
The Effect of Pore Structure on Impact Behavior of Concrete Hollow Brick, Autoclaved Aerated Concrete and Foamed Concrete


Abstract
:1. Introduction
2. Laboratory Experiments
2.1. Sample Size
2.2. Porosity
2.3. Static Load Test
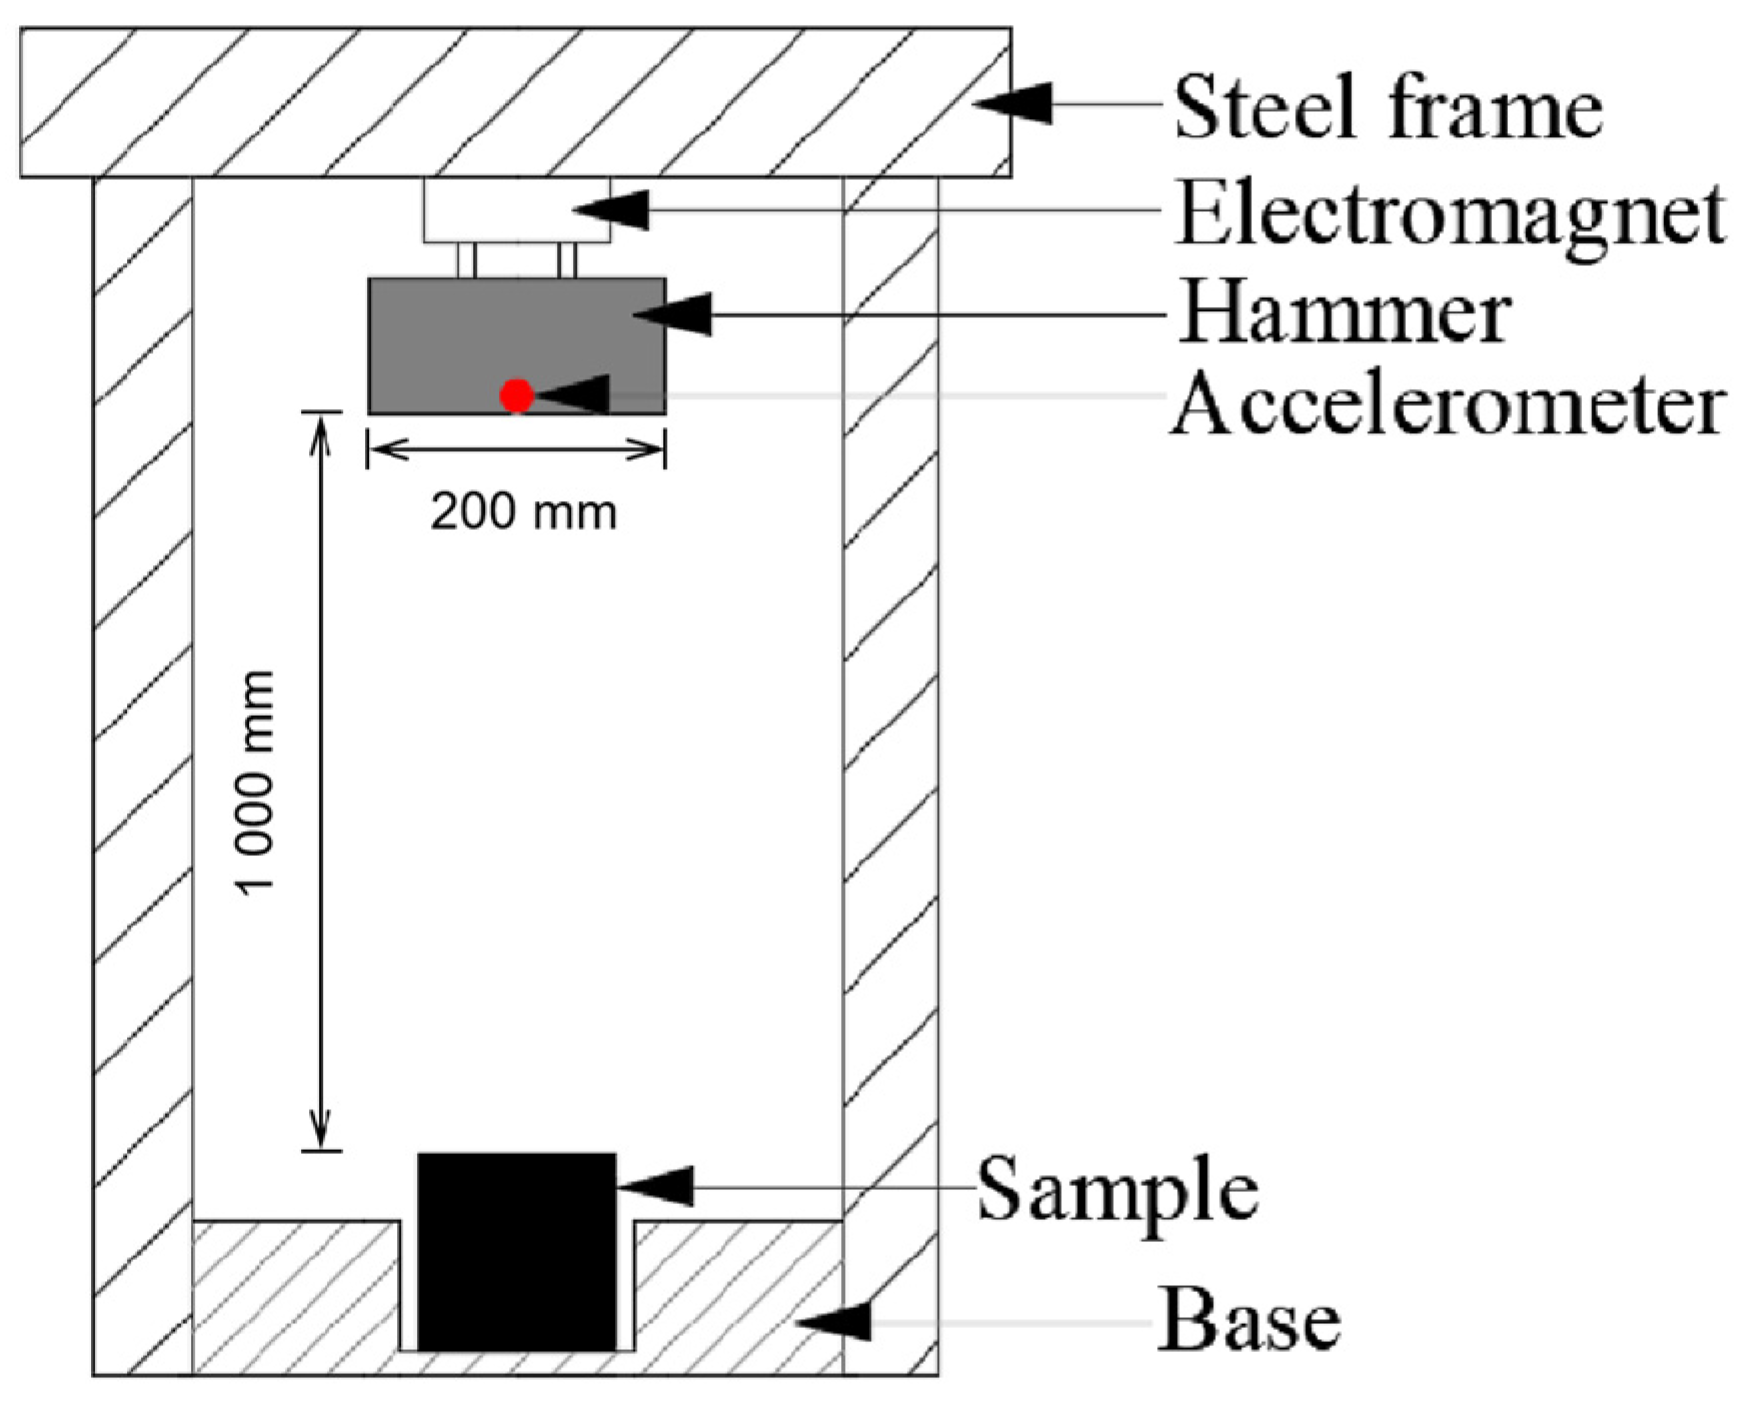
2.4. Drop-Weight Impact Test
3. Results
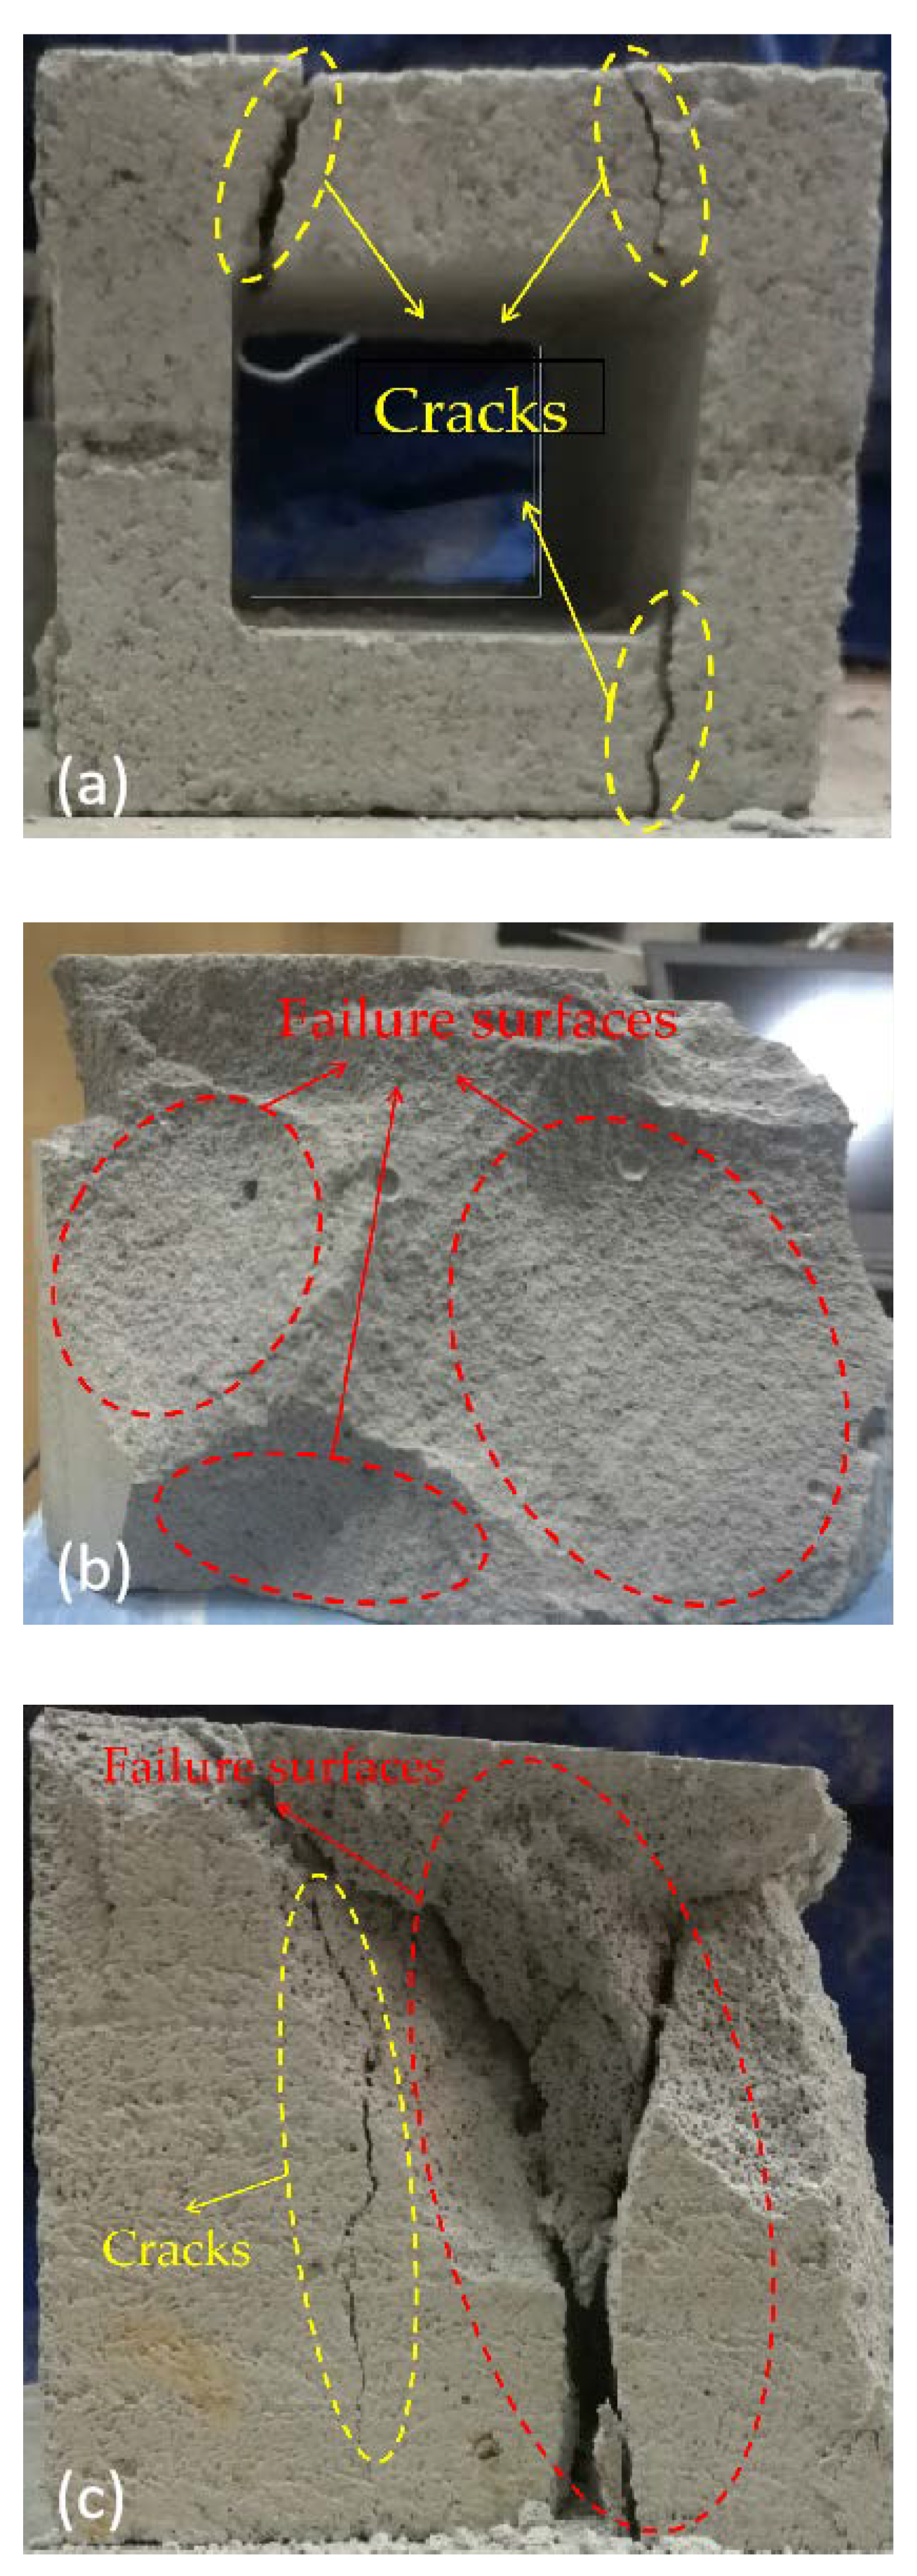
3.1. Damage to Samples
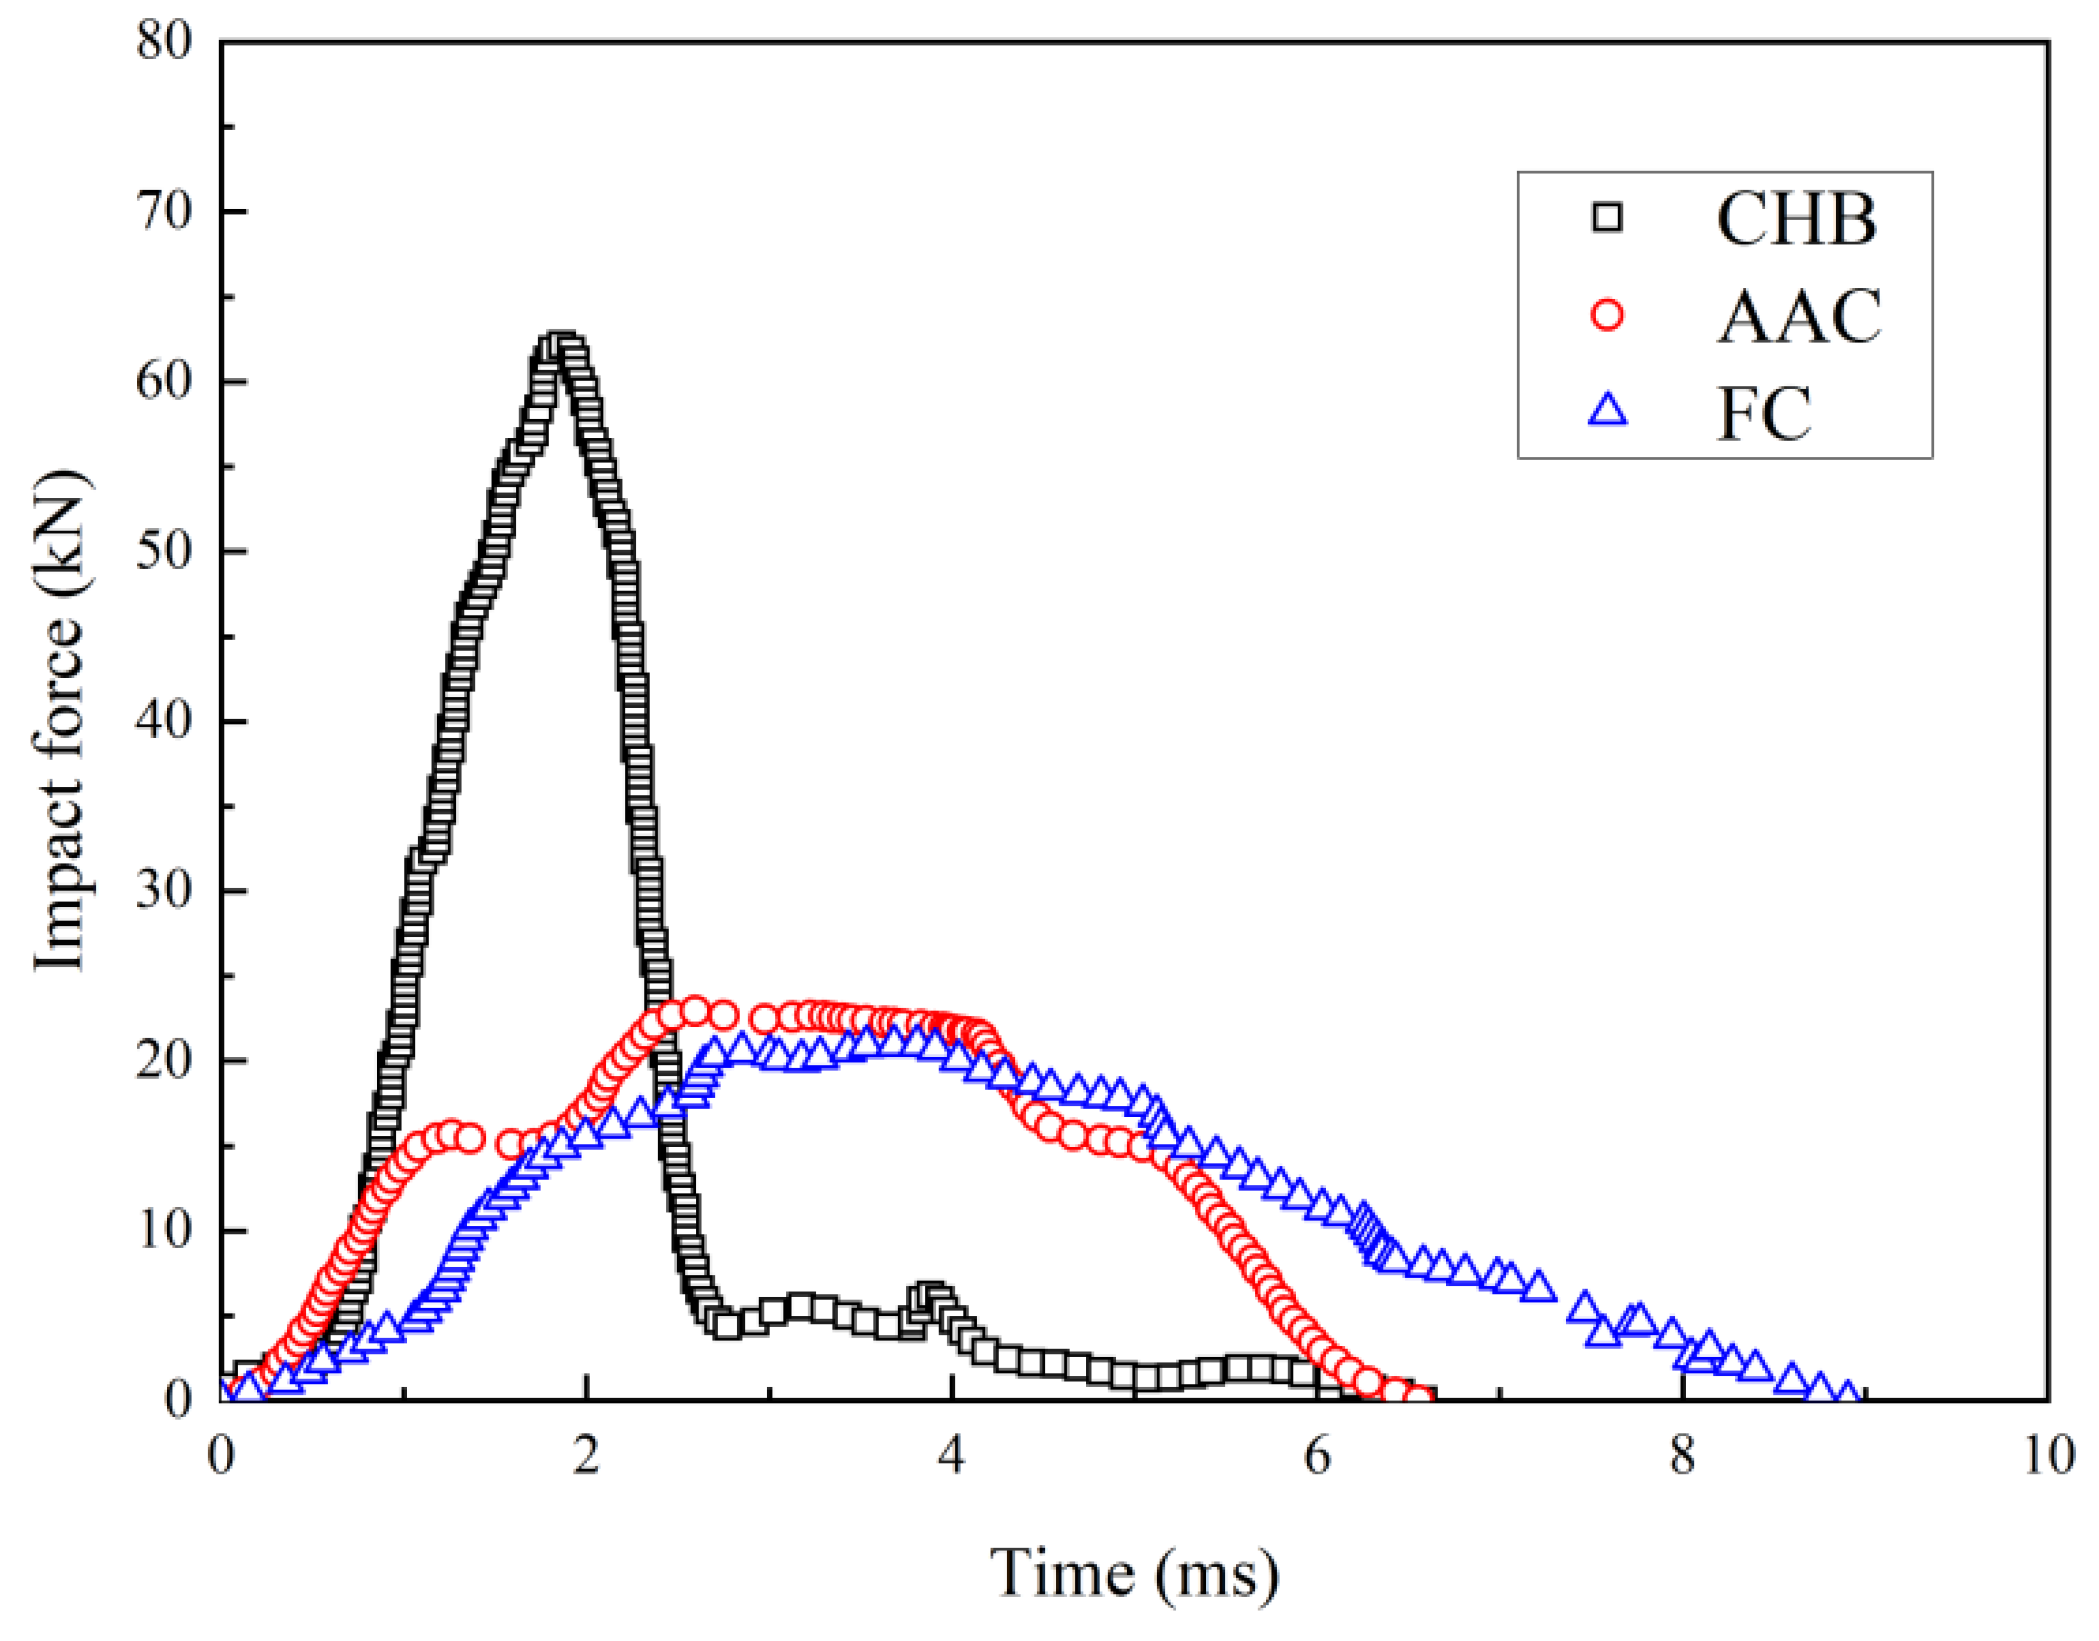
3.2. Impact Force
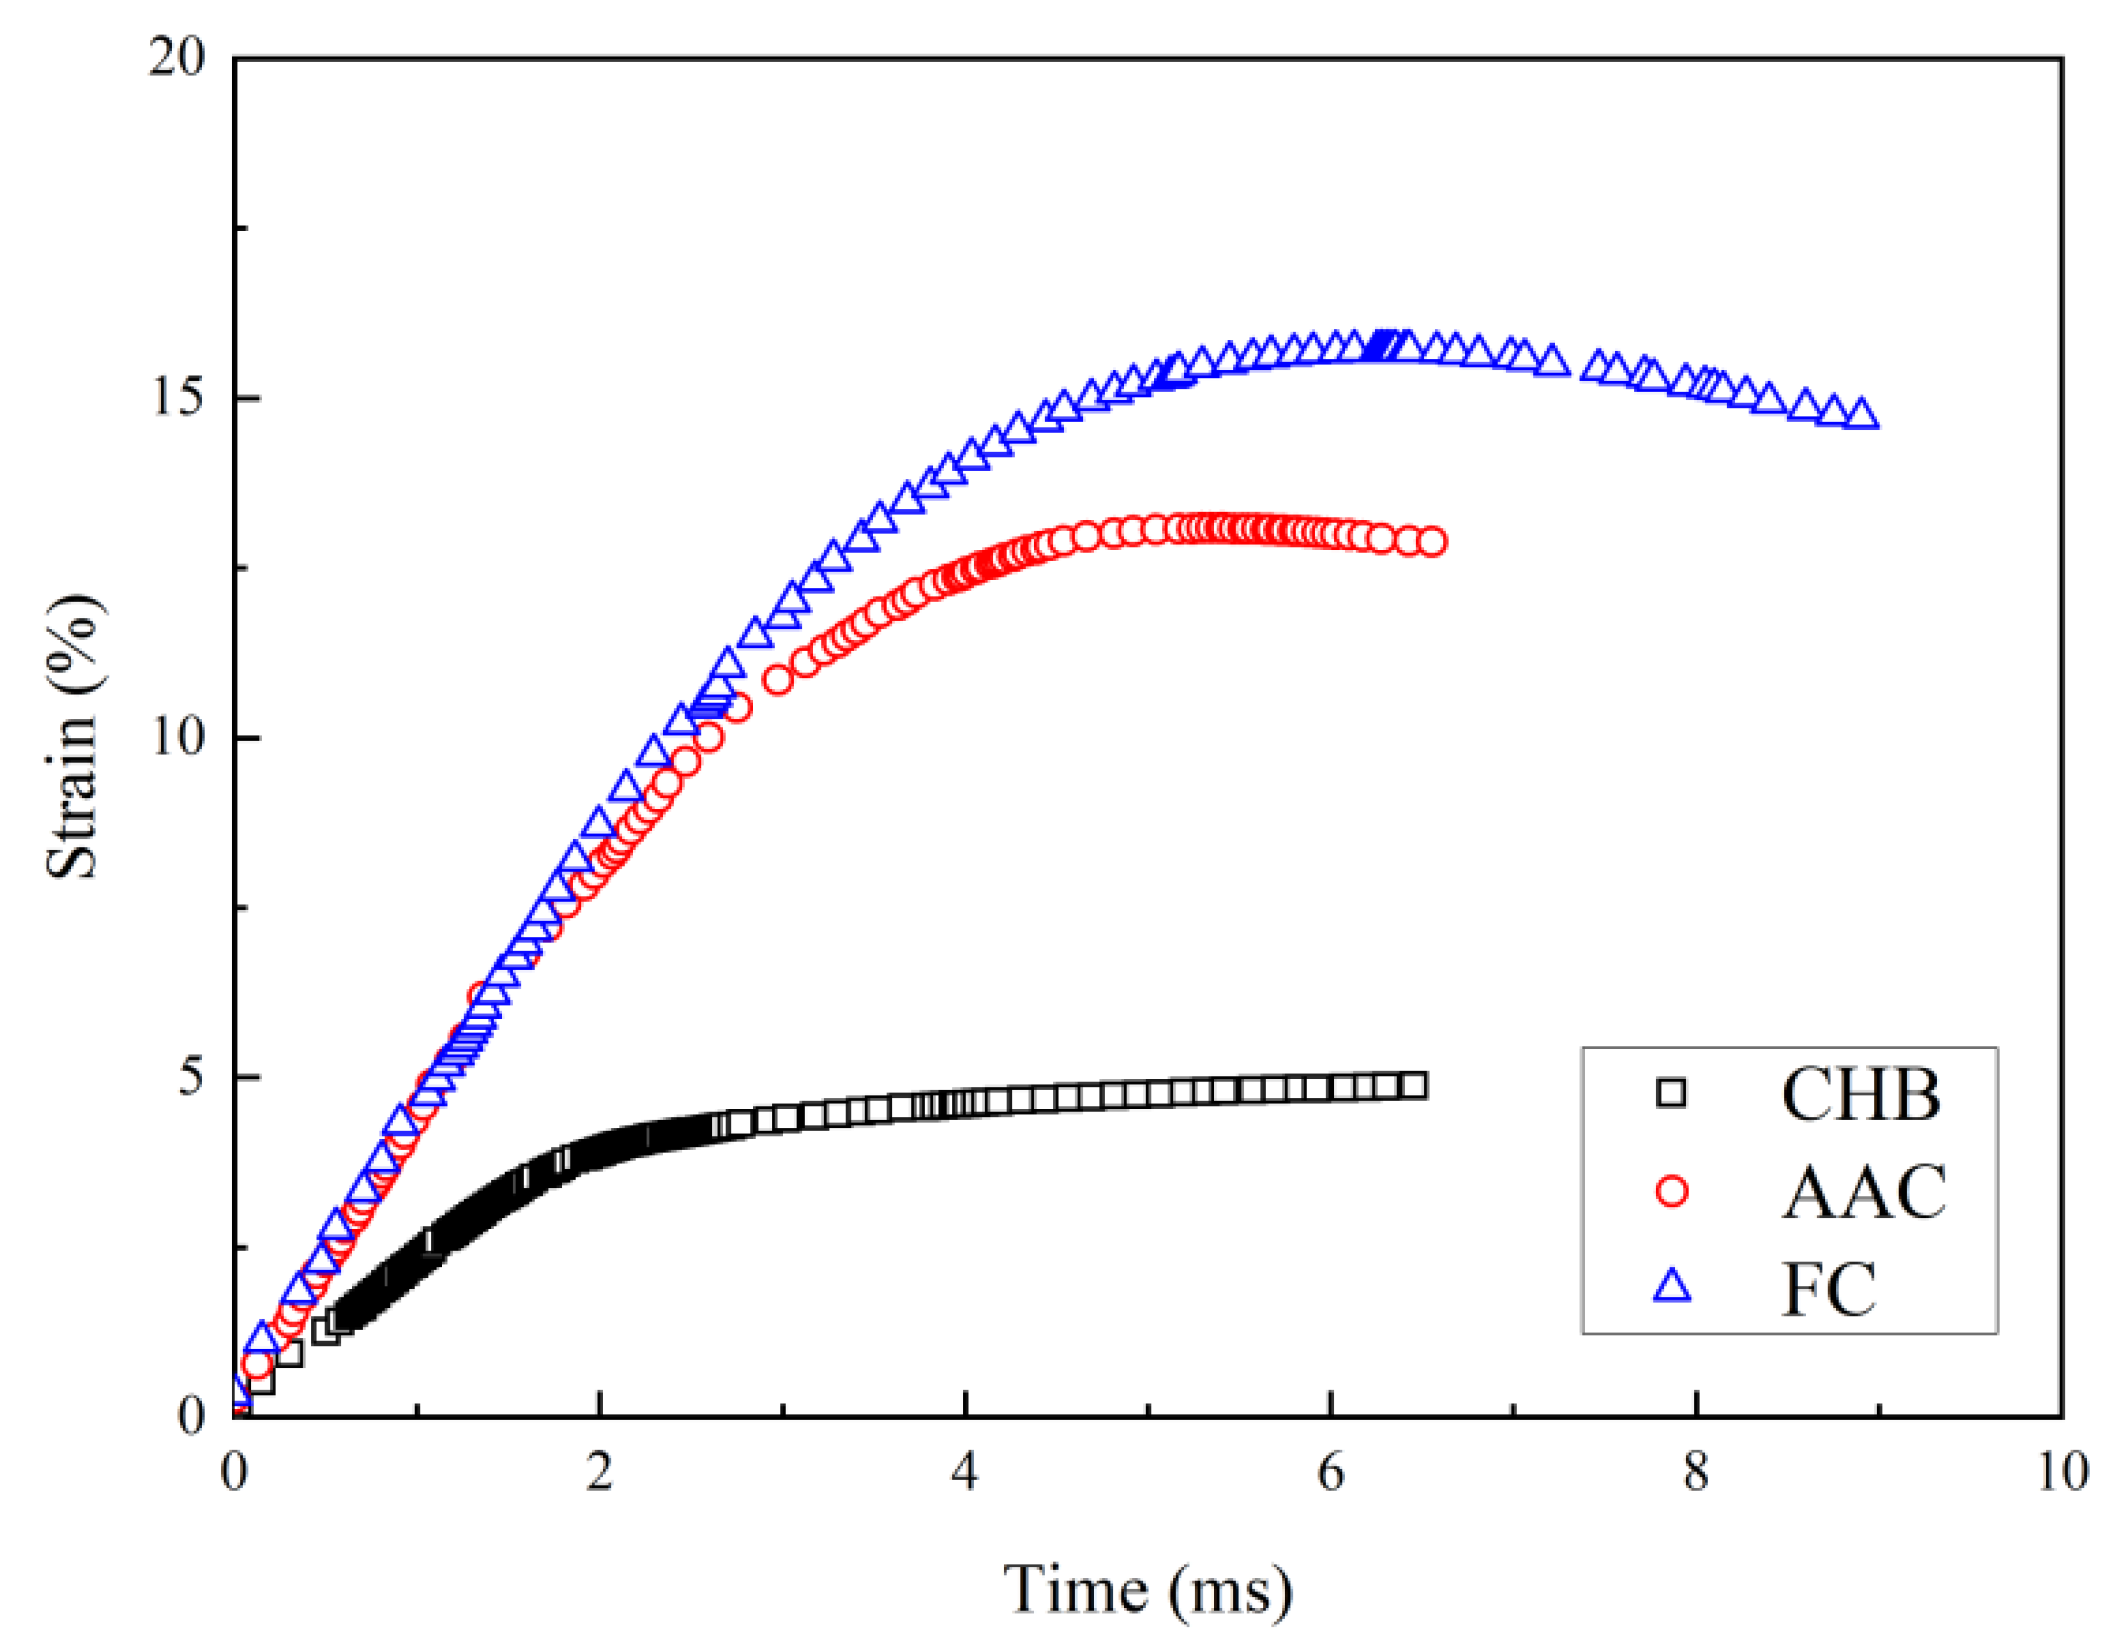
3.3. Strain
4. Discussion
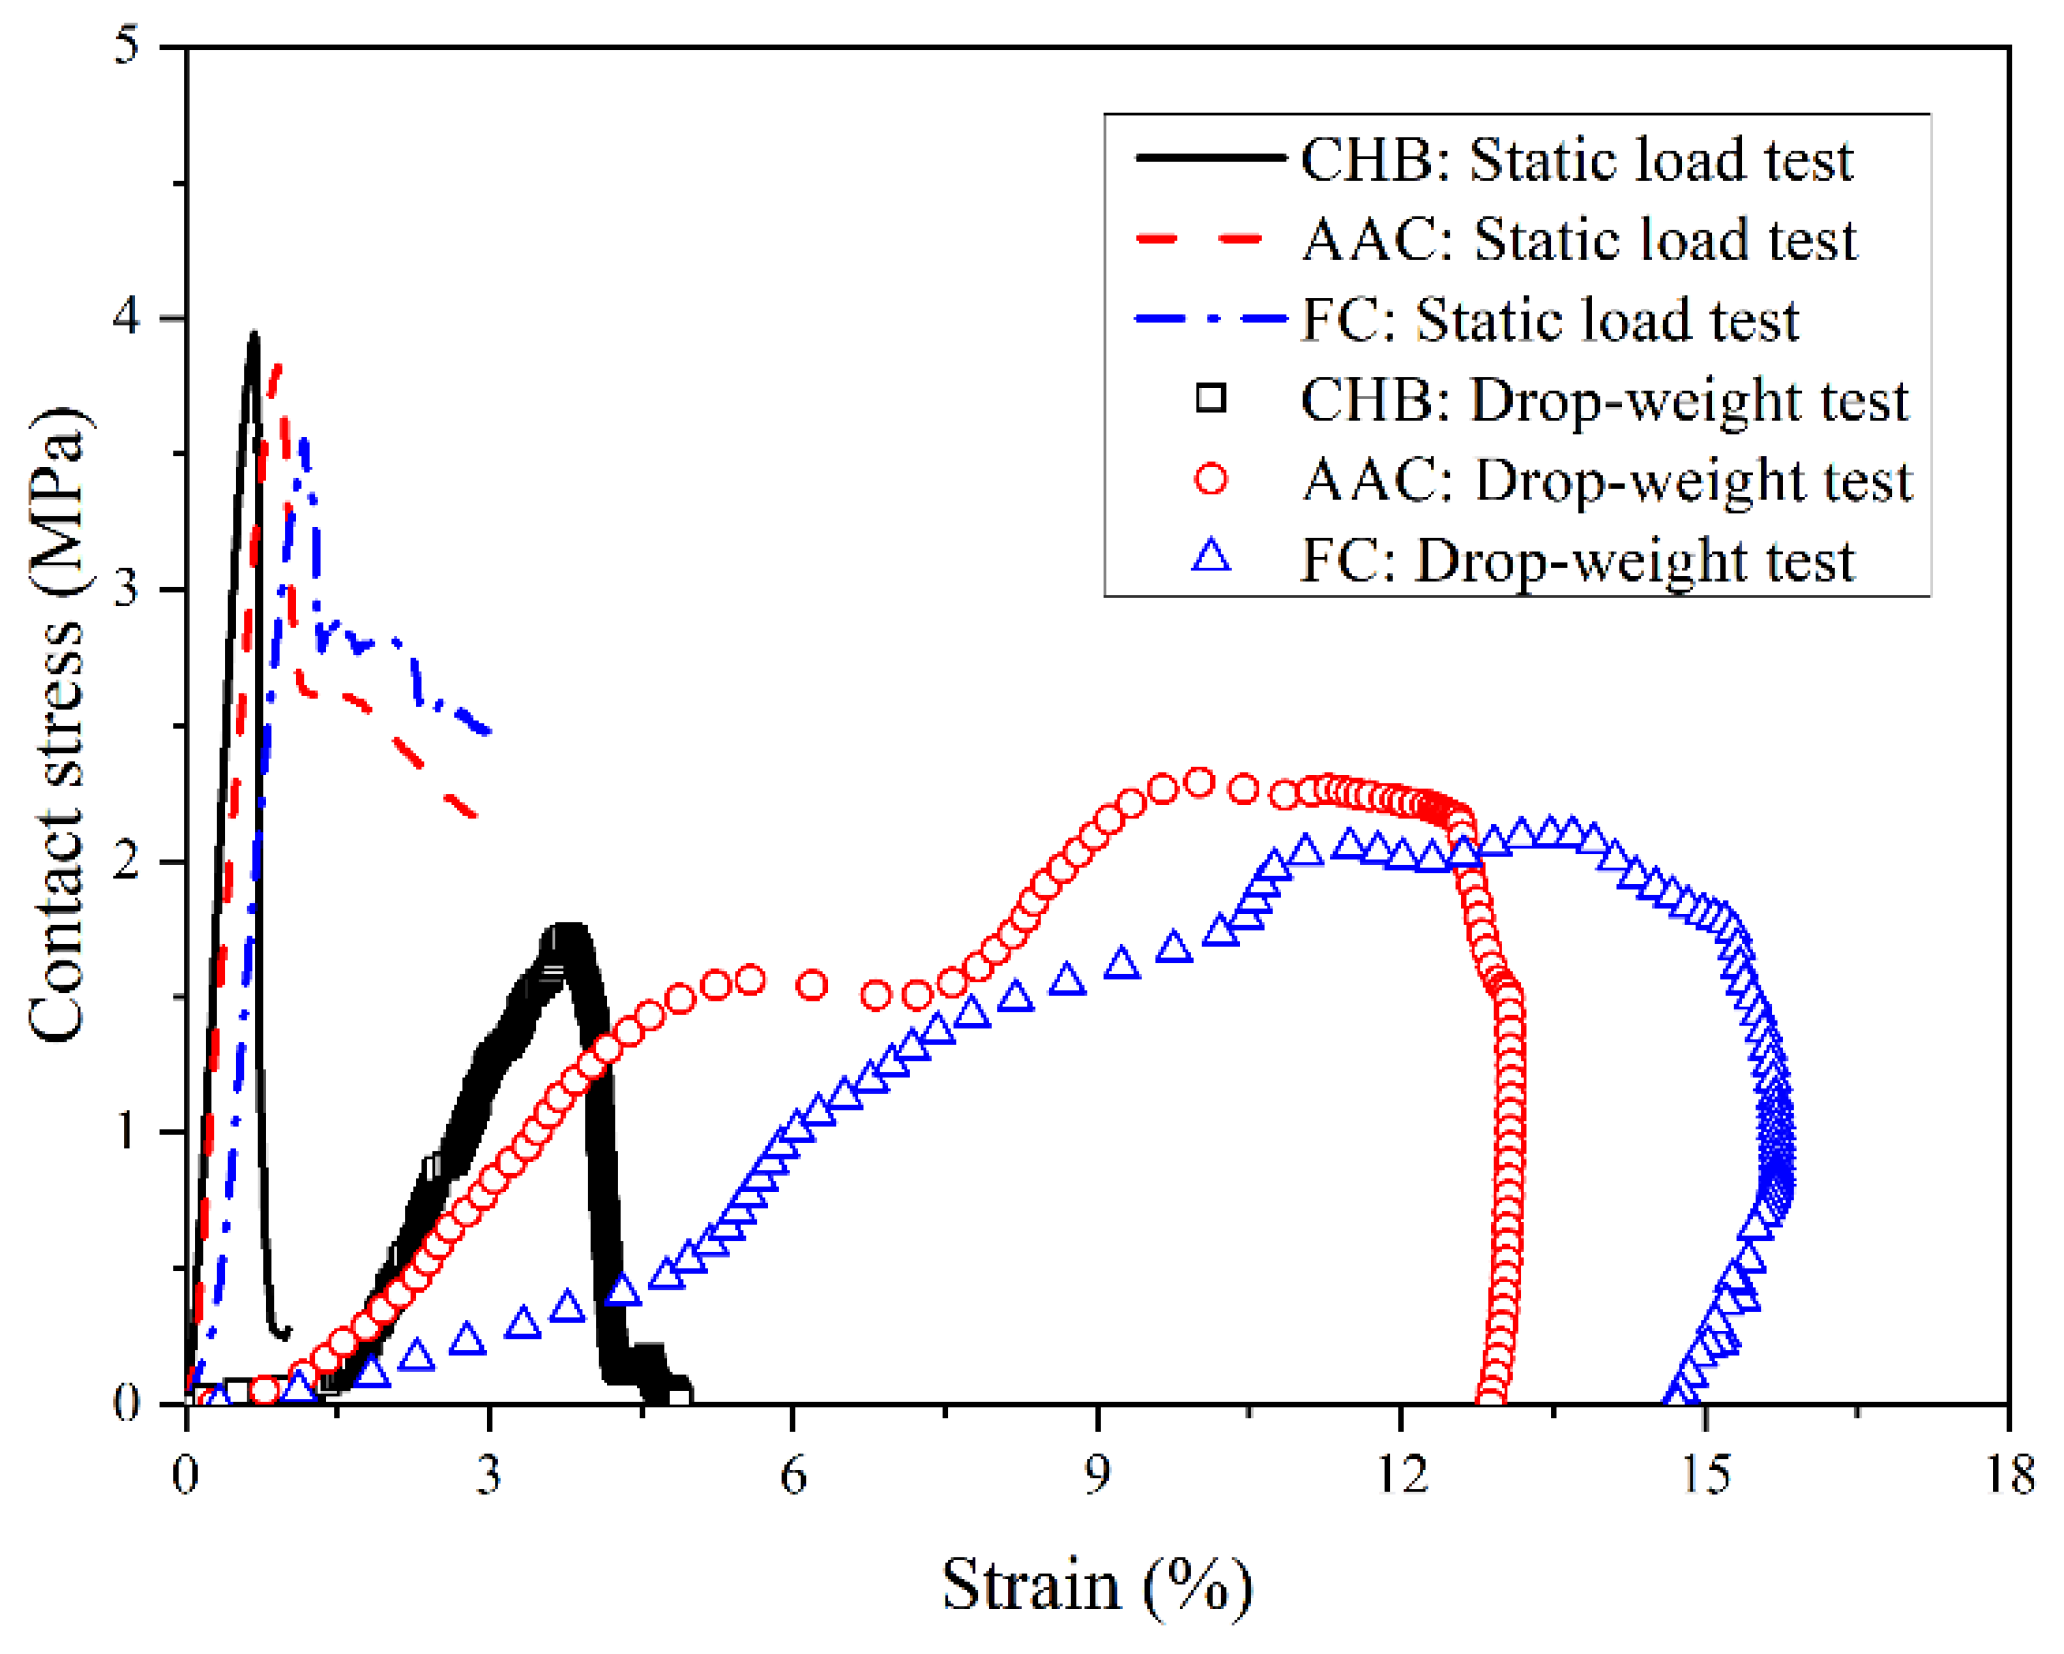
4.1. Contact Stress–strain Relationship
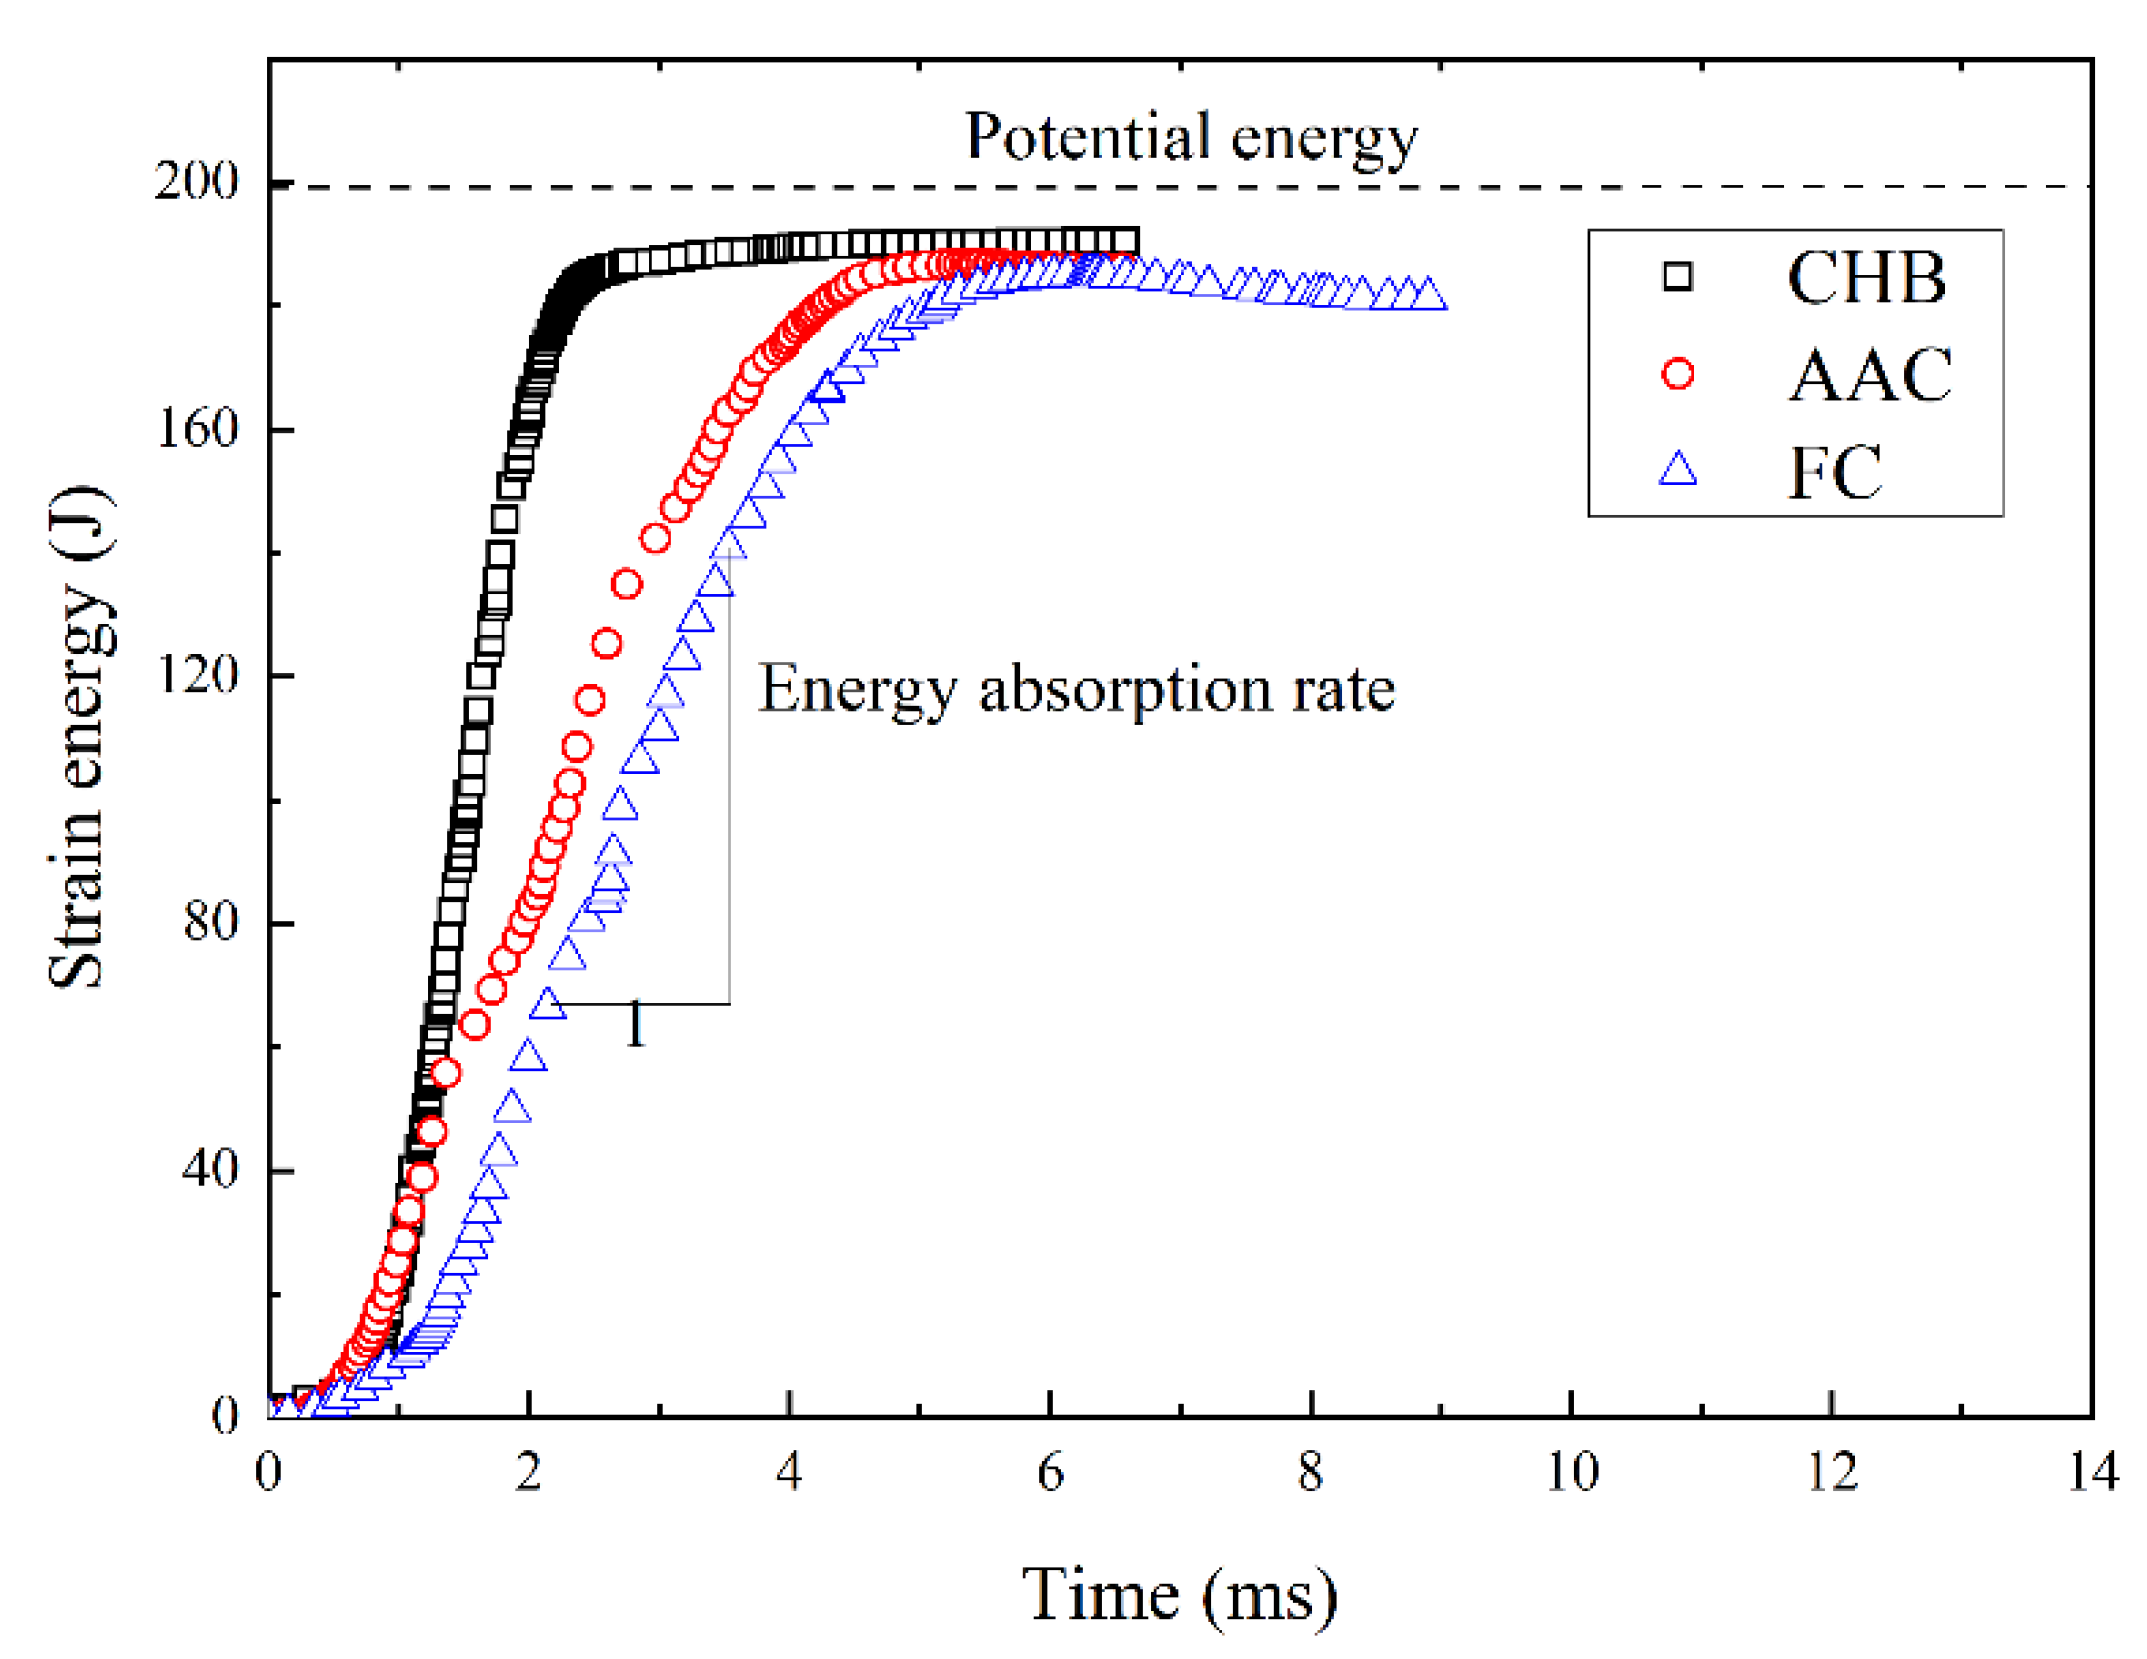
4.2. Absorbed Energy of Porous Concrete
5. Conclusions
Author Contributions
Funding
Institutional Review Board Statement
Informed Consent Statement
Data Availability Statement
Acknowledgments
Conflicts of Interest
References
- Tie, T.S.; Mo, K.H.; Putra, A.; Luo, S.C.; Alengaram, U.J.; Ling, T.-C. Sound absorption performance of modified concrete: A review. J. Build. Eng. 2020, 30, 101219. [Google Scholar] [CrossRef]
- Toghroli, A.; Shariati, M.; Sajedi, F.; Ibrahim, Z.; Koting, S.; Mohamad, E.T.; Khorami, M. A review on pavement porous concrete using recycled waste materials. Smart Struct. Syst. 2018, 22, 433–440. [Google Scholar] [CrossRef]
- Elizondo-Martíneza, E.-J.; Andrés-Valerib, V.-C.; Jato-Espinoa, D.; Rodriguez-Hernandeza, J. Review of porous concrete as multifunctional and sustainable pavement. J. Build. Eng. 2020, 27, 100967. [Google Scholar] [CrossRef]
- Sánchez-Mendieta, C.; Galán, J.J.; Martinez-Lage, I. Physical and hydraulic properties of porous concrete. Sustainability 2021, 13, 10562. [Google Scholar] [CrossRef]
- Ranade, R.; Li, V.C.; Heard, W.F.; Williams, B.A. Impact resistance of high strength-high ductility concrete. Cem. Concr. Res. 2017, 98, 24–35. [Google Scholar] [CrossRef]
- Li, S. Impact Test and Finite Element Analysis of Foamed Light-Weight Vement Based on the Airport Pavement. Master’s Thesis, Nanjing University of Aeronautics and Astronautics, Nanjing, China, December 2011. [Google Scholar]
- Jones, M.R.; Zheng, L. Energy absorption of foamed concrete from low-velocity impacts. Mag. Concr. Res. 2013, 65, 209–219. [Google Scholar] [CrossRef]
- Dey, V.; Bonakdar, A.; Mobasher, B. Low-velocity flexural impact response of fiber-reinforced aerated concrete. Cem. Concr. Comp. 2014, 49, 100–110. [Google Scholar] [CrossRef]
- Li, M.; Hao, H.; Shi, Y.; Hao, Y. Specimen shape and size effects on the concrete compressive strength under static and dynamic tests. Constr. Build. Mater. 2018, 161, 84–93. [Google Scholar] [CrossRef]
- Bai, E.; Xu, j.; Lu, S.; Lin, K.; Zhang, Y. Comparative study on the dynamic properties of lightweight porous concrete. RSC Adv. 2018, 8, 14454–14461. [Google Scholar] [CrossRef] [PubMed] [Green Version]
- Díaz, J.J.D.C.; Nieto, P.J.G.; Biempica, C.B.; Gero, M.B.P. Analysis and optimization of the heat-insulating light concrete hollow brick walls design by the finite element method. Appl. Therm. Eng. 2008, 27, 1445–1456. [Google Scholar] [CrossRef]
- Matsushita, F.; Aono, Y.; Shibata, S. Particles size distribution of quartz sand for AAC production. Cem. Wapno Beton 2011, S1, 7–11. [Google Scholar]
- Kalpana, M.; Mohith, S. Study on autoclaved aerated concrete: Review. Mater. Today Proc. 2020, 22, 894–896. [Google Scholar] [CrossRef]
- Castillo-Lara, J.F.; Flores-Johnson, E.A.; Valadez-Gonzalez, A.; Herrera-Franco, P.J.; Carrillo, J.G.; Gonzalez-Chi, P.I.; Li, Q.M. Mechanical Properties of Natural Fiber Reinforced Foamed Concrete. Materials 2020, 13, 3060. [Google Scholar] [CrossRef] [PubMed]
- Hou, L.; Li, J.; Lu, Z.; Niu, Y. Influence of foaming agent on cement and foam concrete. Constr. Build. Mater. 2021, 280, 122399. [Google Scholar] [CrossRef]
- Amran, Y.H.M.; Farzadnia, N.; Ali, A.A.A. Properties and applications of foamed concrete; a review. Constr. Build. Mater. 2015, 101, 990–1005. [Google Scholar] [CrossRef]
- Tikalsky, P.J.; Pospisil, J.; Macdonald, W. A method for assessment of the freeze–thaw resistance of preformed foam cellular concrete. Cem. Concr. Res. 2004, 34, 889–893. [Google Scholar] [CrossRef]
- Othman, R.; Jaya, R.P.; Muthusamy, K.; Sulaiman, M.; Duraisamy, Y.; Abdullah, M.M.A.B.; Przybył, A.; Sochacki, W.; Skrzypczak, T.; Vizureanu, P.; et al. Relation between Density and Compressive Strength of Foamed Concrete. Materials 2021, 14, 2967. [Google Scholar] [CrossRef] [PubMed]
- RILEM CPC-11.3. Absorption of water by immersion under vacuum. Mater. Struct. 1984, 101, 393–394. [Google Scholar]
- Zhu, W.; Zhang, C.L.; Chiu, A.C.F. Soil–water transfer mechanism for solidified dredged materials. J. Geotech. Geoenviron. 2007, 133, 588–598. [Google Scholar] [CrossRef]
- Wu, M.; Chen, Z.; Zhang, C. Determining the impact behavior of concrete beams through experimental testing and meso-scale simulation: I. drop-weight tests. Eng. Fract. Mech. 2015, 135, 94–112. [Google Scholar] [CrossRef]


| CHB | AAC | FC | |
|---|---|---|---|
| Total porosity (%) | 58.9 | 63.2 | 62.5 |
| Closed-cell pore content (%) | 2.6 | 1.4 | 42.1 |
| Compressive strength (MPa) | 3.94 | 3.77 | 3.48 |
Publisher’s Note: MDPI stays neutral with regard to jurisdictional claims in published maps and institutional affiliations. |
© 2022 by the authors. Licensee MDPI, Basel, Switzerland. This article is an open access article distributed under the terms and conditions of the Creative Commons Attribution (CC BY) license (https://creativecommons.org/licenses/by/4.0/).
Share and Cite
Liu, J.; Ren, Y.; Chen, R.; Wu, Y.; Lei, W. The Effect of Pore Structure on Impact Behavior of Concrete Hollow Brick, Autoclaved Aerated Concrete and Foamed Concrete. Materials 2022, 15, 4075. https://doi.org/10.3390/ma15124075
Liu J, Ren Y, Chen R, Wu Y, Lei W. The Effect of Pore Structure on Impact Behavior of Concrete Hollow Brick, Autoclaved Aerated Concrete and Foamed Concrete. Materials. 2022; 15(12):4075. https://doi.org/10.3390/ma15124075
Chicago/Turabian StyleLiu, Jian, Yuzhe Ren, Rui Chen, Yuedong Wu, and Weidong Lei. 2022. "The Effect of Pore Structure on Impact Behavior of Concrete Hollow Brick, Autoclaved Aerated Concrete and Foamed Concrete" Materials 15, no. 12: 4075. https://doi.org/10.3390/ma15124075