3.2. Oxidation Behavior of the Different Kinds of SiC/SiC
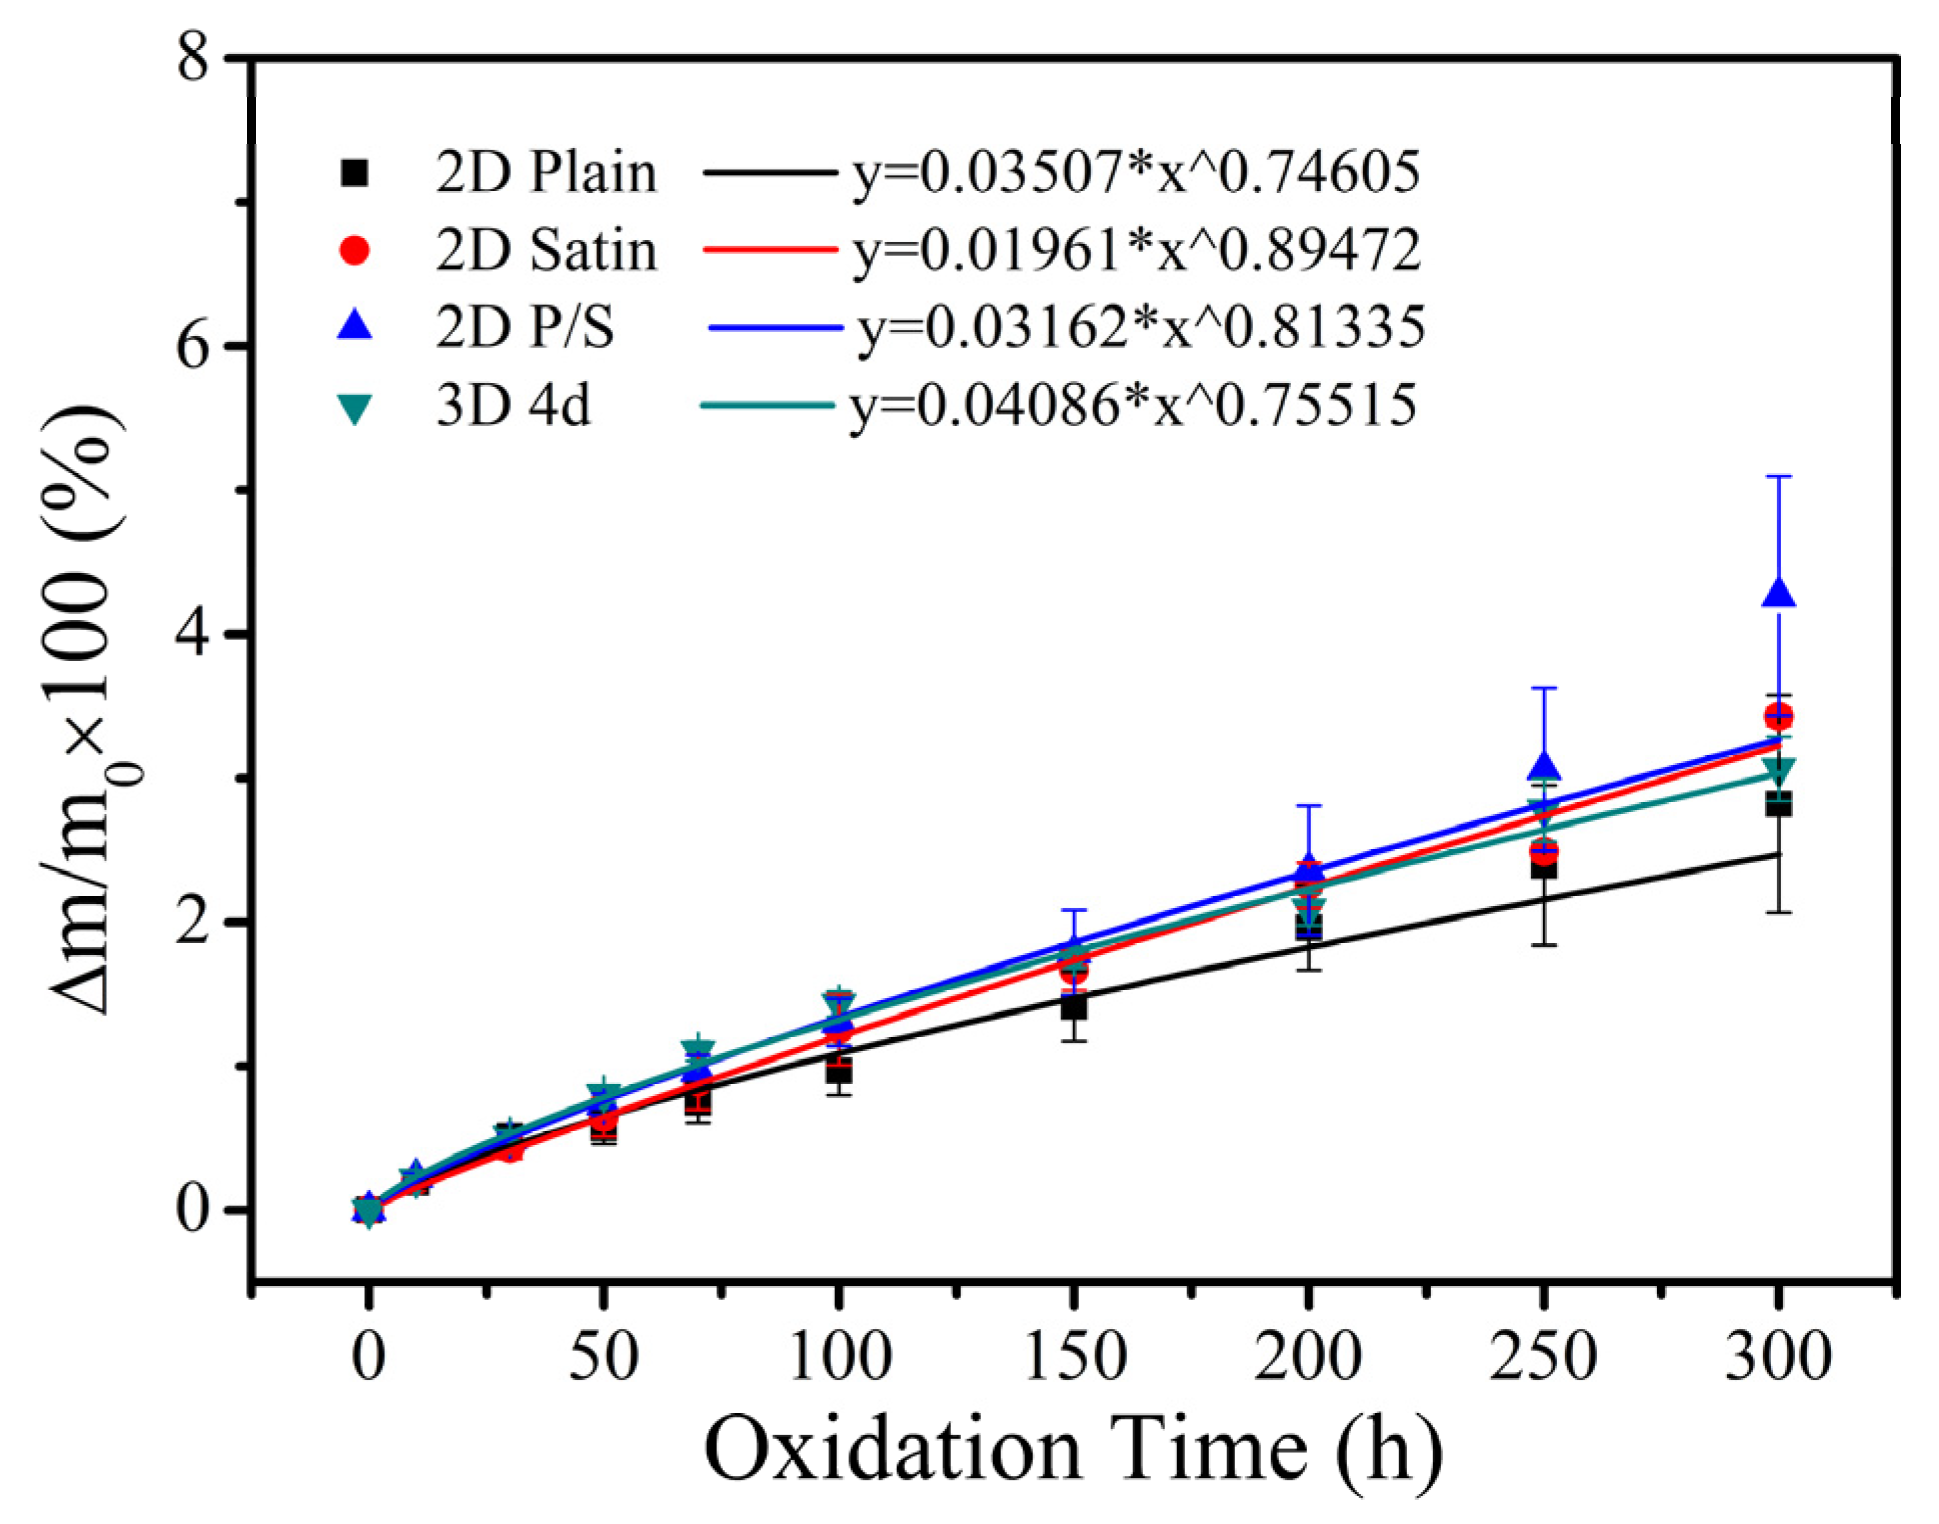
Figure 2 illustrates the mass change curves of four kinds of SiC/SiC composites after being oxidized at 1400 °C in wet oxygen for 300 h. As can be ascertained from the acquired outcomes, all the SiC/SiC composites exhibited a continuous weight gain during the oxidation test, indicating that the weight gain, caused by the formation of oxides (SiO
2), was higher than the respective weight loss, induced by the release of the gas phase products (Si(OH)
4, B
2O
3). Moreover, the weight gain rate of the 2D Plain, 2D Satin, 2D P/S and 3D 4d composites was 2.82%, 3.43%, 4.27% and 3.07%, respectively. As far as the difference in changes was concerned, a detailed analysis was carried out in conjunction with the extracted results of the μ-CT that will be presented in the next section. Furthermore, all four composites exhibited parabolic growth from the non-linear fitting curves of the mass change, suggesting that the oxidation process of materials in wet oxygen at 1400 °C is controlled by a diffusion-based mechanism, while the oxidation rate of the composites gradually slows down over time. It is also interesting to notice that, as the oxidation progresses, the oxide layer formed on the surface and the defects of the sample gradually became thicker, resulting in a slow decrease in the rate of oxygen and water vapor molecules entering the sample, and consequently slowing down of the mass increase of the composite material. For SiC/SiC composites, due to the dispersion of defects in the material itself, the channel and speed of the diffusion of the oxidizing atmosphere into the sample will be affected during the oxidation process. Therefore, even for the same composite material, under the same oxidative environment, there will be a certain difference in mass change, and there will be a standard deviation at each measurement time point, but it will not affect the experimental results.
Figure 3,
Figure 4,
Figure 5 and
Figure 6 demonstrate the μ-CT images of the SiC/SiC composites with four different preforms. The maximum defect volume change and defect distribution that are shown in all graphs are used to explain the oxidation process of the samples.
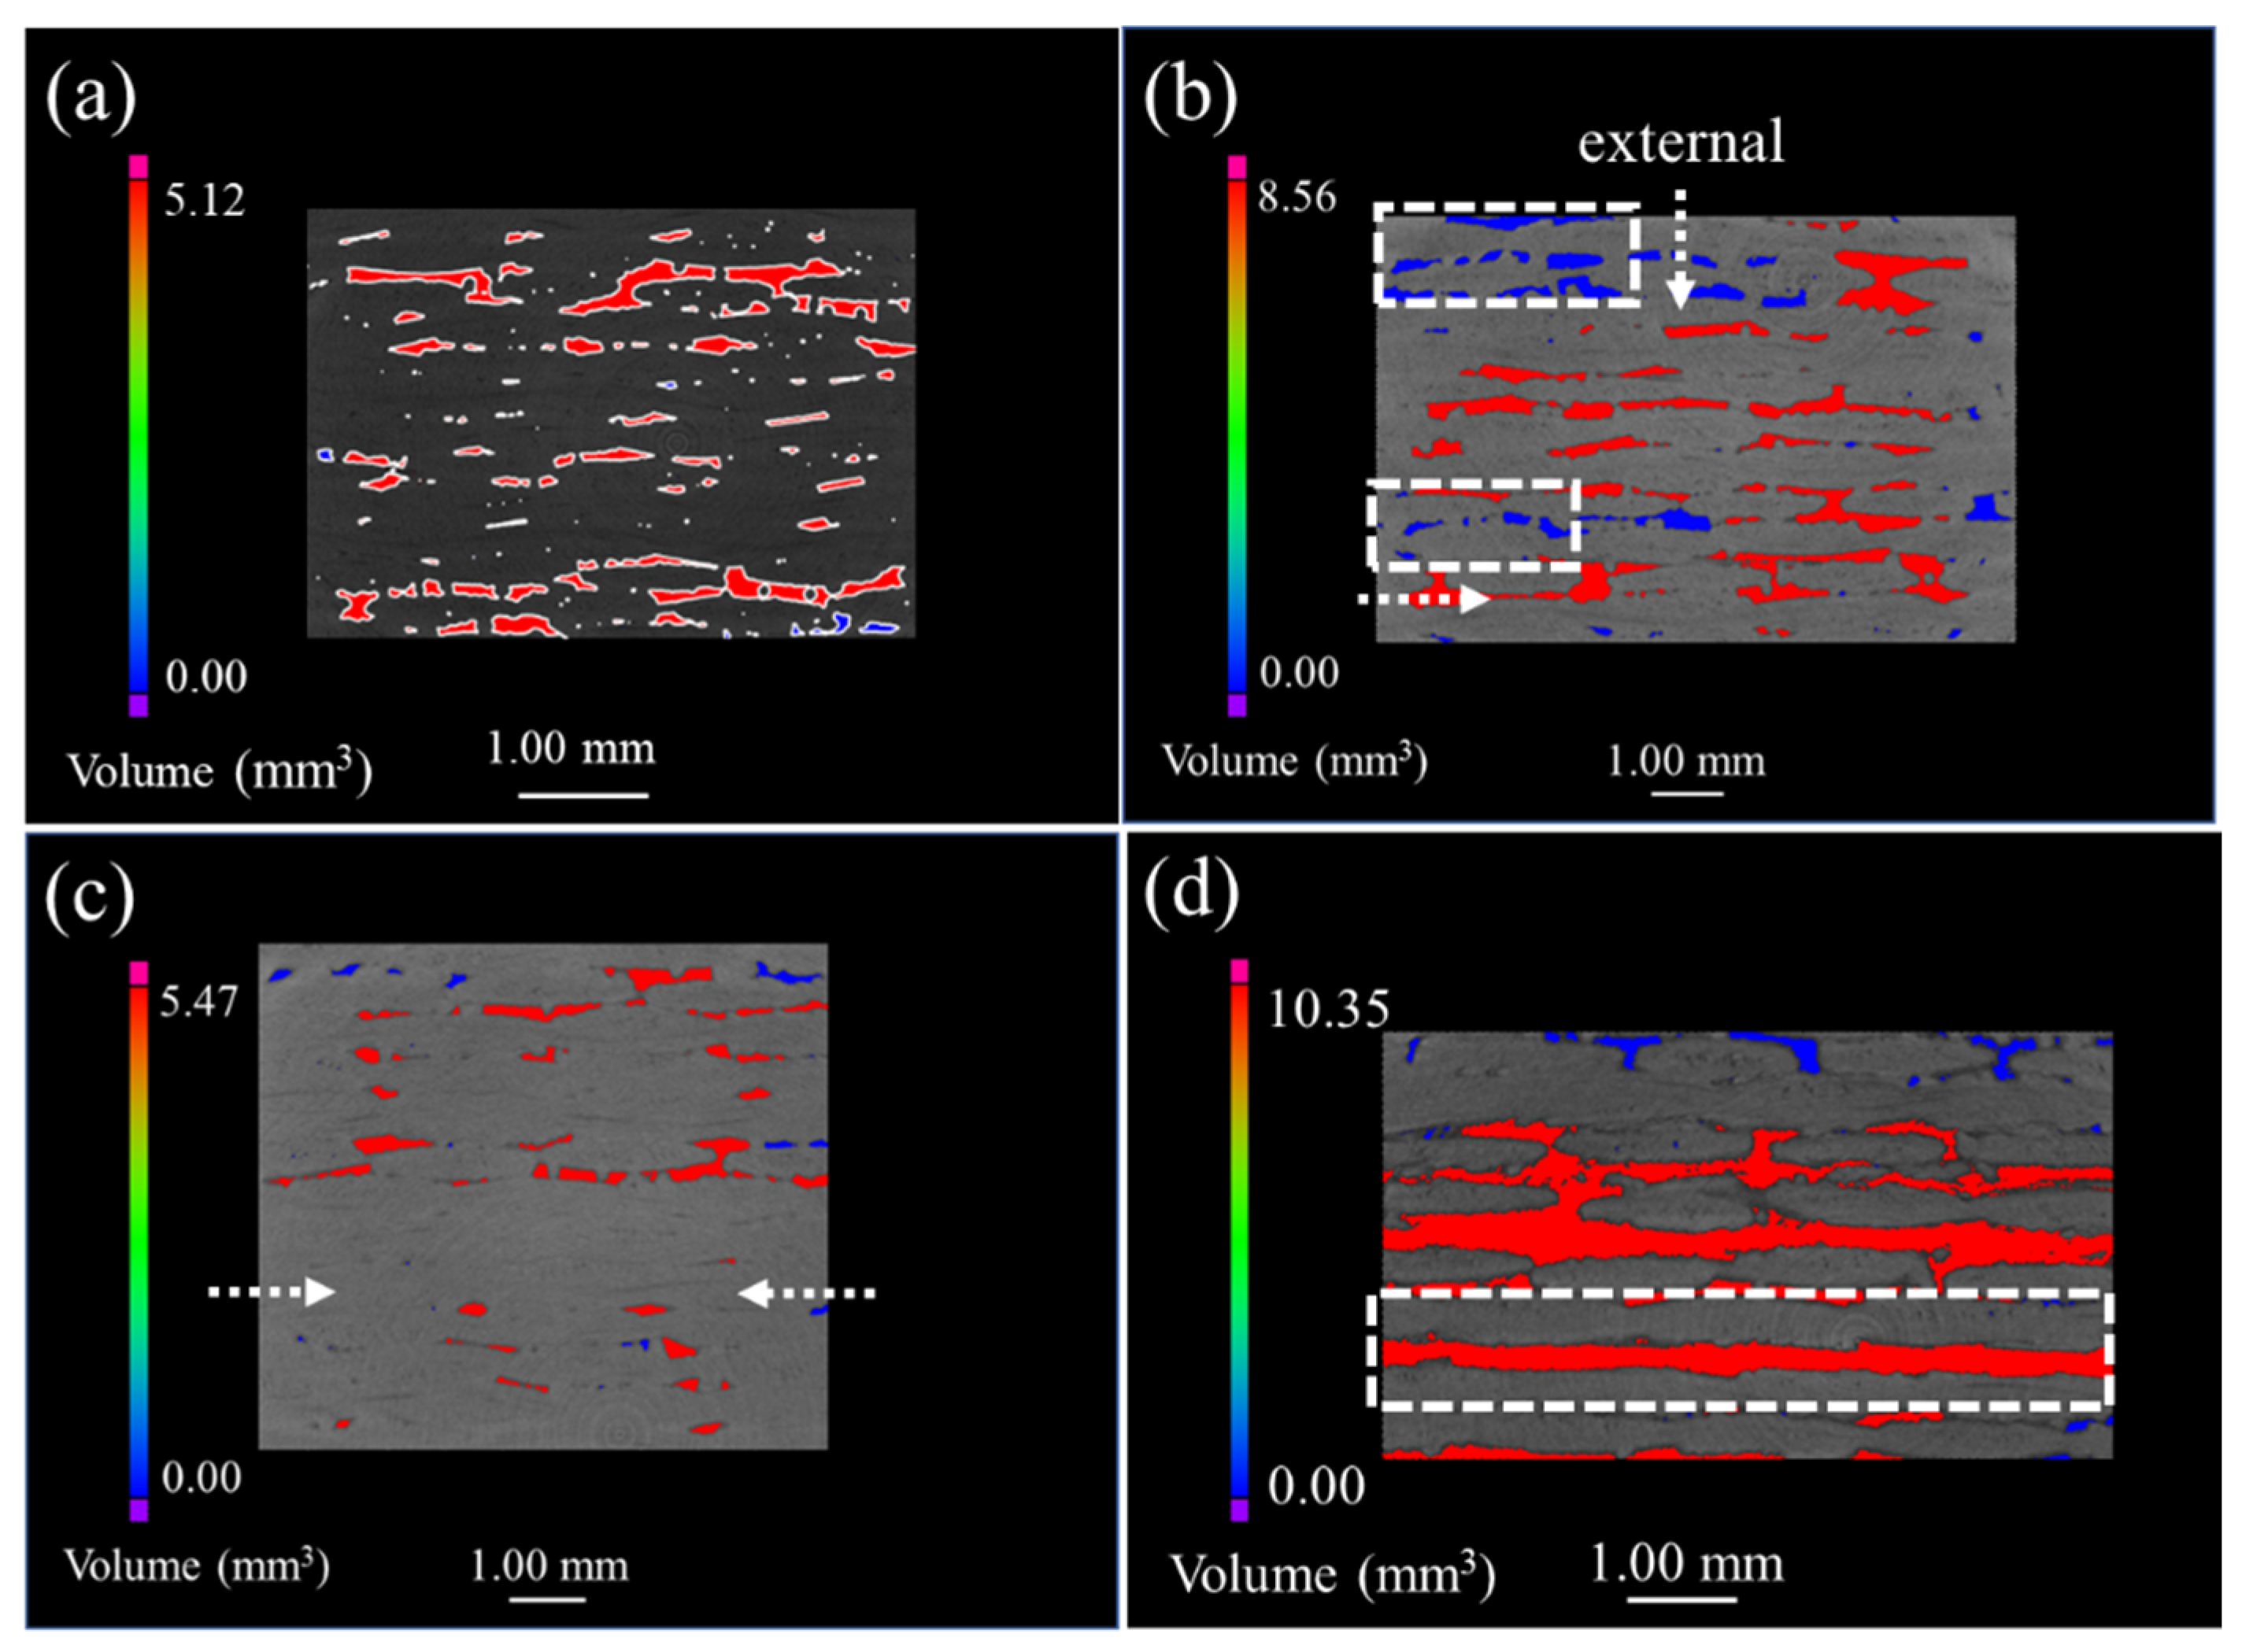
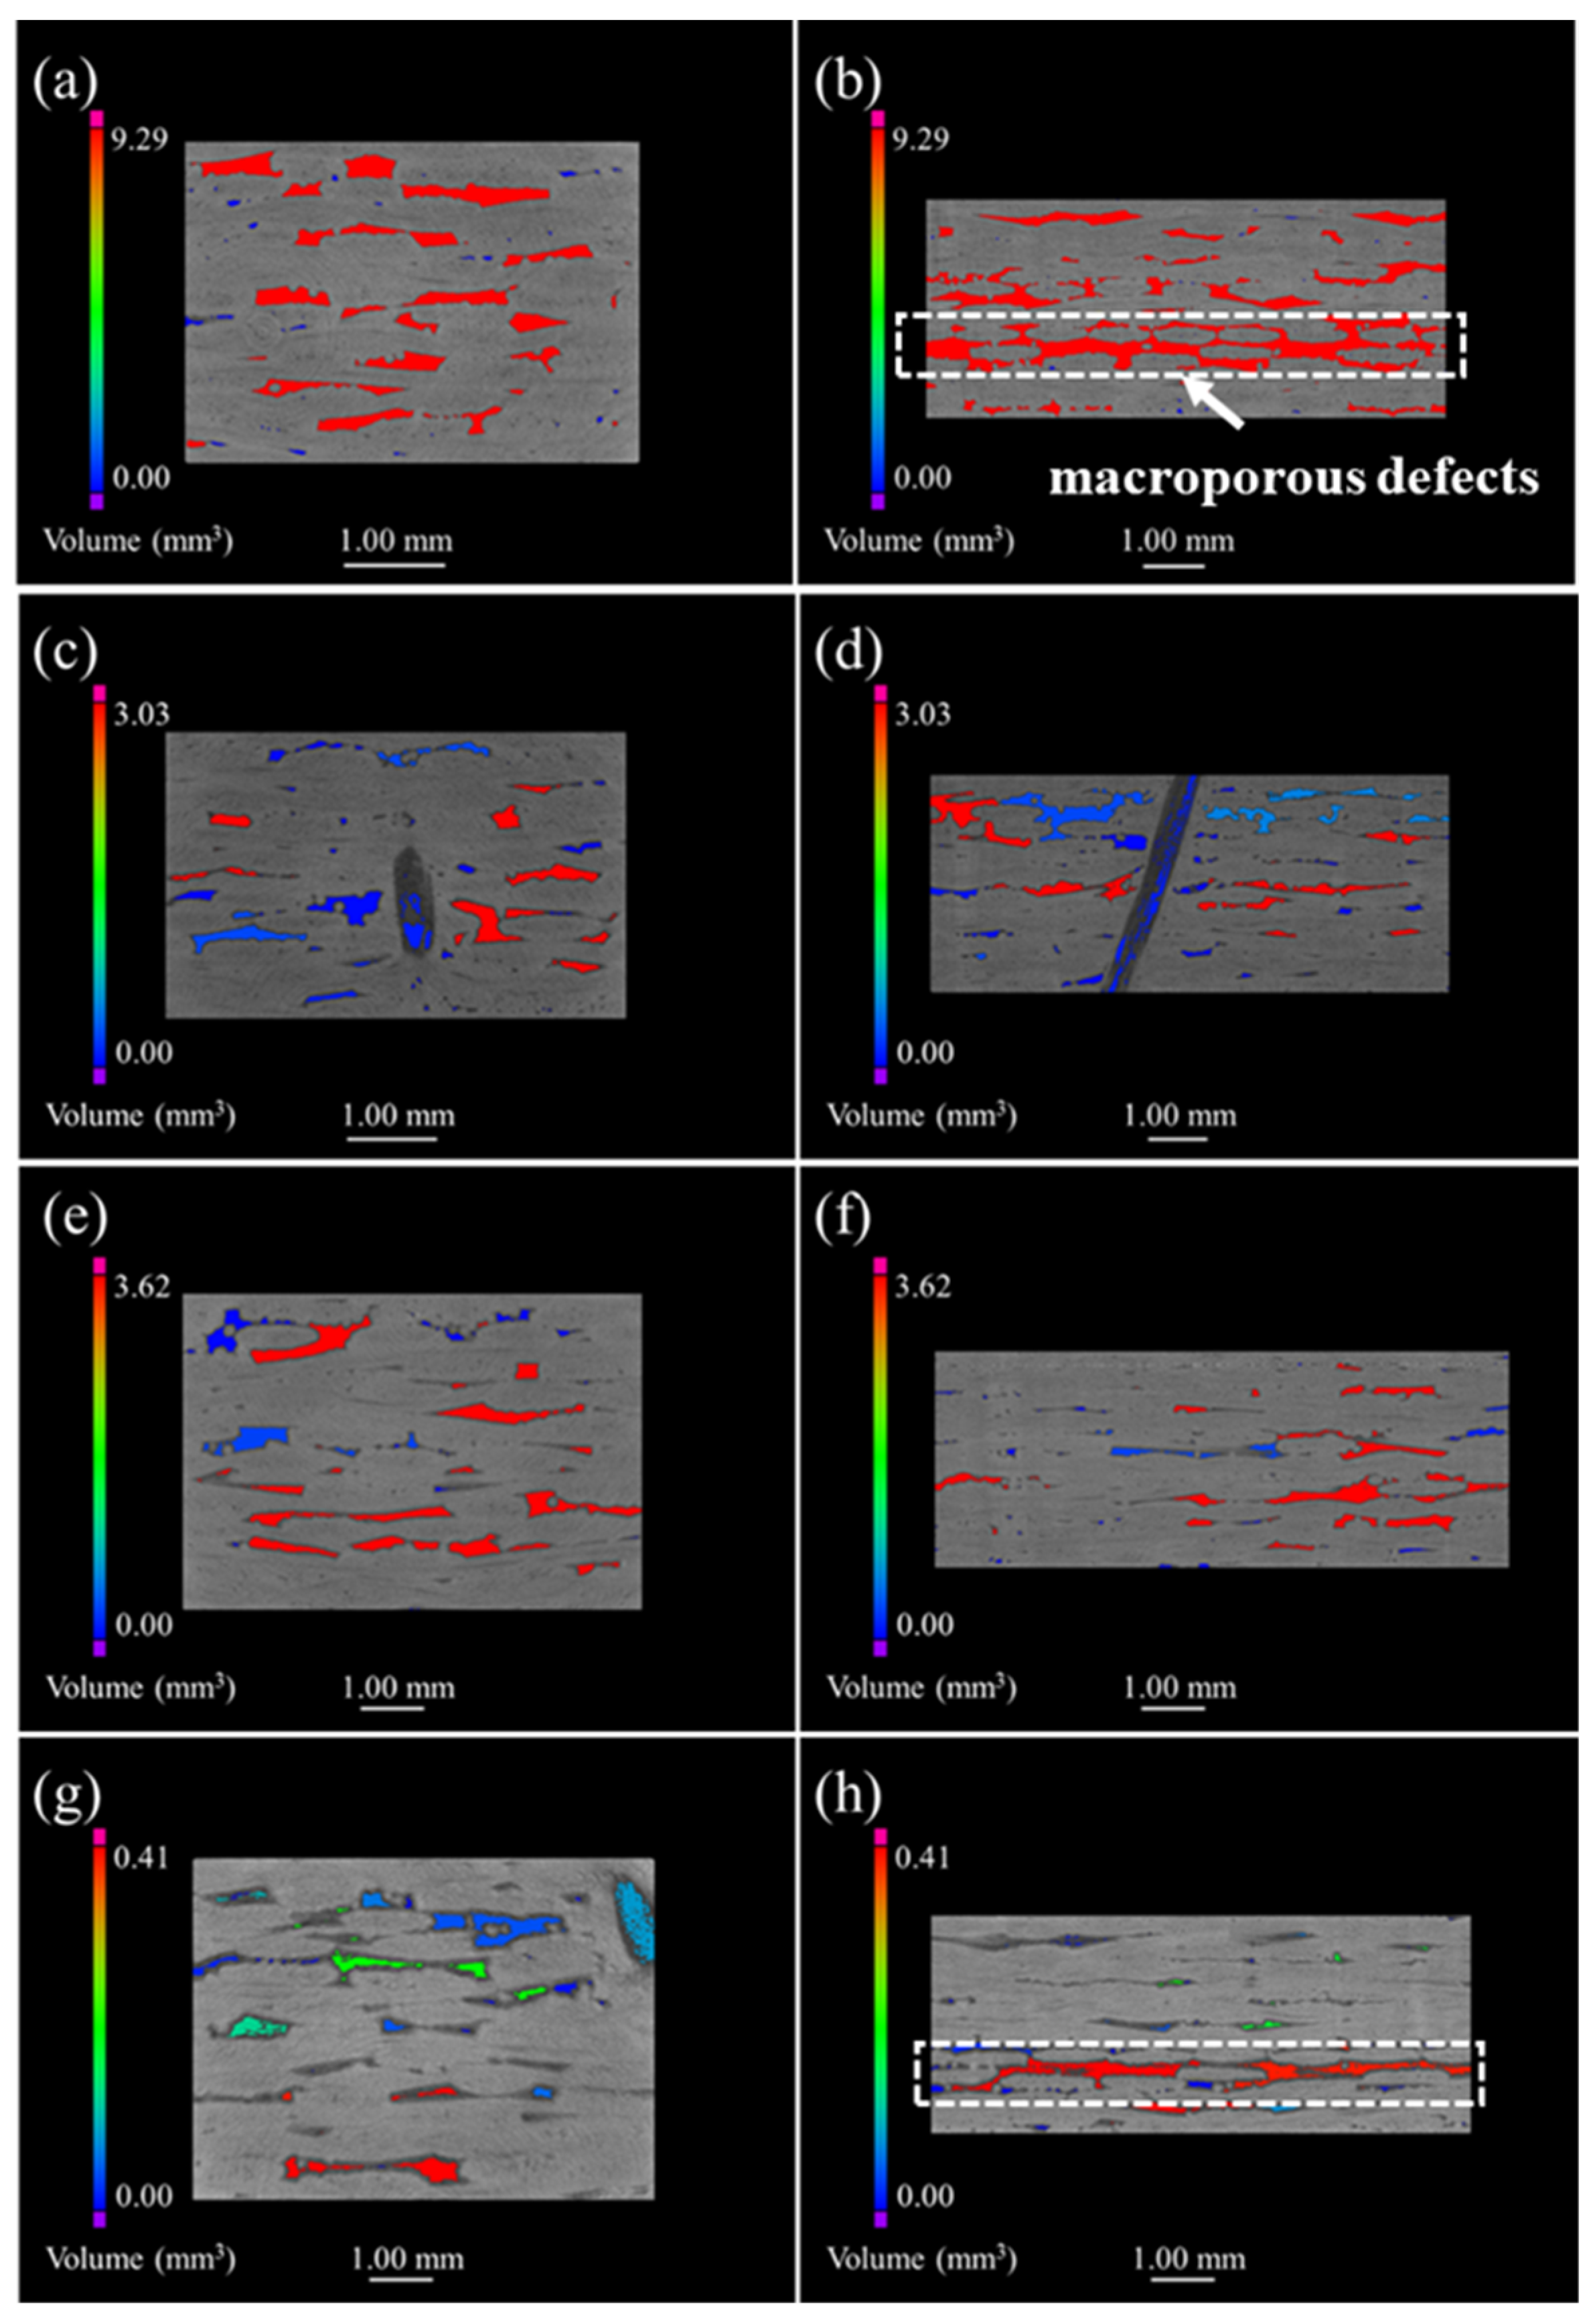
Figure 3 represents the μ-CT images of both the original and the oxidized 2D plain SiC/SiC composites. The defects are mainly distributed in the inter-bundle and the inter-layer of the original SiC/SiC composites, as can be seen from
Figure 3a. When the sample was oxidized for 100 h (as is shown in
Figure 3b), many small-volume defects were distributed at the external surface of the sample and the connectivity of the macro-porous defects decreased. As a result, it is demonstrated that the oxidation of the composites proceeds from the external to the internal. However, the sample, after being oxidized for 300 h, had penetrating large-volume defects, which indicates that a delamination procedure occurs between the weave layers, while the generated oxides are accumulated in the woven holes at this time, forming a large stress concentration.
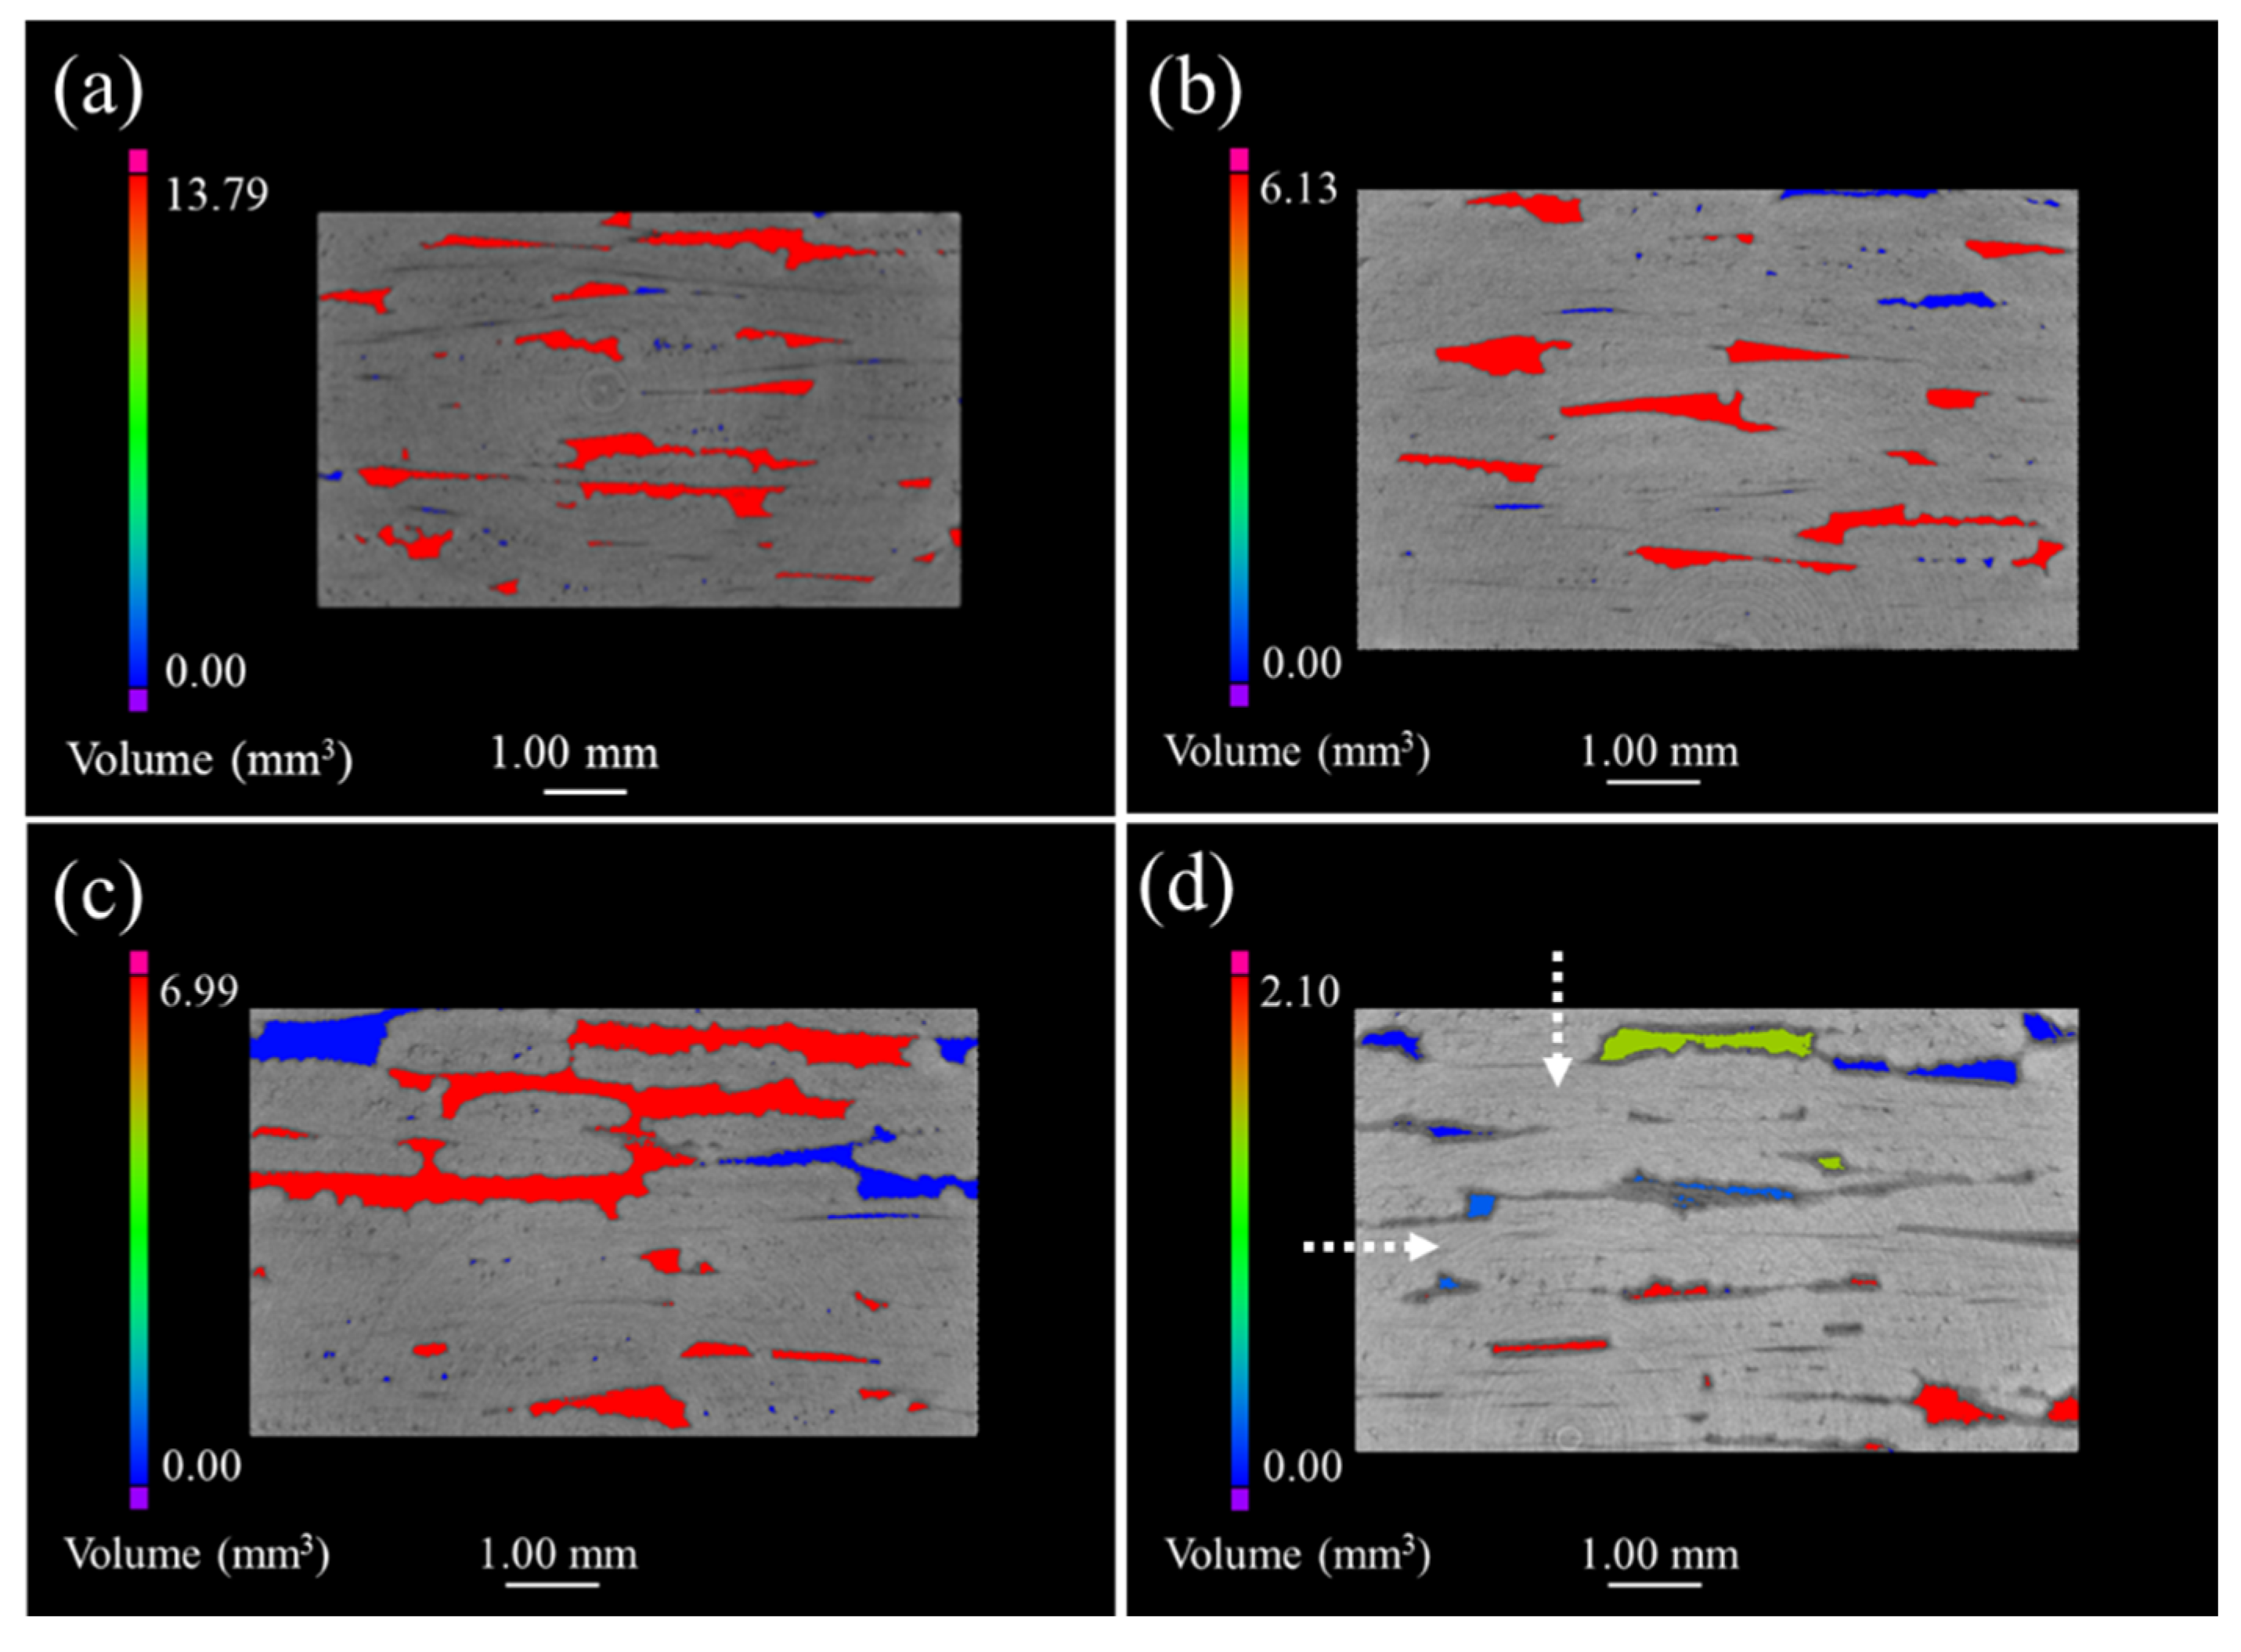
Figure 4 shows the μ-CT images of 2D satin SiC/SiC composites. It can be seen that the defects presented in
Figure 4a are unevenly distributed and the volume is relatively large, compared with the 2D SiC/SiC composite. The maximum defect volume of composites after being oxidized for 100 h and 200 h was reduced by 50% and can be observed in
Figure 4b,c. Simultaneously, a large number of small-volume defects appeared. Compared with the μ-CT morphology of the first 200 h, more defects of different volumes could be found (shown in
Figure 4d), and the maximum defect volume reduced to 2.1 mm
3. Therefore, we can argue that the oxides in the whole process had a good sealing effect on the sample, and no serious delamination phenomenon, similar to that of the 2D plain SiC/SiC composite material, took place.
The acquired μ-CT images of the 2D P/S composite are exhibited in
Figure 5. More specifically, the defect volume and connectivity between the fiber layers were greater than those of the 2D plain and the satin composites, as observed in the μ-CT images of the as-fabricated 2D P/S SiC/SiC composite (in
Figure 5a,b). When the sample was oxidized for 200 h, the maximum defect volume decreased by 67% compared with the original sample, indicating that the oxidation degree of the sample was relatively large. Moreover, the existence of different defect volumes, similar to the satin composite material, can be observed in
Figure 5g,h, and the plain weave layer also appeared to have a similar defect volume to the penetrating defect of the 2D plain weave composite.
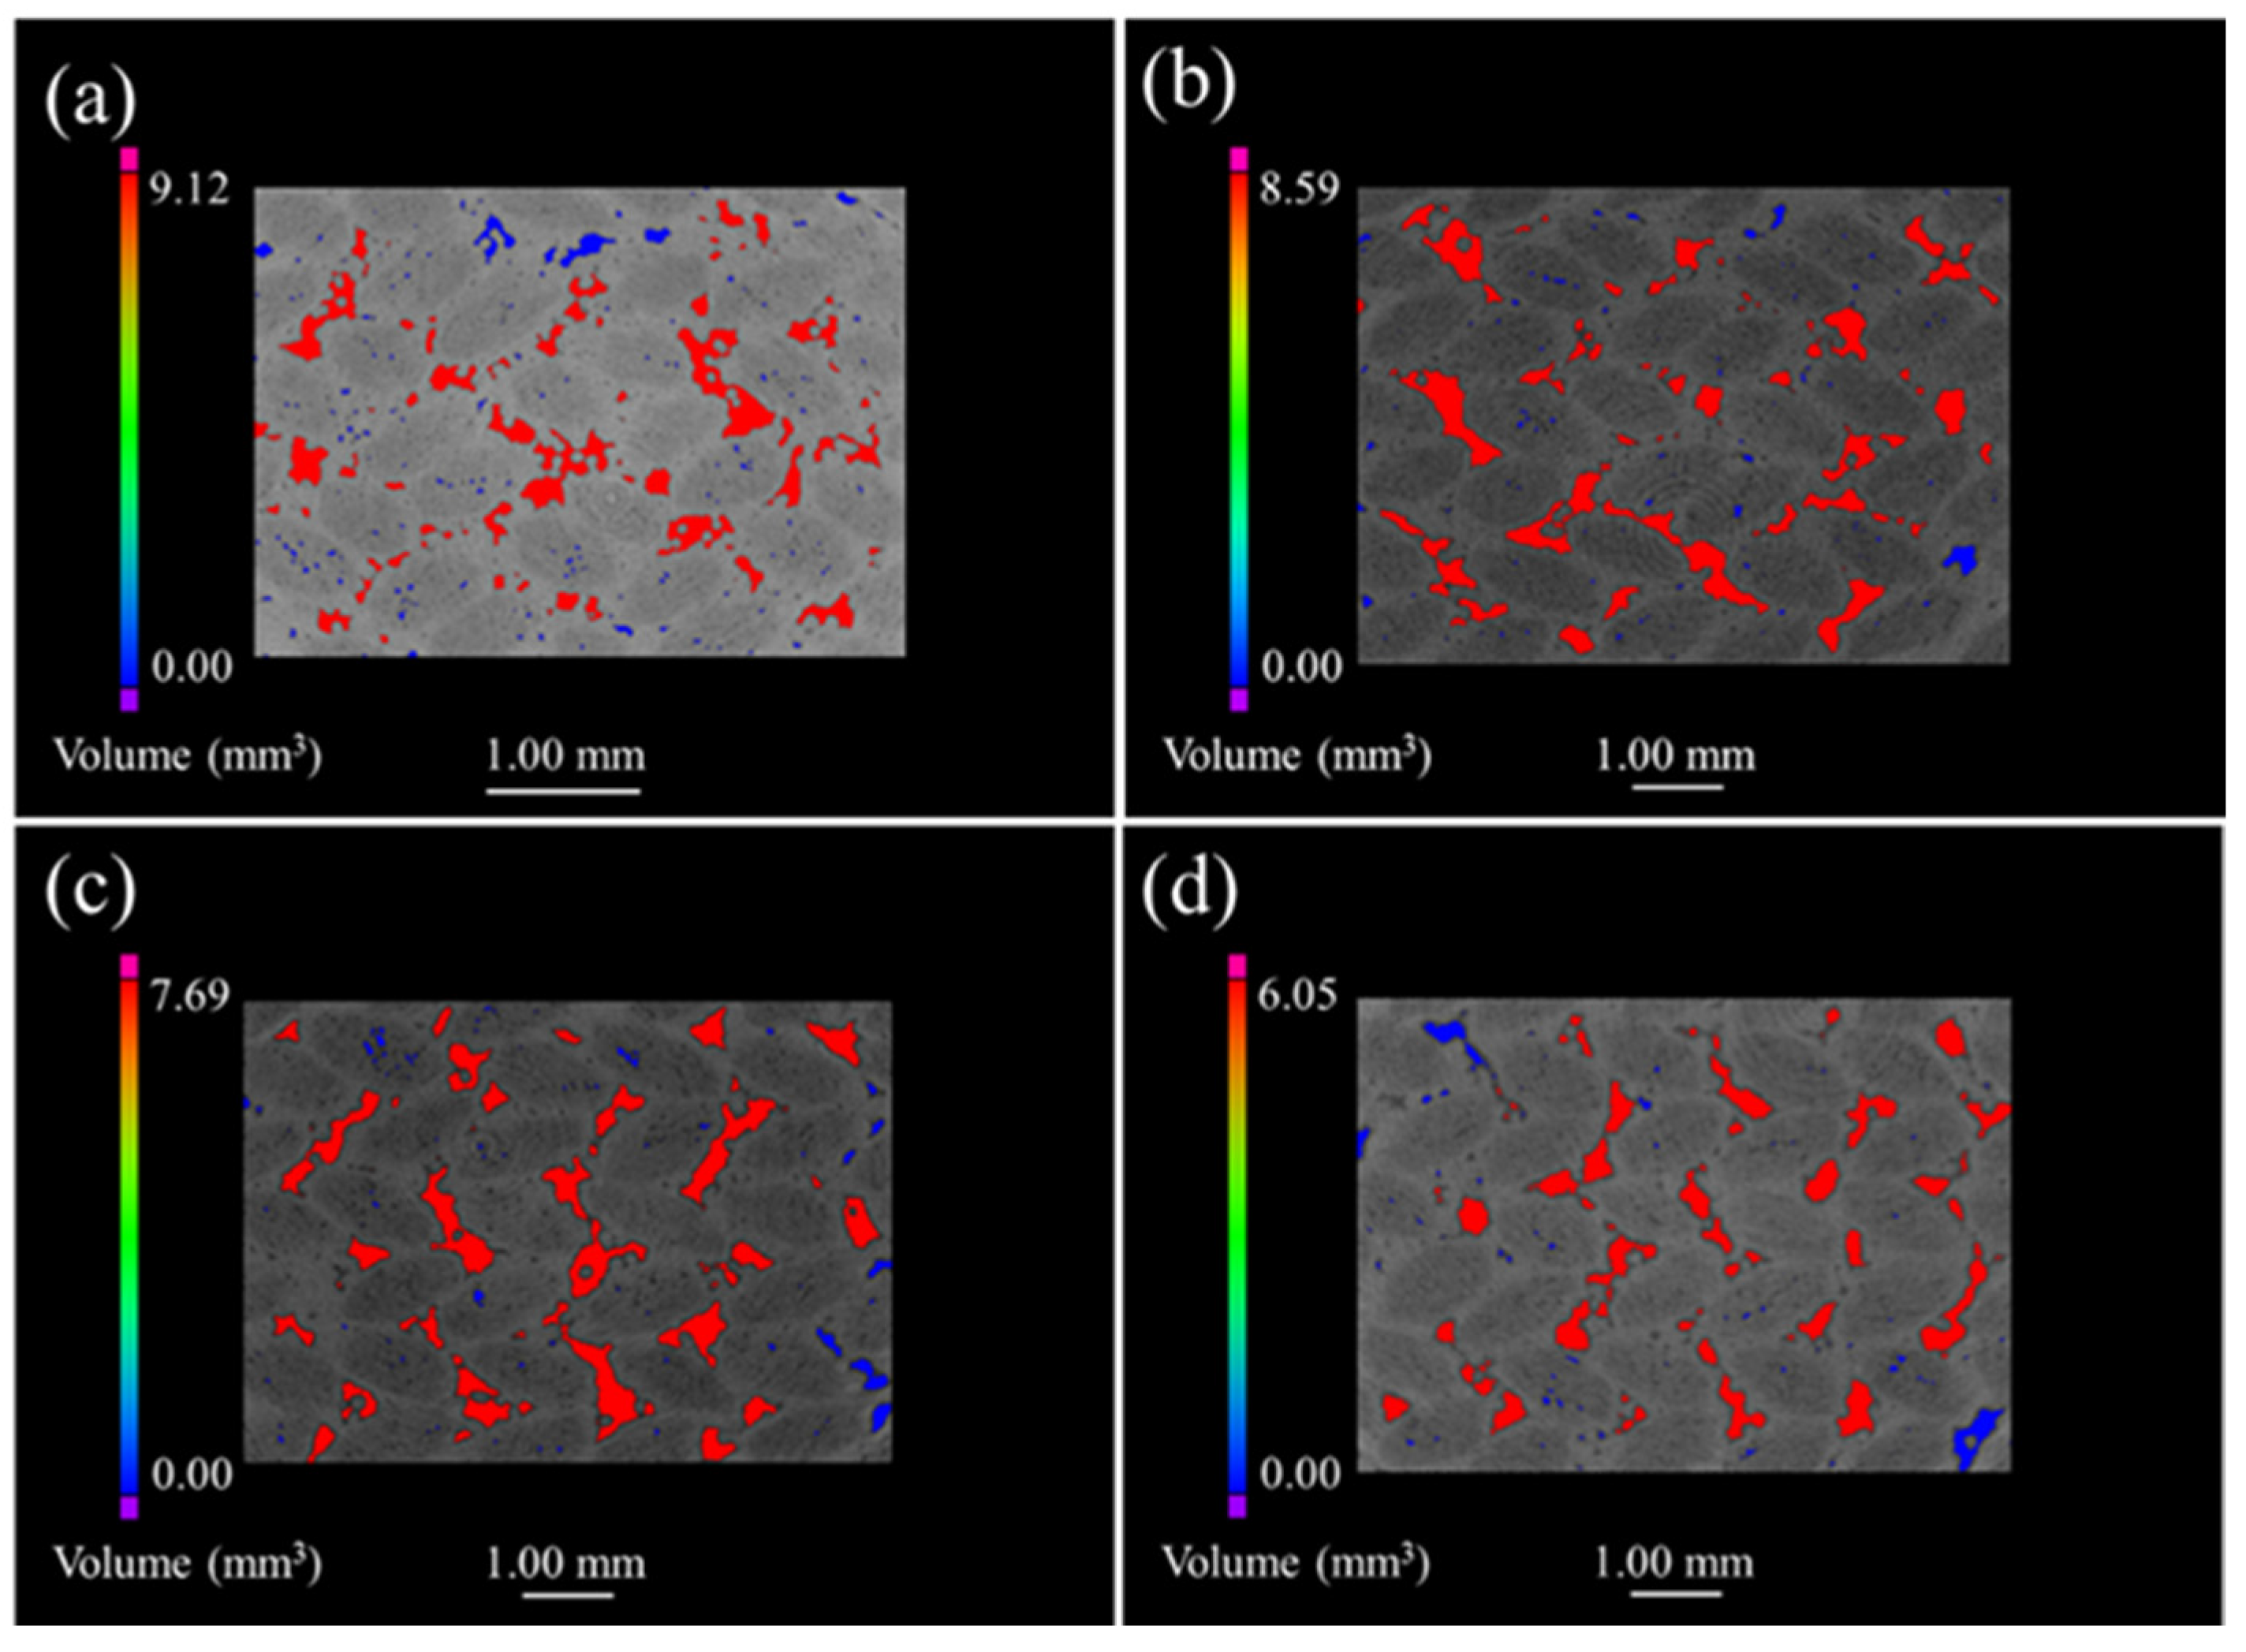
Figure 6 discloses the μ-CT images of the 3D 4d composite. The unoxidized samples are shown in
Figure 6a where small pores and large defects are mainly and evenly distributed within the fiber bundle and the angle between the fiber bundle, respectively. Furthermore,
Figure 6b–d illustrate that the defect volume decreased as oxidation progressed, while the reduction in the maximum pore volume of the oxidized sample, relative to the original sample, was 5.8%, 10.47% and 21.32%; which is small compared with the other three composites. In addition, the distribution of the defects in the oxidized composites was similar to the original samples, suggesting that the oxide filled the material defects more uniformly.
Although the inter-bundle and the inter-layer defects were mainly distributed in the four kinds of composite materials, both the shape and size of the pores were different due to the difference in structures. For example, the defect holes of the 2D plain SiC/SiC configuration were smaller than those of the 2D satin weave, since the fiber bundles of the plain weave are tightly woven. Additionally, the 2D P/S composite materials experienced formation of large connectivity defects in the interlayer during the deposition of the matrix, because of the stacking of plain weave and satin weave. This effect can be considered to prove that the mass change rate of the 2D P/S composite is largely combined with the μ-CT images of the oxidized samples. However, the defects of the 3D 4d composites were mainly distributed at the angle between the fiber bundles uniformly since it is a woven material, and there was no interlayer defect like that of the two-dimensional material.
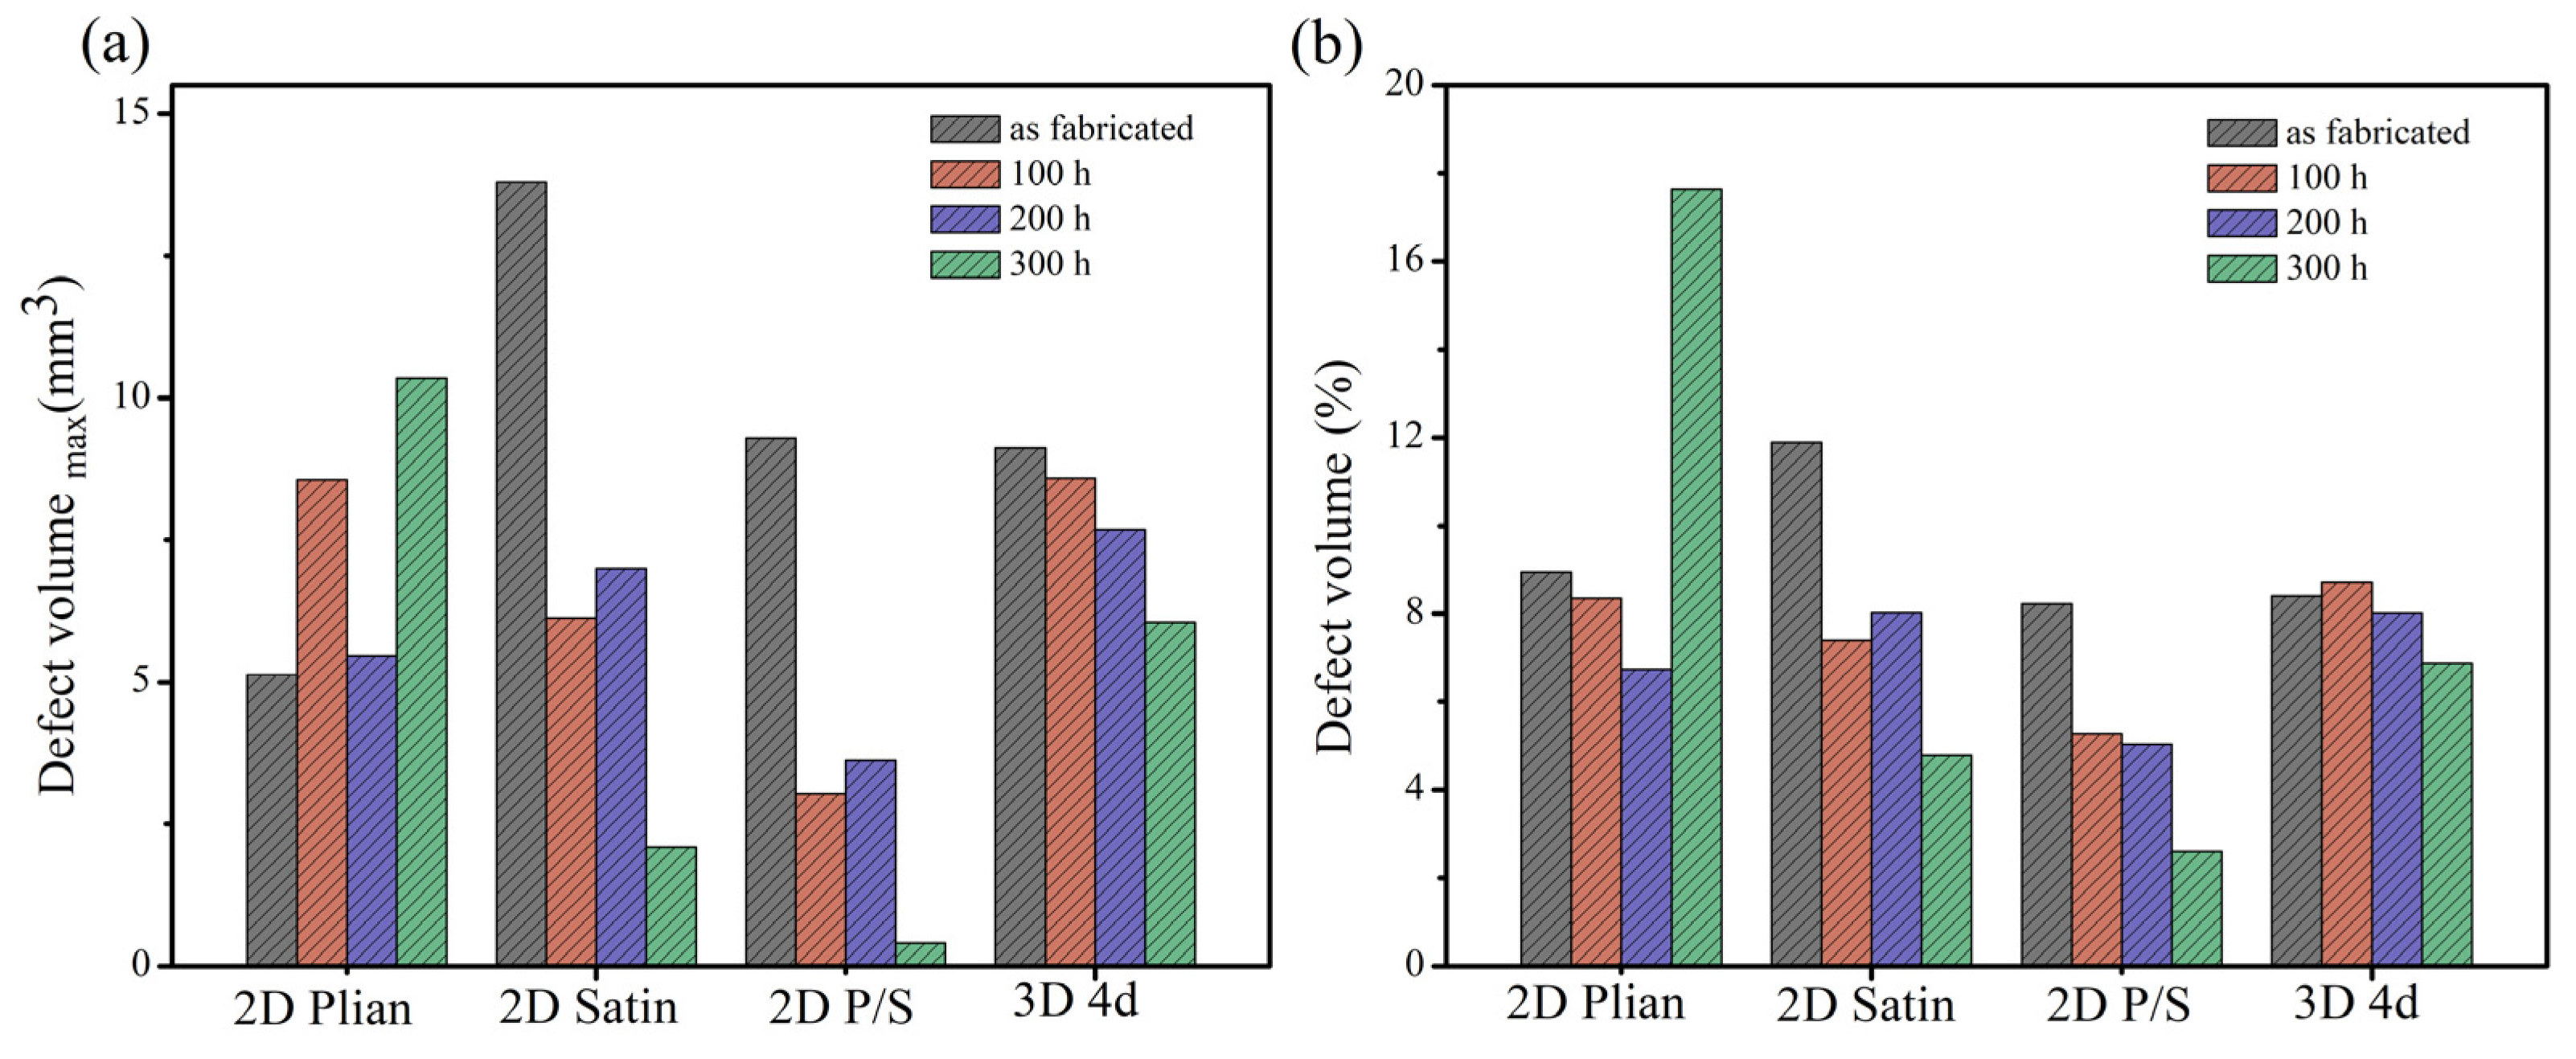
Figure 7 displays the μ-CT data of four kinds of SiC/SiC composites. The defect volume of the unoxidized 2D satin composite was the largest (the change of the defect volume), as is shown in
Figure 7a, whereas that of the 2D P/S composite, after being oxidized for 300 h, was the smallest. On top of that, the change of the defect volume fraction of the four kinds of SiC/SiC composites, represented in
Figure 7b, and the overall change trend, was similar to the pore volume change.
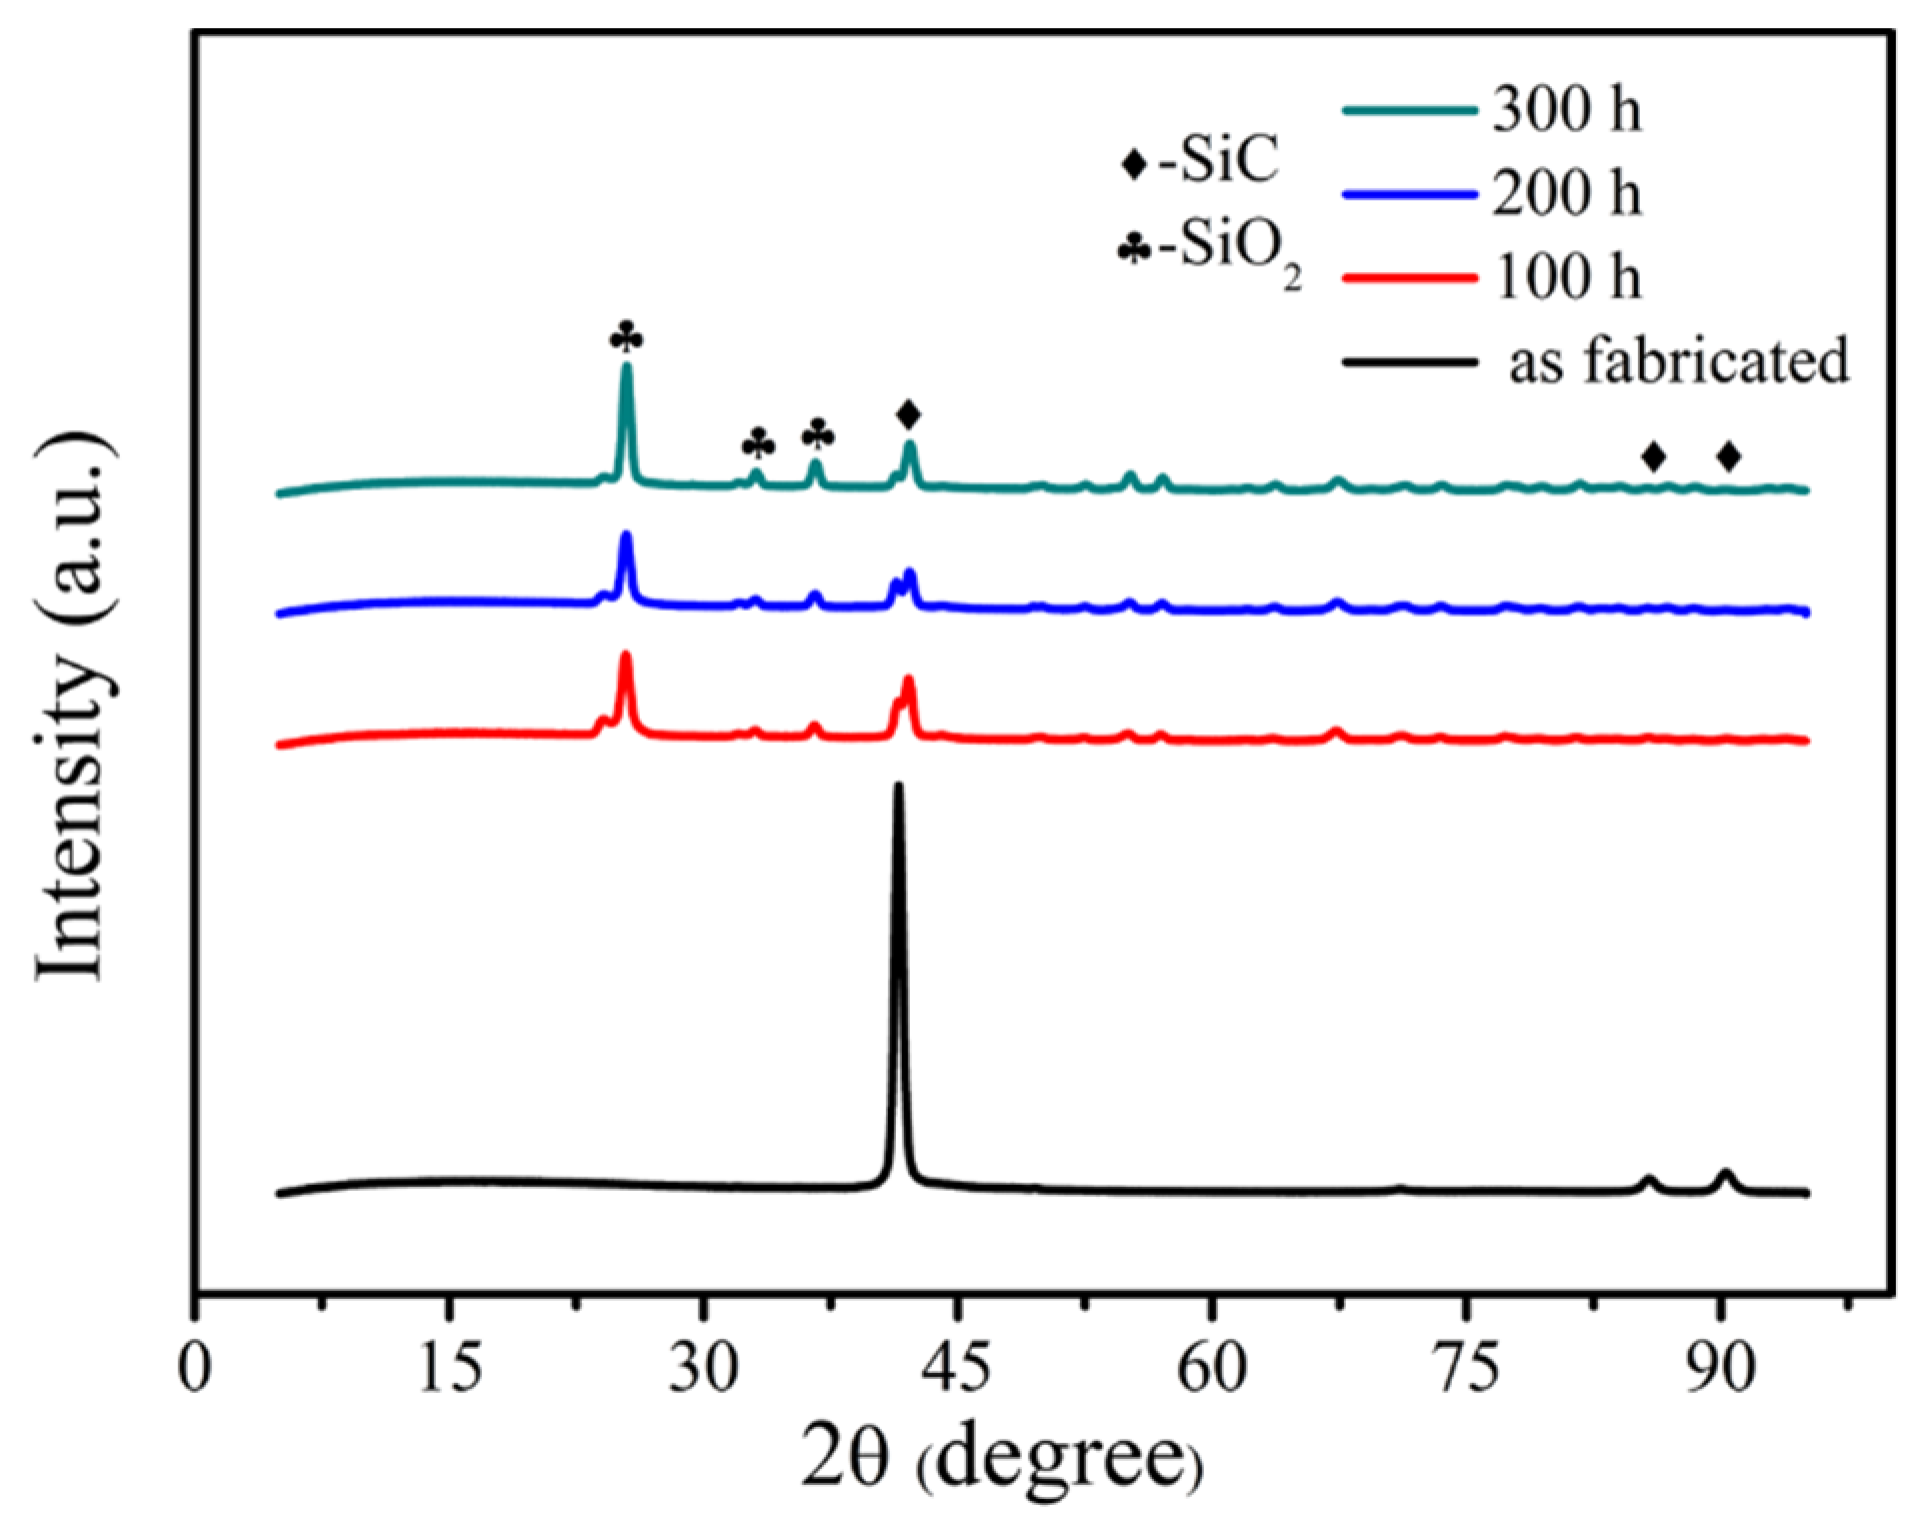
The samples were tested by X-ray diffraction to characterize the change of the phase composition of the material. The 2D satin SiC/SiC composite was selected as the representative, and its XRD results are shown in
Figure 8. It can be seen that the original SiC/SiC composite is mainly composed of SiC phase. However, when the material was oxidized, the existence of SiO
2 phase was detected on the surface of the sample, and the crystallinity of SiO
2 gradually increased with increase in time. This indicates that the SiO
2 film formed on the surface of the sample after oxidation, which can heal surface cracks and play a certain hindering effect on the oxidizing atmosphere. Additionally, the oxidizing atmosphere diffused from the outside to the inside, and SiO
2 oxides were also generated inside to seal the defects, so that the volume fraction of internal defects decreased, as shown in
Figure 7.
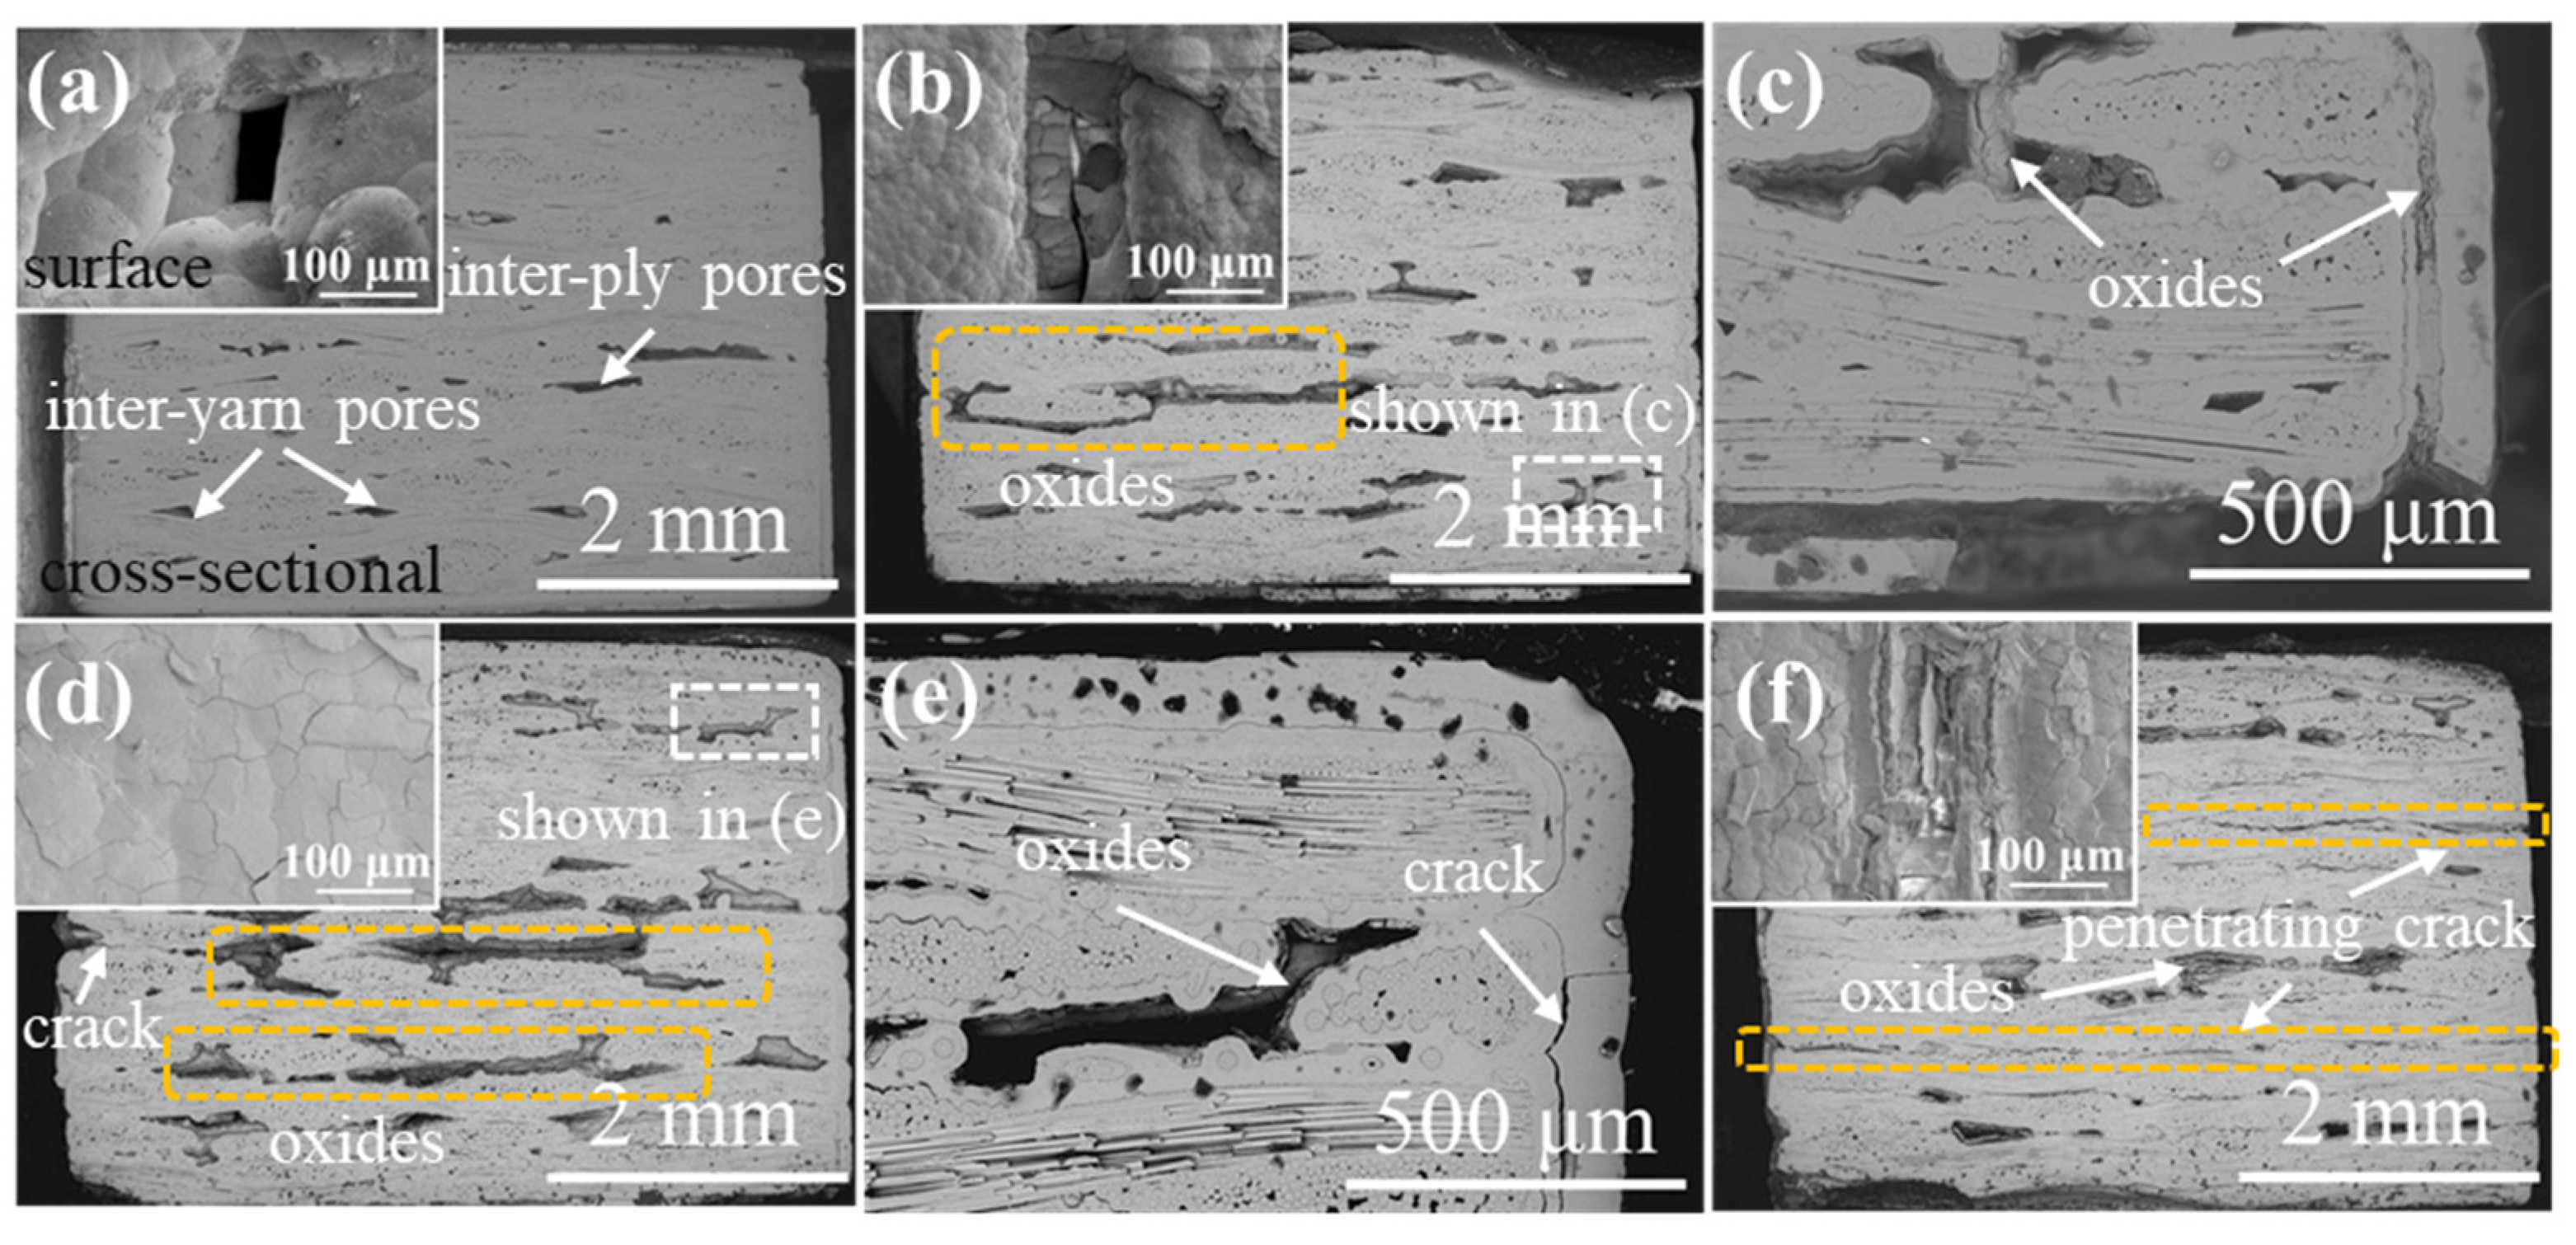
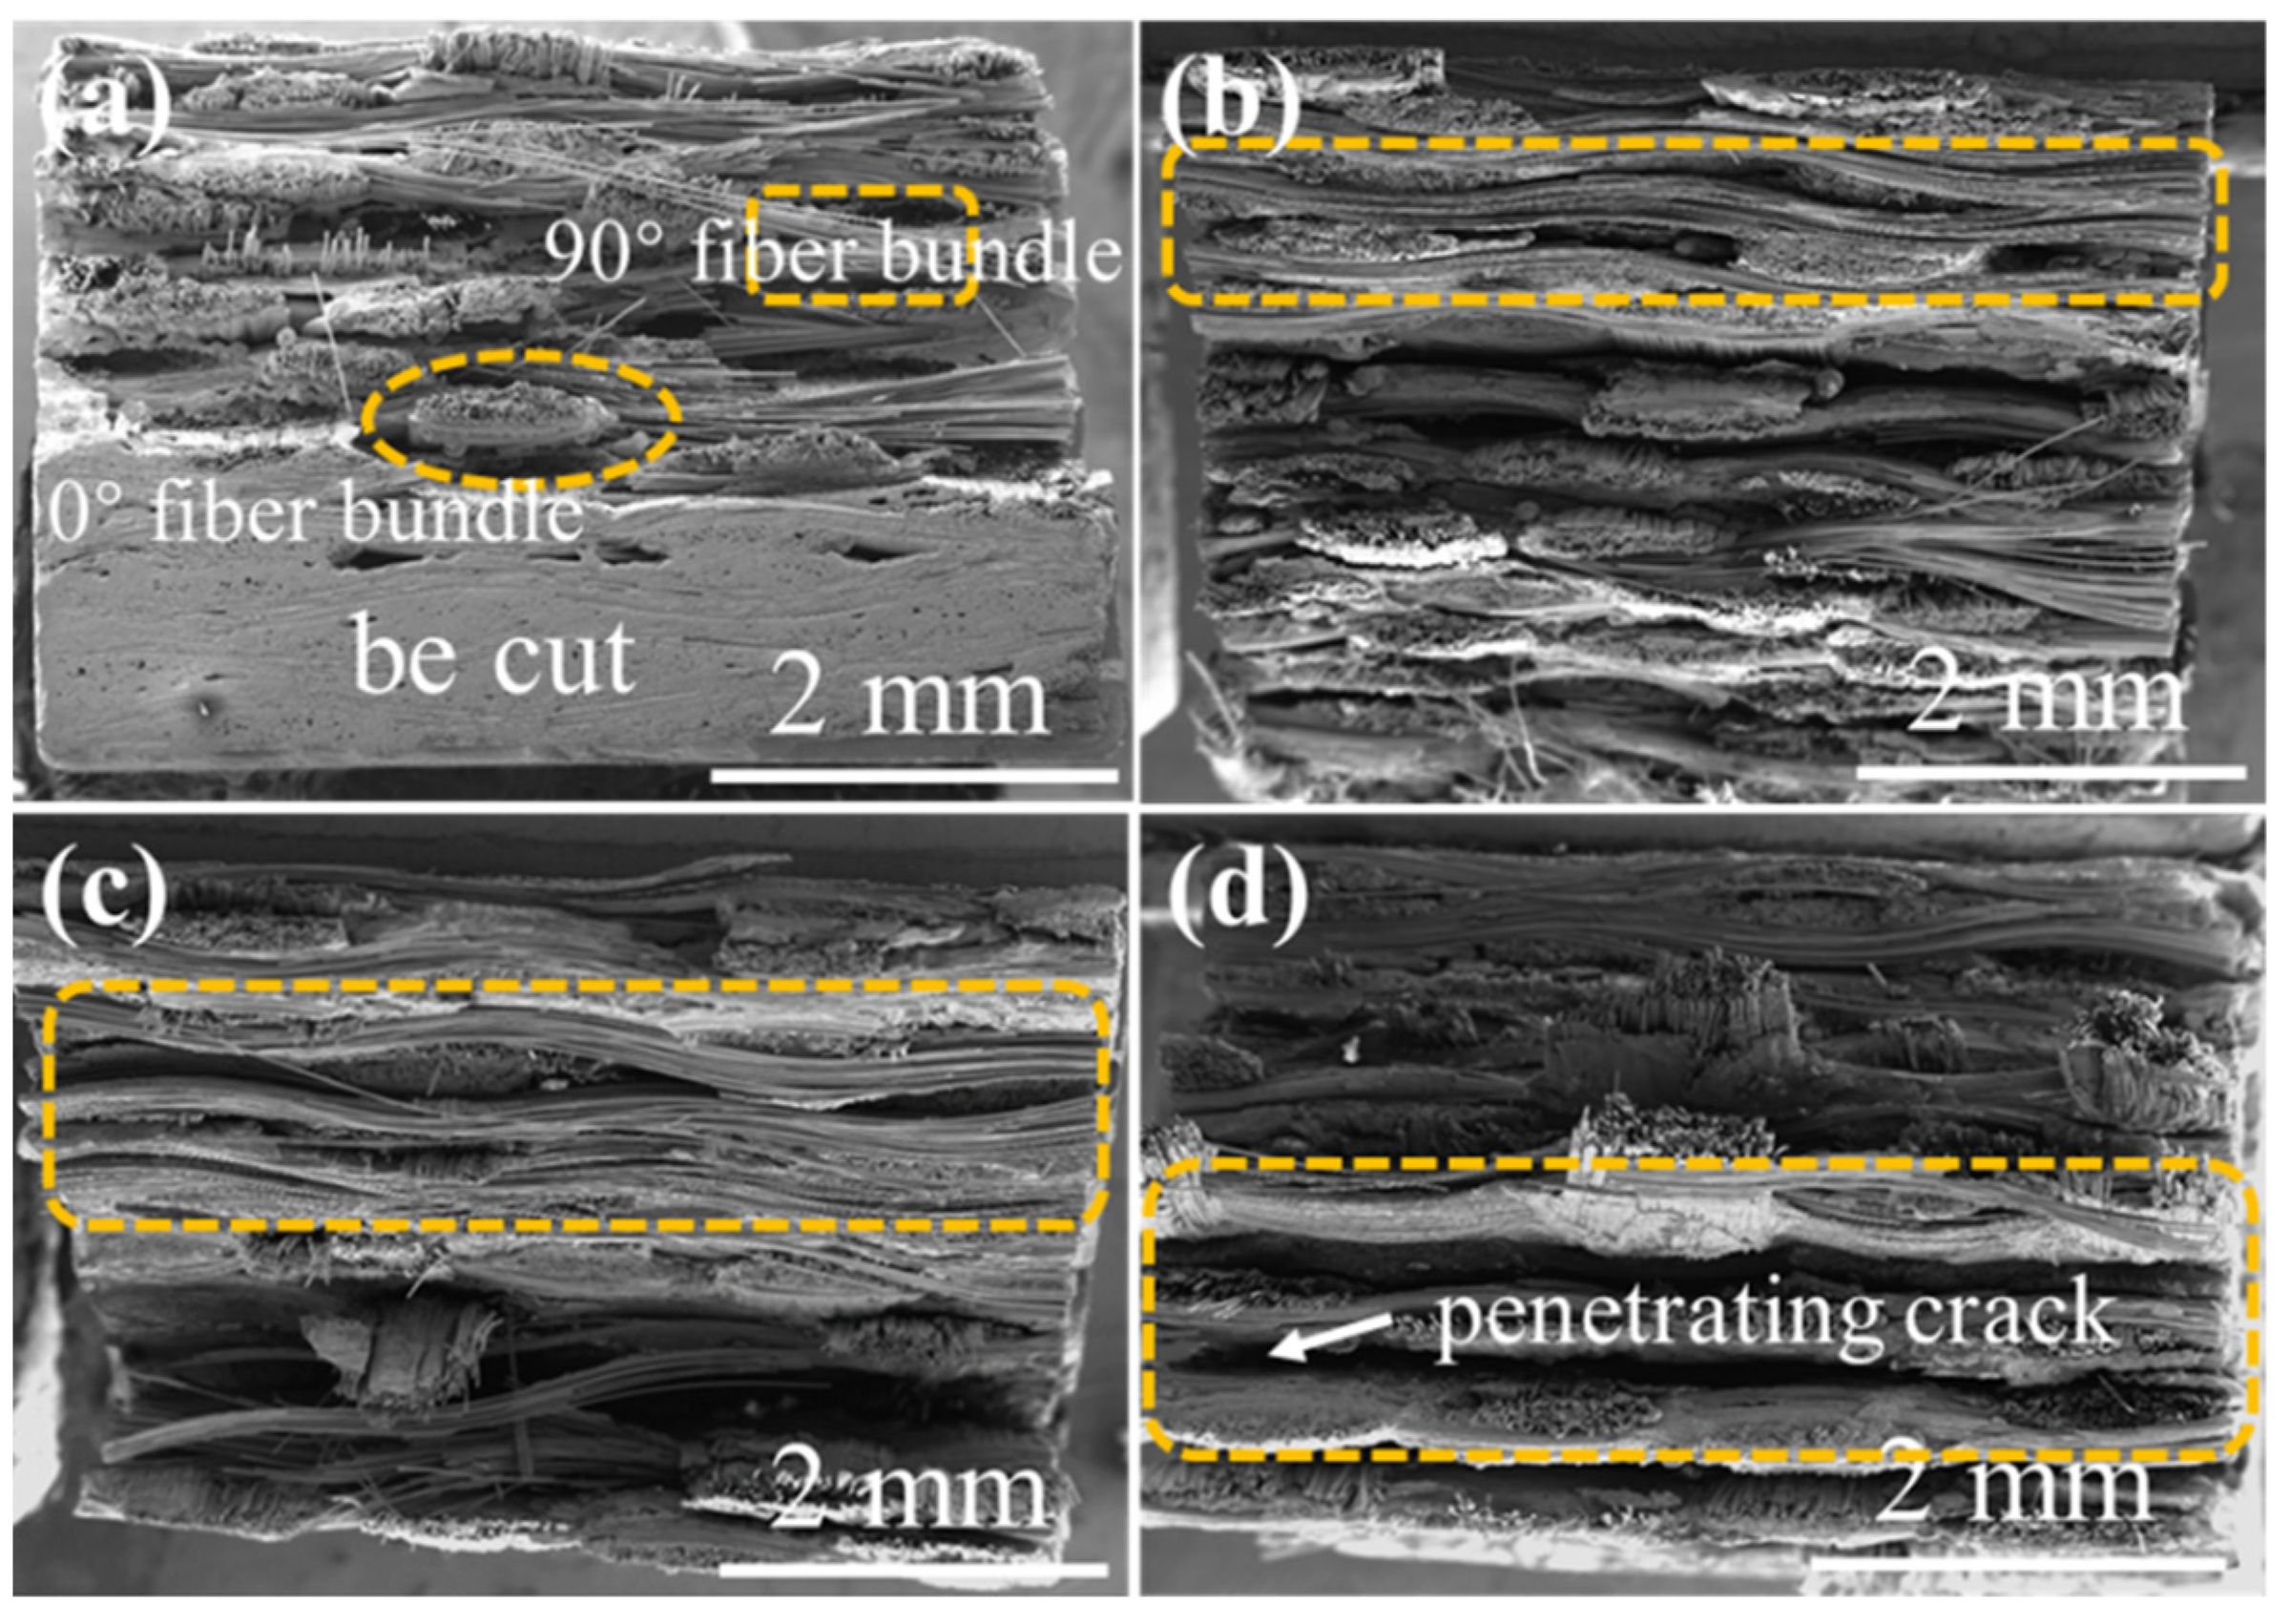
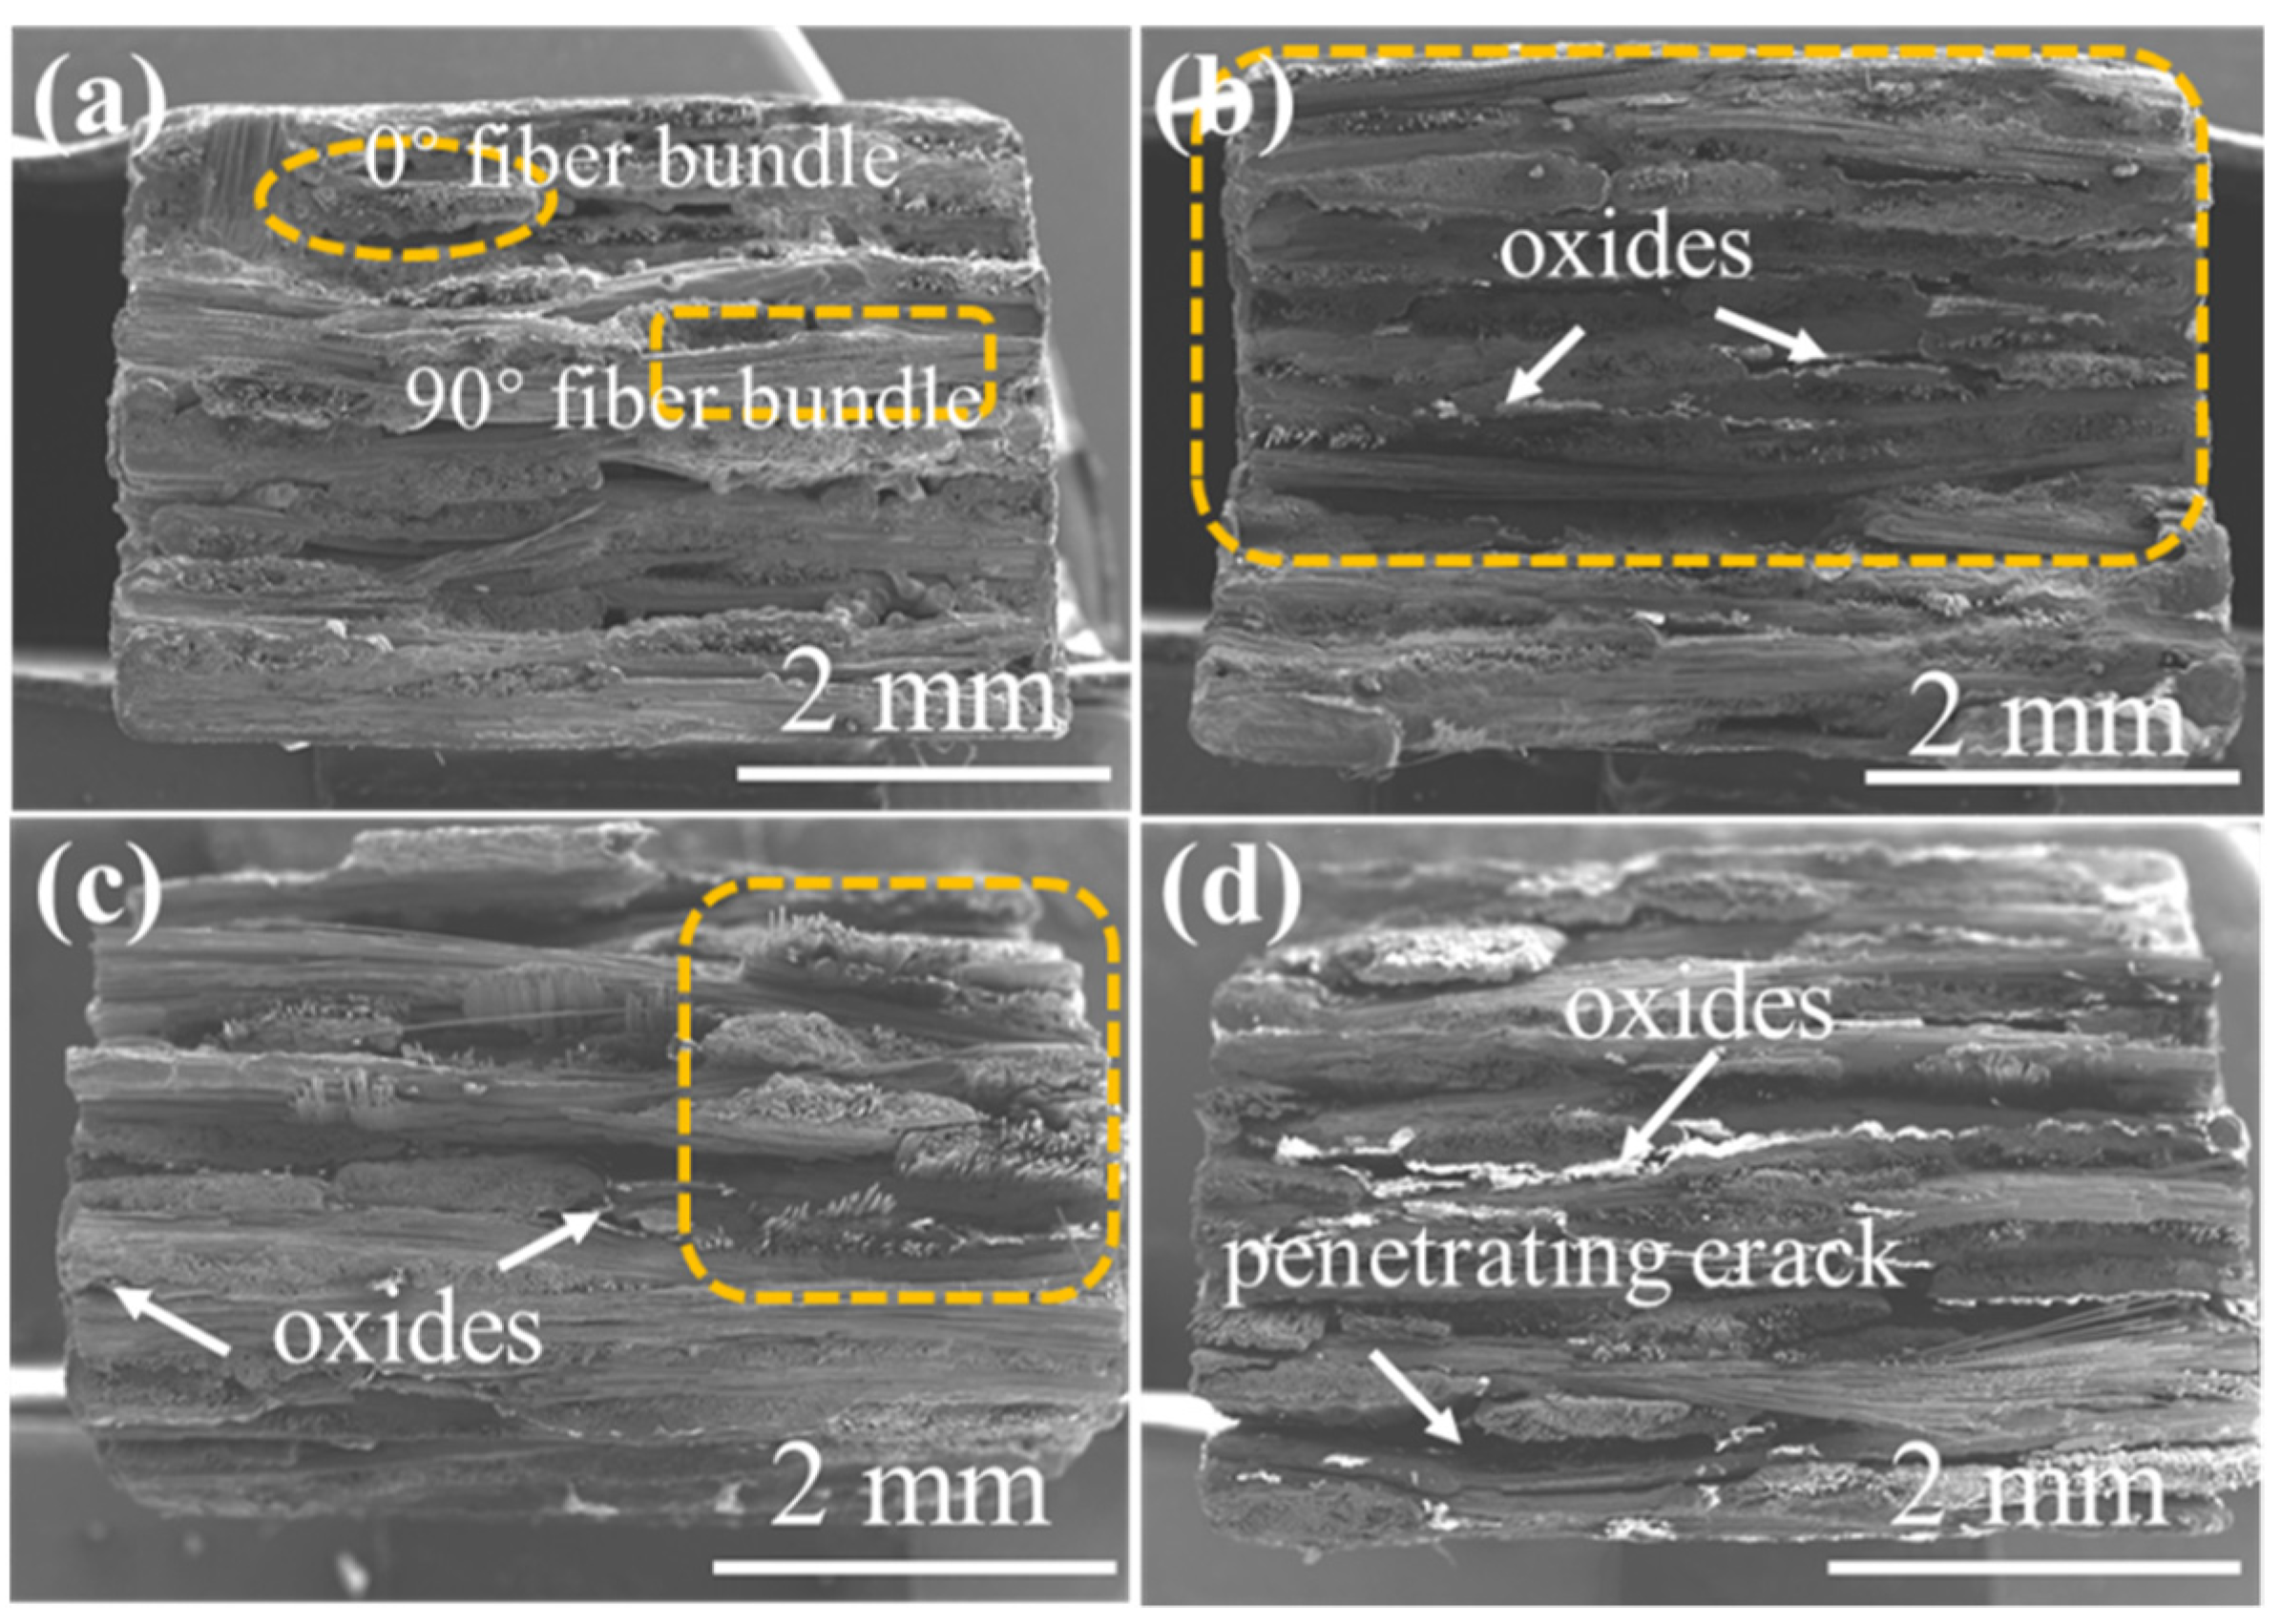
Figure 9 shows the cross-sectional morphology and surface morphology of the 2D plain SiC/SiC composites. From
Figure 9a, it can be observed that there are obvious fiber bundle weaving holes on the surface of the original sample. It can be observed that the surface is filled with oxides (as shown in
Figure 9b,d,f), and there is also the generation of microcracks. Moreover, obvious inter-bundle pores and inter-layer pores are exhibited in the cross-sectional morphology of the sample. Combined with the cross-sectional morphology of
Figure 9b–f, it can be seen that a large number of oxides formed between the layers of the composite material. Furthermore, there were obvious penetrating cracks inside the material when oxidation was carried out for 300 h, which was consistent with the results in μ-CT images (as shown in
Figure 2).
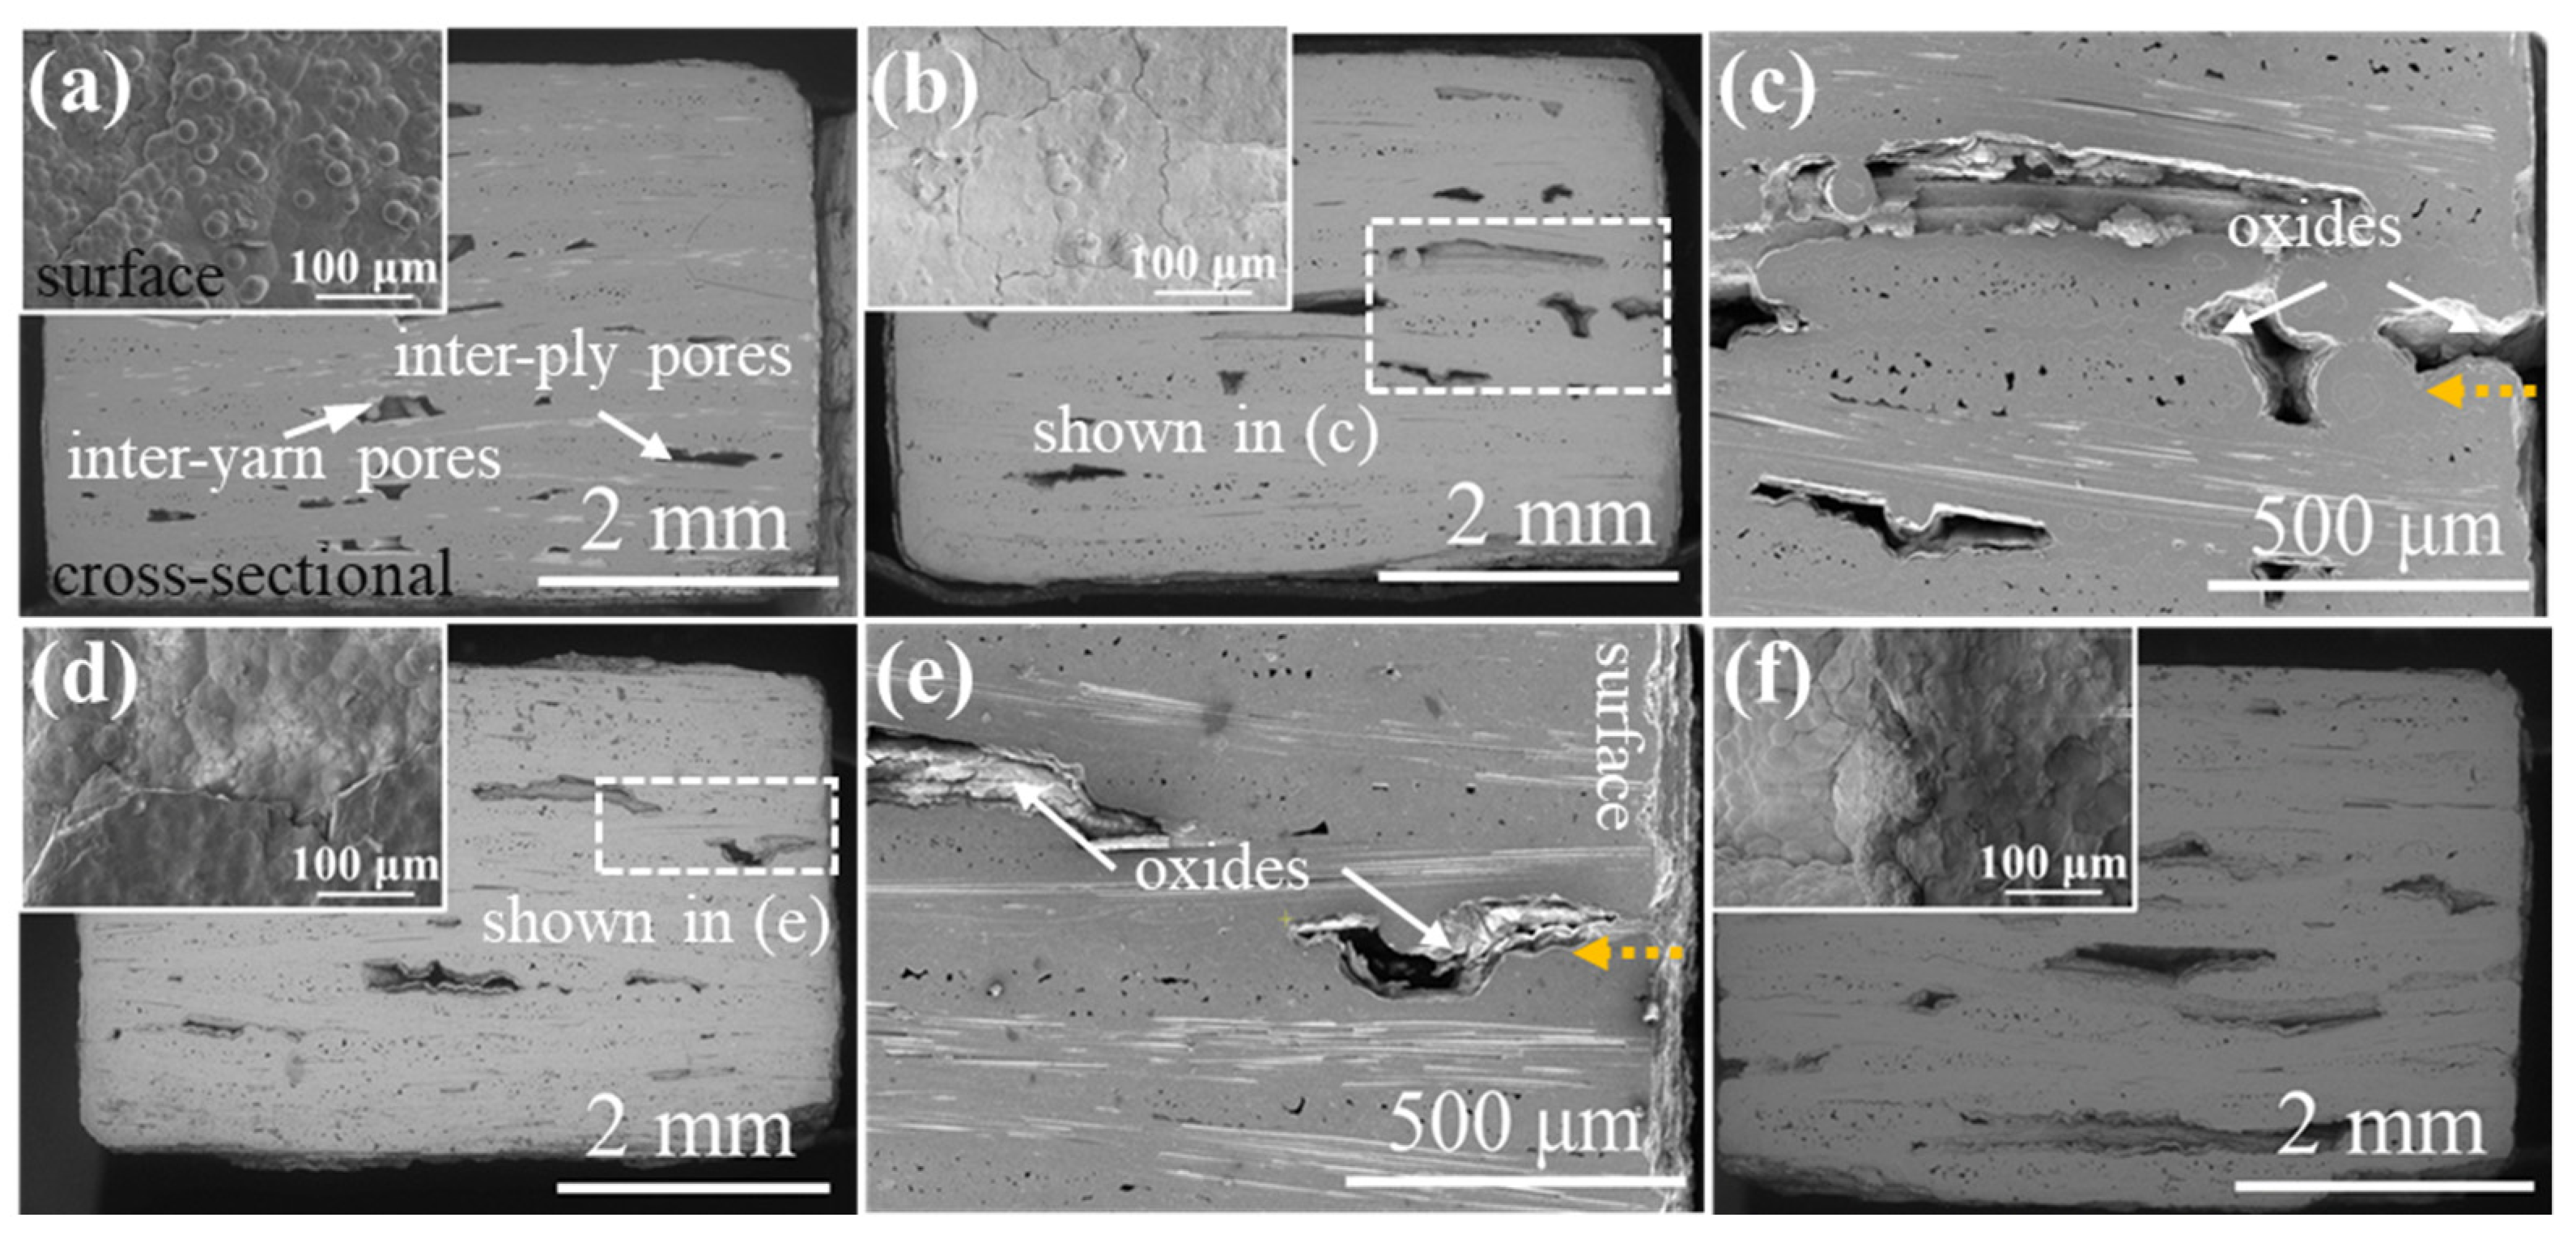
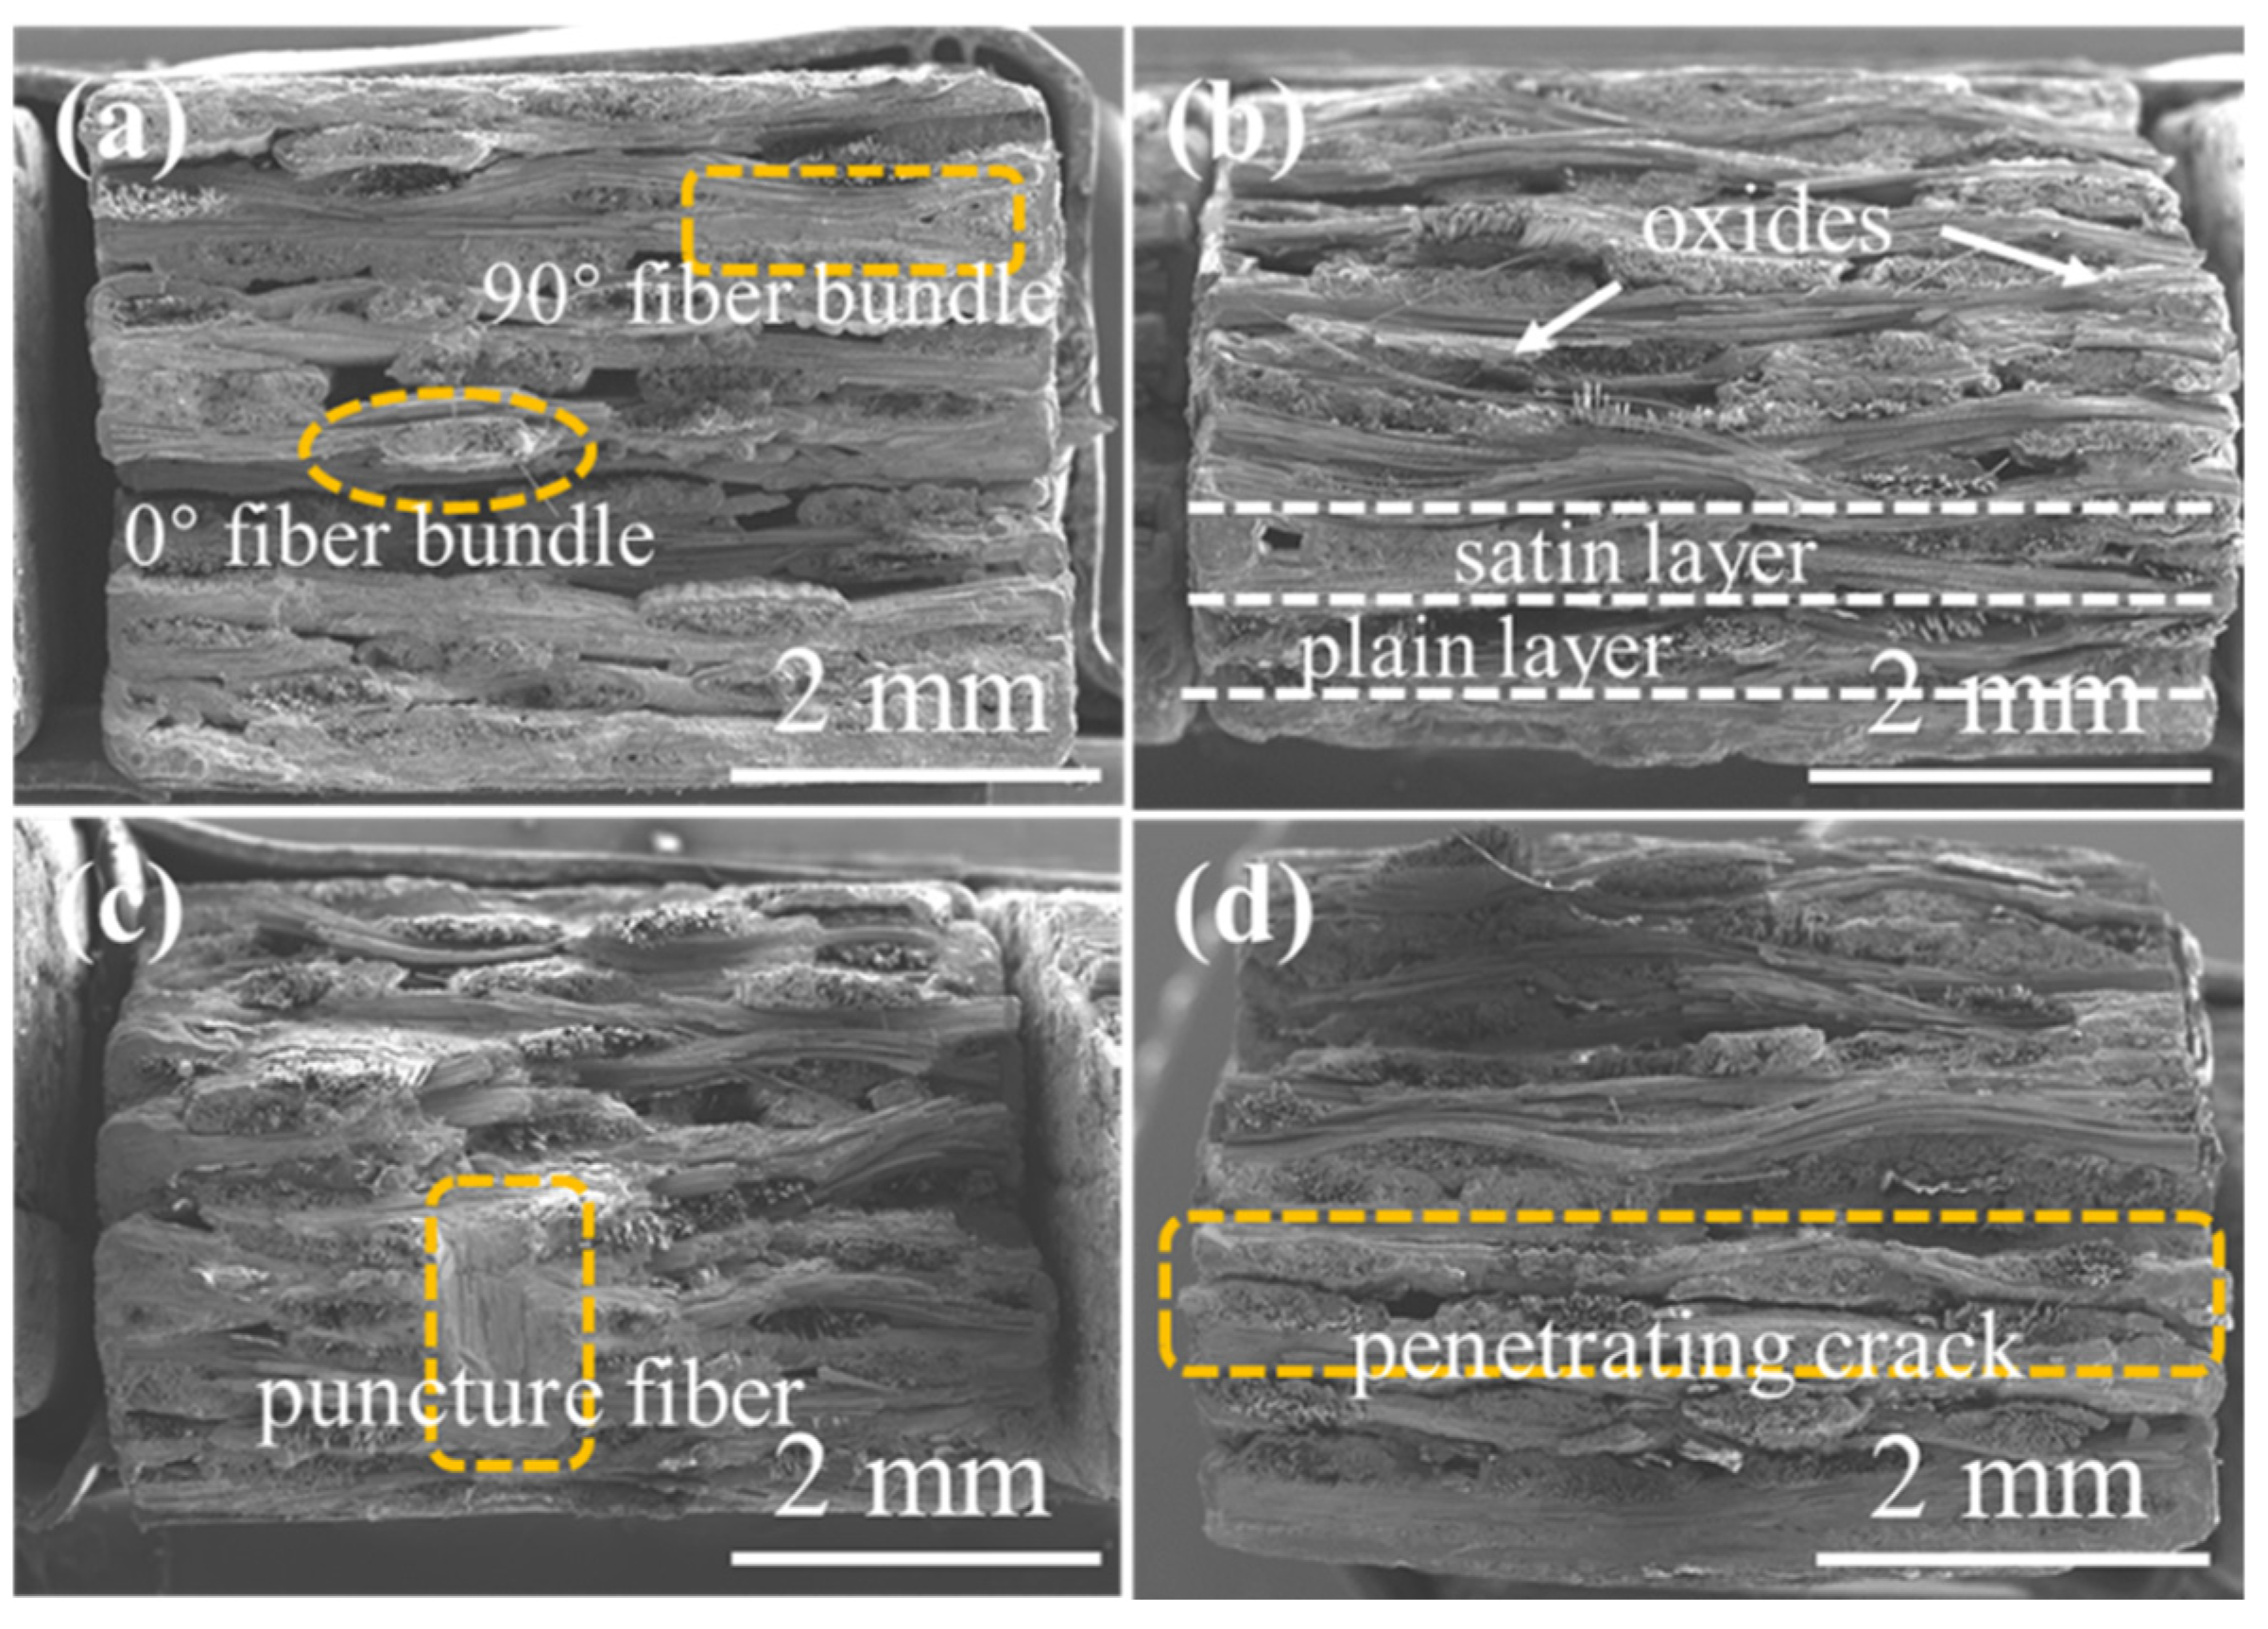
Figure 10 exhibits the cross-section morphology and surface morphology of the 2D satin SiC/SiC composite. From
Figure 10a, it can be observed that the SiC on the surface of the original sample exhibits a cauliflower-like morphology, and oxides were gradually formed on the surface as oxidation progressed (combined with the XRD results in
Figure 8). Observing the cross-sectional morphology in
Figure 10a, the existence of inter-bundle pores and inter-layer pores can also be seen in the original sample, but the volume of defect pores is larger than that in the 2D plain SiC/SiC composite. Furthermore, it can be observed that the defects at the near surface (the position of the orange arrow in
Figure 10c,e) are filled with a large amount of oxide, and the sealing degree of the sample after oxidation for 200 h was greater than that of oxidation for 100 h, indicating that oxidation proceeded inward along the interlayer. Furthermore, the defect pores near the surface of the sample oxidized for 300 h were well sealed, as shown in
Figure 10f.
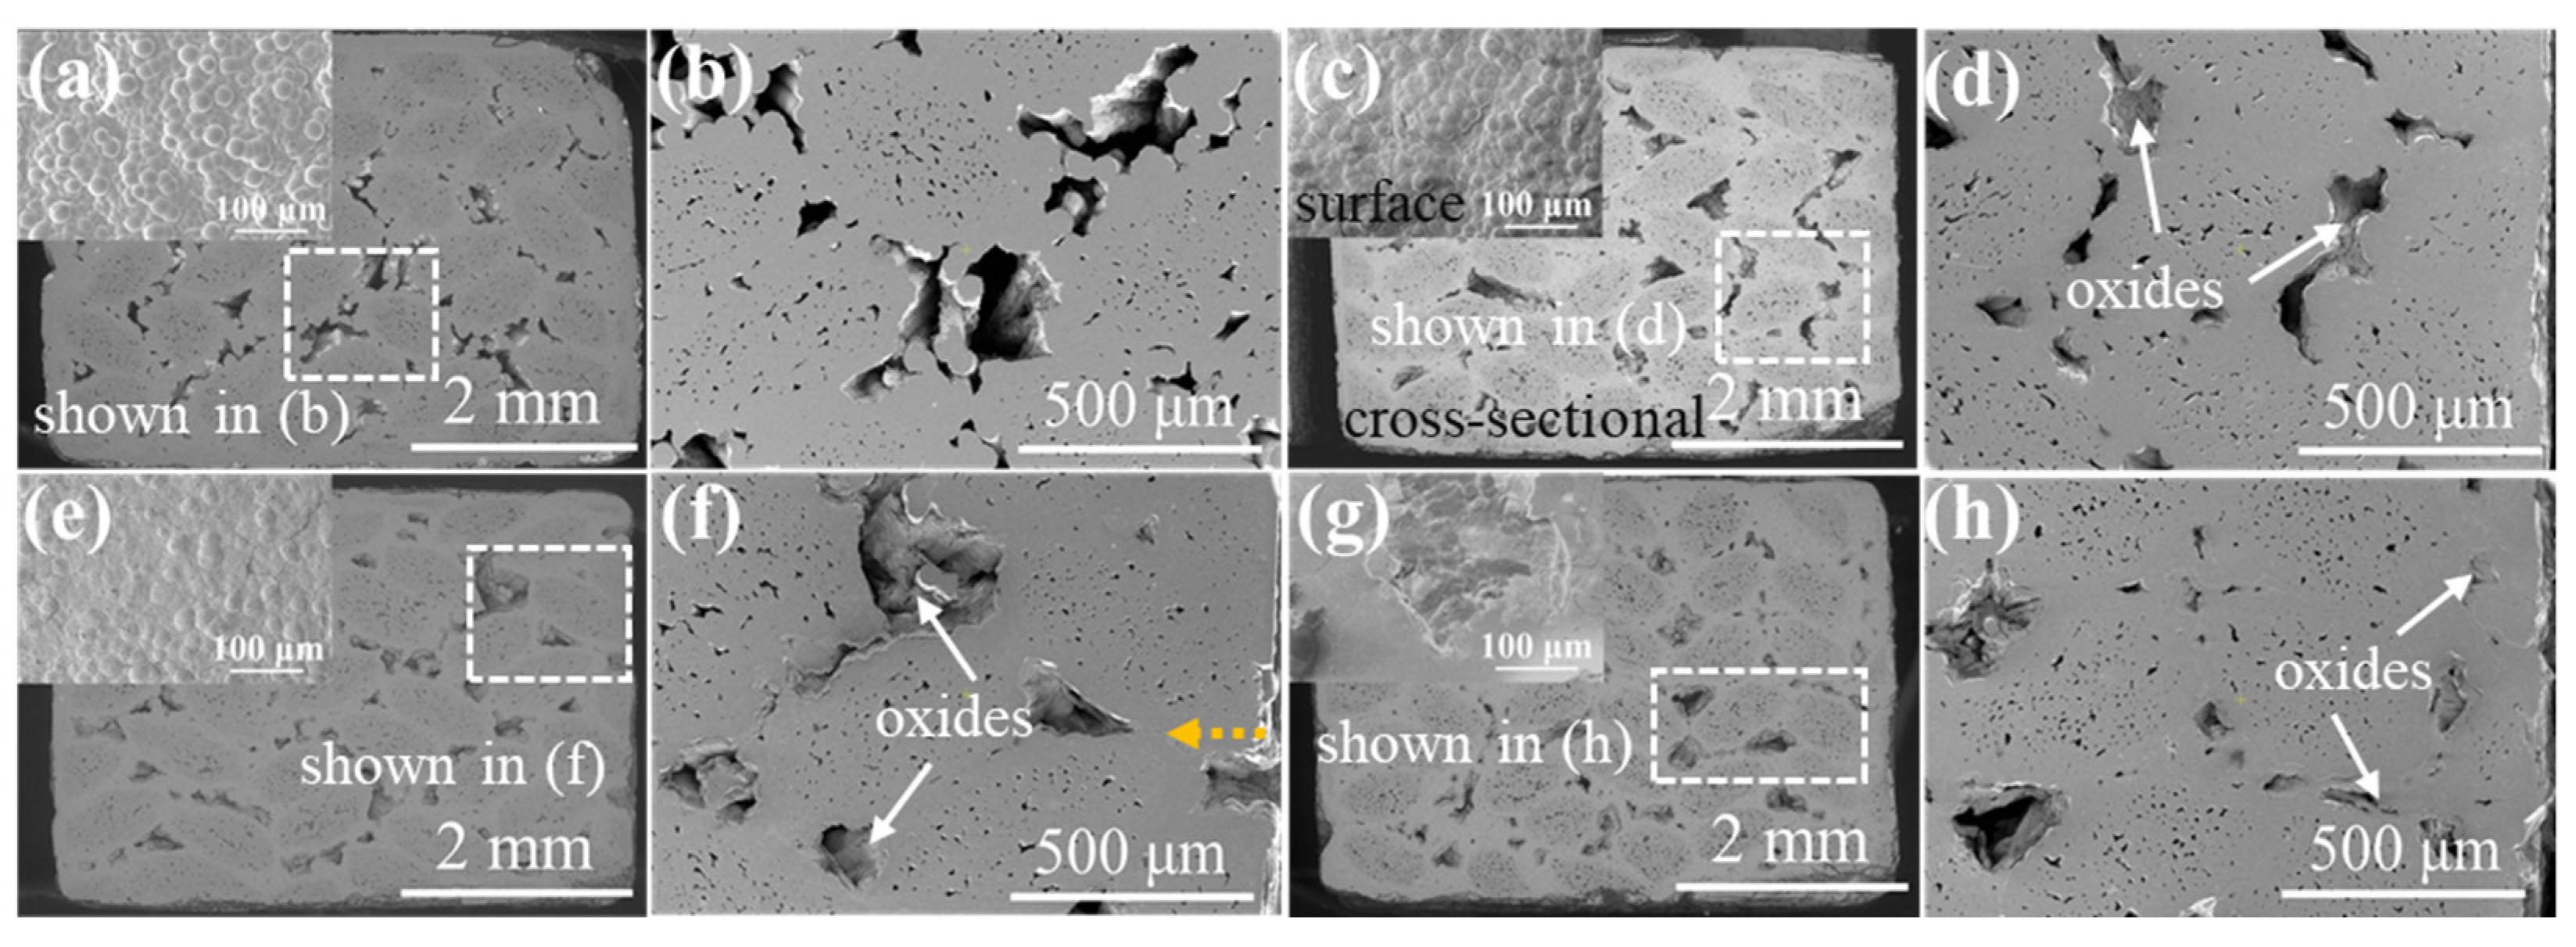
Figure 11 displays the cross-section morphology and surface morphology of the 2D P/S SiC/SiC composite. Observing the surface morphology (as shown in
Figure 11a,c,e,g), dense oxides were formed on the surface of the sample after oxidation. In the cross section of the original sample (in
Figure 11a,b), it can be inspected that there are a large number of large-volume defect pores inside the 2D P/S composite, and the defect pores were filled with SiO
2 after oxidation. In addition, it can be seen that a crack appeared between the inter-layers, shown in
Figure 11g, and the defect pores near the surface of the sample were basically completely sealed (as shown in
Figure 11h).
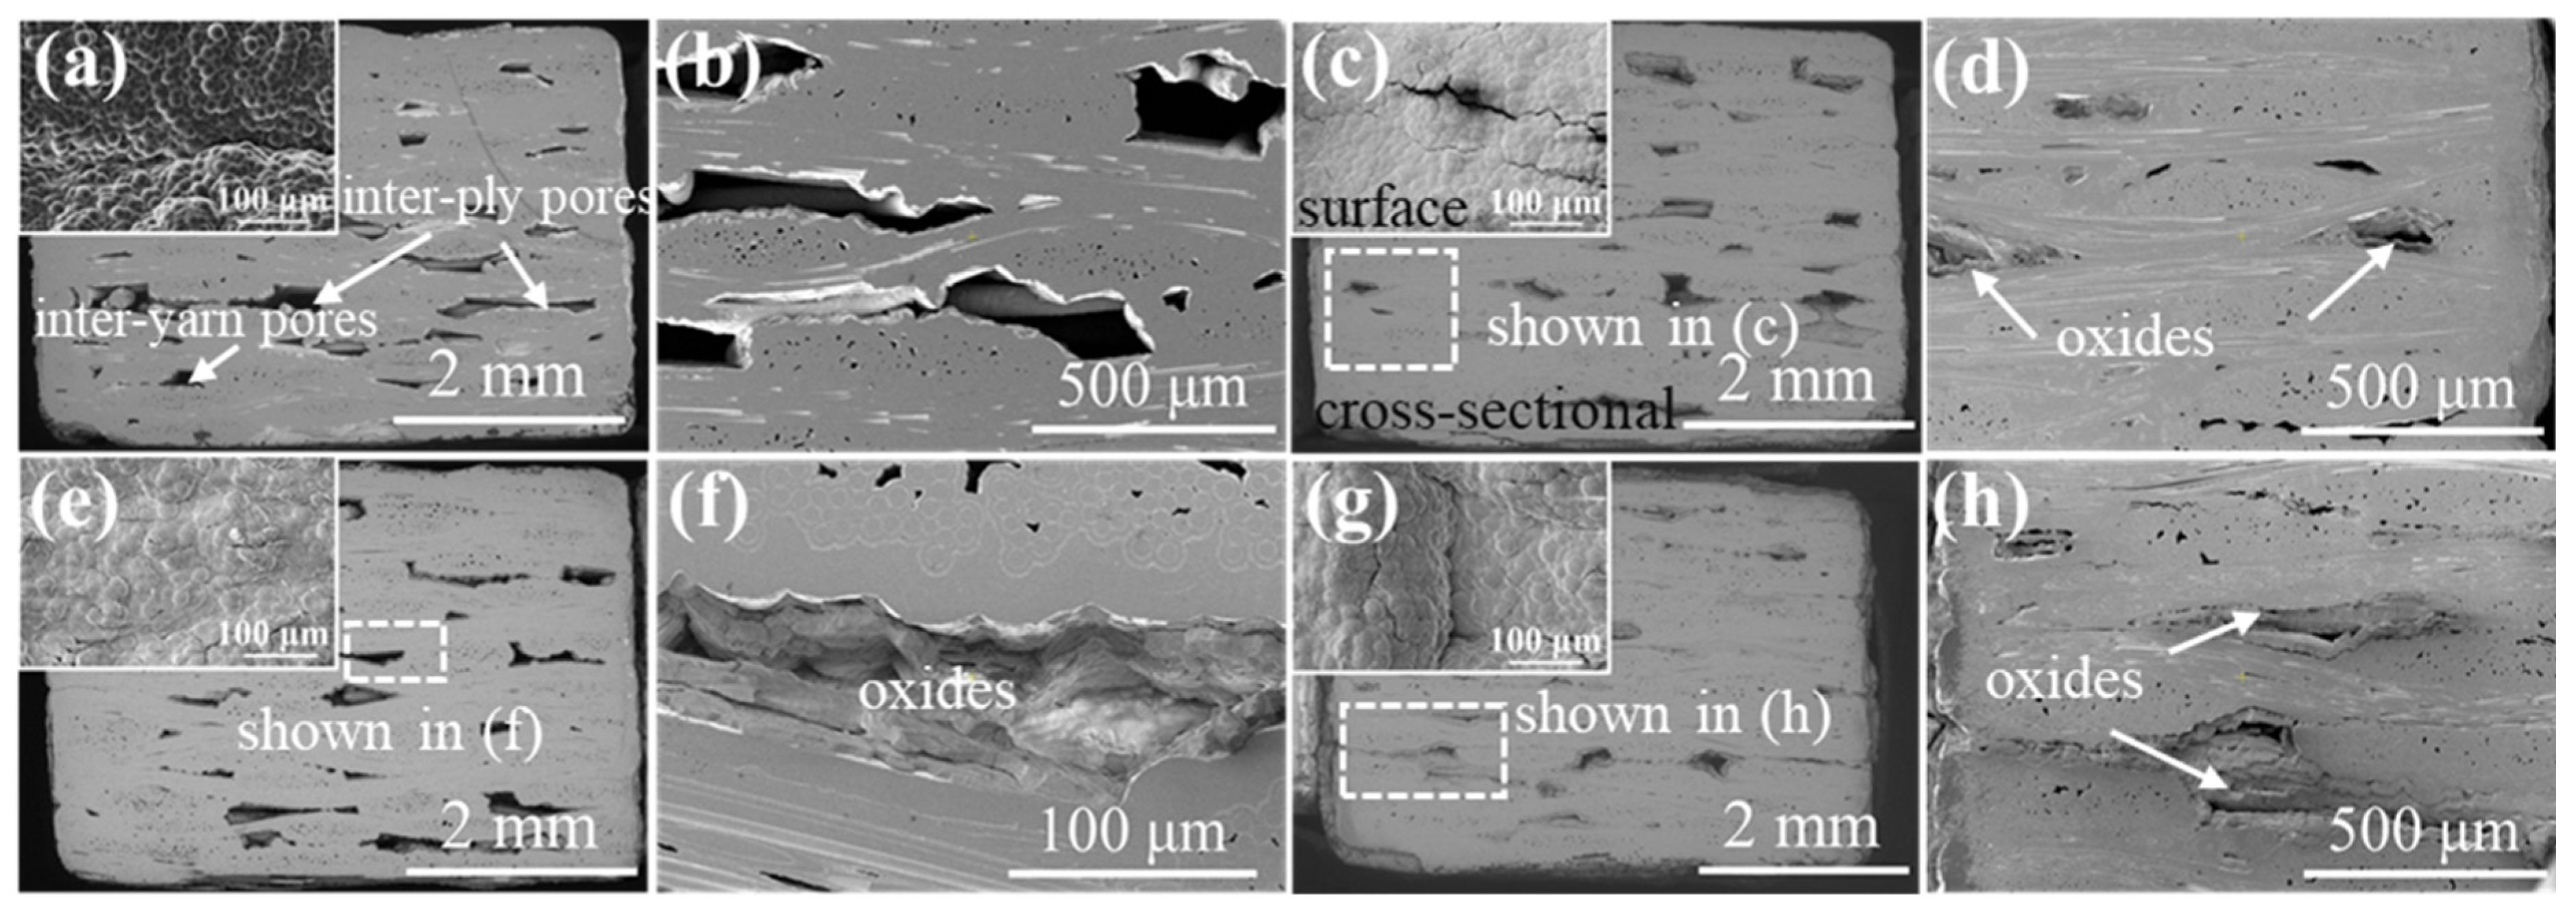
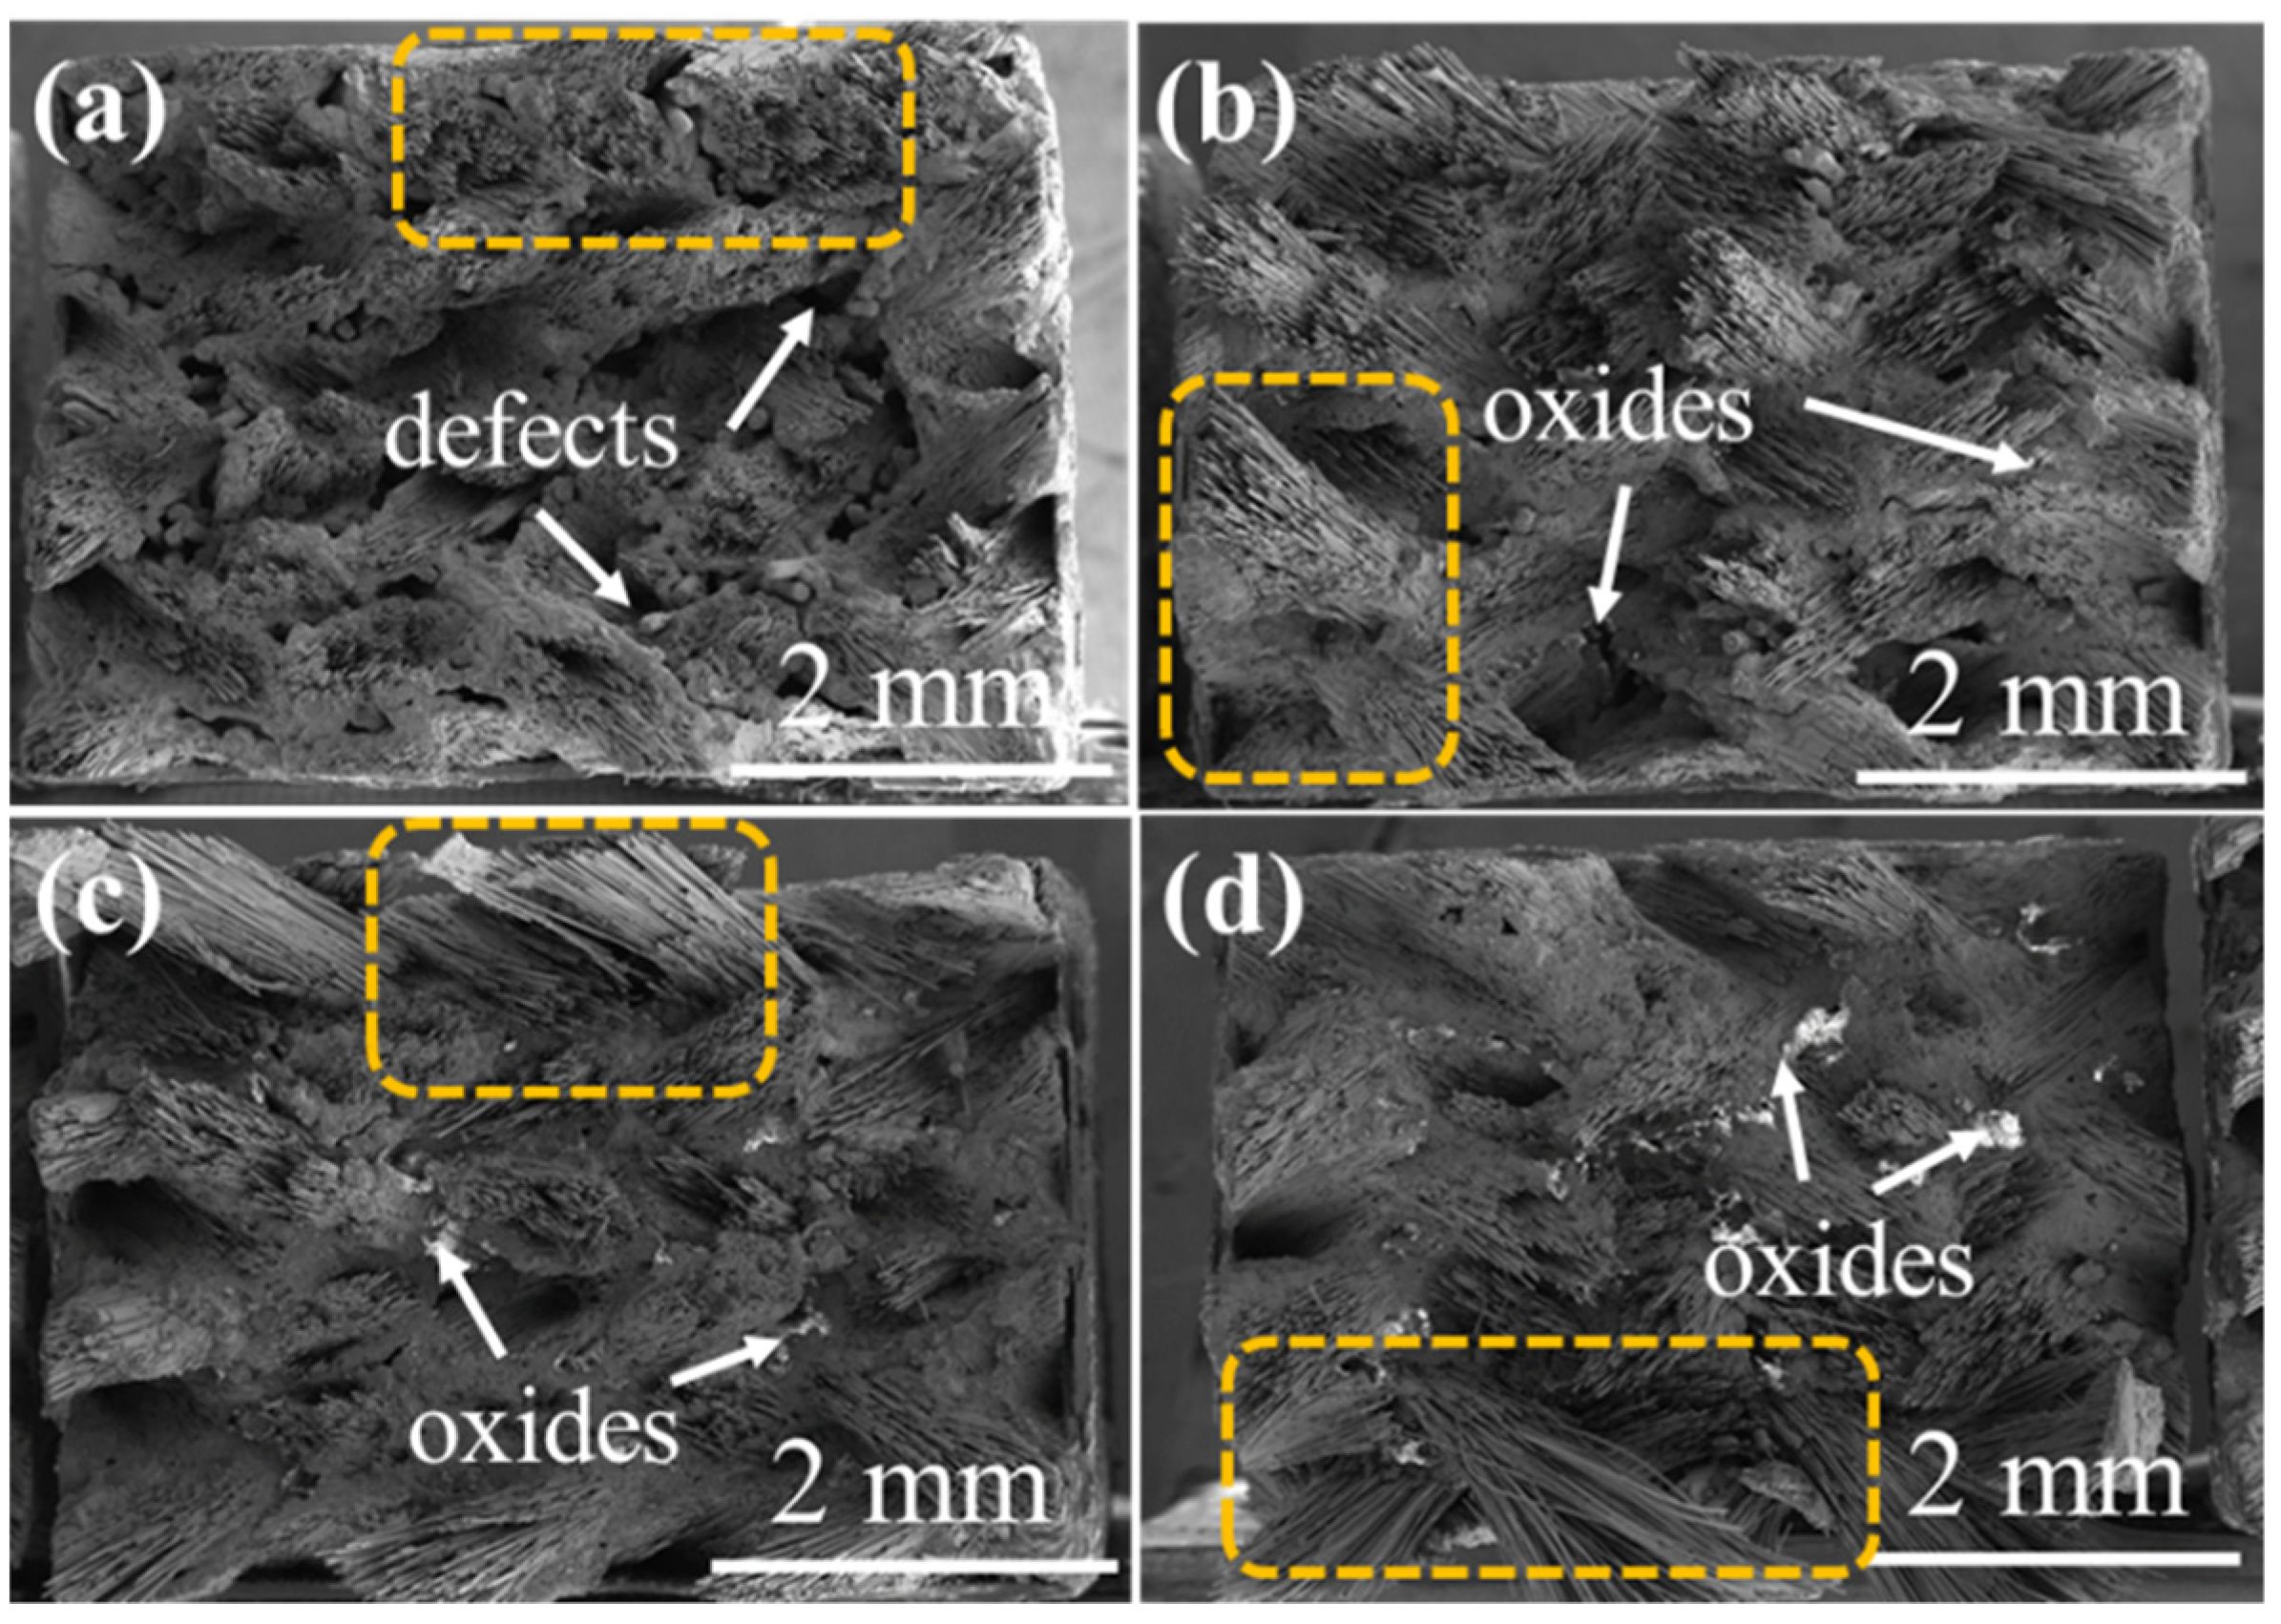
As shown in
Figure 12, it can be seen that there were very obvious oxidation traces on the surface of the 3D 4d SiC/SiC composite and the oxide layer peeling phenomenon was also observed after oxidation for 300 h. In
Figure 12a, the defects of the sample were evenly distributed at the braided corners of the fiber bundles. After being oxidized, the defects near the surface were sealed with an increase in oxidation time (shown in
Figure 12d,f,h). It can be observed from the area indicated by the orange arrow in
Figure 12f that the defect pore directly connected to the outside was completely filled with oxide.
3.3. Mechanical Properties of Different Kinds of SiC/SiC
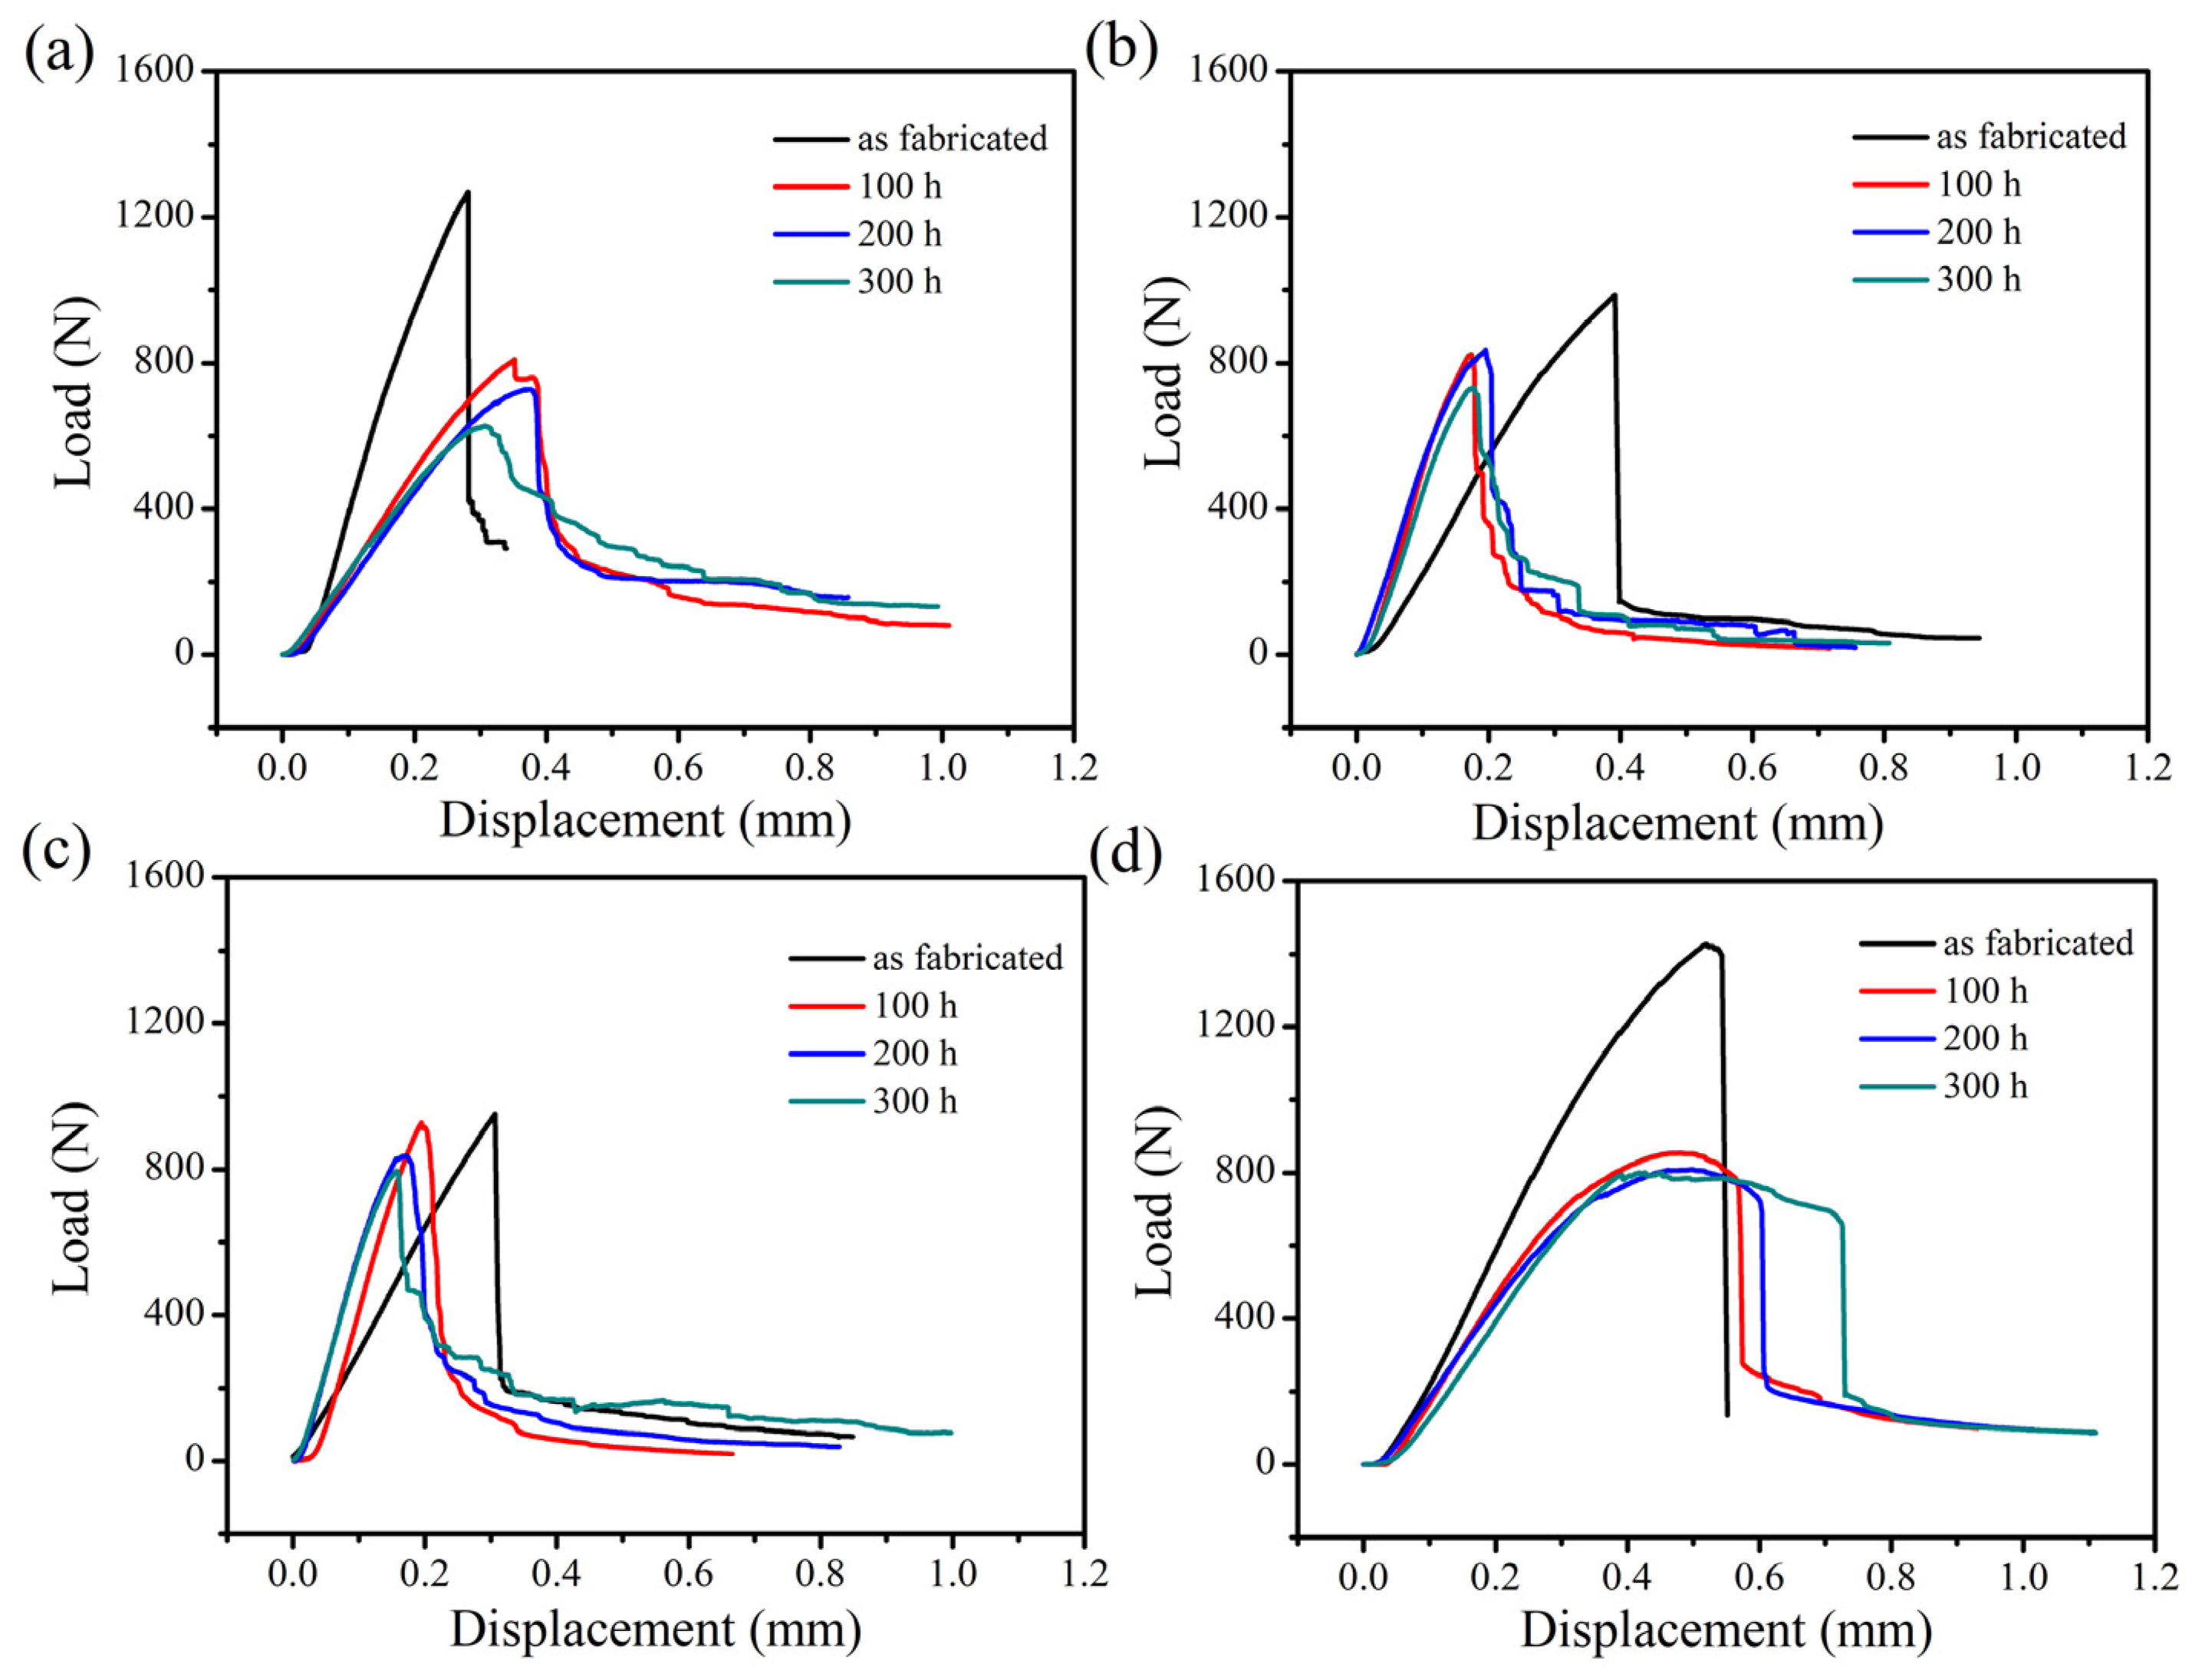
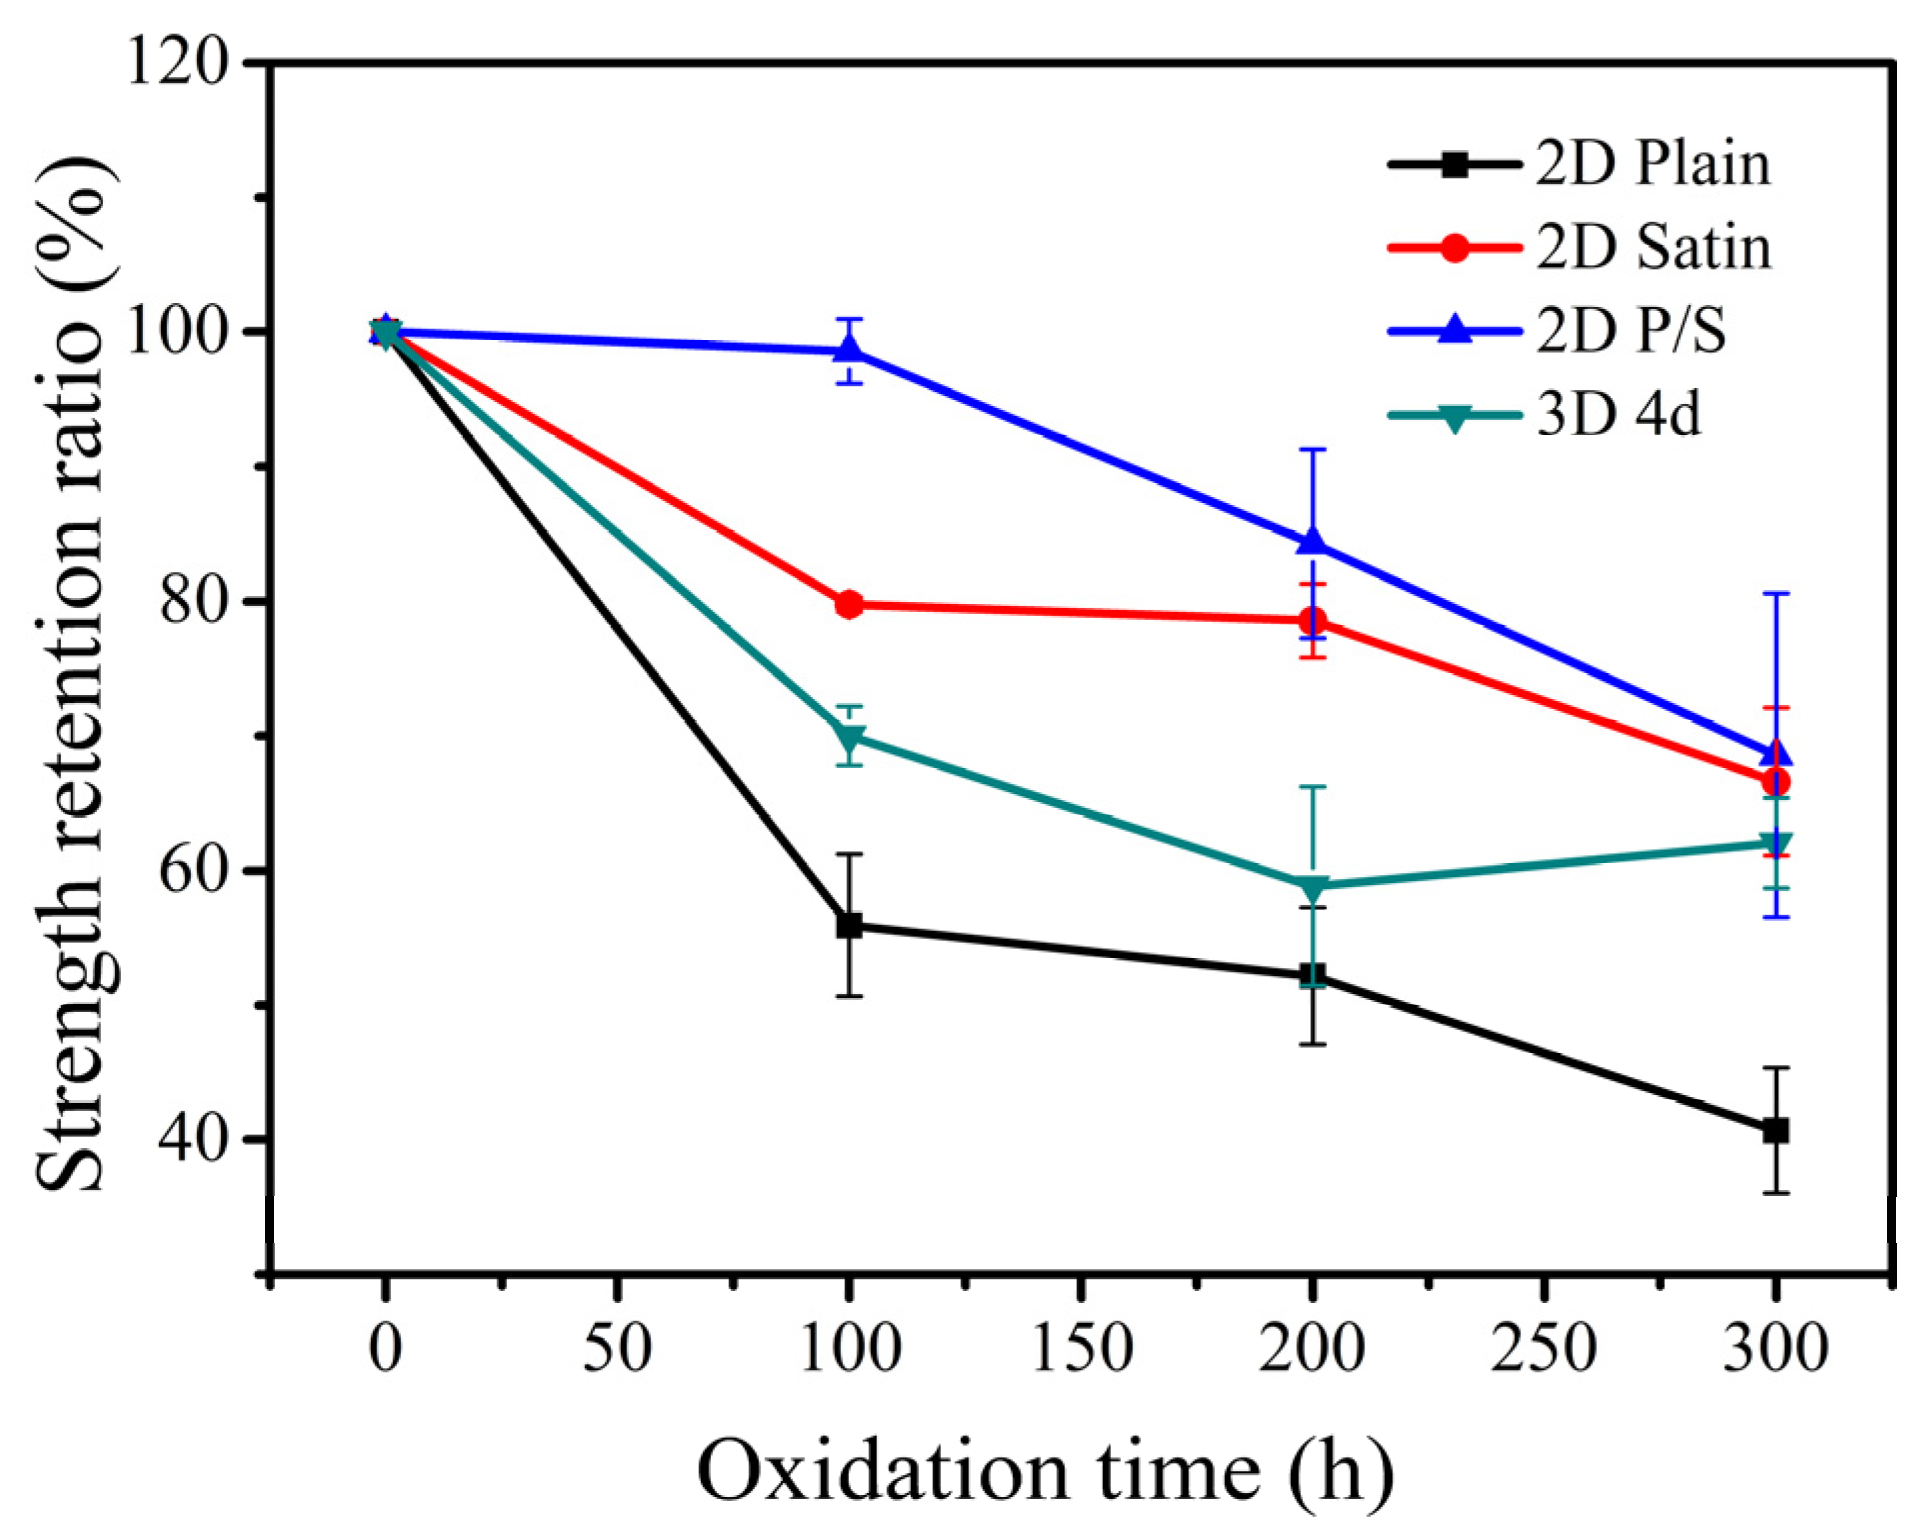
The three-point bending load-displacement curves of the four kinds of SiC/SiC composites at room temperature and the strength retention of the composites are exhibited in
Figure 13 and
Figure 14, respectively. According to the analysis of the graph, the fracture strength of the unoxidized composite was the highest and the flexural strength of the 2D plain, 2D satin and 3D 4d SiC/SiC showed a significant decrease when the materials were oxidized for 100 h. This effect demonstrated that the composites were seriously damaged under the enforcement of wet oxidation. Among them, the decrease of the bending strength of the 2D plain composite was the largest, which can be explained as follows: 1. The generated oxide accumulated at 0/90° fiber bundles braided holes due to the mismatch of the CTE (between the oxide and the composite), which could result in the formation of microcracks; 2. During the application of the three-point bending test, the microcracks would further expand, which ultimately led to a decline in the material bending strength. The 2D P/S composite still had a strength retention rate of about 98.57% after being oxidized for 100 h, illustrating that this structure, oxidized for 100 h, still maintained good mechanical properties. Interestingly, during the subsequent 200 h and 300 h stages of the oxidation, the four kinds of the composites did not show any significant decrease in flexural strength.
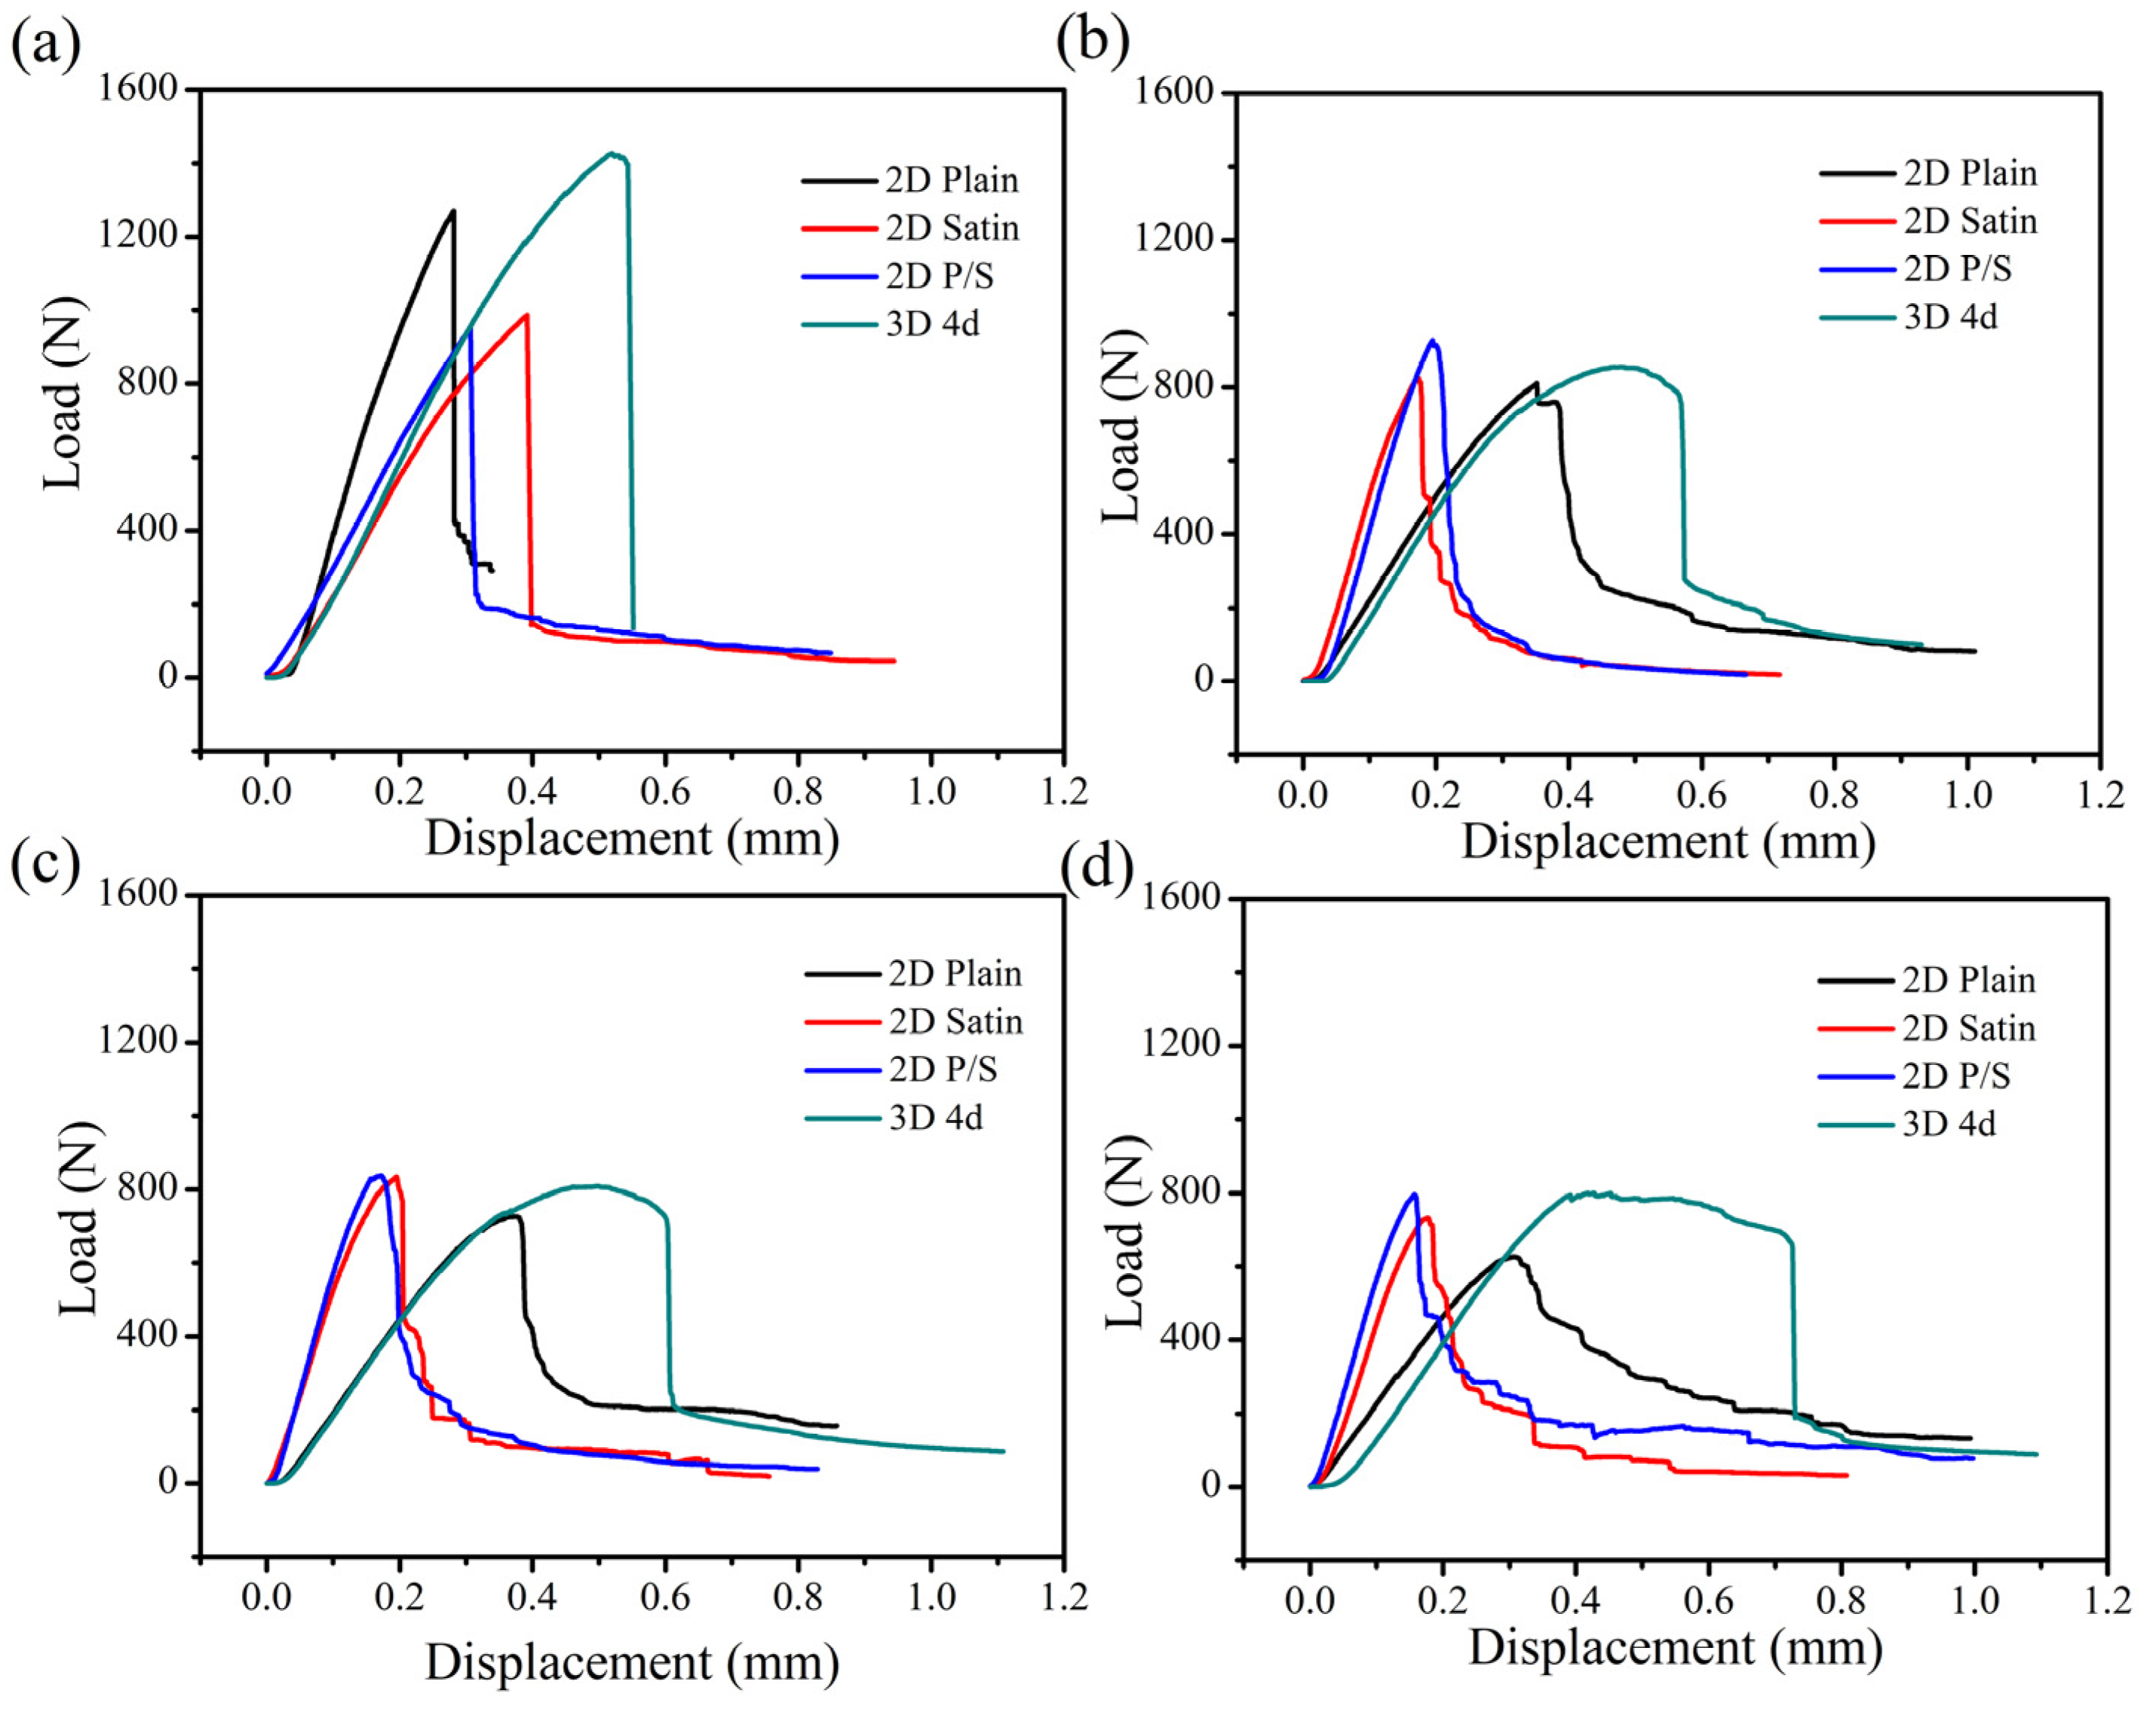
The comparison of the load-displacement curves of the four kinds of SiC/SiC composites with time is shown in
Figure 15. A similar trend regarding the typical load-displacement curves of the composites can be found.
Figure 15a represents the load-displacement curve of the as-fabricated composite material, suggesting that the mechanical strength of the composites decreased according to the following order: 3D 4d, 2D plain, 2D satin and 2D P/S composite. This signifies that the original 3D 4d SiC/SiC had the greatest flexural strength. Moreover, the four kinds of composites divulged a sharp drop in flexural strength after being oxidized for 100 h at 1400 °C, as can be seen from
Figure 15b. Among them, although the flexural strength of the 3D 4d material was still the largest, the strength decreased by 80% compared with the as-fabricated samples. Interestingly, the oxidized 2D plain, 2D satin and 2D P/S composites reached the maximum breaking load, while the magnitude of the load drop decreased slowly (as is shown in
Figure 15b–d). Furthermore, the changes of the 2D satin and P/S composites were closer, as can be observed. The oxidized 3D 4d composite also presented a sharp drop of 25–35% after reaching the maximum bending load, indicating that the proposed three-dimensional material retained some of the characteristics of the structure.
The distribution and oxidation of the braided holes, the pull-out and oxidation of fibers, and the cracks propagation can be observed in
Figure 16,
Figure 17,
Figure 18 and
Figure 19, where the fracture morphologies of the four composite materials, under the application of 12 kPa H
2O:8 kPa O
2:80 kPa Ar atmosphere, at 1400 °C, are presented.
Figure 16 displays the fracture morphology of the 2D plain SiC/SiC composite and the fracture morphology of the 2D plain weave composite material. Comparing the marked orange area in
Figure 16, it can be clearly seen that the bond strength between the fiber cloth layers of the oxidized composite decreased. After being oxidized for 300 h (as shown in
Figure 16d), the sample exhibited obvious penetrating cracks. Moreover, combined with the cross-sectional morphology of
Figure 9, it is illustrated that the cracks generated during the oxidation process further propagated during the three-point bending test by transferring the inter-layers. The overall pull-out of fibers in the composite material were observed, and it was found that the pull-out length of fiber bundles gradually increased with the increase in oxidation time.
The fracture morphology of the 2D satin SiC/SiC composite is shown in
Figure 17. In
Figure 17b, oxides were formed at the braided pores between the fiber bundles, and only the single-filament fibers were pulled out. The overall fracture morphology was neater than that of the original sample shown in
Figure 17a, indicating that oxidation played a role in strengthening the matrix, making the interlayer bonding strength stronger. When the sample was oxidized for 200 h (as shown in
Figure 17c), the length of fiber pull-out was longer than that after oxidation for 100 h, and the bonding strength between layers also decreased. Besides, a penetrating crack appeared when the sample was oxidized for 300 h. It can be seen that the large crack at this time could be caused by the crack propagation during the three-point bending test combined with the cross-sectional morphology in
Figure 10.
Figure 18 shows the 2D P/S SiC/SiC composite. It can be seen from
Figure 18b that the defect holes were filled with oxides, and the plain layer and satin layer can be observed in the fracture morphology. When the sample was oxidized for 200 h (as shown in
Figure 18c), a large area of obvious oxides could be found around the puncture fiber bundle, indicating that the presence of puncture fibers in the sample affected the oxidation behavior of the material. When the oxidation progressed to 300 h, it can be seen from the cross-sectional morphology, shown in
Figure 11, that the cracks generated during the oxidation process were further transmitted along the layers under the action of the applied load.
As can be seen from
Figure 19a, the defects existed at the angles between the fiber bundles. As the oxidation progressed, the oxides sealed the defects and the pull-out length of the fiber bundle gradually became longer with time (indicated by the orange area in
Figure 19), which indicated that the damage at the interface increased, resulting in weakening of the bonding strength between the matrix and the fiber. In addition, it can also be found that the structural characteristics of the 3D 4d composites before and after oxidation were still obvious.
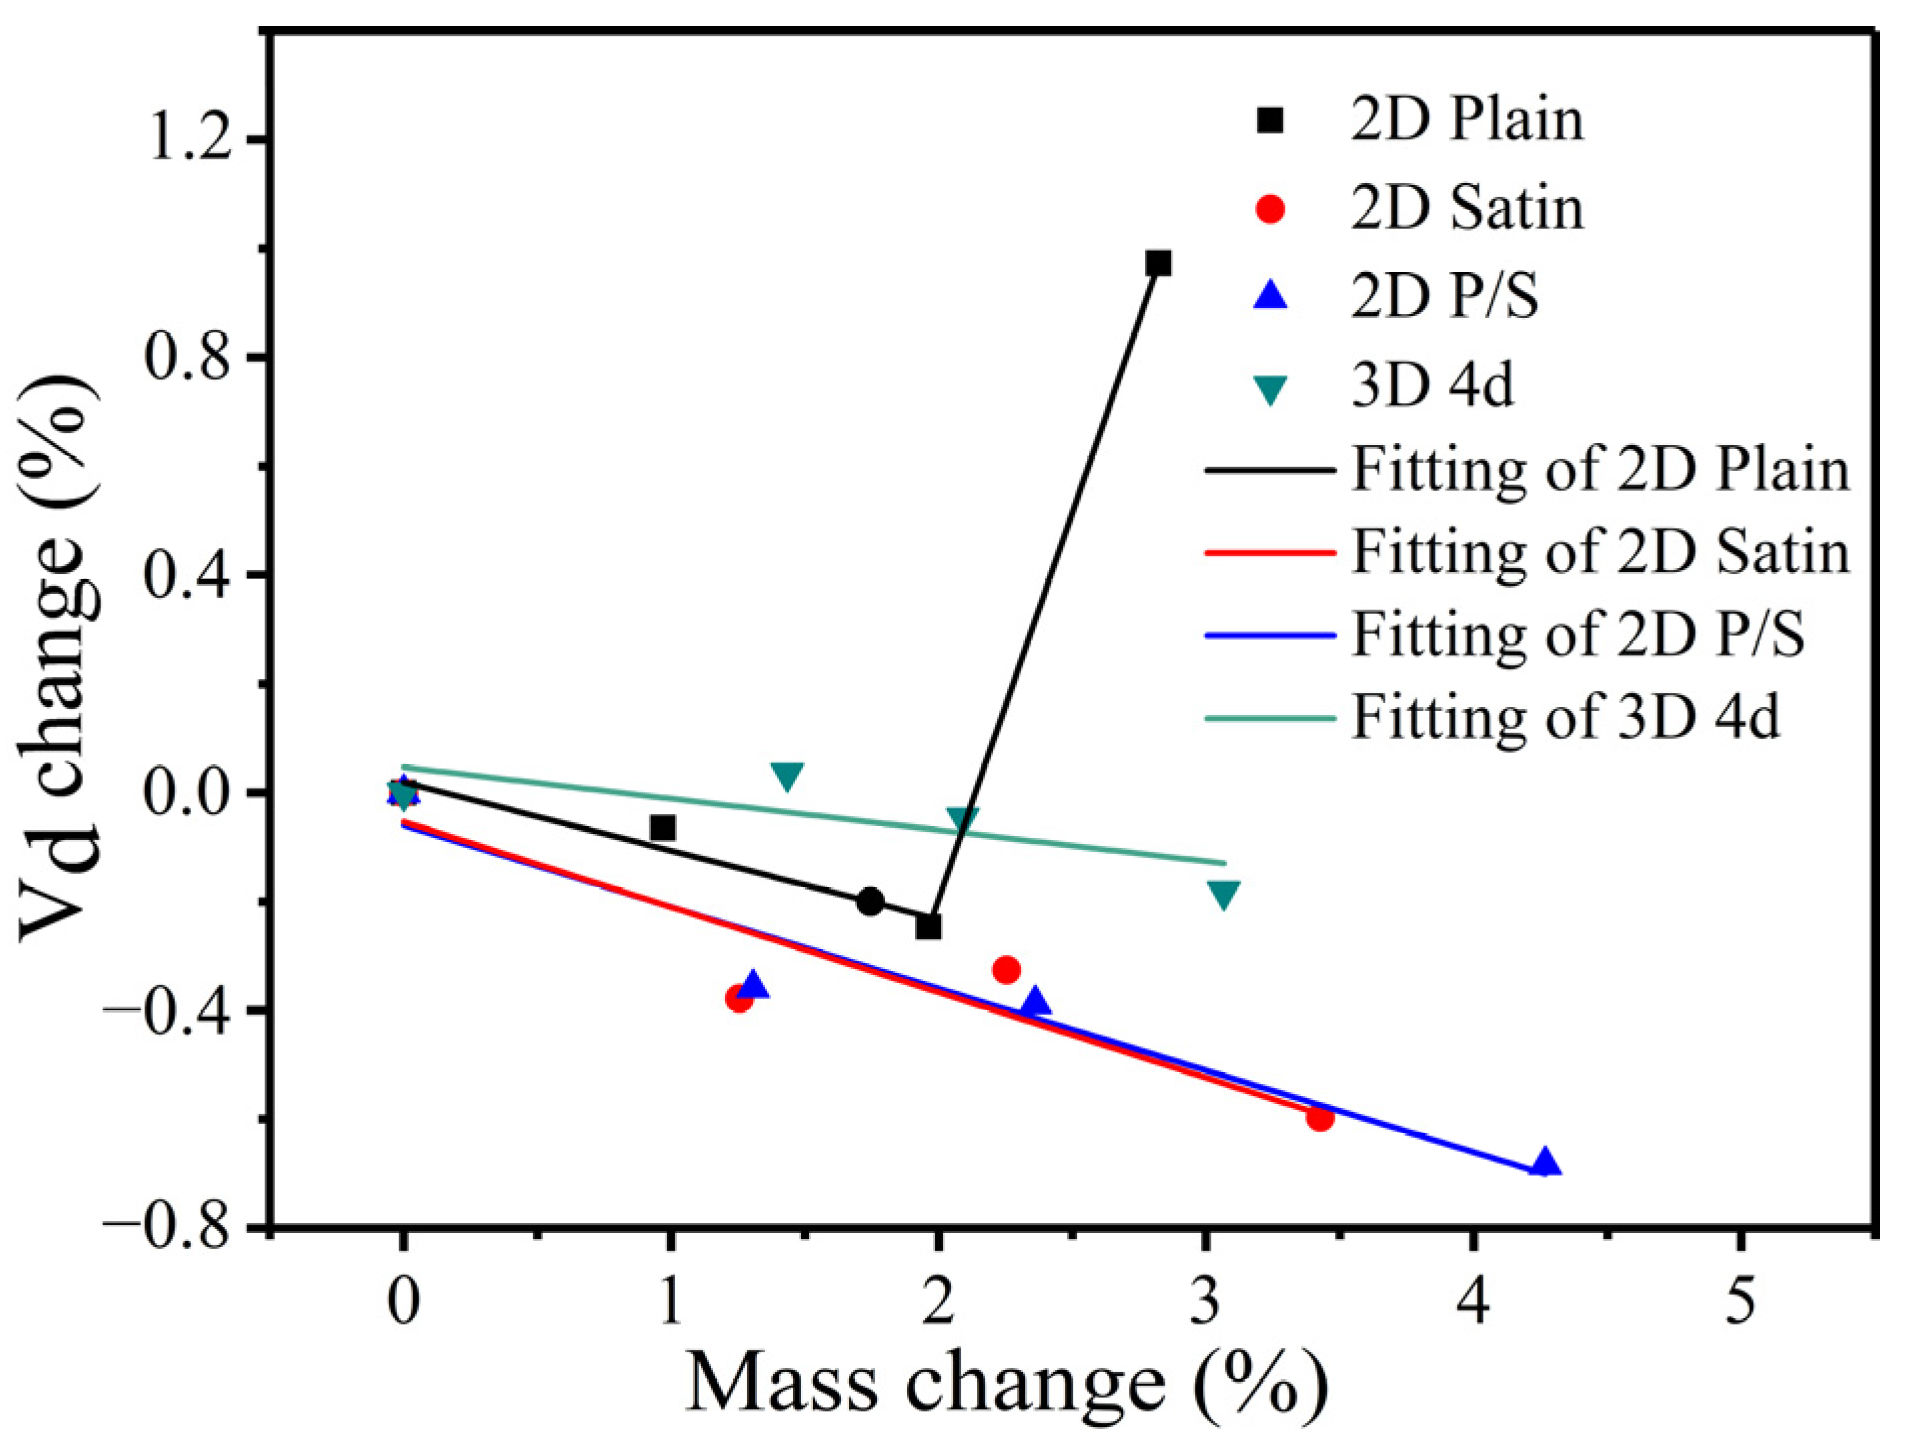
3.5. Function between the Defect Volume Change Rate and Mass Change Rate
The fitting function relationship between the change rate of the internal defect volume fraction and the mass change rate of the four kinds of composites is displayed in
Figure 20. As can be ascertained, only the 2D plain composite had increased after being oxidized for 200 h. This effect is mainly ascribed to the 2D plain SiC/SiC composite having more oxidation products formed at the weaving holes of the fiber bundles in the late oxidation stage. In addition, the CTE mismatch issue between the oxides and composites arose, which led to the manifestation of an obvious delamination effect between the layers. Hence, the defect volume fraction increased significantly when the μ-CT scanning was performed. Under this direction, the functional relations constructed by the four kinds of composite materials are described as follows.
In the above-mentioned function, Di (i =1, 2, 3, 4) corresponds to the change rate of the defect volume fraction of the four different kinds of composites, and t = 100, 200, 300 (h), represent the different oxidation times.
By observing the functions of the four kinds of composites, it can be found that the slopes of the straight lines of the 2D satin and the 2D P/S composites are similar and followed by the 2D plain and 3D 4d composites (decreasing in order). This effect indicates that the defect volume change rate of the 2D satin and 2D P/S composites changed fast as the mass change rate became bigger. The above four formulas are recorded as D = AW + B (A and B are both constants), which can be further simplified as m = m0 + p × m0, p = . It can also be acquired, from the simplified expression, that if the initial mass of the composite material is known, the weight of the sample after performing oxidation for different times can be calculated. Finally, it is proved that the proposed method is feasible, and the calculated results are close to the experimental data.


