
Characterization and Performance Evaluation of Metakaolin-Based Geopolymer Foams Obtained by Adding Palm Olein as the Foam Stabilizer


Abstract
:1. Introduction
2. Materials and Methods
2.1. Materials
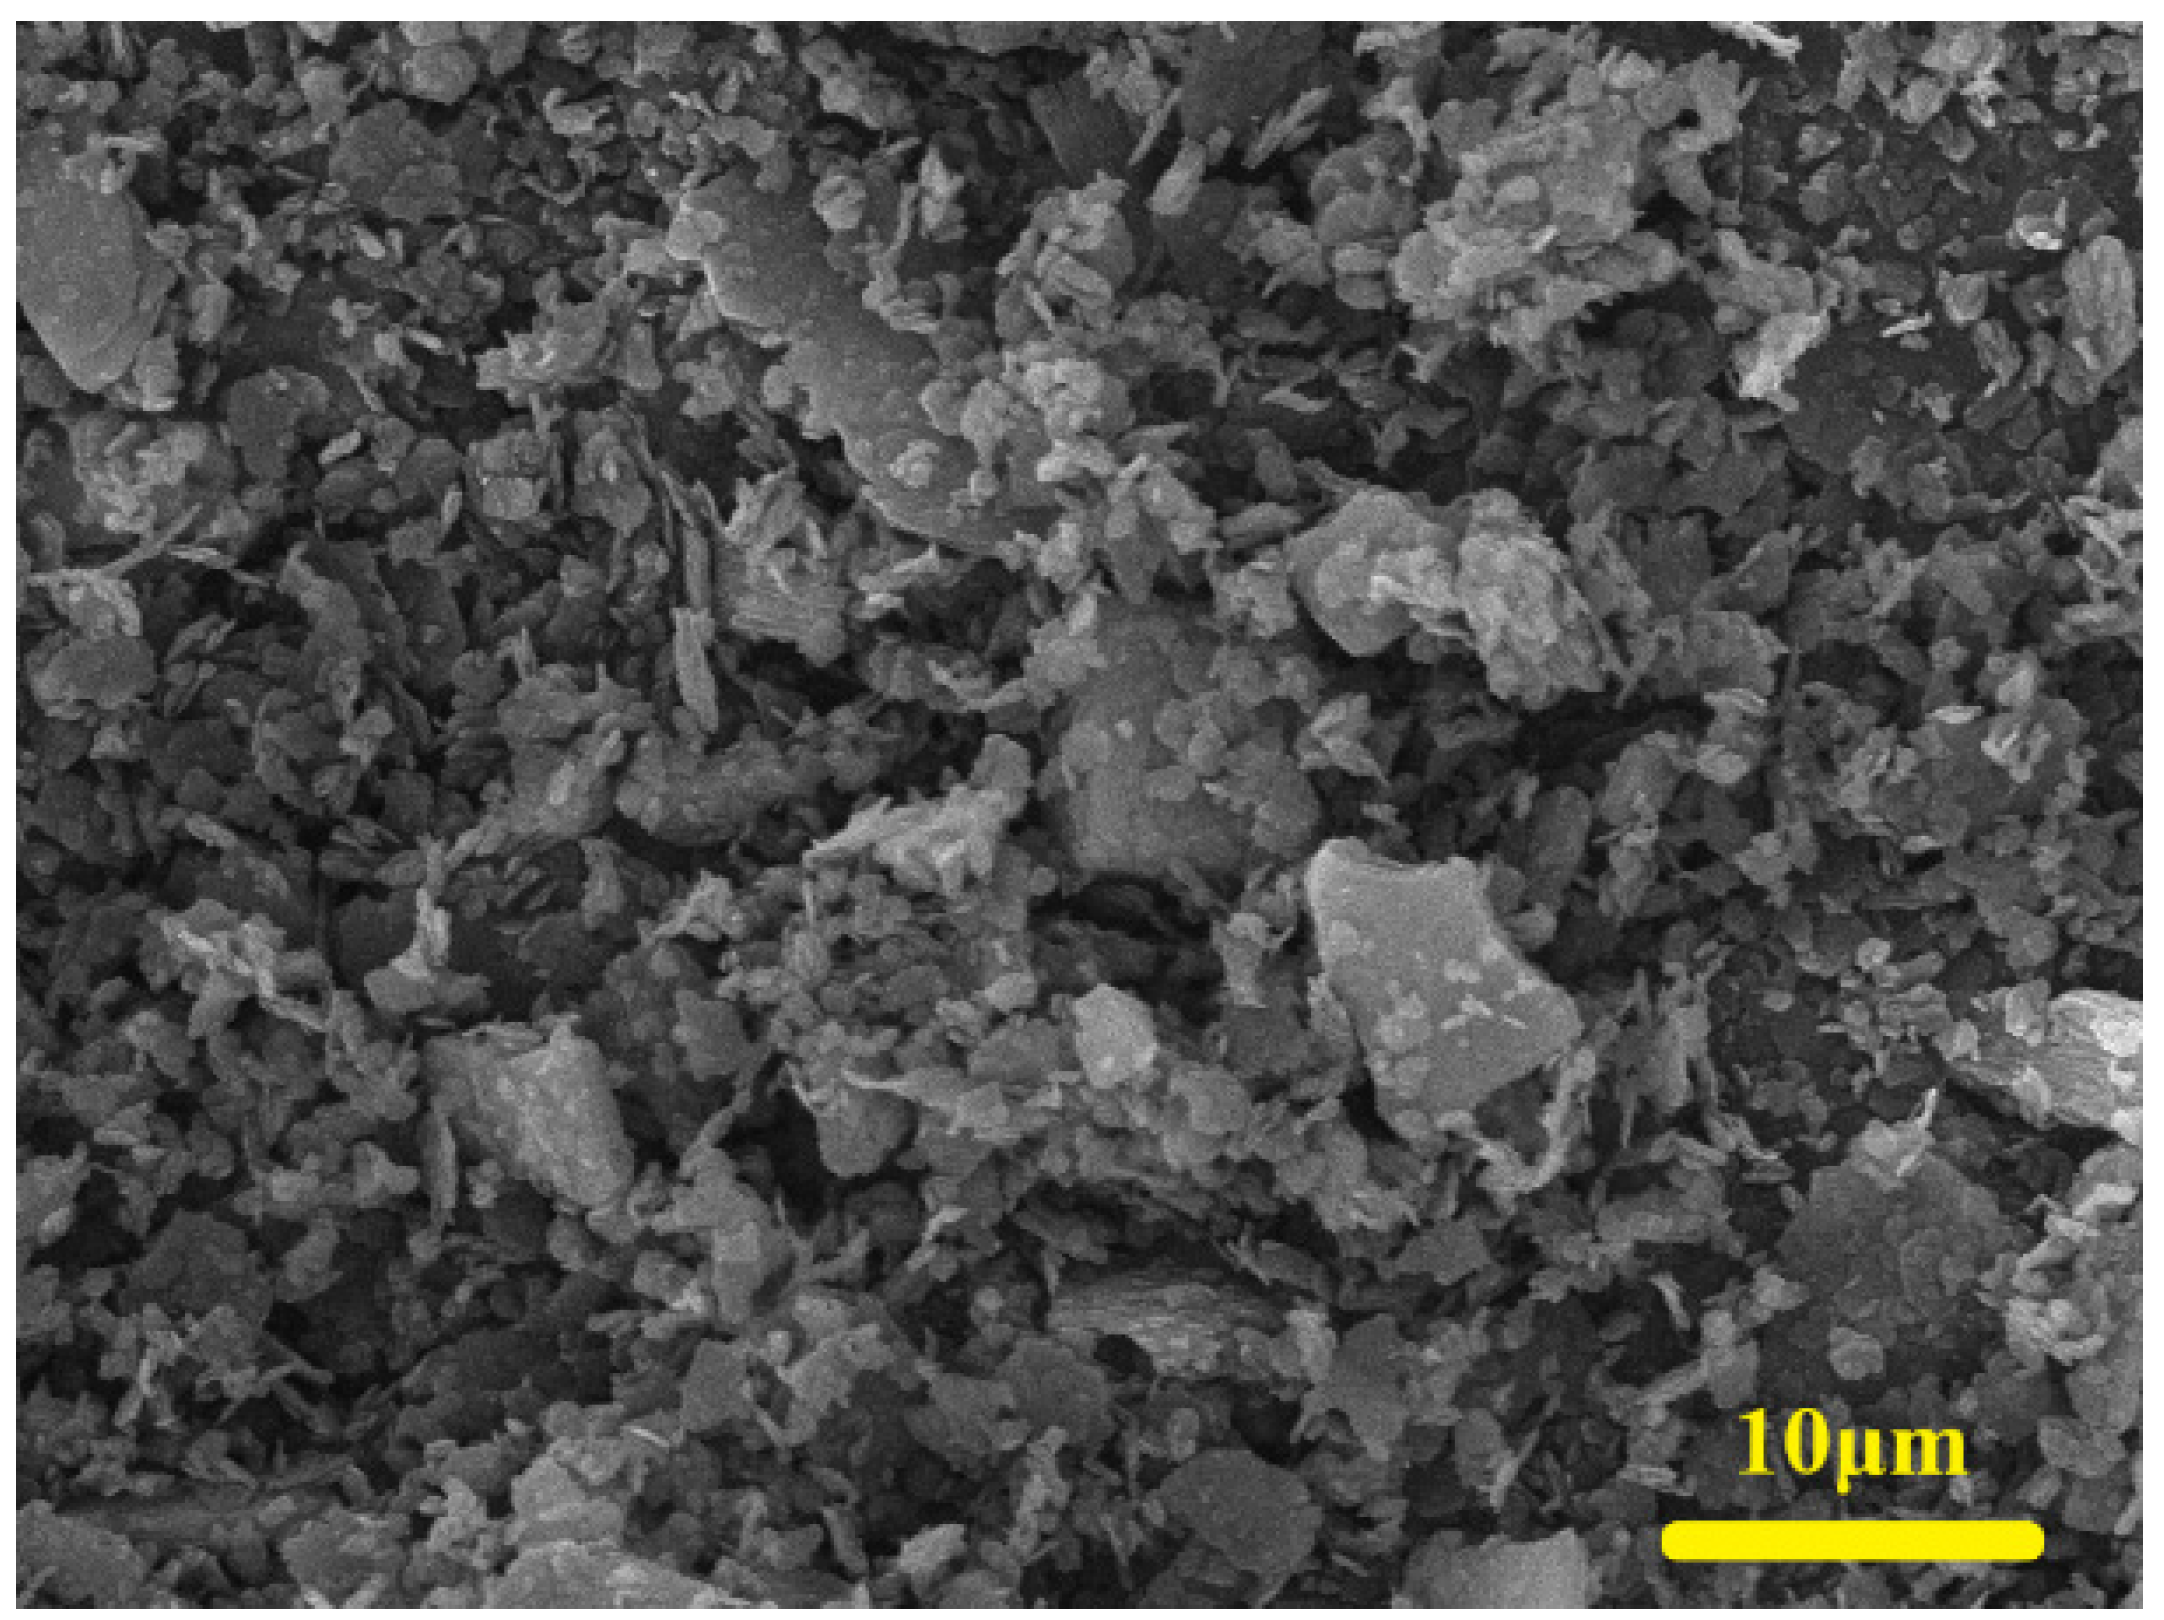
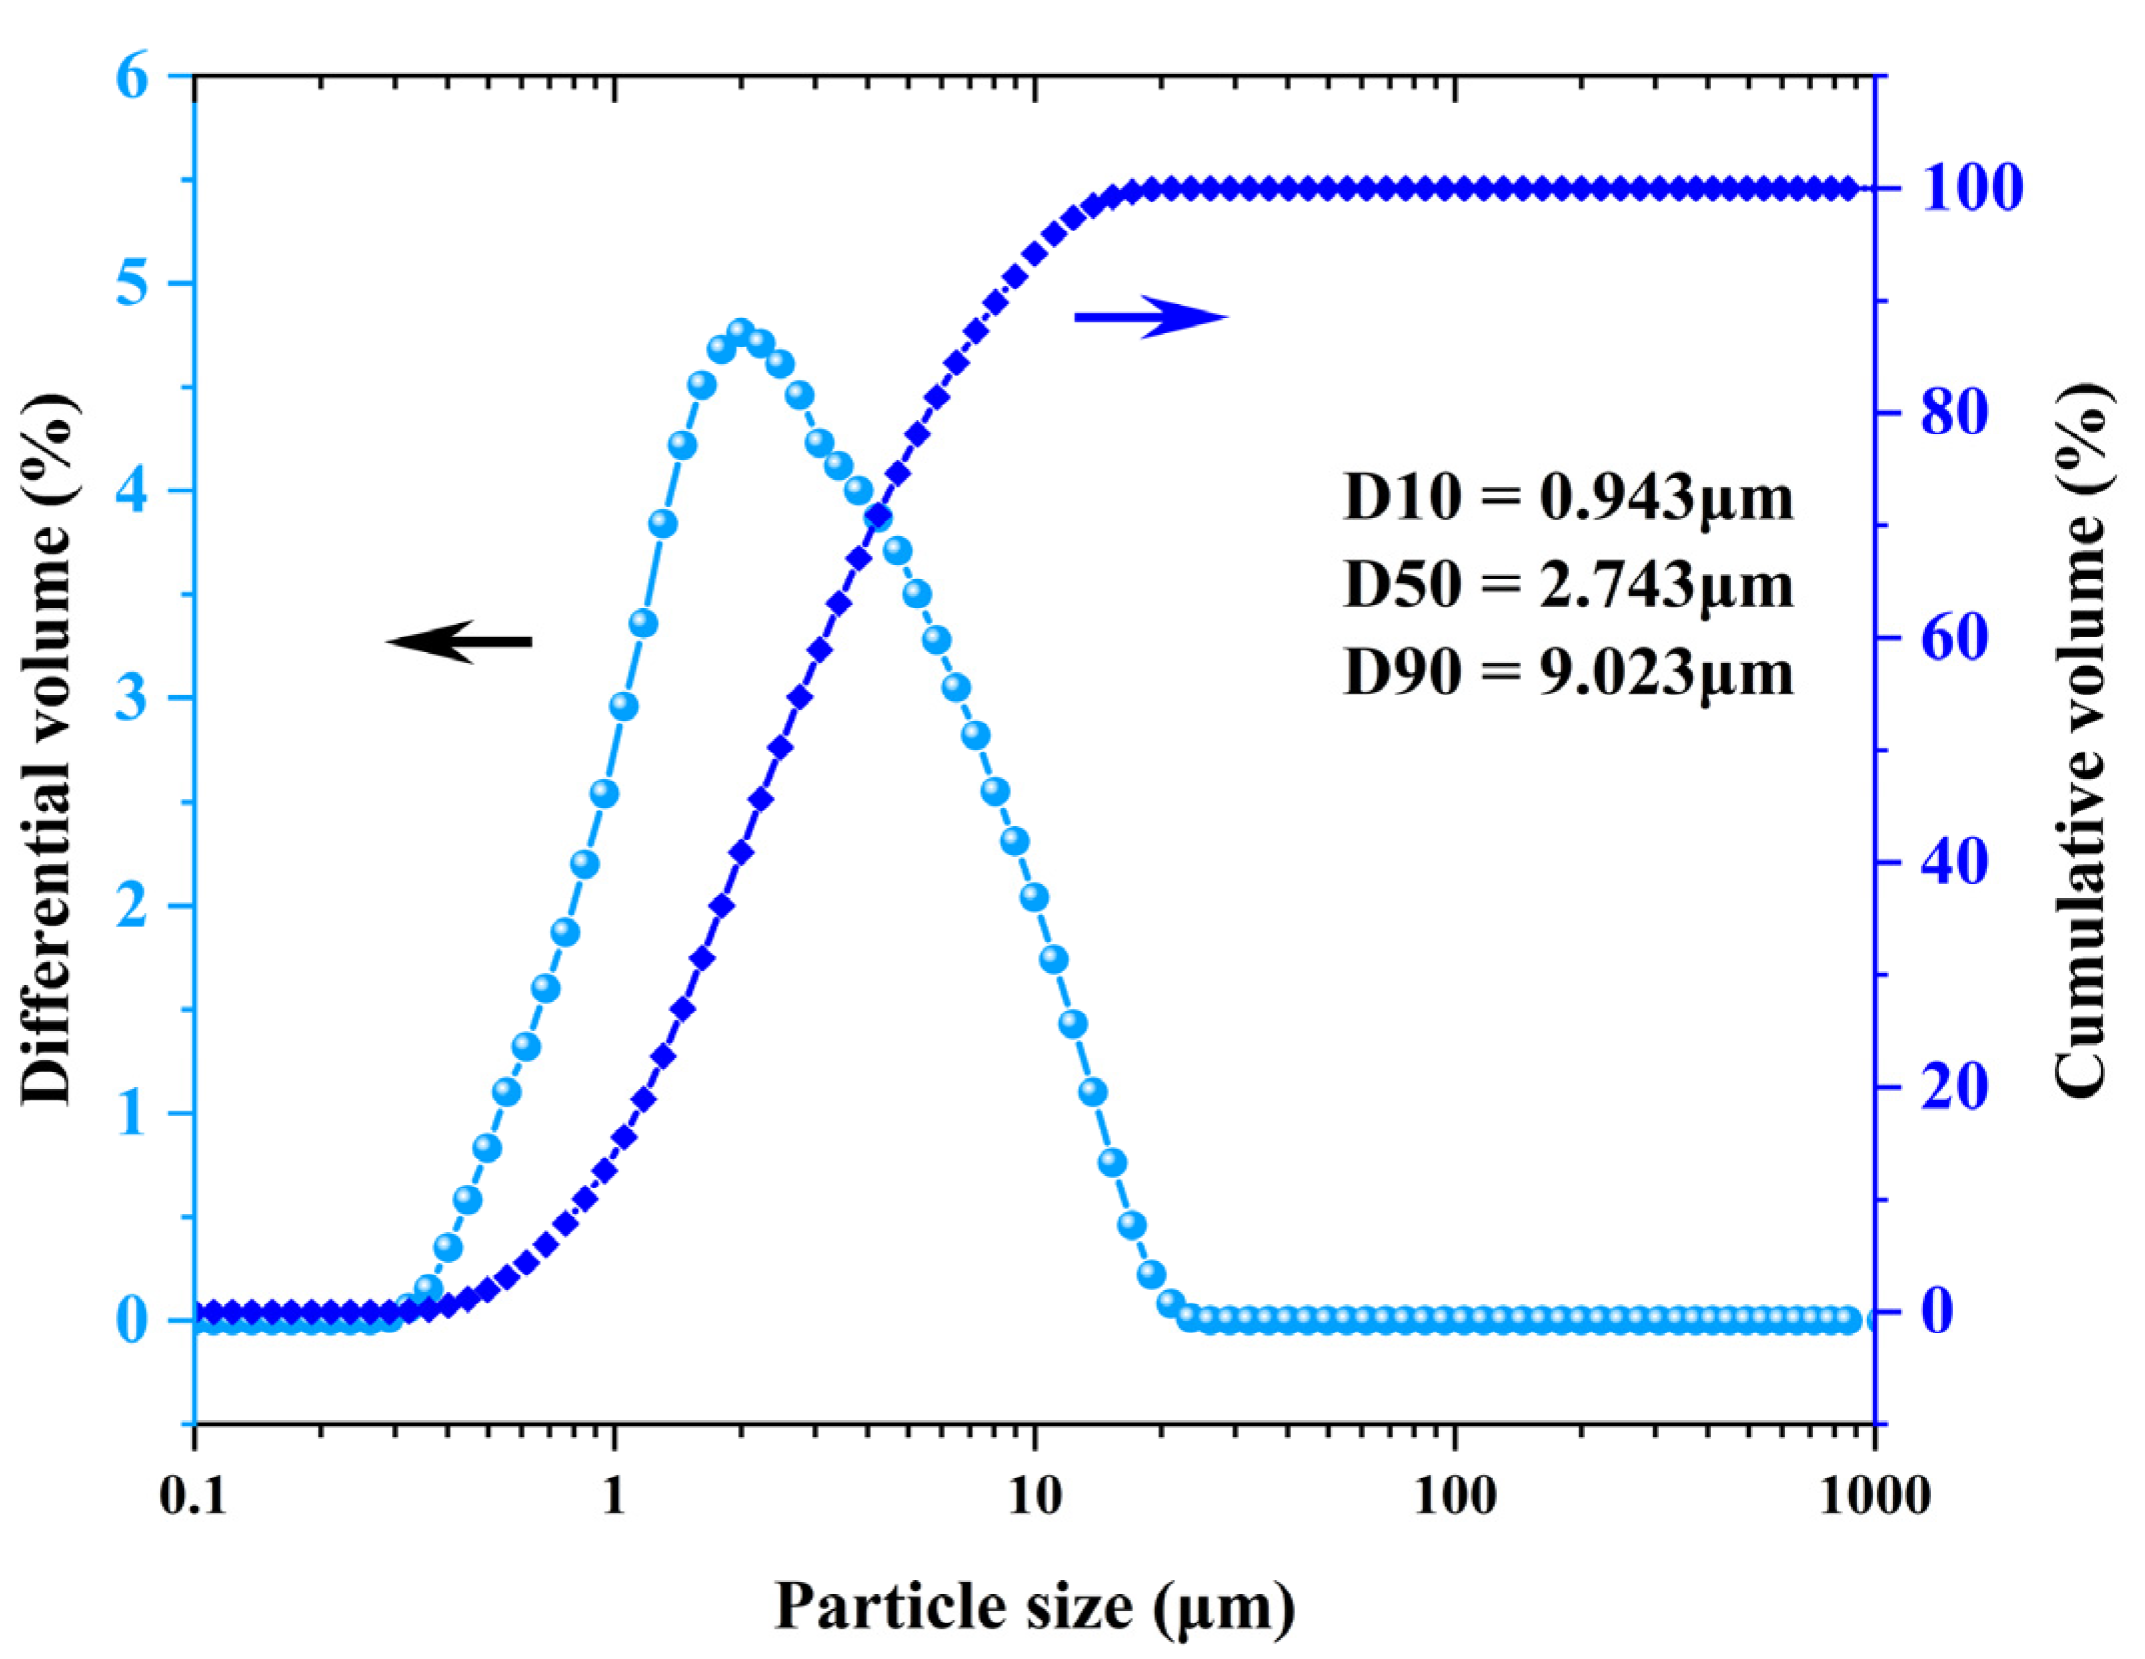
2.1.1. Precursor
2.1.2. Alkali Activator
2.1.3. Foaming Agent
2.1.4. Foam Stabilizer
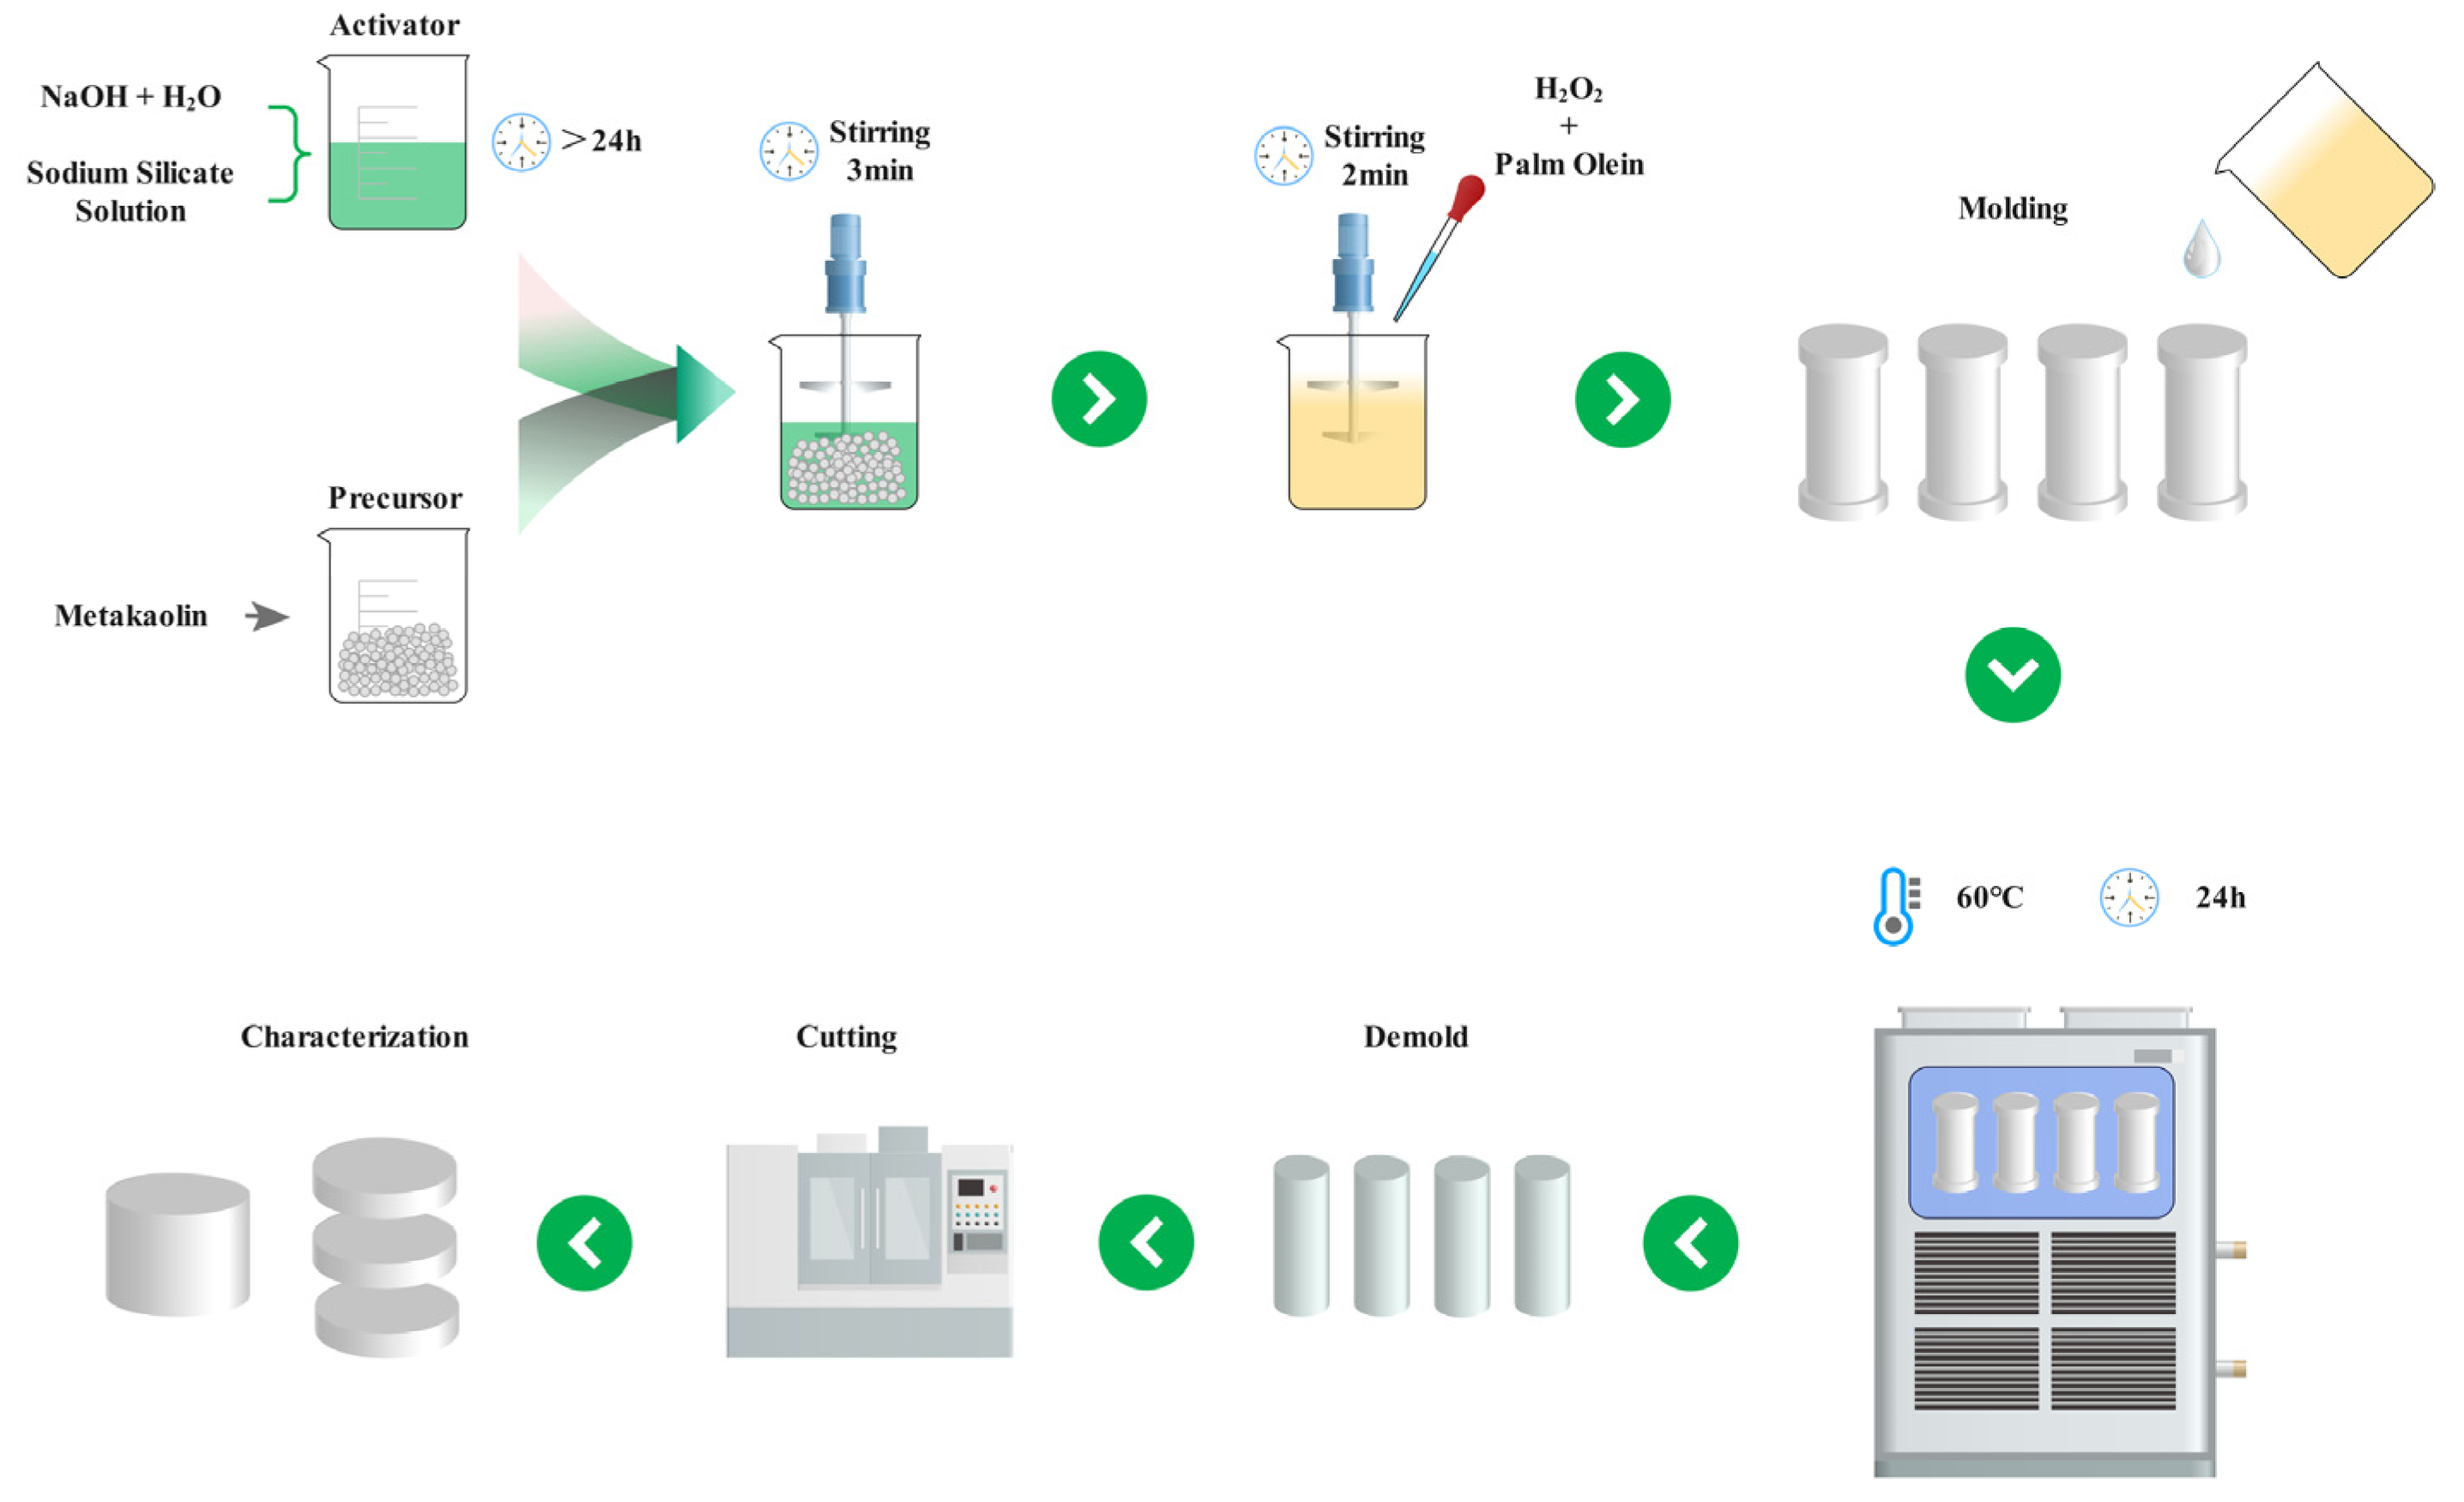
2.2. Fabrication of Geopolymer Foams
2.3. Characterization
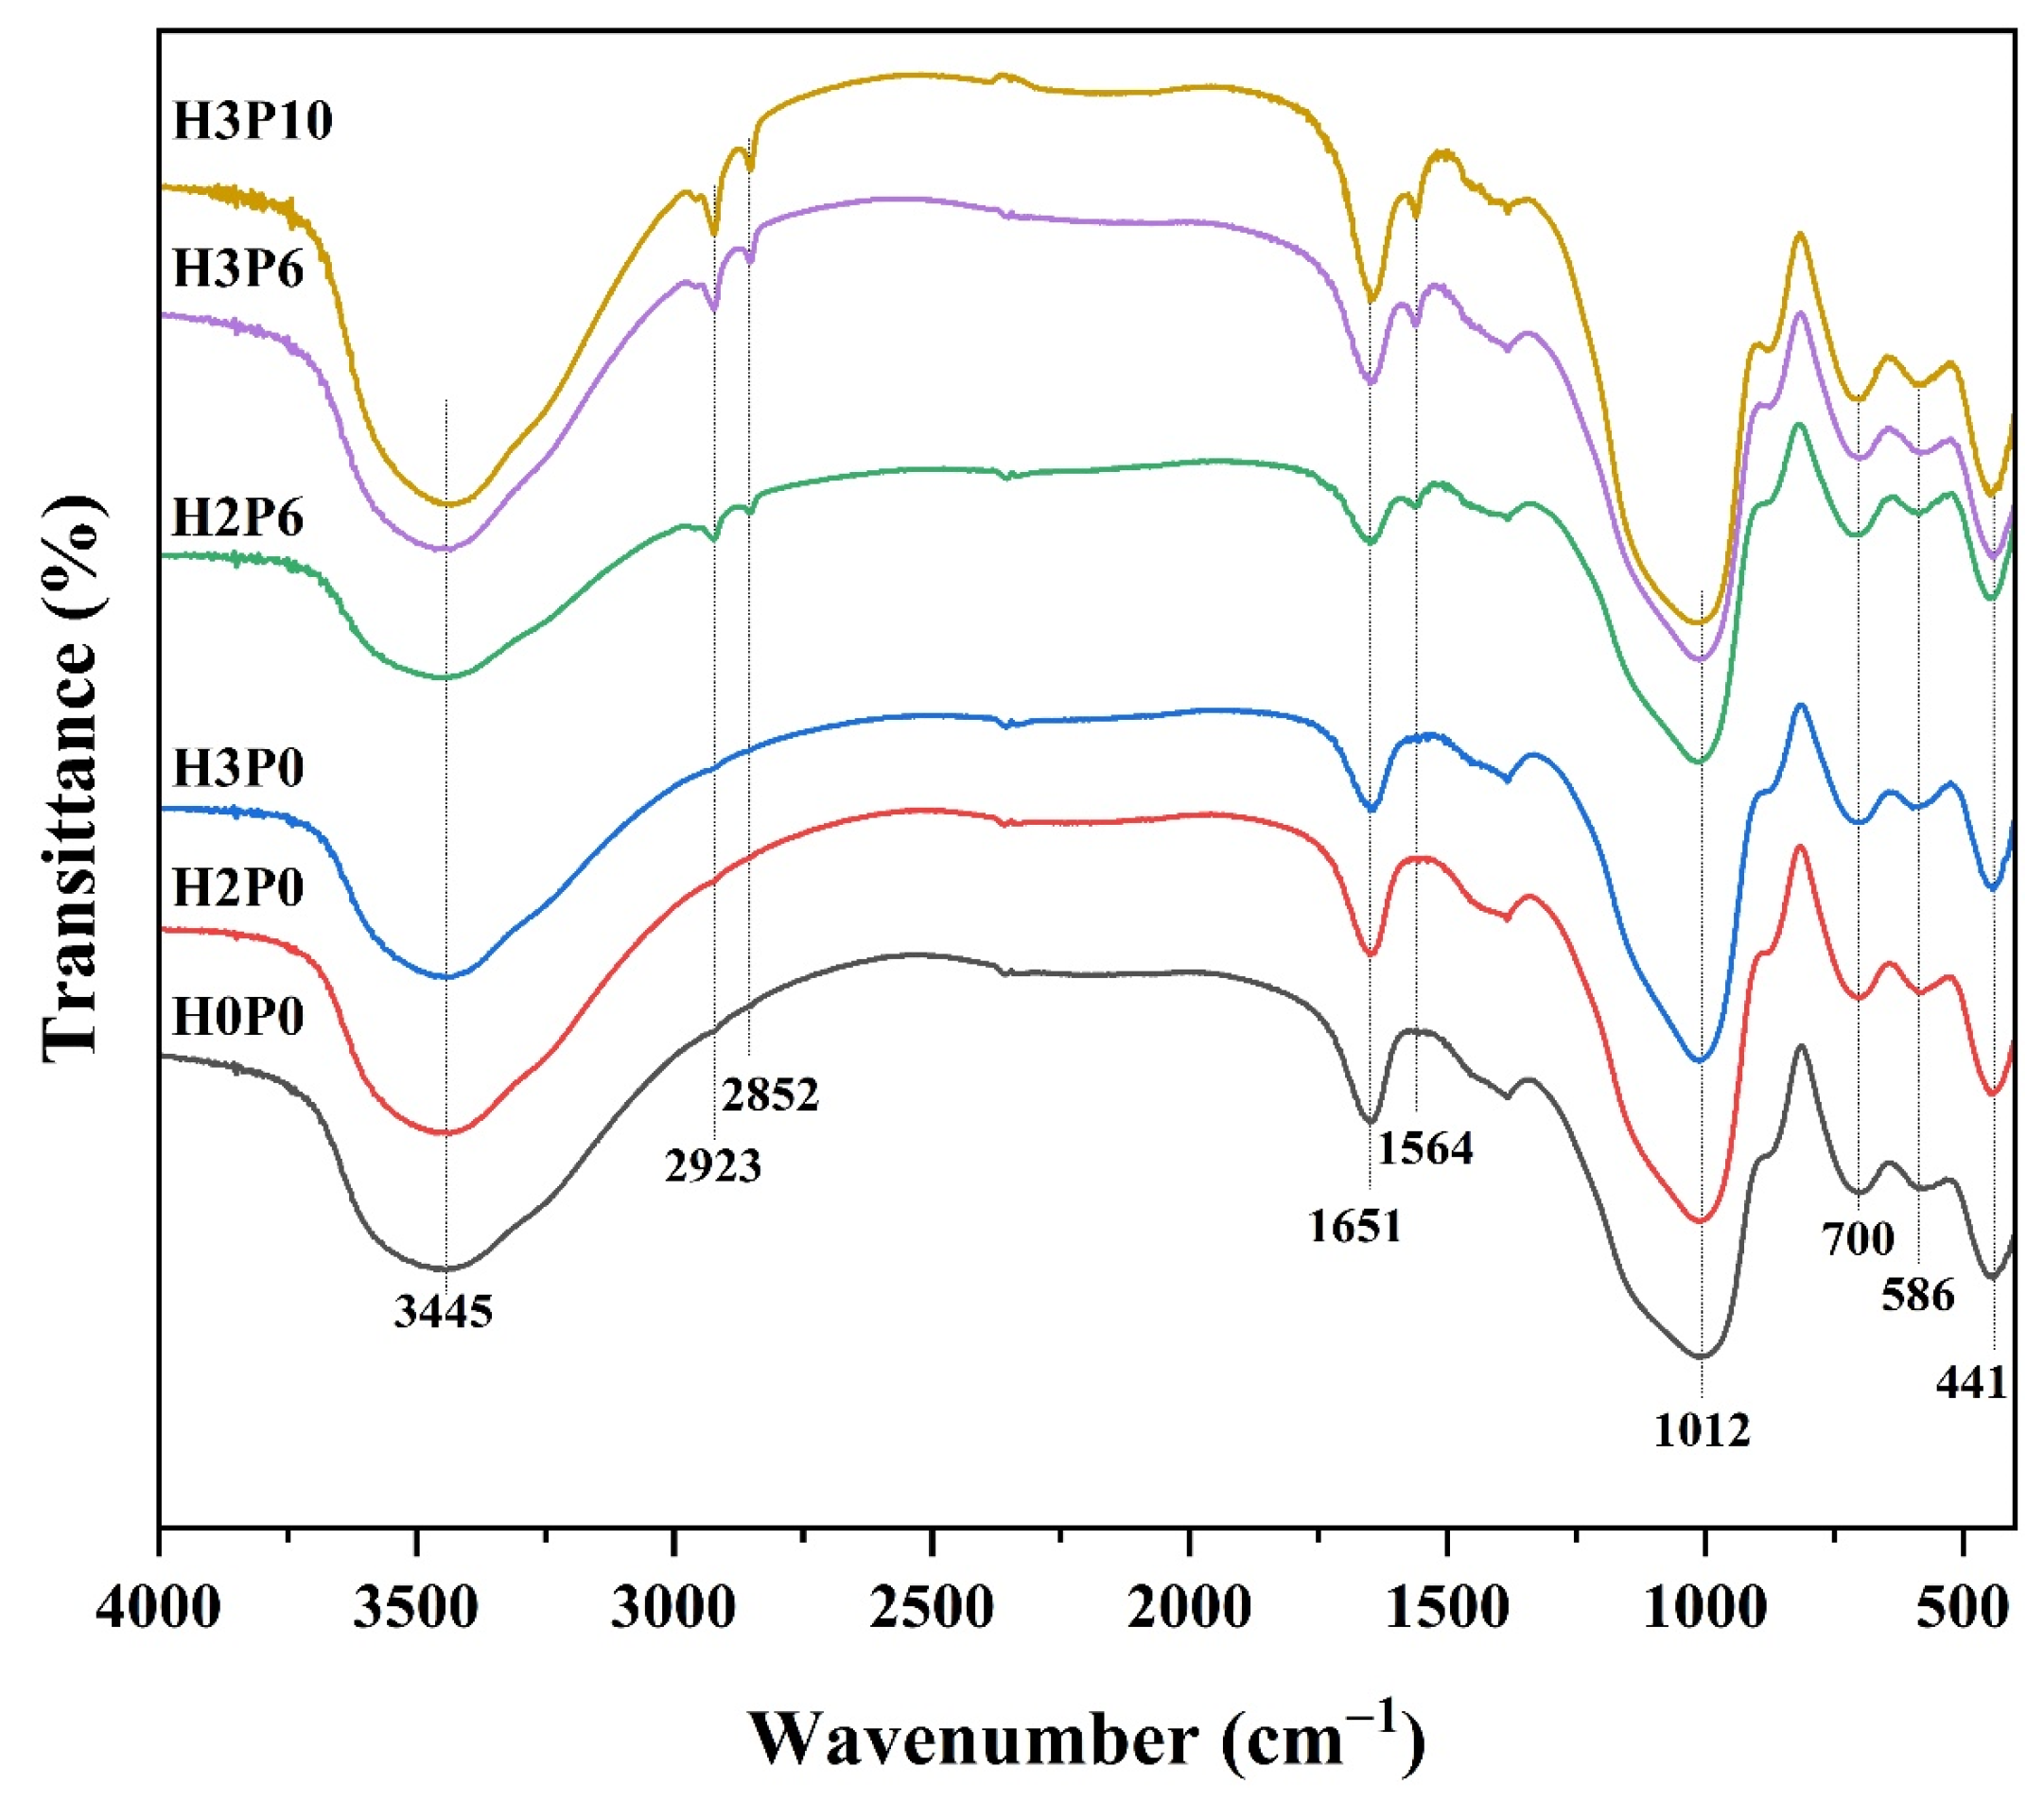
2.3.1. Chemical Features
2.3.2. Morphology
2.3.3. Pore Size Distribution
2.3.4. Porosity
2.3.5. Pore Shape
2.3.6. Water absorption and thermal conductivity
2.3.7. Compressive Strength
3. Results and Discussions
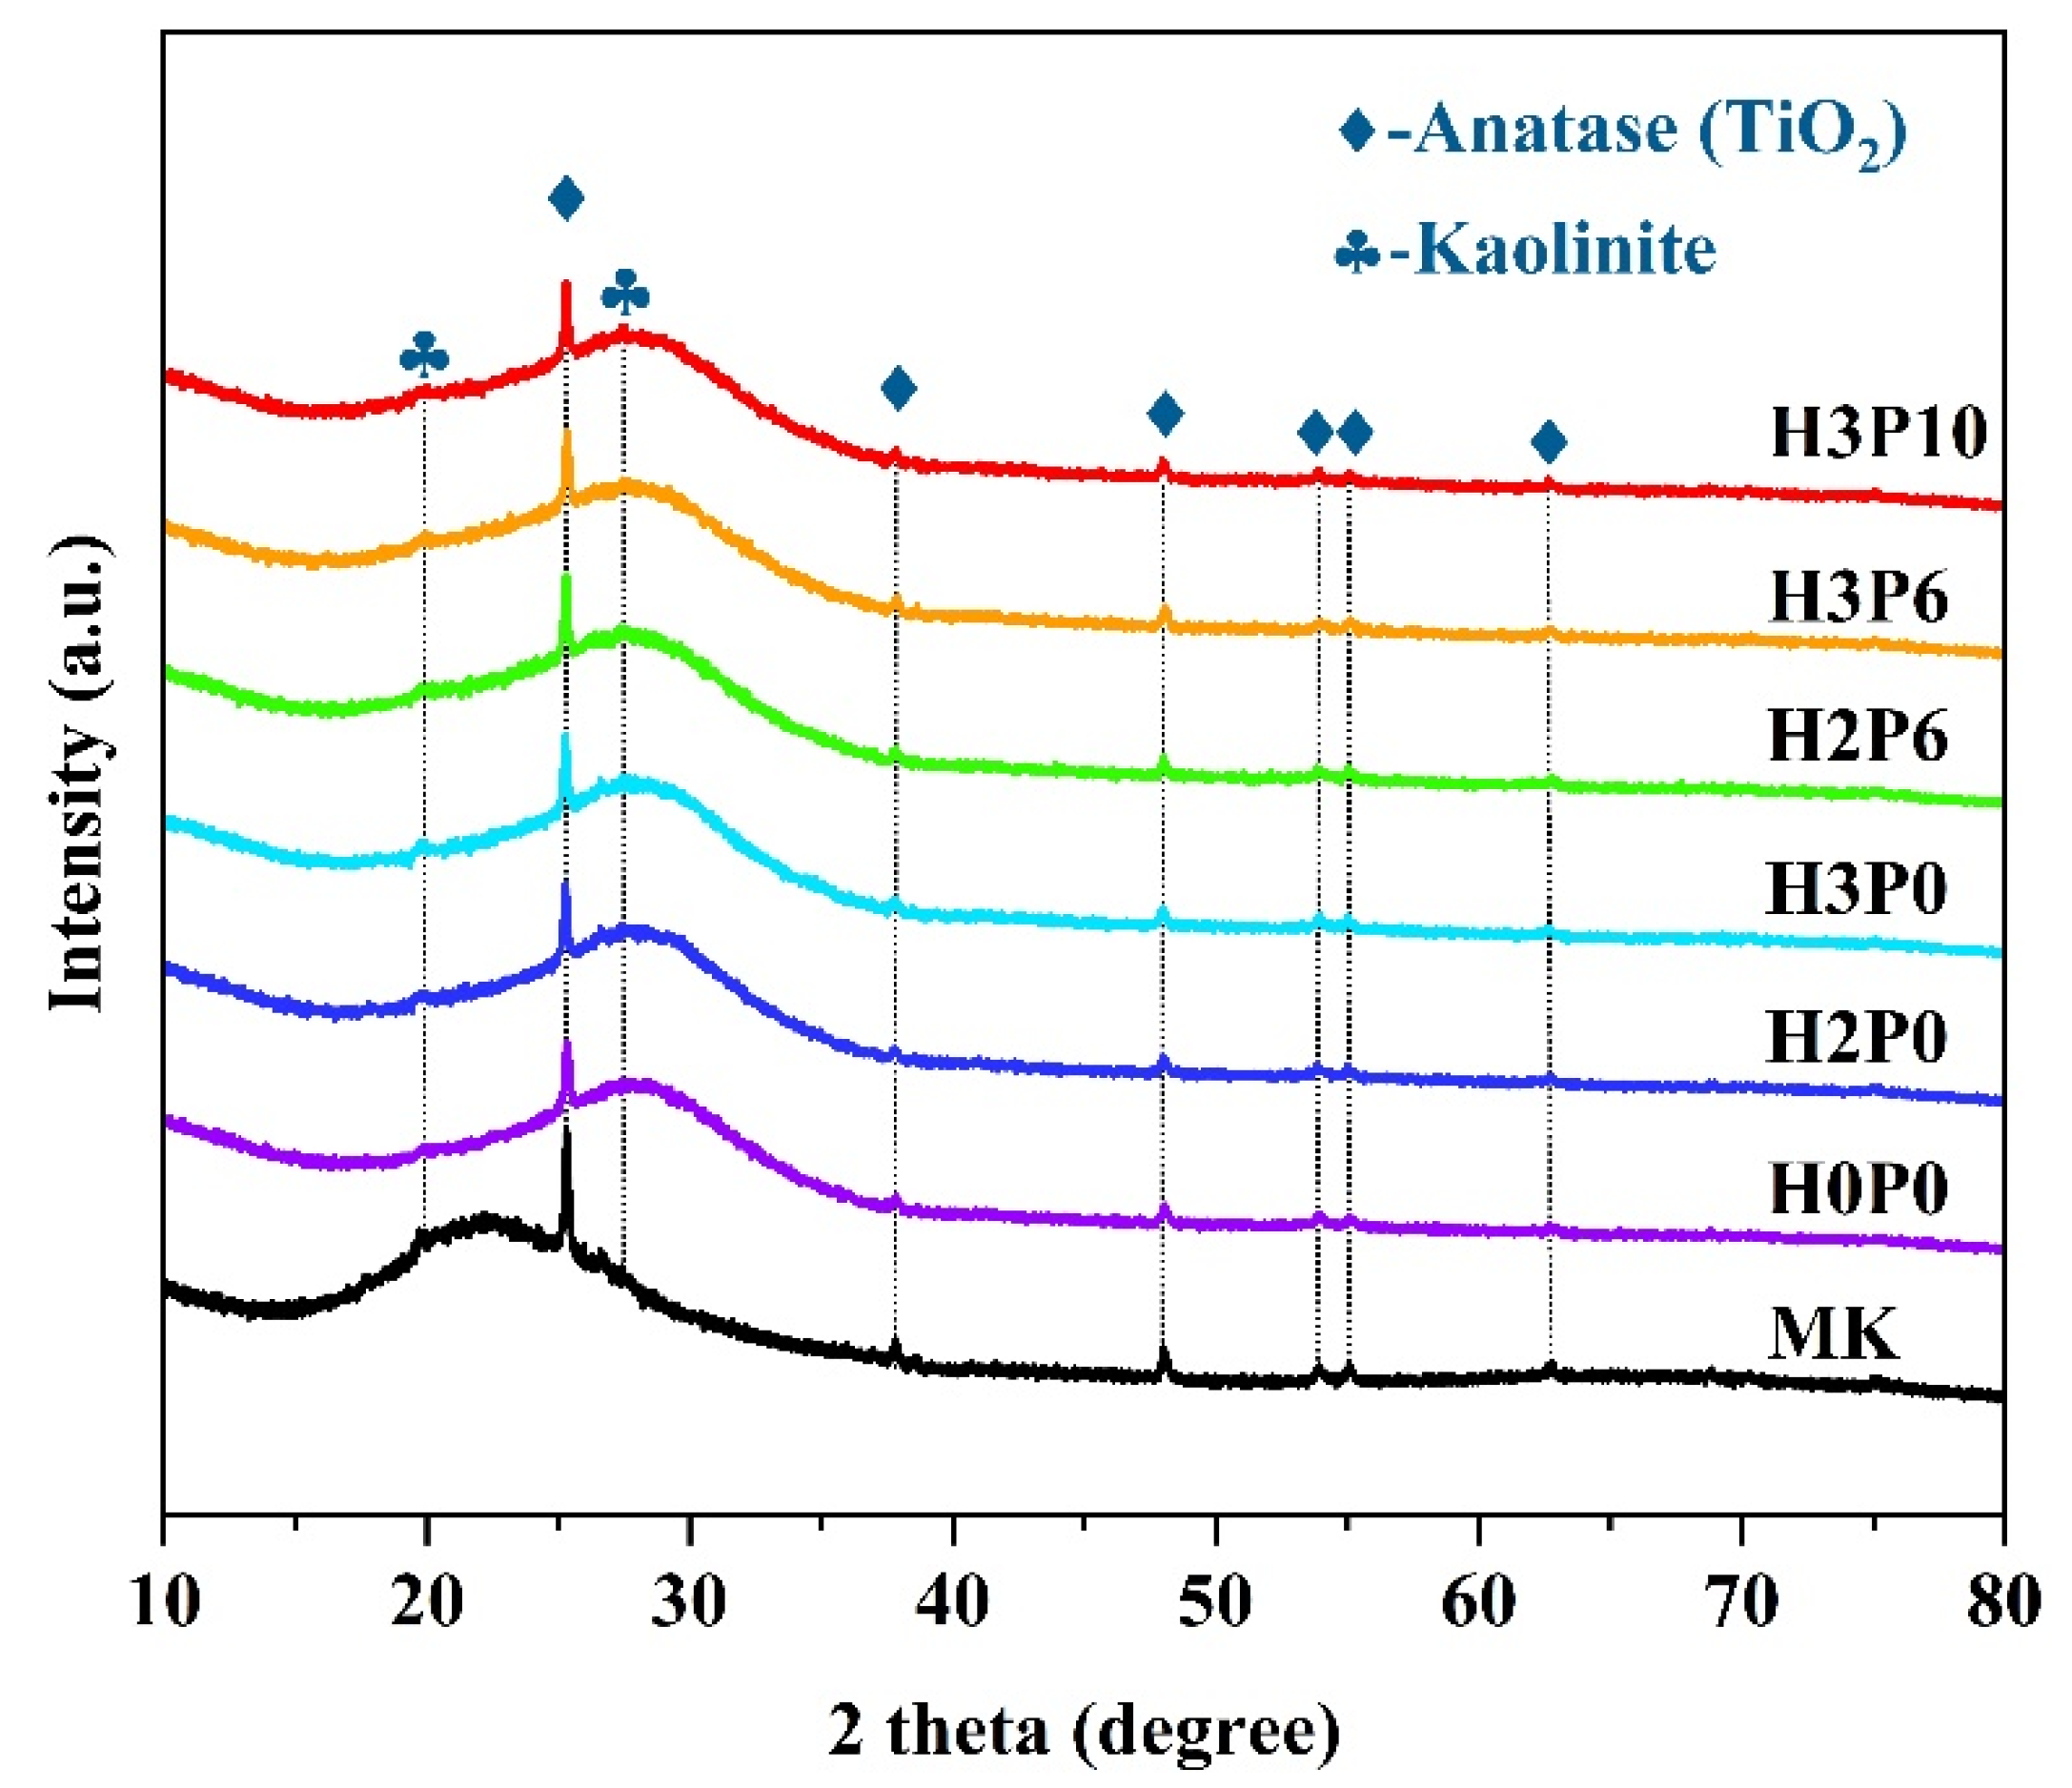
3.1. Chemical Features
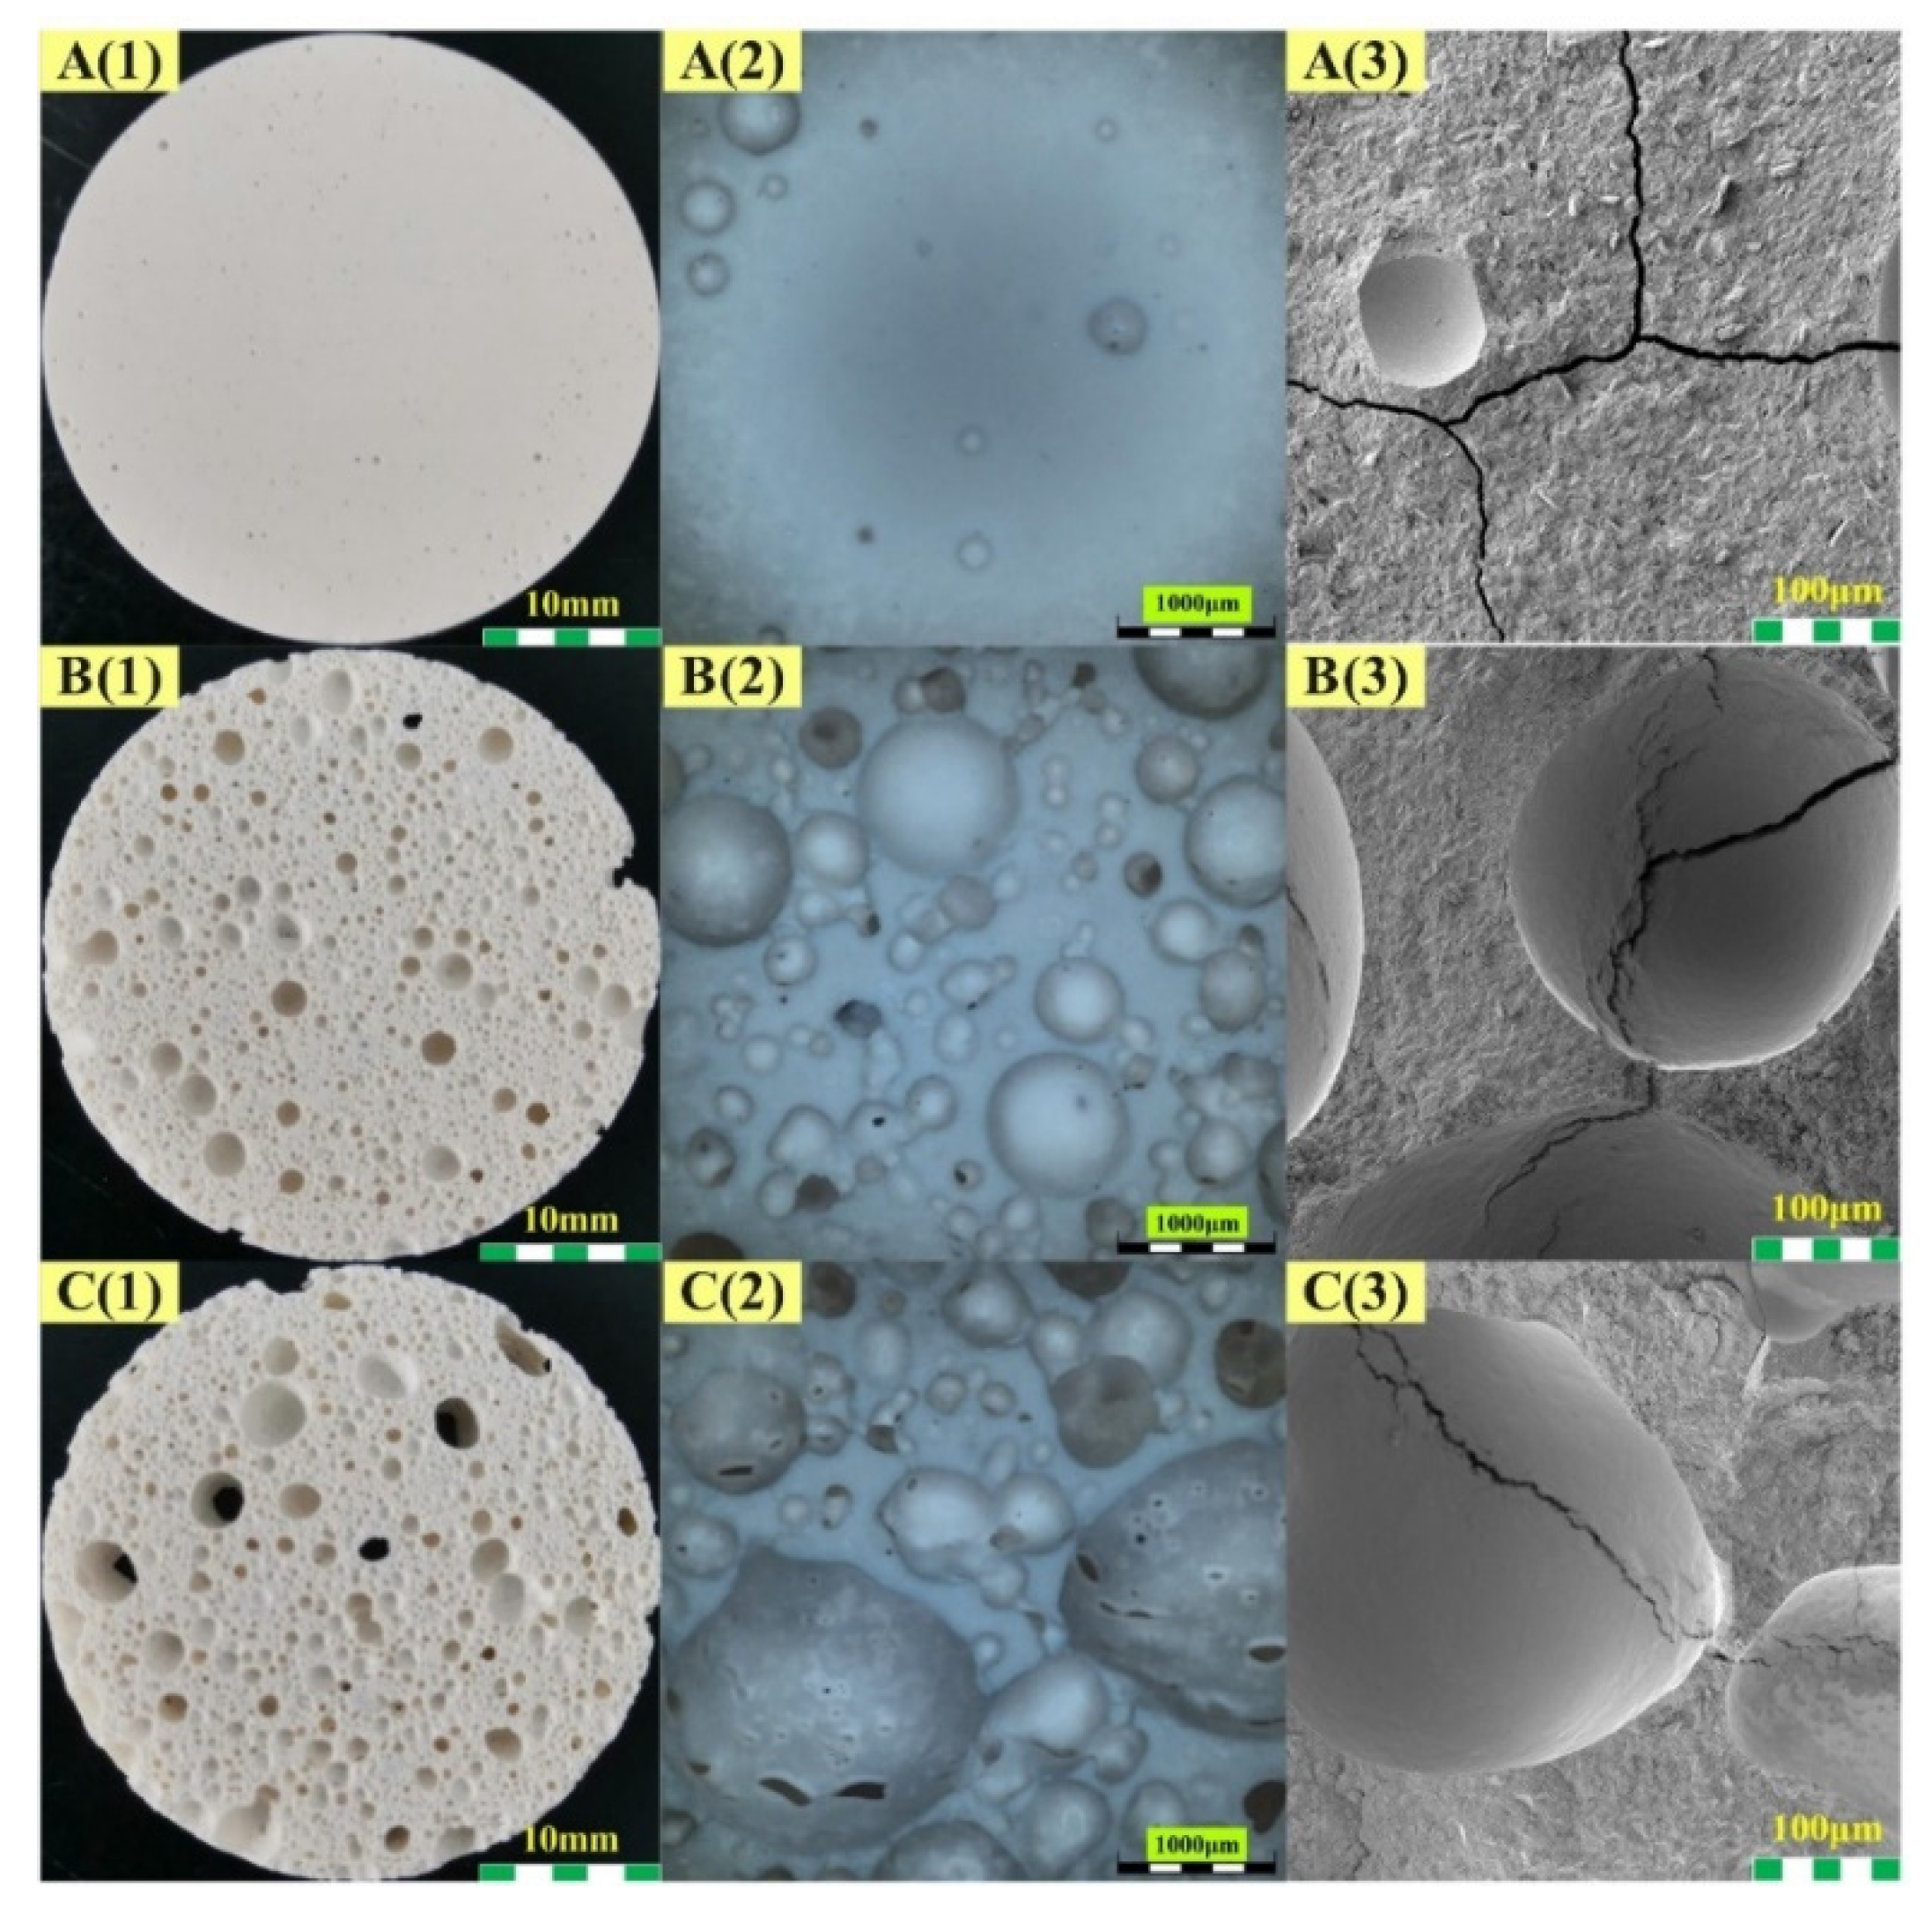
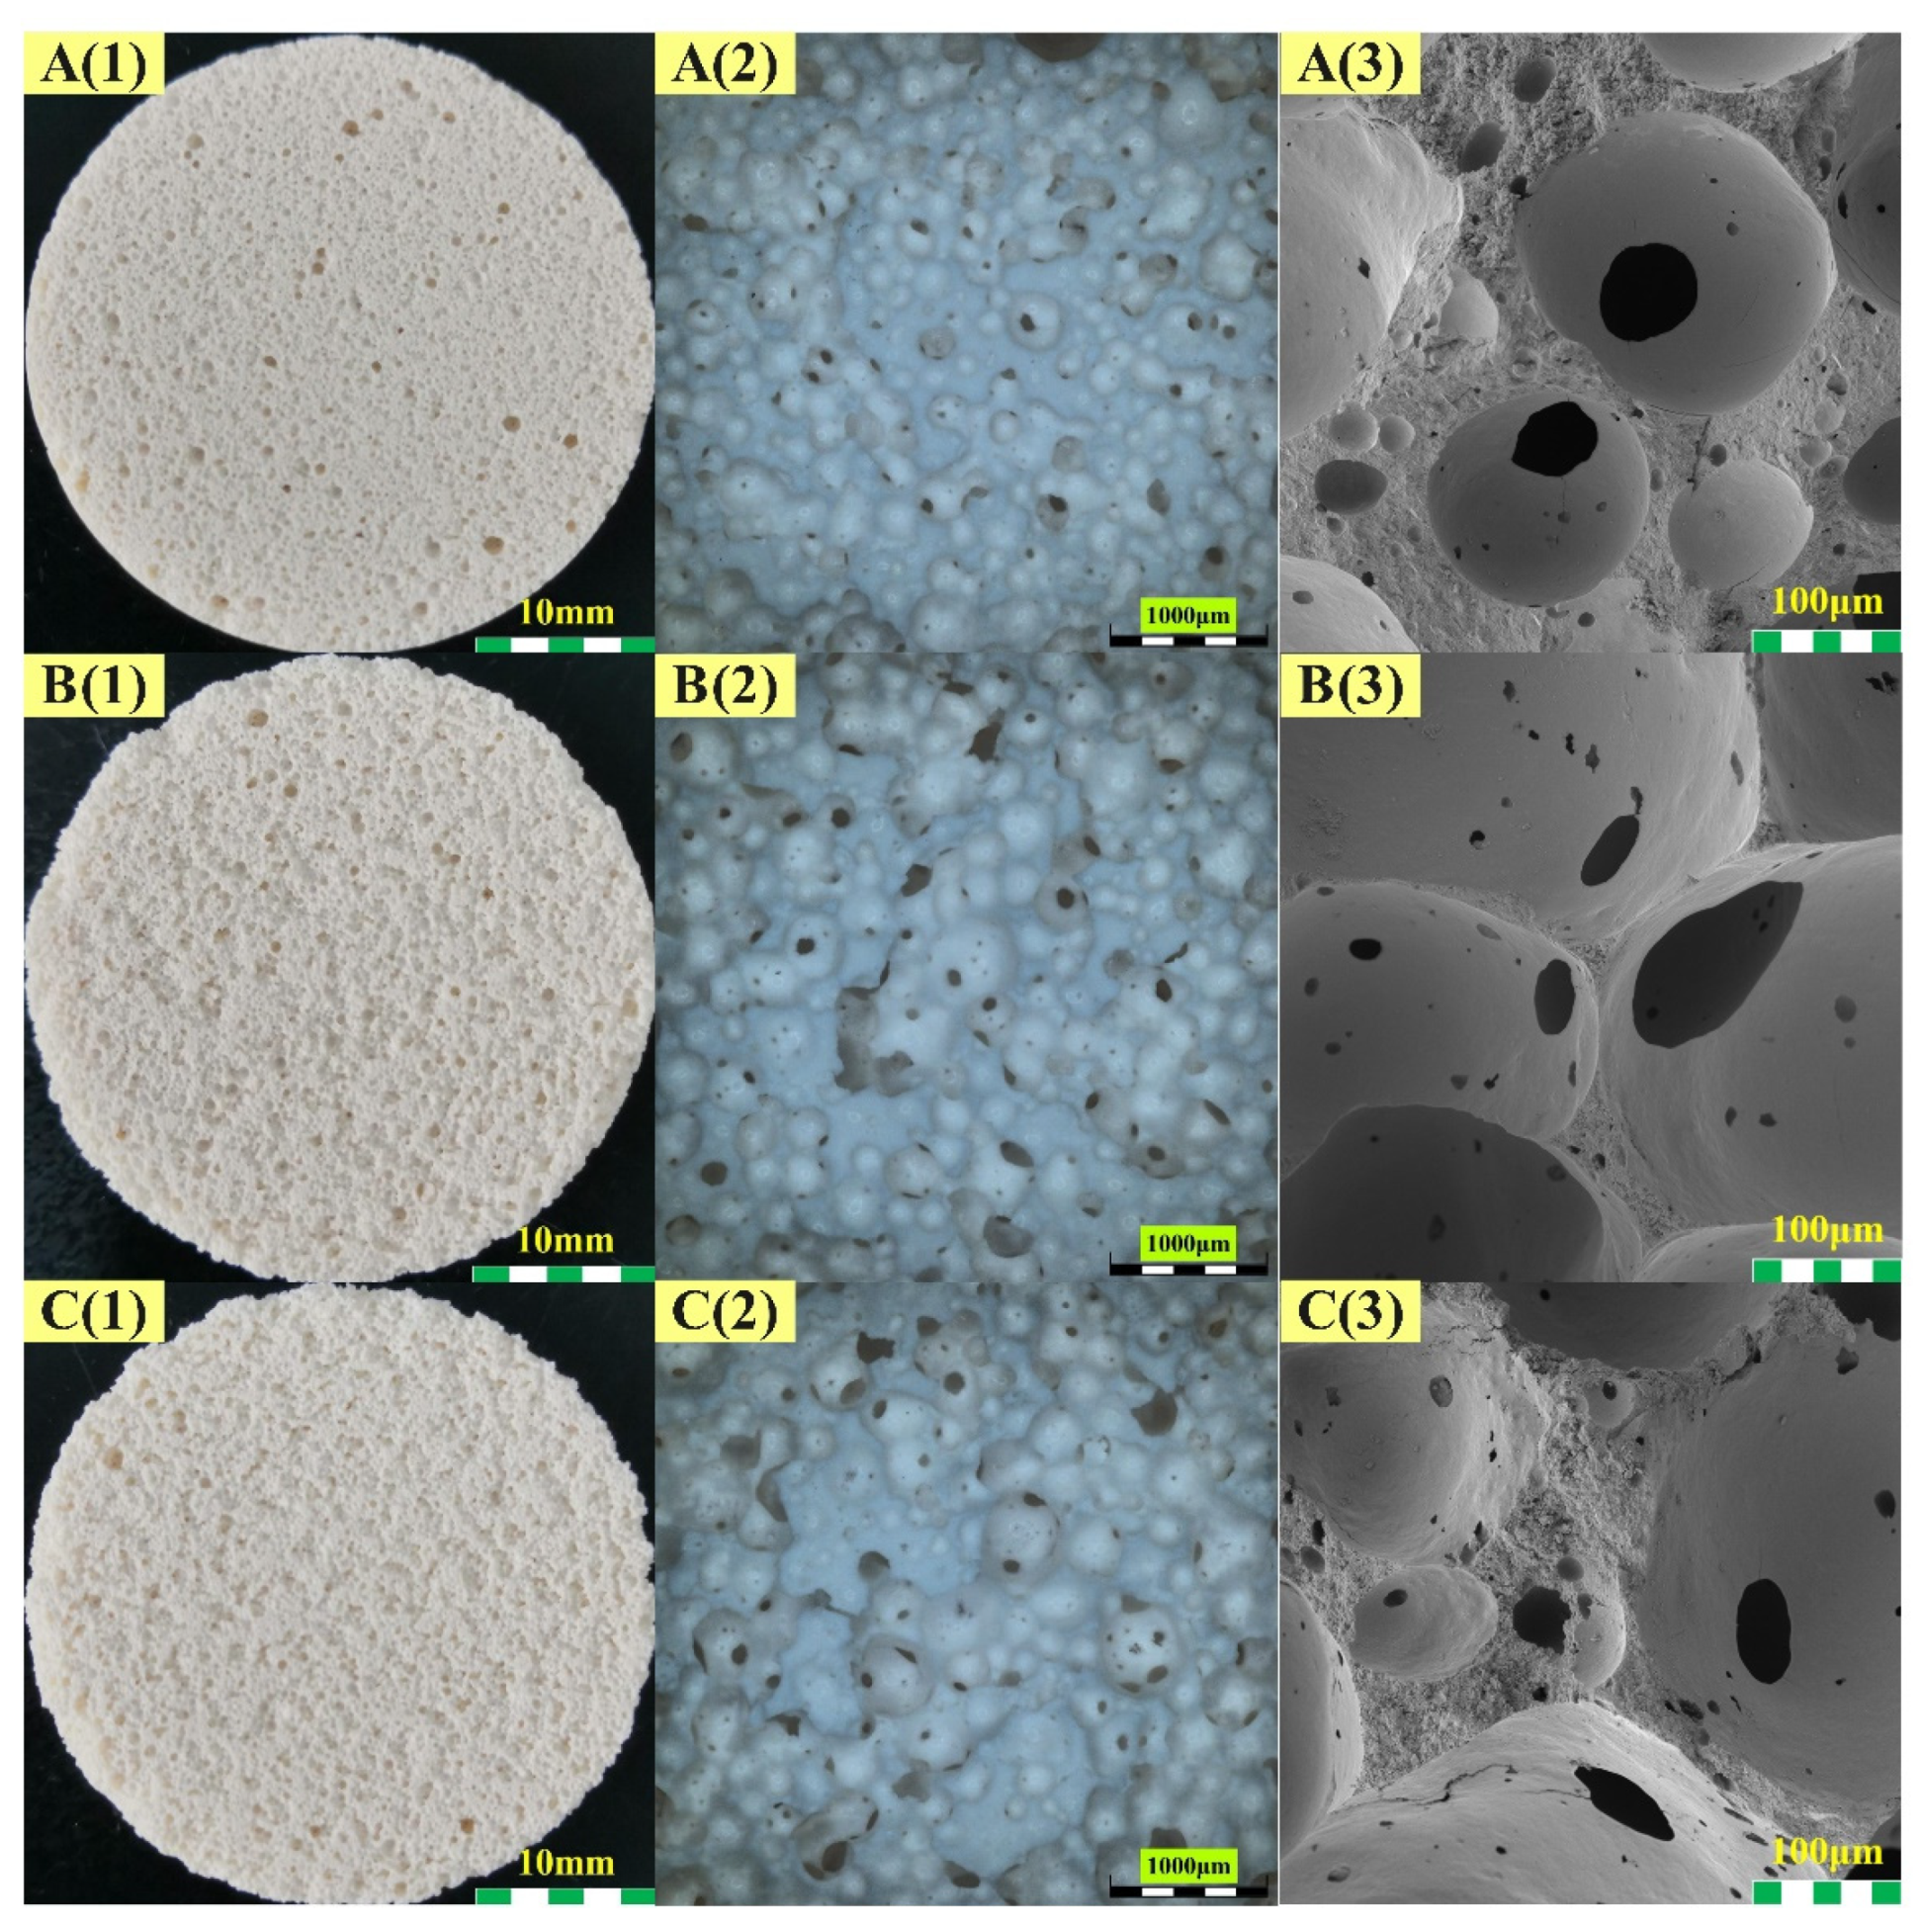
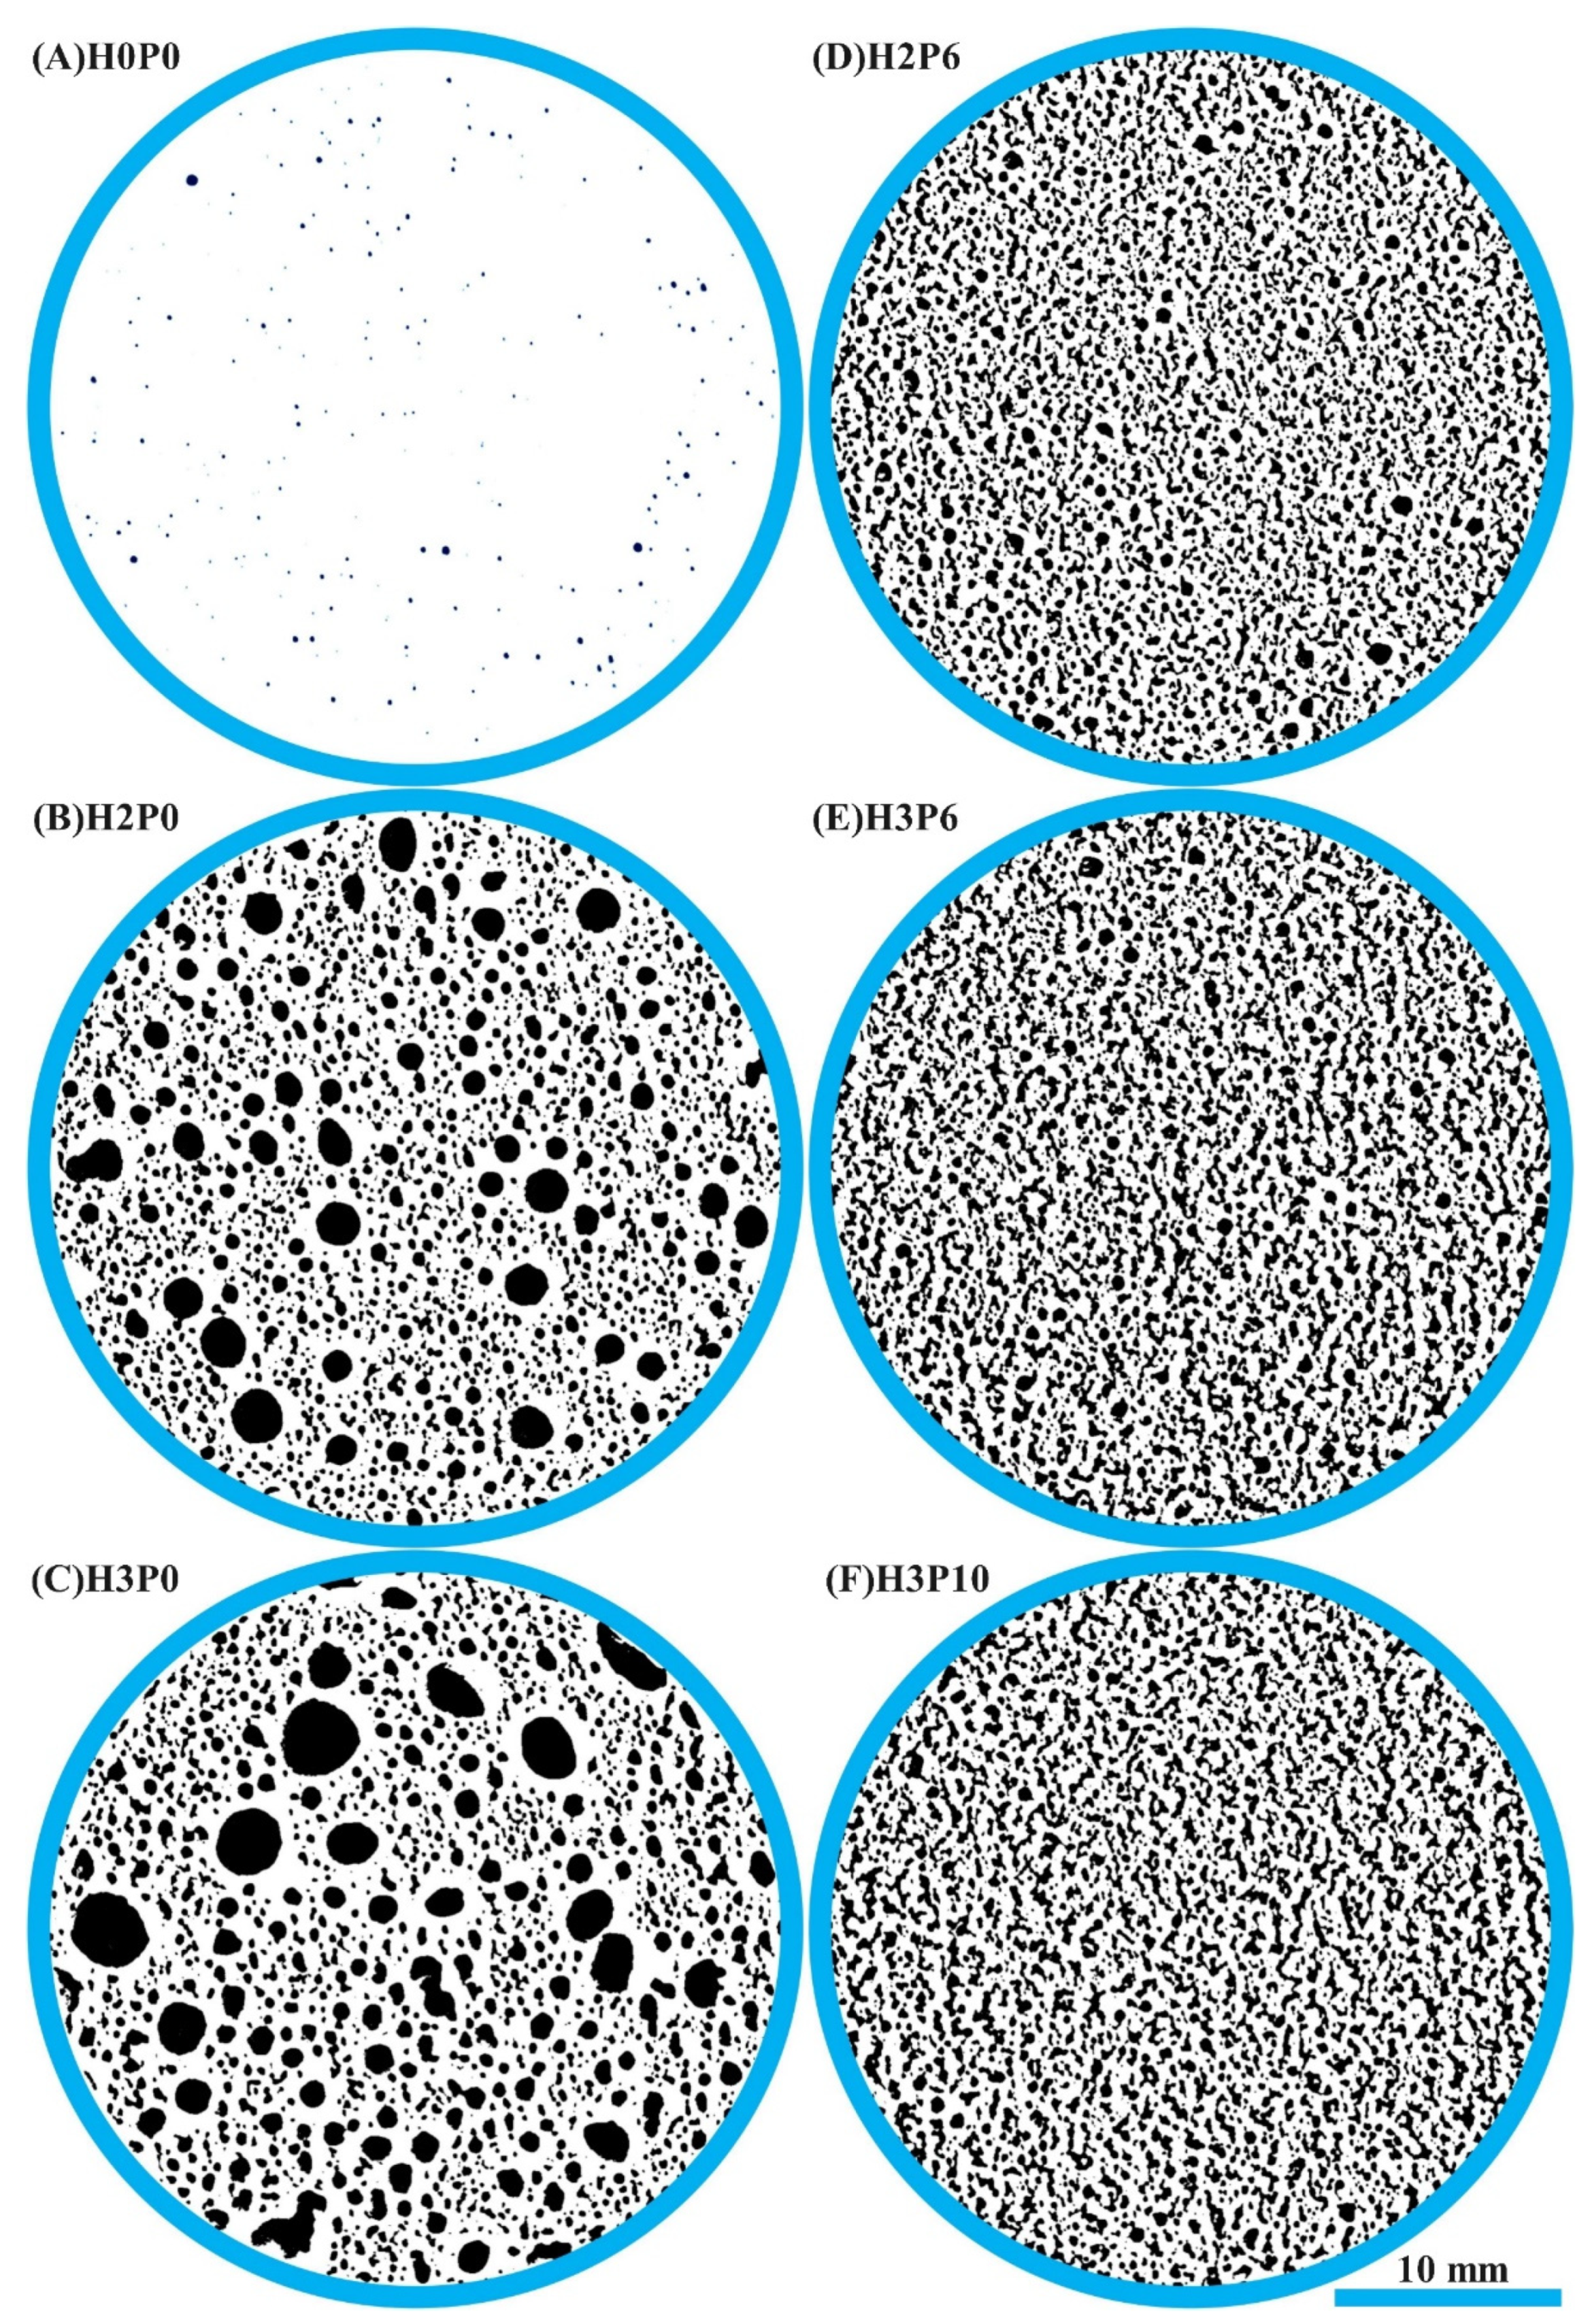
3.2. Morphology
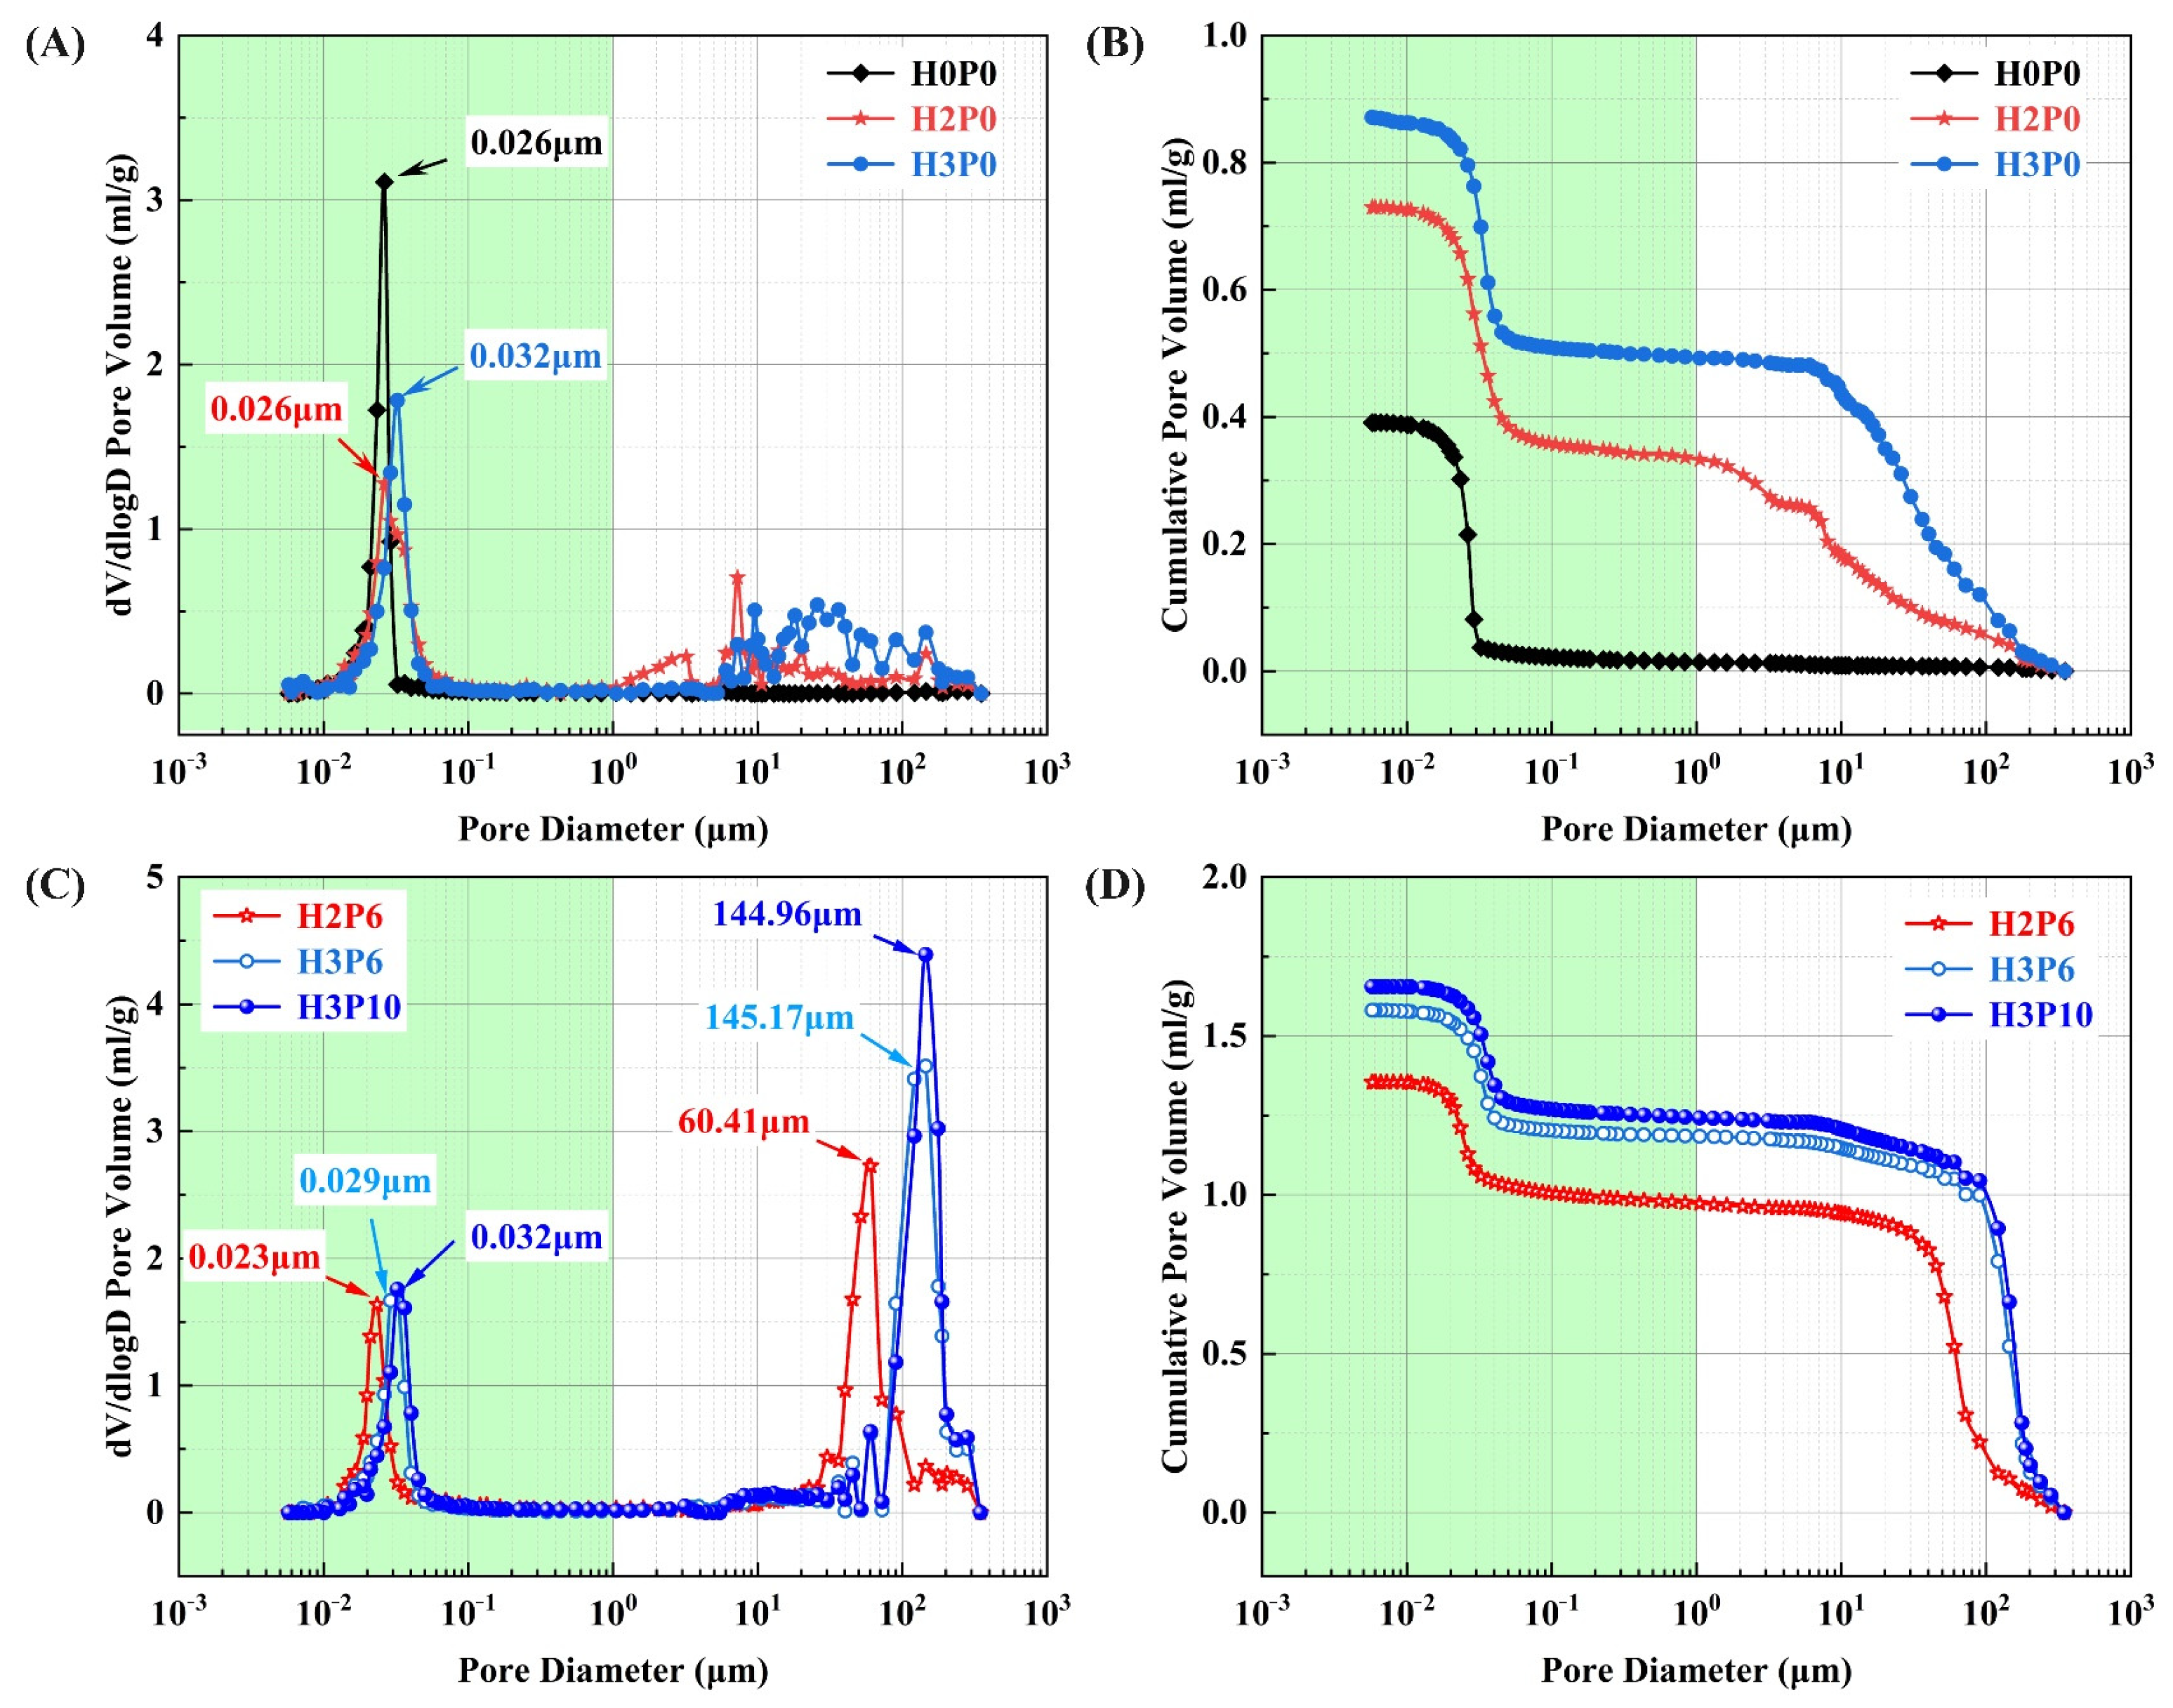
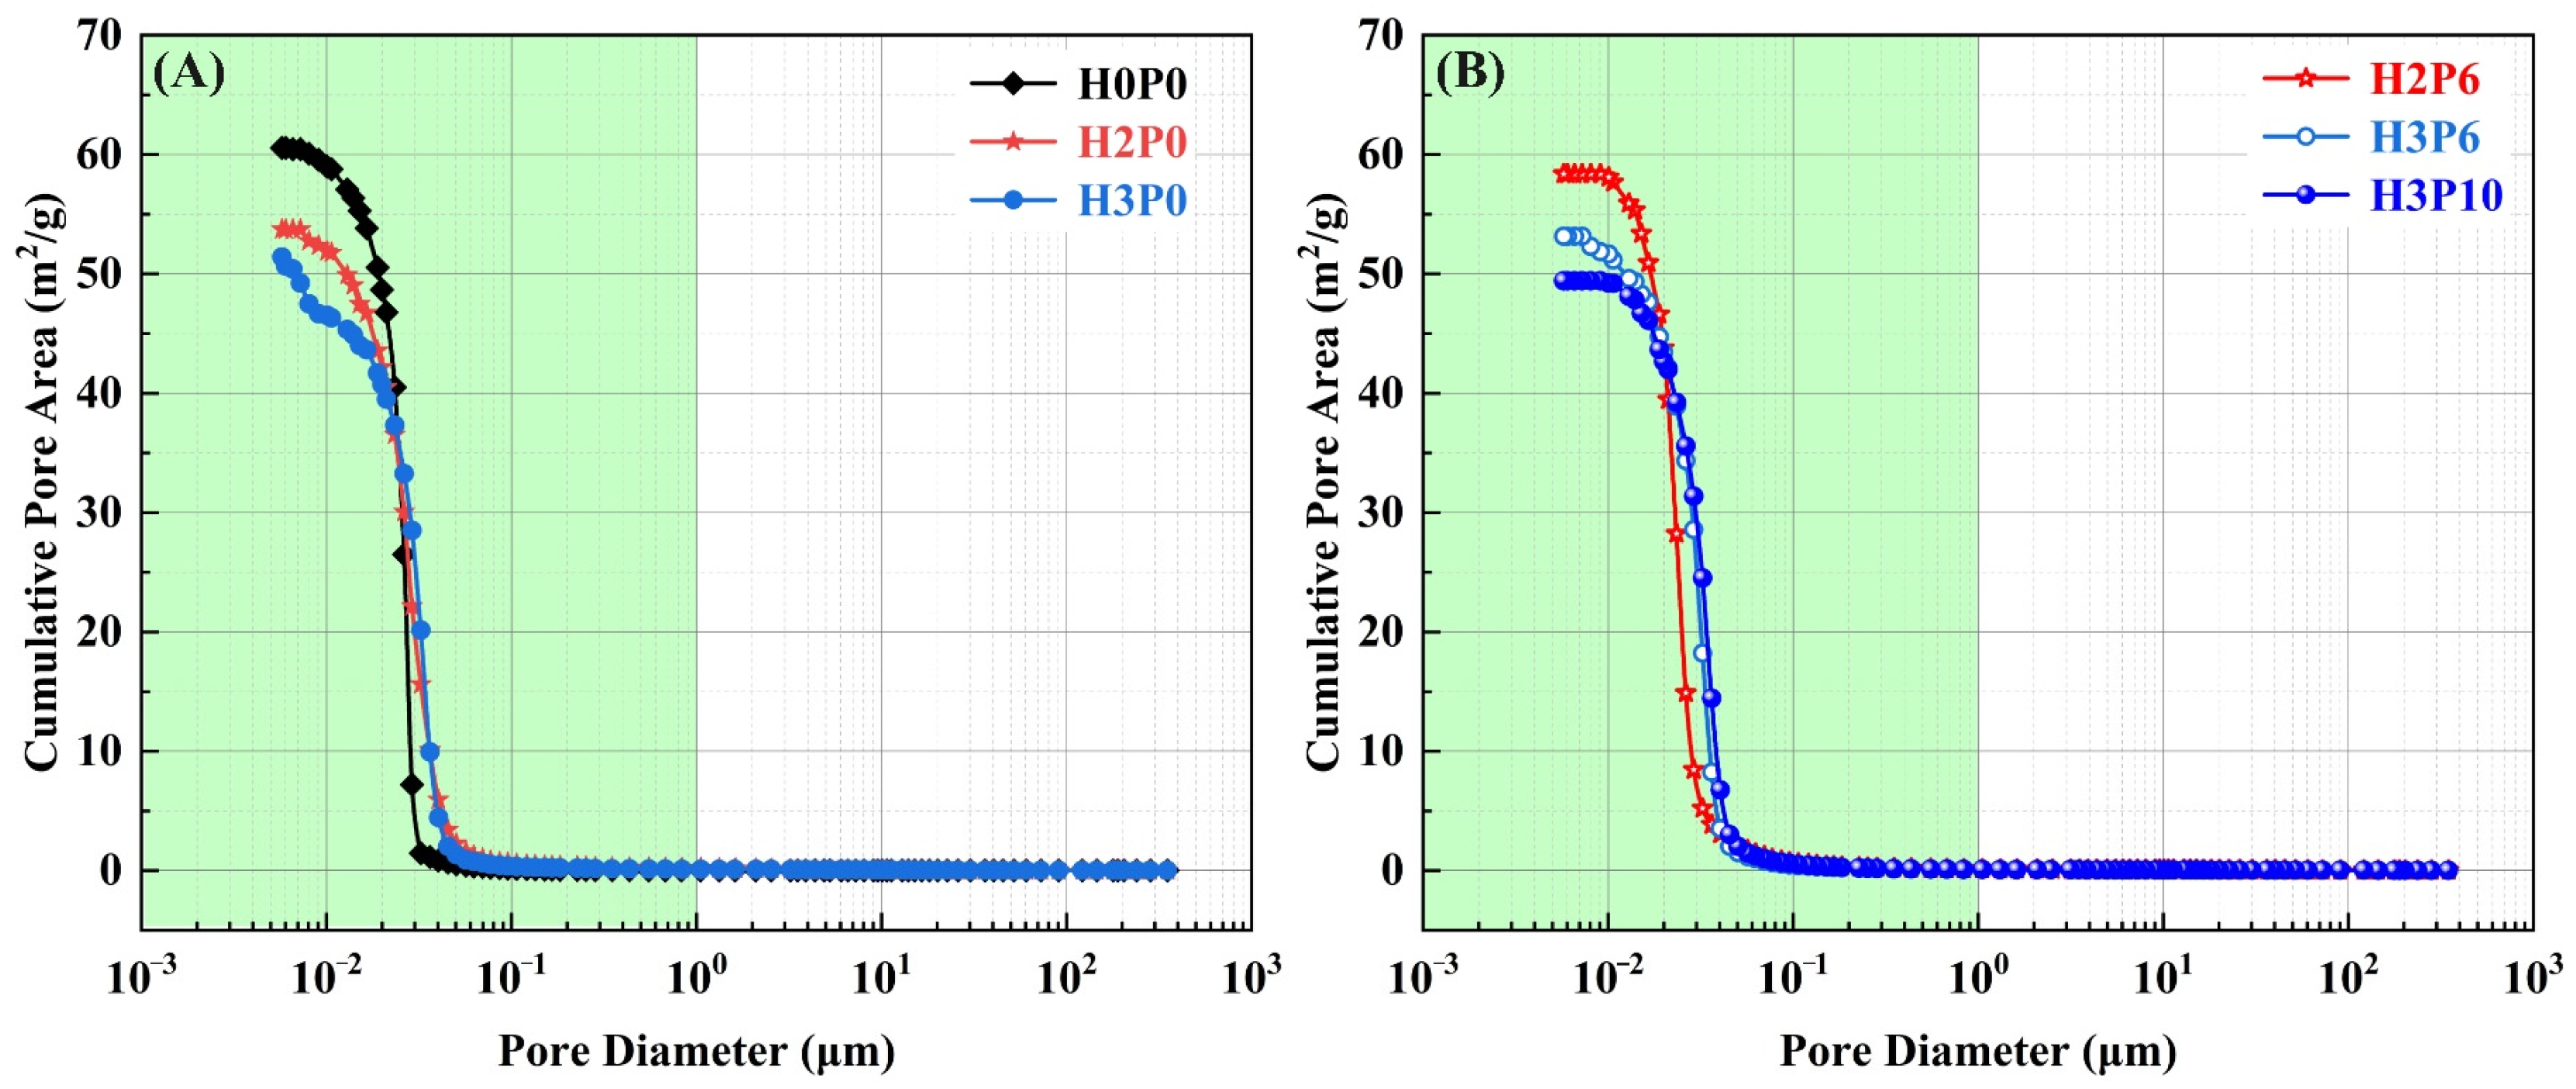
3.3. Pore size Distribution
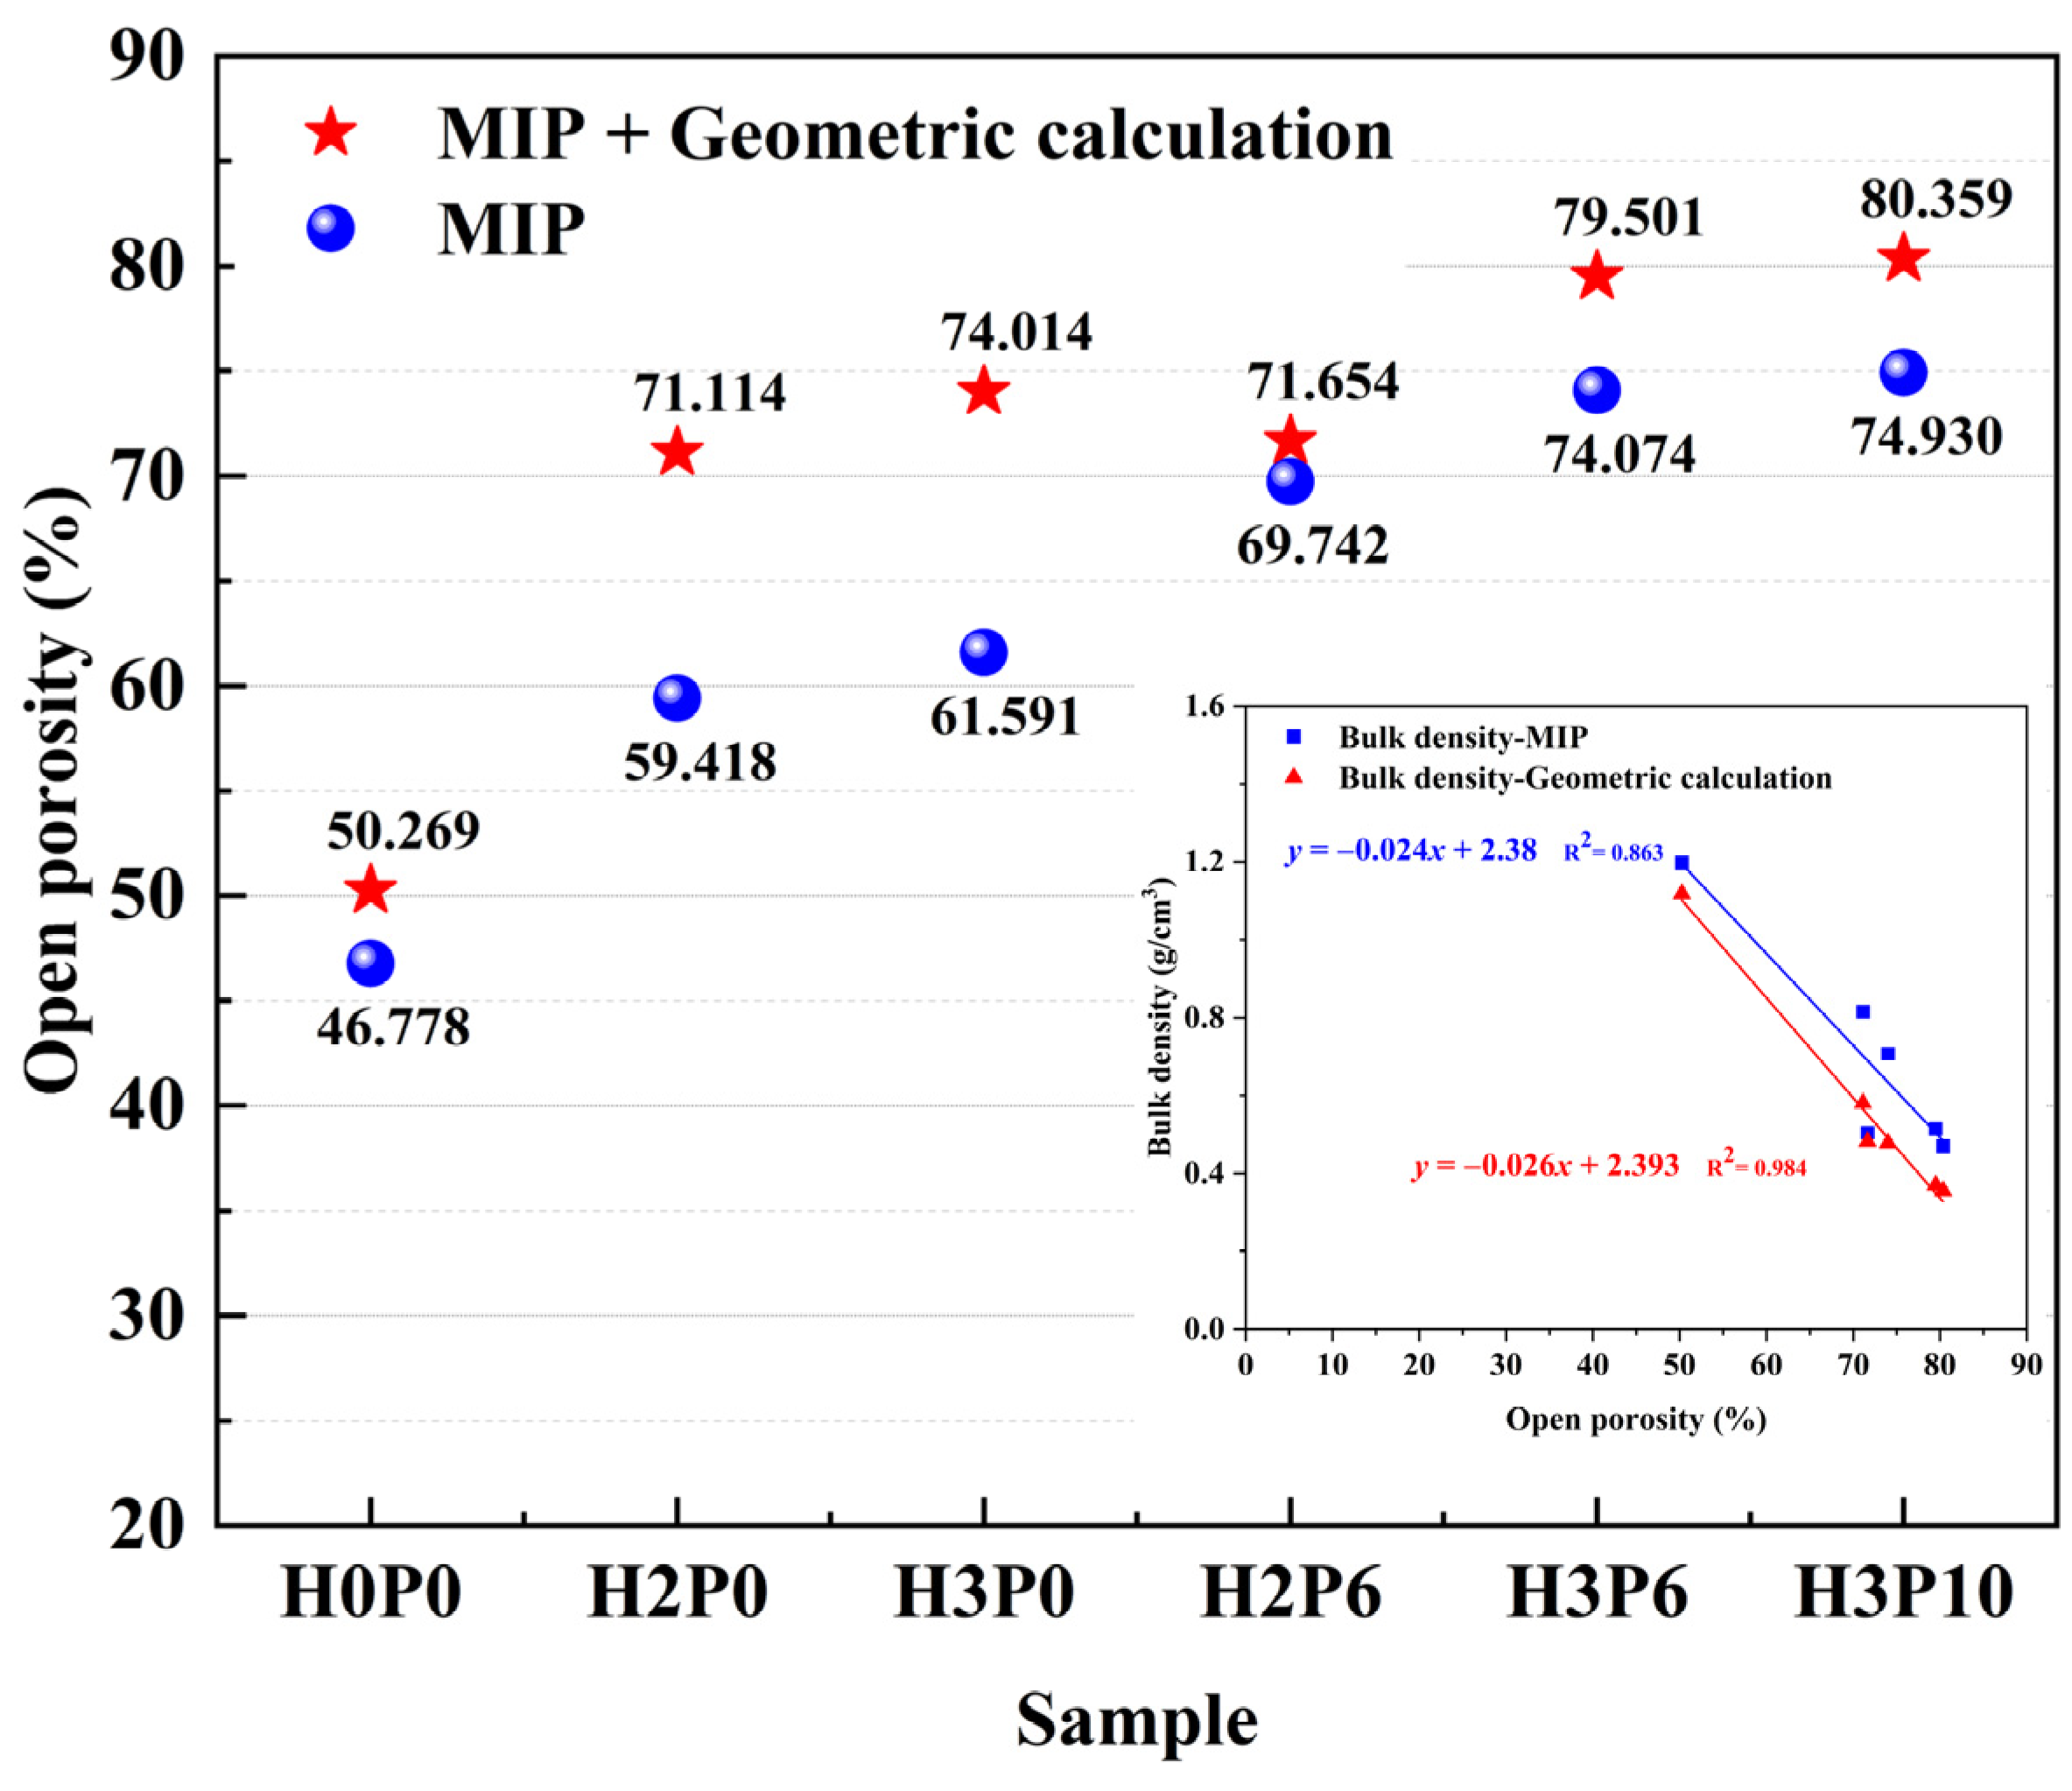
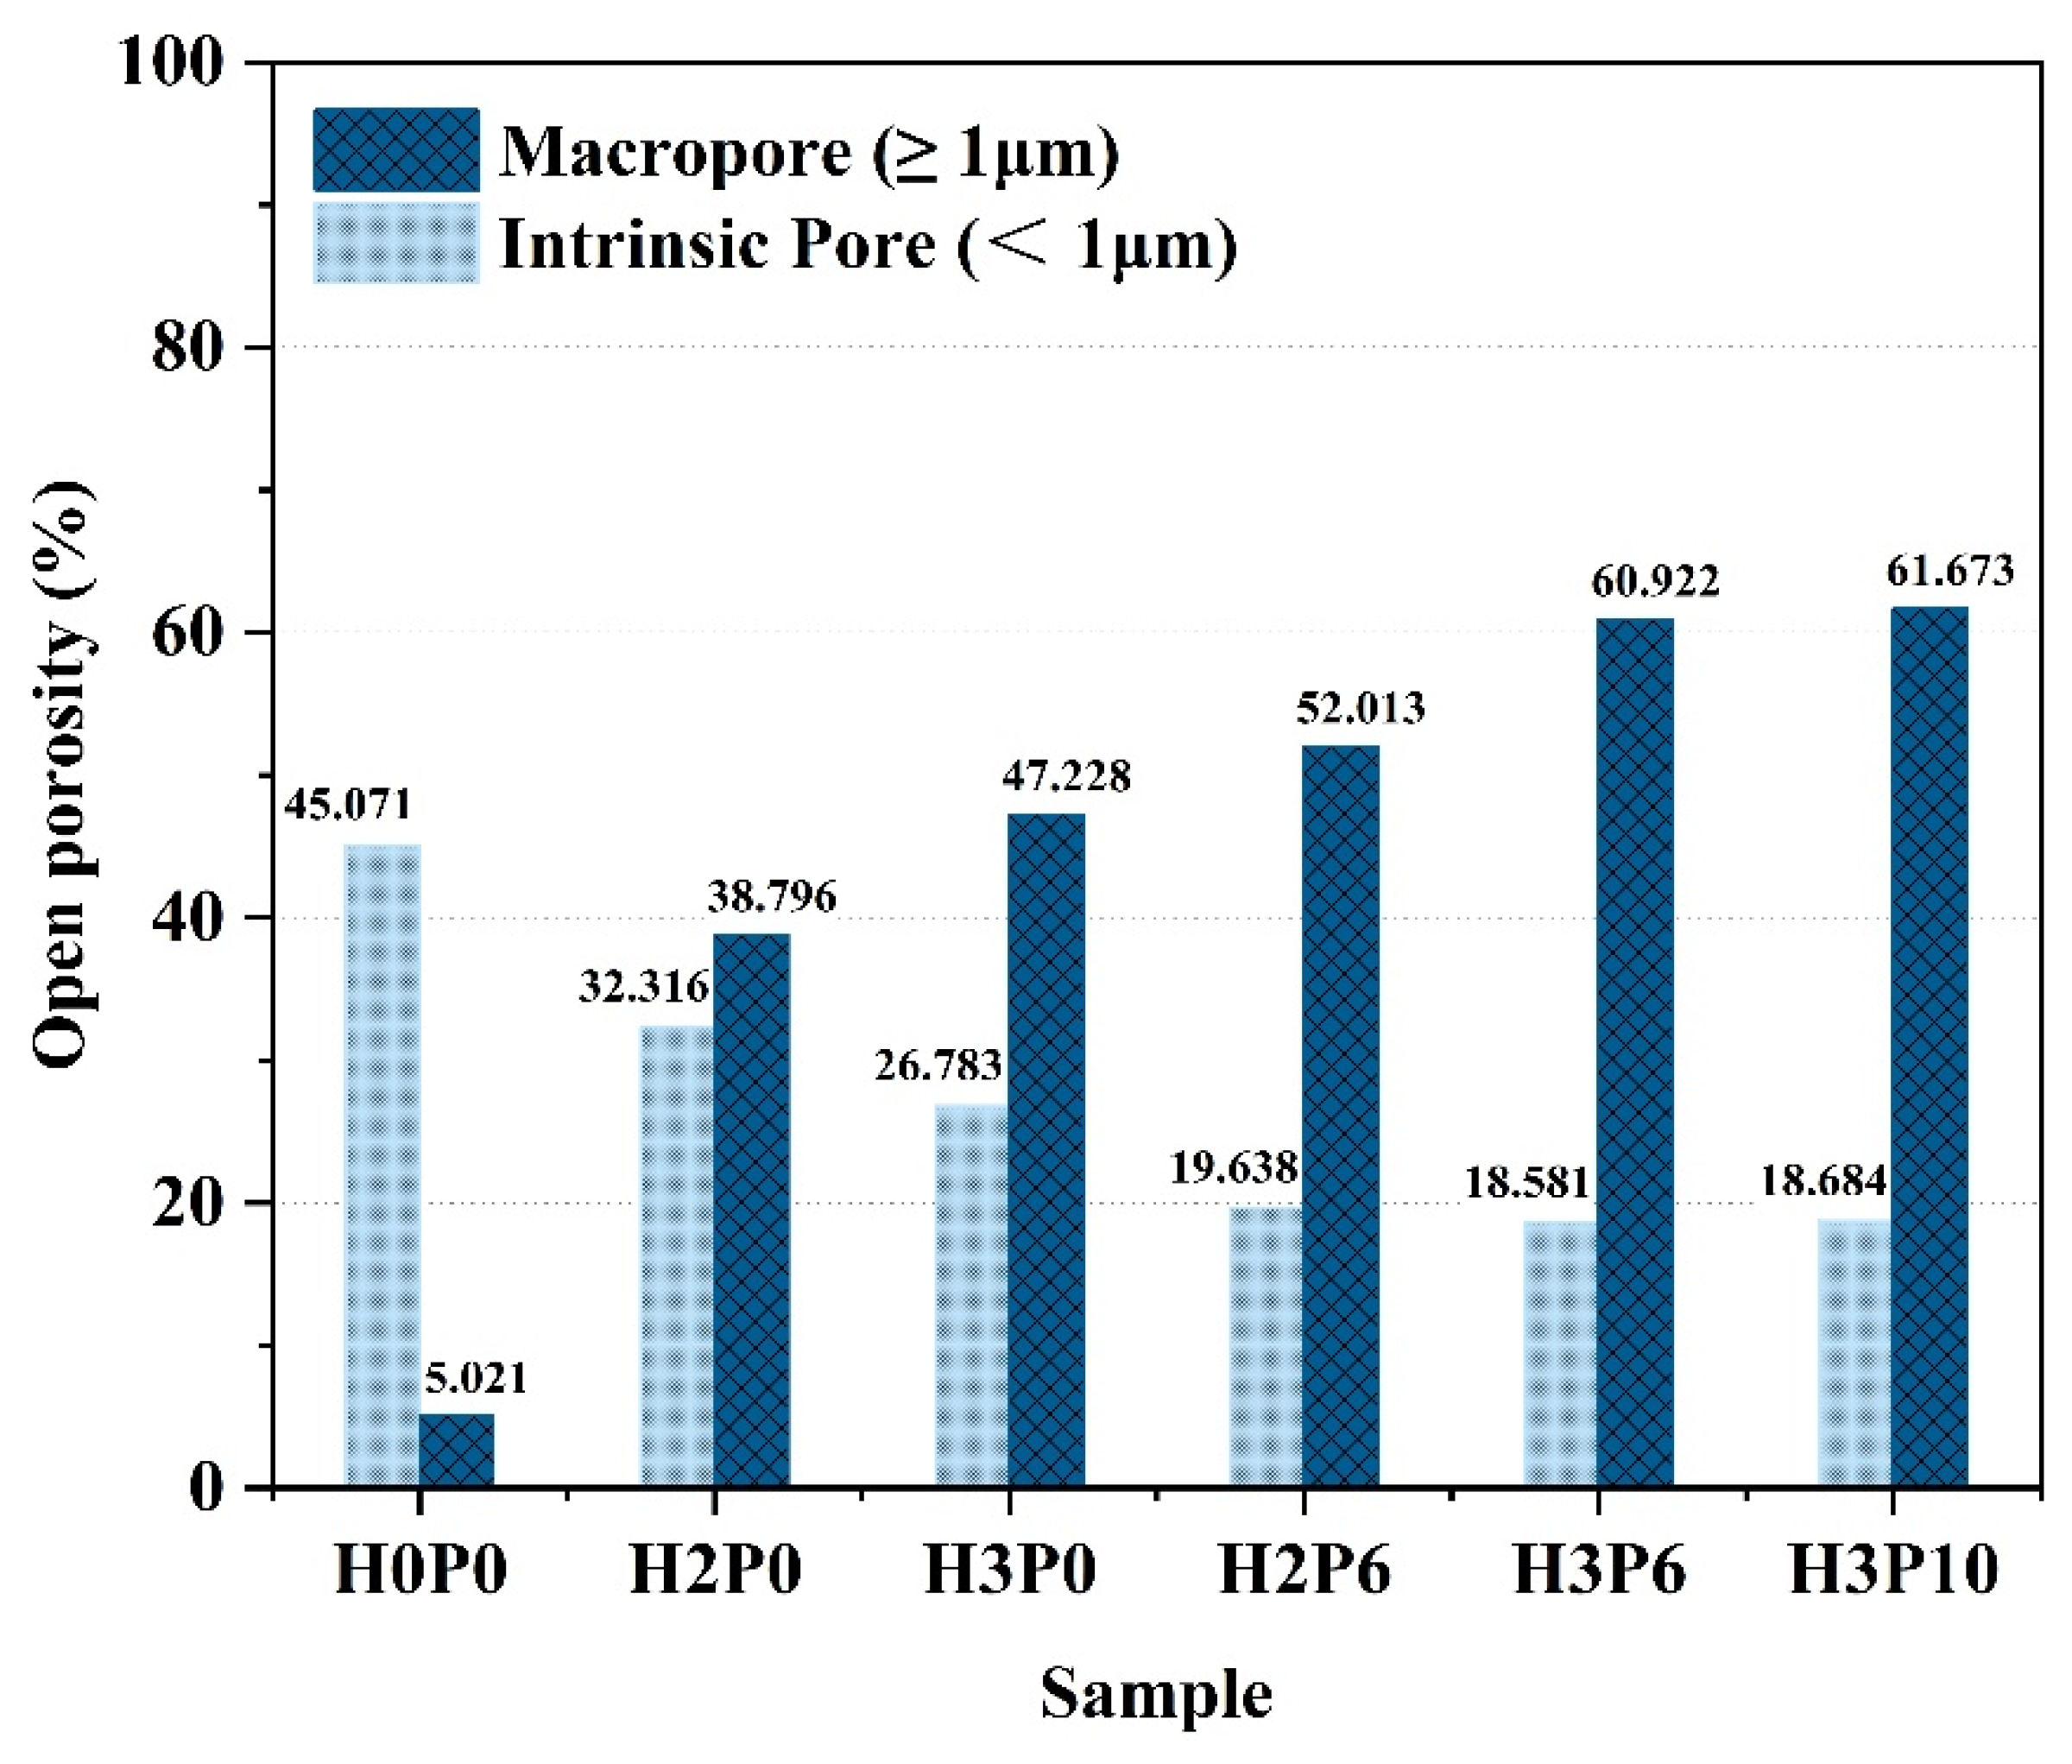
3.4. Porosity
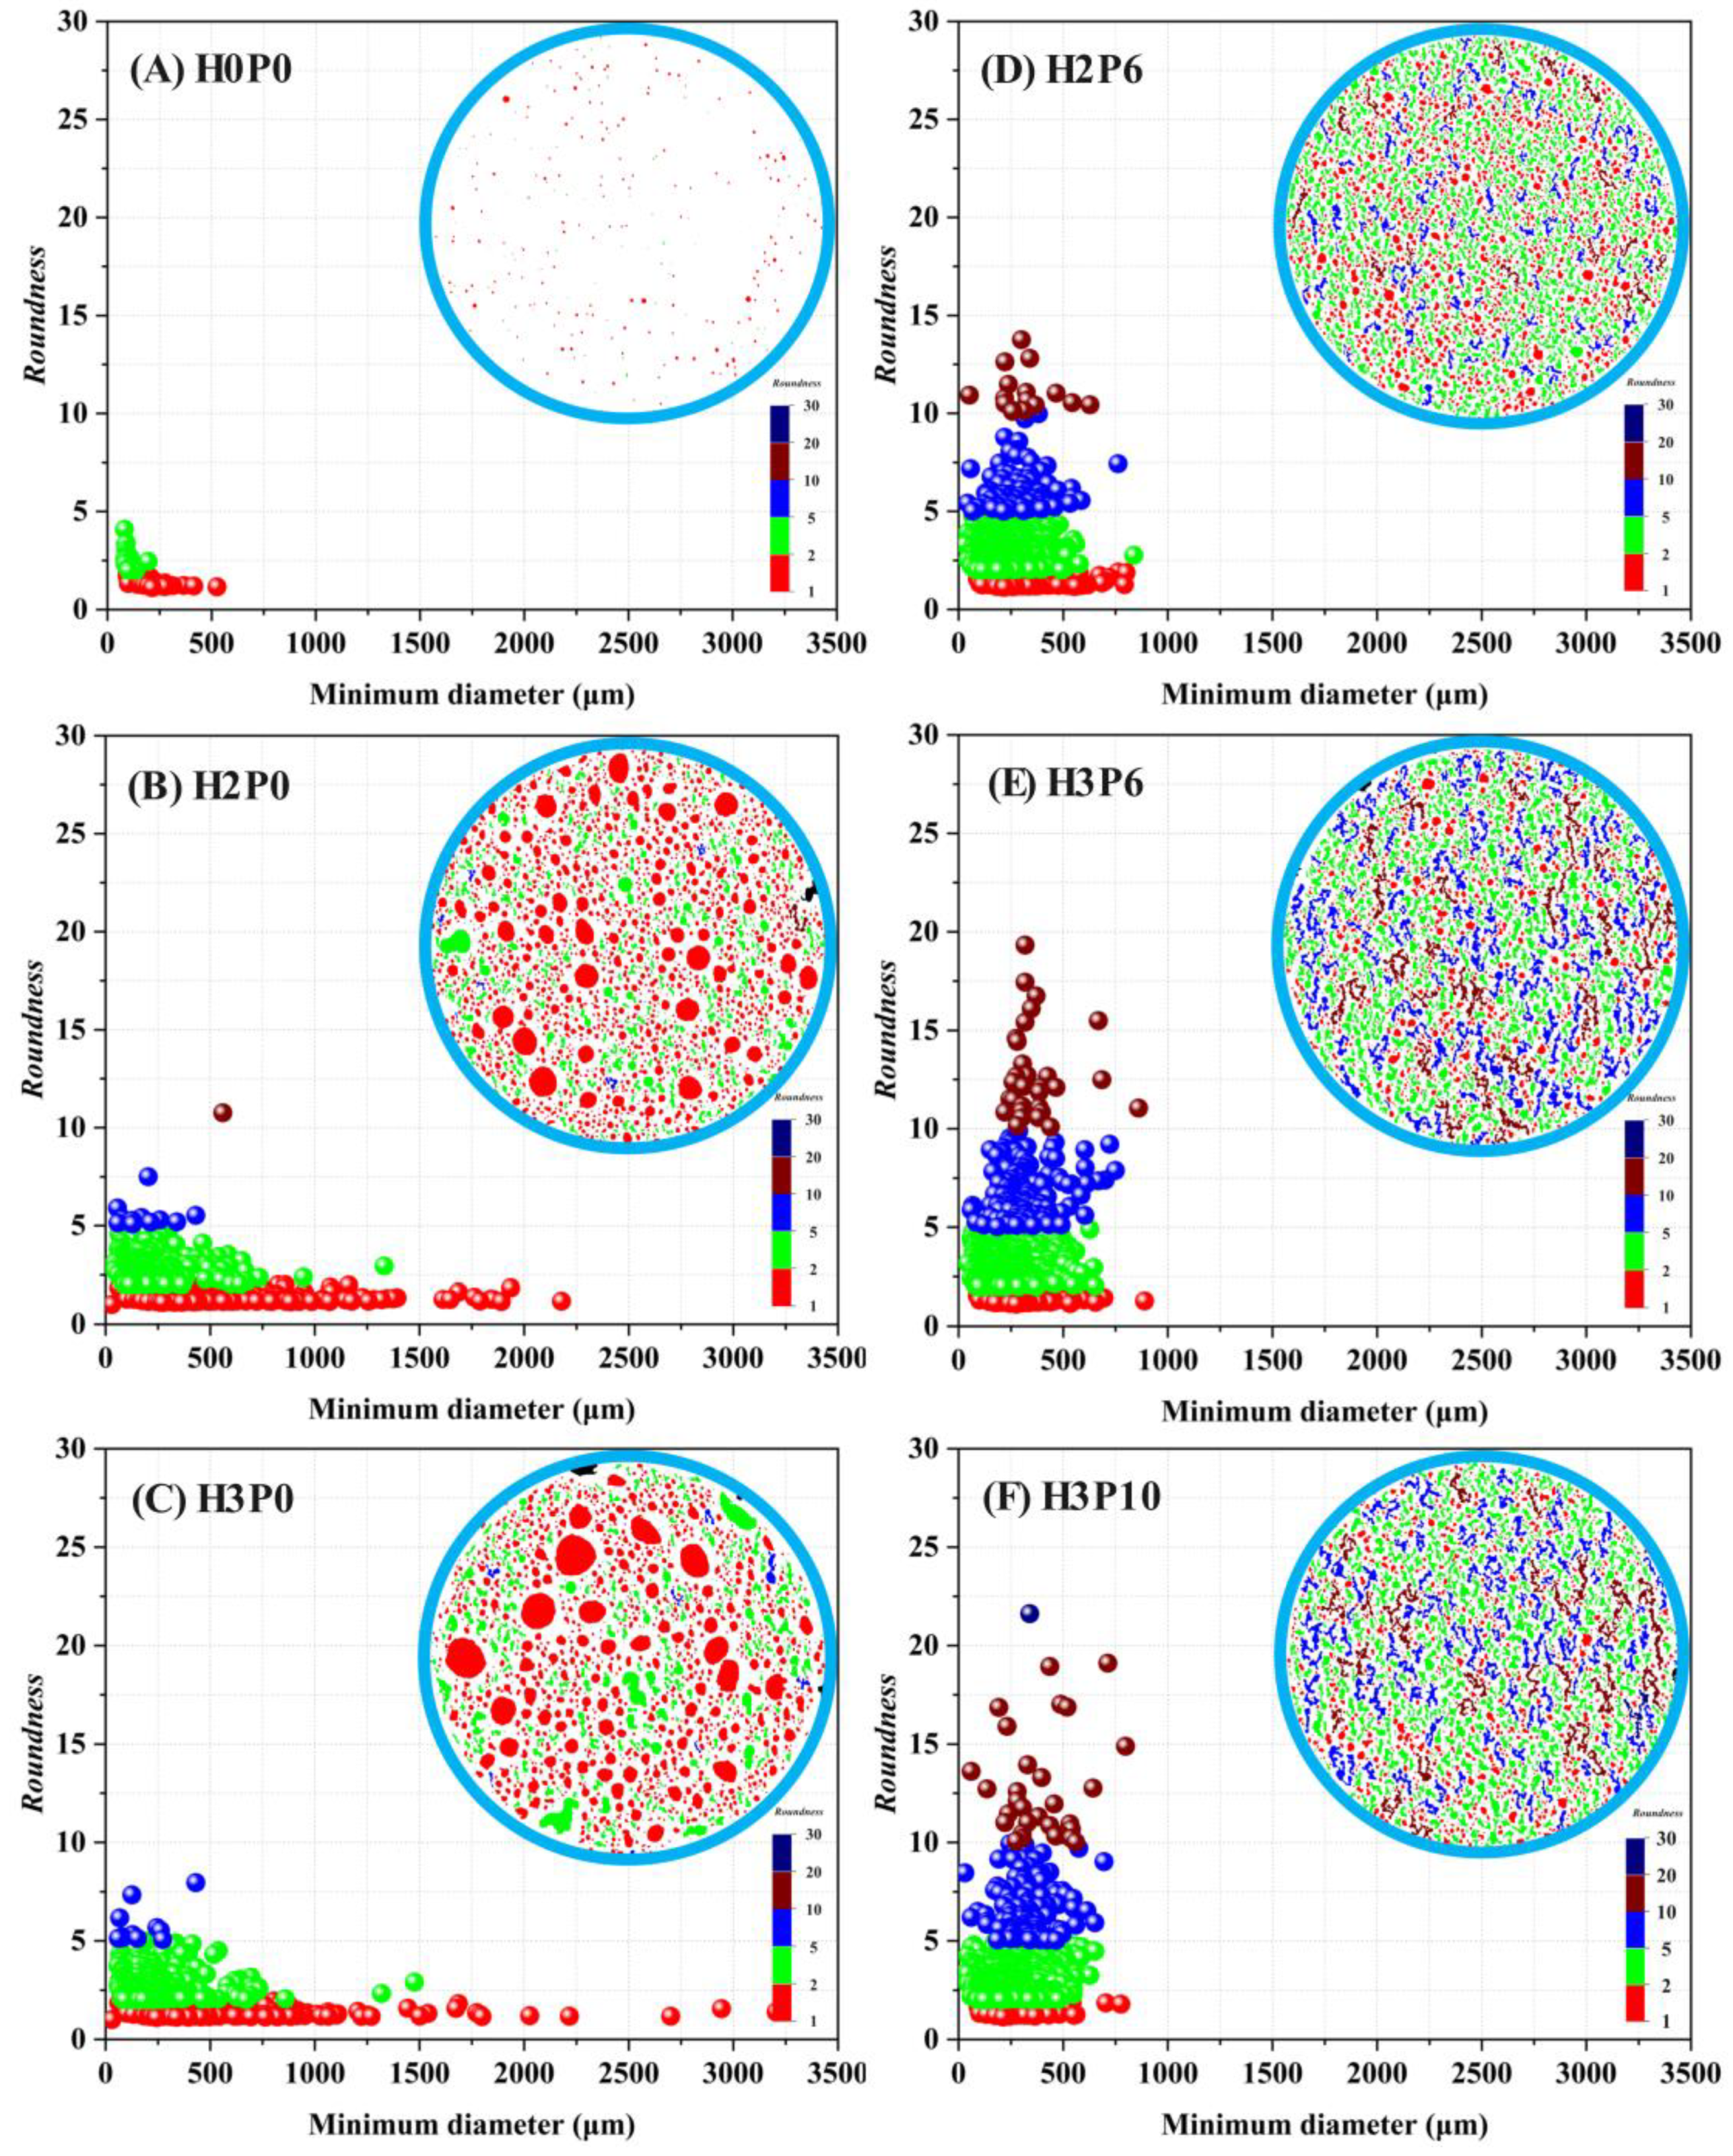
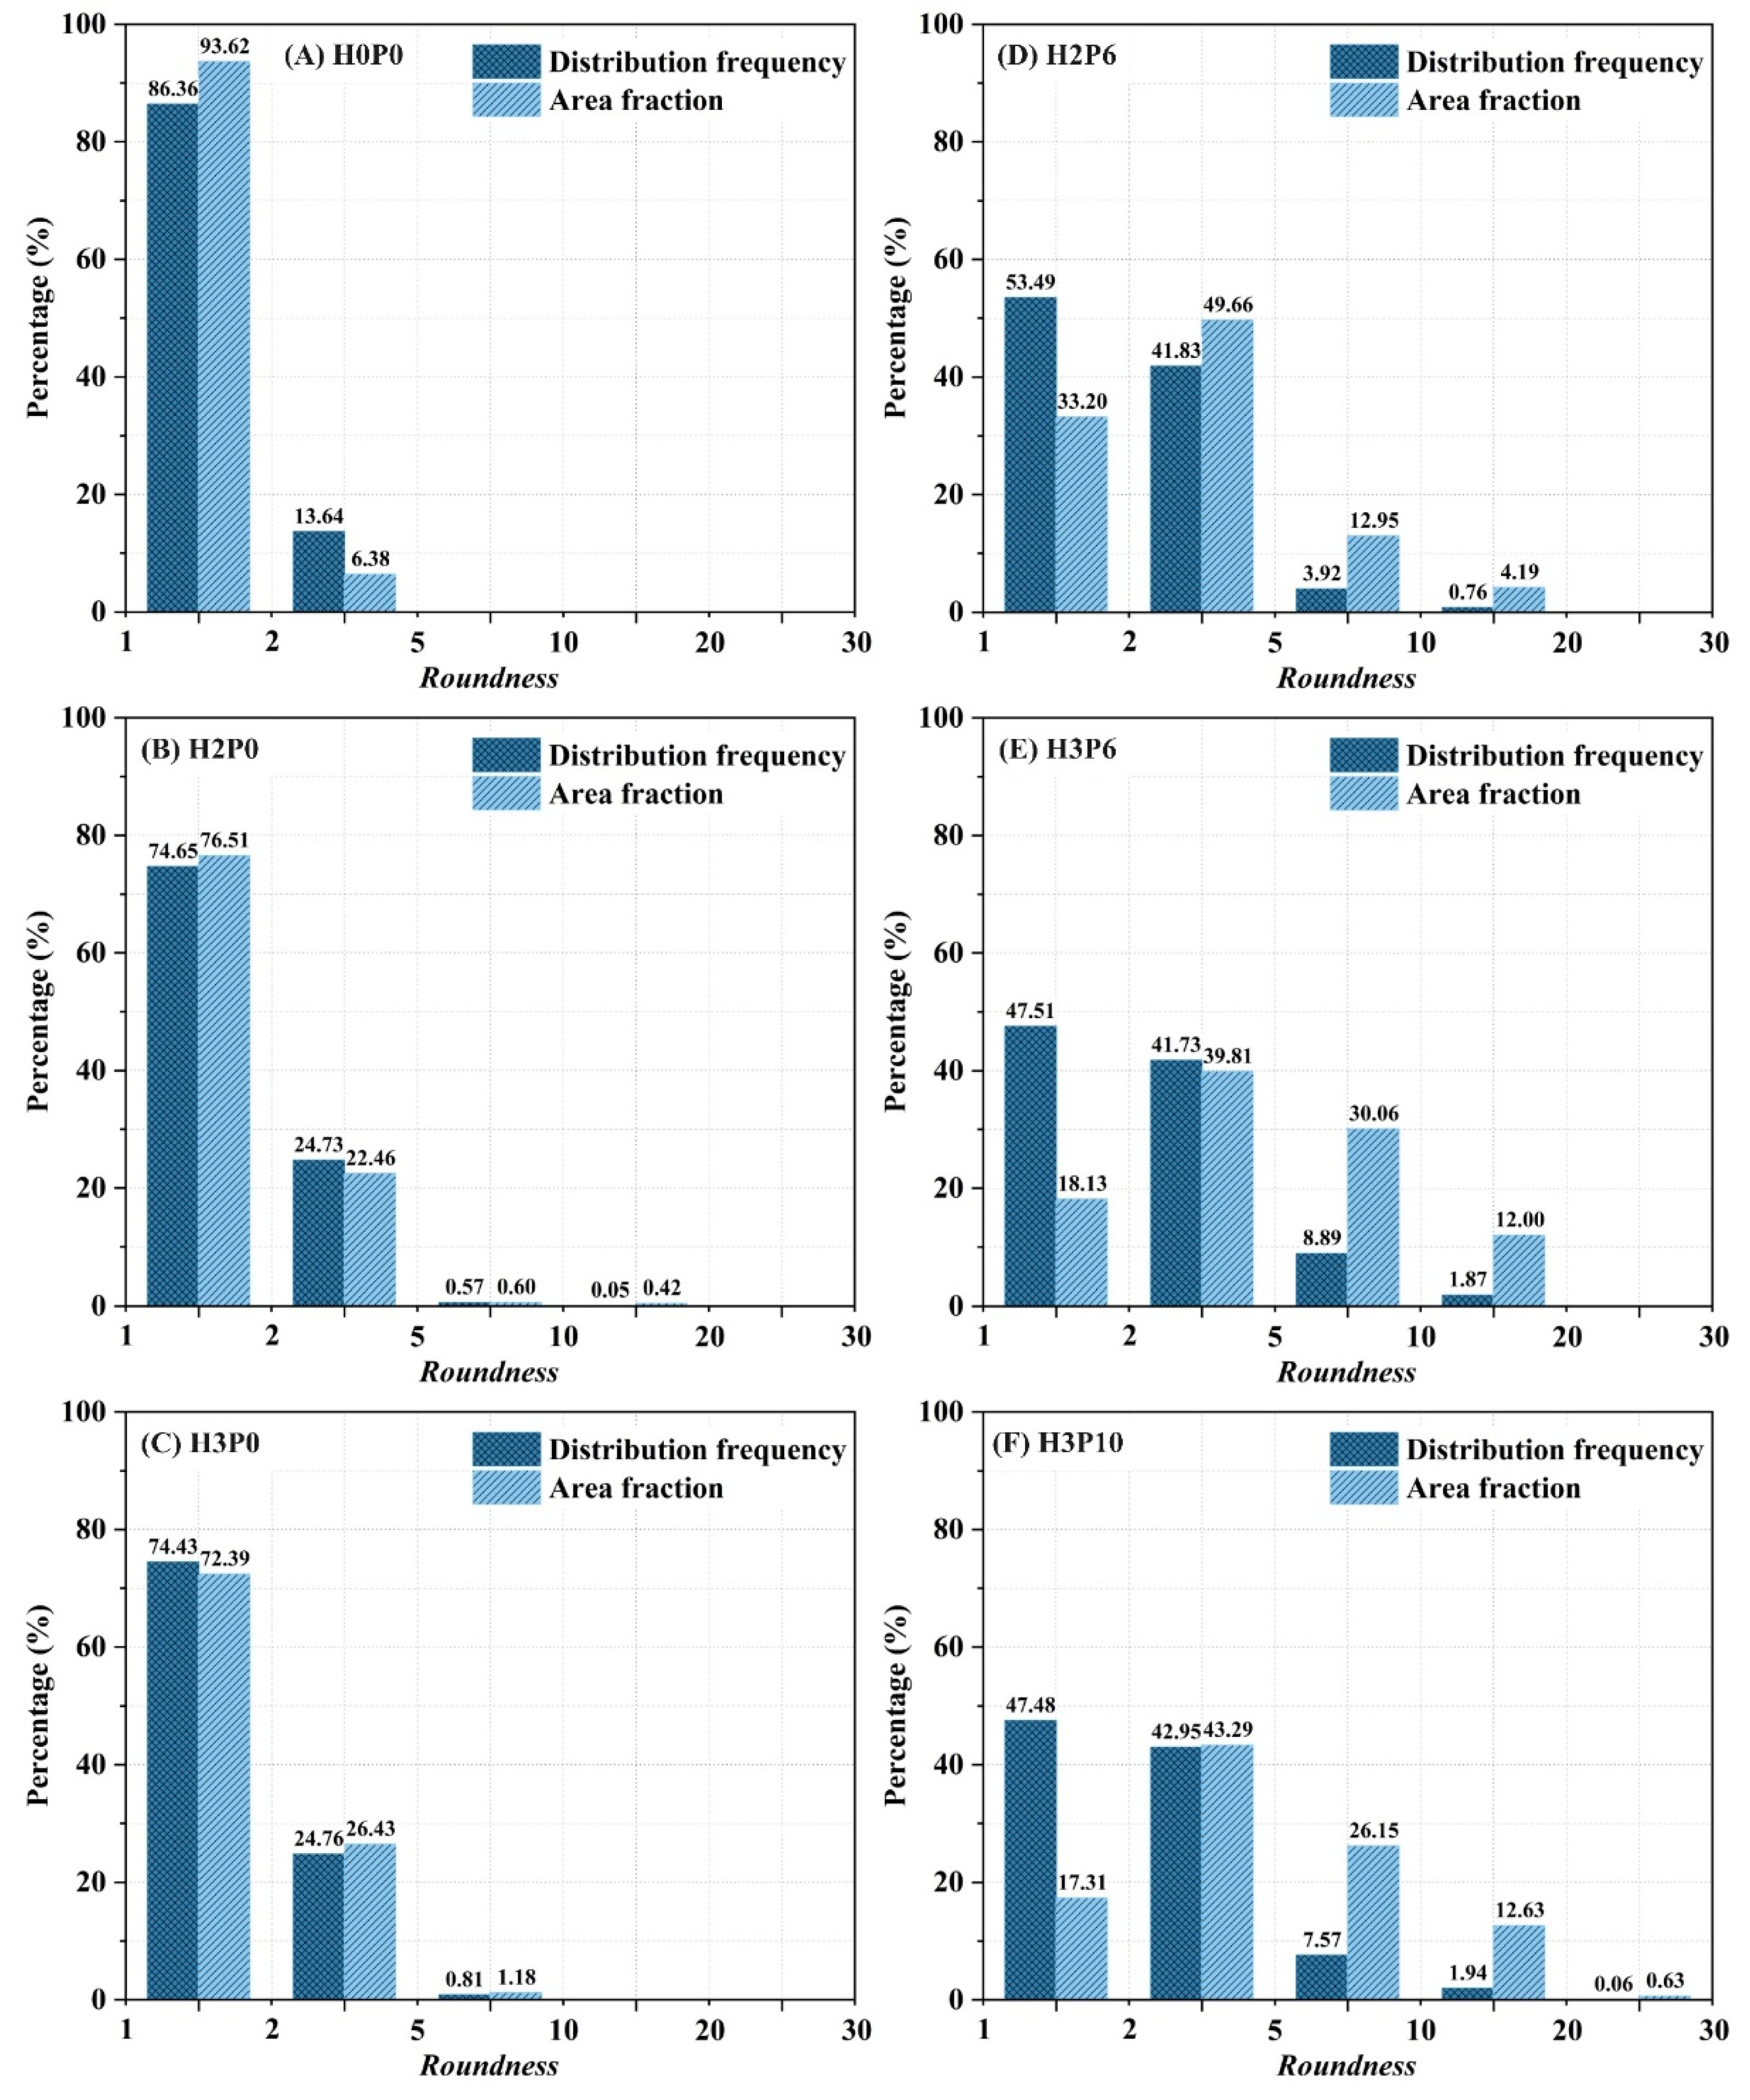
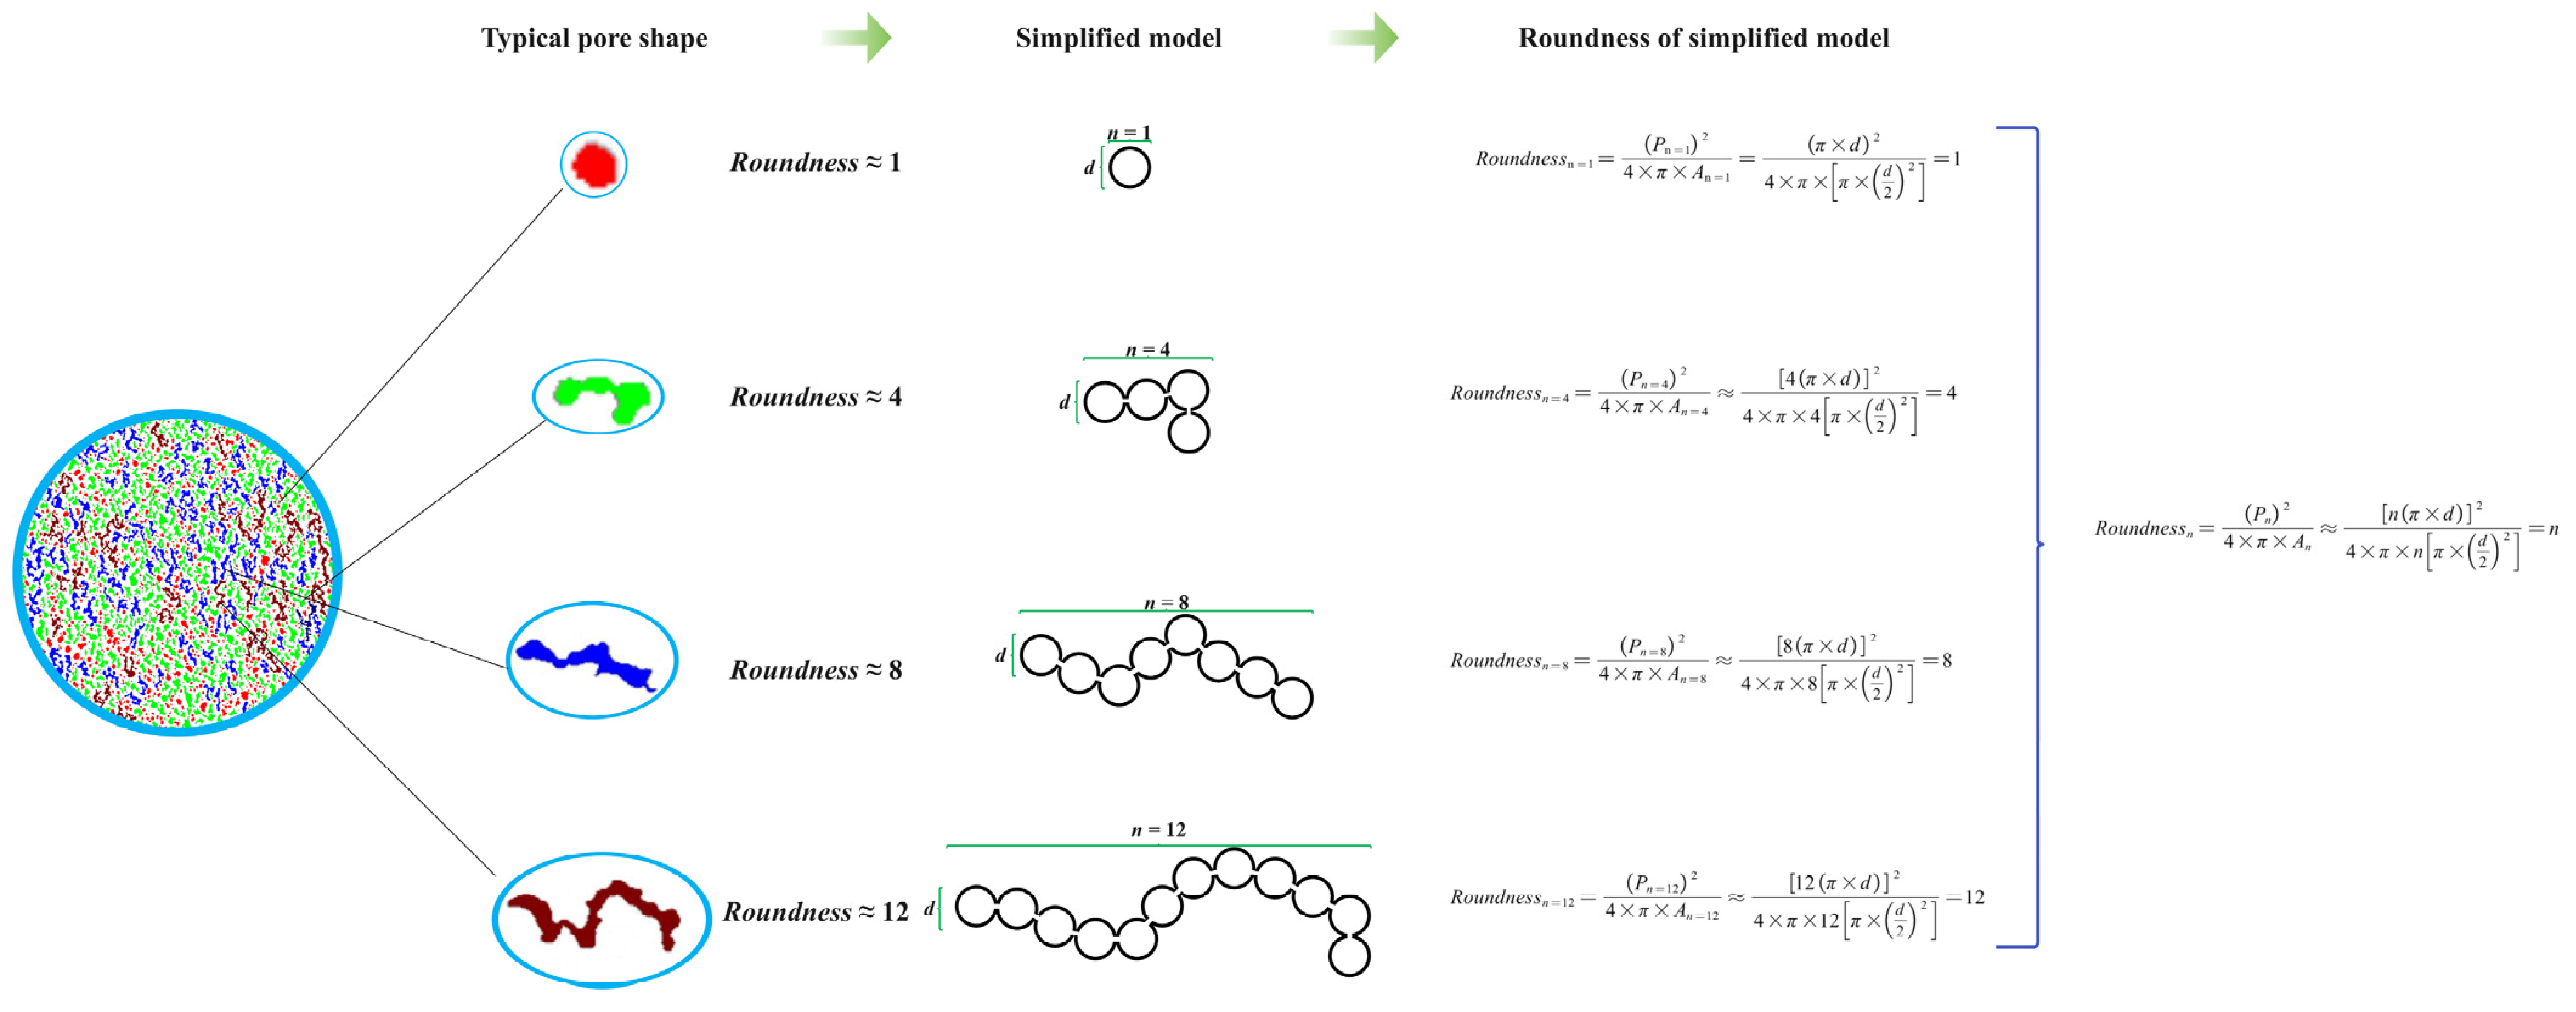
3.5. Pore Shape Evaluation
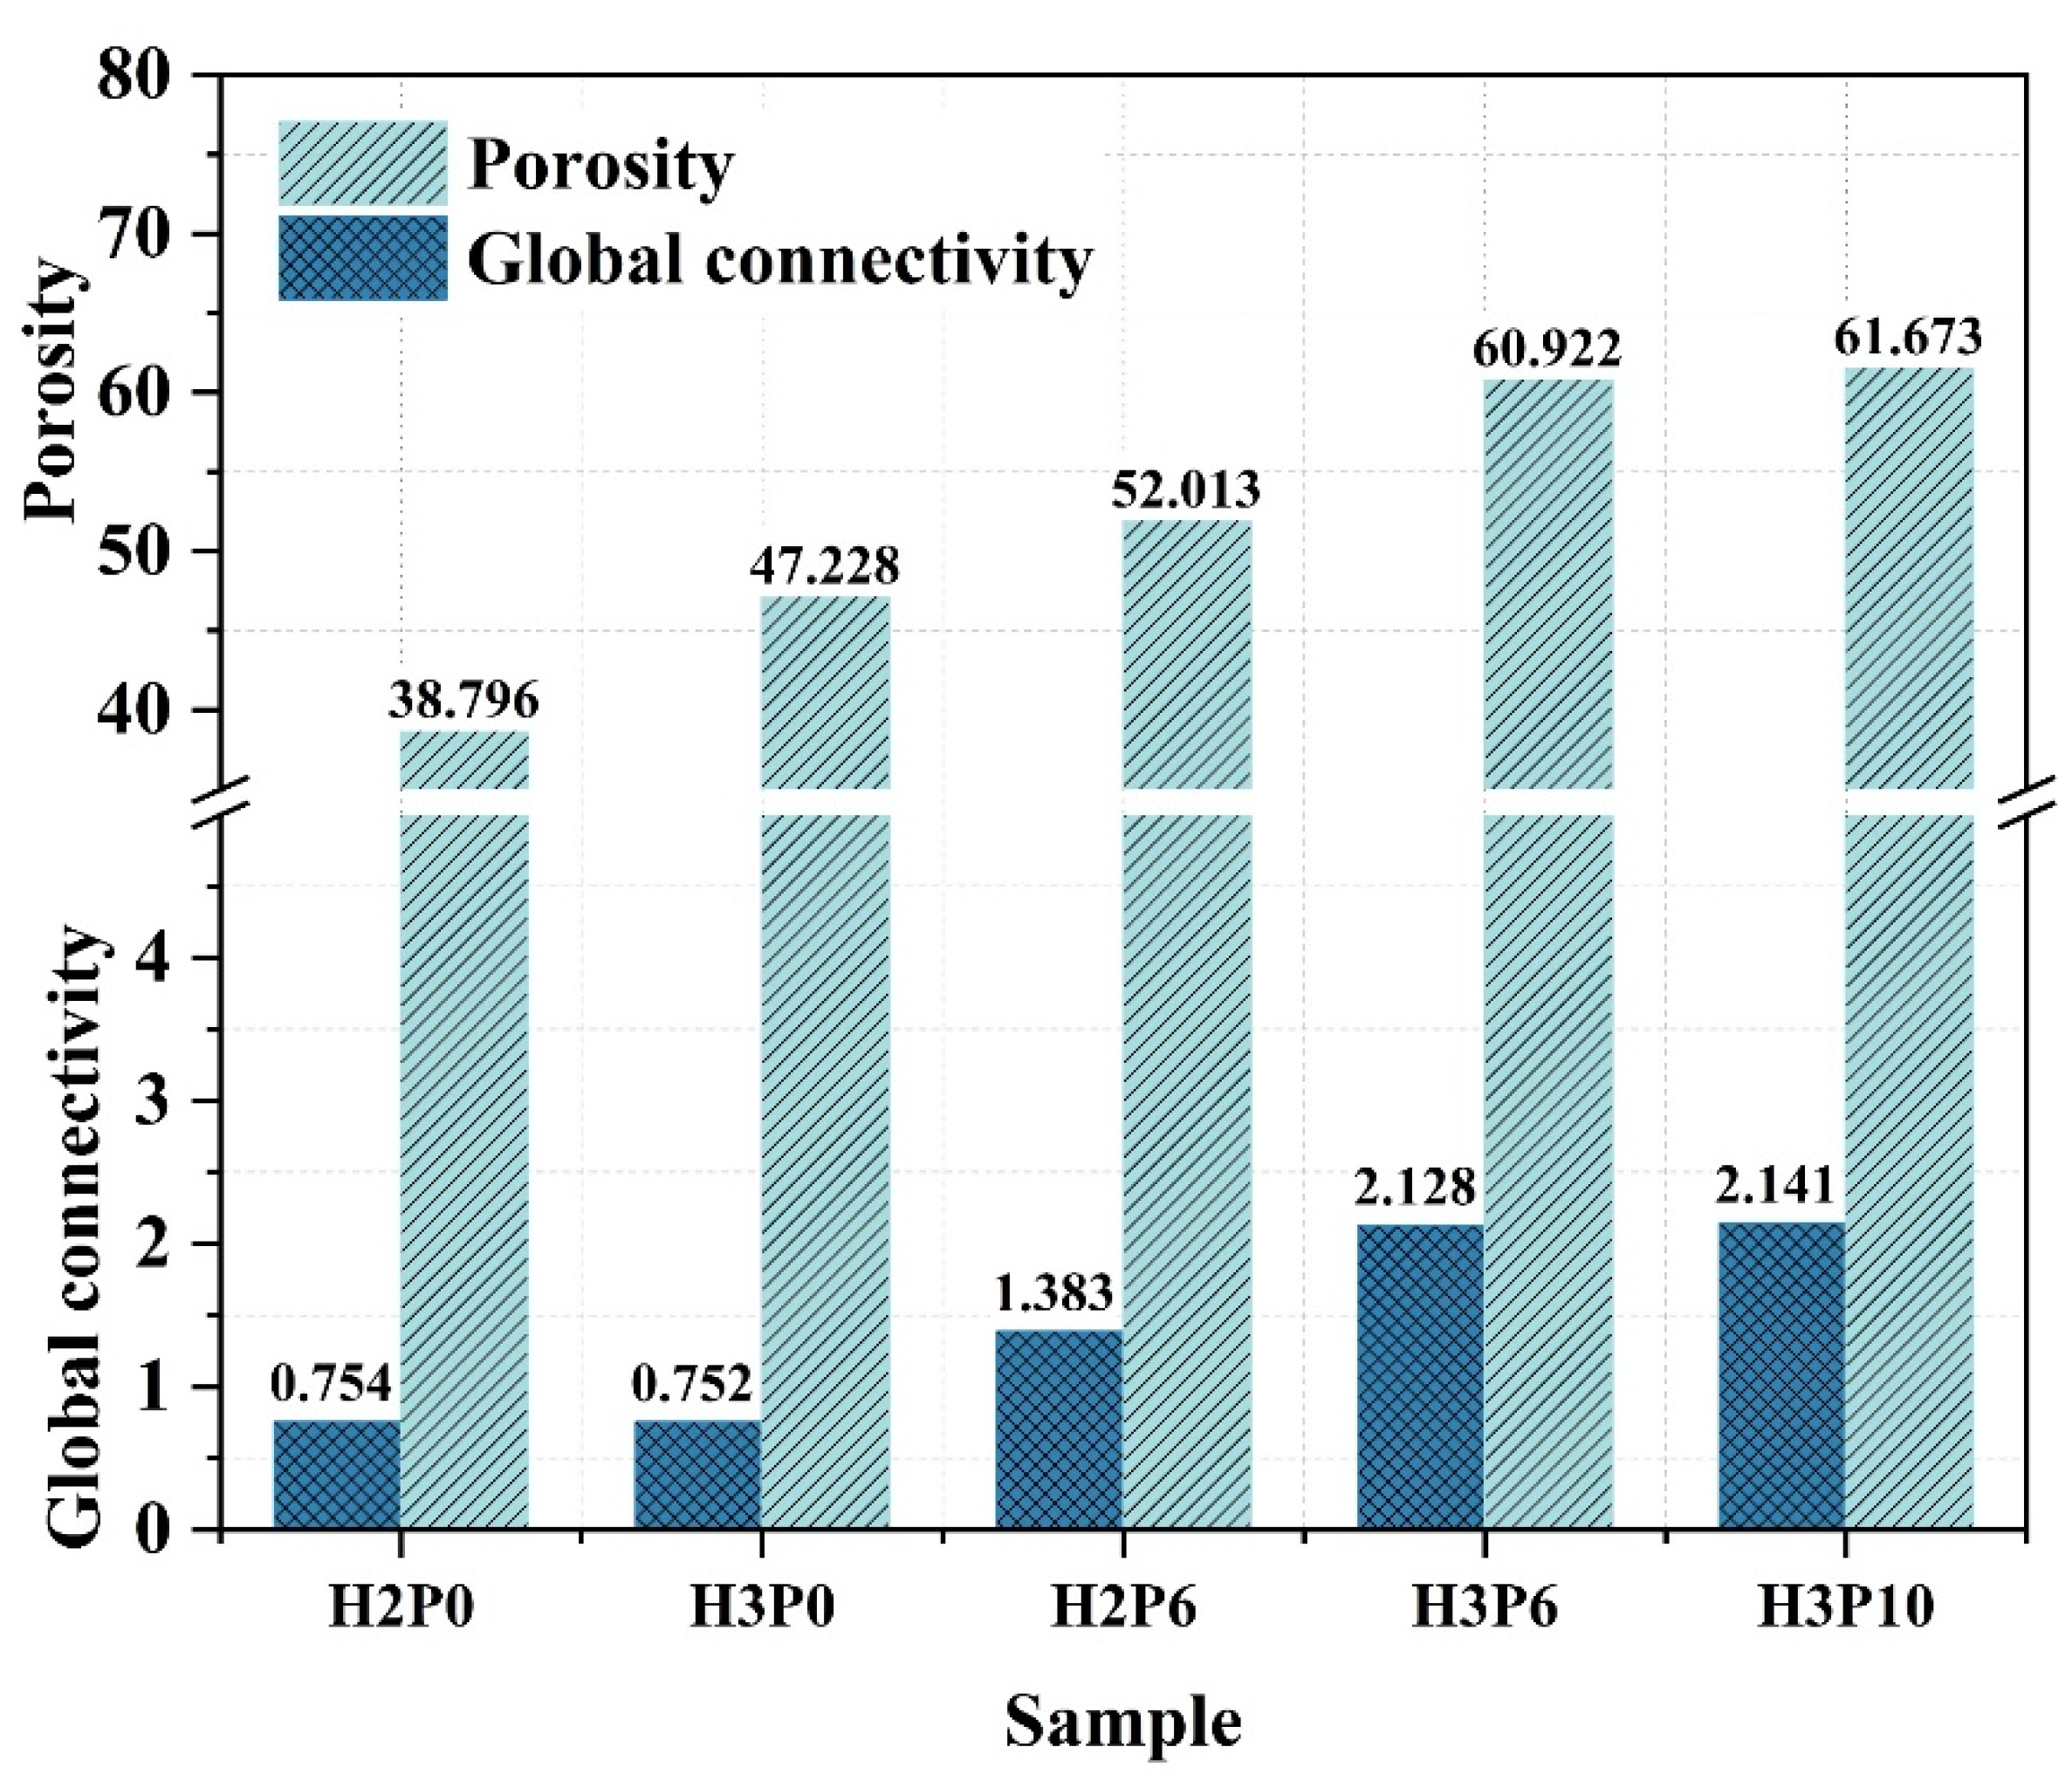
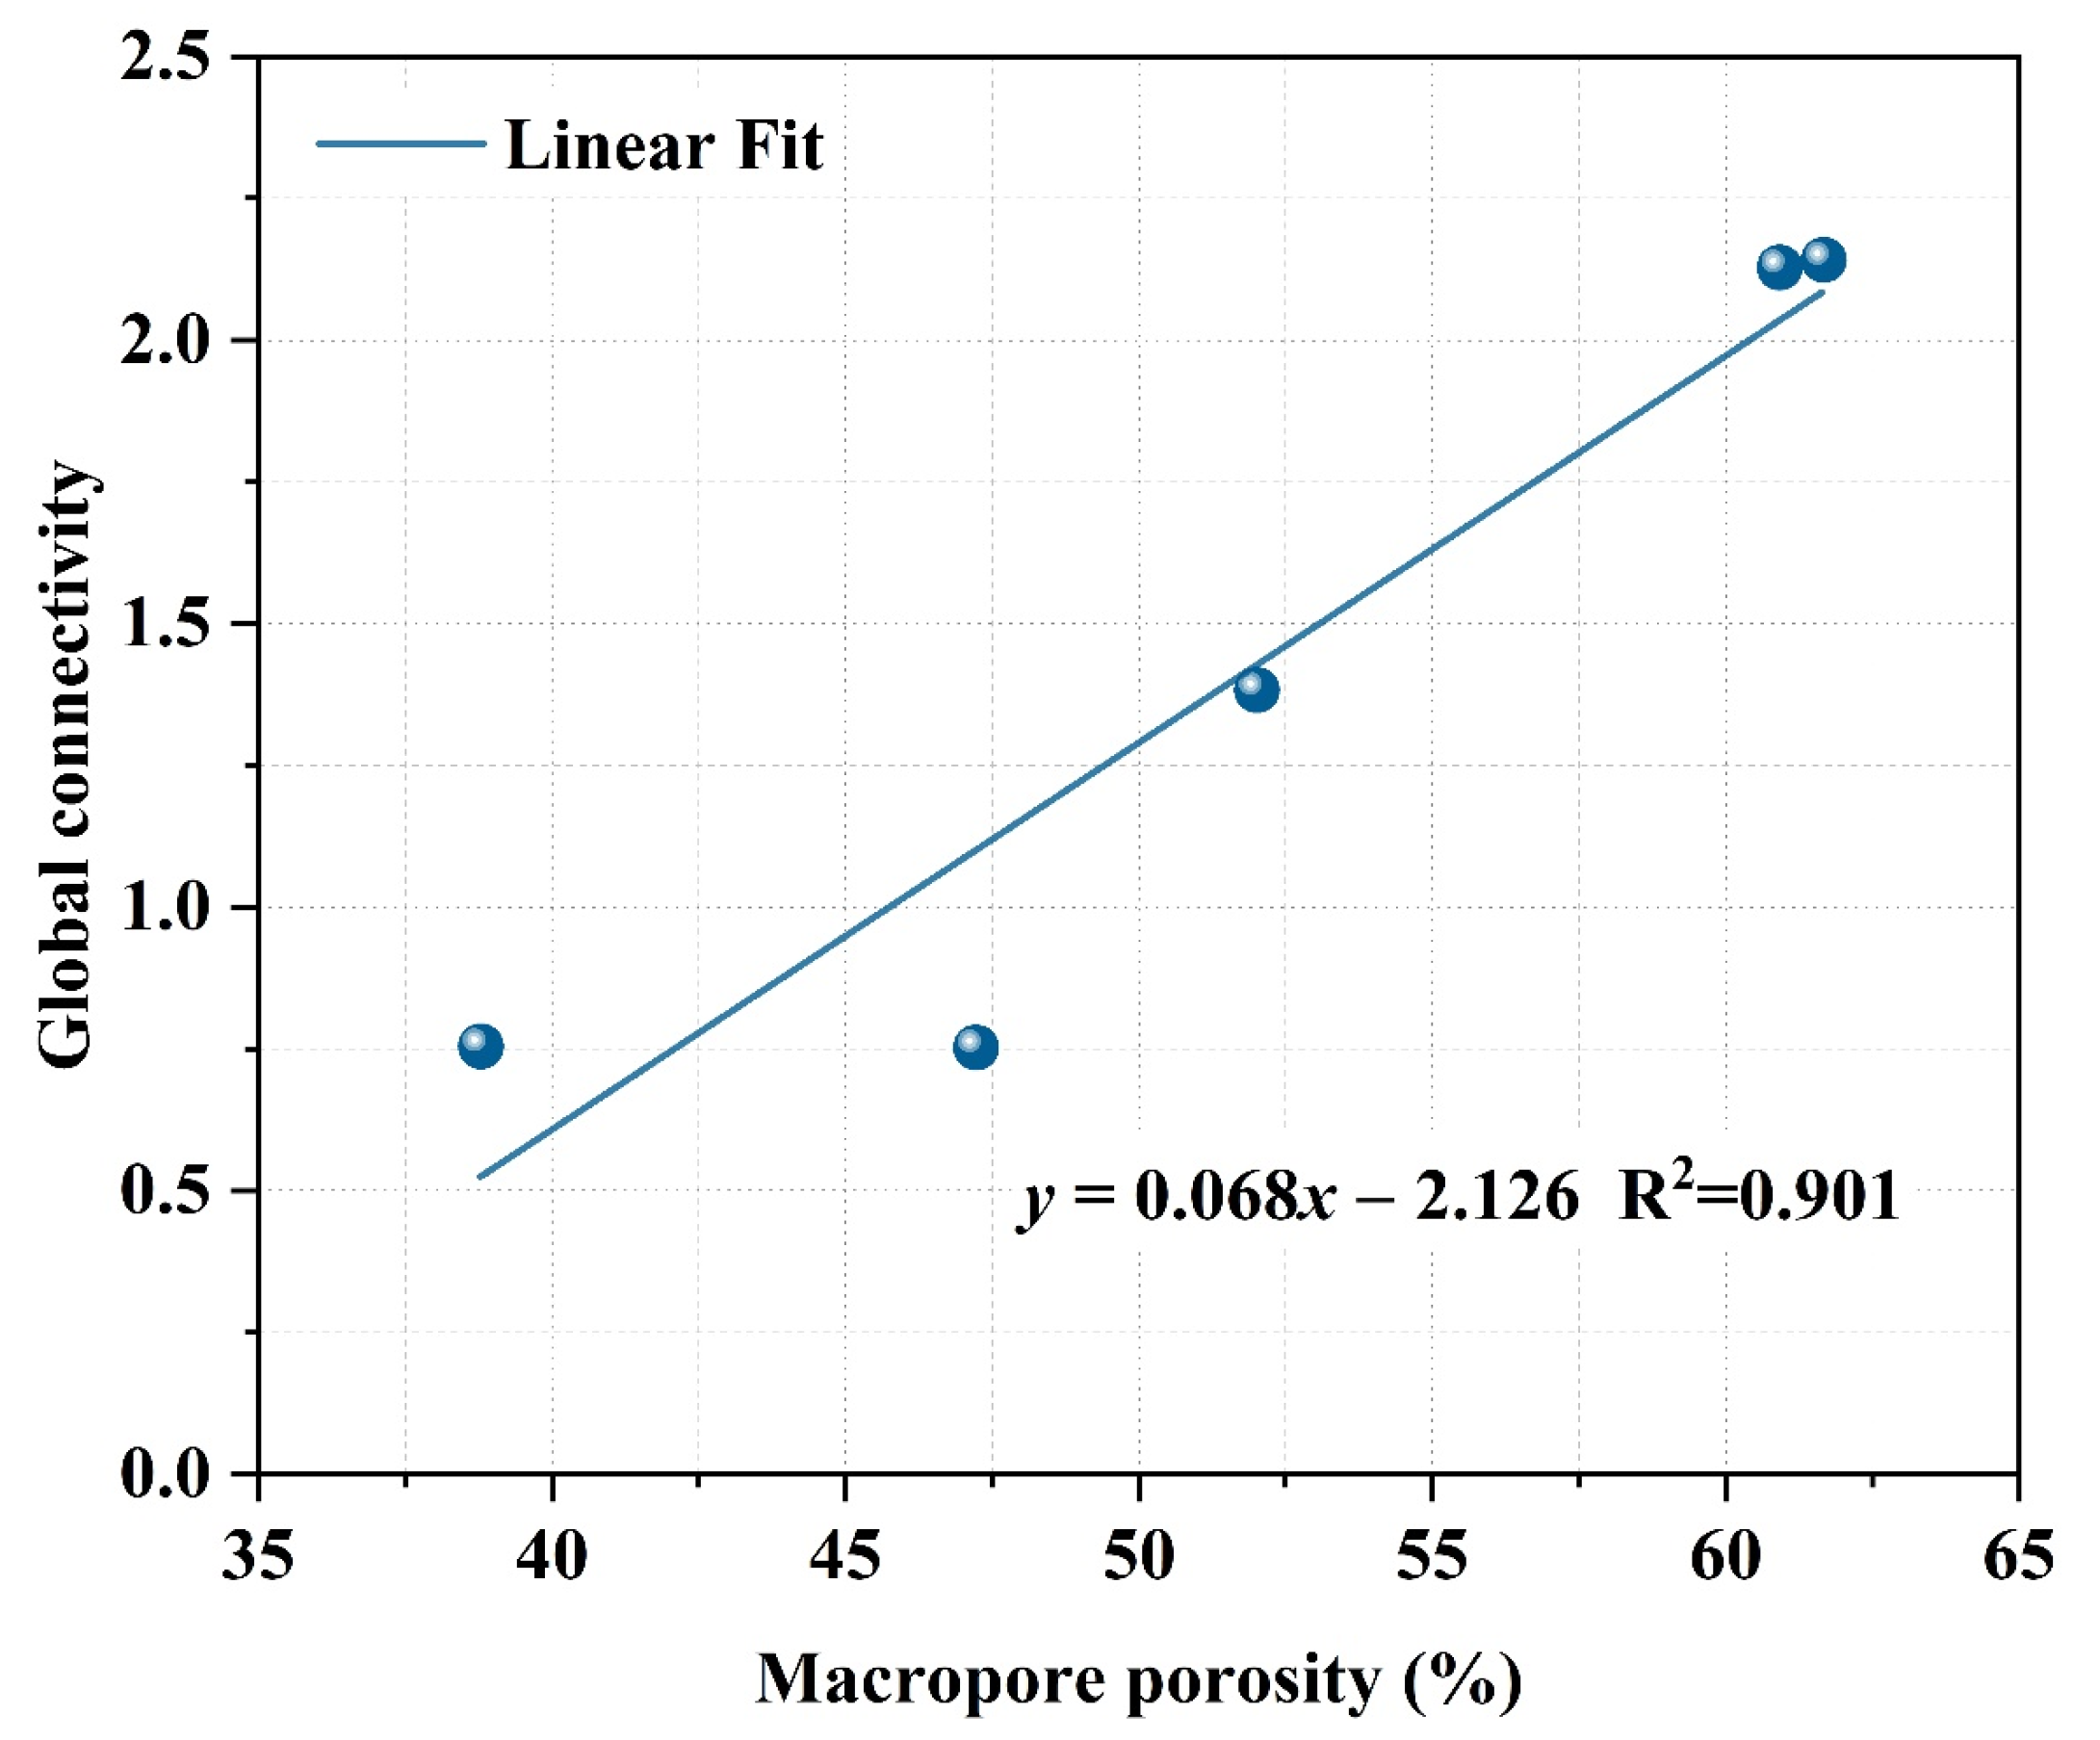
3.6. Connectivity of Pores
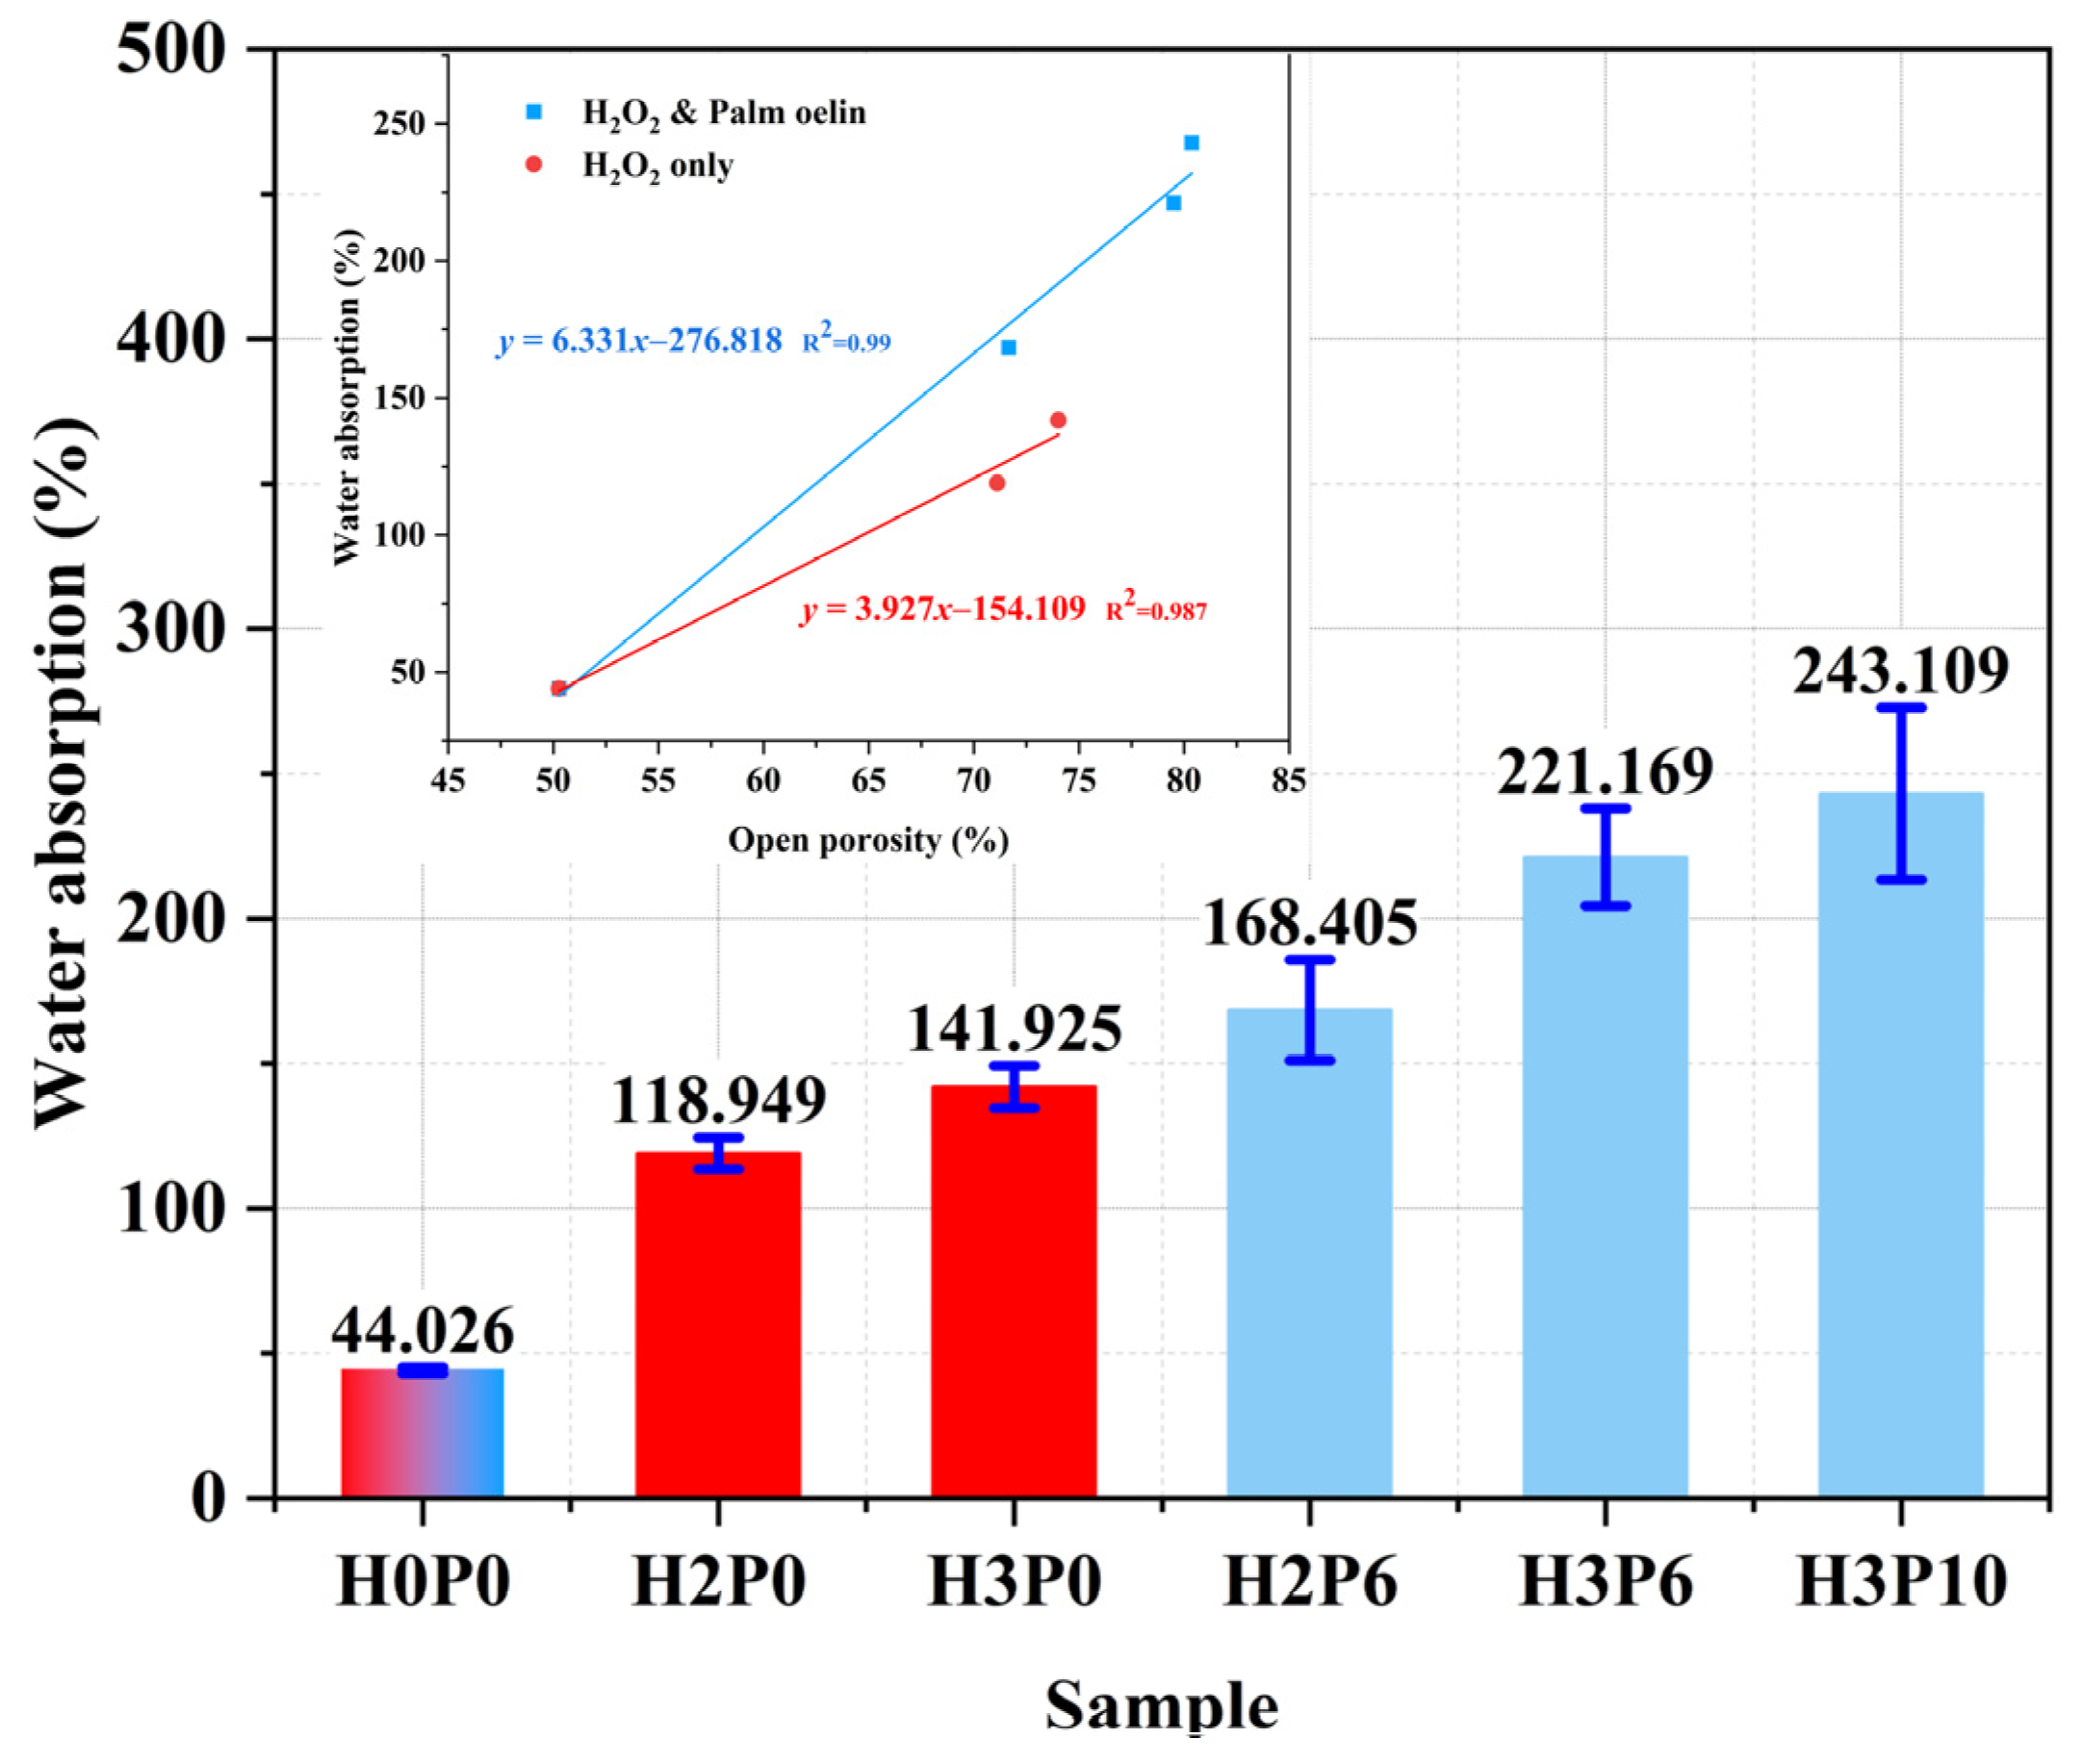
3.7. Water Absorption
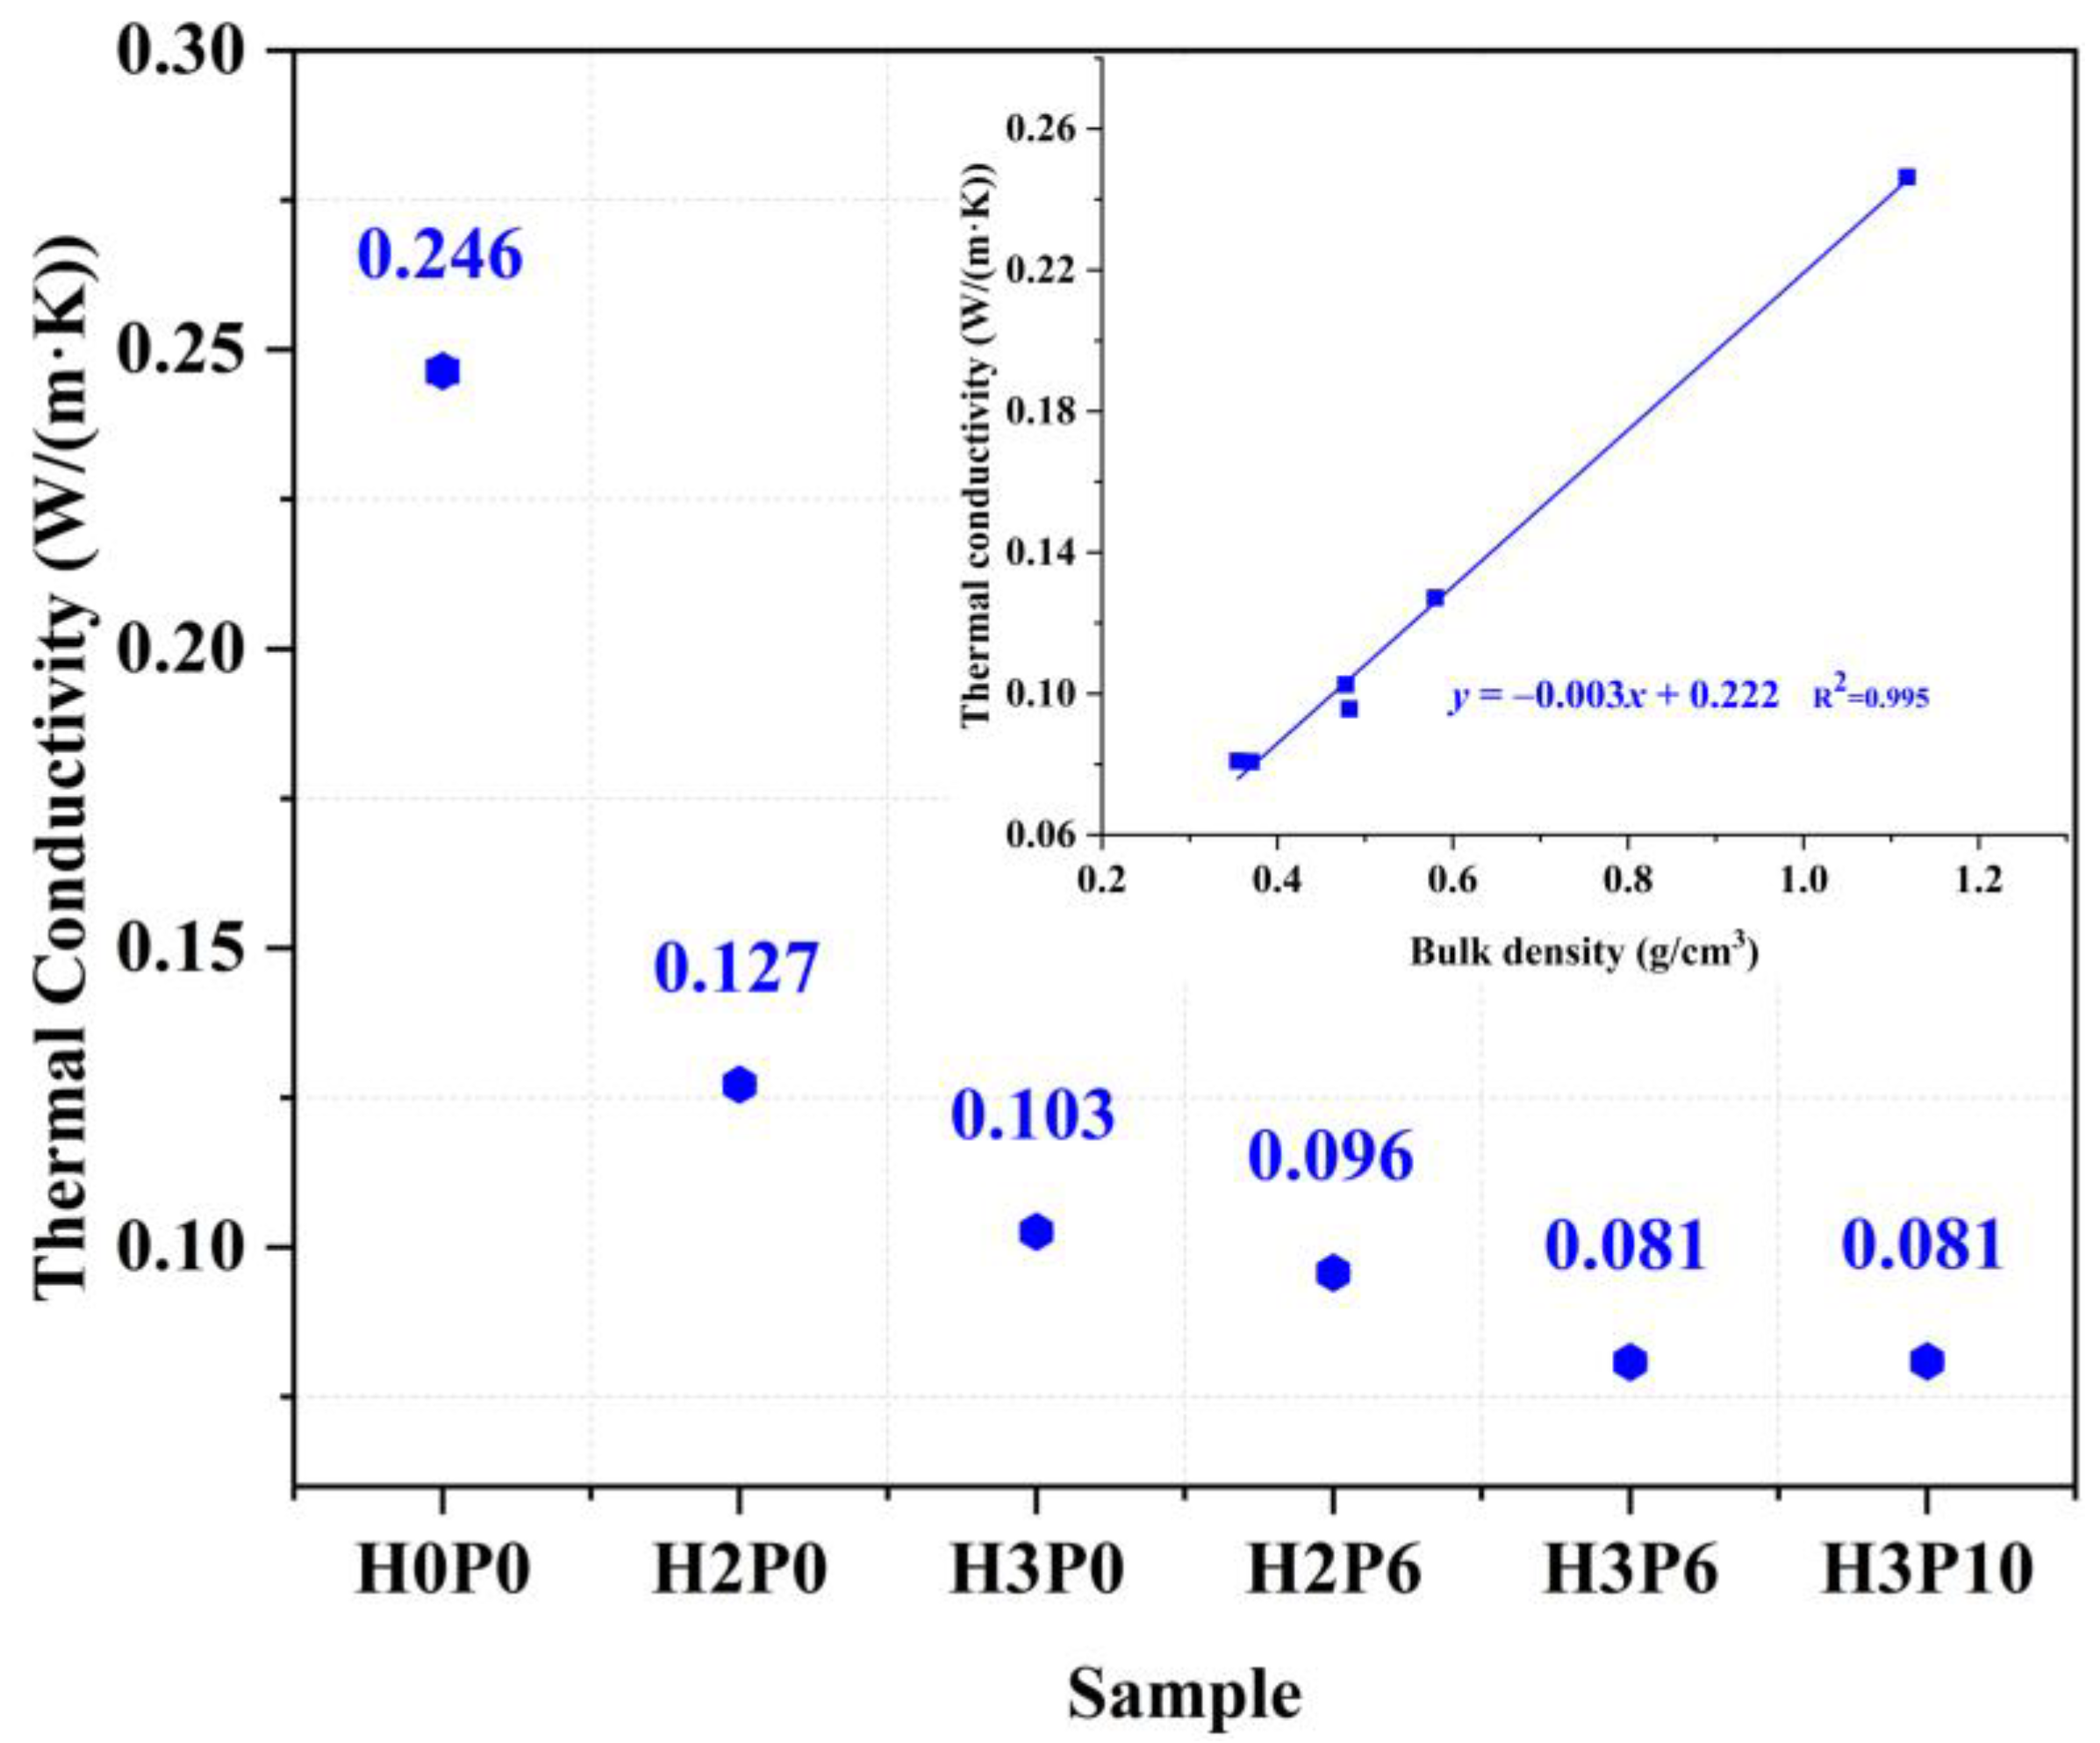
3.8. Thermal Conductivity
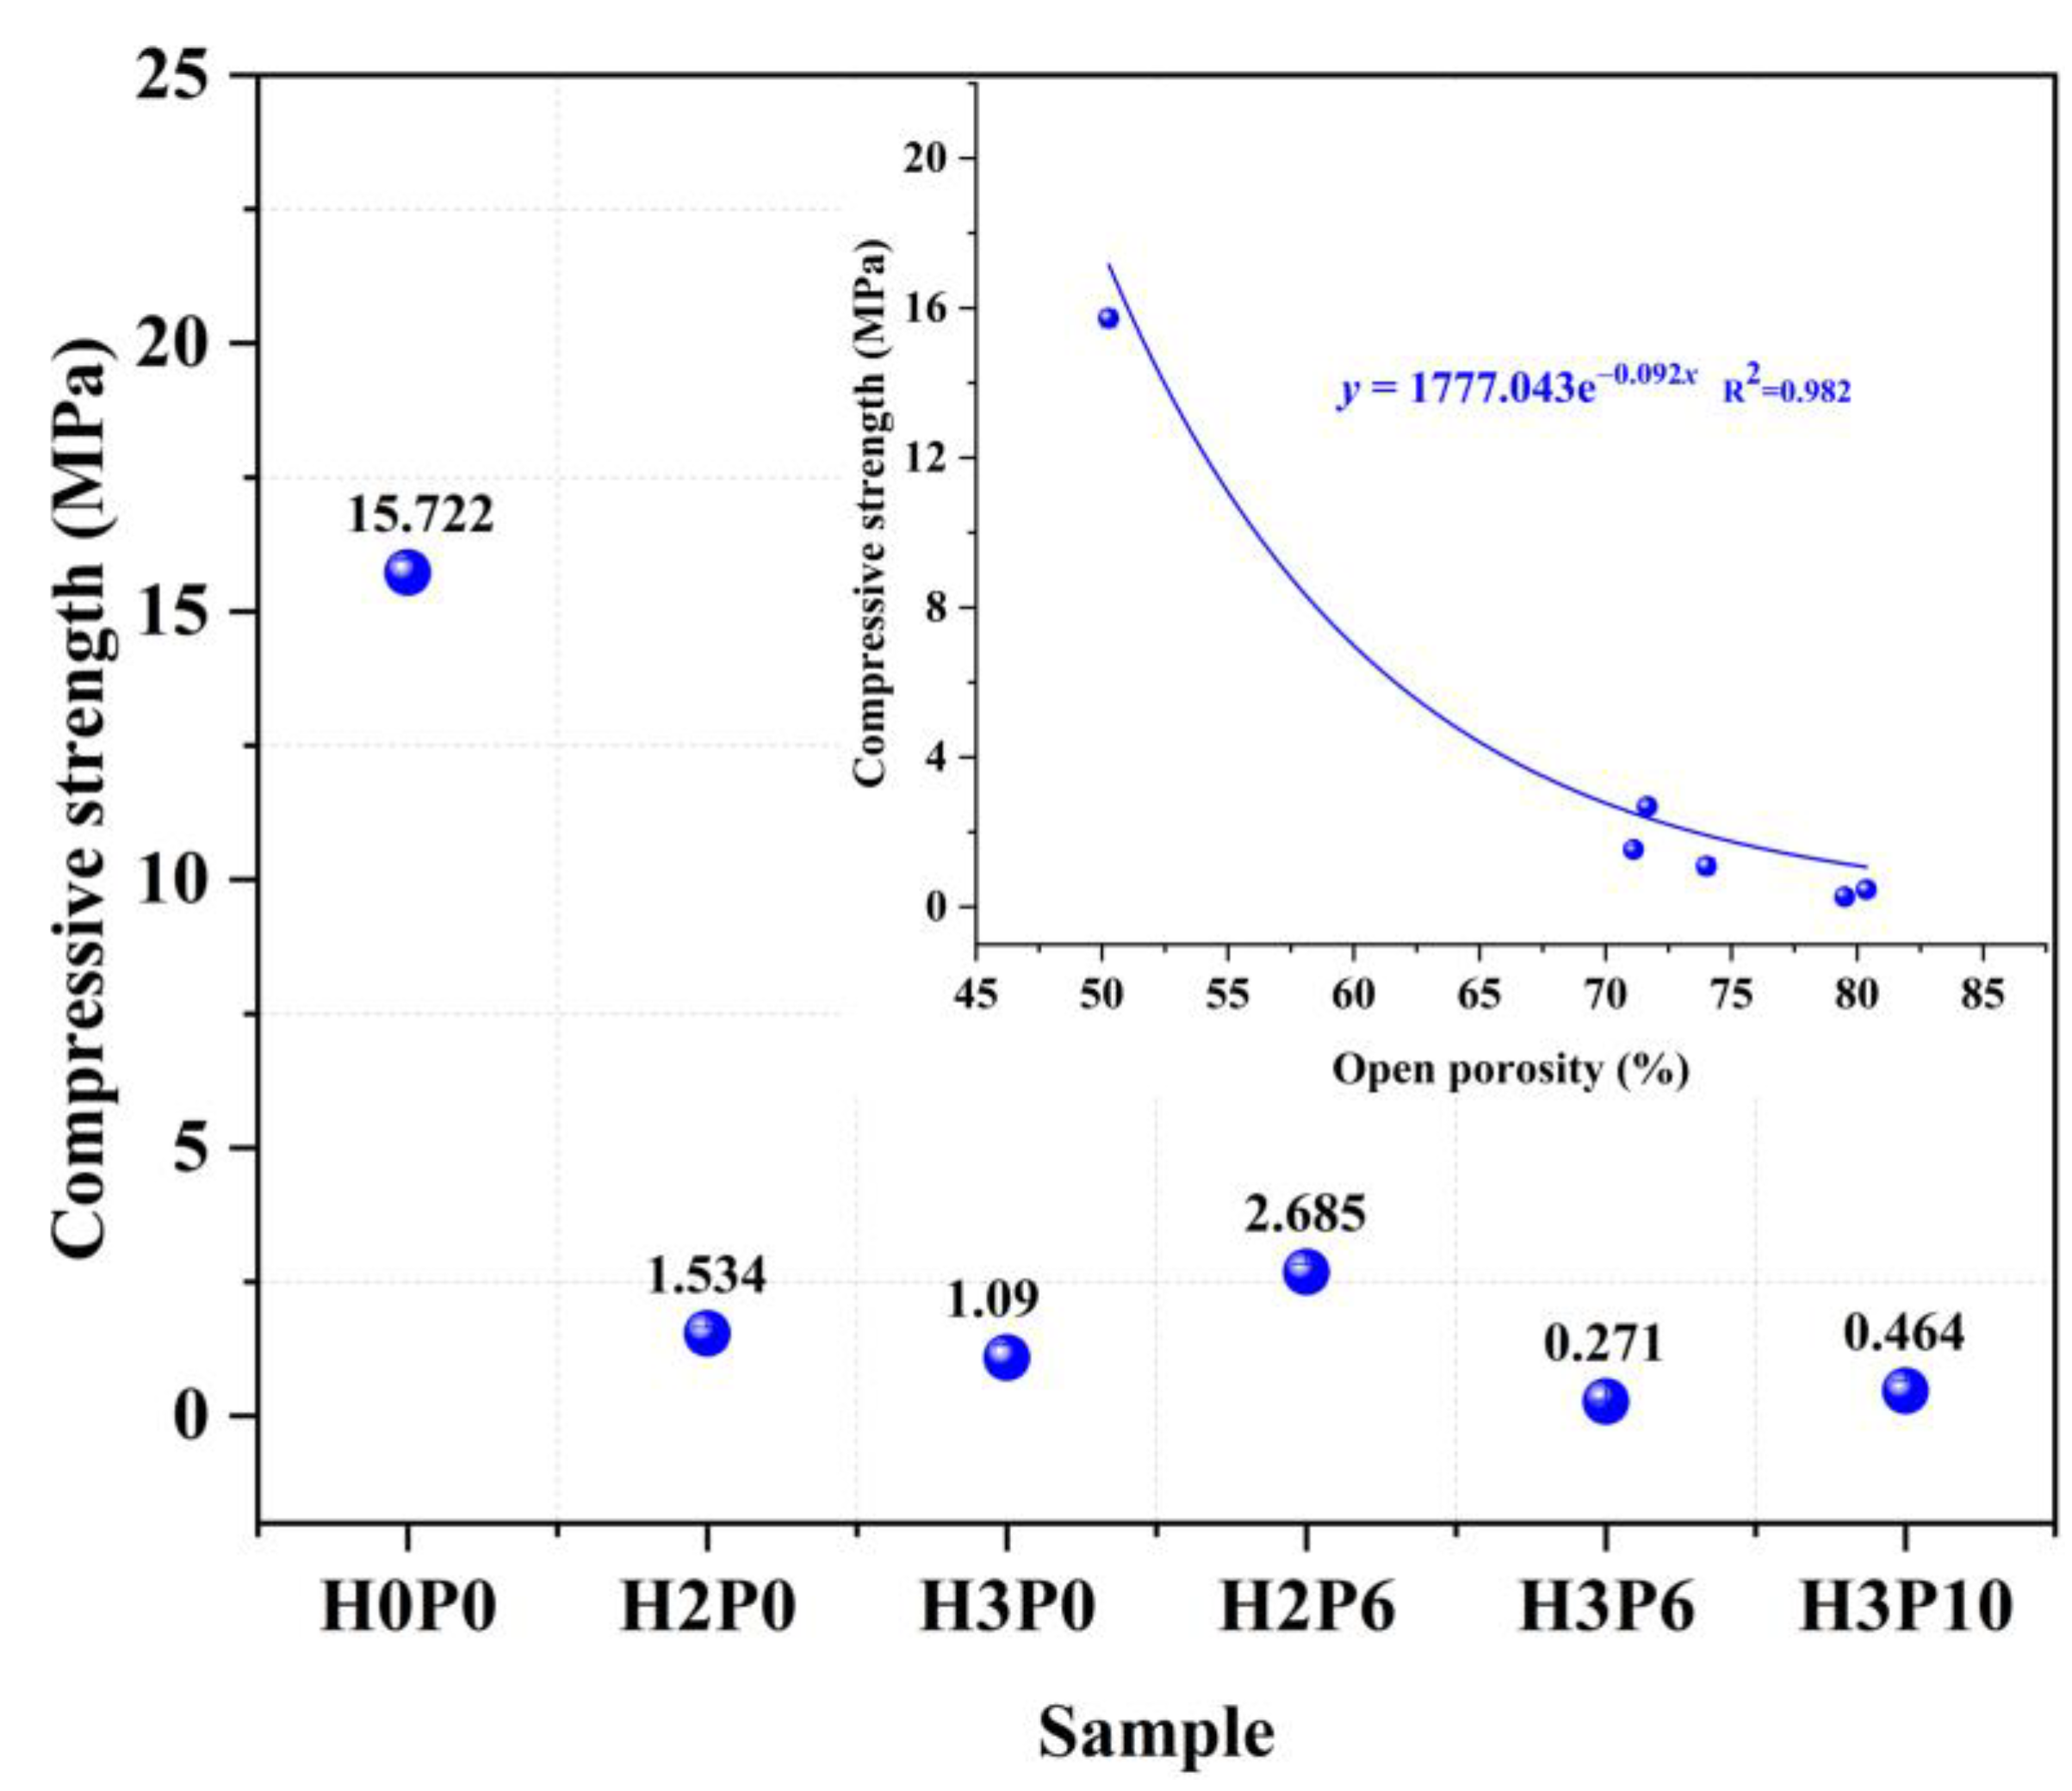
3.9. Compressive Strength
4. Conclusions
Author Contributions
Funding
Institutional Review Board Statement
Informed Consent Statement
Data Availability Statement
Acknowledgments
Conflicts of Interest
References
- Hassan, A.; Arif, M.; Shariq, M. Use of Geopolymer Concrete for a Cleaner and Sustainable Environment—A Review of Mechanical Properties and Microstructure. J. Clean. Prod. 2019, 223, 704–728. [Google Scholar] [CrossRef]
- Duan, P.; Yan, C.; Zhou, W.; Luo, W.; Shen, C. An Investigation of the Microstructure and Durability of a Fluidized Bed Fly Ash-Metakaolin Geopolymer after Heat and Acid Exposure. Mater. Des. 2015, 74, 125–137. [Google Scholar] [CrossRef]
- Dhasindrakrishna, K.; Pasupathy, K.; Ramakrishnan, S.; Sanjayan, J. Progress, Current Thinking and Challenges in Geopolymer Foam Concrete Technology. Cem. Concr. Compos. 2021, 116, 103886. [Google Scholar] [CrossRef]
- Zhang, Z.; Wang, H. The Pore Characteristics of Geopolymer Foam Concrete and Their Impact on the Compressive Strength and Modulus. Front. Mater. 2016, 3, 38. [Google Scholar] [CrossRef] [Green Version]
- Sornlar, W.; Wannagon, A.; Supothina, S. Stabilized Homogeneous Porous Structure and Pore Type Effects on the Properties of Lightweight Kaolinite-Based Geopolymers. J. Build. Eng. 2021, 44, 103273. [Google Scholar] [CrossRef]
- Jaya, N.A.; Yun-Ming, L.; Cheng-Yong, H.; Abdullah, M.M.A.B.; Hussin, K. Correlation between Pore Structure, Compressive Strength and Thermal Conductivity of Porous Metakaolin Geopolymer. Constr. Build. Mater. 2020, 247, 118641. [Google Scholar] [CrossRef]
- Liu, M.Y.J.; Alengaram, U.J.; Jumaat, M.Z.; Mo, K.H. Evaluation of Thermal Conductivity, Mechanical and Transport Properties of Lightweight Aggregate Foamed Geopolymer Concrete. Energy Build. 2014, 72, 238–245. [Google Scholar] [CrossRef]
- Krzywoń, R.; Dawczyński, S. Strength Parameters of Foamed Geopolymer Reinforced with Gfrp Mesh. Materials 2021, 14, 689. [Google Scholar] [CrossRef] [PubMed]
- Gao, H.; Liao, L.; Liu, H.; Mei, L.; Wang, Z.; Huang, D.; Lv, G.; Zhu, G.; Wang, C. Optimization of Thermal Insulation Performance of Porous Geopolymers under the Guidance of Thermal Conductivity Calculation. Ceram. Int. 2020, 46, 16537–16547. [Google Scholar] [CrossRef]
- Peng, X.; Shuai, Q.; Li, H.; Ding, Q.; Gu, Y.; Cheng, C.; Xu, Z. Fabrication and Fireproofing Performance of the Coal Fly Ash-Metakaolin-Based Geopolymer Foams. Materials 2020, 13, 1750. [Google Scholar] [CrossRef] [Green Version]
- Peng, X.; Li, H.; Shuai, Q.; Wang, L. Fire Resistance of Alkali Activated Geopolymer Foams Produced from Metakaolin and Na2O2. Materials 2020, 13, 535. [Google Scholar] [CrossRef] [PubMed] [Green Version]
- Gao, H.; Liu, H.; Liao, L.; Mei, L.; Zhang, F.; Zhang, L.; Li, S.; Lv, G. A Bifunctional Hierarchical Porous Kaolinite Geopolymer with Good Performance in Thermal and Sound Insulation. Constr. Build. Mater. 2020, 251, 118888. [Google Scholar] [CrossRef]
- Liu, X.; Hu, C.; Chu, L. Microstructure, Compressive Strength and Sound Insulation Property of Fly Ash-Based Geopolymeric Foams with Silica Fume as Foaming Agent. Materials 2020, 13, 3215. [Google Scholar] [CrossRef] [PubMed]
- Ge, Y.; Cui, X.; Kong, Y.; Li, Z.; He, Y.; Zhou, Q. Porous Geopolymeric Spheres for Removal of Cu(II) from Aqueous Solution: Synthesis and Evaluation. J. Hazard. Mater. 2015, 283, 244–251. [Google Scholar] [CrossRef] [PubMed]
- Humberto Tommasini Vieira Ramos, F.J.; Vieira Marques, M.d.F.; de Oliveira Aguiar, V.; Jorge, F.E. Performance of Geopolymer Foams of Blast Furnace Slag Covered with Poly(Lactic Acid) for Wastewater Treatment. Ceram. Int. 2022, 48, 732–743. [Google Scholar] [CrossRef]
- Roviello, G.; Chianese, E.; Ferone, C.; Ricciotti, L.; Roviello, V.; Cioff, R.; Tarallo, O. Hybrid Geopolymeric Foams for the Removal of Metallic Ions from Aqueous Waste Solutions. Materials 2019, 12, 4091. [Google Scholar] [CrossRef] [Green Version]
- Reeb, C.; Pierlot, C.; Davy, C.; Lambertin, D. Incorporation of Organic Liquids into Geopolymer Materials—A Review of Processing, Properties and Applications. Ceram. Int. 2021, 47, 7369–7385. [Google Scholar] [CrossRef]
- Gasca-Tirado, J.R.; Manzano-Ramírez, A.; Velázquez-Castillo, R.R.; Gómez-Luna, B.E.; Nava-Mendoza, R.F.; López-Romero, J.M.; Apátiga-Castro, L.M.; Rivera-Muñoz, E.M. Porous Geopolymer as a Possible Template for a Phase Change Material. Mater. Chem. Phys. 2019, 236, 121785. [Google Scholar] [CrossRef]
- Hassan, A.; Rashid, Y.; Mourad, A.H.I.; Ismail, N.; Laghari, M.S. Thermal and Structural Characterization of Geopolymer-Coated Polyurethane Foam-Phase Change Material Capsules/Geopolymer Concrete Composites. Materials 2019, 12, 796. [Google Scholar] [CrossRef] [Green Version]
- Bai, C.; Colombo, P. Processing, Properties and Applications of Highly Porous Geopolymers: A Review. Ceram. Int. 2018, 44, 16103–16118. [Google Scholar] [CrossRef]
- Zhang, Z.; Provis, J.L.; Reid, A.; Wang, H. Geopolymer Foam Concrete: An Emerging Material for Sustainable Construction. Constr. Build. Mater. 2014, 56, 113–127. [Google Scholar] [CrossRef]
- Hajimohammadi, A.; Ngo, T.; Mendis, P. How Does Aluminium Foaming Agent Impact the Geopolymer Formation Mechanism? Cem. Concr. Compos. 2017, 80, 277–286. [Google Scholar] [CrossRef]
- Anggarini, U.; Pratapa, S.; Purnomo, V.; Sukmana, N.C. A Comparative Study of the Utilization of Synthetic Foaming Agent and Aluminum Powder as Pore-Forming Agents in Lightweight Geopolymer Synthesis. Open Chem. 2019, 17, 629–638. [Google Scholar] [CrossRef]
- Kioupis, D.; Zisimopoulou, A.; Tsivilis, S.; Kakali, G. Development of Porous Geopolymers Foamed by Aluminum and Zinc Powders. Ceram. Int. 2021, 47, 26280–26292. [Google Scholar] [CrossRef]
- Prud’homme, E.; Michaud, P.; Joussein, E.; Peyratout, C.; Smith, A.; Arrii-Clacens, S.; Clacens, J.M.; Rossignol, S. Silica Fume as Porogent Agent in Geo-Materials at Low Temperature. J. Eur. Ceram. Soc. 2010, 30, 1641–1648. [Google Scholar] [CrossRef]
- Hajimohammadi, A.; Ngo, T.; Mendis, P.; Nguyen, T.; Kashani, A.; van Deventer, J.S.J. Pore Characteristics in One-Part Mix Geopolymers Foamed by H2O2: The Impact of Mix Design. Mater. Des. 2017, 130, 381–3914. [Google Scholar] [CrossRef]
- Cilla, M.S.; de Mello Innocentini, M.D.; Morelli, M.R.; Colombo, P. Geopolymer Foams Obtained by the Saponification/Peroxide/Gelcasting Combined Route Using Different Soap Foam Precursors. J. Am. Ceram. Soc. 2017, 100, 3440–3450. [Google Scholar] [CrossRef]
- Ji, Z.; Su, L.; Pei, Y. Characterization and Adsorption Performance of Waste-Based Porous Open-Cell Geopolymer with One-Pot Preparation. Ceram. Int. 2021, 47, 12153–12162. [Google Scholar] [CrossRef]
- Hajimohammadi, A.; Ngo, T.; Mendis, P. Enhancing the Strength of Pre-Made Foams for Foam Concrete Applications. Cem. Concr. Compos. 2018, 87, 164–171. [Google Scholar] [CrossRef]
- Strozi Cilla, M.; Colombo, P.; Raymundo Morelli, M. Geopolymer Foams by Gelcasting. Ceram. Int. 2014, 40, 5723–5730. [Google Scholar] [CrossRef]
- Bai, C.; Ni, T.; Wang, Q.; Li, H.; Colombo, P. Porosity, Mechanical and Insulating Properties of Geopolymer Foams Using Vegetable Oil as the Stabilizing Agent. J. Eur. Ceram. Soc. 2018, 38, 799–805. [Google Scholar] [CrossRef]
- Bai, C.; Colombo, P. High-Porosity Geopolymer Membrane Supports by Peroxide Route with the Addition of Egg White as Surfactant. Ceram. Int. 2017, 43, 2267–2273. [Google Scholar] [CrossRef]
- Zhang, X.; Bai, C.; Qiao, Y.; Wang, X.; Jia, D.; Li, H.; Colombo, P. Porous Geopolymer Composites: A Review. Compos. Part A Appl. S. 2021, 150, 106629. [Google Scholar] [CrossRef]
- Patterson, H.B.W. Hydrogenation of Fats and Oils: Theory and Practice, 2nd ed.; Academic Press and AOCS Press: Urbana, IL, USA, 2011; pp. 189–278. [Google Scholar]
- Hlaváček, P.; Šmilauer, V.; Škvára, F.; Kopecký, L.; Šulc, R. Inorganic Foams Made from Alkali-Activated Fly Ash: Mechanical, Chemical and Physical Properties. J. Eur. Ceram. Soc. 2015, 35, 703–709. [Google Scholar] [CrossRef]
- Papa, E.; Medri, V.; Kpogbemabou, D.; Morinière, V.; Laumonier, J.; Vaccari, A.; Rossignol, S. Porosity and Insulating Properties of Silica-Fume Based Foams. Energy Build. 2016, 131, 223–232. [Google Scholar] [CrossRef]
- Xu, F.; Gu, G.; Zhang, W.; Wang, H.; Huang, X.; Zhu, J. Pore Structure Analysis and Properties Evaluations of Fly Ash-Based Geopolymer Foams by Chemical Foaming Method. Ceram. Int. 2018, 44, 19989–19997. [Google Scholar] [CrossRef]
- Saito, Y.; Matsuo, S.; Kanai, T.; Toishi, A.; Uchida, A.; Yamazaki, Y.; Matsushita, Y.; Aoki, H.; Nomura, S.; Hayashizaki, H.; et al. Effect of Random Pore Shape, Arrangement and Nonadhesion Grain Boundaries on Coke Strength. ISIJ Int. 2014, 54, 2519–2526. [Google Scholar] [CrossRef] [Green Version]
- Chen, X.; Niu, Z.; Wang, J.; Zhu, G.R.; Zhou, M. Effect of Sodium Polyacrylate on Mechanical Properties and Microstructure of Metakaolin-Based Geopolymer with Different SiO2/Al2O3 Ratio. Ceram. Int. 2018, 44, 18173–18180. [Google Scholar] [CrossRef]
- Yan, S.; Feng, X.; Yang, Y.; Xing, P. Effects of High-Temperature Exposure on Properties of Lightweight Geopolymer Foams Incorporating Diatomite Powders. Int. J. Appl. Ceram. Technol. 2021, 18, 817–829. [Google Scholar] [CrossRef]
- Rohman, A.; Man, Y.C. Determination of Sodium Fatty Acid in Soap Formulation Using Fourier Transform Infrared (FTIR) Spectroscopy and Multivariate Calibrations. J. Surfactants Deterg. 2011, 14, 9–14. [Google Scholar] [CrossRef]
- Cilla, M.S.; Morelli, M.R.; Colombo, P. Open Cell Geopolymer Foams by a Novel Saponification/Peroxide/Gelcasting Combined Route. J. Eur. Ceram. Soc. 2014, 34, 3133–3137. [Google Scholar] [CrossRef]
- Qiao, Y.; Li, X.; Bai, C.; Li, H.; Yan, J.; Wang, Y.; Wang, X.; Zhang, X.; Zheng, T.; Colombo, P. Effects of Surfactants/Stabilizing Agents on the Microstructure and Properties of Porous Geopolymers by Direct Foaming. J. Asian. Ceram. Soc. 2021, 9, 412–423. [Google Scholar] [CrossRef]
- Chen, L.; Wang, Z.; Wang, Y.; Feng, J. Preparation and Properties of Alkali Activated Metakaolin-Based Geopolymer. Materials 2016, 9, 767. [Google Scholar] [CrossRef] [PubMed] [Green Version]
- Rahier, H.; van Mele, B.; Biesemans, M.; Wastiels, J.; Wu, X. Low-Temperature Synthesized Aluminosilicate Glasses. J. Mater. Sci. 1996, 31, 71–79. [Google Scholar] [CrossRef]
- Novais, R.M.; Ascensão, G.; Buruberri, L.H.; Senff, L.; Labrincha, J.A. Influence of Blowing Agent on the Fresh- and Hardened-State Properties of Lightweight Geopolymers. Mater. Des. 2016, 108, 551–559. [Google Scholar] [CrossRef]
- Kuenzel, C.; Vandeperre, L.J.; Donatello, S.; Boccaccini, A.R.; Cheeseman, C. Ambient Temperature Drying Shrinkage and Cracking in Metakaolin-Based Geopolymers. J. Am. Ceram.Soc. 2012, 95, 3270–3277. [Google Scholar] [CrossRef] [Green Version]
- Perera, D.S.; Uchida, O.; Vance, E.R.; Finnie, K.S. Influence of Curing Schedule on the Integrity of Geopolymers. J. Mater. Sci. 2007, 42, 3099–3106. [Google Scholar] [CrossRef]
- Papa, E.; Medri, V.; Benito, P.; Vaccari, A.; Bugani, S.; Jaroszewicz, J.; Swieszkowski, W.; Landi, E. Synthesis of Porous Hierarchical Geopolymer Monoliths by Ice-Templating. Micropor. Mesopor. Mater. 2015, 215, 206–214. [Google Scholar] [CrossRef]
- Kioupis, D.; Kavakakis, C.; Tsivilis, S.; Kakali, G. Synthesis and Characterization of Porous Fly Ash-Based Geopolymers Using Si as Foaming Agent. Adv. Mater. Sci. Eng. 2018, 2018, 1942898. [Google Scholar] [CrossRef] [Green Version]
- Gu, G.; Xu, F.; Ruan, S.; Huang, X.; Zhu, J.; Peng, C. Influence of Precast Foam on the Pore Structure and Properties of Fly Ash-Based Geopolymer Foams. Constr. Build. Mater. 2020, 256, 119410. [Google Scholar] [CrossRef]
- Palmero, P.; Formia, A.; Antonaci, P.; Brini, S.; Tulliani, J.-M. Geopolymer Technology for Application-Oriented Dense and Lightened Materials. Elaboration and Characterization. Ceram. Int. 2015, 41, 12967–12979. [Google Scholar] [CrossRef]
- He, P.Y.; Zhang, Y.J.; Chen, H.; Han, Z.C.; Liu, L.C. Low-Cost and Facile Synthesis of Geopolymer-Zeolite Composite Membrane for Chromium(VI) Separation from Aqueous Solution. J. Hazard. Mater. 2020, 392, 122359. [Google Scholar] [CrossRef] [PubMed]
- Yan, C.; Guo, L.; Ren, D.; Duan, P. Novel Composites Based on Geopolymer for Removal of Pb(II). Mater. Lett. 2019, 239, 192–195. [Google Scholar] [CrossRef]
- Zhang, J.; He, Y.; Wang, Y.; Mao, J.; Cui, X. Synthesis of a Self-Supporting Faujasite Zeolite Membrane Using Geopolymer Gel for Separation of Alcohol/Water Mixture. Mater. Lett. 2014, 116, 167–170. [Google Scholar] [CrossRef]
- Song, Y.; Li, Z.; Zhang, J.; Tang, Y.; Ge, Y.; Cui, X. A Low-Cost Biomimetic Heterostructured Multilayer Membrane with Geopolymer Microparticles for Broad-Spectrum Water Purification. ACS Appl. Mater. Interfaces 2020, 12, 12133–12142. [Google Scholar] [CrossRef]


| Oxide | SiO2 | Al2O3 | TiO2 | Fe2O3 | Na2O | Cr2O3 | L.O.I. * |
|---|---|---|---|---|---|---|---|
| MK | 53.15 | 42.28 | 3.58 | 0.56 | 0.39 | 0.03 | 0.08 |
| Type | Sample | Metakaolin | Sodium Silicate | NaOH | Water | H2O2 | Palm Olein |
|---|---|---|---|---|---|---|---|
| Matrix | H0P0 | 100.0 | 100.73 | 15.33 | 54.61 | 0 | 0 |
| Geopolymer foams | H2P0 | 100.0 | 100.73 | 15.33 | 54.61 | 2 | 0 |
| H3P0 | 100.0 | 100.73 | 15.33 | 54.61 | 3 | 0 | |
| H2P6 | 100.0 | 100.73 | 15.33 | 54.61 | 2 | 6 | |
| H3P6 | 100.0 | 100.73 | 15.33 | 54.61 | 3 | 6 | |
| H3P10 | 100.0 | 100.73 | 15.33 | 54.61 | 3 | 10 |
| Sample | Pore Volume 0.005–1 μm (mL/g) | Pore Volume 1–350 μm (mL/g) | Total Pore Volume (mL/g) | Total Pore Area (m2/g) | Average Pore Diameter (nm) |
|---|---|---|---|---|---|
| H0P0 | 0.377 | 0.014 | 0.391 | 60.563 | 25.824 |
| H2P0 | 0.397 | 0.333 | 0.729 | 53.731 | 54.300 |
| H3P0 | 0.379 | 0.492 | 0.871 | 51.420 | 67.771 |
| H2P6 | 0.381 | 0.973 | 1.354 | 58.370 | 92.815 |
| H3P6 | 0.397 | 1.185 | 1.581 | 53.158 | 118.981 |
| H3P10 | 0.413 | 1.242 | 1.655 | 49.421 | 133.951 |
| Sample | Skeletal Density by MIP (g/cm3) | Bulk Density at 0.52 Psia by MIP (g/cm3) | Bulk Density by Geometric Calculation (g/cm3) |
|---|---|---|---|
| H0P0 | 2.248 | 1.197 | 1.118 ± 0.010 |
| H2P0 | 2.007 | 0.815 | 0.580 ± 0.006 |
| H3P0 | 1.841 | 0.707 | 0.478 ± 0.024 |
| H2P6 | 1.726 | 0.504 | 0.482 ± 0.002 |
| H3P6 | 1.702 | 0.515 | 0.370 ± 0.002 |
| H3P10 | 1.807 | 0.469 | 0.355 ± 0.001 |
| Sample | Open Porosity (%) | |||
|---|---|---|---|---|
| d < 1 μm | 1 μm ≤ d < 350 μm | d ≥ 350 μm | d ≥ 1 μm | |
| H0P0 | 45.071 | 1.709 | 3.492 | 5.201 |
| H2P0 | 32.316 | 27.102 | 11.694 | 38.796 |
| H3P0 | 26.783 | 34.808 | 12.420 | 47.228 |
| H2P6 | 19.638 | 50.103 | 1.910 | 52.013 |
| H3P6 | 18.581 | 55.493 | 5.429 | 60.922 |
| H3P10 | 18.684 | 56.246 | 5.427 | 61.673 |
| Sample | n | κGlobal |
|---|---|---|
| H2P0 | 1929 | 0.754 |
| H3P0 | 1357 | 0.752 |
| H2P6 | 2247 | 1.383 |
| H3P6 | 1608 | 2.128 |
| H3P10 | 1546 | 2.141 |
Publisher’s Note: MDPI stays neutral with regard to jurisdictional claims in published maps and institutional affiliations. |
© 2022 by the authors. Licensee MDPI, Basel, Switzerland. This article is an open access article distributed under the terms and conditions of the Creative Commons Attribution (CC BY) license (https://creativecommons.org/licenses/by/4.0/).
Share and Cite
Yu, Q.; Li, X.; Wang, Z.; Xue, J. Characterization and Performance Evaluation of Metakaolin-Based Geopolymer Foams Obtained by Adding Palm Olein as the Foam Stabilizer. Materials 2022, 15, 3570. https://doi.org/10.3390/ma15103570
Yu Q, Li X, Wang Z, Xue J. Characterization and Performance Evaluation of Metakaolin-Based Geopolymer Foams Obtained by Adding Palm Olein as the Foam Stabilizer. Materials. 2022; 15(10):3570. https://doi.org/10.3390/ma15103570
Chicago/Turabian StyleYu, Qinglin, Xueying Li, Zheng Wang, and Jing Xue. 2022. "Characterization and Performance Evaluation of Metakaolin-Based Geopolymer Foams Obtained by Adding Palm Olein as the Foam Stabilizer" Materials 15, no. 10: 3570. https://doi.org/10.3390/ma15103570