
Hydration and Mechanical Properties of Blended Cement with Copper Slag Pretreated by Thermochemical Modification

 ,
,
Abstract
:1. Introduction
2. Materials and Methods
2.1. Materials
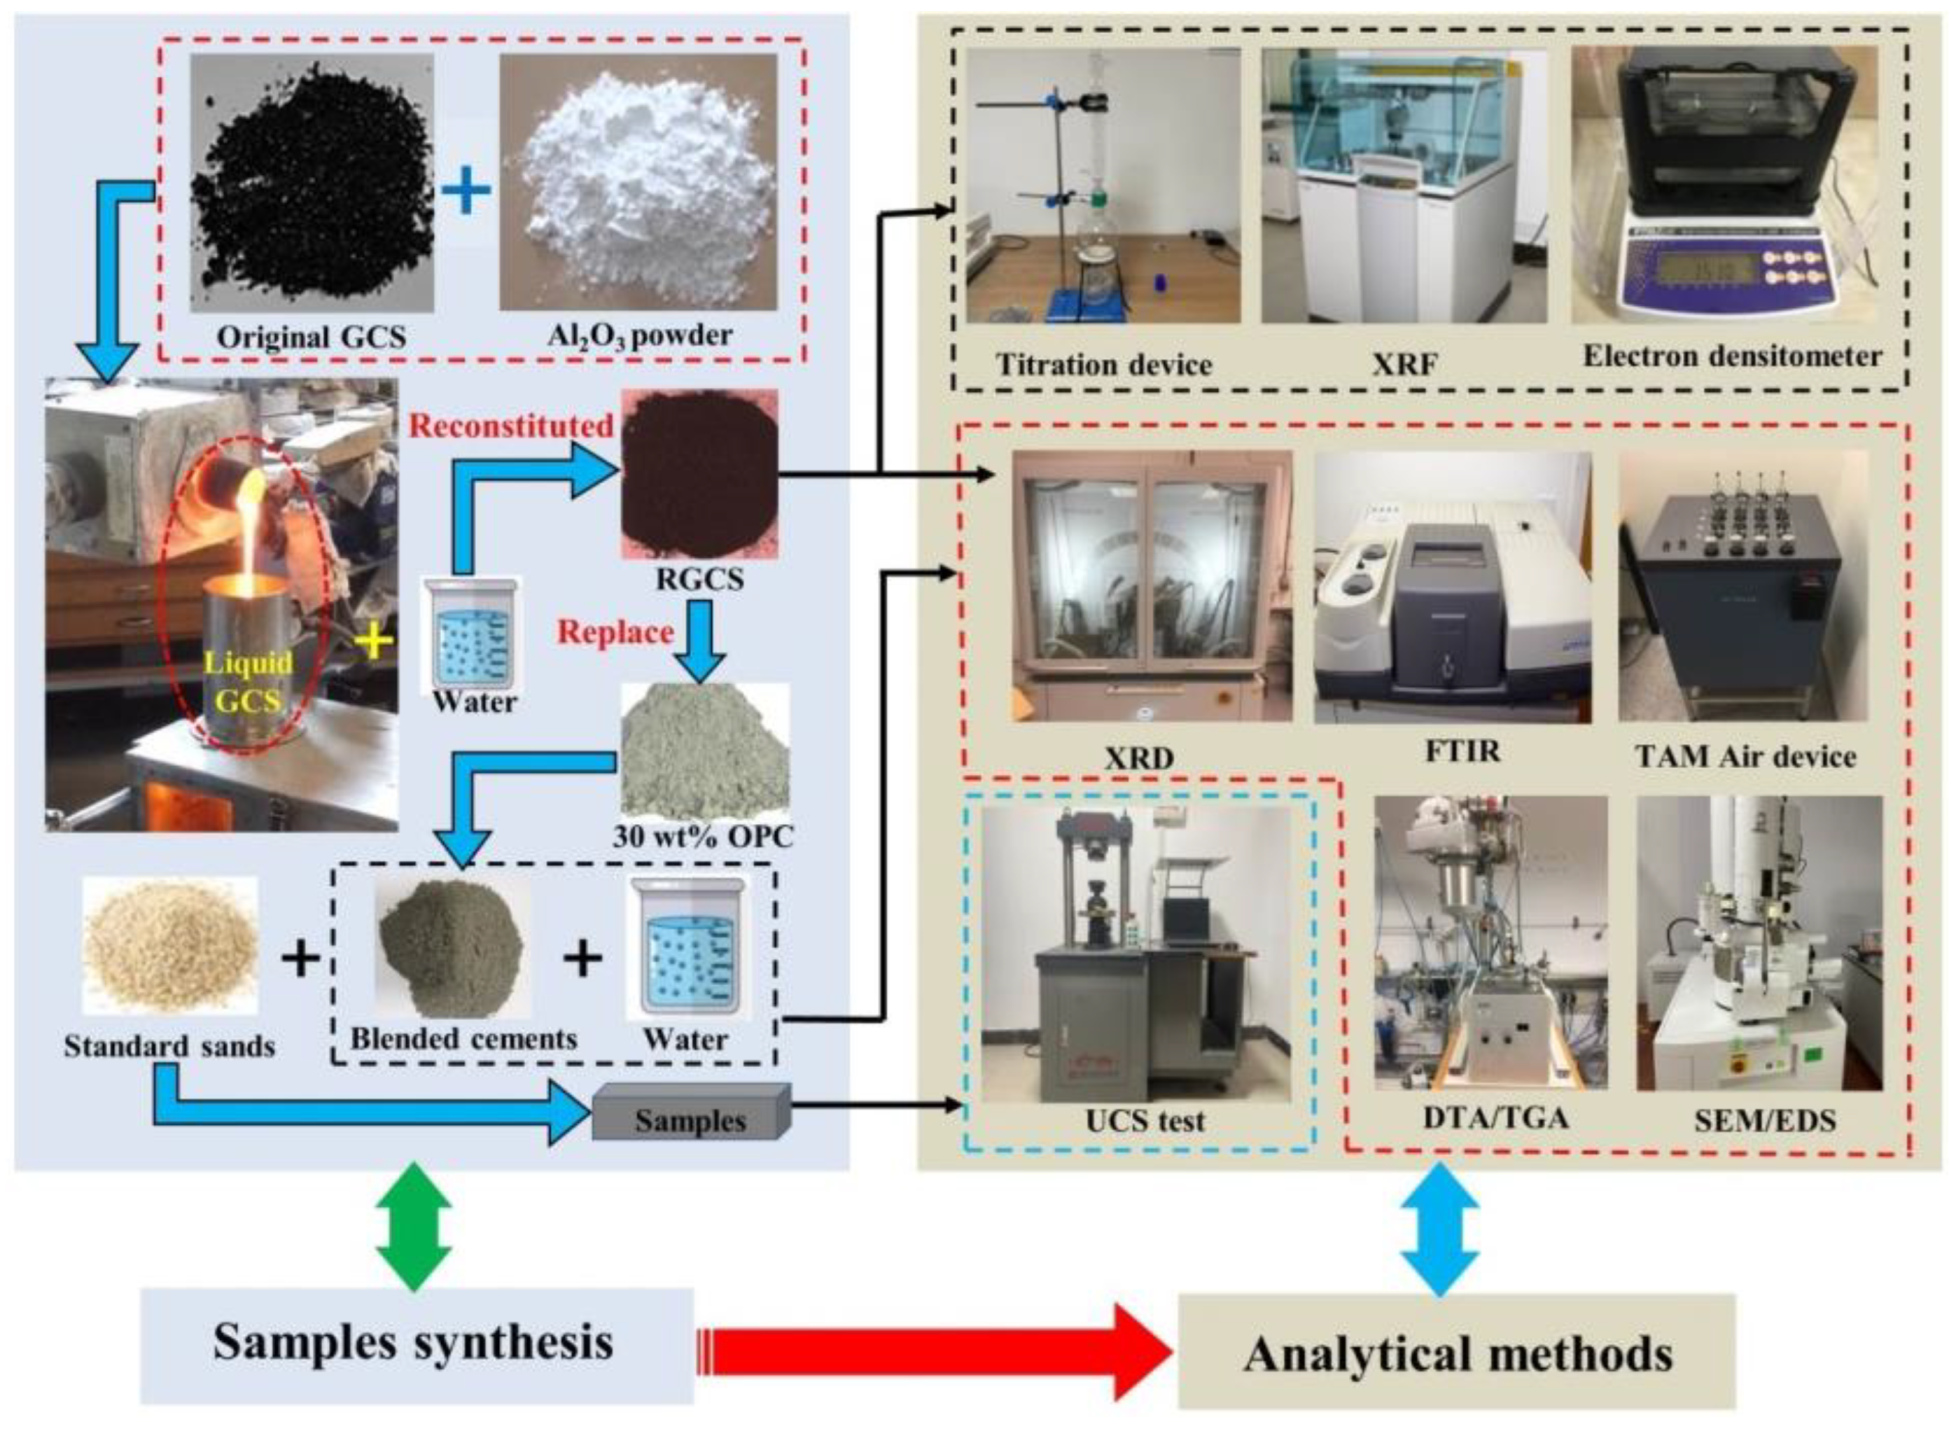
2.2. Samples Synthesis
2.2.1. RGCS
2.2.2. Blended Cement Paste
2.2.3. Blended Cement Mortar
2.3. Analytical Methods
2.3.1. Physicochemical Properties and Mineral Phase Tests of RGCS
2.3.2. Pozzolanic Activity Test and Mineral Phase of Blended Cement
2.3.3. UCS Testing
2.3.4. Morphology and Structure Test of Blended Cement
3. Results and Discussion
3.1. Physicochemical Properties
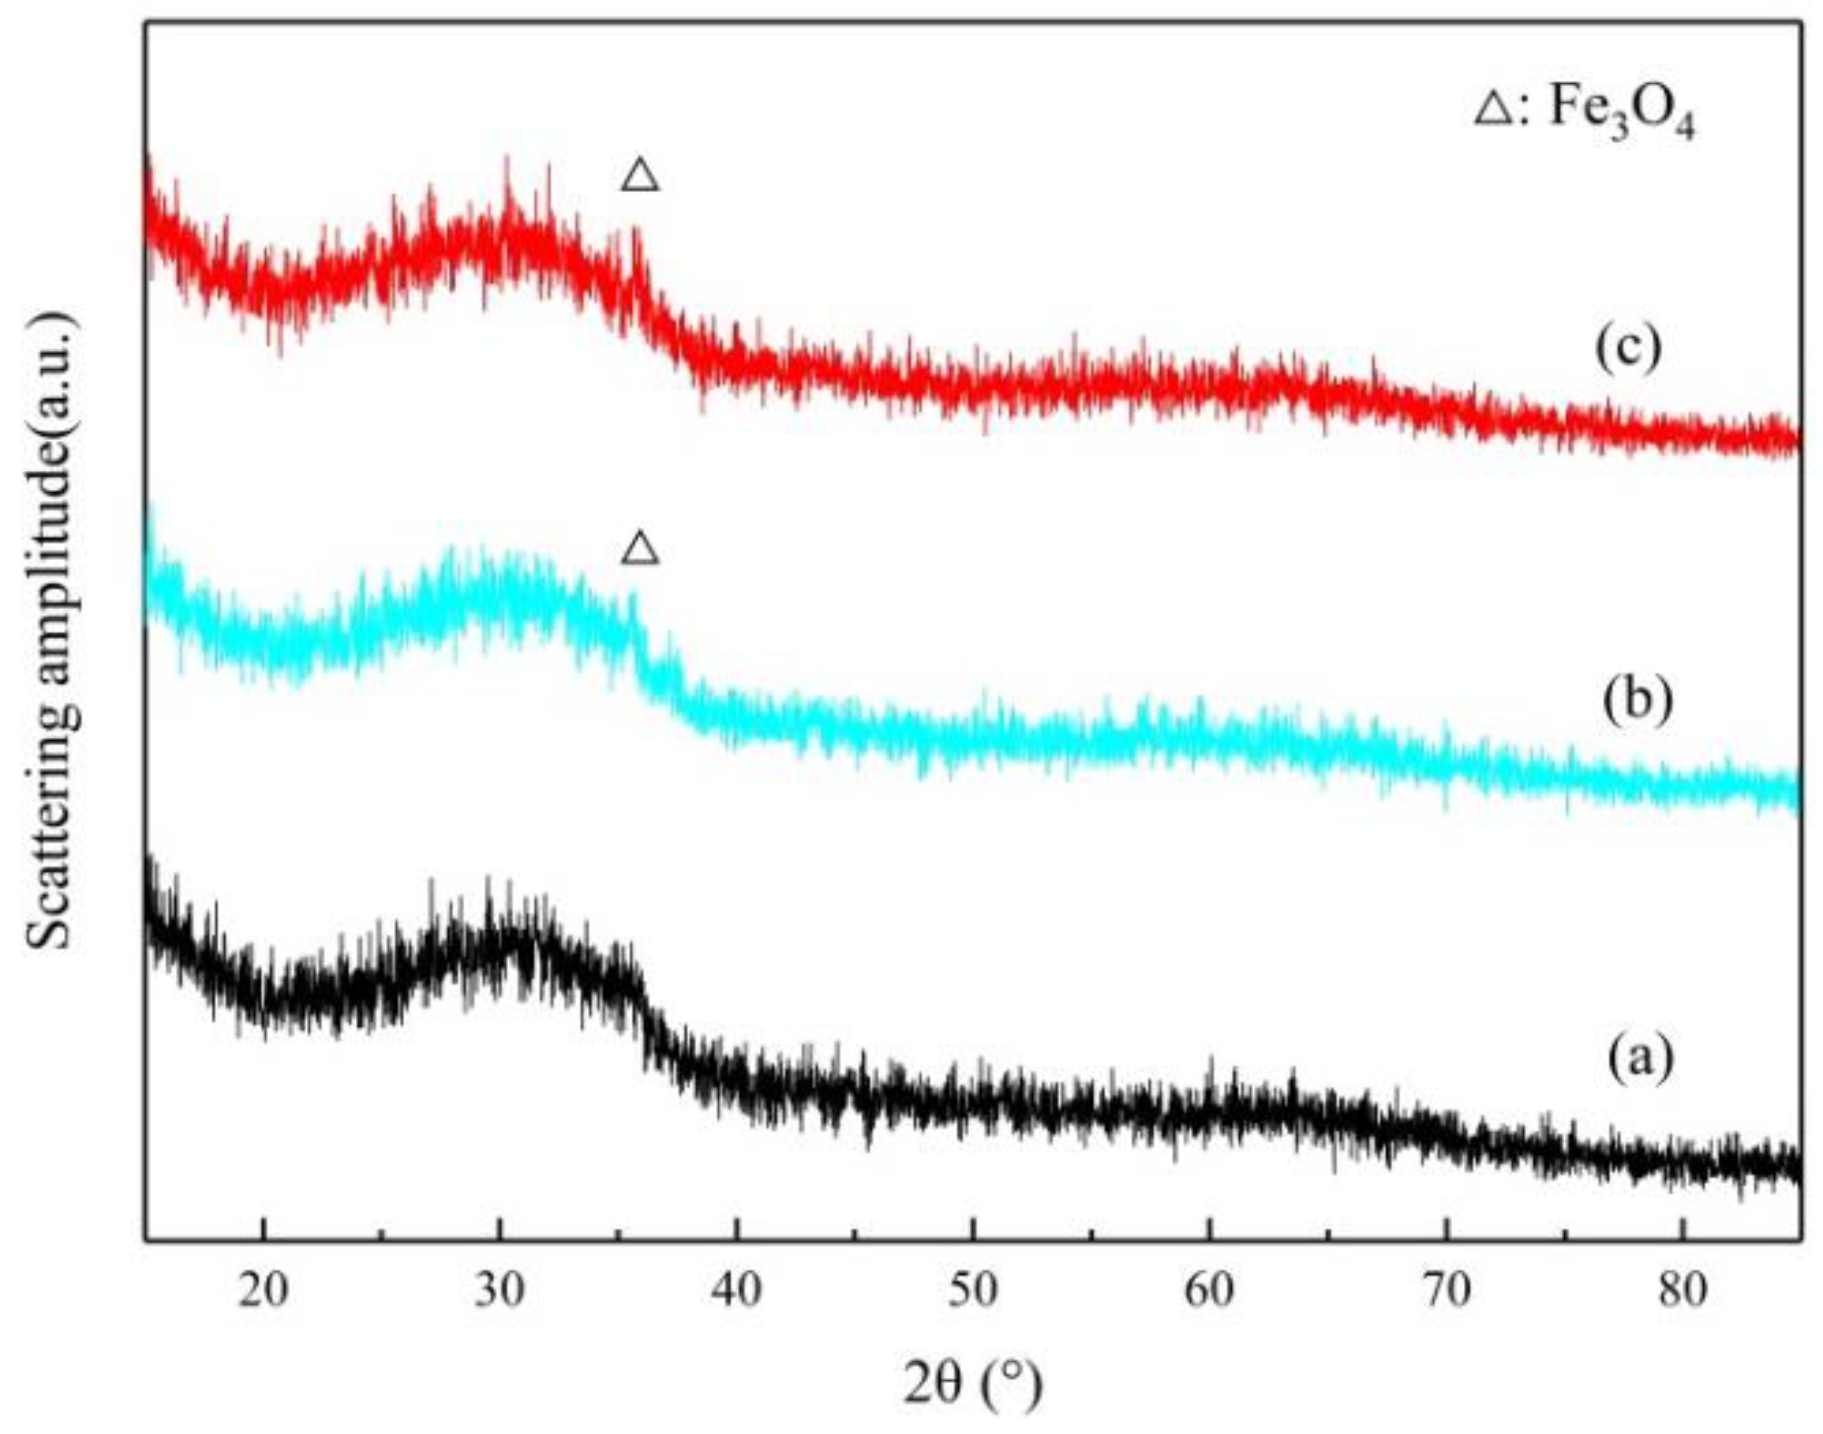
3.2. Mineralogy of the RGCS
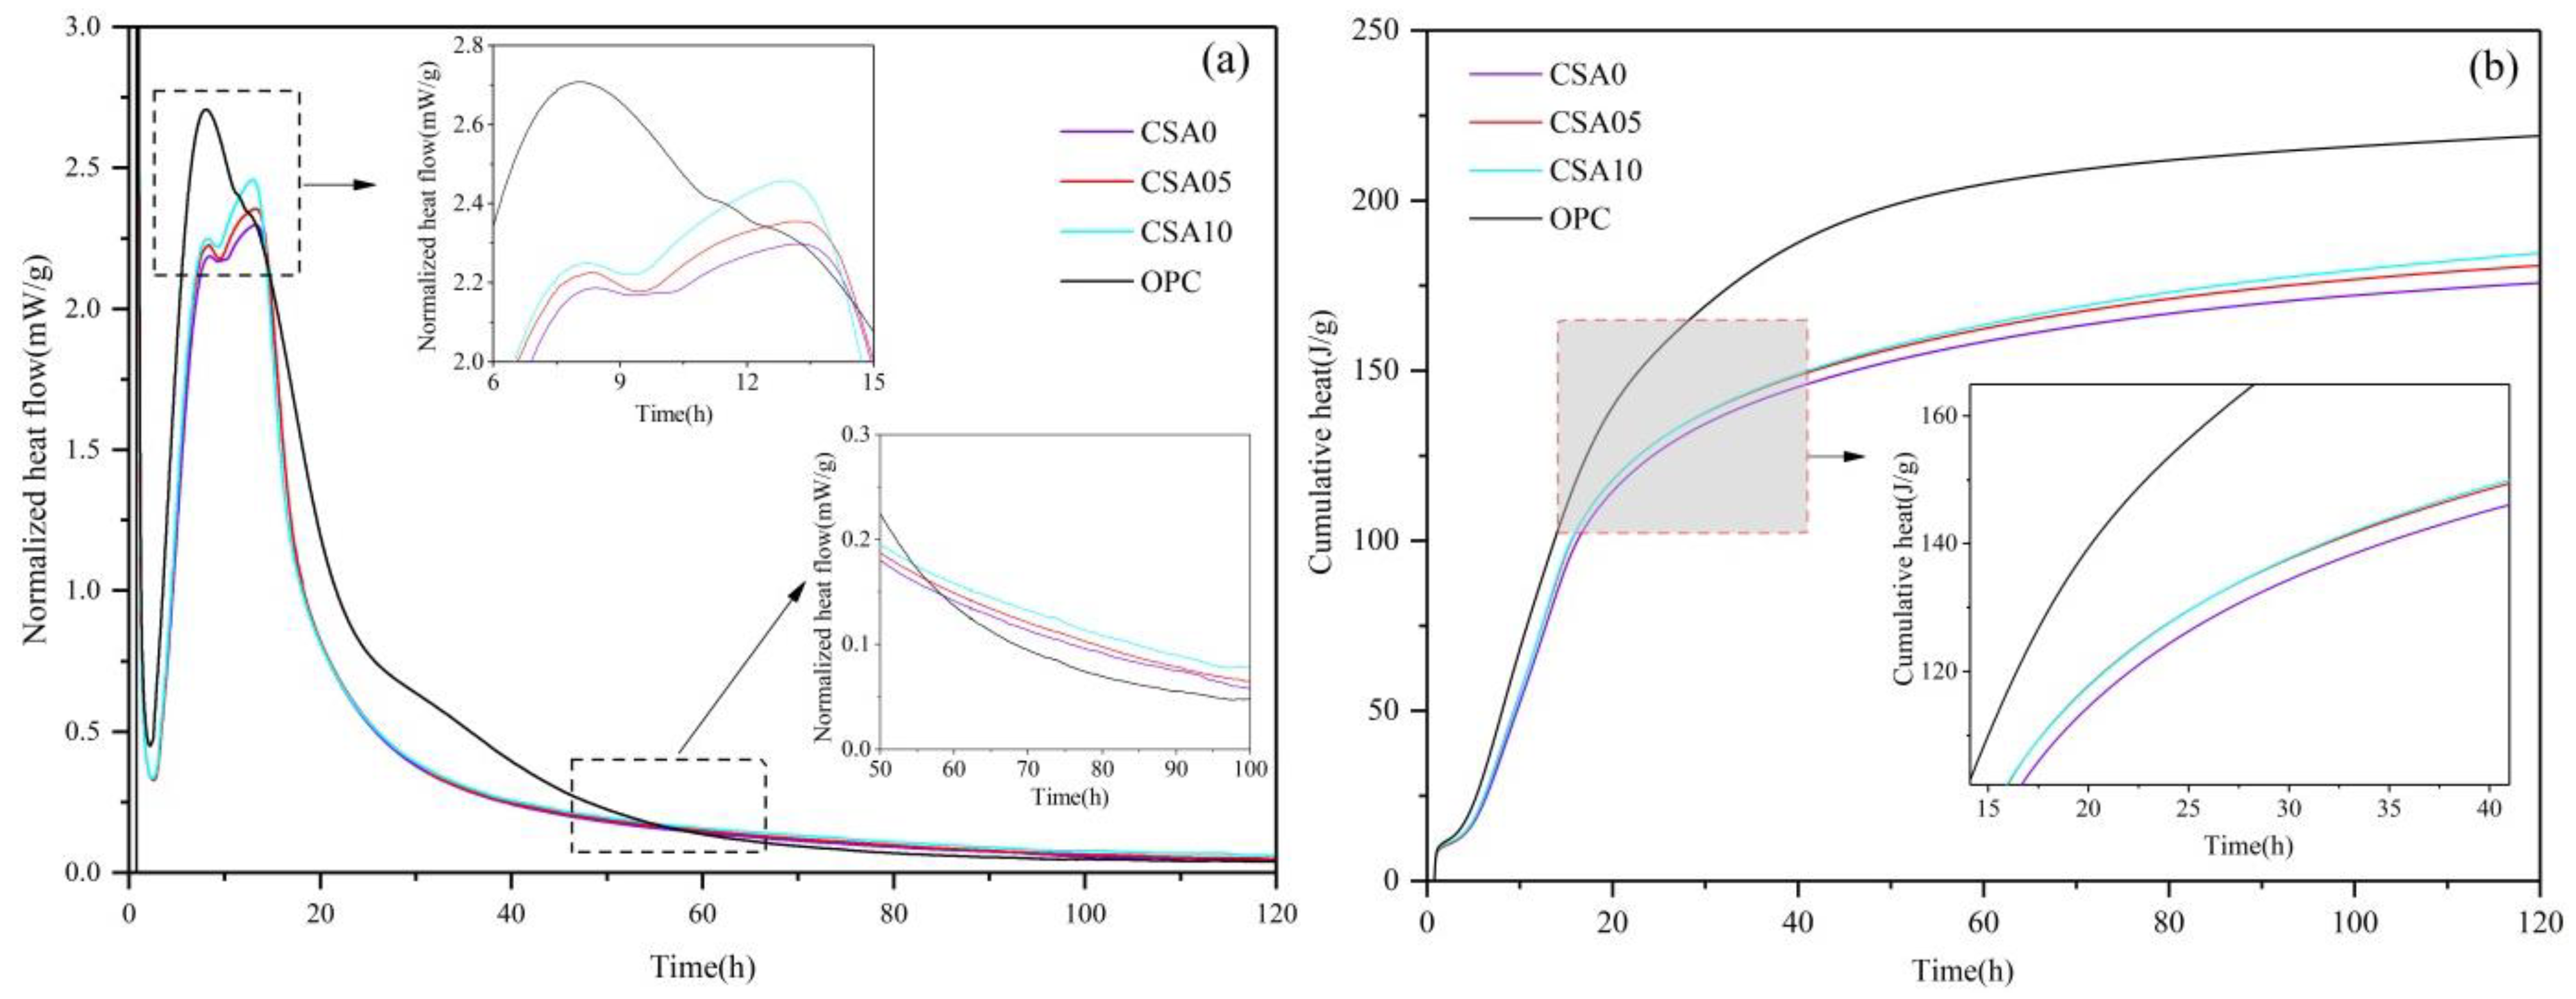
3.3. Isothermal Calorimetry
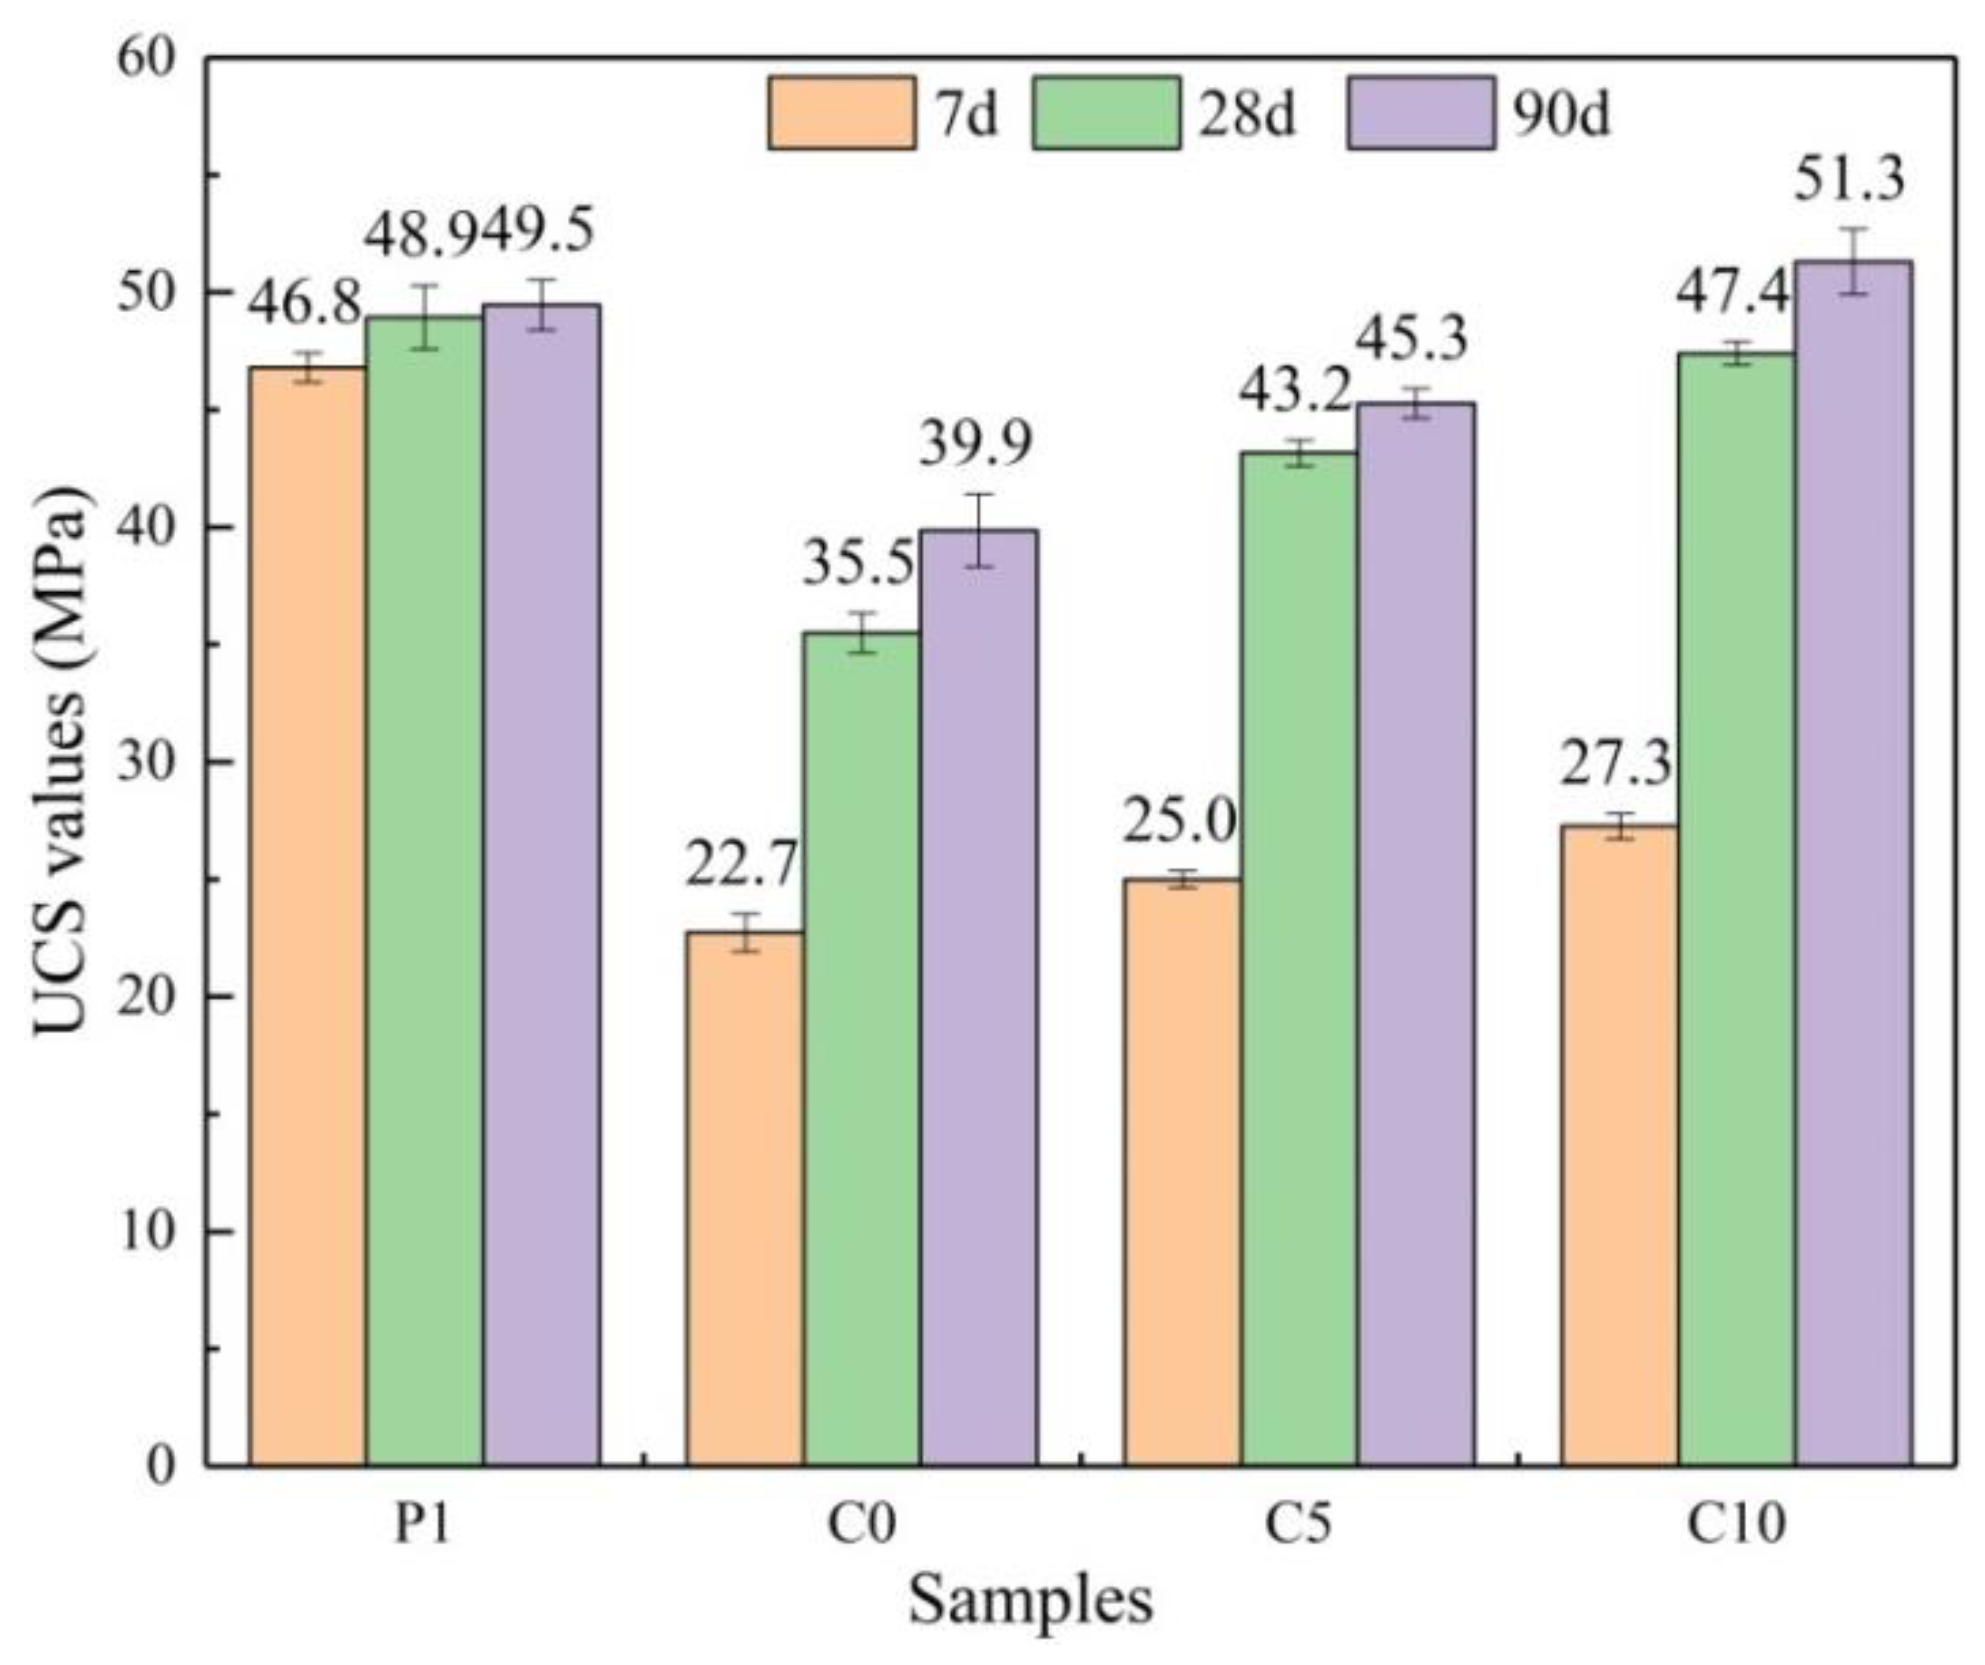
3.4. UCS Analysis
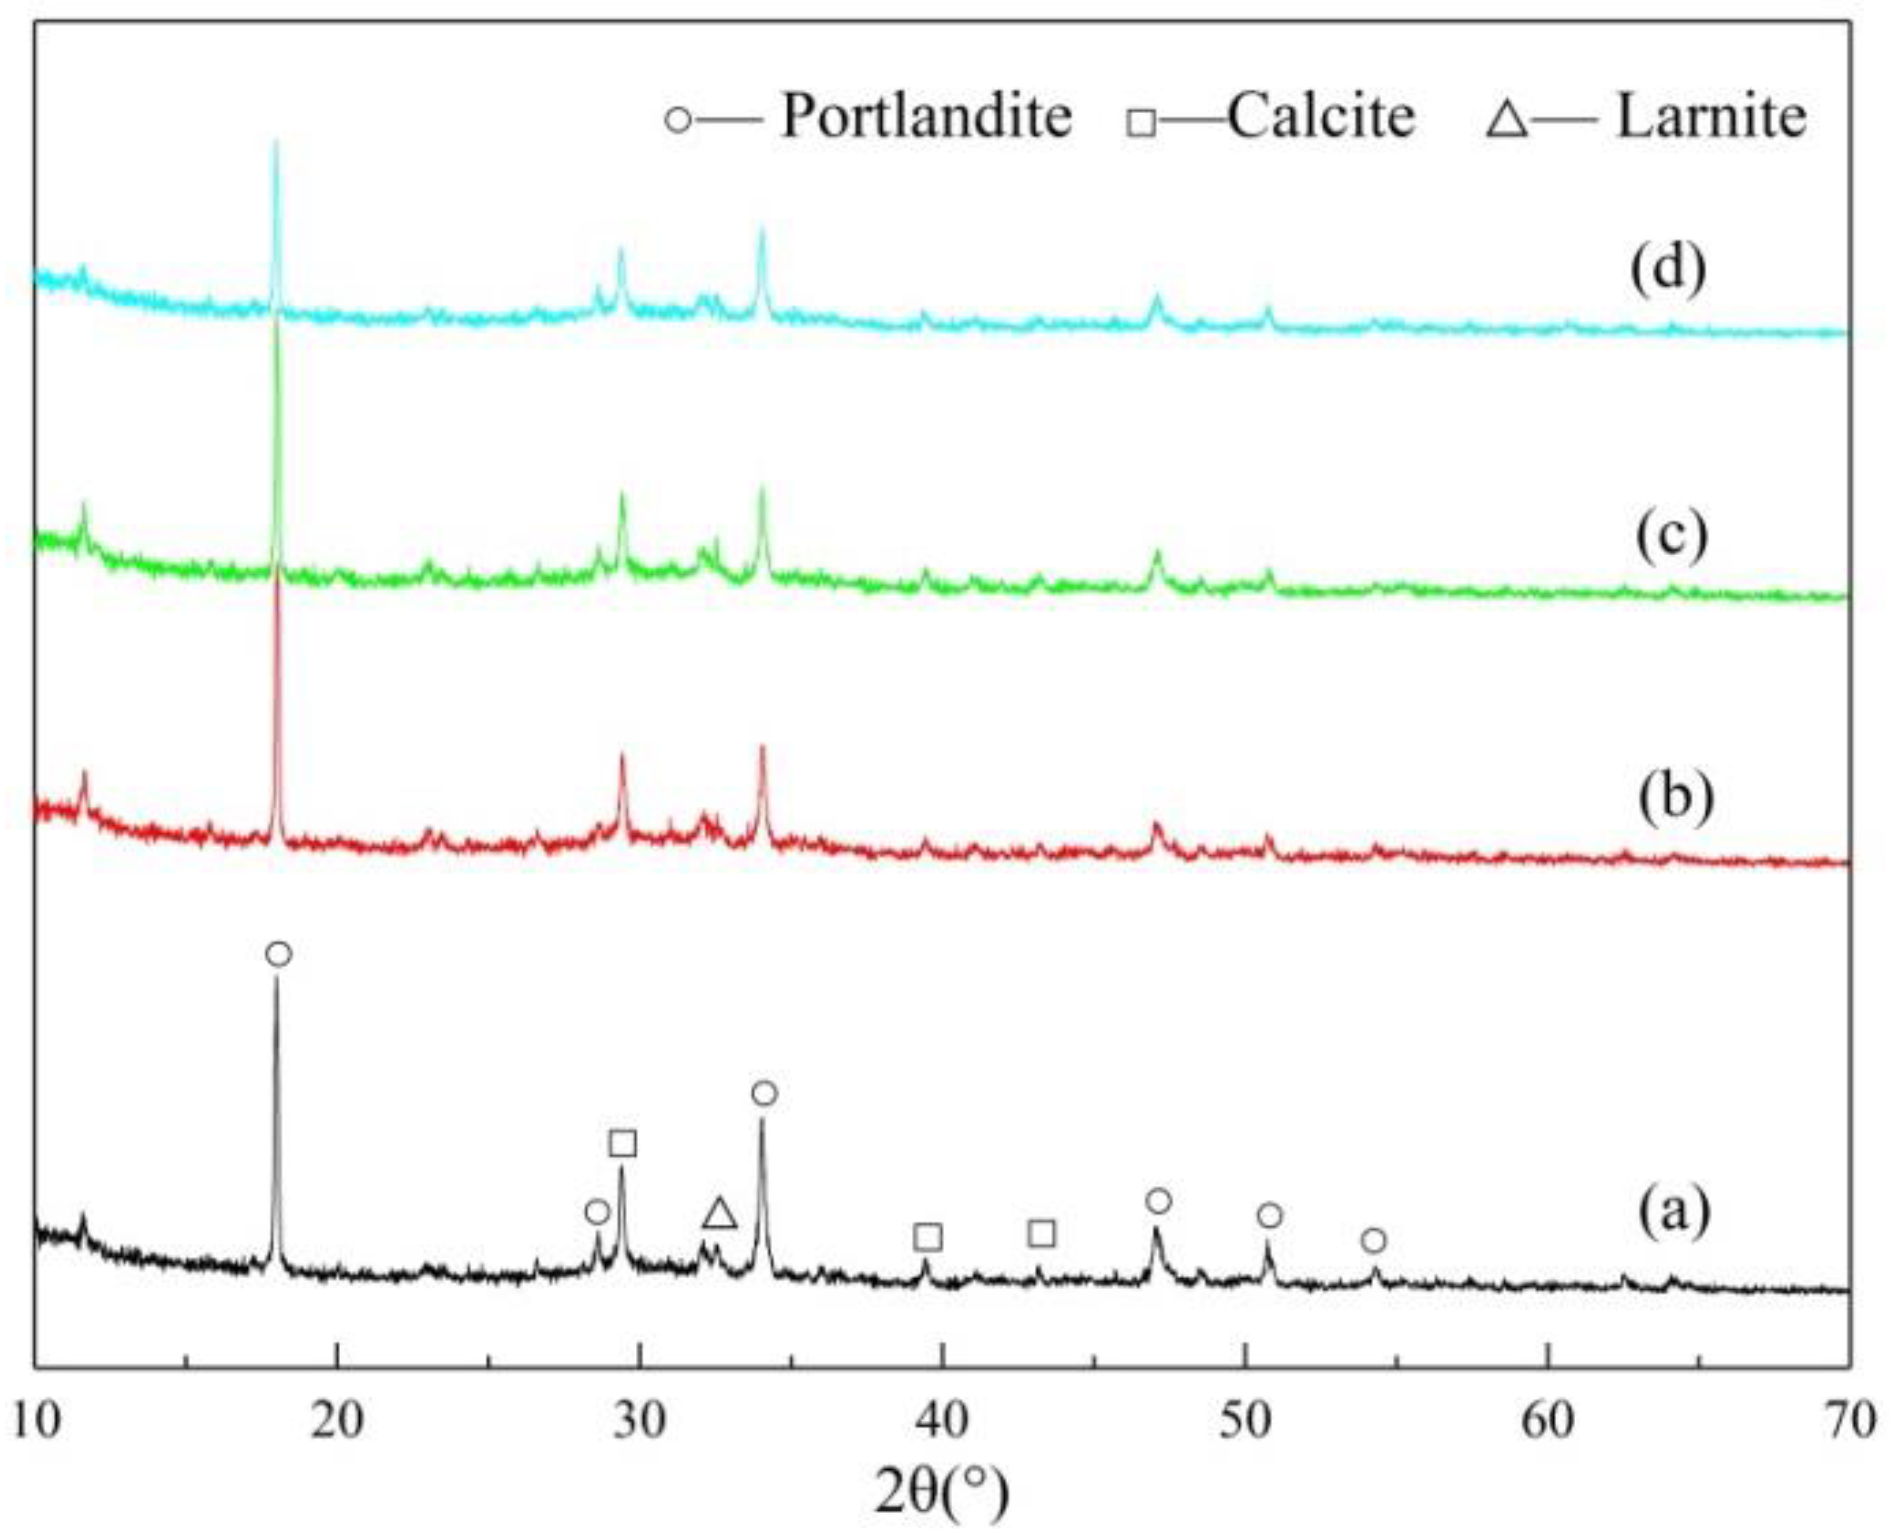
3.5. XRD Analysis of RGCS
3.6. Thermogravimetric Analysis
3.7. FTIR Analysis
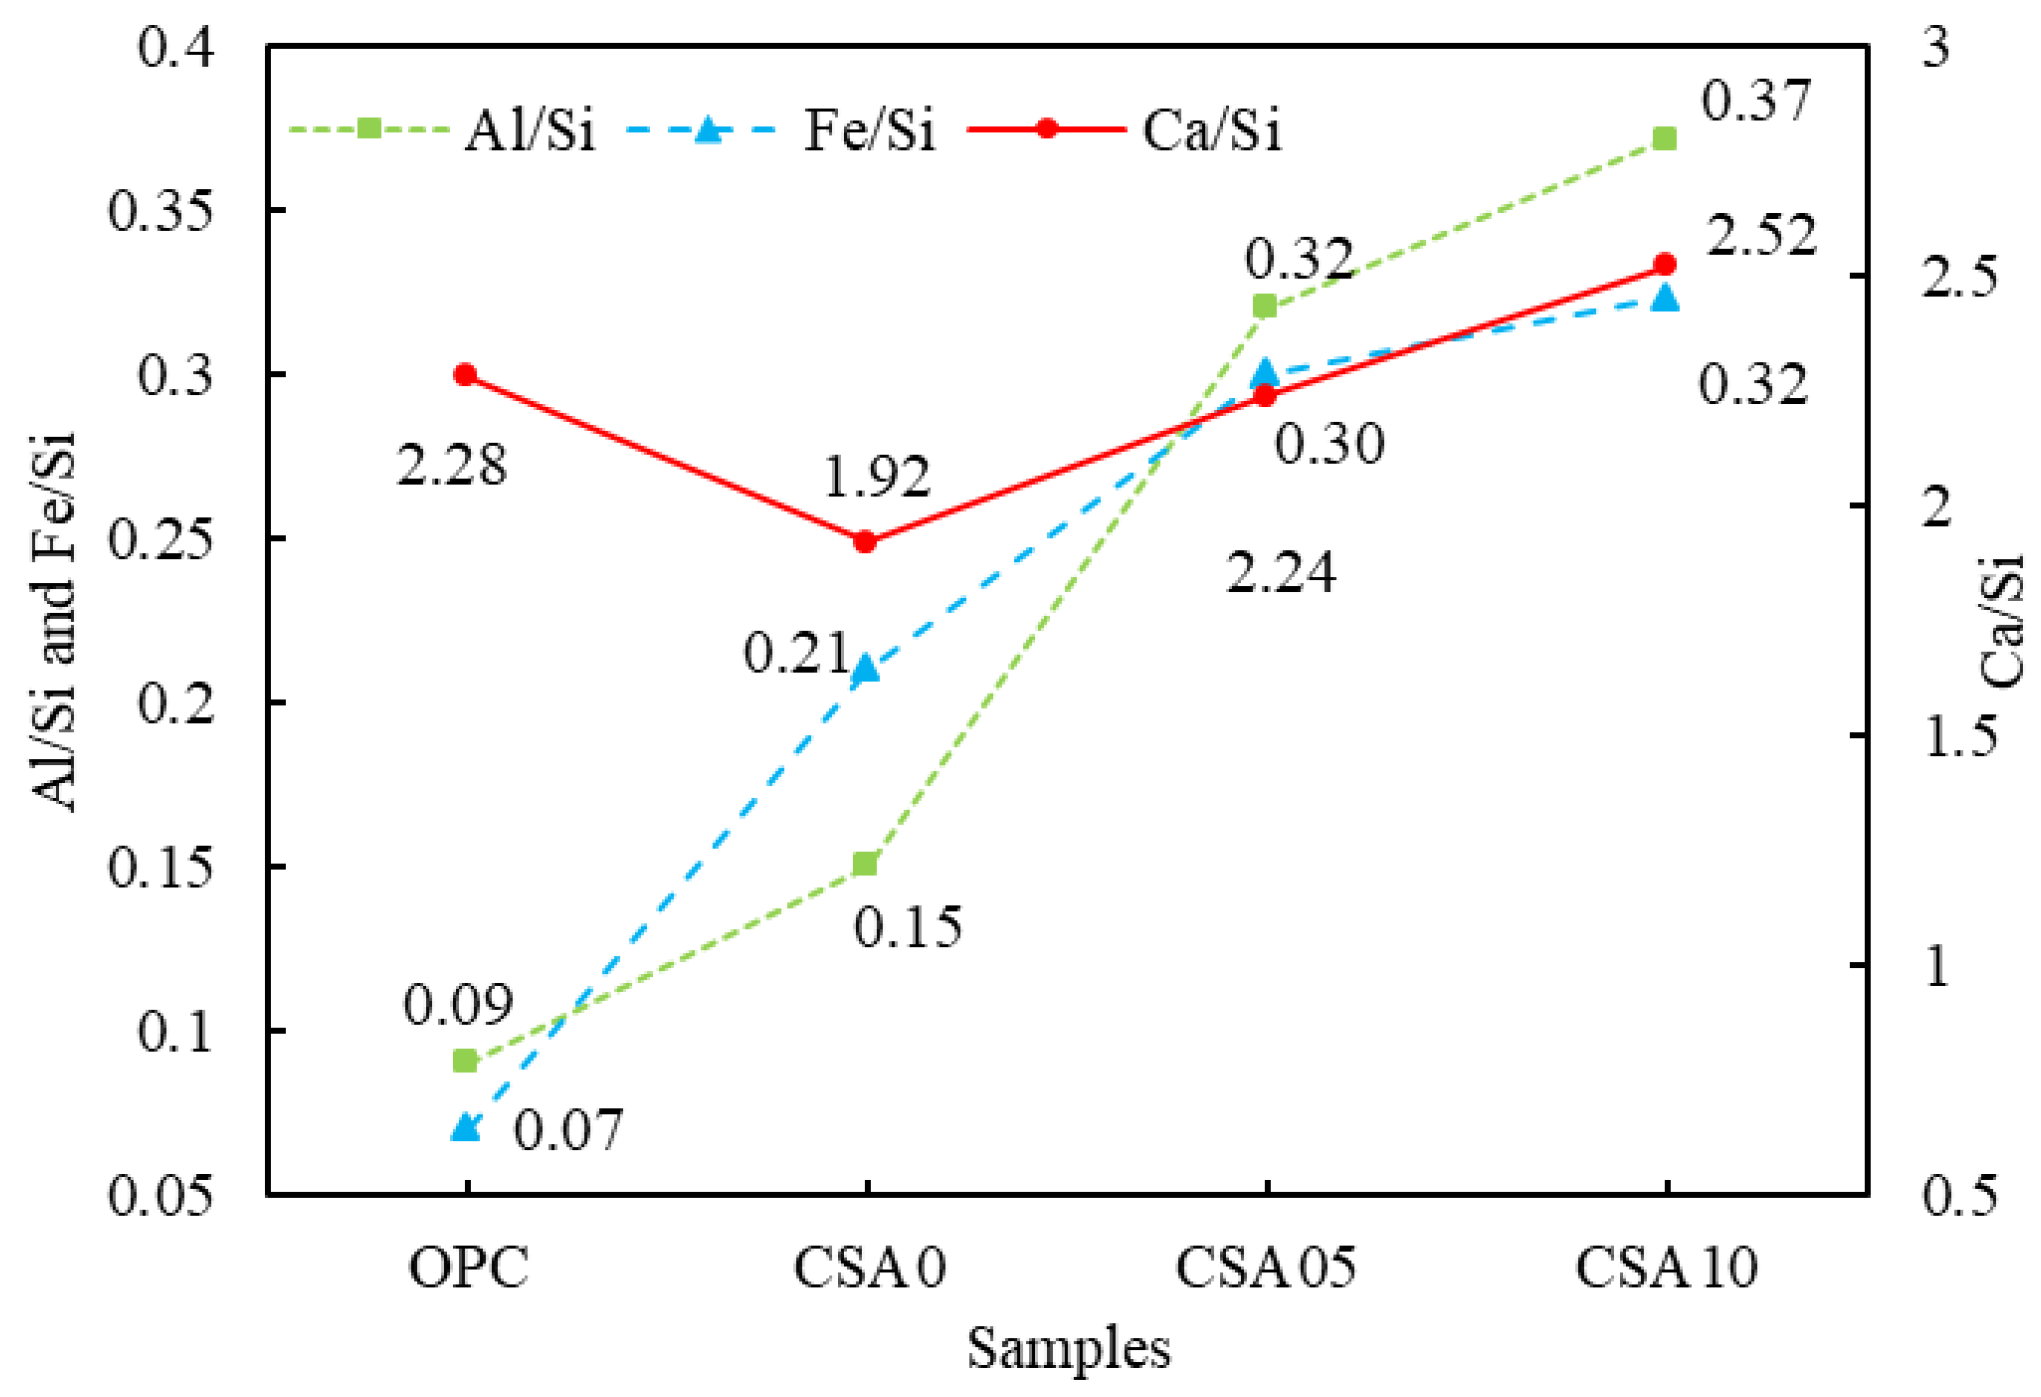
3.8. SEM Analysis
4. Conclusions
- In terms of physicochemical properties and mineral-phase composition, RGCS with the addition of Al2O3 leads to an increase in magnetite precipitation by weakening the bond between FeO and SiO2 and exhibits a highly amorphous structure. However, the BET surface areas of CSA0, CSA05, and CSA10 are 0.67, 0.67, and 0.69 m2·g−1, respectively, showing negligible variations.
- The cement and GCS mixture show increases in exothermic rate and cumulative heat release at early-age hydration after the modification using Al2O3, which can accelerate the pozzolanic reaction. The sample of CSA10 exhibits the most violent reaction with the second peak value of 2.25 mW·g−1 and the 120 h cumulative heat of 184.2 J·g−1.
- From the UCS testing of blended cement and OPC mortars, C10 gains higher UCS ratios and UCS development rate from 7 d to 28 d than that of C0 and C05, and a higher UCS value (51.3 MPa) than OPC (49.5 MPa) at 90 d of curing. This indicates that the UCS development of C10 mortar is more advantageous than OPC at the middle and later curing stage (7–90 d).
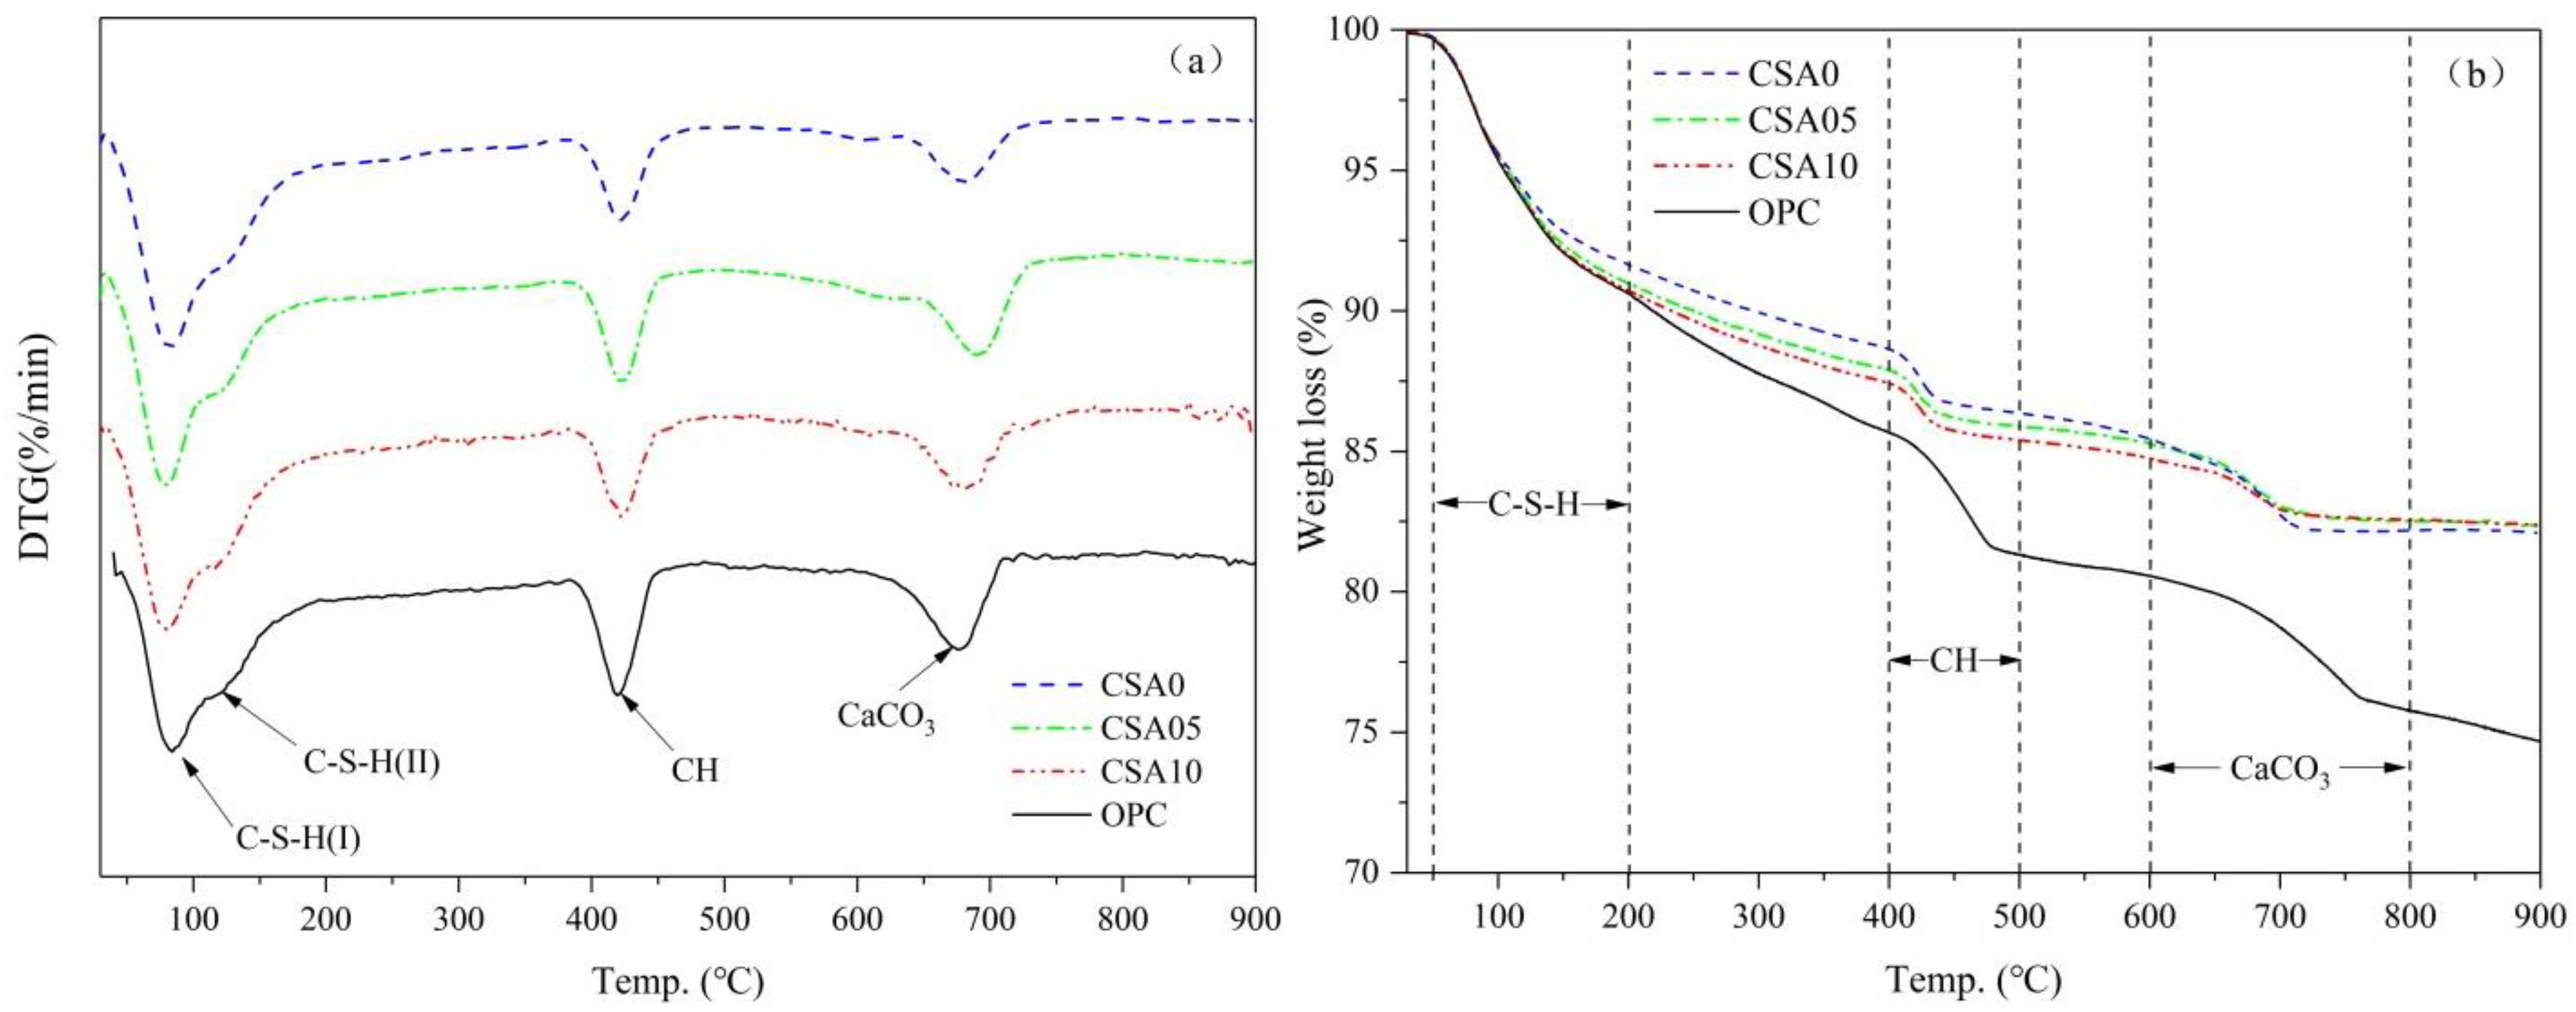
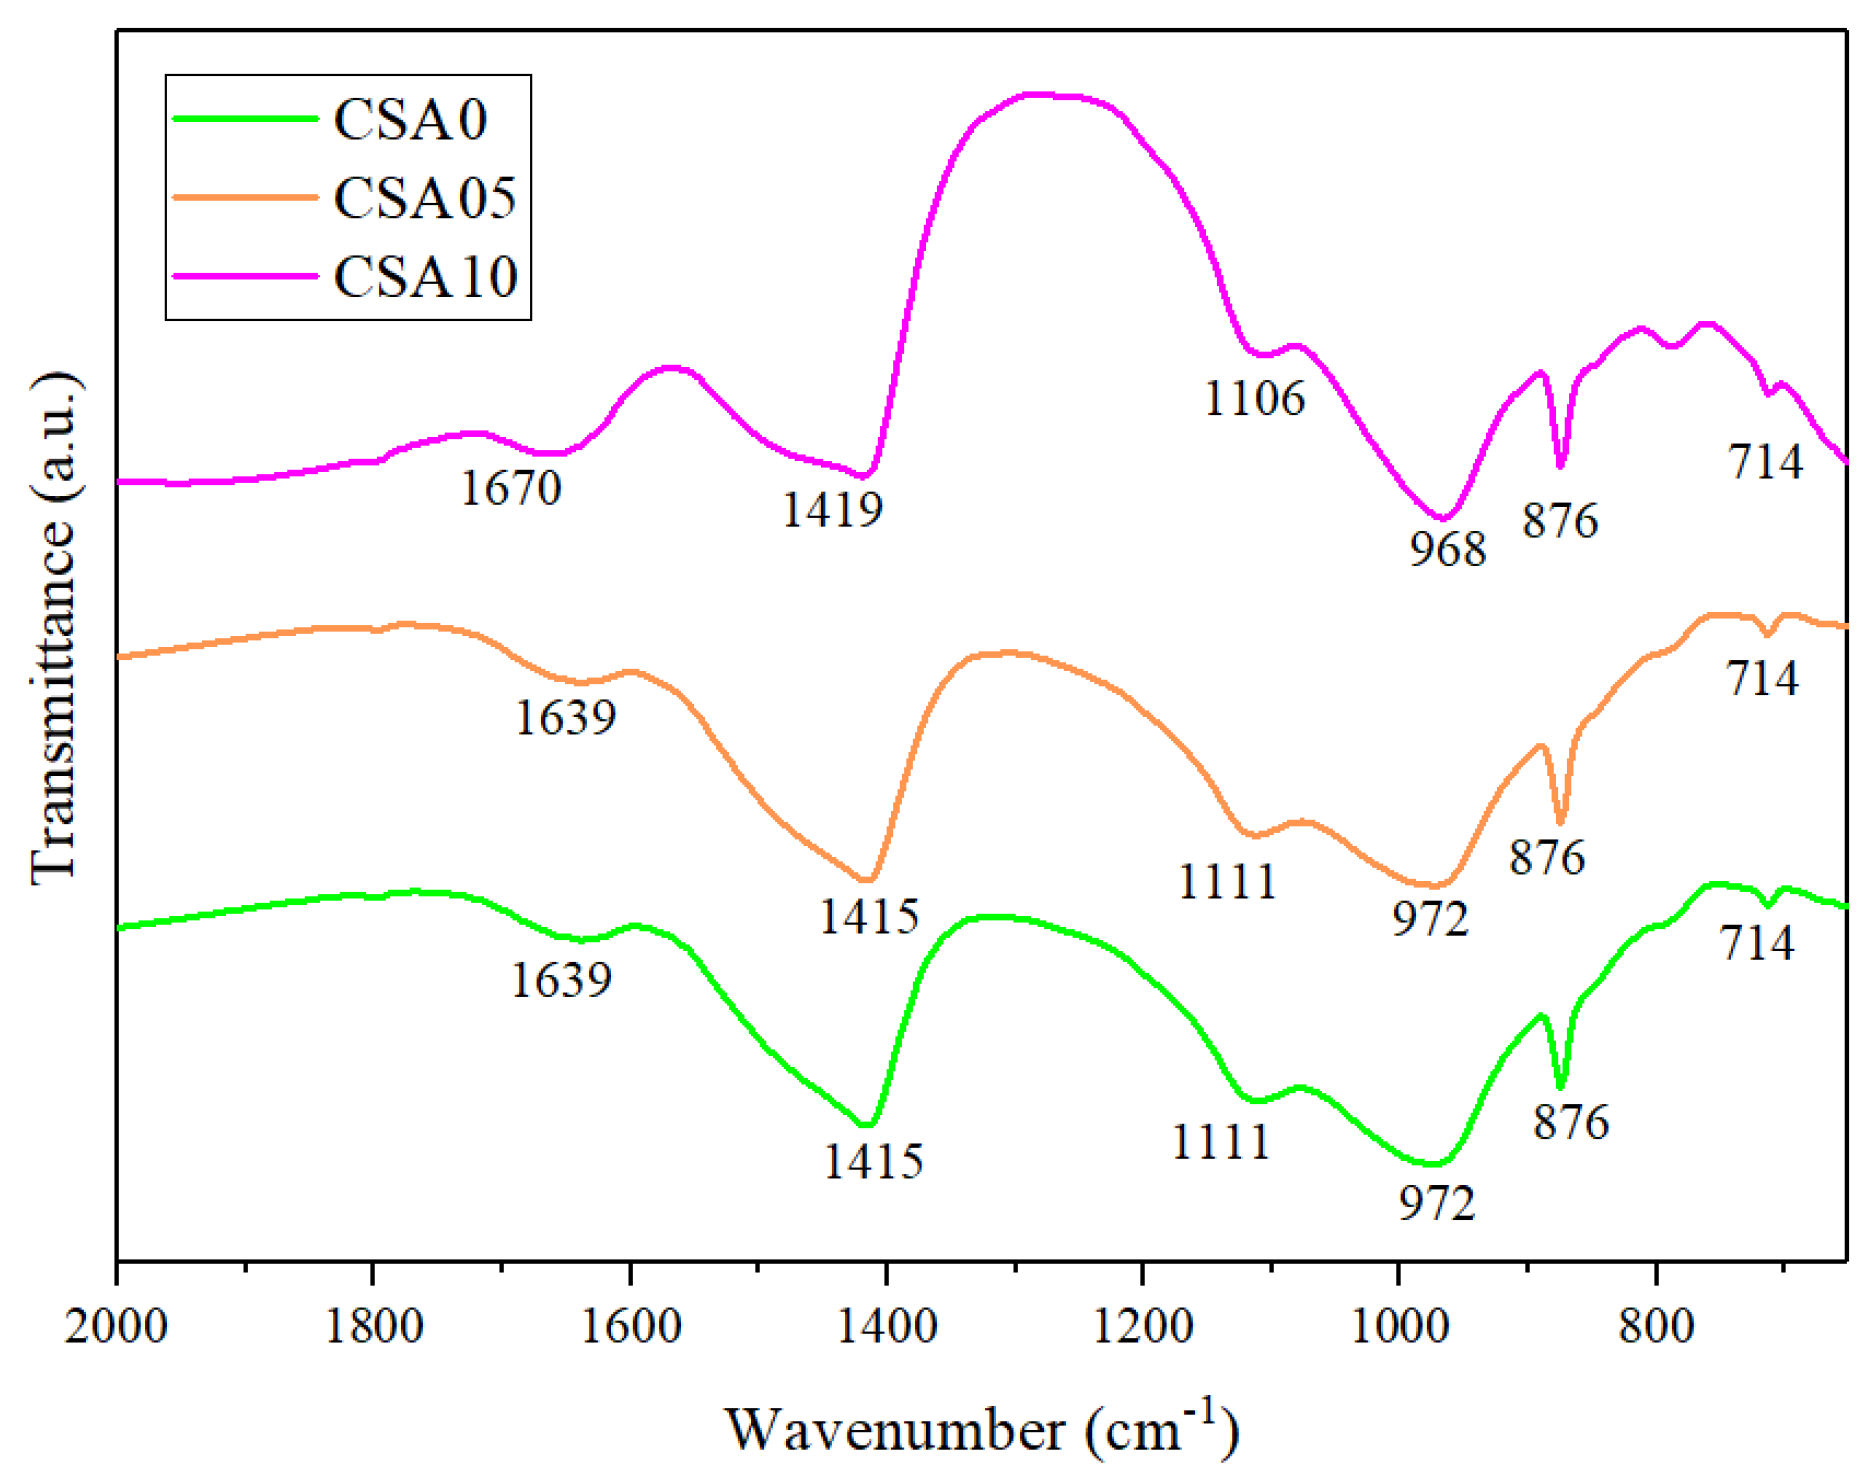
- Regarding TGA, the fixed CH of the cured 28-day blended cement slurry is 18.1%, 29.5%, and 34.0% for CSA0, CSA05, and CSA10 slurries, respectively. The CSA10 slurry exhibits the highest pozzolanic activity, but the expected increase in the fixed CH was not obtained with the addition of Al2O3 in RGCS. This is attributed to the fact that the transformation from BO to NBO is weakened, and part of Al2O3 plays the role of network-forming body when the content of Al2O3 is over 5 wt% in RGCS. Additionally, the FTIR results verify DTG/TGA measurements.
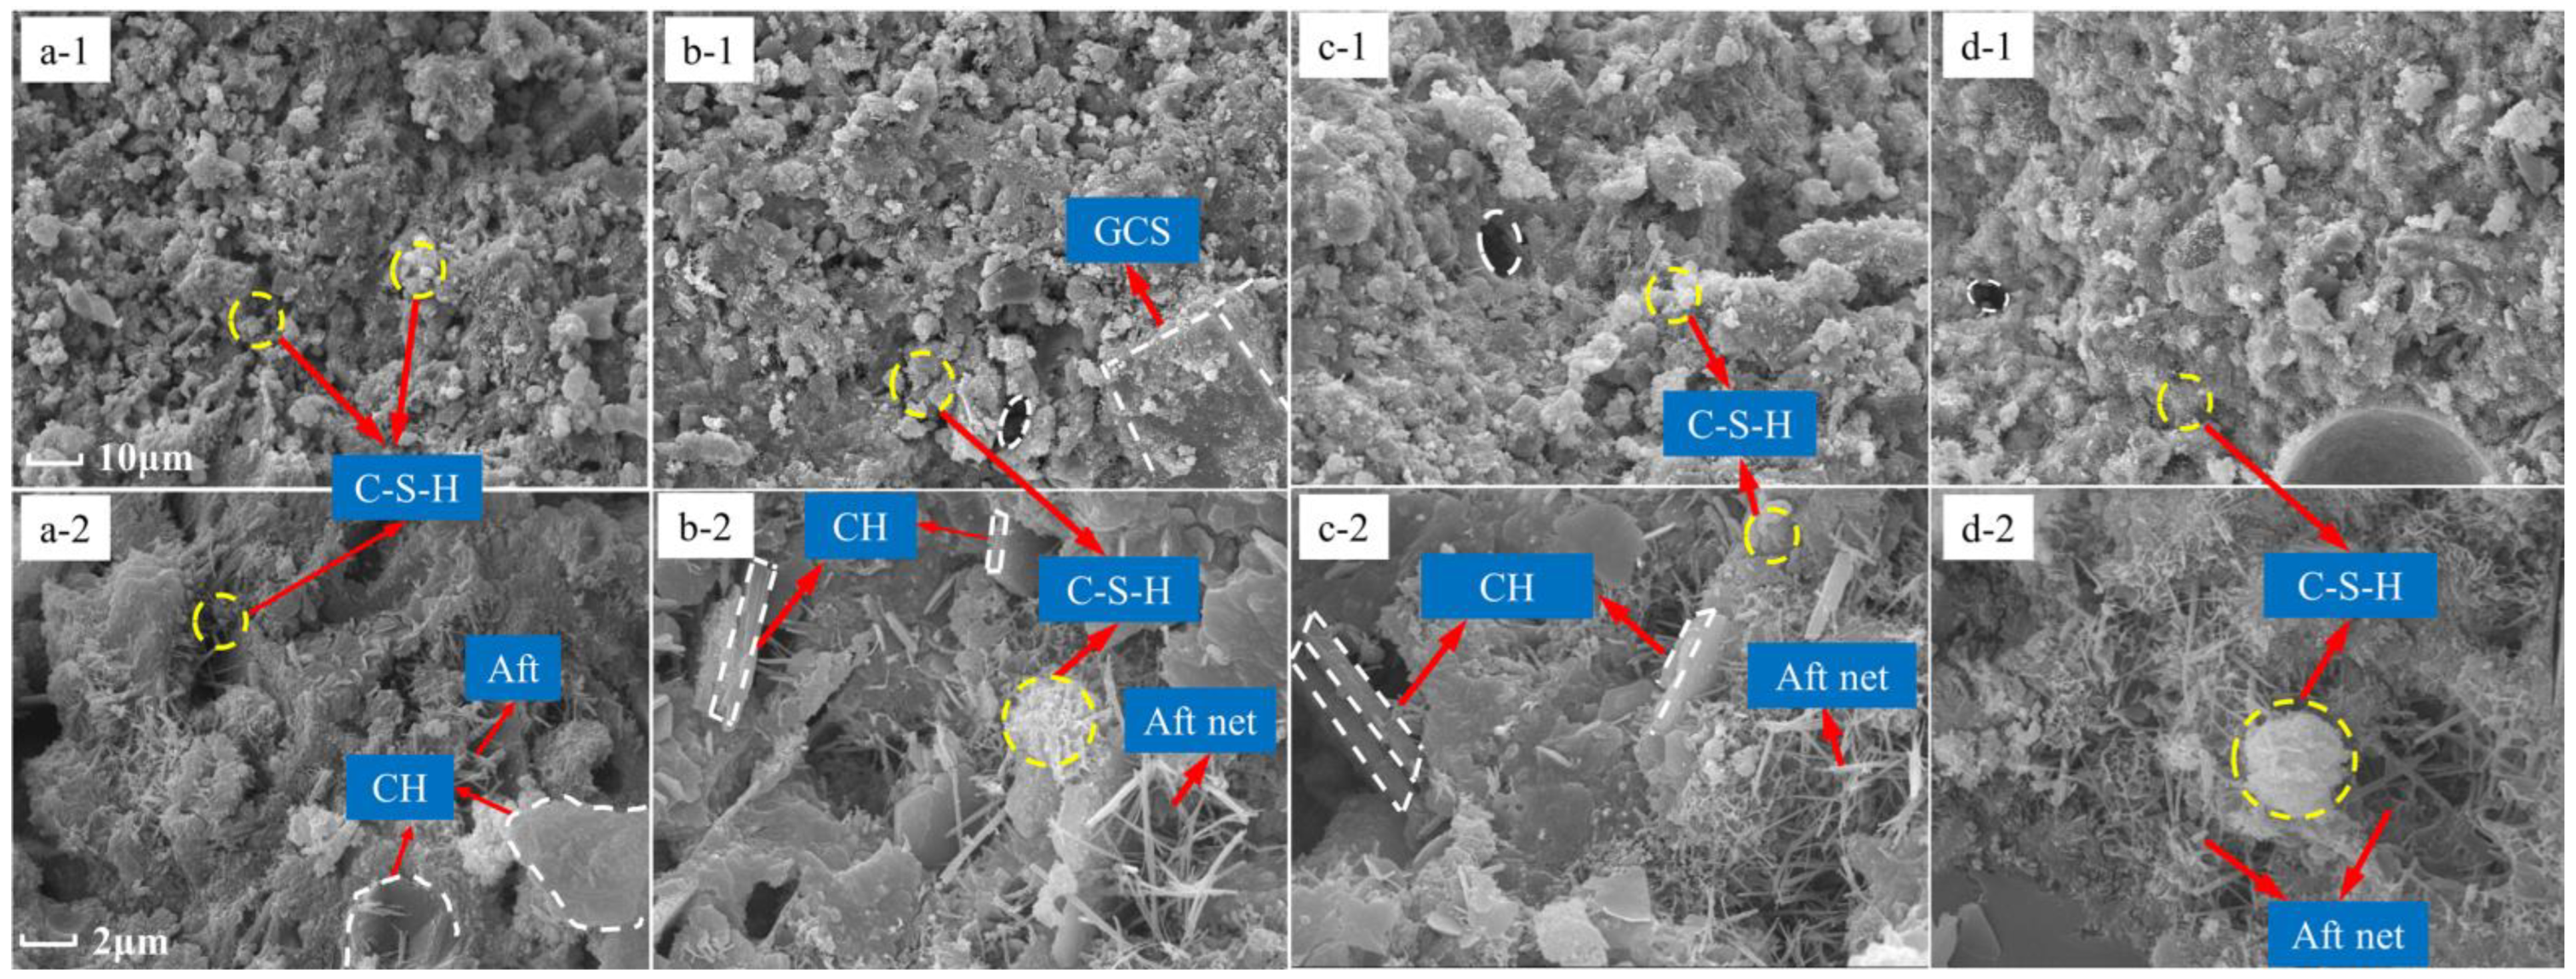
- From SEM and EDS, the addition of Al2O3 accelerates the dissociation of RGCS, thus releasing more active molecules, enhancing the growth of hydration products of blended cement samples, filling the structurally weak regions, promoting the formation of C-S-H with high Ca/Si, Al/Si, and Fe/Si ratios, and reaching the optimum level at 10 wt% addition of Al2O3.
Author Contributions
Funding
Institutional Review Board Statement
Informed Consent Statement
Data Availability Statement
Conflicts of Interest
Correction Statement
References
- Liu, J.; Zhang, S.; Wagner, F. Exploring the driving forces of energy consumption and environmental pollution in China’s cement industry at the provincial level. J. Clean. Prod. 2018, 184, 274–285. [Google Scholar] [CrossRef]
- Wang, Y.; Zhu, Q.; Geng, Y. Trajectory and driving factors for GHG emissions in the Chinese cement industry. J. Clean. Prod. 2013, 53, 252–260. [Google Scholar] [CrossRef]
- Zaetang, Y.; Sata, V.; Wongsa, A.; Chindaprasirt, P. Properties of pervious concrete containing recycled concrete block aggregate and recycled concrete aggregate. Constr. Build. Mater. 2016, 111, 15–21. [Google Scholar] [CrossRef]
- Schlesinger, M.; King, M.; Sole, K.; Davenport, W. Extractive Metallurgy of Copper; Elsevier: Amsterdam, The Netherlands, 2011. [Google Scholar]
- Dhir, R.K.; de Brito, J.; Mangabhai, R.; Lye, C.Q. Sustainable Construction Materials: Copper Slag; Elsevier: Amsterdam, The Netherlands, 2016. [Google Scholar]
- Tixier, R.; Devaguptapu, R.; Mobasher, B. The effect of copper slag on the hydration and mechanical properties of cementitious mixtures. Cem. Concr. Res. 1997, 27, 1569–1580. [Google Scholar] [CrossRef]
- Edwin, R.S.; De Schepper, M.; Gruyaert, E.; De Belie, N. Effect of secondary copper slag as cementitious material in ultra-high performance mortar. Constr. Build. Mater. 2016, 119, 31–44. [Google Scholar] [CrossRef]
- Kriskova, L.; Pontikes, Y.; Cizer, Ö.; Mertens, G.; Veulemans, W.; Geysen, D.; Jones, P.T.; Vandewalle, L.; Van Balen, K.; Blanpain, B. Effect of mechanical activation on the hydraulic properties of stainless steel slags. Cem. Concr. Res. 2012, 42, 778–788. [Google Scholar] [CrossRef]
- Lan, W.T.; Wu, A.X.; Yu, P. Development of a new controlled low strength filling material from the activation of copper slag: Influencing factors and mechanism analysis. J. Clean. Prod. 2020, 246, 119060. [Google Scholar] [CrossRef]
- Feng, Y.; Kero, J.; Yang, Q.; Chen, Q.; Engström, F.; Samuelsson, C.; Qi, C. Mechanical Activation of Granulated Copper Slag and Its Influence on Hydration Heat and Compressive Strength of Blended Cement. Materials 2019, 12, 772. [Google Scholar] [CrossRef]
- He, Y.; Chen, Q.S.; Qi, C.C.; Zhang, Q.L.; Xiao, C.C. Lithium slag and fly ash-based binder for cemented fine tailings backfill. J. Environ. Manag. 2019, 248, 109282. [Google Scholar] [CrossRef]
- Krivenko, P.; Petropavlovsky, O.; Petranek, V.; Pushkar, V.; Vozniuk, G. High Strength Alkali Activated Slag Cements with Controlled Setting Times and Early Strength Gain. Adv. Mater. Res. 2015, 1100, 44–49. [Google Scholar] [CrossRef]
- Feng, Y.; Chen, Q.; Zhou, Y.; Yang, Q.; Zhang, Q.; Jiang, L.; Guo, H. Modification of glass structure via CaO addition in granulated copper slag to enhance its pozzolanic activity. Constr. Build. Mater. 2020, 240, 117970. [Google Scholar] [CrossRef]
- Mostaghel, S.; Matsushita, T.; Samuelsson, C.; Björkman, B.; Seetharaman, S. Influence of alumina on physical properties of an industrial zinc–copper smelting slag Part 3—Melting behaviour. Trans. Inst. Min. Metall. Sect. C Miner. Process. Extr. Metall. 2013, 122, 56–62. [Google Scholar] [CrossRef]
- Collier, N.C. Transition and decomposition temperatures of cement phases—A collection of thermal analysis data. Ceram. Silik. 2016, 60, 338–343. [Google Scholar] [CrossRef]
- Park, H.-S.; Park, S.S.; Sohn, I. The Viscous Behavior of FeOt-Al2O3-SiO2 Copper Smelting Slags. Metall. Mater. Trans. B Process Metall. Mater. Process. Sci. 2011, 42, 692–699. [Google Scholar] [CrossRef]
- Park, J.H.; Kim, H.; Min, D.J. Novel Approach to Link between Viscosity and Structure of Silicate Melts via Darken’s Excess Stability Function: Focus on the Amphoteric Behavior of Alumina. Metall. Mater. Trans. B Process Metall. Mater. Process. Sci. 2008, 39, 150–153. [Google Scholar] [CrossRef]
- Mihailova, I.; Mehandjiev, D. Characterization of Fayalite from Copper Slags. J. Univ. Chem. Technol. Metall. 2010, 45, 317–326. [Google Scholar]
- Kim, H.; Matsuura, H.; Tsukihashi, F.; Wang, W.; Min, D.J.; Sohn, I. Effect of Al2O3 and CaO/SiO2 on the Viscosity of Calcium-Silicate–Based Slags Containing 10 Mass Pct MgO. Metall. Mater. Trans. B Process Metall. Mater. Process. Sci. 2013, 44, 5–12. [Google Scholar] [CrossRef]
- Liu, M.; Liu, X.; Wang, W.; Guo, J.; Zhang, L.; Zhang, H. Effect of SiO2 and Al2O3 on characteristics of lightweight aggregate made from sewage sludge and river sediment. Ceram. Int. 2018, 44, 4313–4319. [Google Scholar] [CrossRef]
- Feng, Y.; Yang, Q.; Chen, Q.; Kero, J.; Andersson, A.; Ahmed, H.; Engström, F.; Samuelsson, C. Characterization and evaluation of the pozzolanic activity of granulated copper slag modified with CaO. J. Clean. Prod. 2019, 232, 1112–1120. [Google Scholar] [CrossRef]
- Zhao, B.; Jak, E.; Hayes, P. The effect of Al2O3 on liquidus temperatures of fayalite slags. Metall. Mater. Trans. B Process Metall. Mater. Process. Sci. 1999, 30, 597–605. [Google Scholar] [CrossRef]
- Potysz, A.; Kierczak, J.; Fuchs, Y.; Grybos, M.; Guibaud, G.; Lens, P.N.L.; van Hullebusch, E.D. Characterization and pH-dependent leaching behaviour of historical and modern copper slags. J. Geochem. Explor. 2016, 160, 1–15. [Google Scholar] [CrossRef]
- Wang, L.; Li, G.; Li, X.; Guo, F.; Tang, S.; Lu, X.; Hanif, A. Influence of reactivity and dosage of MgO expansive agent on shrinkage and crack resistance of face slab concrete. Cem. Concr. Compos. 2022, 126, 104333. [Google Scholar] [CrossRef]
- Shi, Y.; Wei, Y.; Zhou, S.; Li, B.; Yang, Y.; Wang, H. Effect of B2O3 content on the viscosity of copper slag. J. Alloys Compd. 2019, 822, 153478. [Google Scholar] [CrossRef]
- Chinese National Standard GB/T 17671-1999, Method of Testing Cements—Determinationof Strength. Available online: http://www.gb688.cn/bzgk/gb/newGbInfo?hcno=7AD06455D640C969669ACAEEB4AB1762 (accessed on 5 May 2022). (In Chinese).
- Chen, Q.-S.; Zhang, Q.-L.; Fourie, A.; Chen, X.; Qi, C.-C. Experimental investigation on the strength characteristics of cement paste backfill in a similar stope model and its mechanism. Constr. Build. Mater. 2017, 154, 34–43. [Google Scholar] [CrossRef]
- Cihangir, F.; Ercikdi, B.; Kesimal, A.; Deveci, H.; Erdemir, F. Paste backfill of high-sulphide mill tailings using alkali-activated blast furnace slag: Effect of activator nature, concentration and slag properties. Miner. Eng. 2015, 83, 117–127. [Google Scholar] [CrossRef]
- Feng, Y.; Zhang, Q.L.; Chen, Q.S.; Wang, D.L.; Guo, H.; Liu, L.; Yang, Q. Hydration and strength development in blended cement with ultrafine granulated copper slag. PLoS ONE 2019, 14, e0215677. [Google Scholar] [CrossRef]
- Wang, L.; Song, X.; Yang, H.; Wang, L.; Tang, S.; Wu, B.; Mao, W. Pore Structural and Fractal Analysis of the Effects of MgO Reactivity and Dosage on Permeability and F–T Resistance of Concrete. Fractal Fract. 2022, 6, 113. [Google Scholar] [CrossRef]
- Deepthi, T.; Balamurugan, K. Effect of Yttrium (20%) doping on mechanical properties of rare earth nano lanthanum phosphate (LaPO4) synthesized by aqueous sol-gel process. Ceram. Int. 2019, 45, 18229–18235. [Google Scholar] [CrossRef]
- Li, X.; Peng, K.; Peng, J.; Hou, D. Experimental investigation of cyclic wetting-drying effect on mechanical behavior of a medium-grained sandstone. Eng. Geol. 2021, 293, 106335. [Google Scholar] [CrossRef]
- Wang, D.-L.; Zhang, Q.-L.; Chen, Q.-S.; Qi, C.-C.; Feng, Y.; Xiao, C.-C. Temperature variation characteristics in flocculation settlement of tailings and its mechanism. Int. J. Miner. Met. Mater. 2020, 27, 1438–1448. [Google Scholar] [CrossRef]
- Tadros, M.E.; Skalny, J.; Kalyoncu, R.S. Early Hydration of Tricalcium Silicate. J. Am. Ceram. Soc. 1976, 59, 344–347. [Google Scholar] [CrossRef]
- Young, J.F. A review of the mechanisms of set-retardation in portland cement pastes containing organic admixtures. Cem. Concr. Res. 1972, 2, 415–433. [Google Scholar] [CrossRef]
- Liu, L.; Zhu, C.; Qi, C.; Zhang, B.; Song, K.-I. A microstructural hydration model for cemented paste backfill considering internal sulfate attacks. Constr. Build. Mater. 2019, 211, 99–108. [Google Scholar] [CrossRef]
- Liu, S.; Xie, G.; Wang, S. Effect of curing temperature on hydration properties of waste glass powder in cement-based materials. J. Therm. Anal. Calorim. 2015, 119, 47–55. [Google Scholar] [CrossRef]
- El-Didamony, H.; Sharara, A.M.; Helmy, I.M.; El-Aleem, S.A. Hydration characteristics of β-C2S in the presence of some accelerators. Cem. Concr. Res. 1996, 26, 1179–1187. [Google Scholar] [CrossRef]
- Ding, Y.; Dai, J.-G.; Shi, C.-J. Fracture properties of alkali-activated slag and ordinary Portland cement concrete and mortar. Constr. Build. Mater. 2018, 165, 310–320. [Google Scholar] [CrossRef]
- Haha, M.B.; LE Saout, G.; Winnefeld, F.; Lothenbach, B. Influence of activator type on hydration kinetics, hydrate assemblage and microstructural development of alkali activated blast-furnace slags. Cem. Concr. Res. 2011, 41, 301–310. [Google Scholar] [CrossRef]
- Taylor, H.F. Proposed Structure for Calcium Silicate Hydrate Gel. J. Am. Ceram. Soc. 1986, 69, 464–467. [Google Scholar] [CrossRef]
- Antiohos, S.; Maganari, K.; Tsimas, S. Evaluation of blends of high and low calcium fly ashes for use as supplementary cementing materials. Cem. Concr. Compos. 2005, 27, 349–356. [Google Scholar] [CrossRef]
- Payá, J.; Monzó, J.; Borrachero, M.V.; Velázquez, S. Evaluation of the pozzolanic activity of fluid catalytic cracking catalyst residue (FC3R). Thermogravimetric analysis studies on FC3R-Portland cement pastes. Cem. Concr. Res. 2003, 33, 603–609. [Google Scholar] [CrossRef]
- Zachariasen, W.H. The atomic arrangement in glass. J. Am. Chem. Soc. 1932, 54, 3841–3851. [Google Scholar] [CrossRef]
- Stebbins, J.F.; Xu, Z. NMR evidence for excess non-bridging oxygen in an aluminosilicate glass. Nature 1997, 390, 60–62. [Google Scholar] [CrossRef]
- Lee, T.-C.; Wang, W.-J.; Shih, P.-Y. Slag–cement mortar made with cement and slag vitrified from MSWI fly-ash/scrubber-ash and glass frit. Constr. Build. Mater. 2008, 22, 1914–1921. [Google Scholar] [CrossRef]
- Allahverdi, A.; Mahinroosta, M. Mechanical activation of chemically activated high phosphorous slag content cement. Powder Technol. 2013, 245, 182–188. [Google Scholar] [CrossRef]
- Ramirez, D.E.A.; de Gutierrez, R.M.; Puertas, F. Alkali-activated Portland blast-furnace slag cement: Mechanical properties and hydration. Constr. Build. Mater. 2017, 140, 119–128. [Google Scholar] [CrossRef]
- Nath, S.; Kumar, S. Evaluation of the suitability of ground granulated silico-manganese slag in Portland slag cement. Constr. Build. Mater. 2016, 125, 127–134. [Google Scholar] [CrossRef]


| Constituents | Chemical Composition (% by Mass) | |||
|---|---|---|---|---|
| CSA0 | CSA05 | CSA10 | PC | |
| FeO | 35.89 | 33.91 | 32.15 | |
| SiO2 | 33.40 | 32.70 | 32.70 | 18.10 |
| CaO | 4.00 | 3.90 | 3.70 | 62.10 |
| Fe2O3 | 7.14 | 9.11 | 9.47 | 2.80 |
| Al2O3 | 3.50 | 6.60 | 9.80 | 4.90 |
| MgO | 1.39 | 0.82 | 0.82 | 1.20 |
| ZnO | 1.35 | 1.02 | 0.95 | |
| Cu2O | 1.65 | 0.68 | 0.64 | |
| Cr2O3 | 0.85 | 0.27 | 0.26 | |
| Sb2O5 | 0.11 | 0.04 | 0.04 | |
| Pb2O3 | 0.04 | 0.01 | 0.01 | |
| Physical characteristics | ||||
| BET surface area (m2·g−1) | 0.67 | 0.67 | 0.69 | 0.47 |
| Density (g·cm−3) | 3.56 | 3.49 | 3.46 | 3.08 |
| Sample | The Second Peak | The Third Peak | Cumulative Heat (J/g) | ||||
|---|---|---|---|---|---|---|---|
| Time of Peak Occurrence (h) | Peak Value (mW/g) | Time of Peak Occurrence (h) | Peak Value (mW/g) | 20 h | 60 h | 120 h | |
| OPC | 8.0 | 2.72 | – | – | 139.4 | 204.8 | 219.0 |
| CSA0 | 8.4 | 2.20 | 13.2 | 2.30 | 113.5 | 158.0 | 175.6 |
| CSA05 | 8.4 | 2.23 | 13.0 | 2.35 | 117.1 | 162.0 | 180.7 |
| CSA10 | 8.2 | 2.25 | 12.8 | 2.48 | 117.3 | 163.4 | 184.2 |
| Sample | UCS Ratio (%) | UCS Development Rate (MPa·d−1) | |||
|---|---|---|---|---|---|
| 7 d | 28 d | 90 d | from 7 d to 28 d | from 28 d to 90 d | |
| P1 | 100.0 | 100.0 | 100.0 | 0.10 | 0.01 |
| C0 | 48.6 | 72.6 | 80.6 | 0.61 | 0.07 |
| C5 | 53.4 | 88.3 | 91.5 | 0.87 | 0.03 |
| C10 | 58.2 | 96.9 | 103.7 | 0.96 | 0.06 |
Publisher’s Note: MDPI stays neutral with regard to jurisdictional claims in published maps and institutional affiliations. |
© 2022 by the authors. Licensee MDPI, Basel, Switzerland. This article is an open access article distributed under the terms and conditions of the Creative Commons Attribution (CC BY) license (https://creativecommons.org/licenses/by/4.0/).
Share and Cite
Wang, D.; Zhang, Q.; Feng, Y.; Chen, Q.; Xiao, C.; Li, H.; Xiang, Y.; Qi, C. Hydration and Mechanical Properties of Blended Cement with Copper Slag Pretreated by Thermochemical Modification. Materials 2022, 15, 3477. https://doi.org/10.3390/ma15103477
Wang D, Zhang Q, Feng Y, Chen Q, Xiao C, Li H, Xiang Y, Qi C. Hydration and Mechanical Properties of Blended Cement with Copper Slag Pretreated by Thermochemical Modification. Materials. 2022; 15(10):3477. https://doi.org/10.3390/ma15103477
Chicago/Turabian StyleWang, Daolin, Qinli Zhang, Yan Feng, Qiusong Chen, Chongchun Xiao, Hongpeng Li, Yujing Xiang, and Chongchong Qi. 2022. "Hydration and Mechanical Properties of Blended Cement with Copper Slag Pretreated by Thermochemical Modification" Materials 15, no. 10: 3477. https://doi.org/10.3390/ma15103477