
A Resistivity Plate Loading Device for Assessing the Factors Affecting the Stiffness of a Cement-Stabilized Subgrade


Abstract
:1. Introduction
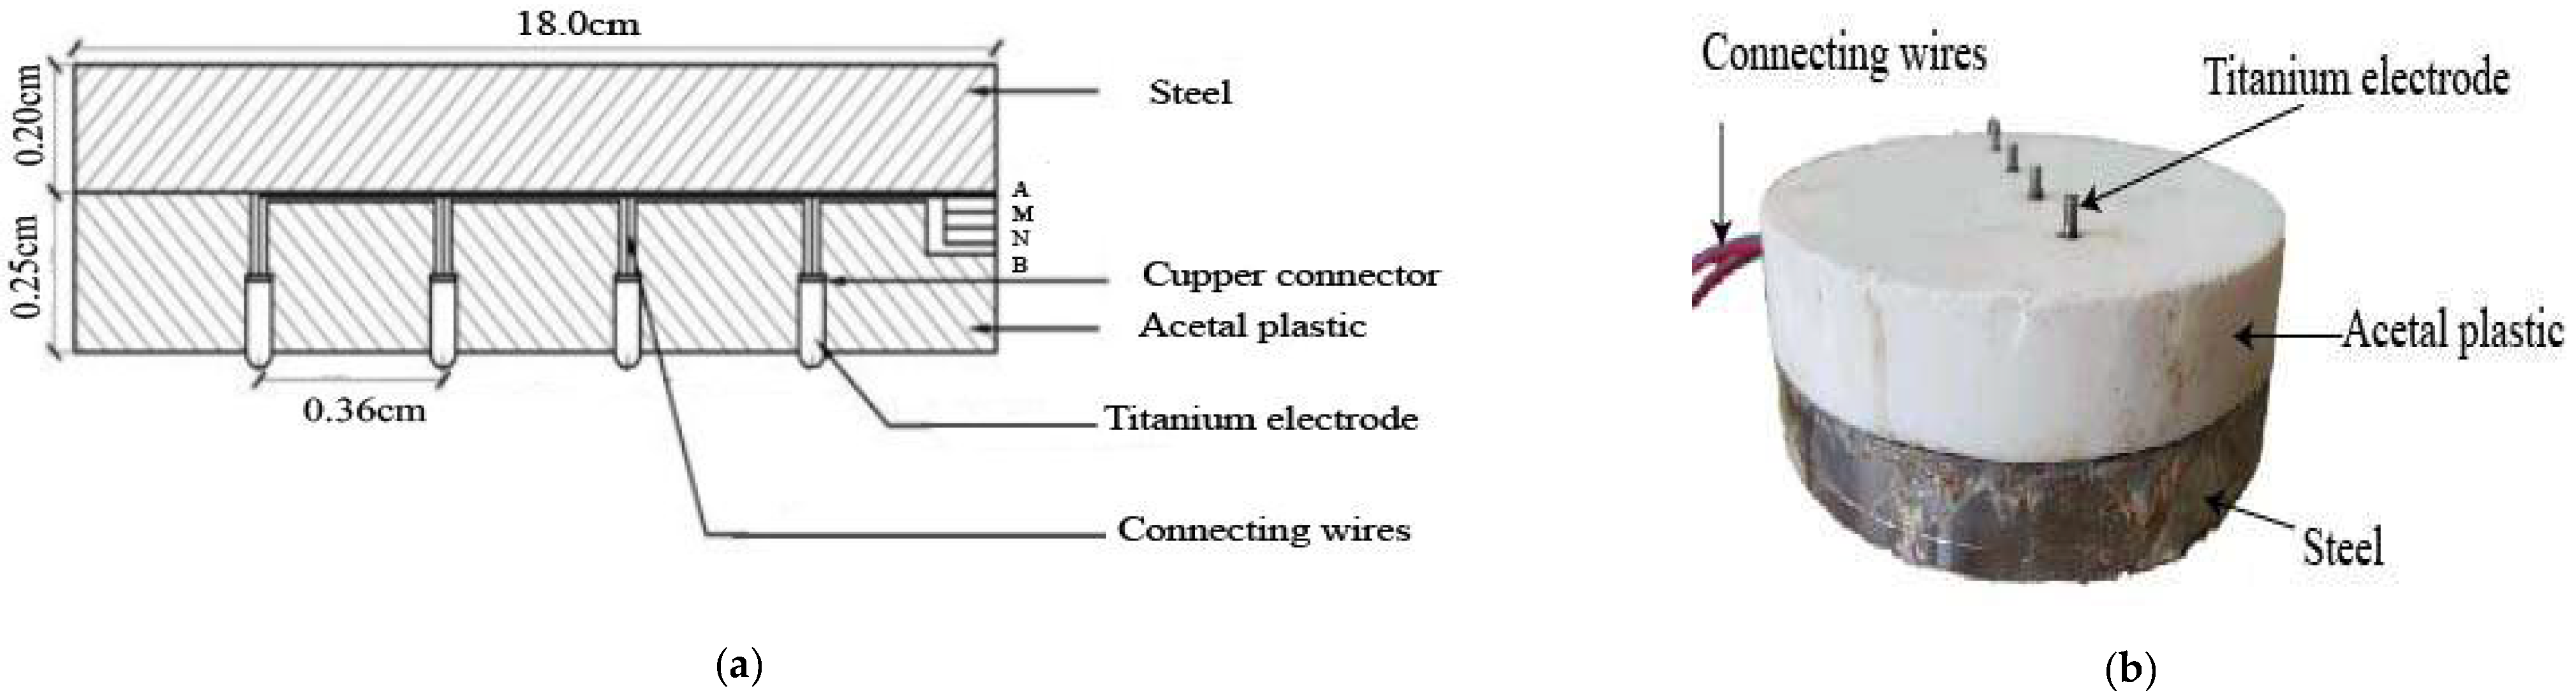
Resistivity Plate Loading Device
2. Experimental Program, Materials, Soil Preparation, and Testing
2.1. Experimental Program
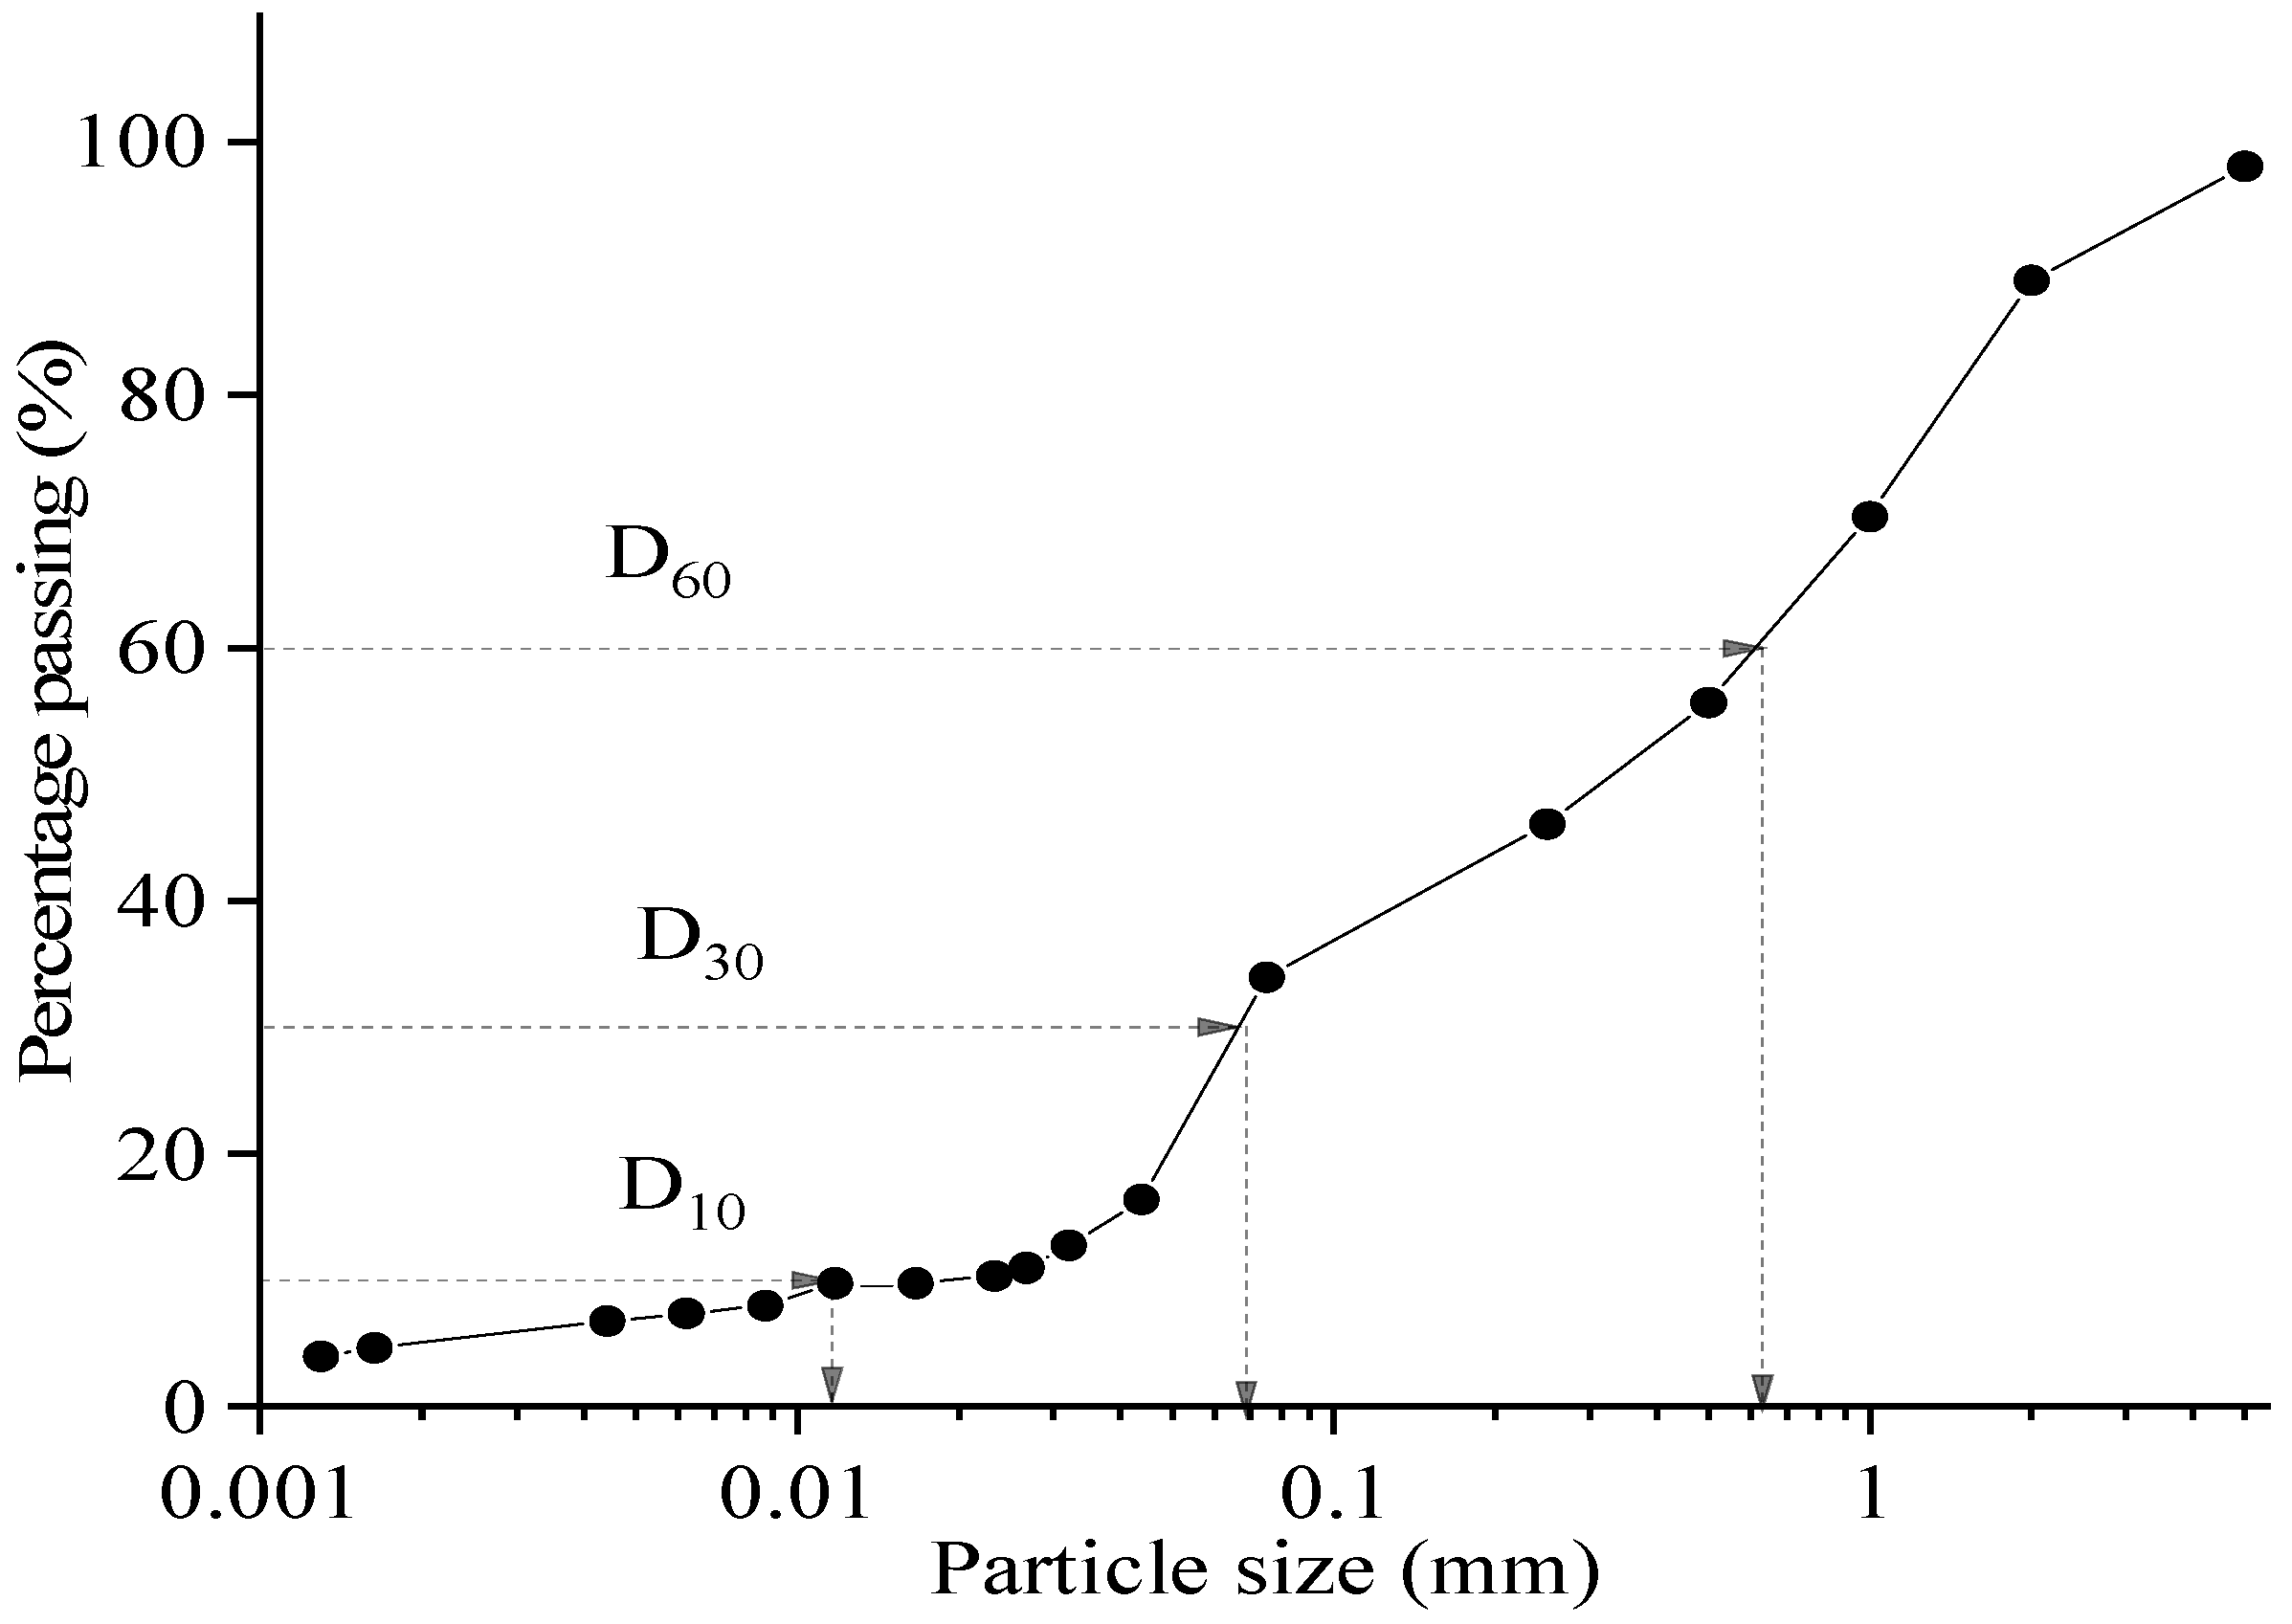
2.2. Soil Properties
2.3. Development of Taguchi Orthogonal Array
2.4. Soil Preparation
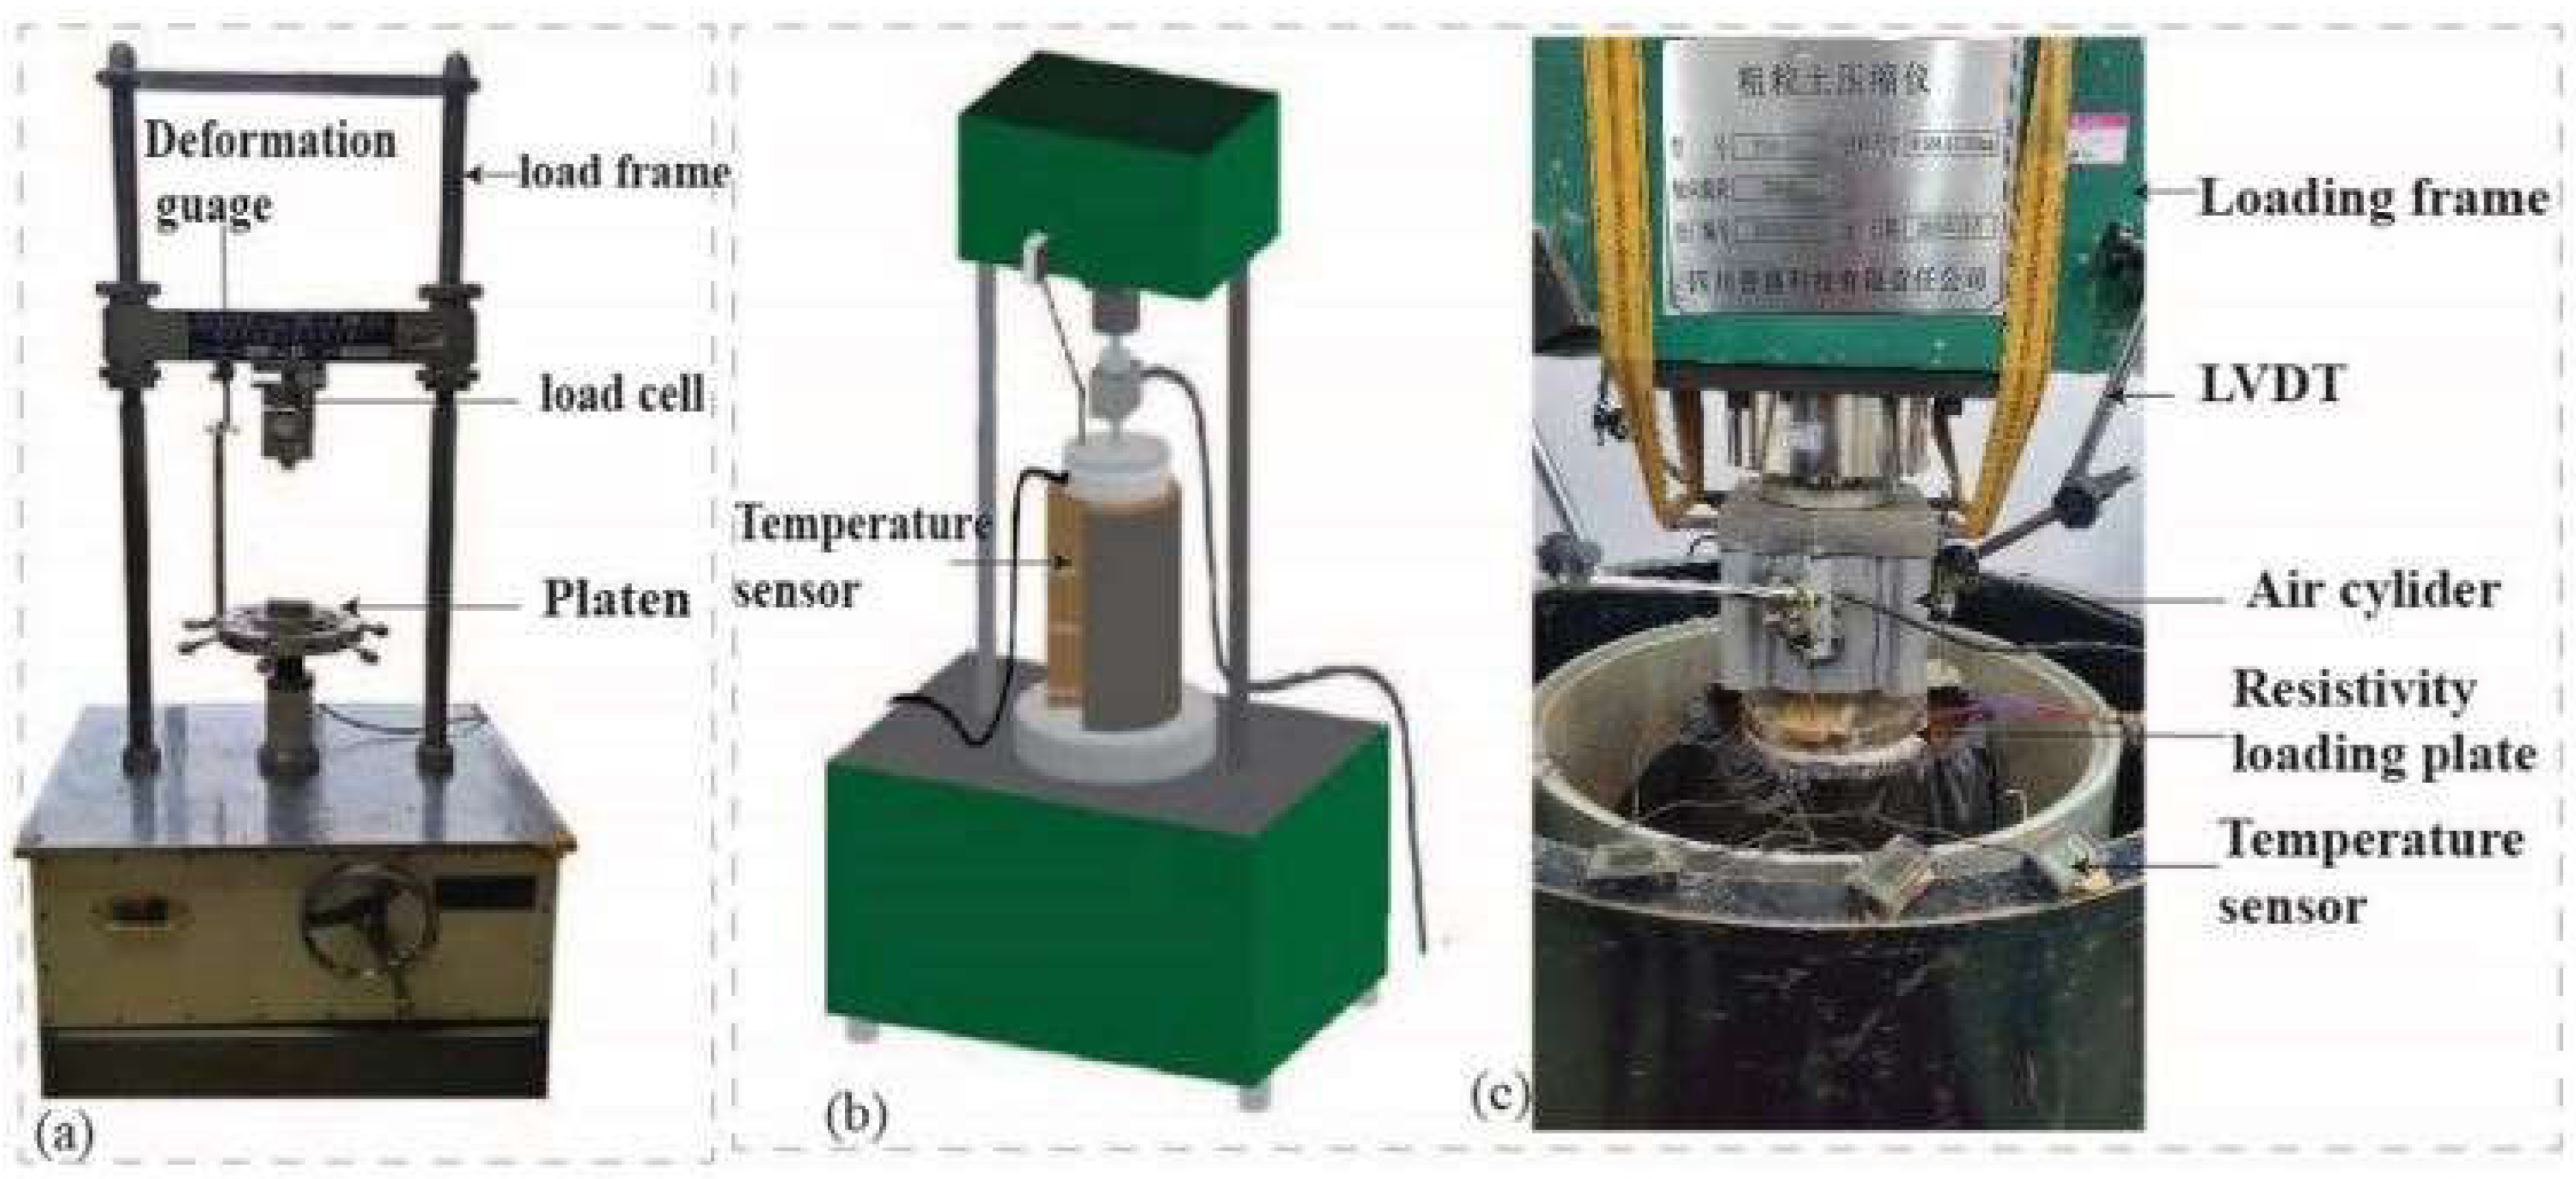
2.5. Test Setup
3. Testing Process
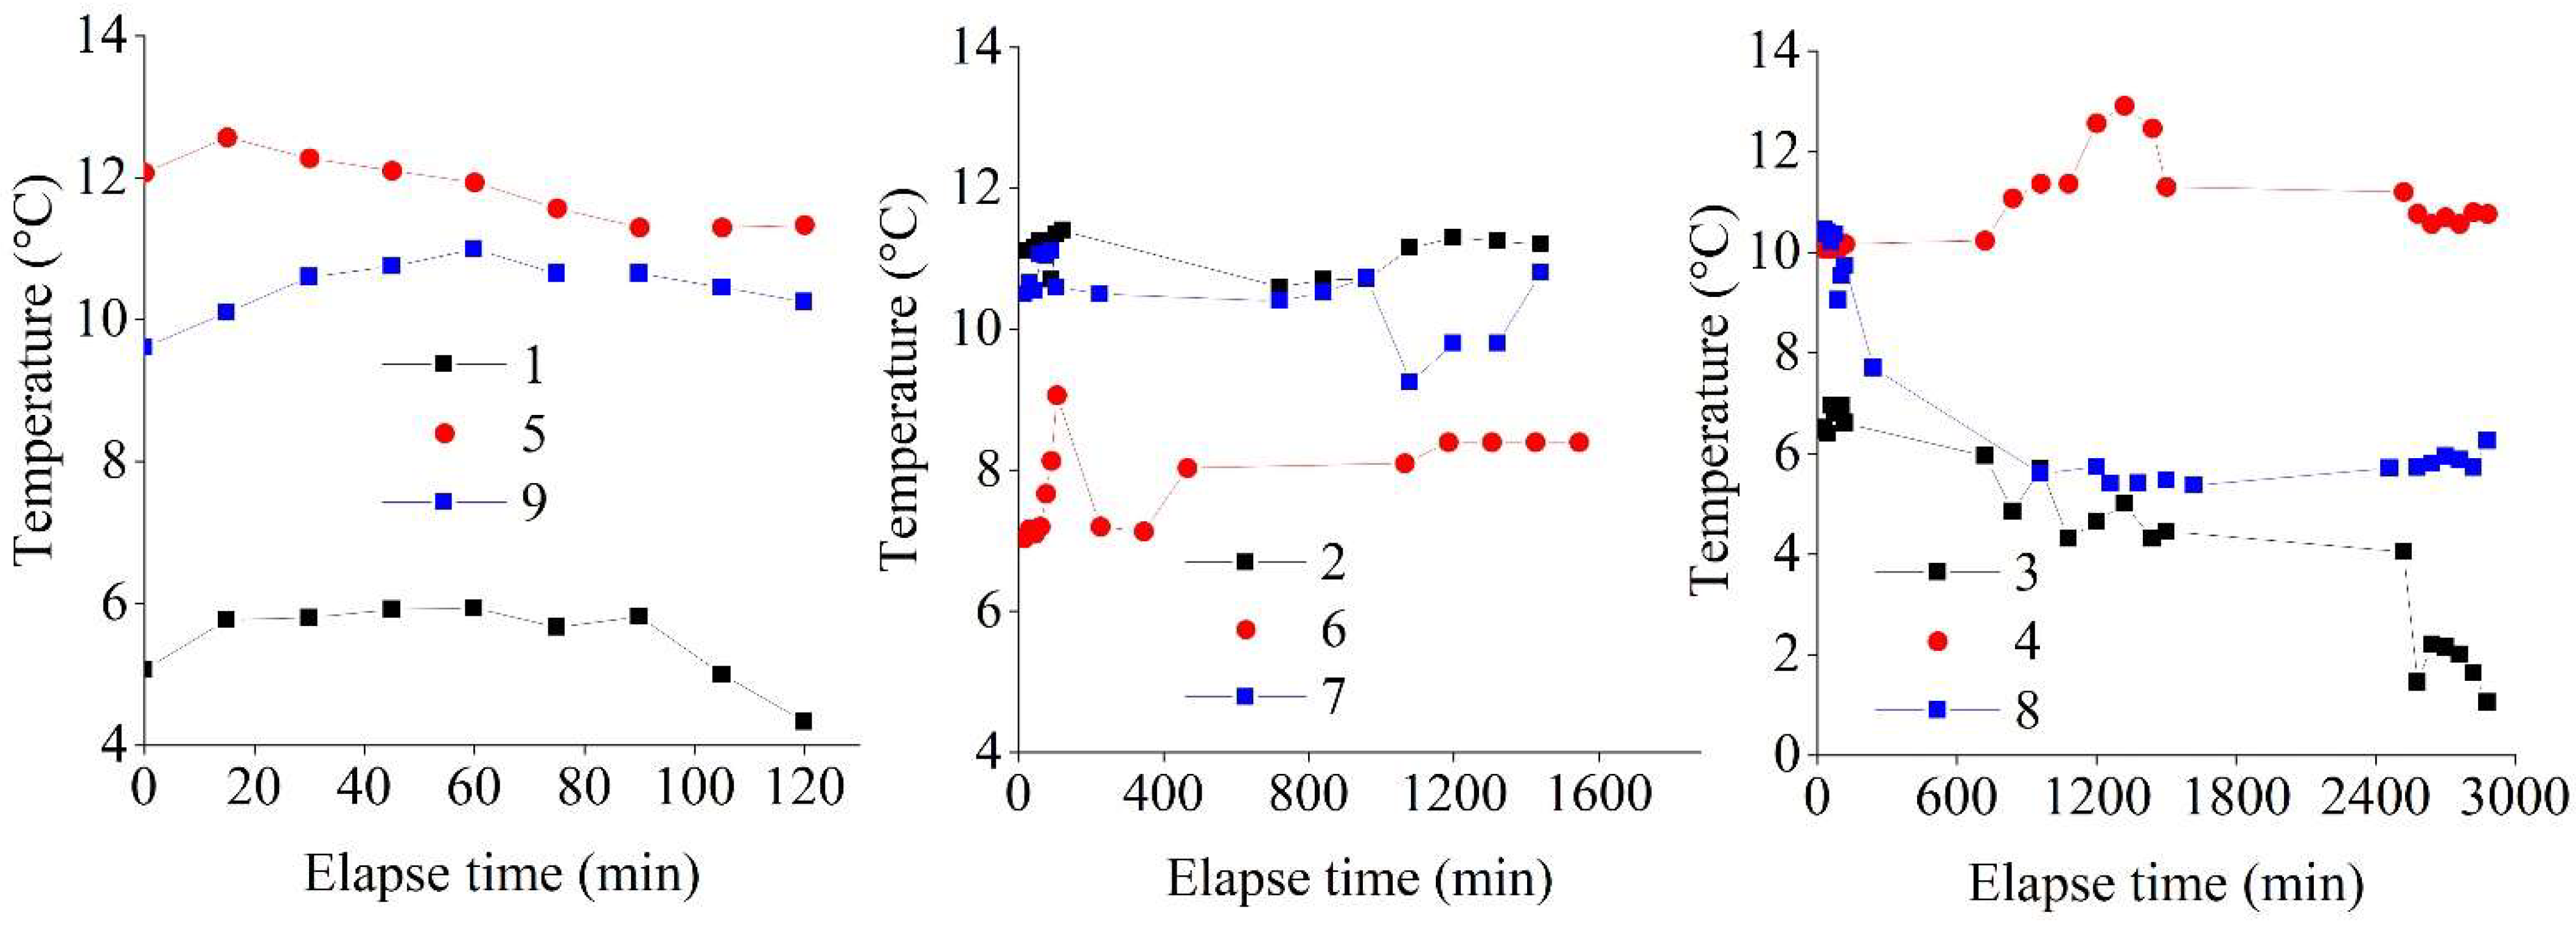
3.1. Temperature
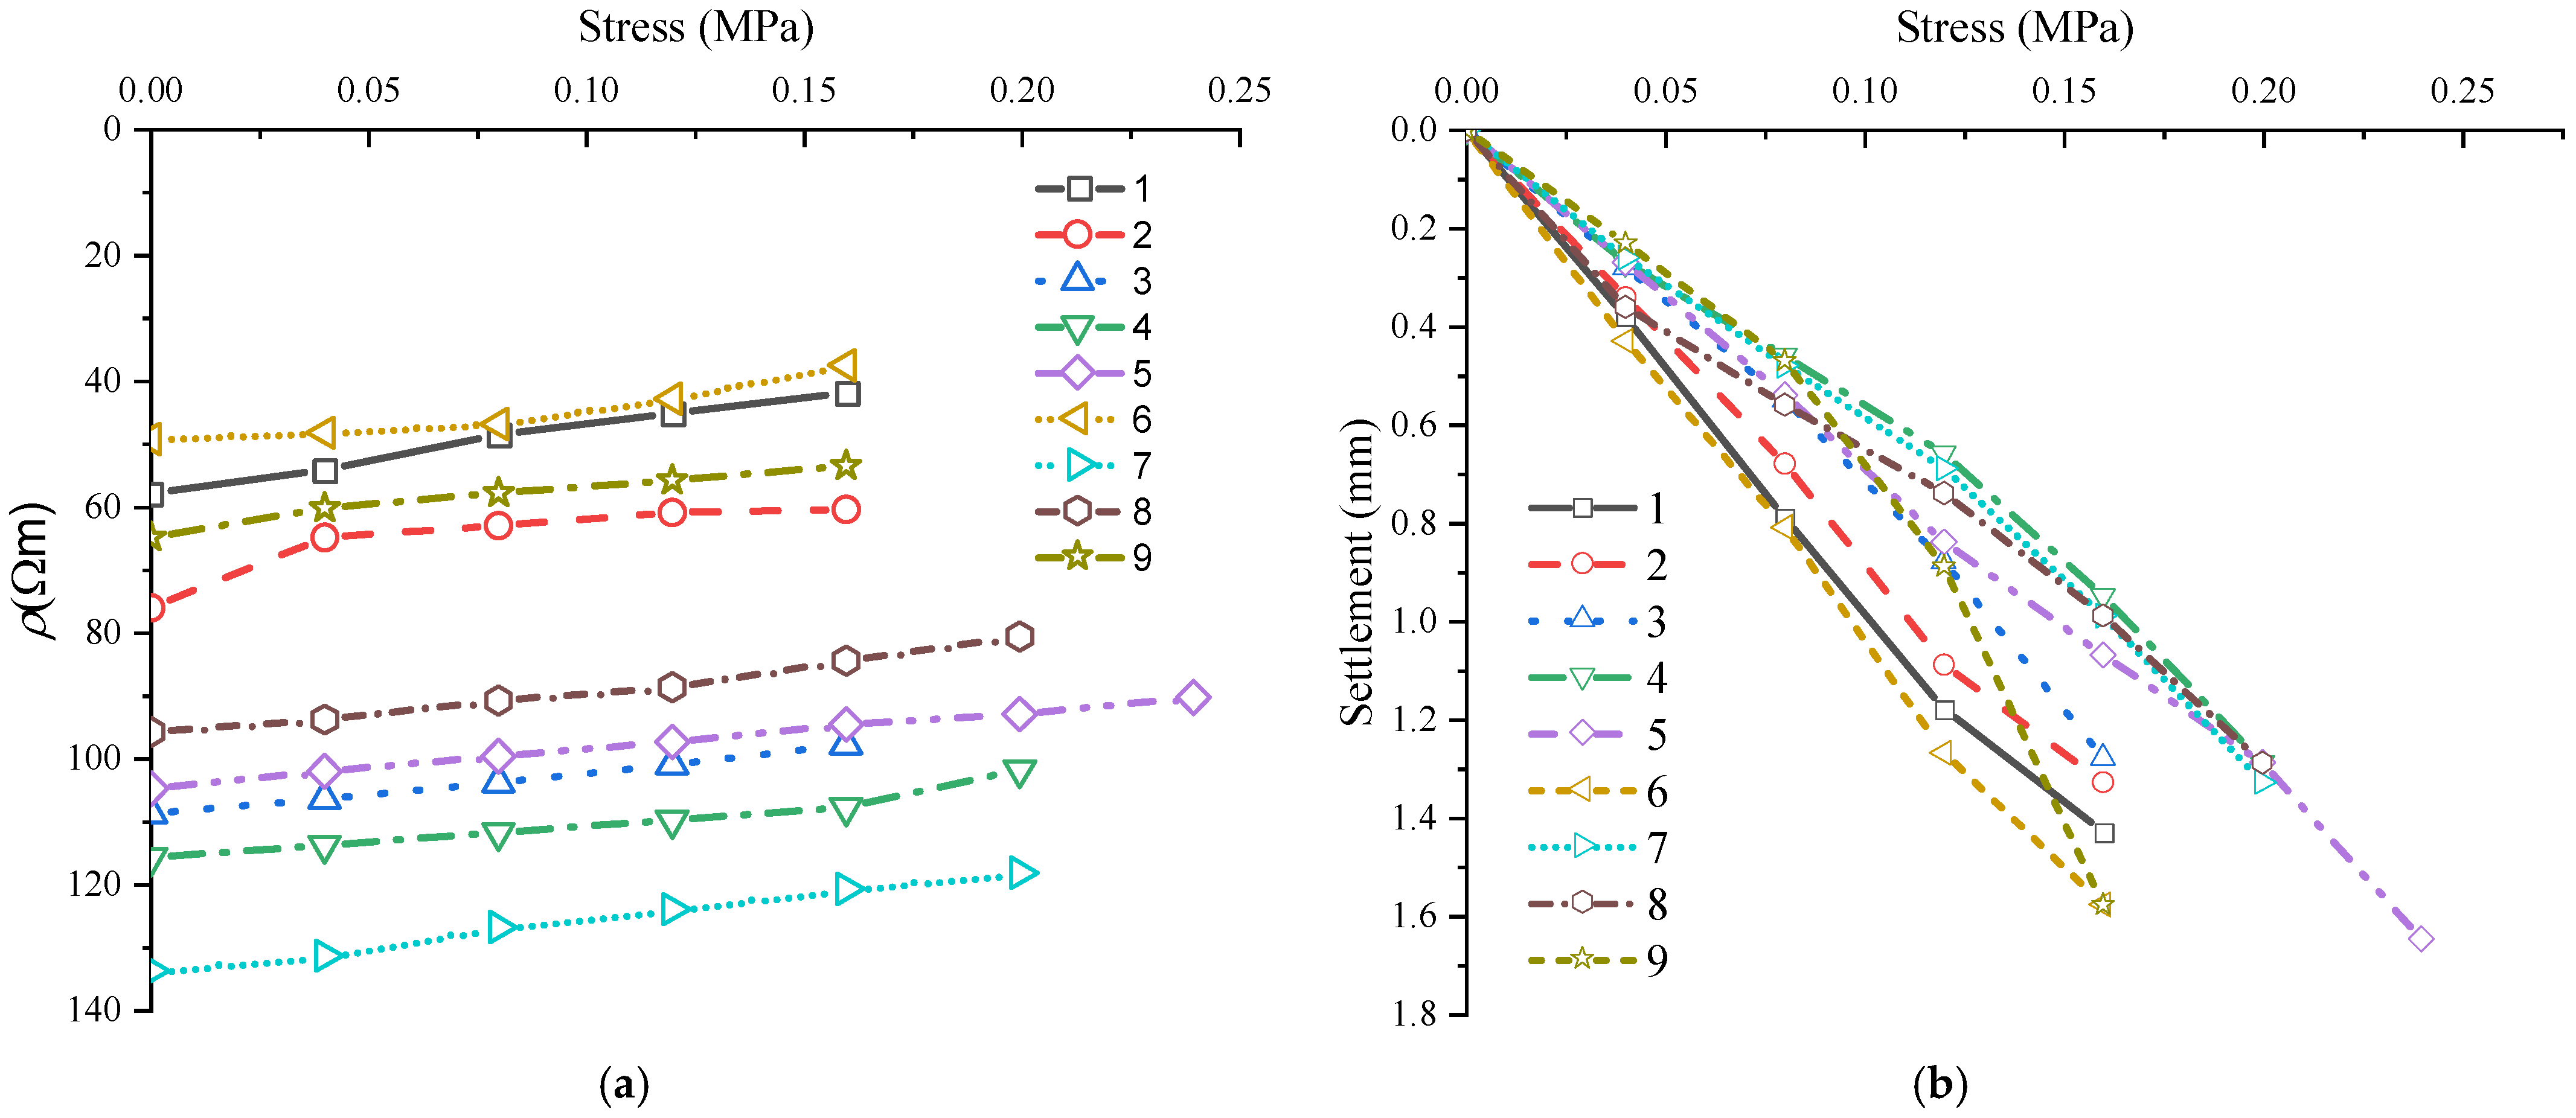
3.2. Resistivity Subgrade Reaction Modulus Test
3.3. Unconfined Compression Strength Test
3.4. Explanation of Test Results
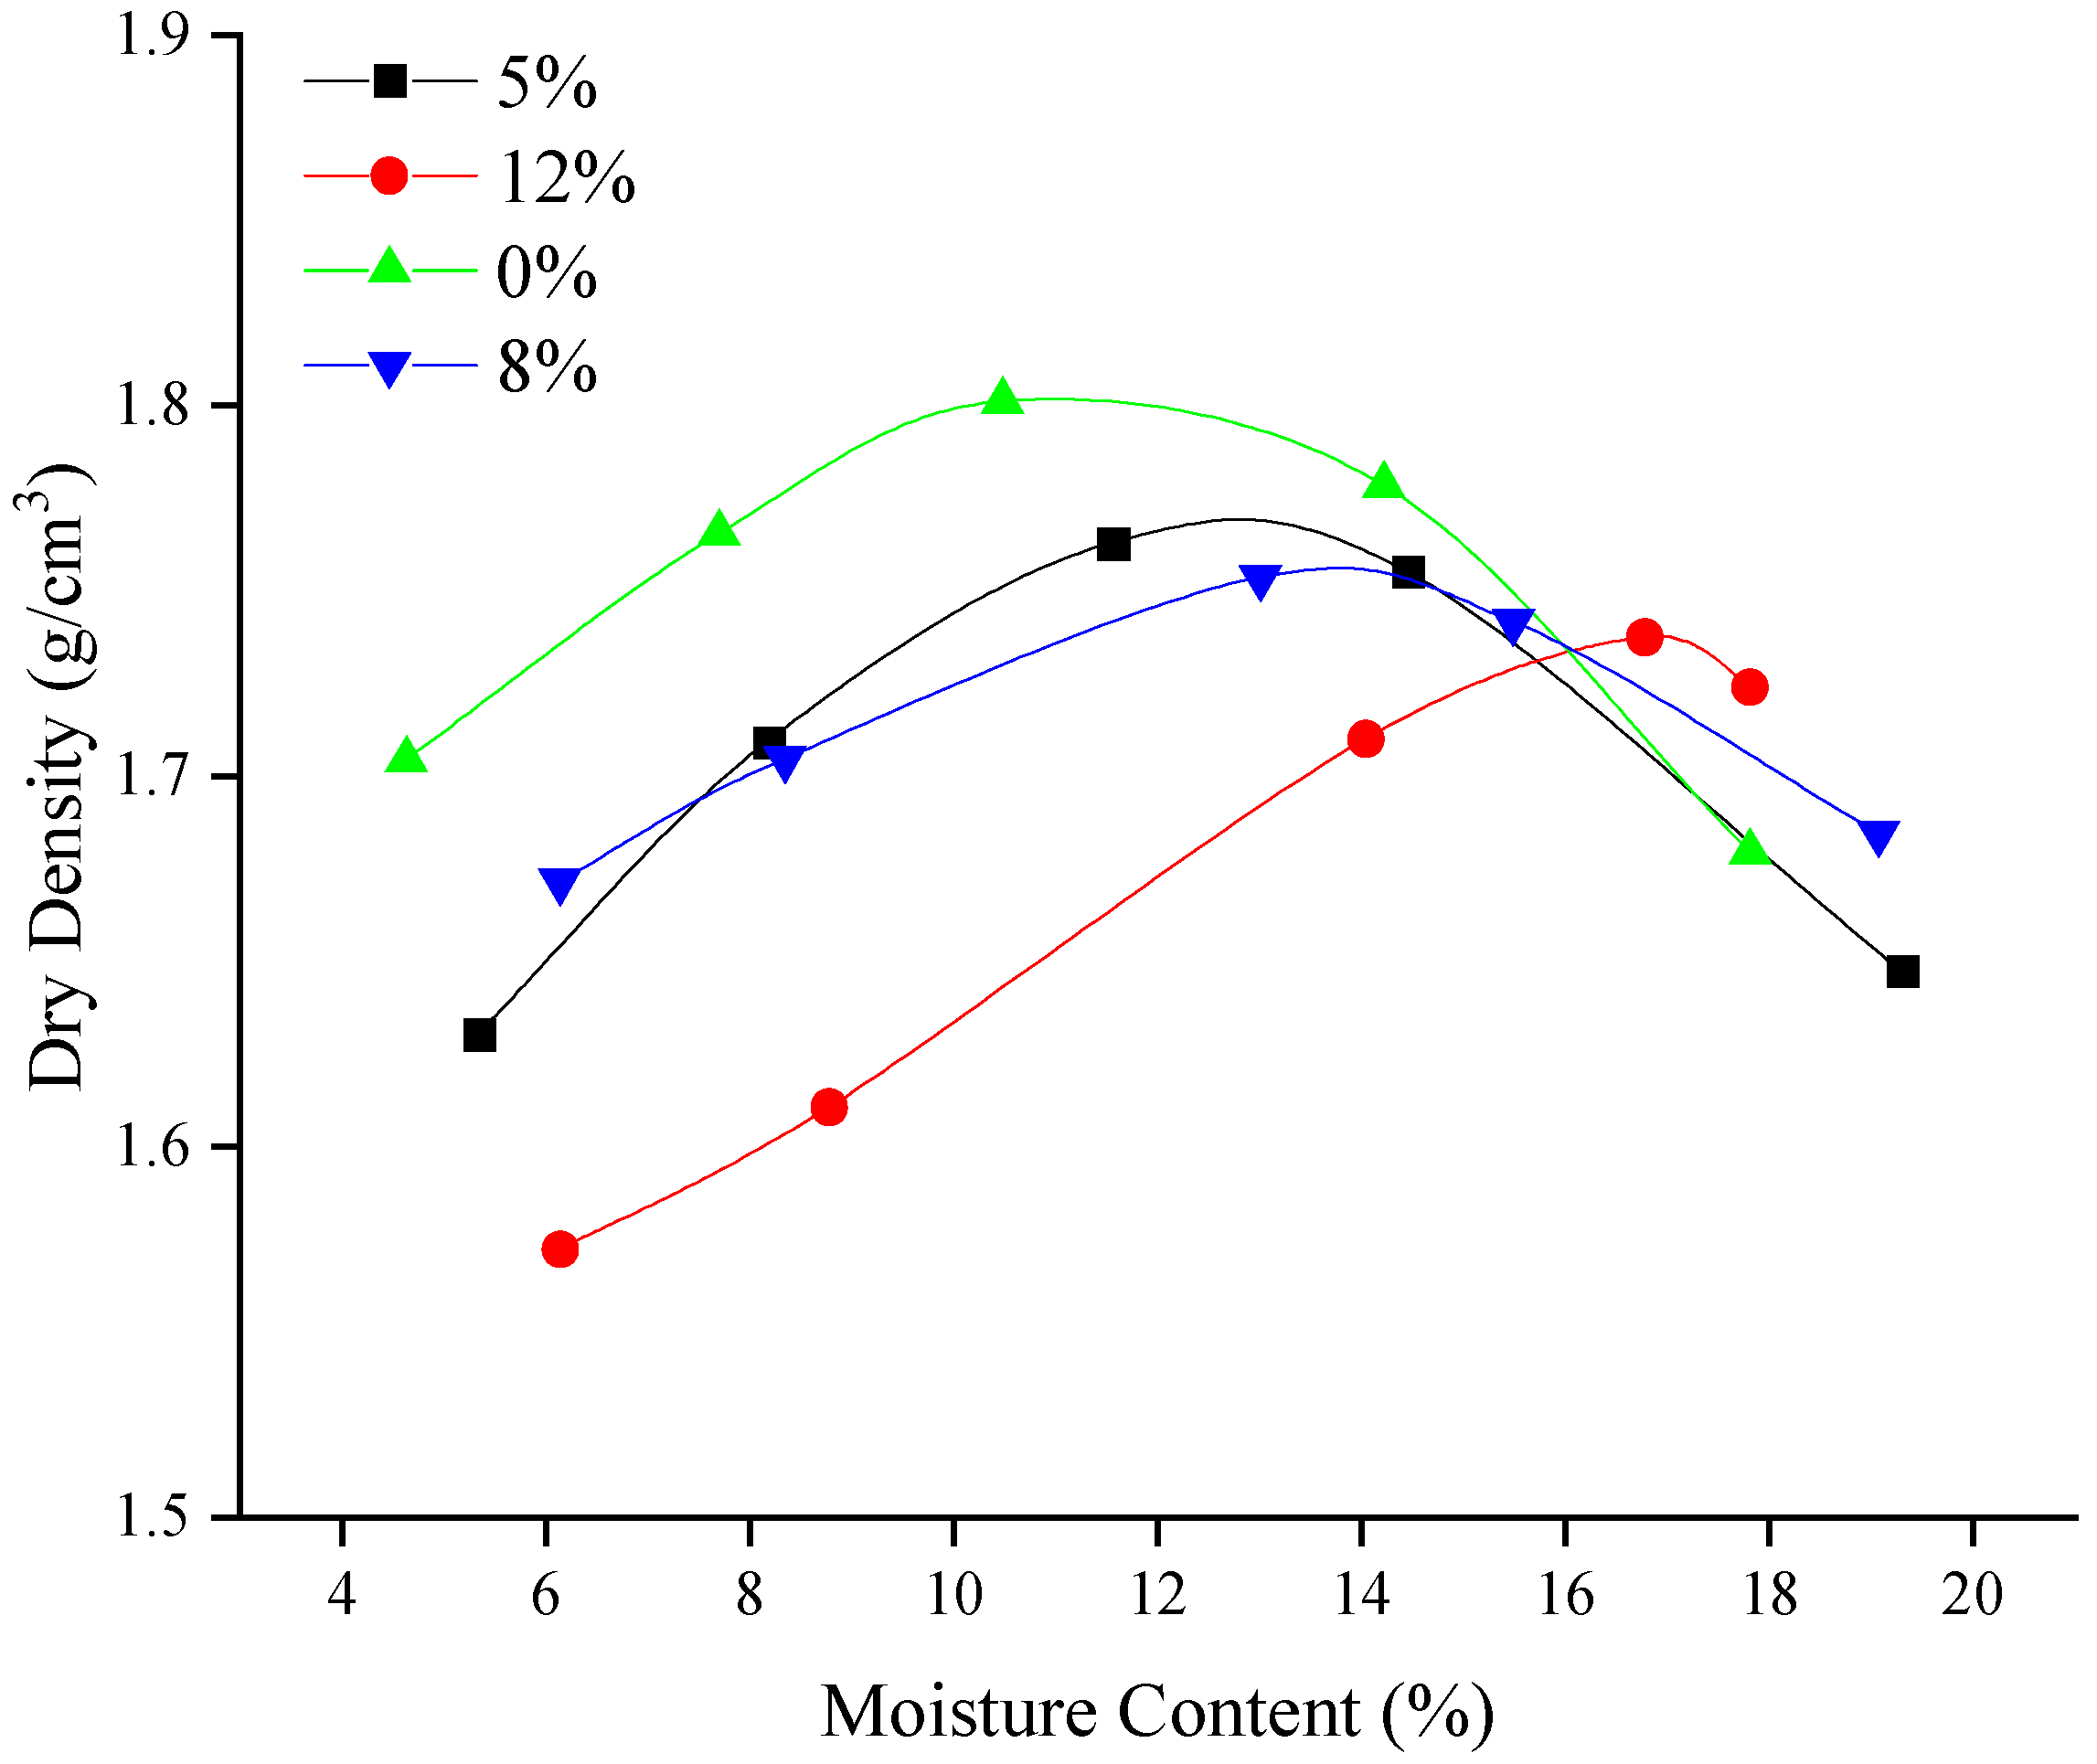
3.4.1. Compaction
3.4.2. Temperature
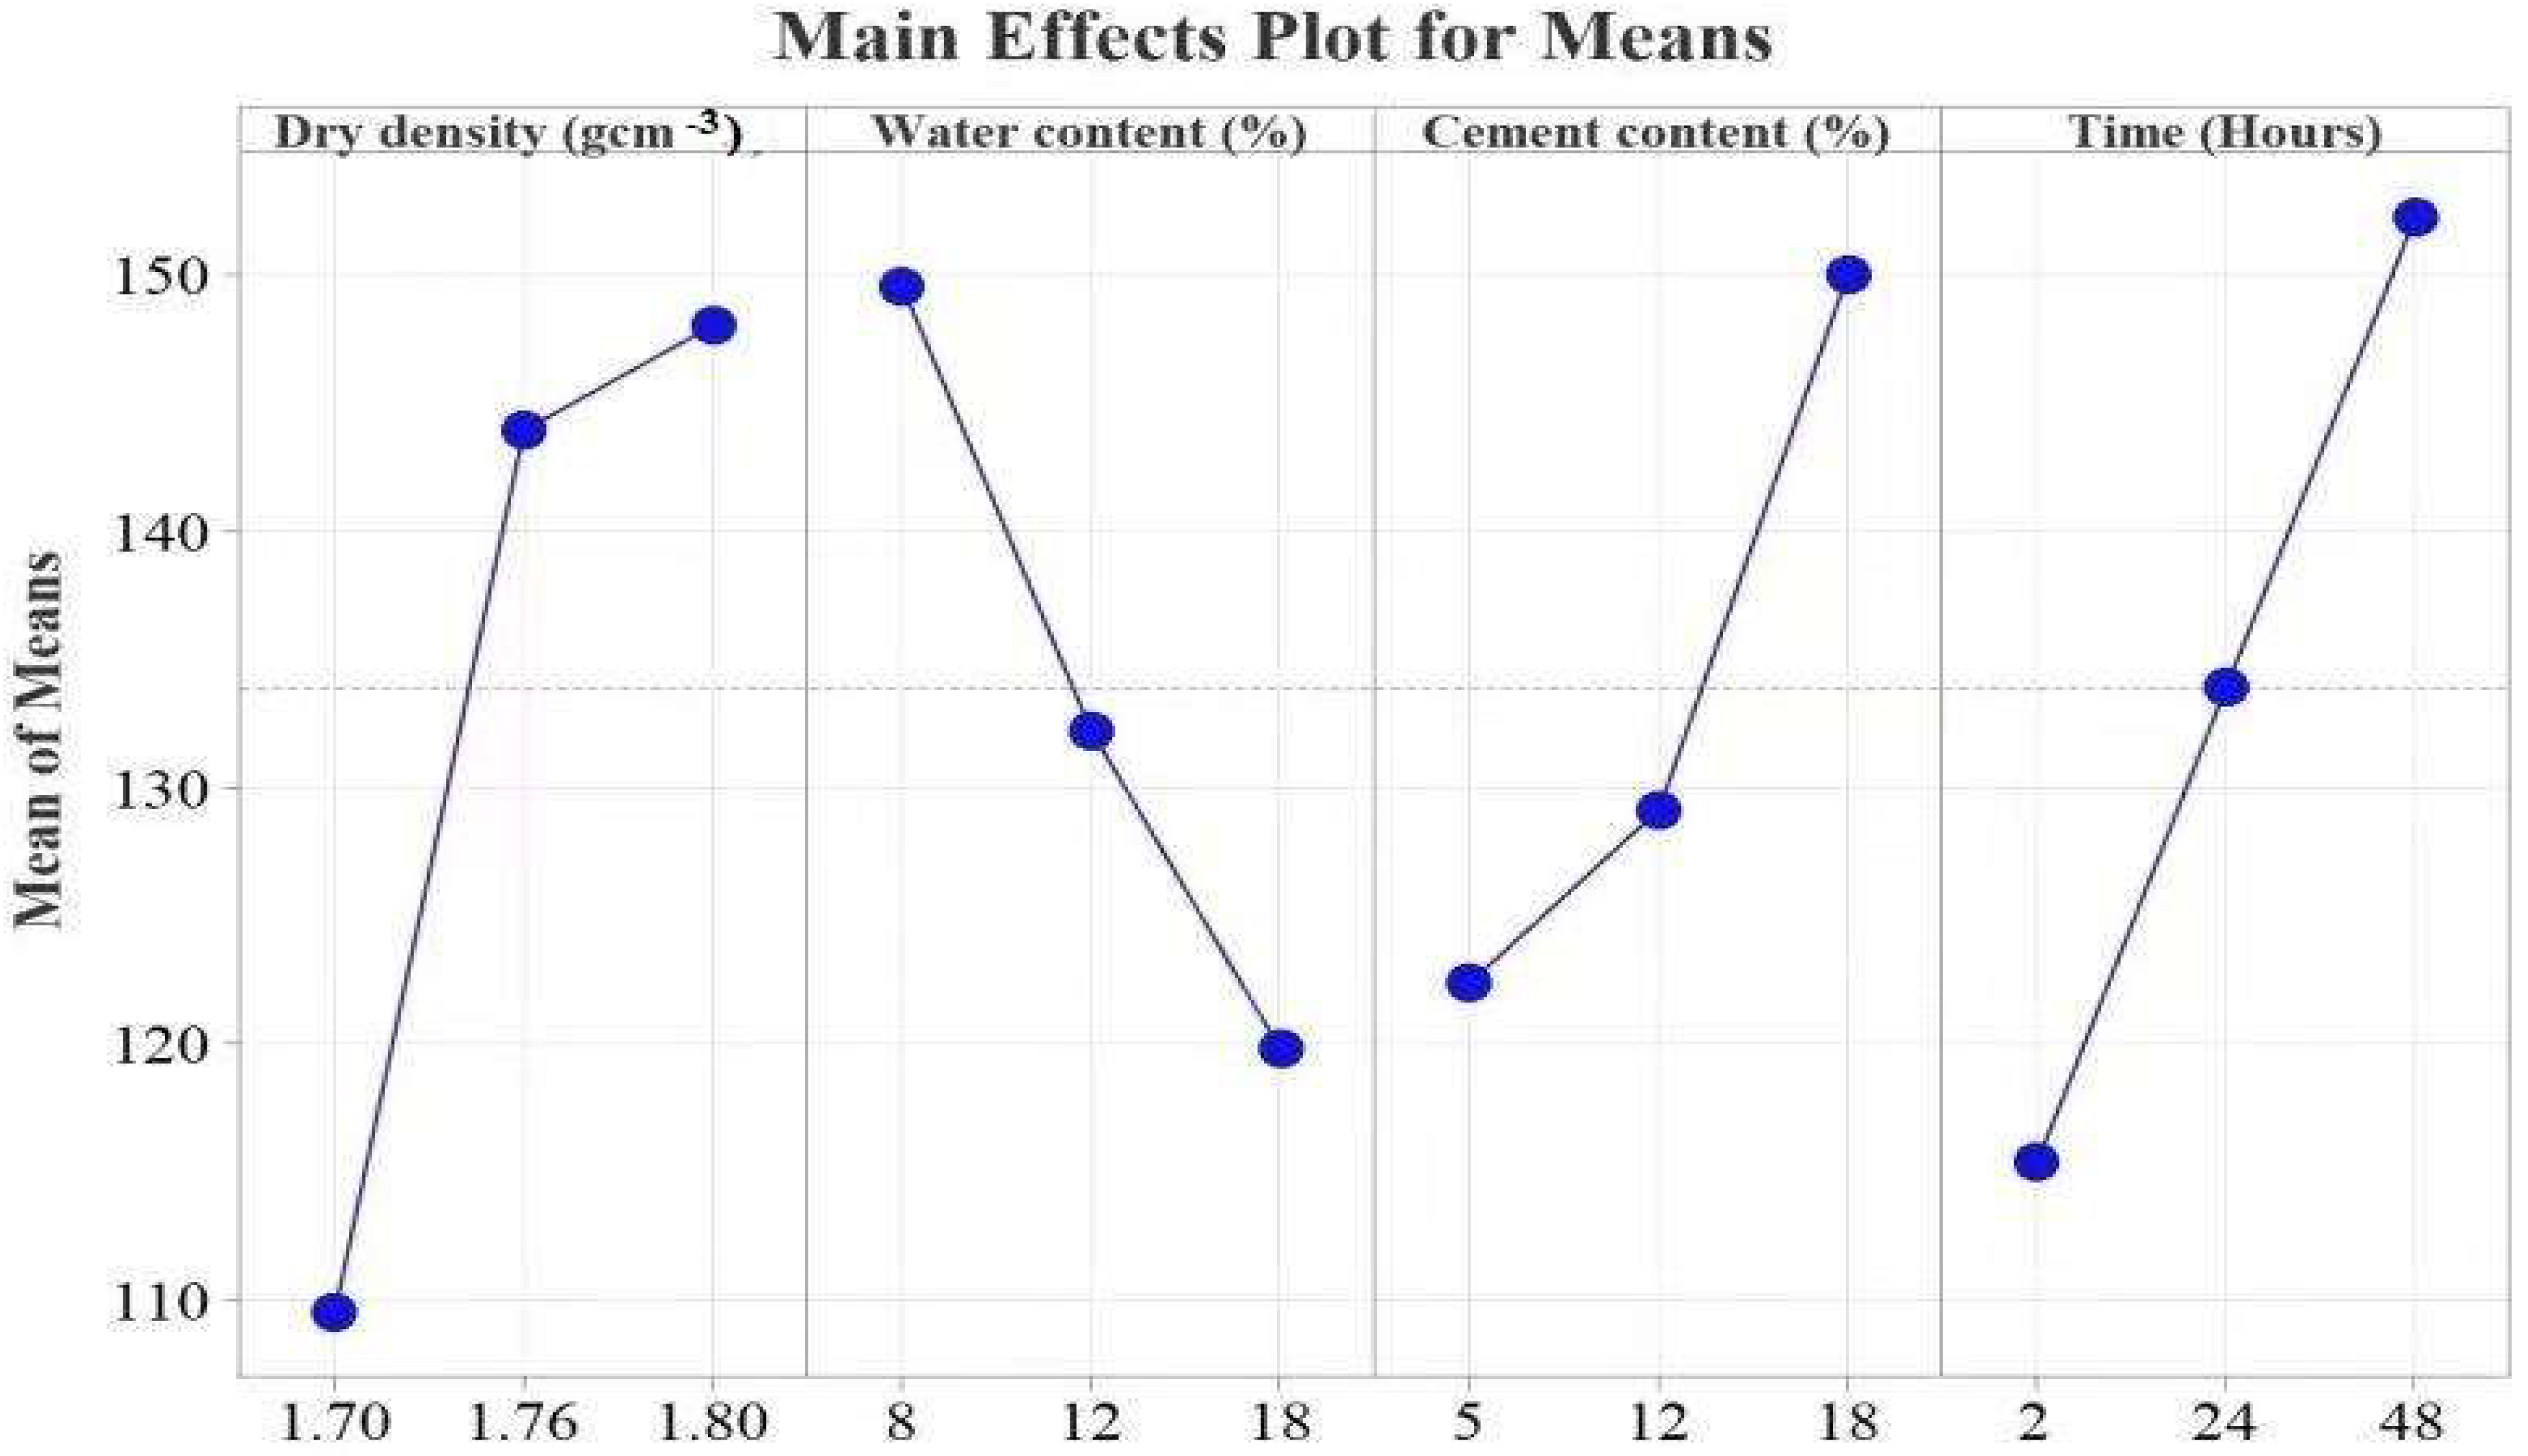
3.4.3. Resistivity Subgrade Reaction Modulus
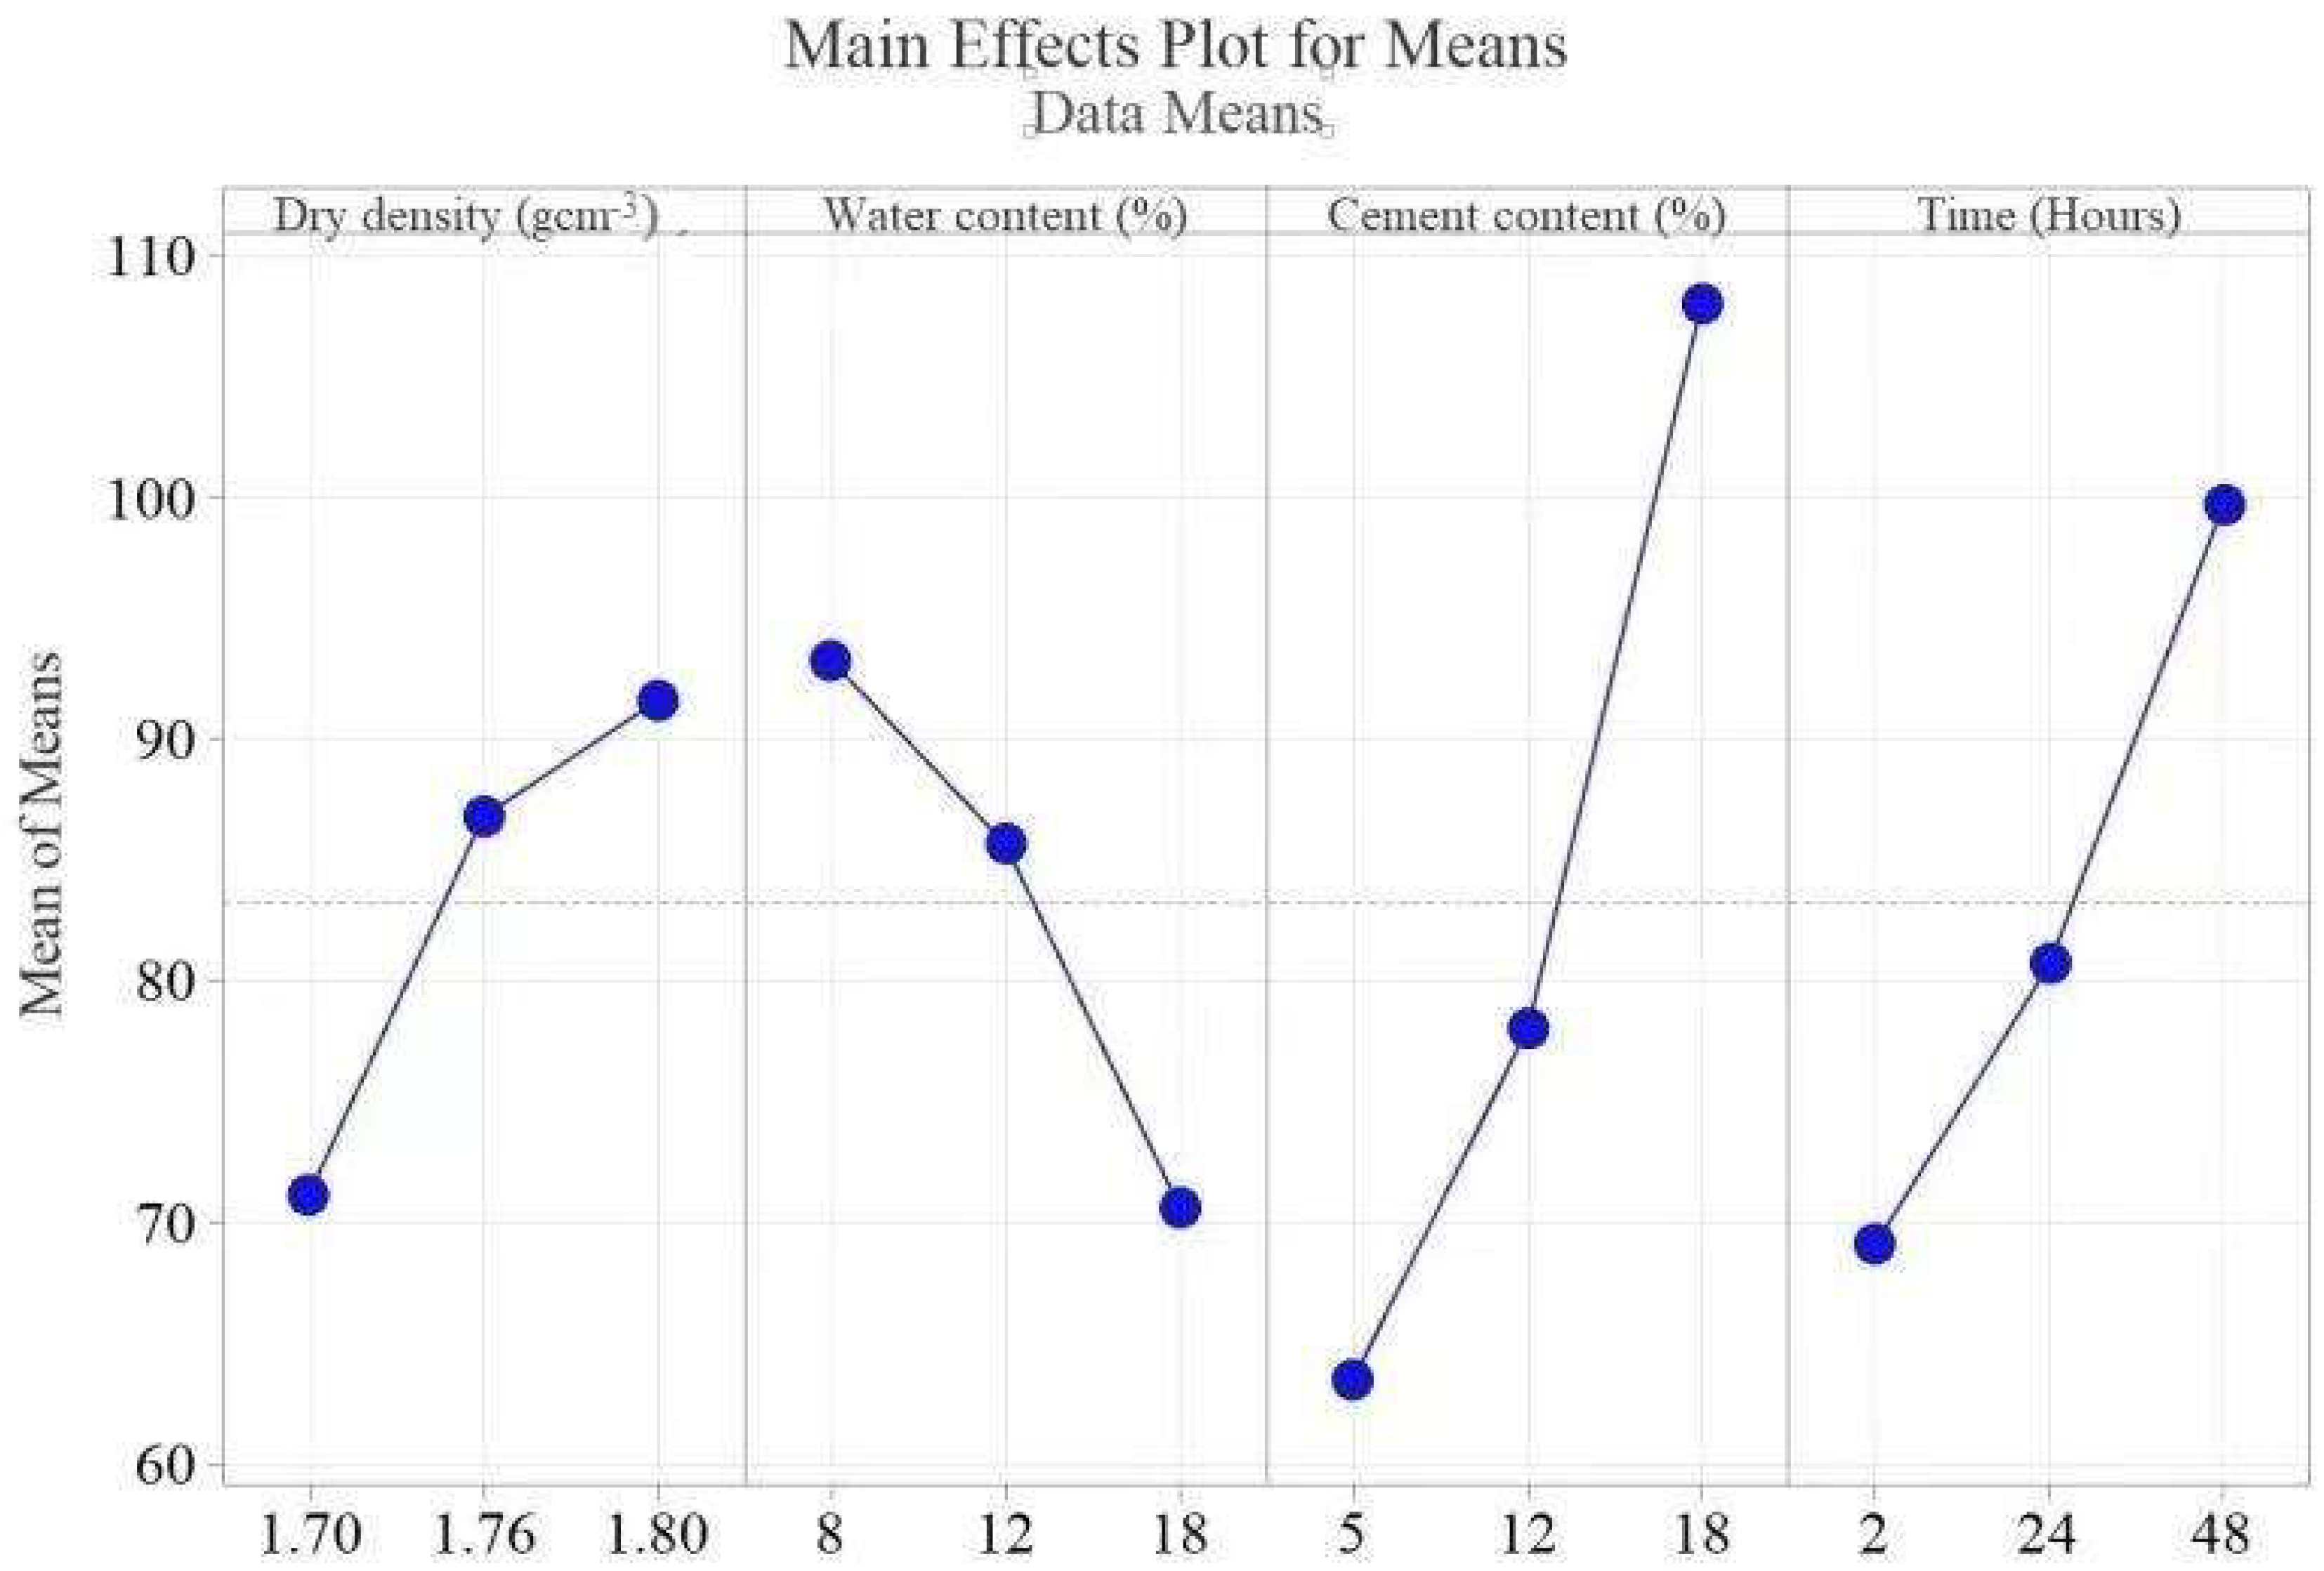
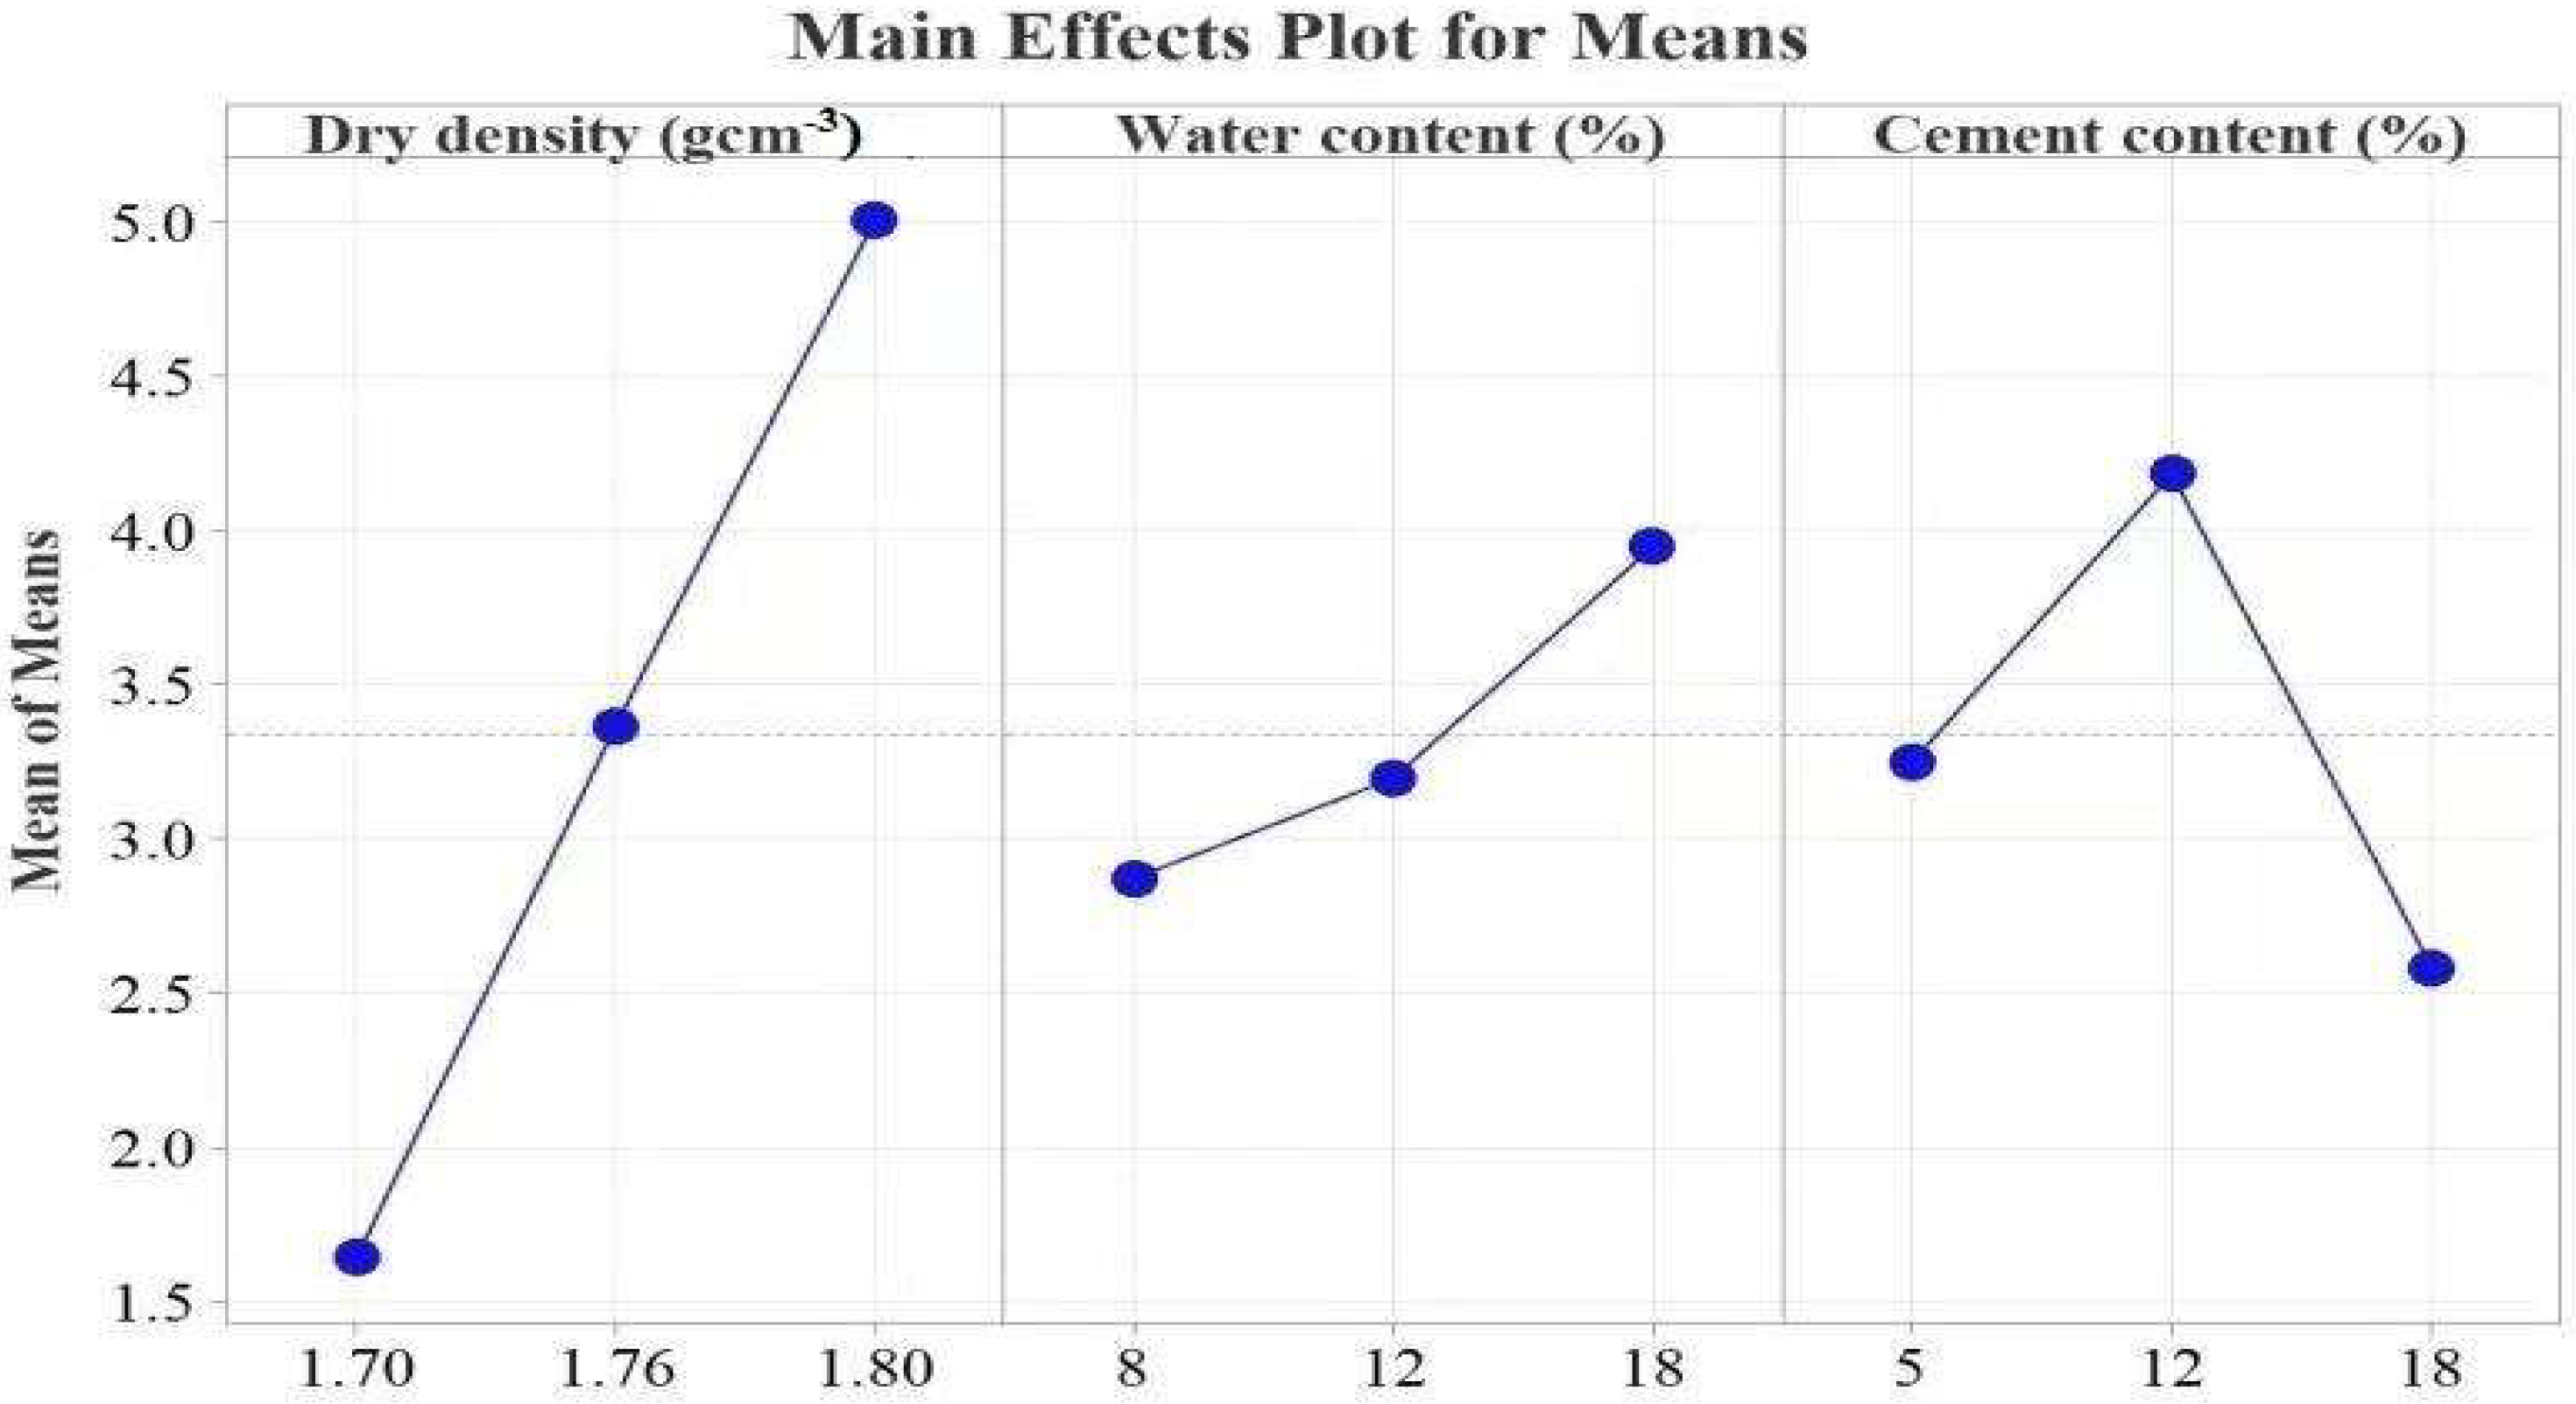
3.4.4. Unconfined Compression Strength Test
4. Discussion
4.1. Range Analysis
4.1.1. Subgrade Reaction Modulus
4.1.2. Resistivity
4.1.3. Unconfined Compressive Strength
4.2. Grey Rational Analysis
4.3. Regression Analysis
4.4. Implications for Practice
5. Conclusions
- (1)
- The resistivity plate load device can be efficiently used to assess the w, C, ρd, and T effects on K30 for the cement-stabilized subgrade for construction. Therefore, the device is recommended for field use. This recommendation must be evaluated and validated in the field with a vast variability in compacted soils with variable w, C, and ρd properties that may confirm the implications of our laboratory observation.
- (2)
- K30 is significantly affected by C, w, ρd, and T. It is important within subgrade construction control protocols to confirm that compacted cement-stabilized subgrade C, ρd, T, and w are considered for a well-informed decision on K30.
- (3)
- Different values of C, ρd, and w have different effects on the USC, leading to variable USC strength values and confirming the need to control C, ρd, and w during construction for enhanced performance.
- (4)
- The proposed regression models showed better performance, and therefore, are recommended to predict the average K30, ρ, UCS, and GRA grades during construction of the cement-stabilized subgrade for similar soils.
Author Contributions
Funding
Institutional Review Board Statement
Informed Consent Statement
Data Availability Statement
Acknowledgments
Conflicts of Interest
References
- Jones, D.; Rahim, A.; Saadeh, S.; Harvey, J.T. Guidelines for the Stabilization of Subgrade Soils in California; State of California, Department of Transportation: Los Angeles, CA, USA, 2011.
- Wei, X.; Ku, T. New Design Chart for Geotechnical Ground Improvement: Characterizing Cement-Stabilized Sand. Acta Geotech. 2020, 15, 999–1011. [Google Scholar] [CrossRef]
- Bahar, R.; Benazzoug, M.; Kenai, S. Performance of Compacted Cement-Stabilised Soil. Cem. Concr. Compos. 2004, 26, 811–820. [Google Scholar] [CrossRef]
- Little, D.N.; Nair, S. Recommended Practice for Stabilization of Subgrade Soils and Base Materials; National Academies of Sciences, Engineering, and Medicine: Washington, DC, USA, 2009. [Google Scholar]
- Biswal, D.R.; Sahoo, U.C.; Dash, S.R. Non-Destructive Strength and Stiffness Evaluation of Cement-Stabilised Granular Lateritic Soils. Road Mater. Pavement Des. 2020, 21, 835–849. [Google Scholar] [CrossRef]
- Fiedler, S.A.; Main, M.; DiMillio, A.F. In-Place Stiffness and Modulus Measurements. In Performance Confirmation of Constructed Geotechnical Facilities; ACSE: Reston, VA, USA, 2000; pp. 365–376. [Google Scholar] [CrossRef]
- Commuri, S.; Zaman, M.M.; Arshadi, A.; Imran, S.; Barman, M. Special Provisions for Intelligent Compaction of Stabilized Soil Subgrades; Southern Plains Transportation Center: Norman, OK, USA, 2017. [Google Scholar]
- Kumar, S.A.; Mazari, M.; Garibay, J.; AlDouri, R.E.; Nazarian, S.; Si, J. Compaction Quality Monitoring of Lime-Stabilized Clayey Subgrade Using Intelligent Compaction Technology. In Proceedings of the 2016 International Conference on Transportation and DevelopmentAmerican Society of Civil Engineers, Houston, TX, USA, 26–29 June 2016. [Google Scholar] [CrossRef]
- Nazarian, S.; Yuan, D.; Arellano, M. Quality Management of Base and Subgrade Materials with Seismic Methods. Transp. Res. Rec. 2002, 1786, 3–10. [Google Scholar] [CrossRef]
- Barman, M.; Nazari, M.; Imran, S.A.; Commuri, S.; Zaman, M.; Beainy, F.; Singh, D. Quality Control of Subgrade Soil Using Intelligent Compaction. Innov. Infrastruct. Solut. 2016, 1, 23. [Google Scholar] [CrossRef] [Green Version]
- Baaj, H. Field and Lab Assessment for Cement-Stabilized Subgrade in Chatham, Ontario; University of Waterloo: Waterloo, ON, Canada, 2018. [Google Scholar]
- White, D.J.; Becker, P.; Vennapusa, P.K.; Dunn, M.J.; White, C.I. Assessing Soil Stiffness of Stabilized Pavement Foundations. Transp. Res. Rec. 2013, 2335, 99–109. [Google Scholar] [CrossRef]
- Pongsivasathit, S.; Horpibulsuk, S.; Piyaphipat, S. Assessment of Mechanical Properties of Cement Stabilized Soils. Case Stud. Constr. Mater. 2019, 11, e00301. [Google Scholar] [CrossRef]
- Tehrani, F.S.; Meehan, C.L. The Effect of Water Content on Light Weight Deflectometer Measurements. In GeoFlorida 2010: Advances in Analysis, Modeling & Design; ACSE: Reston, VA, USA, 2010; pp. 930–939. [Google Scholar] [CrossRef] [Green Version]
- Hu, W.; Jia, X.; Zhu, X.; Su, A.; Du, Y.; Huang, B. Influence of Moisture Content on Intelligent Soil Compaction. Autom. Constr. 2020, 113, 103141. [Google Scholar] [CrossRef]
- Kavussi, A.; Qorbaninik, M.; Hassani, A. The Influence of Moisture Content and Compaction Level on LWD Modulus of Unbound Granular Base Layers. Transp. Geotech. 2019, 20, 100252. [Google Scholar] [CrossRef]
- Li, Y.; Zhang, Y.; Ceylan, H.; Kim, S. In Situ Evaluation of Using Lignosulfonate for Subgrade Stabilization. In Proceedings of the Geo-Congress 2020: Foundations, Soil Improvement, and Erosion, American Society of Civil Engineers, Reston, VA, USA, 25–28 February 2020; pp. 592–600. [Google Scholar] [CrossRef]
- Liu, Y.; He, L.Q.; Jiang, Y.J.; Sun, M.M.; Chen, E.J.; Lee, F.-H. Effect of in Situ Water Content Variation on the Spatial Variation of Strength of Deep Cement-Mixed Clay. Géotechnique 2019, 69, 391–405. [Google Scholar] [CrossRef] [Green Version]
- Xin, H.; Guo-jun, Z. Hardening Mechanism of Cement-Stabilized Soil. Chin. J. Geotech. Eng. 1994, 1, 62–68. [Google Scholar]
- Walubita, L.F.; Mercado, V.; Lee, S.I.; Fuentes, L.; Villegas, J.M. Exploration of a Mechanistic Model for the Quantification of the Resilient Modulus Using Free-Free Resonant Column Testing. Road Mater. Pavement Des. 2021, 22, 2369–2383. [Google Scholar] [CrossRef]
- Souliman, M.I.; GC, H.; Isied, M.M.; Walubita, L.F. Treated versus Untreated Aggregate Bases for Flexible Pavements: Nationwide Comparative Case Study. Transp. Res. Rec. 2020, 2674, 225–236. [Google Scholar] [CrossRef]
- Shooshpasha, I.; Shirvani, R.A. Effect of Cement Stabilization on Geotechnical Properties of Sandy Soils. Geomech. Eng. 2015, 8, 17–31. [Google Scholar] [CrossRef]
- Lazorenko, G.; Kasprzhitskii, A.; Khakiev, Z.; Yavna, V. Dynamic Behavior and Stability of Soil Foundation in Heavy Haul Railway Tracks: A Review. Constr. Build. Mater. 2019, 205, 111–136. [Google Scholar] [CrossRef]
- Fu, Z.; Chen, S.; Han, H. Large-Scale Triaxial Experiments on the Static and Dynamic Behavior of an Artificially Cemented Gravel Material. Eur. J. Environ. Civ. Eng. 2020, 1–21. [Google Scholar] [CrossRef]
- Chae, Y.; Chiang, Y. Dynamic Behavior of Weak Soils Treated with Additives. In Proceedings of the 5th World Conference on Earthquake Engineering, Rome, Italy, 25–29 June 1973; pp. 1606–1610. [Google Scholar]
- Walubita, L.F.; Lee, S.I.; Faruk, A.N.; Scullion, T.; Nazarian, S.; Abdallah, I. Texas Flexible Pavements and Overlays: Year 5 Report-Complete Data Documentation; Texas A&M Transportation Institute: College Station, TX, USA, 2017. [Google Scholar]
- Ackah, F.S.; Zhuochen, N.; Huaiping, F. Effect of Wetting and Drying on the Resilient Modulus and Permanent Strain of a Sandy Clay by RLTT. Int. J. Pavement Res. Technol. 2021, 14, 366–377. [Google Scholar] [CrossRef]
- Tannoury, G.A. Evaluation of Cement-Modified Soil (CMS) with Microcracking and Its Effects on Flexible Pavement Performance. Ph.D. Thesis, University of Kansas, Lawrence, KS, USA, 2019. [Google Scholar]
- Kim, J.H.; Yoon, H.-K.; Lee, J.-S. Void Ratio Estimation of Soft Soils Using Electrical Resistivity Cone Probe. J. Geotech. Geoenviron. Eng. 2011, 137, 86–93. [Google Scholar] [CrossRef]
- Choi, J.C.; Grande, L.; Park, J.; Mondol, N.H. Anisotropy Resistivity Measurement Using Modified Triaxial Cell: Estimation of Geometry Factor Using Numerical Simulation. In Proceedings of the 4th International Workshop on Rock Physics, Trondheim, Norway, 29 May–2 June 2017. [Google Scholar]
- Naghibi, M.; Abuel-Naga, H.; Orense, R. Modified Odometer Cell to Measure Electrical Resistivity of Clays Undergoing Consolidation Process. J. Test. Eval. 2017, 45, 1261–1269. [Google Scholar] [CrossRef]
- Zhang, D.; Chen, L.; Liu, S. Key Parameters Controlling Electrical Resistivity and Strength of Cement Treated Soils. J. Cent. South Univ. 2012, 19, 2991–2998. [Google Scholar] [CrossRef]
- Tibbetts, C.M.; Watts, B.E.; Ferraro, C.C.; Huber, E.D. Improving the Utility of MIP Analysis for Cementitious Systems through Gaussian Process Regression Modeling to Predict Electrical Resistivity. Cem. Concr. Compos. 2021, 116, 103870. [Google Scholar] [CrossRef]
- Côté, J.; Konrad, J.-M. A Generalized Thermal Conductivity Model for Soils and Construction Materials. Can. Geotech. J. 2005, 42, 443–458. [Google Scholar] [CrossRef]
- Wang, Z.; Gelius, L.-J.; Kong, F.-N. Simultaneous Core Sample Measurements of Elastic Properties and Resistivity at Reservoir Conditions Employing a Modified Triaxial Cell—A Feasibility Study. Geophys. Prospect. 2009, 57, 1009–1026. [Google Scholar] [CrossRef]
- Saydam, A.S.; Duckworth, K. Comparison of Some Electrode Arrays for Their IP and Apparent Resistivity Responses over a Sheet like Target. Geoexploration 1978, 16, 267–289. [Google Scholar] [CrossRef]
- Dahlin, T.; Zhou, B. A Numerical Comparison of 2D Resistivity Imaging with 10 Electrode Arrays. Geophys. Prospect. 2004, 52, 379–398. [Google Scholar] [CrossRef] [Green Version]
- Zhou, Z.; Yang, H.; Wan, Z.H.; Liu, B.C. Computational Model for Electrical Resistivity of Soil–Rock Mixtures. J. Mater. Civ. Eng. 2016, 28, 06016009. [Google Scholar] [CrossRef]
- Fortier, R.; Allard, M.; Seguin, M.-K. Effect of Physical Properties of Frozen Ground on Electrical Resistivity Logging. Cold Reg. Sci. Technol. 1994, 22, 361–384. [Google Scholar] [CrossRef]
- Hong, C.-H.; Chong, S.-H.; Cho, G.-C. Theoretical Study on Geometries of Electrodes in Laboratory Electrical Resistivity Measurement. Appl. Sci. 2019, 9, 4167. [Google Scholar] [CrossRef] [Green Version]
- Horpibulsuk, S.; Katkan, W.; Sirilerdwattana, W.; Rachan, R. Strength Development in Cement Stabilized Low Plasticity and Coarse Grained Soils: Laboratory and Field Study. Soils Found. 2006, 46, 351–366. [Google Scholar] [CrossRef] [Green Version]
- Jeyapaul, R.; Shahabudeen, P.; Krishnaiah, K. Quality Management Research by Considering Multi-Response Problems in the Taguchi Method—A Review. Int. J. Adv. Manuf. Technol. 2005, 26, 1331–1337. [Google Scholar] [CrossRef]
- Sevinc, A.H.; Durgun, M.Y.; Eken, M. A Taguchi Approach for Investigating the Engineering Properties of Concretes Incorporating Barite, Colemanite, Basaltic Pumice and Ground Blast Furnace Slag. Constr. Build. Mater. 2017, 135, 343–351. [Google Scholar] [CrossRef]
- Ho, T.-O.; Chen, W.-B.; Yin, J.-H.; Wu, P.-C.; Tsang, D.C. Stress-Strain Behaviour of Cement-Stabilized Hong Kong Marine Deposits. Constr. Build. Mater. 2021, 274, 122103. [Google Scholar] [CrossRef]
- Jin, L.; Song, W.; Shu, X.; Huang, B. Use of Water Reducer to Enhance the Mechanical and Durability Properties of Cement-Treated Soil. Constr. Build. Mater. 2018, 159, 690–694. [Google Scholar] [CrossRef]
- Slebi-Acevedo, C.J.; Silva-Rojas, I.M.; Lastra-Gonzalez, P.; Pascual-Munoz, P.; Castro-Fresno, D. Multiple-Response Optimization of Open Graded Friction Course Reinforced with Fibers through CRITIC-WASPAS Based on Taguchi Methodology. Constr. Build. Mater. 2020, 233, 117274. [Google Scholar] [CrossRef]
- Besson, A.; Cousin, I.; Dorigny, A.; Dabas, M.; King, D. The Temperature Correction for the Electrical Resistivity Measurements in Undisturbed Soil Samples: Analysis of the Existing Conversion Models and Proposal of a New Model. Soil Sci. 2008, 173, 707–720. [Google Scholar] [CrossRef]
- Wang, D.; Zentar, R.; Abriak, N.E. Temperature-Accelerated Strength Development in Stabilized Marine Soils as Road Construction Materials. J. Mater. Civ. Eng. 2017, 29, 04016281. [Google Scholar] [CrossRef]
- Tabbagh, J.; Samouëlian, A.; Tabbagh, A.; Cousin, I. Numerical Modelling of Direct Current Electrical Resistivity for the Characterisation of Cracks in Soils. J. Appl. Geophys. 2007, 62, 313–323. [Google Scholar] [CrossRef]
- White, D.J.; Harrington, D.; Thomas, Z. Fly Ash Soil Stabilization for Non-Uniform Subgrade Soils. In IHRB Project TR-461, FHWA Project; Iwoa State University: Ames, IA, USA, 2005; Volume 4. [Google Scholar]
- Sariosseiri, F.; Muhunthan, B. Effect of Cement Treatment on Geotechnical Properties of Some Washington State Soils. Eng. Geol. 2009, 104, 119–125. [Google Scholar] [CrossRef]
- Guthrie, W.S.; Michener, J.E.; Wilson, B.T.; Eggett, D.L. Effects of Environmental Factors on Construction of Soil–Cement Pavement Layers. Transp. Res. Rec. 2009, 2104, 71–79. [Google Scholar] [CrossRef] [Green Version]
- Chai, M.; Zhang, H.; Zhang, J.; Zhang, Z. Effect of Cement Additives on Unconfined Compressive Strength of Warm and Ice-Rich Frozen Soil. Constr. Build. Mater. 2017, 149, 861–868. [Google Scholar] [CrossRef]
- Little, D.N.; Males, E.H.; Prusinski, J.R.; Stewart, B. Cementitious Stabilization. In Transportation in the New Millennium; National Academies of Sciences, Engineering, and Medicine: Washington, DC, USA, 2000. [Google Scholar]
- Ikhlef, N.S.; Ghembaza, M.S.; Dadouch, M. Effect of Cement and Compaction on the Physicochemical Behavior of a Material in the Region of Sidi Bel Abbes. Eng. Technol. Appl. Sci. Res. 2014, 4, 677–680. [Google Scholar] [CrossRef]
- Cho, G.-C.; Dodds, J.; Santamarina, J.C. Particle Shape Effects on Packing Density, Stiffness, and Strength: Natural and Crushed Sands. J. Geotech. Geoenviron. Eng. 2006, 132, 591–602. [Google Scholar] [CrossRef] [Green Version]
- Tatsuoka, F.; Hashimoto, T.; Tateyama, K. Soil Stiffness as a Function of Dry Density and the Degree of Saturation for Compaction Control. Soils Found. 2021, 61, 989–1002. [Google Scholar] [CrossRef]
- Chen, L.; Liu, S.Y.; Du, Y.J.; Jin, F. Unconfined Compressive Strength Properties of Cement Solidified/Stabilized Lead-Contaminated Soils. Yantu Gongcheng Xuebao/Chin. J. Geotech. Eng. 2010, 32, 1898–1903. [Google Scholar] [CrossRef]
- Ajmera, B.; Tiwari, B.; Koirala, J.; Obaid, Z. Compaction Characteristics, Unconfined Compressive Strengths, and Coefficients of Permeability of Fine-Grained Soils Mixed with Crumb-Rubber Tire. J. Mater. Civ. Eng. 2017, 29, 04017148. [Google Scholar] [CrossRef]
- Parreira, A.B.; Kobayashi, A.R.K.; Silvestre, O.B., Jr. Influence of Portland Cement Type on Unconfined Compressive Strength and Linear Expansion of Cement-Stabilized Phosphogypsum. J. Environ. Eng. 2003, 129, 956–960. [Google Scholar] [CrossRef]
- Ribeiro, D.; Néri, R.; Cardoso, R. Influence of Water Content in the UCS of Soil-Cement Mixtures for Different Cement Dosages. Procedia Eng. 2016, 143, 59–66. [Google Scholar] [CrossRef] [Green Version]
- Azadegan, O.; Jafari, S.H.; Li, J. Compaction Characteristics and Mechanical Properties of Lime/Cement Treated Granular Soils. Electron. J. Geotech. Eng. 2012, 17, 2275–2284. [Google Scholar]
- Horpibulsuk, S.; Rachan, R.; Chinkulkijniwat, A.; Raksachon, Y.; Suddeepong, A. Analysis of Strength Development in Cement-Stabilized Silty Clay from Microstructural Considerations. Constr. Build. Mater. 2010, 24, 2011–2021. [Google Scholar] [CrossRef]


| Factor | Level 1 | Level 2 | Level 3 |
|---|---|---|---|
| ρd | 1.70 g cm−3 | 1.76 g cm−3 | 1.80 g cm−3 |
| w | 8% | 12% | 18% |
| C | 5% | 12% | 18% |
| T | 2 | 24 | 48 |
| ID | Taguchi Orthogonal Array | Test Results | ||||||||
|---|---|---|---|---|---|---|---|---|---|---|
| ρd (g·cm−3) | w (%) | C (%) | T (h) | K30 (MPa/m2) | ρ (Ωm) | UCS (MPa) | ||||
| Average | St.d | Average | St.d | Average | St.d | |||||
| 1 | 1.70 | 5.0 | 8.0 | 2.0 | 95.33 | 0.67 | 47.10 | 1.43 | 0.88 | 0.03 |
| 2 | 1.70 | 12.0 | 12.0 | 24.0 | 103.3 | 3.33 | 66.29 | 0.77 | 3.12 | 0.06 |
| 3 | 1.70 | 18.0 | 18.0 | 48.0 | 130.10 | 2.67 | 100.00 | 2.89 | 0.93 | 0.04 |
| 4 | 1.76 | 5.0 | 12.0 | 48.0 | 173.33 | 0.00 | 108.20 | 0.62 | 3.18 | 0.04 |
| 5 | 1.76 | 12.0 | 18.0 | 2.0 | 140.00 | 1.67 | 100.00 | 0.11 | 2.26 | 0.08 |
| 6 | 1.76 | 18.0 | 8.0 | 24.0 | 118.50 | 1.50 | 52.10 | 2.18 | 4.66 | 0.10 |
| 7 | 1.80 | 5.0 | 18.0 | 24.0 | 179.98 | 2.68 | 123.99 | 0.09 | 5.66 | 0.13 |
| 8 | 1.80 | 12.0 | 8.0 | 48.0 | 153.34 | 2.66 | 90.94 | 2.21 | 4.21 | 0.06 |
| 9 | 1.80 | 18.0 | 12.0 | 2.0 | 110.83 | 2.50 | 59.27 | 0.26 | 8.25 | 0.08 |
| Subgrade Reaction Modulus (K30) | ||||
|---|---|---|---|---|
| Level | ρd | w | C | T |
| 1 | 109.60 | 149.50 | 122.40 | 115.40 |
| 2 | 143.90 | 132.20 | 129.20 | 133.90 |
| 3 | 148.00 | 119.80 | 150.00 | 152.20 |
| Delta | 38.50 | 29.70 | 27.60 | 36.90 |
| Rank | 1.00 | 3.00 | 4.00 | 2.00 |
| Soil electrical resistivity (ρ) | ||||
| 1 | 71.27 | 93.25 | 63.52 | 69.12 |
| 2 | 86.78 | 80.31 | 72.69 | 75.36 |
| 3 | 91.59 | 70.64 | 108.00 | 99.72 |
| Delta | 20.32 | 22.60 | 44.48 | 30.61 |
| Rank | 4 | 3 | 1 | 2 |
| Unconfined compression strength test (USC) | ||||
| 1 | 1.64 | 2.87 | 3.25 | |
| 2 | 3.37 | 3.20 | 4.18 | |
| 3 | 5.01 | 3.95 | 2.58 | |
| Delta | 3.36 | 1.07 | 1.60 | |
| Rank | 1.00 | 3.00 | 2.00 | |
| GRA | ||||
| 1 | 0.82 | 0.55 | 0.57 | 0.61 |
| 2 | 0.52 | 0.67 | 0.64 | 0.62 |
| 3 | 0.42 | 0.53 | 0.54 | 0.52 |
| Delta | 0.40 | 0.14 | 0.09 | 0.11 |
| Rank | 1.00 | 2.00 | 4.00 | 3.00 |
| ID | K30 | ρ | UCS | K30 | ρ | UCS | GRA G |
|---|---|---|---|---|---|---|---|
| Normalized | Gray Relational Coefficient | ||||||
| 1 | 0.18 | 0.16 | 0.05 | 0.74 | 0.76 | 0.90 | 0.80 |
| 2 | 0.00 | 0.00 | 0.00 | 1.00 | 1.00 | 1.00 | 1.00 |
| 3 | 0.24 | 0.05 | 0.77 | 0.67 | 0.92 | 0.39 | 0.66 |
| 4 | 0.96 | 0.85 | 0.23 | 0.34 | 0.37 | 0.68 | 0.46 |
| 5 | 0.77 | 0.77 | 0.00 | 0.39 | 0.39 | 0.99 | 0.59 |
| 6 | 0.64 | 0.31 | 0.60 | 0.44 | 0.61 | 0.45 | 0.50 |
| 7 | 1.00 | 1.00 | 0.58 | 0.33 | 0.33 | 0.46 | 0.38 |
| 8 | 0.85 | 0.68 | 0.49 | 0.37 | 0.42 | 0.50 | 0.43 |
| 9 | 0.60 | 0.38 | 1.00 | 0.46 | 0.57 | 0.33 | 0.45 |
| Factor | DF | Adss | Ad MS | = 0.5 | p Value | % Contribution |
|---|---|---|---|---|---|---|
| ρd | 2 | 0.261 | 0.131 | 11.22 | 0.009 | 79.09 |
| w | 2 | 0.034 | 0.017 | 0.35 | 0.717 | 10.30 |
| C | 2 | 0.013 | 0.007 | 0.03 | 0.883 | 3.94 |
| T | 2 | 0.022 | 0.011 | 0.21 | 0.817 | 6.67 |
| Error | - | - | - | |||
| Total | 8 | 0.33 | 100.00 |
| Subgrade Reaction Modulus (K30) | ||||||
|---|---|---|---|---|---|---|
| Source | DF | Adj SS | Adj MS | F-Value | p-Value | % Contribution |
| Regression | 5 | 6538.43 | 1307.69 | 5.15 | 0.104 | 89.57 |
| ρd | 1 | 1429.90 | 1429.90 | 5.63 | 0.098 | 19.59 |
| T | 1 | 242.29 | 242.29 | 0.95 | 0.401 | 3.32 |
| ρdw | 1 | 859.12 | 859.12 | 3.38 | 0.163 | 11.77 |
| wC | 1 | 8.03 | 8.03 | 0.03 | 0.870 | 0.11 |
| w | 1 | 1326.70 | 1326.70 | 5.23 | 0.106 | 18.17 |
| Error | 3 | 761.64 | 253.88 | 10.43 | ||
| Total | 8 | 7300.07 | 100.00 | |||
| Soil electrical resistivity (ρ) | ||||||
| Regression | 5 | 6149.24 | 1229.85 | 5.90 | 0.087 | 90.77 |
| ρd | 1 | 994.34 | 994.34 | 4.77 | 0.117 | 14.68 |
| T | 1 | 424.27 | 424.27 | 2.04 | 0.249 | 6.26 |
| ρdw | 1 | 16.12 | 16.12 | 0.08 | 0.799 | 0.24 |
| C | 1 | 982.29 | 982.29 | 4.71 | 0.118 | 14.50 |
| w | 1 | 766.37 | 766.37 | 3.68 | 0.151 | 11.31 |
| Error | 3 | 625.02 | 208.34 | 9.23 | ||
| Total | 8 | 6774.26 | 100.00 | |||
| Unconfined compressive strength (UCS) | ||||||
| Regression | 3 | 20.93 | 6.9778 | 7.55 | 0.03 | 81.89 |
| ρd | 1 | 5.47 | 5.4783 | 5.93 | 0.06 | 21.40 |
| wC | 1 | 2.24 | 2.2373 | 2.42 | 0.18 | 8.76 |
| w | 1 | 1.73 | 1.7281 | 1.87 | 0.23 | 6.77 |
| Error | 5 | 4.62 | 0.9245 | 18.08 | ||
| Total | 8 | 25.56 | 100.00 | |||
| Grey rational analysis (GRA) | ||||||
| Regression | 5 | 0.225396 | 0.045079 | 3.01 | 0.197 | 83.36 |
| ρd | 1 | 0.108580 | 0.108580 | 7.24 | 0.074 | 40.16 |
| wC | 1 | 0.001064 | 0.001064 | 0.07 | 0.807 | 0.39 |
| wT | 1 | 0.000019 | 0.000019 | 0.00 | 0.974 | 0.01 |
| CT | 1 | 0.008024 | 0.008024 | 0.54 | 0.517 | 2.97 |
| T | 1 | 0.009048 | 0.009048 | 0.60 | 0.494 | 3.35 |
| Error | 3 | 0.044987 | 0.014996 | 16.64 | ||
| Total | 8 | 0.270383 | 100.00 | |||
Publisher’s Note: MDPI stays neutral with regard to jurisdictional claims in published maps and institutional affiliations. |
© 2022 by the authors. Licensee MDPI, Basel, Switzerland. This article is an open access article distributed under the terms and conditions of the Creative Commons Attribution (CC BY) license (https://creativecommons.org/licenses/by/4.0/).
Share and Cite
Feng, H.; Siaw, A.F.; Wang, H. A Resistivity Plate Loading Device for Assessing the Factors Affecting the Stiffness of a Cement-Stabilized Subgrade. Materials 2022, 15, 3453. https://doi.org/10.3390/ma15103453
Feng H, Siaw AF, Wang H. A Resistivity Plate Loading Device for Assessing the Factors Affecting the Stiffness of a Cement-Stabilized Subgrade. Materials. 2022; 15(10):3453. https://doi.org/10.3390/ma15103453
Chicago/Turabian StyleFeng, Huaiping, Ackah Frank Siaw, and Hailiang Wang. 2022. "A Resistivity Plate Loading Device for Assessing the Factors Affecting the Stiffness of a Cement-Stabilized Subgrade" Materials 15, no. 10: 3453. https://doi.org/10.3390/ma15103453