
Hot Deformation Behavior and Processing Maps of a New Ti-6Al-2Nb-2Zr-0.4B Titanium Alloy


Abstract
:1. Introduction
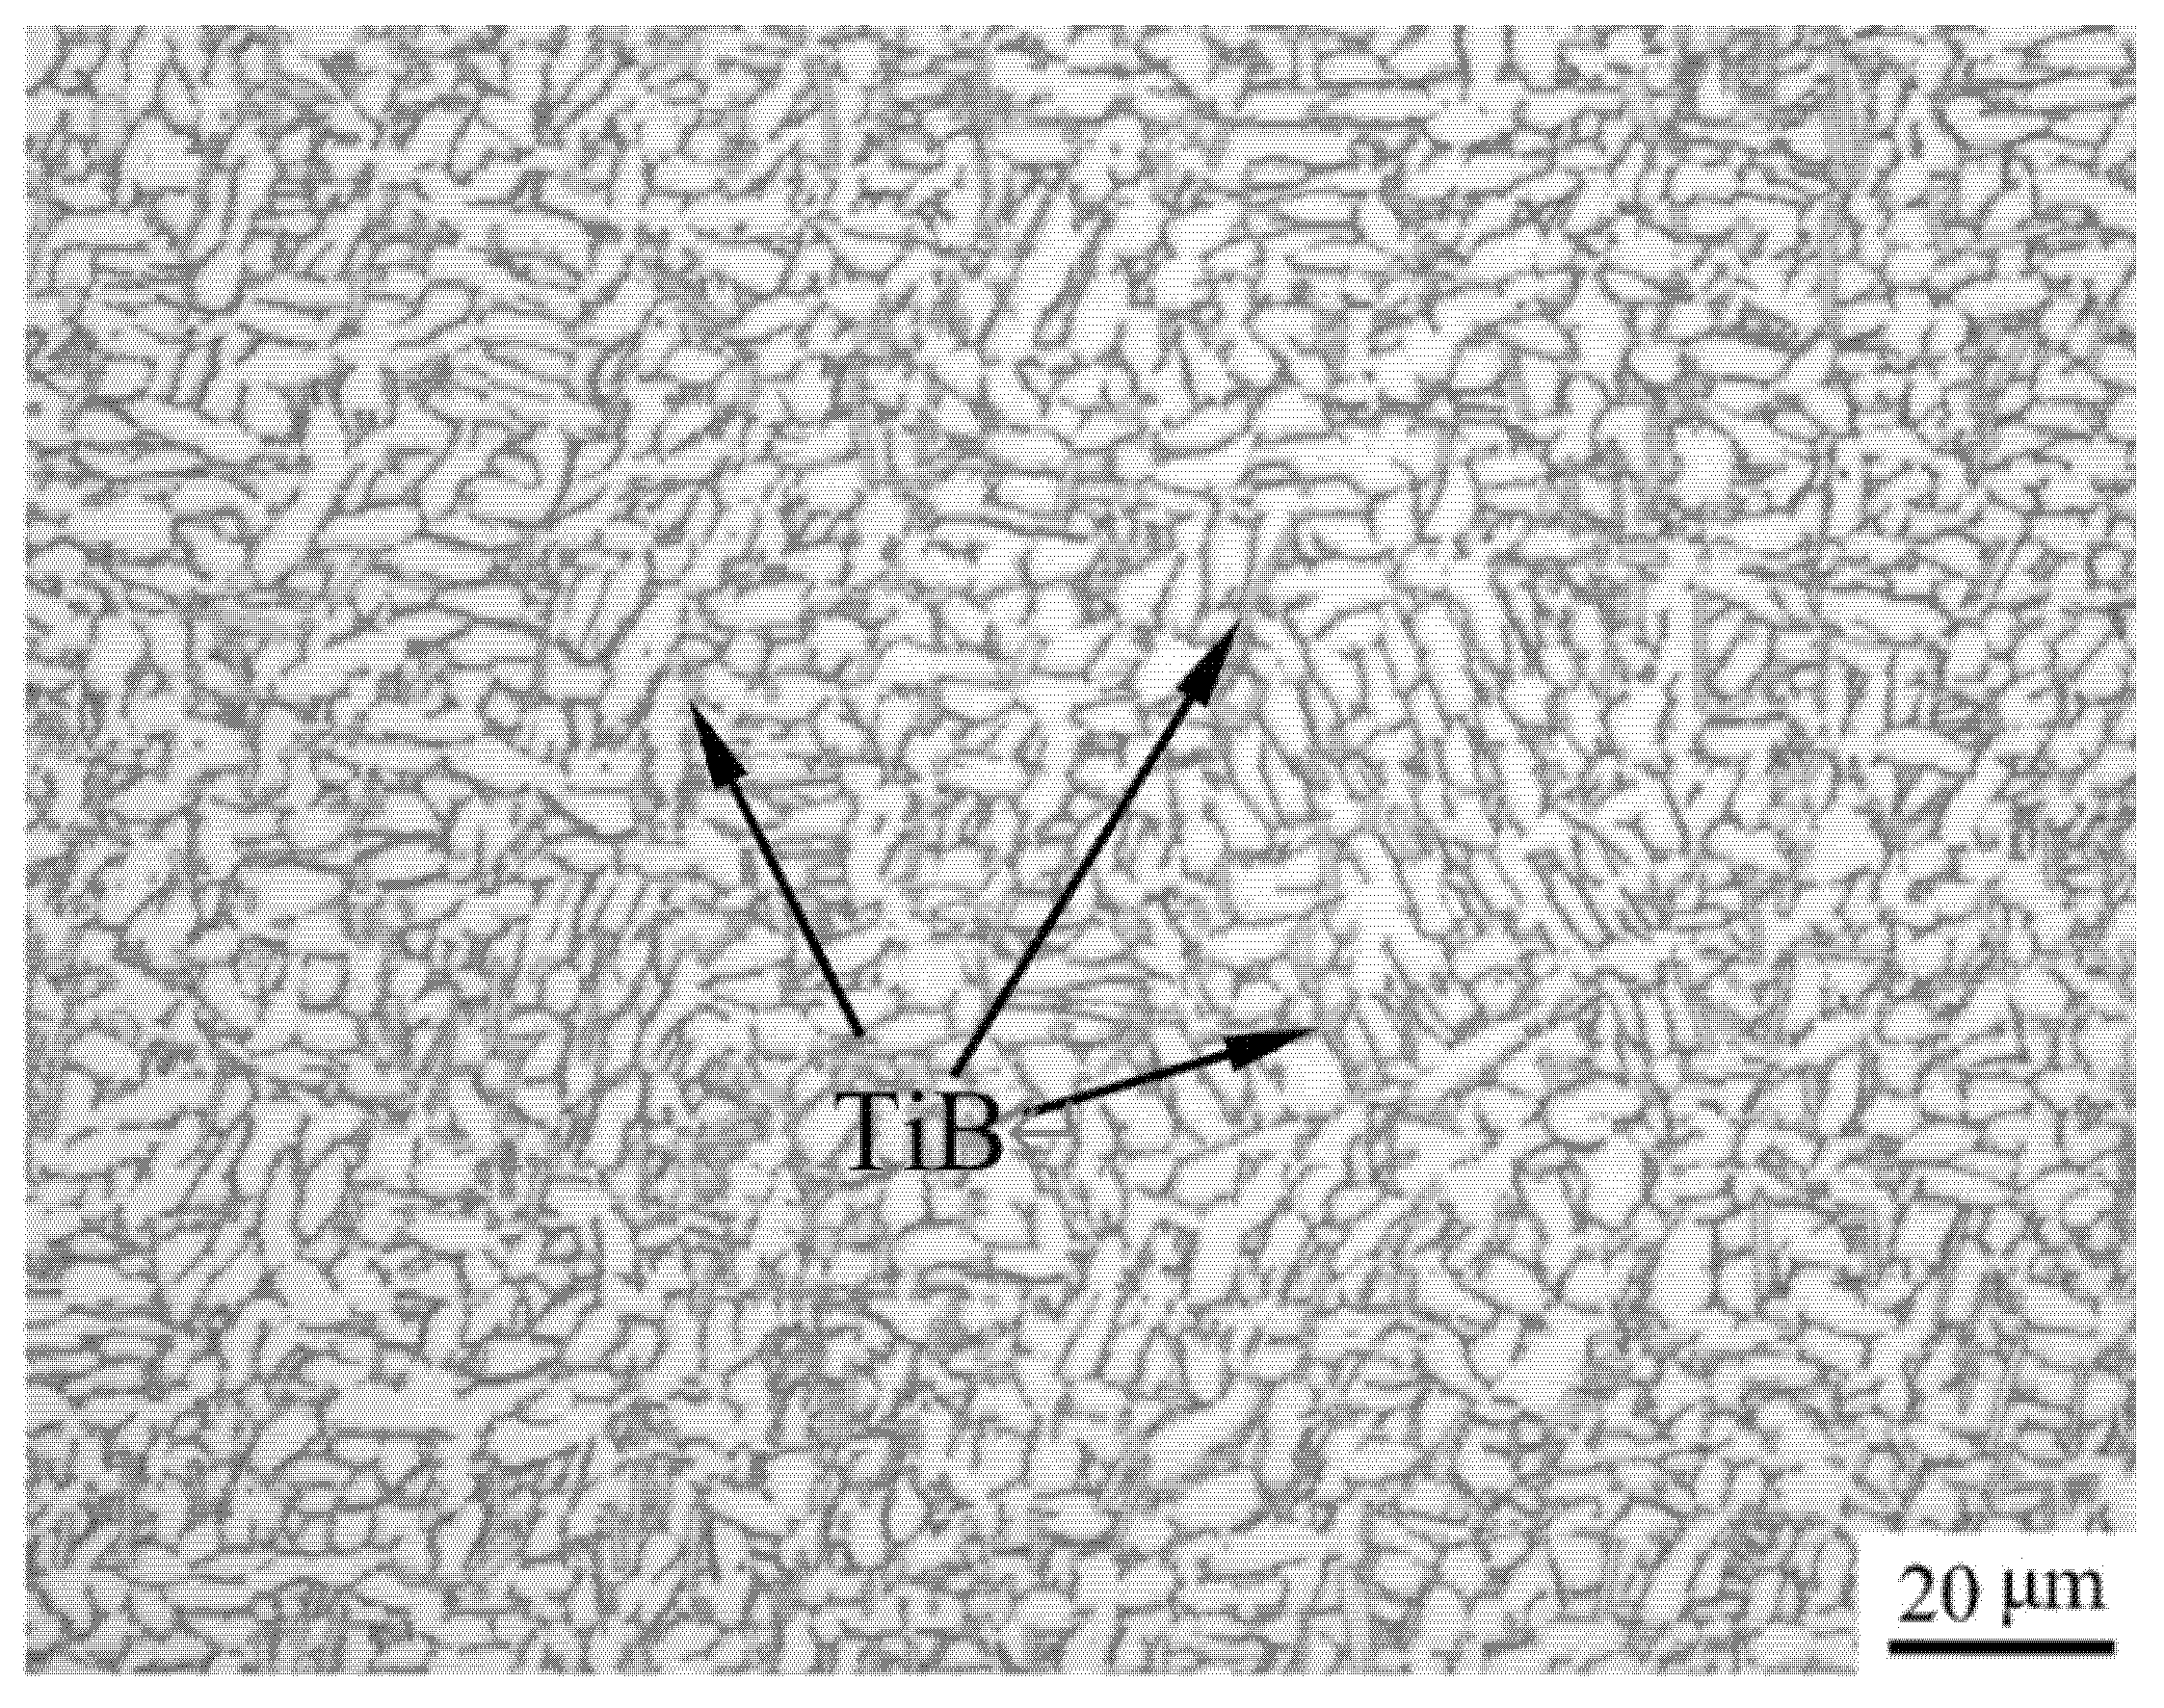
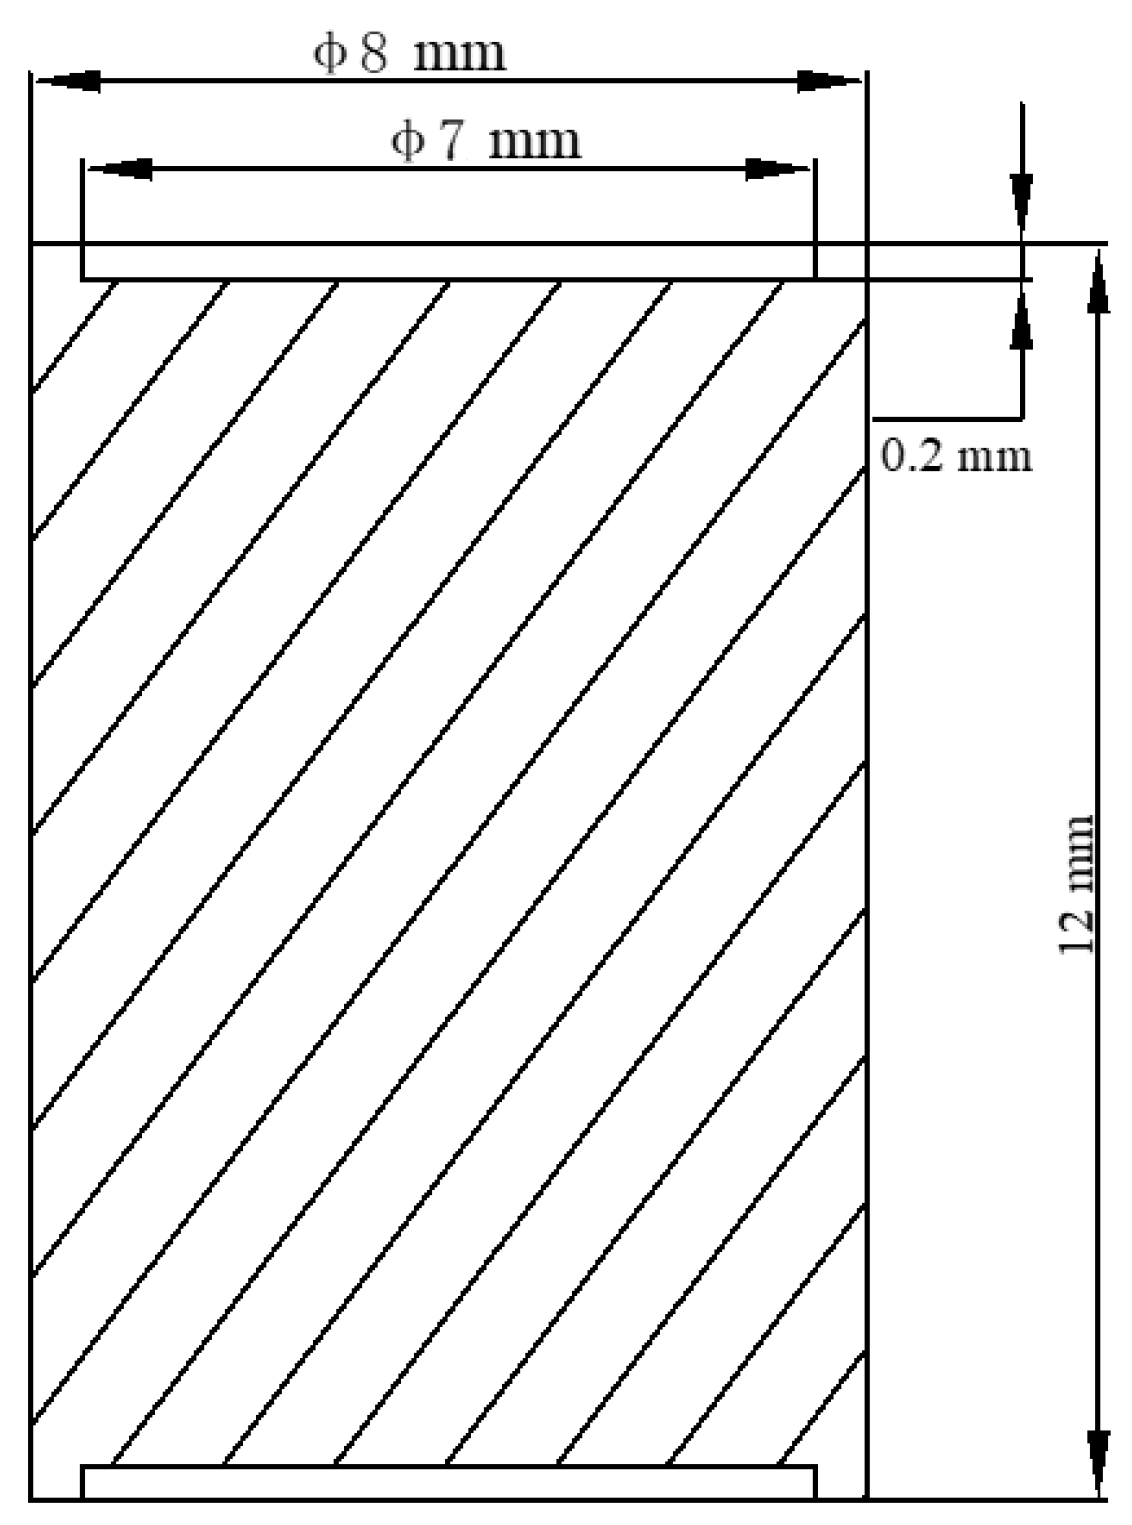
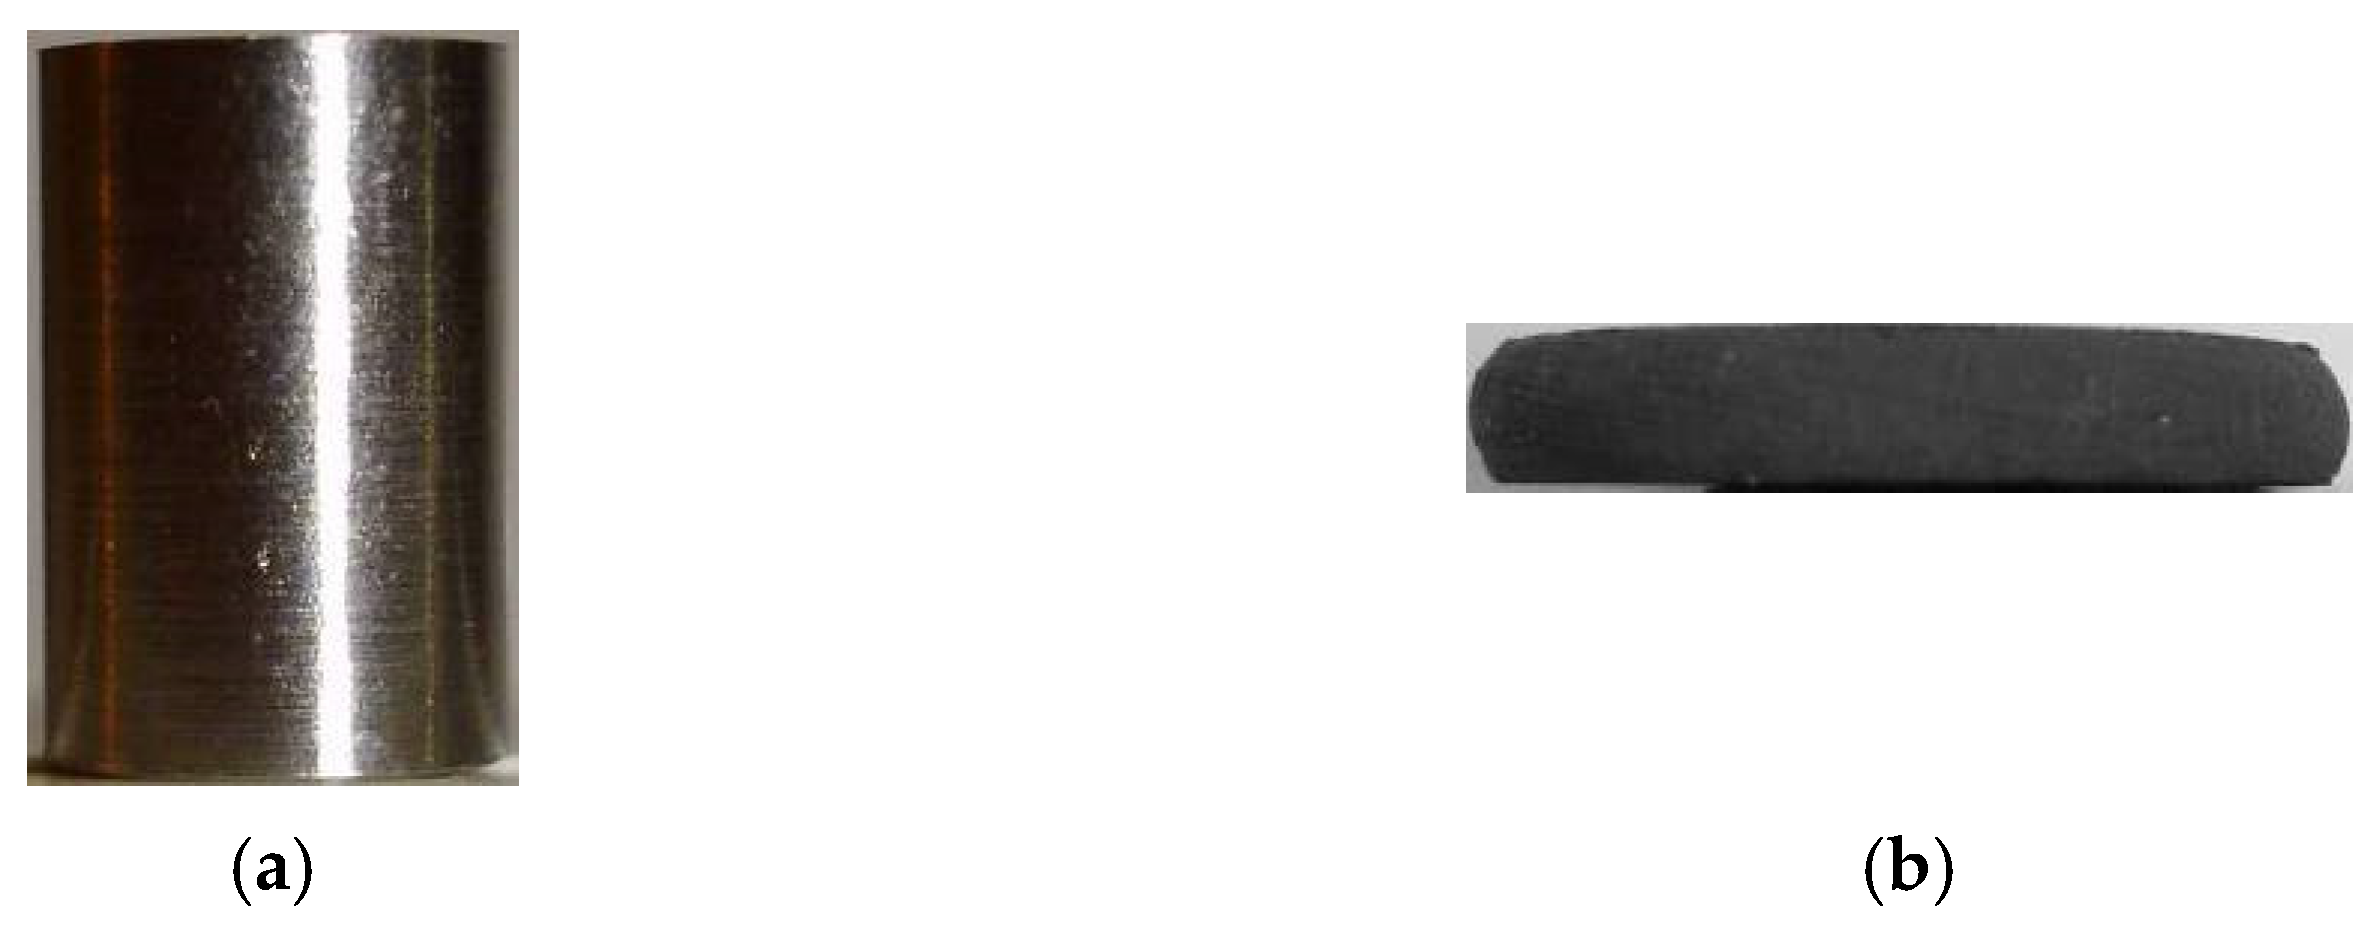
2. Materials and Methods
3. Results and Discussion
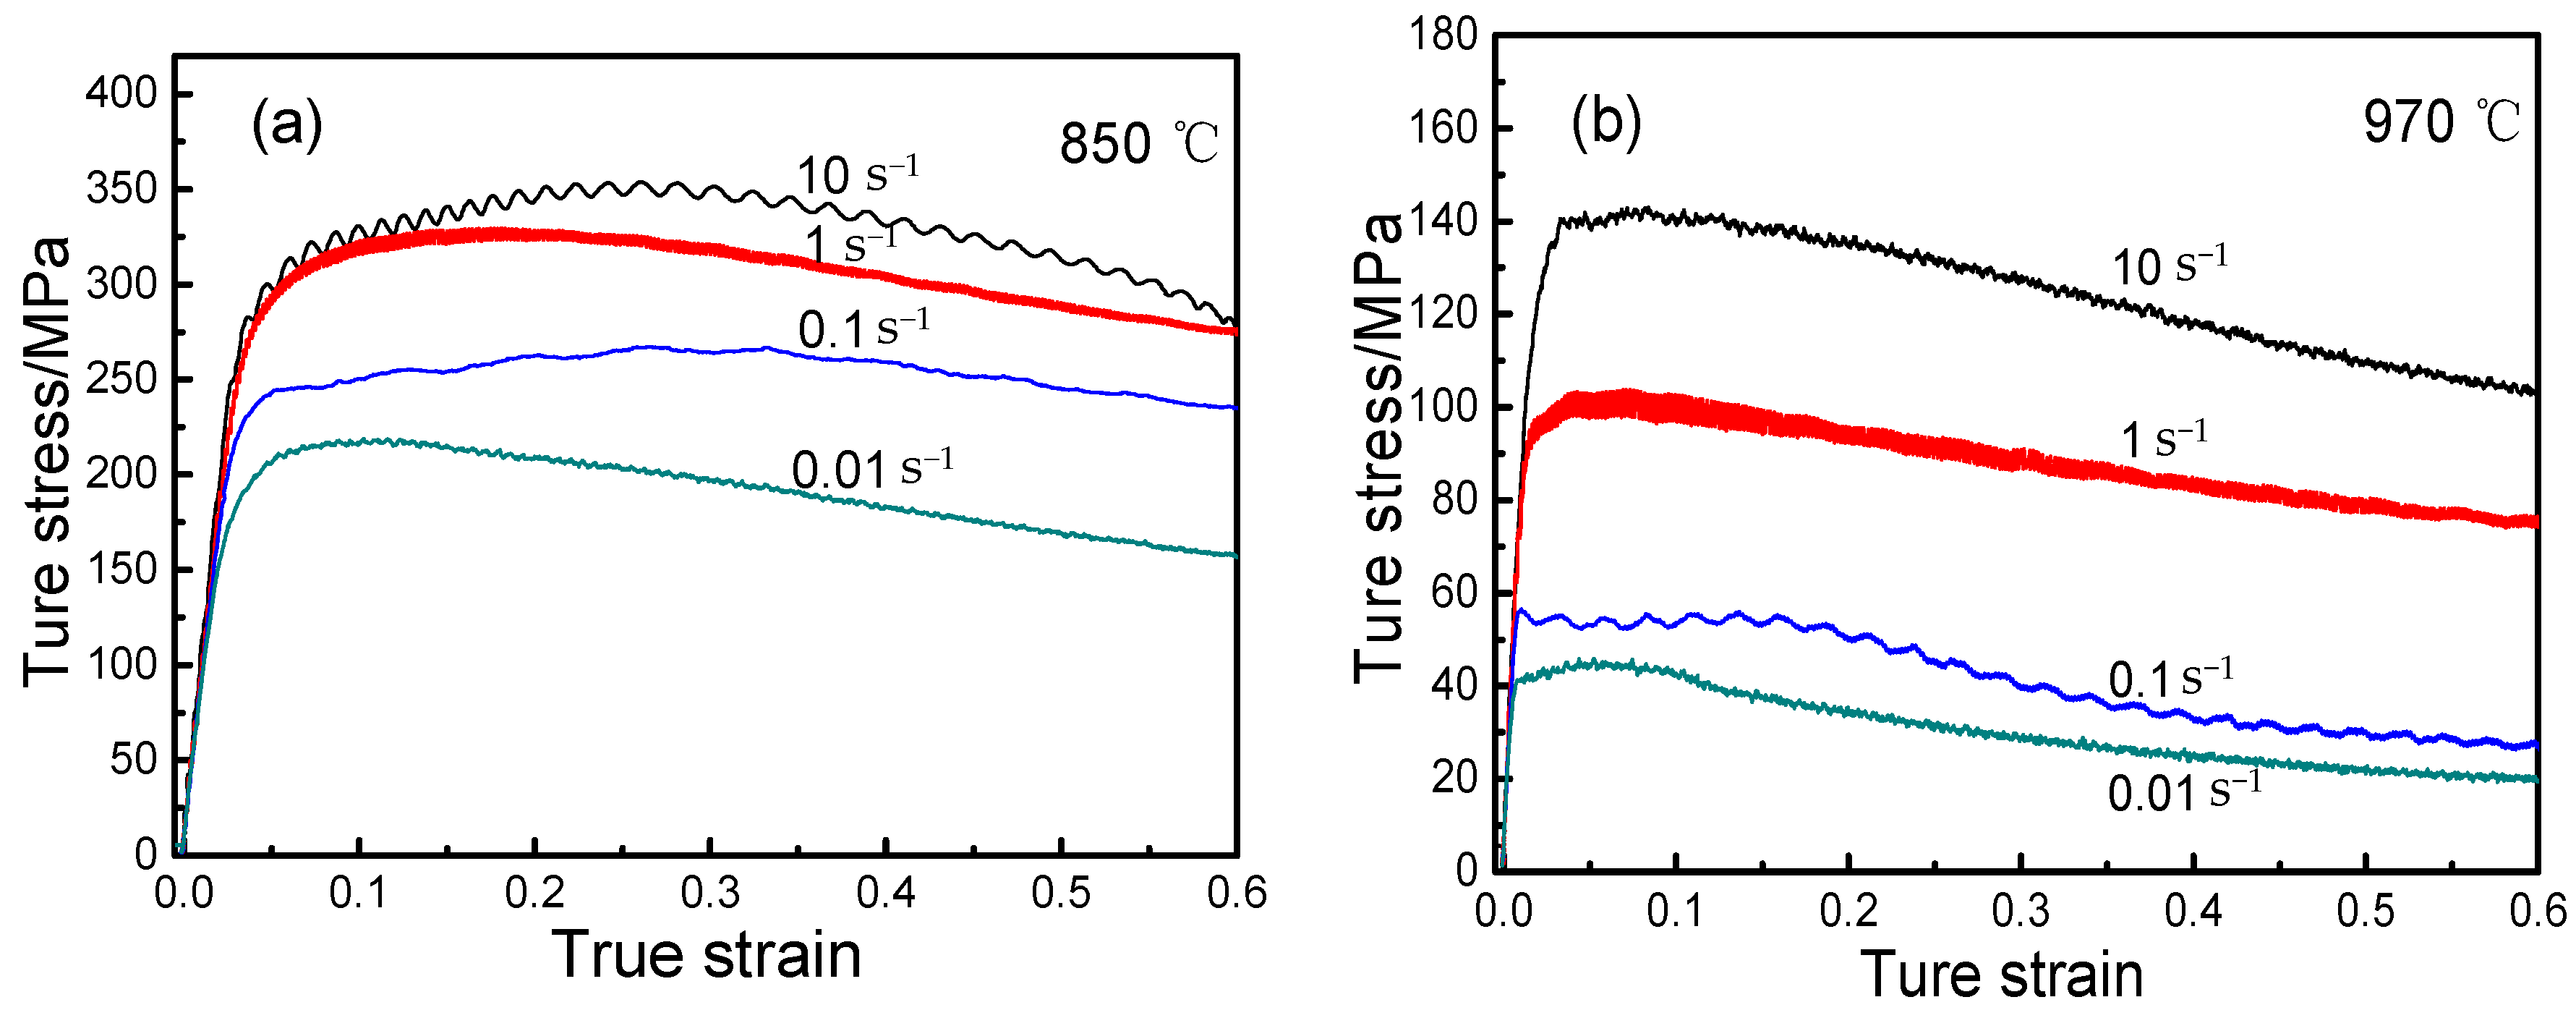
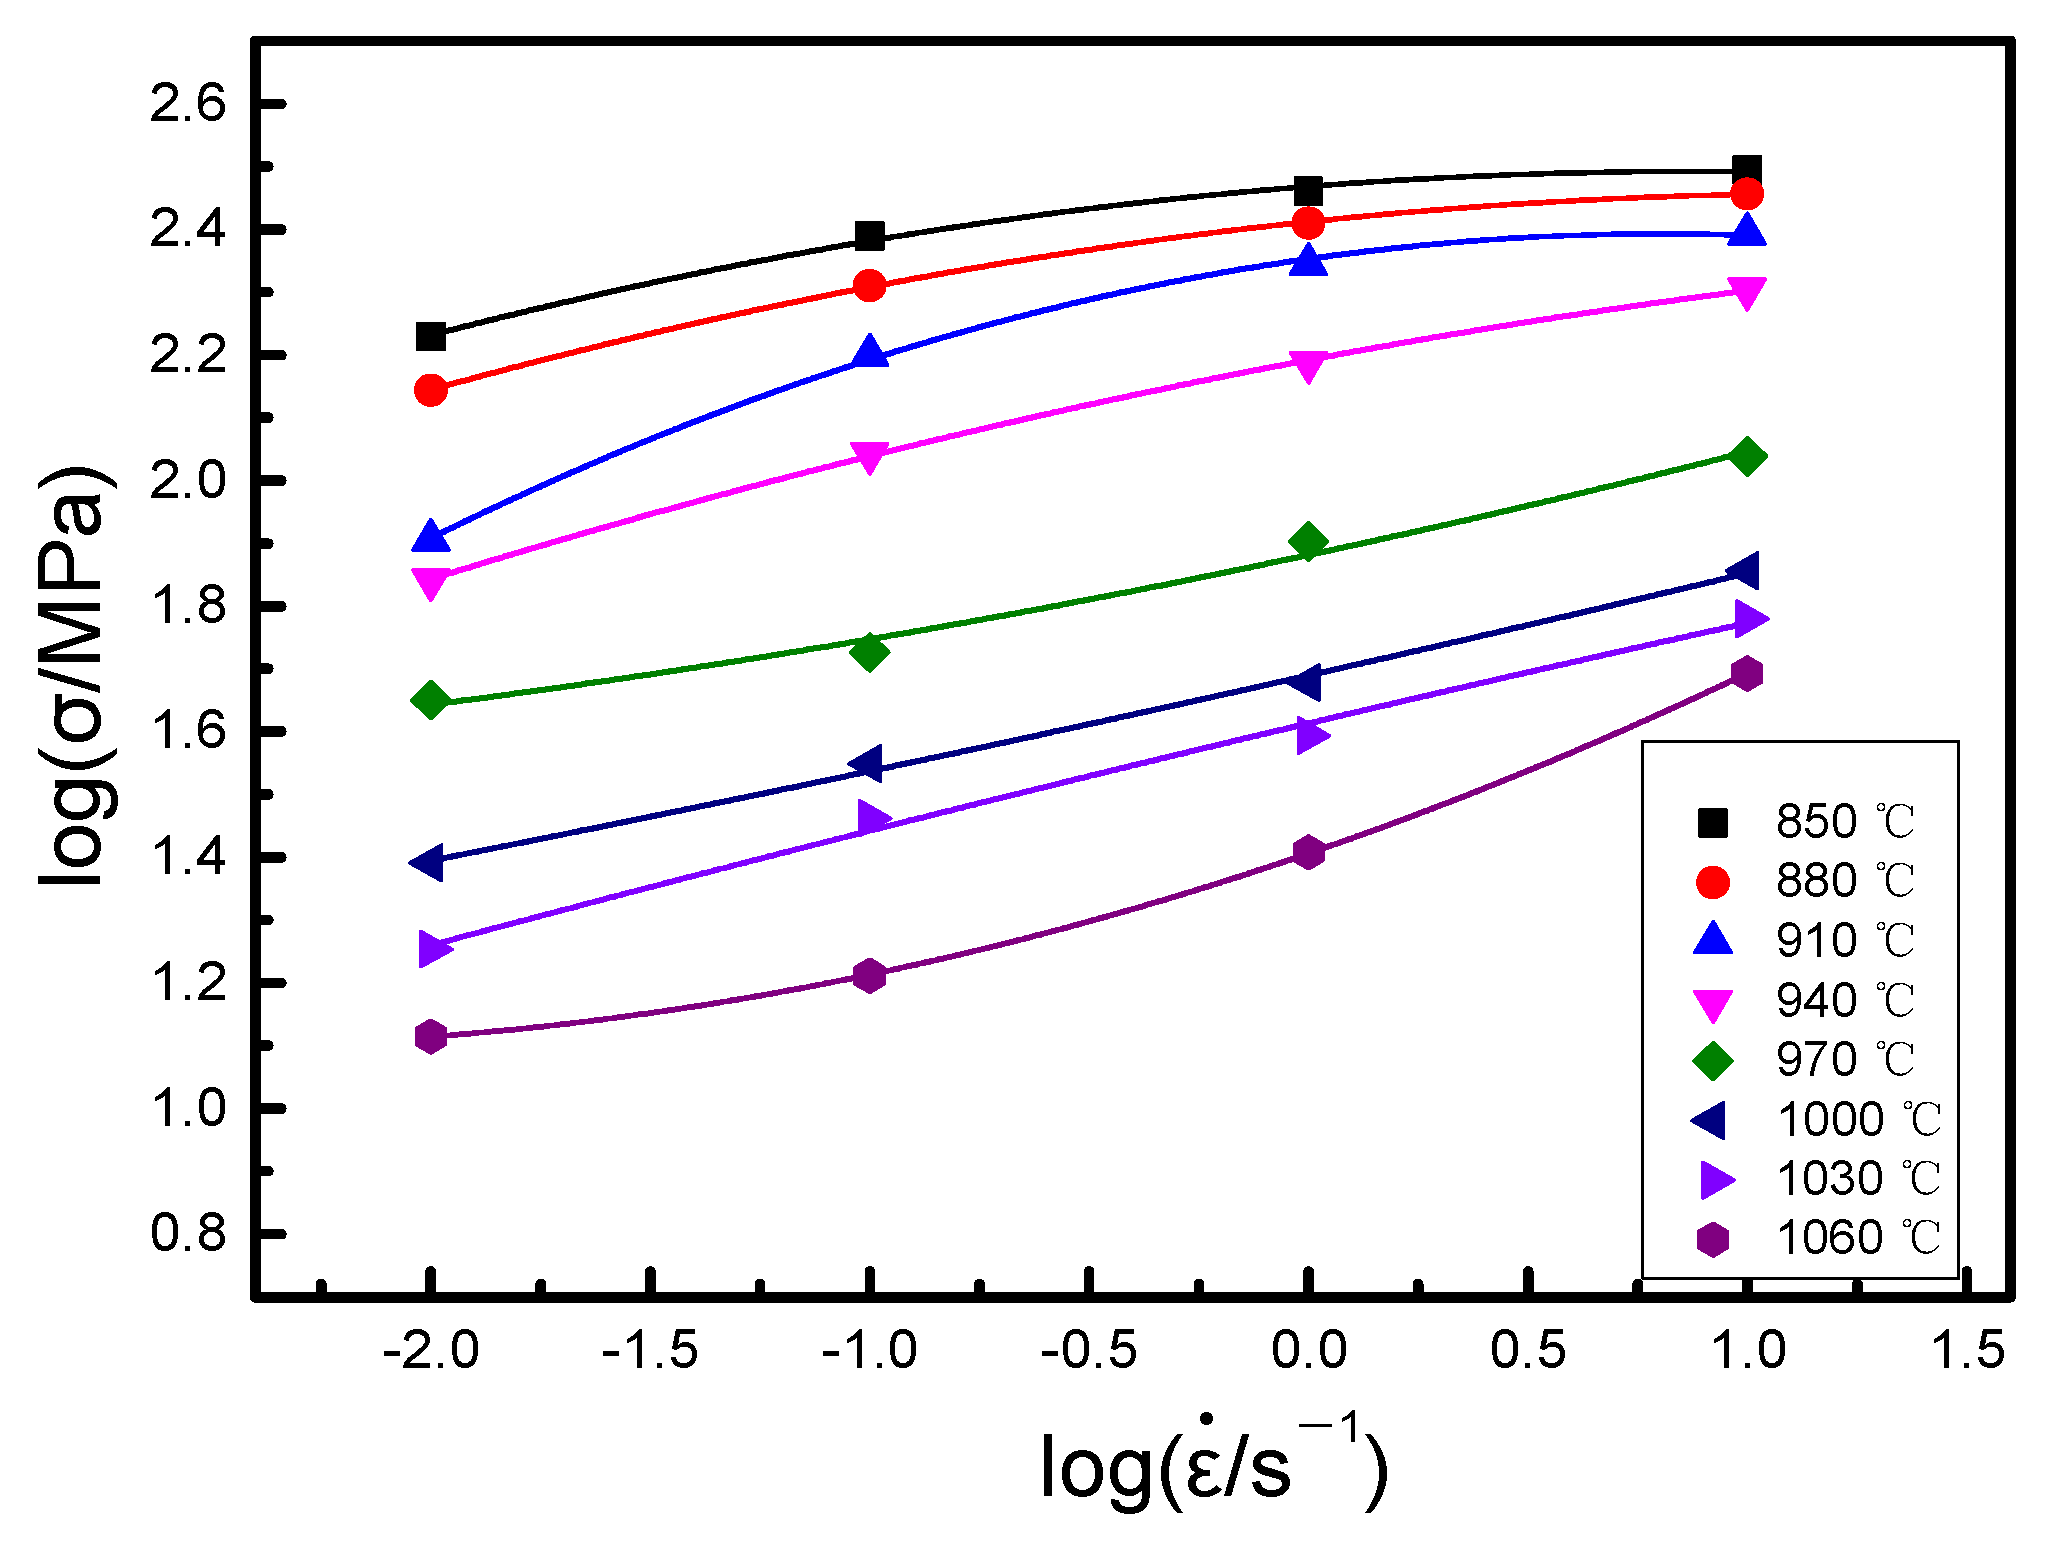
3.1. Thermal Deformation Behavior
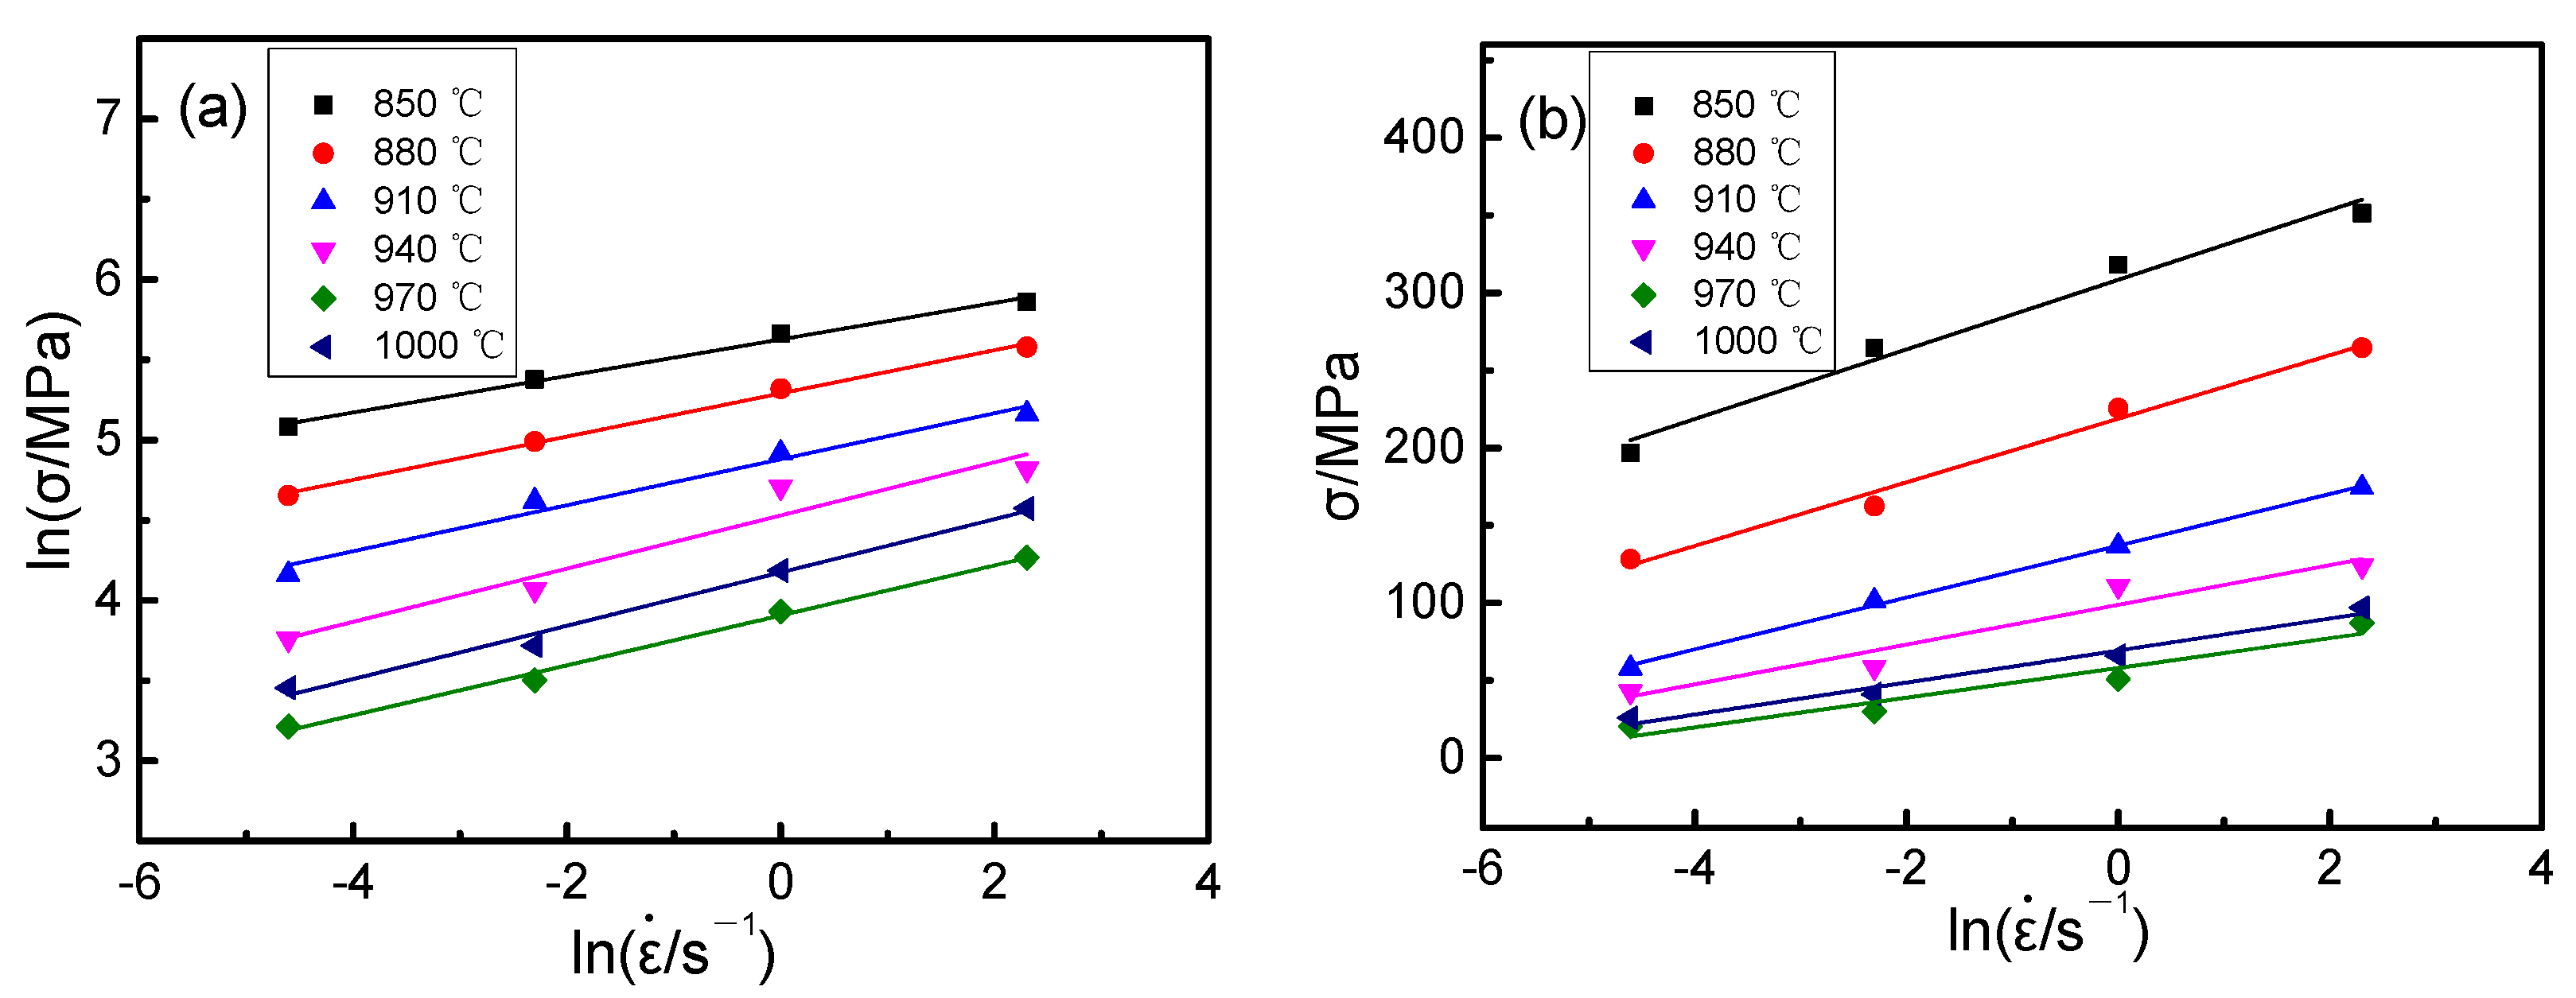
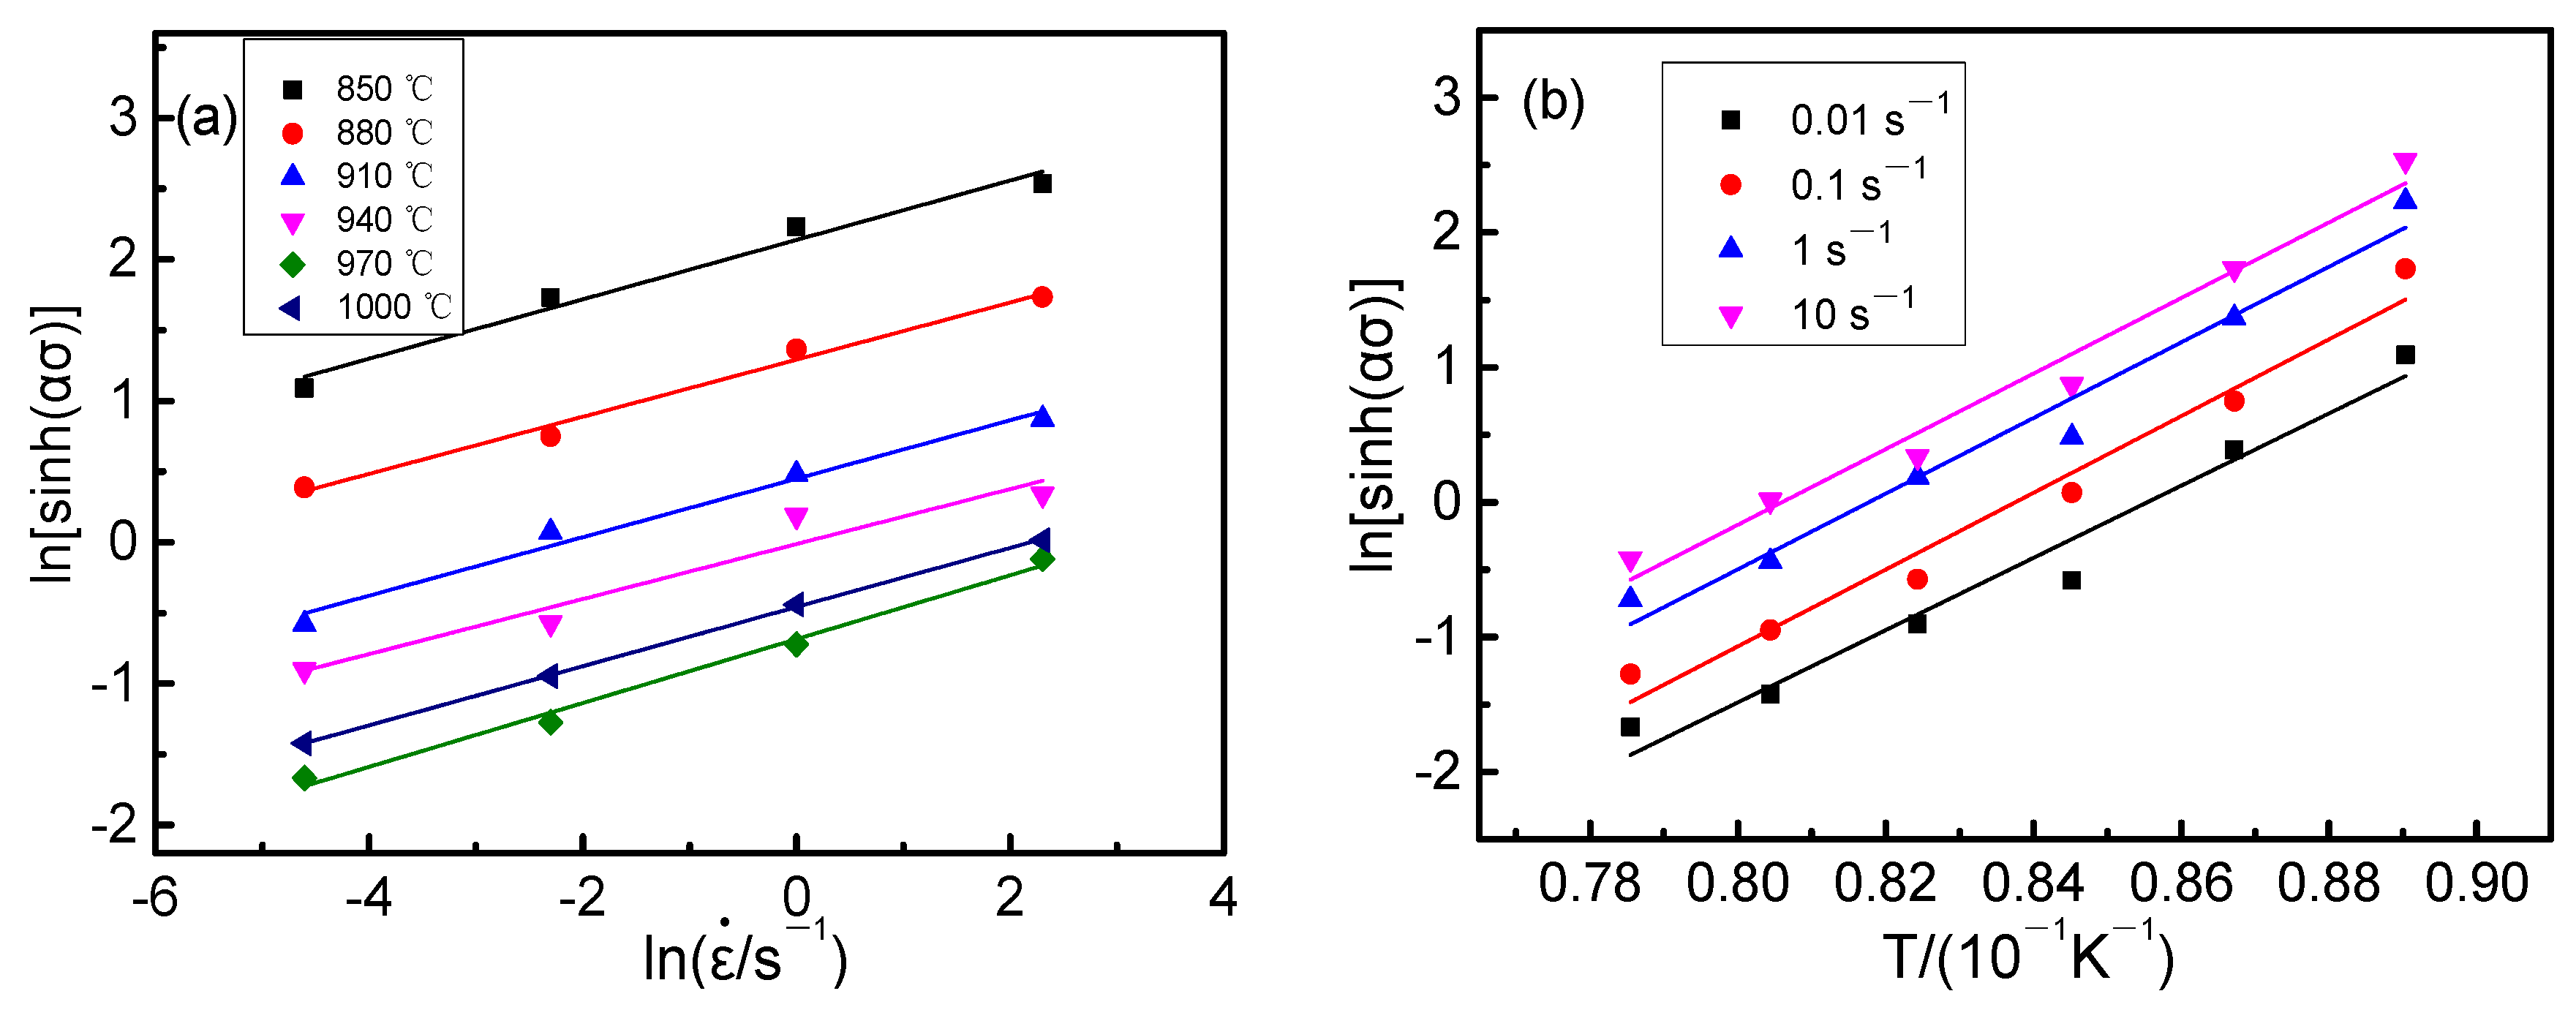
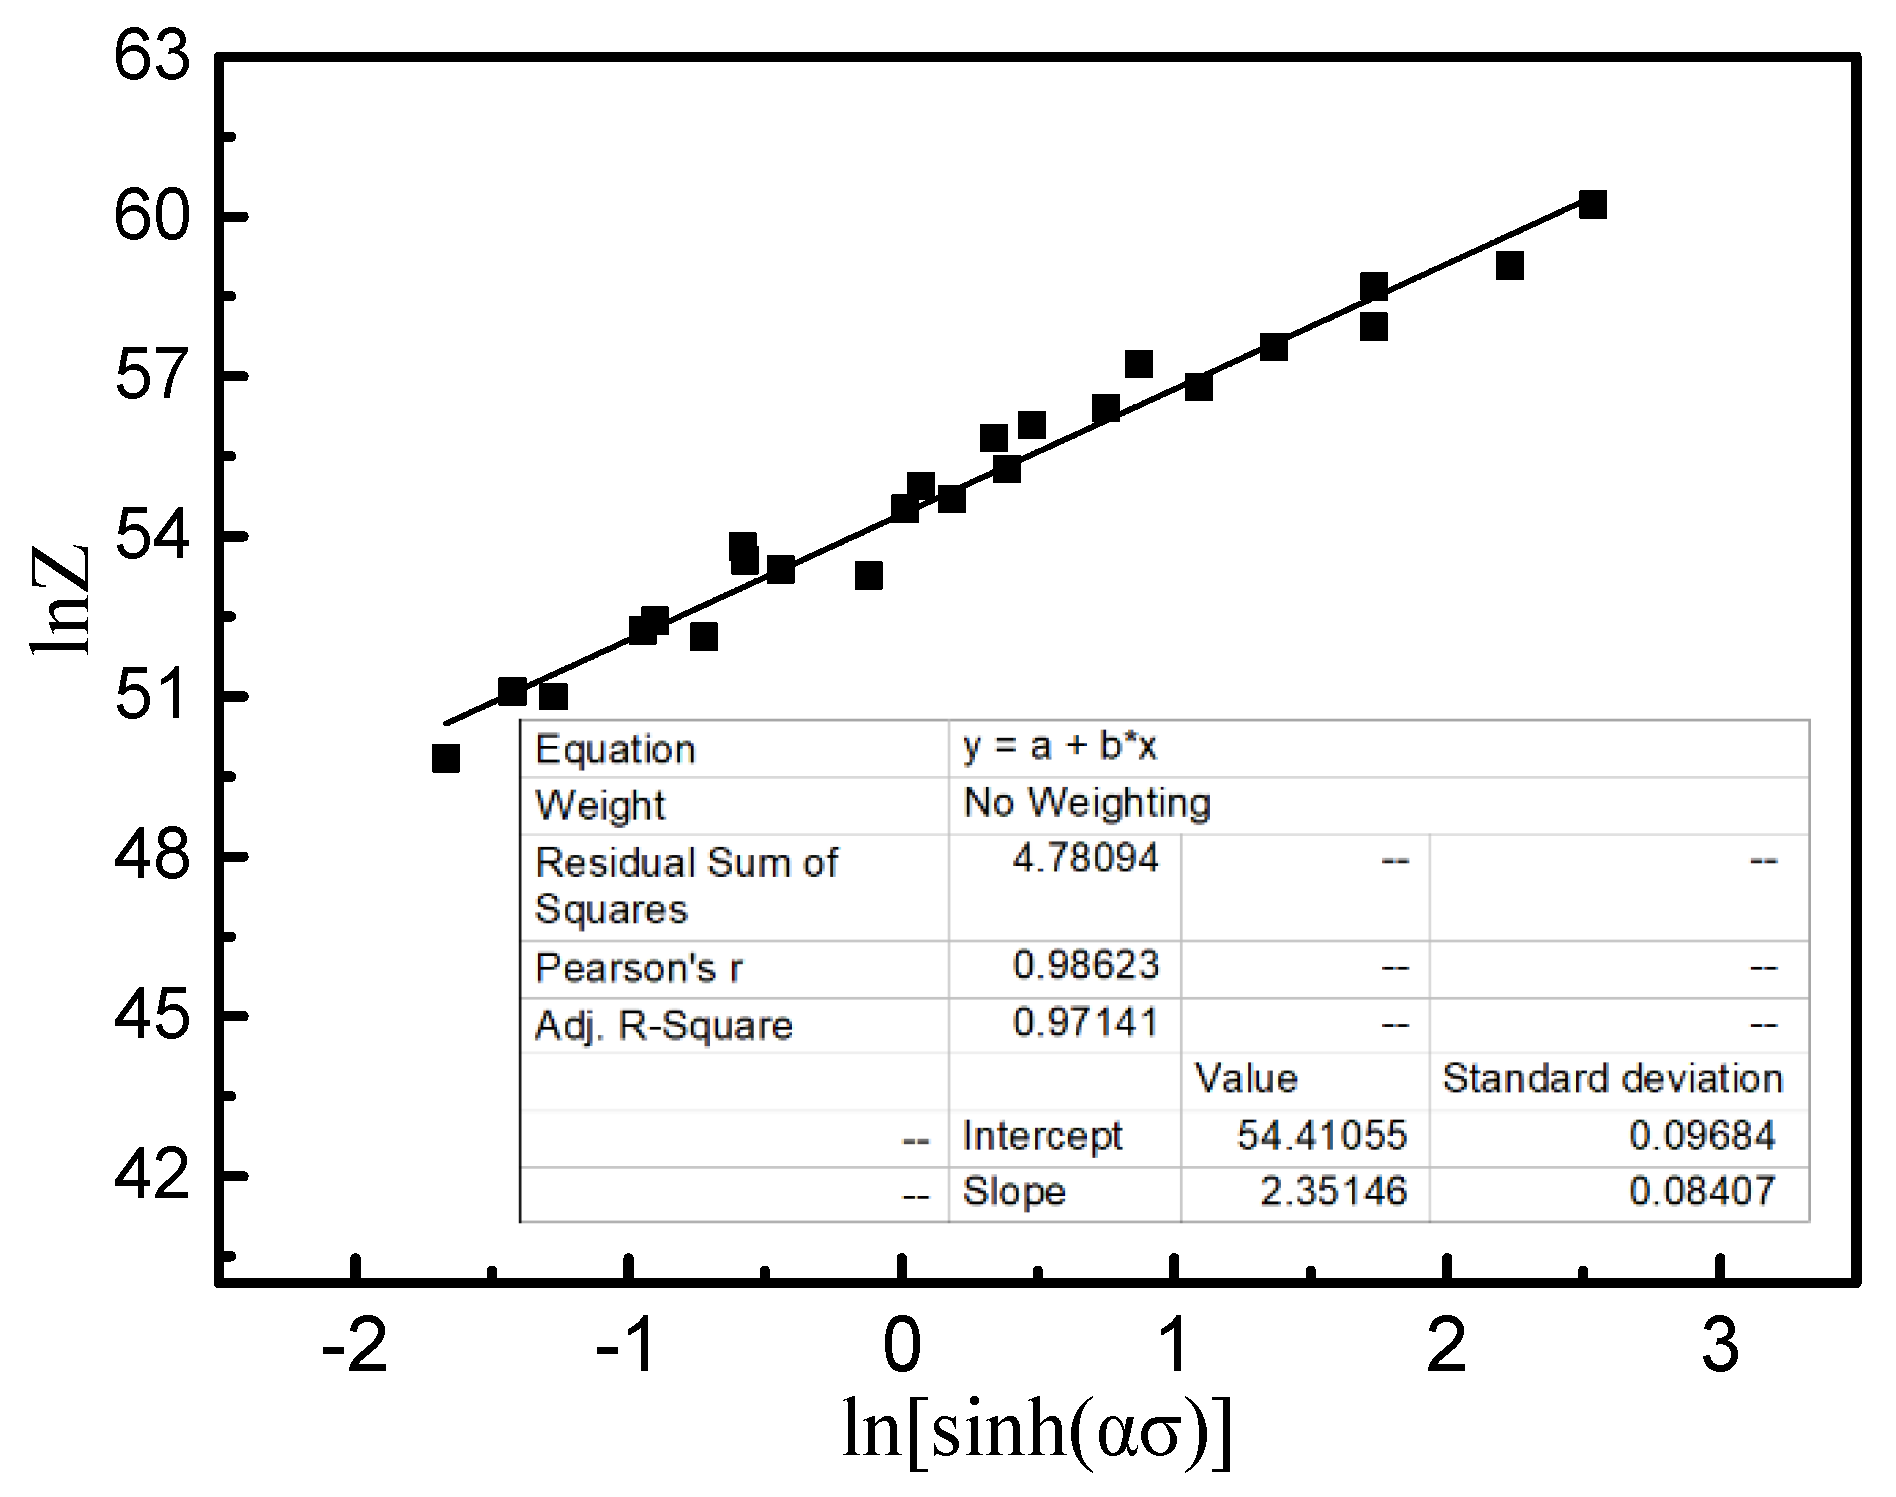
3.2. Constructive Equation
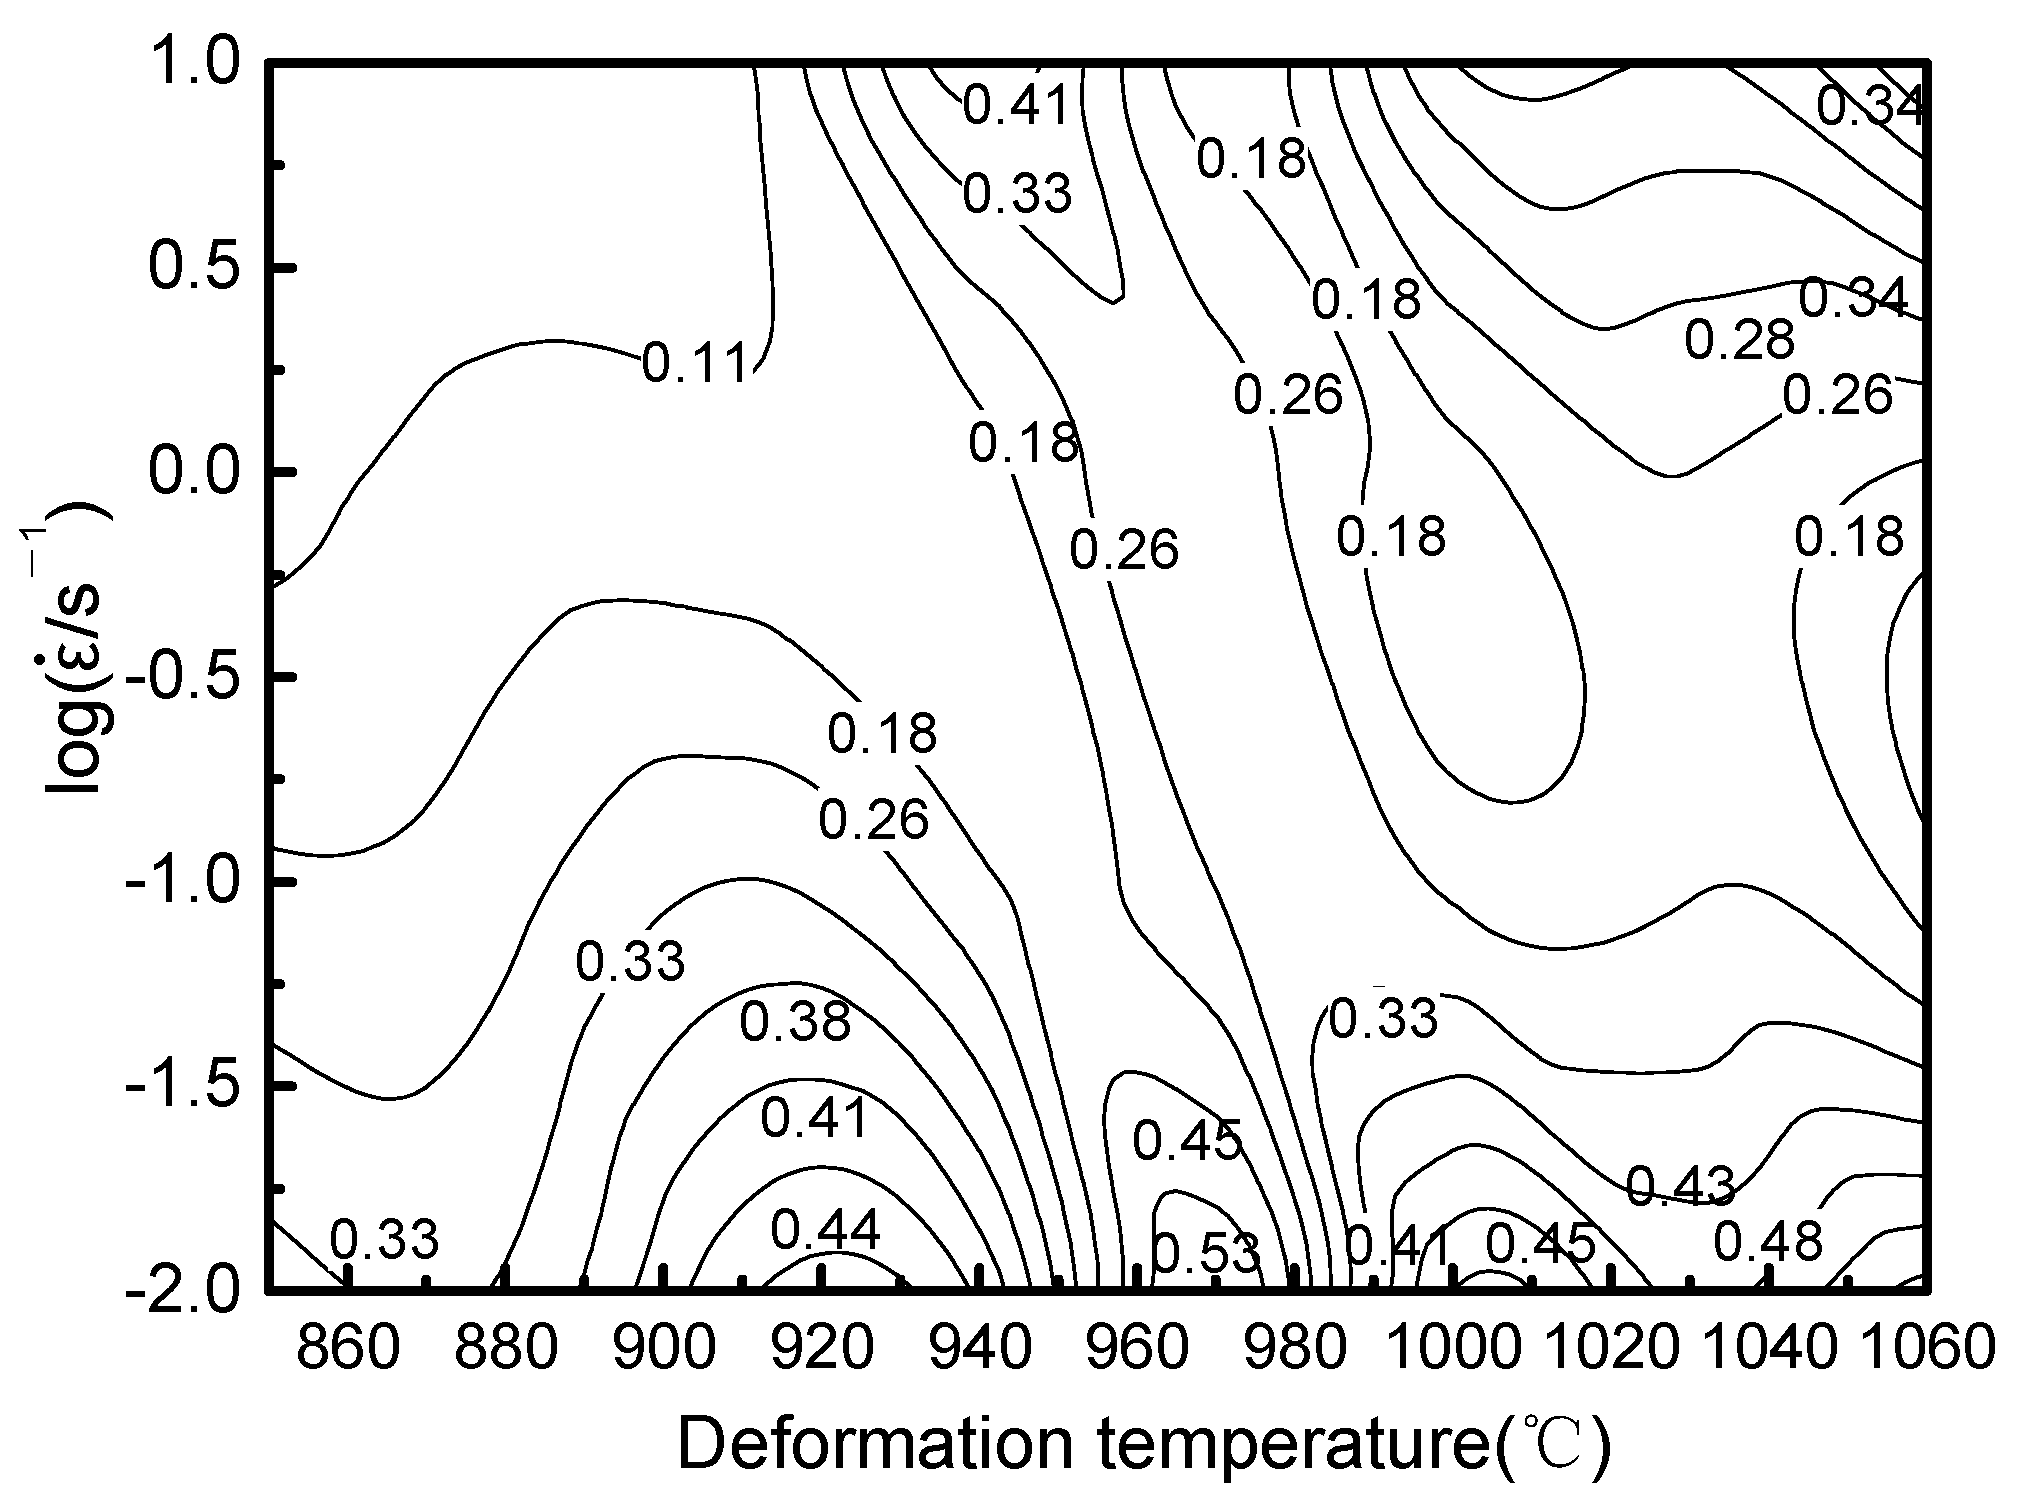
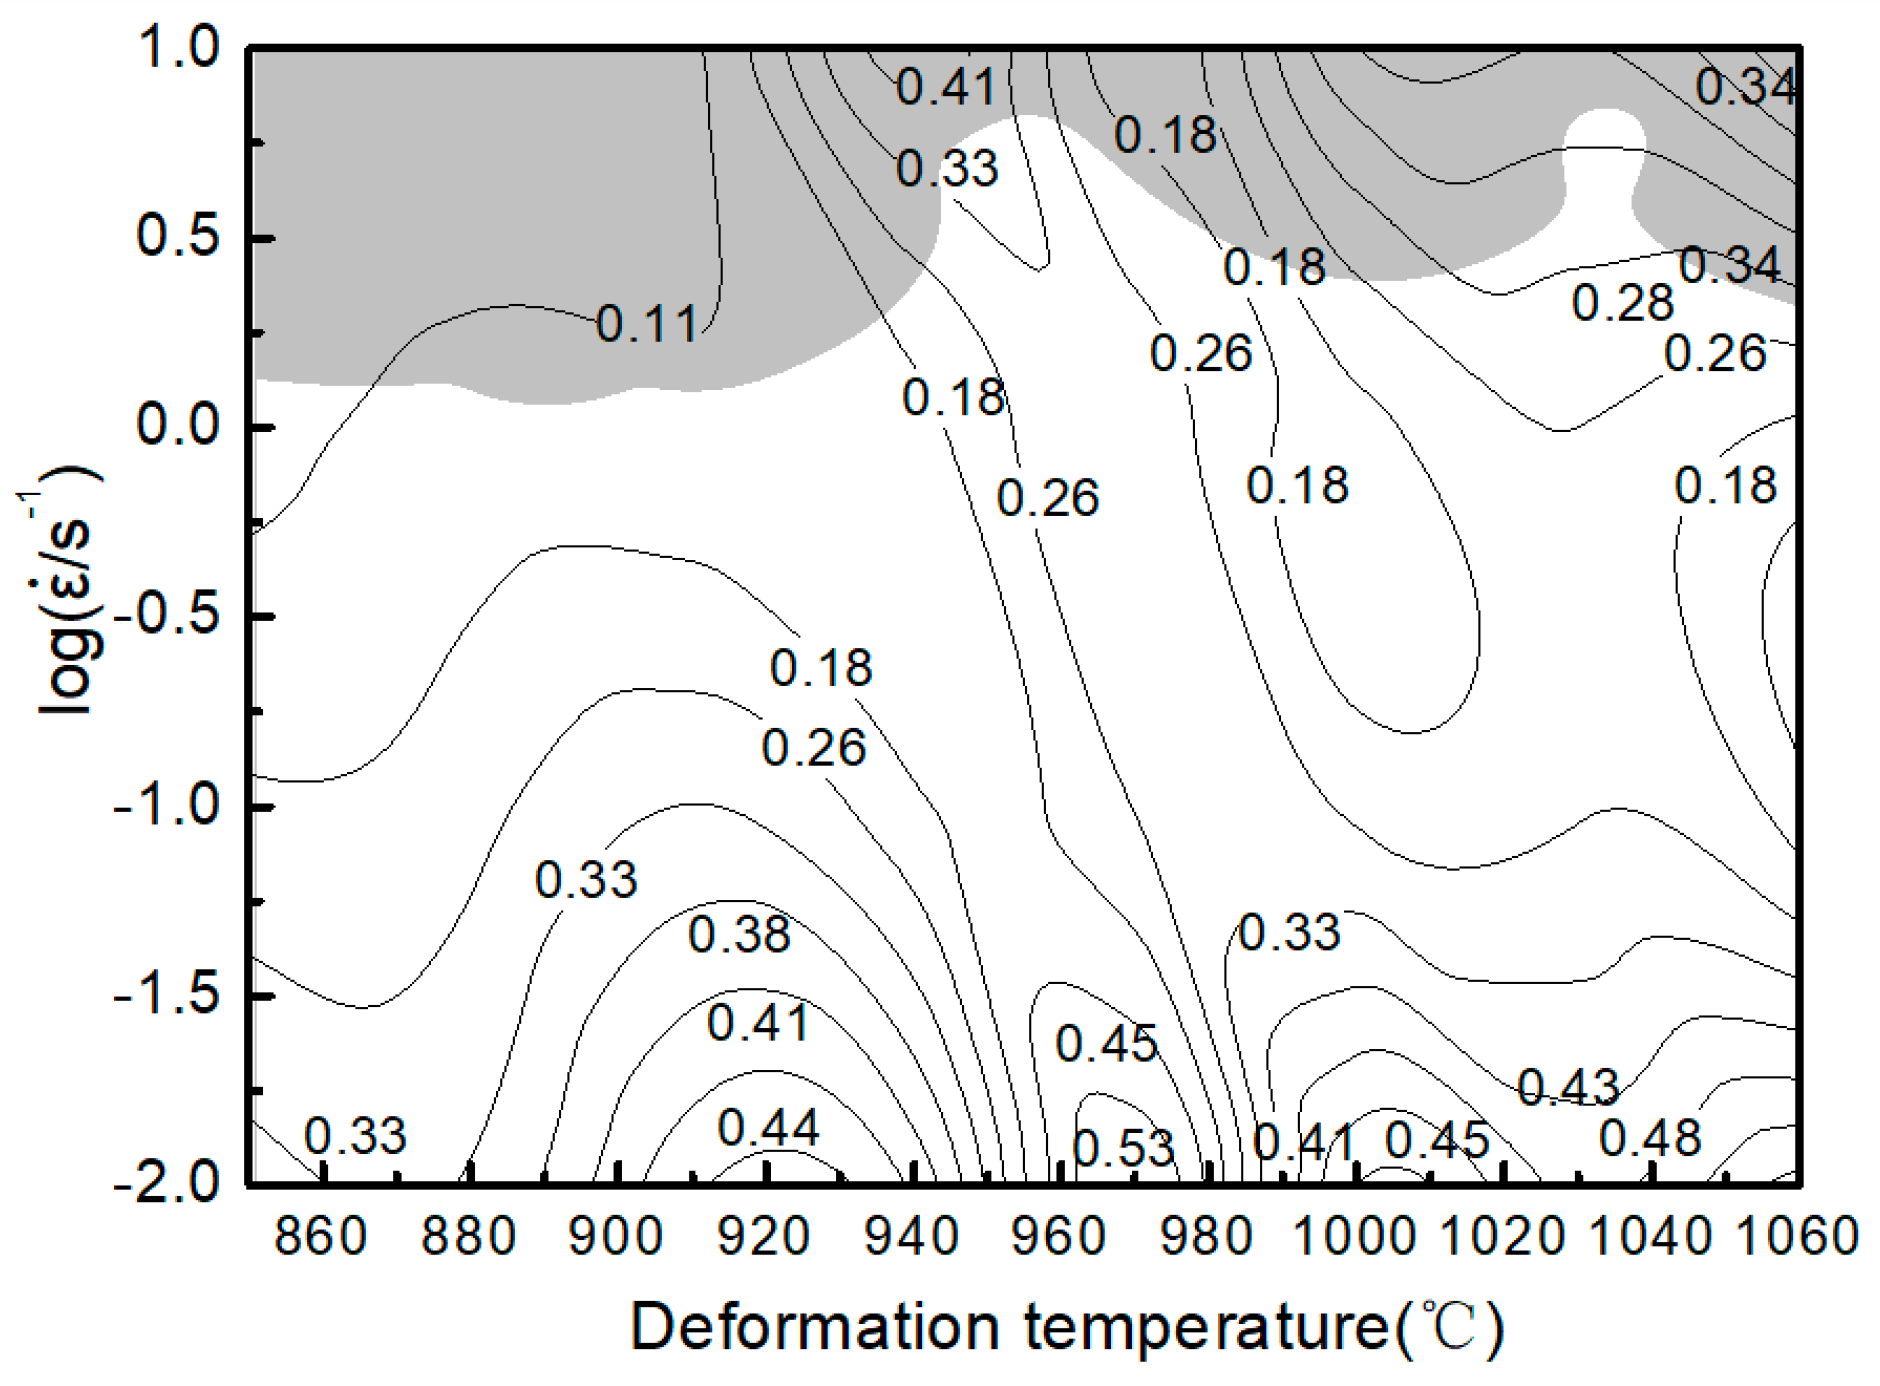
3.3. Processing Maps
3.3.1. Dissipative Judgment Criterion
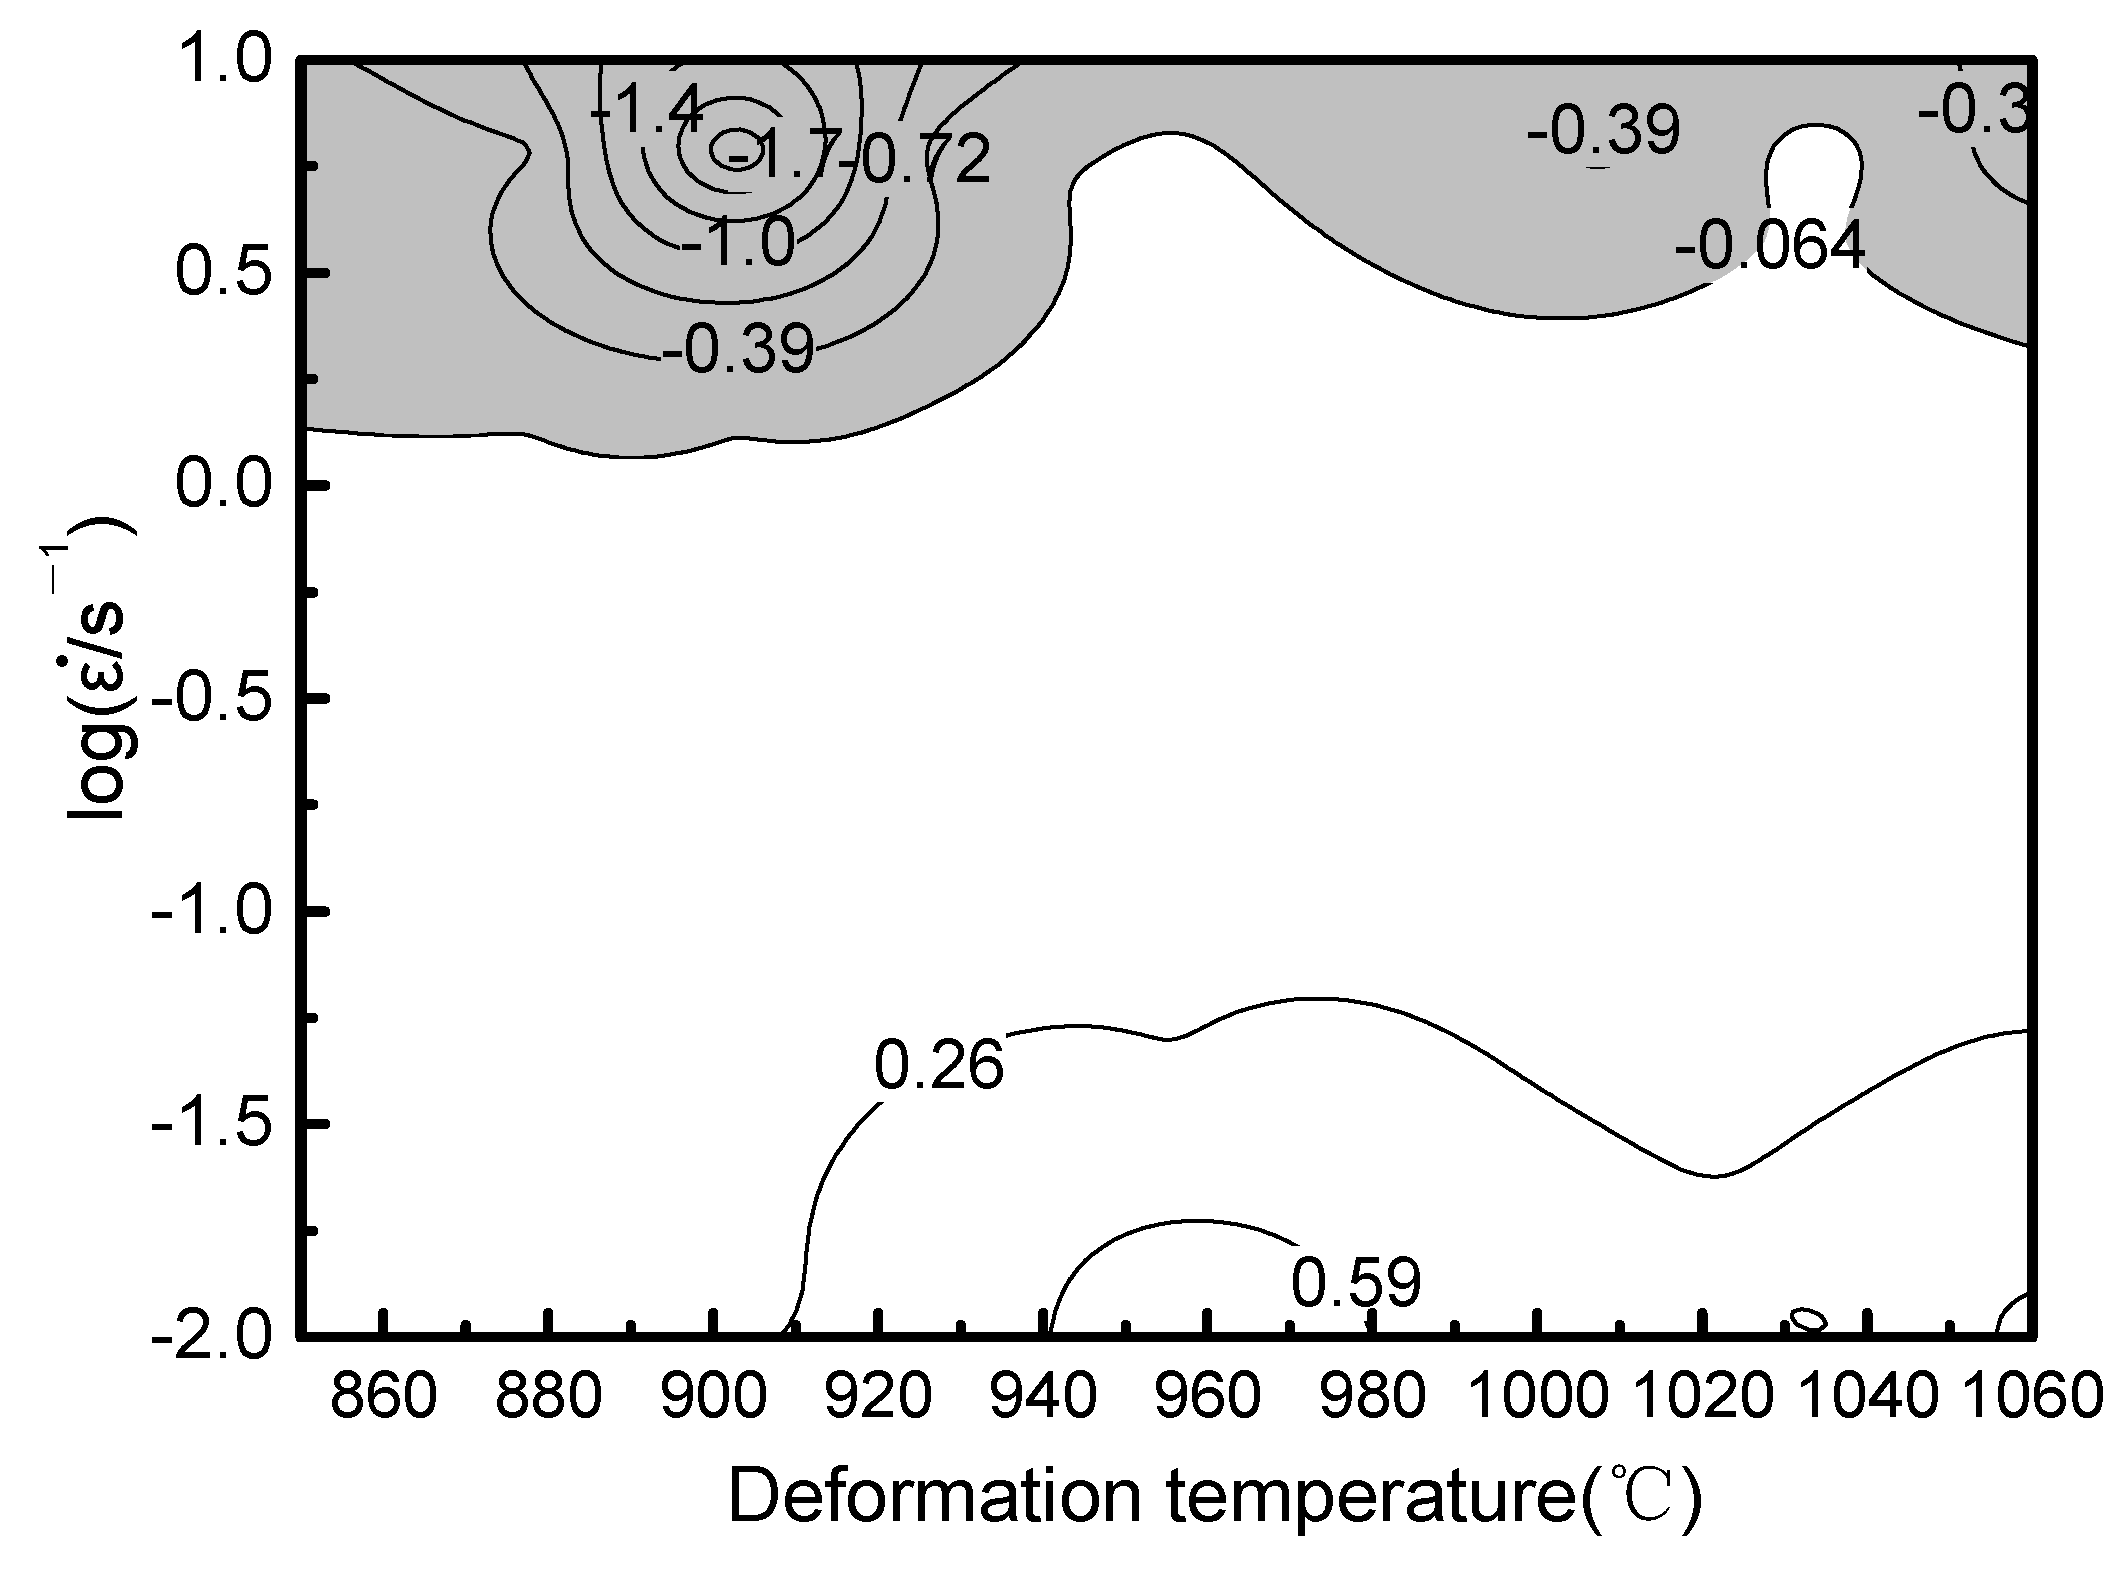
3.3.2. Plastic Instability Criterion
3.3.3. Processing Maps Analysis
4. Conclusions
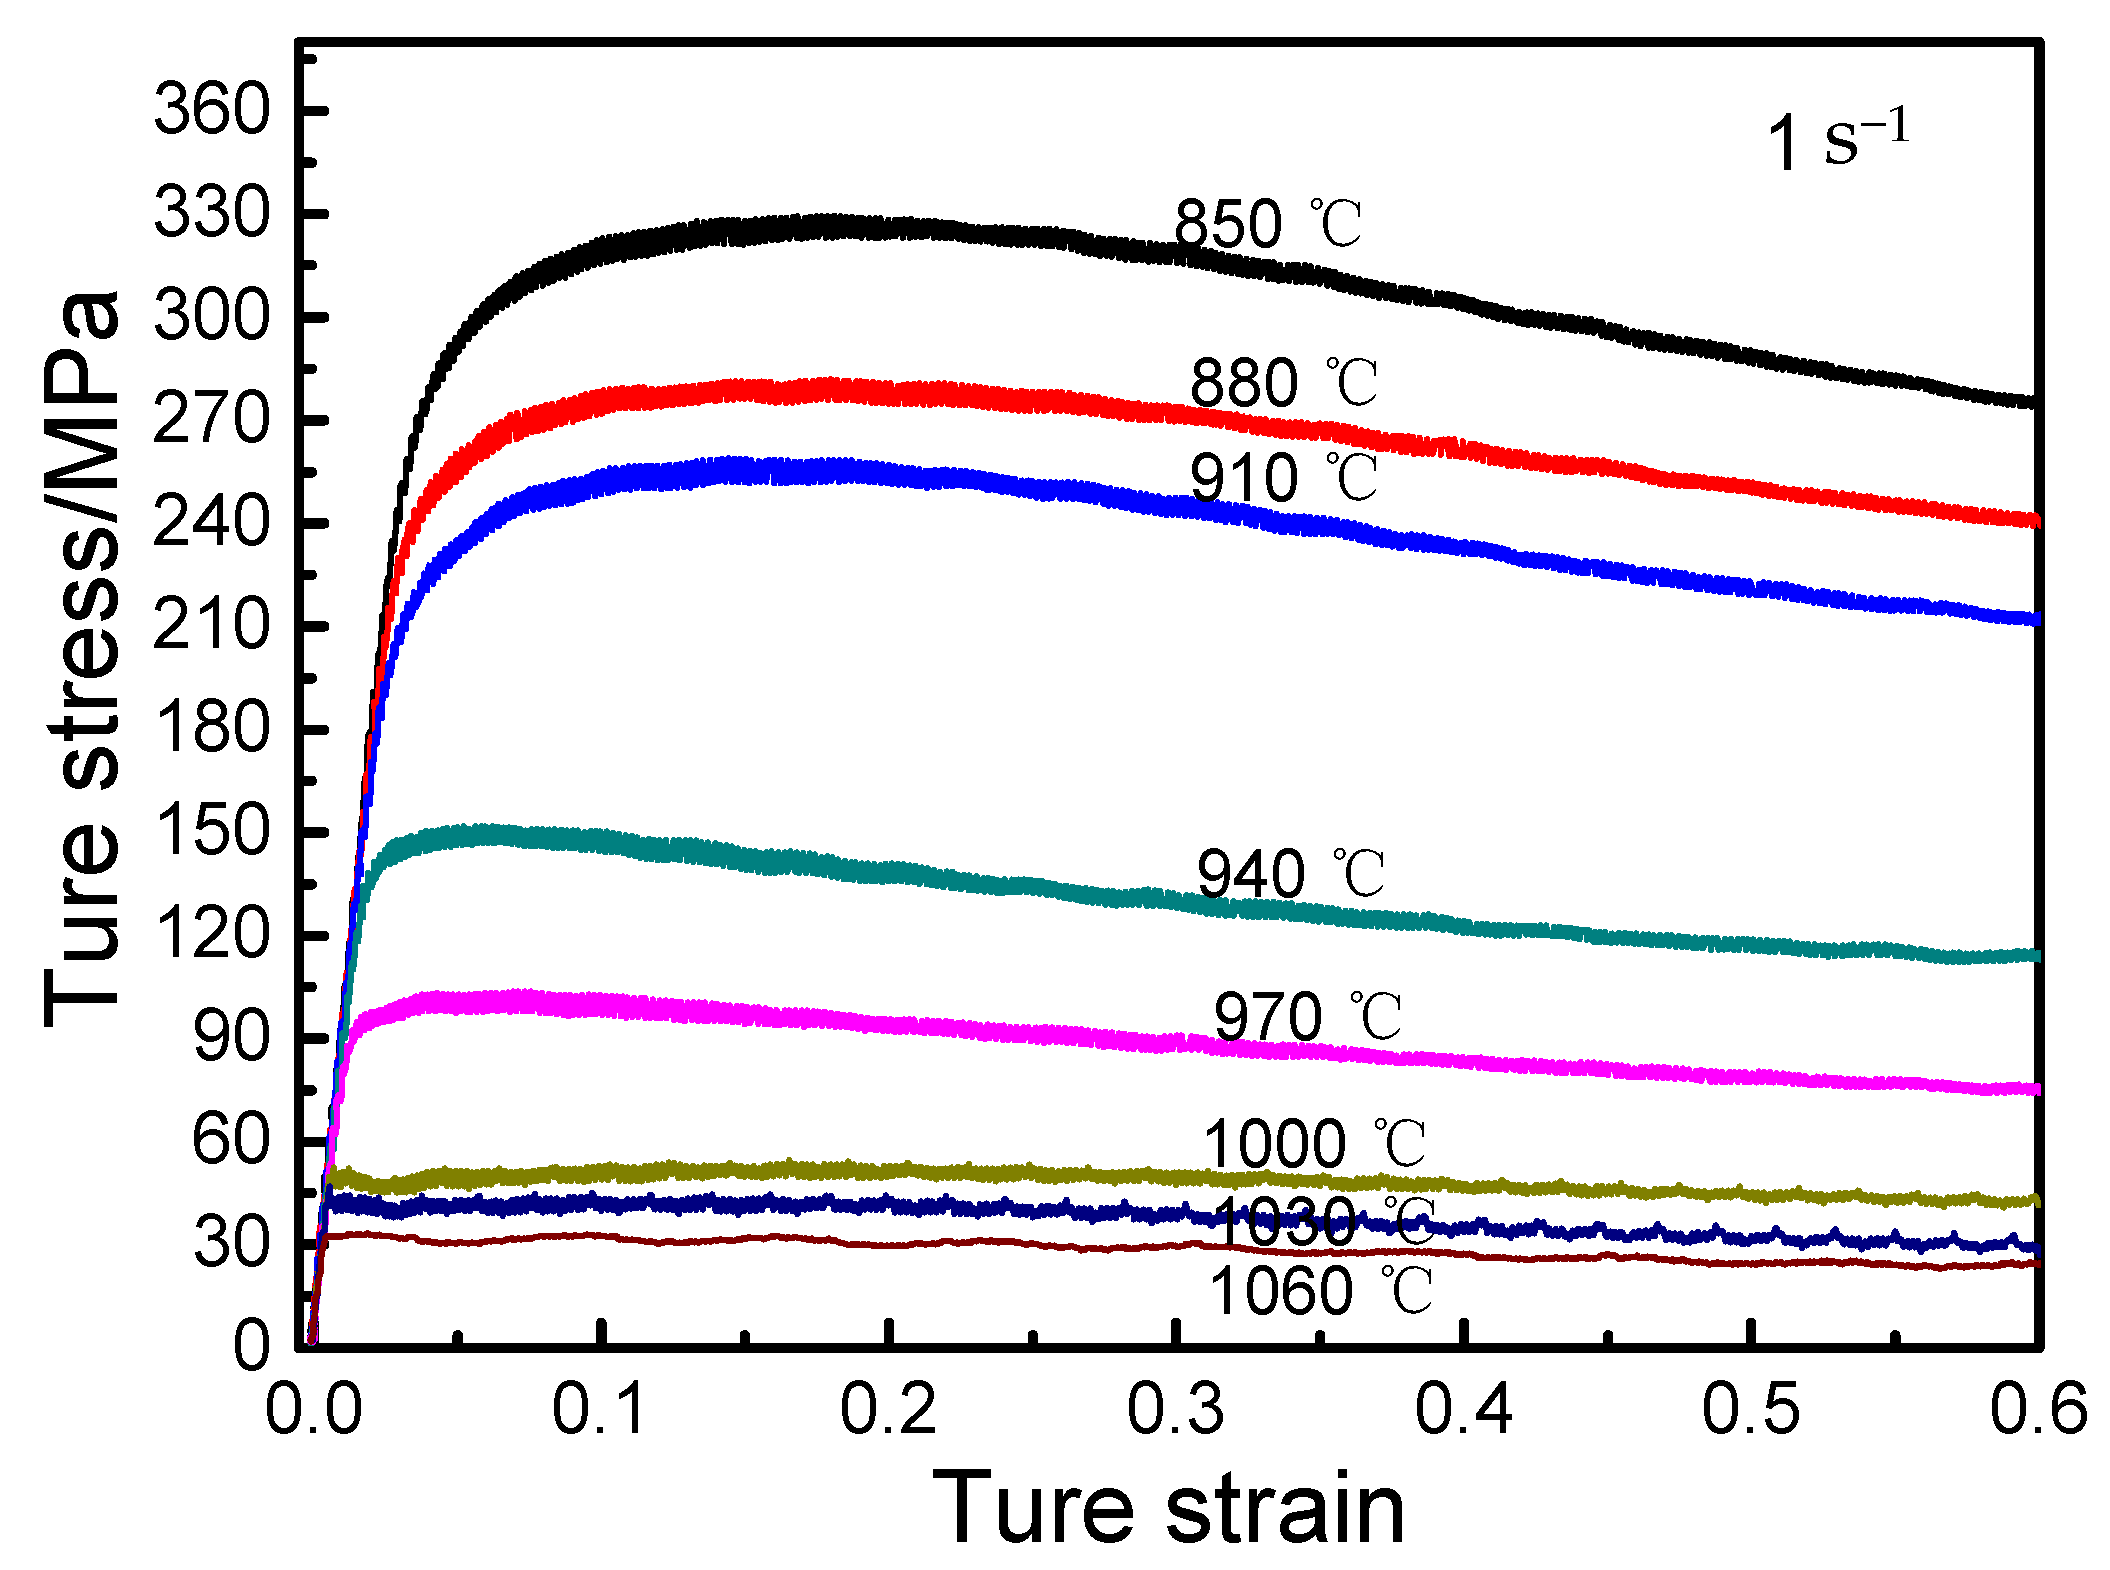
- The true stress–strain curves were similar under all conditions. The flow stress reached the peak fast (hardening) by increasing the strain followed by a gradual decrease (softening), exhibiting a typical dynamic recrystallization curve. When the true compressive strain exceeded a certain value, the change in flow stress decreased and tended to a stable value by increasing the strain variable.
- The thermal deformation activation energy Q was 551.7 kJ/mol, and the constitutive equation was hyperbolic sine functions.
- The suitable hot-working zone of the alloy was in the range of 0.01–0.05 s−1 and temperature range of 920–980 °C at the (α + β) two-phase region, and the energy dissipation rate was 53%. The other zone was in the range of 0.01–0.1 s−1 and temperature range of 1010–1040 °C at the β single-phase region, and the energy dissipation rate was 48%.
Author Contributions
Funding
Institutional Review Board Statement
Informed Consent Statement
Data Availability Statement
Conflicts of Interest
References
- Li, D.; Wang, K.; Yan, Z.; Cao, Y.; Misra, R.; Xin, R.; Liu, Q. Evolution of microstructure and tensile properties during the three-stage heat treatment of TA19 titanium alloy. Mater. Sci. Eng. A 2018, 716, 157–164. [Google Scholar] [CrossRef]
- Li, W.Y.; Chen, Z.C.; Liu, J.R.; Wang, Q.J.; Sui, G.X. Effect of texture on anisotropy at 600 C in a near-alpha titanium alloy Ti60 plate. Mater. Sci. Eng. A 2017, 688, 322–329. [Google Scholar] [CrossRef]
- Yang, Z.; Kou, H.; Li, J.; Hu, R.; Chang, H.; Zhou, L. Macrosegregation Behavior of Ti-10V-2Fe-3Al Alloy During Vacuum Consumable Arc Remelting Process. J. Mater. Eng. Perform. 2010, 20, 65–70. [Google Scholar] [CrossRef]
- Wang, K.; Li, M. Flow behavior and deformation mechanism in the isothermal compression of the TC8 titanium alloy. Mater. Sci. Eng. A 2014, 600, 122–128. [Google Scholar] [CrossRef]
- Balasubrahmanyam, V.V.; Prasad, Y.V.R.K. Deformation behaviour of beta titanium alloy Ti-10V-4.5Fe-1.5Al in hot upset forging. Mater. Sci. Eng. A 2002, 336, 150–158. [Google Scholar] [CrossRef]
- Niu, Y.; Hou, H.; Li, M.; Li, Z. High temperature deformation behavior of a near alpha Ti600 titanium alloy. Mater. Sci. Eng. A 2008, 492, 24–28. [Google Scholar] [CrossRef]
- Luo, J.; Li, M. Strain rate sensitivity and strain hardening exponent during the isothermal compression of Ti60 alloy. Mater. Sci. Eng. A 2012, 538, 156–163. [Google Scholar] [CrossRef]
- Luo, J.; Li, M.; Yu, W.; Li, H. The variation of strain rate sensitivity exponent and strain hardening exponent in isothermal compression of Ti–6Al–4V alloy. Mater. Des. 2010, 31, 741–748. [Google Scholar] [CrossRef]
- Lei, L.M.; Huang, X.; Wang, M.M.; Wang, L.Q.; Qin, J.N.; Li, H.P.; Lu, S.Q. Effect of hot compressive deformation on the martensite transformation of Ti-10V-2Fe-3Al titanium alloy. Mater. Sci. Eng. A 2011, 530, 591–601. [Google Scholar] [CrossRef]
- Jia, W.; Zeng, W.; Zhou, Y.; Liu, J.; Wang, Q. High-temperature deformation behavior of Ti60 titanium alloy. Mater. Sci. Eng. A 2011, 528, 4068–4074. [Google Scholar] [CrossRef]
- Wang, J.; Guo, X.; Xiao, L.; Wang, L.; Lu, W.; Li, B.; Li, Z.; Zhang, D. Effect of B4C on the Microstructure and Mechanical Properties of As-Cast TiB+TiC/TC4 Composites. Acta Met. Sin. Engl. Lett. 2014, 27, 205–210. [Google Scholar] [CrossRef]
- Huang, C.; Lai, K.L.J.; Lee, C.S. Deformation characteristics of Ti-24Al-14Nb-3V-0.5Mo alloy during hot compression. J. Mater. Process. Technol. 1998, 73, 119–124. [Google Scholar] [CrossRef]
- JMatPro Software, version 9.0; Material properties simulation software; Thrmotech Ltd. and Sente Software Ltd.: Guildford, UK, 2016.
- Fan, J.; Kou, H.; Lai, M.; Tang, B.; Chang, H.; Li, J. Characterization of hot deformation behavior of a new near beta titanium alloy: Ti-7333. Mater. Des. 2013, 49, 945–952. [Google Scholar] [CrossRef]
- McQueen, H.; Ryan, N. Constitutive analysis in hot working. Mater. Sci. Eng. A 2002, 322, 43–63. [Google Scholar] [CrossRef]
- Yu, W.; Hou, S.; Yang, Z.; Zhang, J.; Lang, S. Characterization and Modeling of Room-Temperature Compressive Creep Behavior of a Near α TA31 Titanium Alloy. Metals 2020, 10, 1190. [Google Scholar] [CrossRef]
- Li, M.Q.; Pan, H.S.; Lin, Y.Y.; Luo, J. High temperature deformation behavior of near alpha Ti-5.6Al-4.8Sn-2.0Zr alloy. J. Mater. Process. Tech. 2007, 183, 71–76. [Google Scholar] [CrossRef]
- Ma, D.W.; Li, M.Q.; Luo, J.; Yu, W.X.; Su, S.B.; Wu, J.L. Flow stress model considering contribution of strain in isothermal compression of 7A09 aluminum alloy. Chin. J. Nonferrous Met. 2011, 21, 954–960. [Google Scholar]
- Zhang, J.; Di, H.; Wang, H.; Mao, K.; Ma, T.; Cao, Y. Hot deformation behavior of Ti-15-3 titanium alloy: A study using processing maps, activation energy map, and Zener–Hollomon parameter map. J. Mater. Sci. 2012, 47, 4000–4011. [Google Scholar] [CrossRef]
- Yu, H.Y. Variation of elastic modulus during plastic deformation and its influence on springback. Mater. Des. 2009, 30, 846–850. [Google Scholar] [CrossRef]
- Shi, Y.D.; Wang, L.N.; Liang, S.X.; Zhou, Q.; Zheng, B. A high Zr-containing Ti-based alloy with ultralow Young’s modulus and ultrahigh strength and elastic admissible strain. Mater. Sci. Eng. A 2016, 674, 696–700. [Google Scholar] [CrossRef]
- Kardashev, B.K.; Betekhtin, V.I.; Kadomtsev, A.G.; Narykova, M.V.; Kolobov, Y.R. Elastic and microplastic properties of titanium in different structural states. Tech. Phys. 2017, 62, 1372–1376. [Google Scholar] [CrossRef]
- Seshacharyulu, T.; Medeiros, S.C.; Frazier, W.G. Hot working of Commercial Ti-6Al-4V with an Equiaxed α-β Microstructure: Materials Modeling Considerations. Mater. Sci. Eng. A 2020, 284, 184–194. [Google Scholar] [CrossRef]
- Wan, P.; Zou, H.; Wang, K.; Zhao, Z.; Lu, S.; Nie, H. Hot Deformation Behaviors and Intrinsic Hot Workability Map of Ti-12Mo-4Zr-5Sn Alloy Based on Physical Model and Polar Reciprocity Model. Metals 2020, 10, 956. [Google Scholar] [CrossRef]
- Zener, C.; Hollomon, J.H. Effect of Strain Rate upon Plastic Flow of Steel. J. Appl. Phys. 1944, 15, 22–32. [Google Scholar] [CrossRef]
- Medina, S.F.; Hernandez, C.A. General expression of the Zener-Hollomon parameter as a function of the chemical composition of low alloy and microalloyed steels. Acta Mater. 1996, 44, 137. [Google Scholar] [CrossRef]
- Prasad, Y.V.R.K.; Gegel, H.L.; Doraivelu, S.M.; Malas, J.C.; Morgan, J.T.; Lark, K.A.; Barker, D.R. Modeling of dynamic material behavior in hot deformation: Forging of Ti-6242. Met. Mater. Trans. A 1984, 15, 1883–1892. [Google Scholar] [CrossRef]
- Zhang, J.-L.; Guo, H.-Z.; Liang, H.-Q. Hot deformation behavior and process parameter optimization of Ti22Al25Nb using processing map. Rare Met. 2016, 35, 118–126. [Google Scholar] [CrossRef]
- Li, M.; Zhang, X. Optimization of TC11 alloy forging parameters using processing maps. Rare Met. 2011, 30, 222–226. [Google Scholar] [CrossRef]
- Gu, S.-D.; Zhang, L.-W.; Ruan, J.-H.; Zhou, P.-Z.; Zhen, Y. Constitutive Modeling of Dynamic Recrystallization Behavior and Processing Map of 38MnVS6 Non-Quenched Steel. J. Mater. Eng. Perform. 2014, 23, 1062–1068. [Google Scholar] [CrossRef]
- Liu, Q.; Wang, Z.; Yang, H.; Ning, Y. Hot Deformation Behavior and Processing Maps of Ti-6554 Alloy for Aviation Key Structural Parts. Metals 2020, 10, 828. [Google Scholar] [CrossRef]
- Li, D.J.; Feng, Y.R.; Yin, Z.F.; Shang, G.F.S.; Wang, K.; Liu, Q.; Hu, F. Hot deformation behavior of an austenitic Fe–20Mn–3Si–3Al transformation induced plasticity steel. Mater. Des. 2012, 34, 713–718. [Google Scholar] [CrossRef]
- Kumar, J.; Singh, V.; Ghosal, P.; Kumar, V. Characterization of fracture and deformation mechanism in a high strength beta titanium alloy Ti-10-2-3 using EBSD technique. Mater. Sci. Eng. A 2015, 623, 49–58. [Google Scholar] [CrossRef]
- Prasad, Y.V.R.K. Processing Maps: A Status Report. J. Mater. Eng. Perform. 2003, 12, 638–645. [Google Scholar] [CrossRef]
- Li, H.Z.; Jun, J.; Min, D.; X, P.L.; Jie, O.Y. Hot Deformation Behavior and Microstructure of 6069 Aluminum Alloy. Mater. Sci. Forum. 2014, 788, 201–207. [Google Scholar] [CrossRef]
- Chen, X.; Du, Y.; Lian, T.; Du, K.; Huang, T. Hot Workability of Ultra-Supercritical Rotor Steel Using a 3-D Processing Map Based on the Dynamic Material Model. Materials 2020, 13, 4118. [Google Scholar] [CrossRef]


| Al | Nb | Zr | B | Si | C | N | H | O |
|---|---|---|---|---|---|---|---|---|
| 5.97 | 2.01 | 1.93 | 0.402 | <0.010 | 0.029 | 0.0062 | 0.0010 | 0.074 |
Publisher’s Note: MDPI stays neutral with regard to jurisdictional claims in published maps and institutional affiliations. |
© 2021 by the authors. Licensee MDPI, Basel, Switzerland. This article is an open access article distributed under the terms and conditions of the Creative Commons Attribution (CC BY) license (https://creativecommons.org/licenses/by/4.0/).
Share and Cite
Yang, Z.; Yu, W.; Lang, S.; Wei, J.; Wang, G.; Ding, P. Hot Deformation Behavior and Processing Maps of a New Ti-6Al-2Nb-2Zr-0.4B Titanium Alloy. Materials 2021, 14, 2456. https://doi.org/10.3390/ma14092456
Yang Z, Yu W, Lang S, Wei J, Wang G, Ding P. Hot Deformation Behavior and Processing Maps of a New Ti-6Al-2Nb-2Zr-0.4B Titanium Alloy. Materials. 2021; 14(9):2456. https://doi.org/10.3390/ma14092456
Chicago/Turabian StyleYang, Zhijun, Weixin Yu, Shaoting Lang, Junyi Wei, Guanglong Wang, and Peng Ding. 2021. "Hot Deformation Behavior and Processing Maps of a New Ti-6Al-2Nb-2Zr-0.4B Titanium Alloy" Materials 14, no. 9: 2456. https://doi.org/10.3390/ma14092456