Article

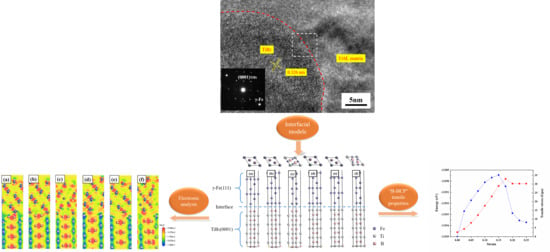
First Principle Study of TiB2 (0001)/γ-Fe (111) Interfacial Strength and Heterogeneous Nucleation

School of Materials Science and Engineering, North University of China, Taiyuan 030051, China
*
Author to whom correspondence should be addressed.
Materials 2021, 14(6), 1573; https://doi.org/10.3390/ma14061573
Submission received: 4 February 2021 / Revised: 3 March 2021 / Accepted: 15 March 2021 / Published: 23 March 2021

Abstract

:
TiB2/316L stainless steel composites were prepared by selective laser melting (SLM), and the adhesion work, interface energy and electronic structure of TiB2/γ-Fe interface in TiB2/316L stainless steel composites were investigated to explore the heterogeneous nucleation potential of γ-Fe grains on TiB2 particles using first principles. Six interface models composed of three different stacking positions and two different terminations were established. The B-terminated-top 2 site interface (“B-top 2”) was the most stable because of the largest adhesion work, smallest interfacial distances, and smallest interfacial energy. The difference charge density and partial density of states indicated that a large number of strong Fe-B covalent bonds were formed near the “B-top 2” interface, which increased the stability of interface. Fracture analysis revealed that the bonding strength of the “B-top 2” interface was higher than that of the Fe matrix, and it was difficult to fracture at the interface. The interface energy at the Ti-poor position in the “B-top 2” interface model was smaller than that of the γ-Fe/Fe melt, indicating that TiB2 had strong heterogeneous nucleation potency for γ-Fe.

Graphical Abstract

1. Introduction

316L stainless steel is widely used in aerospace, biomedicine, automotive structure, and other fields due to its high wear resistance, corrosion resistance, and ductility [1]. However, it shows poor mechanical properties under high strength and high temperature, limiting its application in the industry [2,3]. Metal matrix composites have received great attention in many applications [4]. The mechanical properties of stainless-steel matrix composites, such as strength, hardness, wear resistance, and thermodynamics, can be effectively improved by adding ceramic reinforcement phase [1,5]. The commonly used ceramic reinforcing phases are TiC, TiB, TiB2, SiC, WC, etc [6,7,8,9,10,11]. Because the TiB2 particle has the advantages of good thermal stability, high hardness, and good compatibility with steel. It is an effective grain refiner and an ideal material for strengthening steel matrix composites [12,13,14].
Many experiments have shown the effect of TiB2 on the microstructure and mechanical properties of stainless steel. AlMangour et al. [2] found that TiB2/316L stainless steel composite formed by selective laser melting (SLM) has higher yield strength, hardness, and wear resistance, the hardness can be increased by about twice with 15 vol% TiB2. Liu et al. [15] prepared in-situ synthesized TiB2/Mg-based composites by powder and explored the grain refining effect of the TiB2 phase. They found that TiB2 particles can be used as heterogeneous nucleation centers of magnesium alloys, effectively refining α-Mg grains.
In any kind of composite, the interfacial reaction and bonding between the matrix and reinforcement play a major role, which determines the effective heterogeneous nucleation ability and quality of the composites. However, due to the complexity of interface structure, it is difficult to evaluate the detailed interaction of the ceramic phases and matrix interface on the atomic or electronic scale through experimental methods. To further explore the strengthening mechanism and refinement mechanism of ceramic particles on the substrate metal, many scholars use the first principle to calculate and analyze the interface bonding. Liu et al. [16] studied the interface structure of Mg (0001)/TiB2 (0001) by using the first principles and analyzed the heterogeneous nucleation potential of α-Mg on TiB2. The results showed that the interface energy of Mg/TiB2 was greater than that of α-Mg/Mg melt, which was not conducive to heterogeneous nucleation. Deng et al. [17] revealed the grain refinement mechanism of Al-Ti-B in Al-Si alloy by analyzing the Al/TiB2 interface energy, indicating that a new phase Al3Ti was formed at the Ti-rich termination, which could be used as a nucleation center. Bai et al. [18] prepared TiC/316L stainless steel by SLM and calculated the interface properties of TiC/γ-Fe using first principles, indicating that TiC can promote the heterogeneous nucleation of γ-Fe. It has been common to explore the heterogeneous nucleation potential and grain refinement effects of TiB2 in 316L stainless steel composites through experiments [13,19], unfortunately, the atomic interaction at the interface level is currently not entirely clear. Thus, it is highly desirable to investigate the interfacial stability of TiB2/316L composites based on first-principles calculation.
In this paper, SLM was used to fabricated TiB2/316L stainless steel composites. The bulk properties, surface behavior, adhesion work, interface energy, electronic properties of the TiB2 (0001)/γ-Fe (111) were explored by first-principles calculation to reveal interfacial strength and heterogeneous nucleation potential of γ-Fe on TiB2 atoms. The bulk properties test is to make the simulated value closer to the experimental value and ensure the accuracy of calculation. The purpose of surface energy test is to get a stable surface model and lay a foundation for the interface calculation. Interfacial adhesion and bonding nature play an important role in the theoretical research of nucleation potency of a heterogeneous substrate. The larger the adhesion work is, the smaller the interface distance is, the smaller the interface energy is, and the more stable the interface structure is, when the interfacial energy between TiB2 and γ-Fe is lower than that between γ-Fe and Fe melt, which is beneficial to effective heterogeneous nucleation.

2. Experimental and Computational Procedures

The 316L stainless steel powder (particle size of 15–45 μm) prepared by gas atomization was used for this experiment, Figure 1a. TiB2 with the particle size of 5–10 μm was used as reinforcement phase, Figure 1b. TiB2/316L stainless steel composite was fabricated by using Renishaw AM 250 with a 220 W laser power, a 900 mm/s scanning speed, a 100 μm laser beam diameter, and an 80 μm hatch spacing. The whole printing process was carried out under the protection of argon. The transmission electron microscopy (JEM-2100F, Tokyo, Japan) was used to observe the microstructure and orientation relationship.
All calculations used in this paper were performed in the Cambridge Serial Total Energy Package (CASTEP, Material Studio) based on density functional theory [20,21]. The exchange-correlation select generalized gradient approximation (GGA) with the Perdew–Burke–Ernzerhof (PBE) [22]. The interaction between ions and covalent electrons was described by the ultrasoft pseudopotential method. Broyden Fletcher Goldfarb Shanno algorithm (BFGS) was used in geometry optimization to minimize the ground state and energy of the atom [23]. The value of plane-wave cutoff energy was set to 410 eV, k point was set to 10 × 10 × 1. The convergence criteria are as follows: 2 × 10⁻⁵ eV/atom for the energy, 0.1 GPa for maximum stress, 0.05 eV/Å for maximum force, and 0.003 Å for maximum displacements.

3. Results and Discussion

3.1. Experiment

Due to the small amount of TiB2, which is only 0.3%, it is difficult to observe under optical microscope and scanning electron microscope. Only under TEM can nano-sized TiB2 particles be found. Figure 1c shows the TEM of TiB2/316L matrix composites. It can be seen from Figure 1c that most of the TiB2 particles are distributed in the 316L matrix grains. The HRTEM morphology and corresponding FFT patterns of TiB2 and 316L matrix interface are shown in Figure 1d. The interplanar spacing of the TiB2(0001) planes was measured to be 0.326 nm. The main phase component in 316L stainless steel is γ-Fe, other phase components were ignored, and in the low index surface of γ-Fe, the mismatch between γ-Fe (111) and TiB2 (0001) is less than 15%, which belongs to the semi-coherent interface structure, and the interface bonding is good. The mismatches between TiB2 (0001) and other planes of γ-Fe are greater than 15%, which is not conducive to the formation of a stable interface. To explore the interfacial bonding strength and interaction of TiB2 reinforced 316L stainless steel composite, we investigated the interfacial stability of TiB2(0001) and γ-Fe(111) matrix using first principle calculations as follows.

3.2. Calculation and Simulation

3.2.1. Bulk and Surface Properties

  • Bulk Properties
According to the simulation parameters in the second section, the geometric optimizations of γ-Fe (111) and TiB2 (0001) were carried out. The lattice constants, volume, bulk modulus, and formation enthalpy of γ-Fe and TiB2 are listed in Table 1. The optimized lattice constants of γ-Fe and TiB2 obtained in this calculation are basically consistent with the experimental and other calculated values, which ensure that the parameter setting is reliable and accurate.
  • Surface Energy
The convergence test method was used to obtain the optimal atomic layers before calculating the surface energy. For γ-Fe (111) surface model, the surface energy can be expressed as follows [28]:
σ   = E Slab N N Δ E 2 A
where E Slab N , is the total energy of an N-layer slab, ΔE is the incremental energy obtained by ( E Slab N E Slab N 2 ) / 2 , A is the surface area, N is the number of atom layers of the surface model. In order to eliminate the periodic effect between the surface atoms, a vacuum layer of 10 Å was added on each surface when the surface model was constructed. The surface energies of γ-Fe (111) models with different atomic layers are listed in Table 2. The results show that the surface can converge to about 2.56 J/m2 when the number of atomic layers reaches seven, which satisfies the requirement of a stable state. In this case, γ-Fe has also achieved characteristics of bulk phase. The results are well in line with Shi et al. [29].
There is only one kind of atom in the termination of the TiB2 surface, namely Ti-termination or B-termination. The three, five, seven, nine, and eleven atomic layers were selected for the convergence test to eliminate the pseudo dipole effect on the surface of TiB2. The change of interlayer distances of TiB2(0001) surfaces with different termination atoms after relaxation is shown in Table 3.
With the increase of the number of atomic layers, the interlayer distance of atoms decreases, and the atoms show characteristics of relaxation from the seventh layer. Therefore, the surface structure of Ti and B termination can be similar to characteristics of bulk phase when the layer thickness n ≥ 9. Therefore, the number of atomic layers of TiB2 (0001) is selected as nine.
TiB2 is a multi-element phase and exhibits a non-stoichiometric, whose surface energy is closely related to the chemical potential of different termination atoms. The surface energies of TiB2 (0001) are calculated [30]:
E TiB 2 = 1 2 A [ E slab N B μ B N Ti μ Ti + PV TS ]
where E Slab is the total energy after fully relaxed surface, N Ti and N B represent the numbers of Ti and B atoms in the slab, μ Ti and μ B slab are the chemical potentials of Ti and B atoms, respectively, A stands for the surface area. The surface energy of TiB2 was calculated in the ideal state of CASTEP module, so the simulation is carried out at 0 K, the PV and TS terms in the formula can be ignored. The formula is simplified to:
E TiB 2 = 1 2 A [ E slab N B μ B N Ti μ Ti ]
μ Ti bulk + 2 μ B bulk + Δ H f 0 ( TiB 2 ) = μ Ti + 2 μ B = μ TiB 2 bulk
According to the above formula, Equation (2) can be expressed as
E TiB 2 = 1 2 A [ E slab 1 2 N B μ TiB 2 bulk +   ( 1 2 N B N Ti ) μ Ti ]
The chemical potential of Ti or B element in the bulk should be larger than that of the corresponding surface slab:
μ Ti μ Ti bulk , μ B μ B bulk
Combining Equations (4) and (6), the formation enthalpy ( Δ H f 0 ( TiB 2 ) ) can be defined:
Δ H f 0 ( TiB 2 ) μ Ti μ Ti bulk 0
Δ μ Ti = μ Ti μ Ti bulk
The surface energies of TiB2 (0001) with B and Ti termination are shown in Figure 2. The calculated value Δ H f 0 ( TiB 2 ) is −3.22 eV. The calculated values of the surface energy of B and Ti terminated of TiB2(0001) surface are in the ranges of 2.69 to 5.89 J/m2 and 5.23 to 2 J/m2, respectively, which are consistent with the results reported in Ref [17]. With the increase of the Δ μ Ti , the surface energy of B-termination decreases linearly, while that of Ti-termination is the opposite. A more stable interface structure has smaller surface energy. When Δ μ Ti is less than −1.85eV, the surface energy of B-termination is smaller than that of Ti, thus, the structure of B-termination is more stable. On the contrary, the surface energy of Ti-termination is smaller in the range of −1.85 to 0 eV, which indicates that the Ti-termination model is more stable.

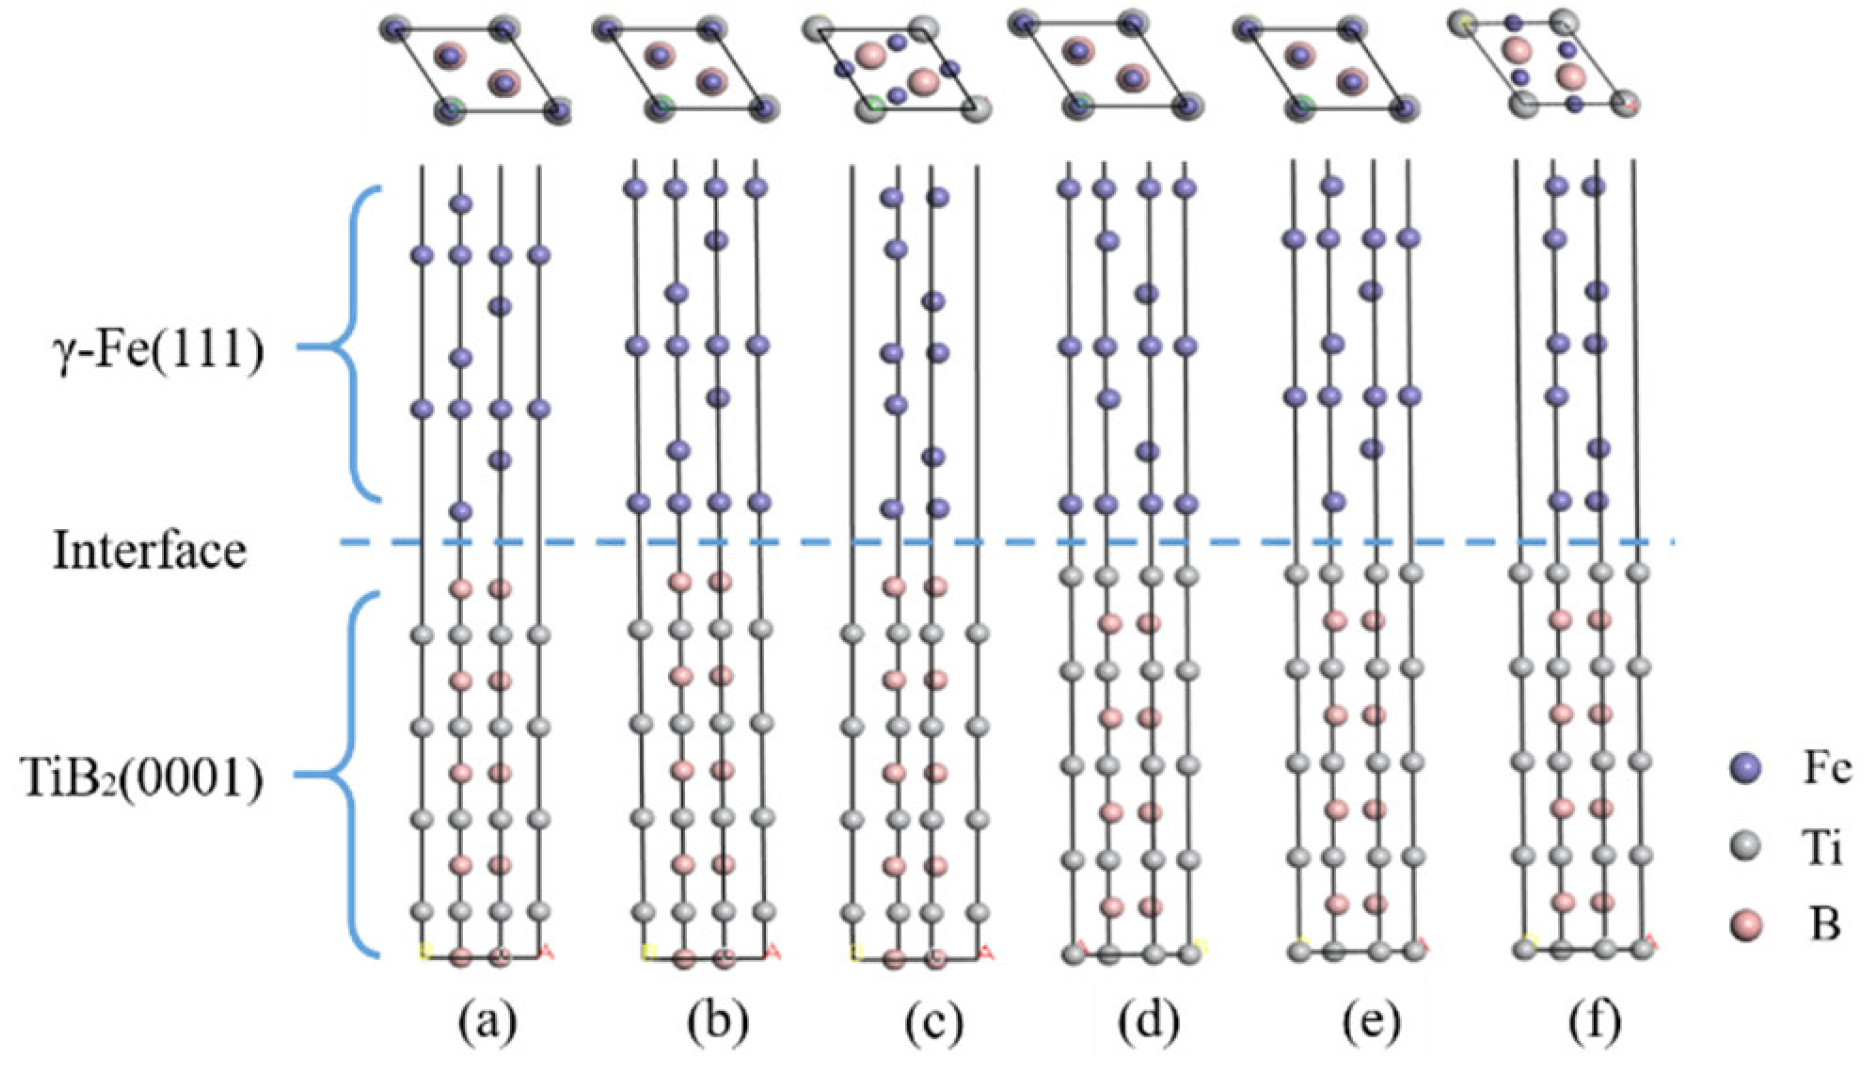
3.2.2. Properties of the TiB2/γ-Fe Interface

  • TiB2 (0001) and γ-Fe (111) Interface
Based on the above calculation results, the interface structure of TiB2(0001)/γ-Fe(111) was formed by stacking 7-layers γ-Fe (111) and 9-layers TiB2(0001). In order to prevent the interaction between the upper and lower sides of the interface slab, a vacuum layer of 10 Å was constructed at the γ-Fe interface. The mismatch degree of the model is less than 15%, which meets the requirement of forming a semi-coherent interface. Six different interface models were established (B-top 1, B-top 2, B-center, Ti-top 1, Ti-top 2, Ti-center) in TiB2 (0001) and γ-Fe (111) as shown in Figure 3.
  • Adhesion Work
The adhesion work (Wad) is a key parameter to characterize the interfacial bonding strength, which is a reversible work to separate the interface into two free surfaces [31]. The adhesion work (Wad) is determined as [32]:
W a d = 1 A ( E t o t a l F e + E t o t a l T i B 2 E t o t a l F e / T i B 2 )
where E total Fe / TiB 2 is the total energy of fully relaxed interface, E total Fe and E total TiB 2 denote the total energies of fully relaxed surface slabs, respectively. A represents the interface area.
Interfacial distance (d0) and adhesion work (Wad) after full relaxation are shown in Table 4. Besides that, the different termination and stacking sequences have a significant impact on the Wad and d0. It can be seen that the B-terminated interfacial distance (d0) is significantly smaller than that of the Ti-terminated interface, but the B-terminated interfacial adhesion work (Wad) is larger. The larger the interfacial adhesion work and the smaller the interface distance, the stronger the interface stability is. The B-terminated “top 2” stacking structure exhibits the largest interfacial adhesion (4.16 J/m2) and the lower interfacial distance (1.24 Å), indicating that is the most stable and optimal. The B-terminated surface is more reactive and ready to form bonds.
  • Interfacial Stability
The thermodynamic stability of the TiB2/γ-Fe interface can be further analyzed by calculating the interface energy. The interface energy (γint) can be calculated as follows [33]:
γ int = 1 A [ E t o t a l 1 2 N B μ T i B 2 b u l k + ( 1 2 N B N T i ) μ T i N F e μ F e b u l k ] σ T i B 2 σ F e
where E total is the total energy of TiB2/γ-Fe system; μ TiB 2 bulk and μ Fe bulk stand for the chemical potential of the bulk TiB2 and Fe atoms, respectively. N B and N Fe are the number of B and Fe atoms in the interface, respectively. σ TiB 2 and σ Fe are the surface energies of the TiB2 and Fe surface structures, respectively. A is the interface area.
Figure 4 shows the relationship between different chemical potentials of titanium and interface energy changes for six interface models. The interface energy of the B-terminated model increases with the increase of the chemical potential, while Ti-terminated model shows the opposite trend. Under the same termination, the interfacial energies of “top 2” model are the smallest. Obviously, the interface energies of B-top 2 and Ti-top 2 are −0.81~2.7 J/m2 and 4.06~0.46 J/m2, respectively, which are more favorable interface structures. In the subsequent analysis, we will focus on them.
  • Electronic Structure and Bonding
The interfacial bonding strength and stability are closely related to the electronic structure and bonding of TiB2(0001)/γ-Fe(111) interface atoms. Electronic structure mapping is to determine the polarity of bonding according to the specific spatial distribution of different charge accumulation and depletion. The models used in this simulation are all ideal models which reach stable state after atomic relaxation, and the defects in crystal are not considered. The charge density difference and density of states of TiB2(0001)/γ-Fe(111) were analyzed in depth.
Figure 5 shows the charge density difference of six models. The blue and red regions represent the charge depletion and the charge accumulation regions, respectively. The B-terminated interface model has obvious charge localization characteristics, strong charge accumulation around B atoms, a small amount of charge accumulation and partial charge loss near Fe atoms, and almost all charge loss around Ti atoms. The strong electronegativities of the B atoms lead to electronic transfers from the Fe atoms to the interface, and most of them cross the interface and deposit near the B atoms, resulting in a strong Fe-B covalent bond. Some of the depleted Ti atoms combine with B atoms to form Ti-B covalent bonds, and some Ti atoms transfer to the interface and near the Fe atoms to form Fe-Ti metal bonds. The charge transfer in the “B-top 1” and “B-top 2” interface models are very obvious. Due to the stronger charge interaction between Fe-B atoms in the “B-top 2” structure, the interface space is smaller. The interaction between Fe and Ti atoms at the Ti-terminated produces metal bond, while the B atom is far away from the Fe atoms, only a weak covalent bond is produced, so the interfacial interaction is weaker. It is proved that the interface structure of “B-top 2” is more stable.
Figure 6 shows the partial density of states (PDOS) of the interface structure of “B-top 2” and “Ti-top 2”. The interaction between atoms at the interface leads to the obvious difference between the PDOS curves of the interface atoms and those of the inner atoms. It also confirms that the charge distribution is localized. In the “B-top 2” interface model, the 3d orbital of the interface Fe atoms and the 3p orbital of the interface B atoms have obvious multiple resonance peaks between −7.5−2.5eV, the orbital hybridization occurred between two atomic orbitals at −13eV, which shows a strong Fe-B covalent bond. Compared with the internal Fe atoms, the interfacial Fe atoms have a wider energy density range at the Fermi level, and the Fermi level of the Fe atom is high, indicating that Fe-Fe metal bonds form. The interfacial B atoms have a higher density value at the Fermi level and show a higher filling state, indicating that there are obvious charge transfers between Fe atoms and B atoms. Figure 6b shows the density of states of the “Ti-top 2” structure. A pseudo-energy gap appears at the Fermi level of Ti atoms at the interface and the density value are even higher, showing that charge transfer and redistribution occurred between Fe and Ti atoms, resulting in strong Fe-Ti metal bonds. The density distribution of internal B atoms is similar, and there is only tiny orbital hybridization with the interface Fe atoms, forming the weaker Fe-B covalent bond. Due to the stronger effect of the Fe-B covalent bond, the “B-top 2” interface model is more stable.

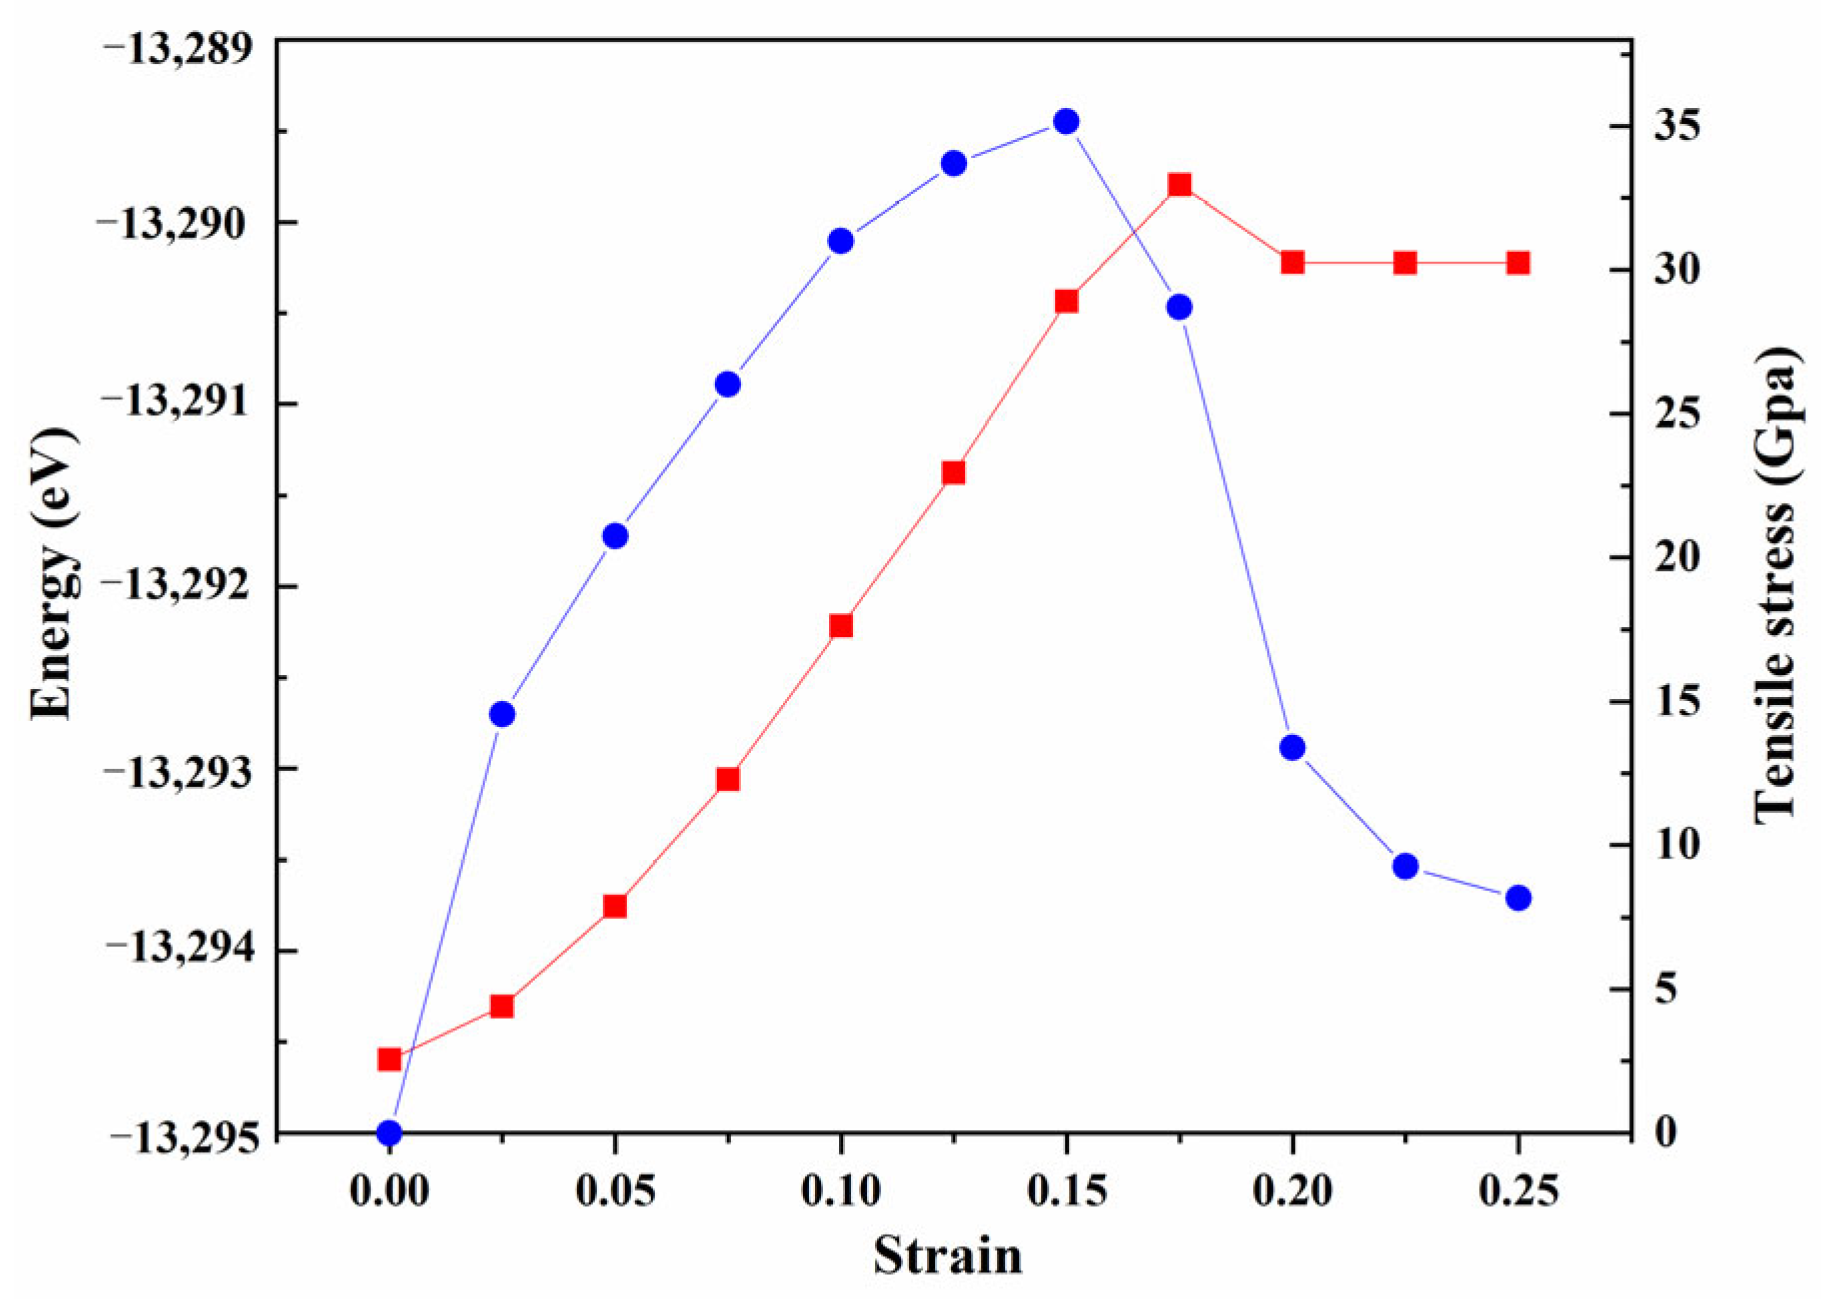
3.2.3. Tensile Strength and Property

  • Tensile Simulation
The uniaxial tensile test of the relaxed supercell was carried out by using the first principle to predict the tensile properties of the interface model theoretically. The specific method is to gradually increase the lattice length along the z-axis with 2.5% as the strain step length, and each new structural optimization is based on the previous optimization. As the strain increases, the atomic position of the whole system changes continuously until the fracture occurs. The normal strain is presented as follow:
σ t e n s i l e = ( l l 0 ) / l 0
where l0 and l denote the original cell length and the stretched cell length, respectively. The red curve in Figure 7 shows the relationship between strain and deformation energy of the “B-top 2” interface structure. When the strain is less than 17.5%, the deformation energy increases linearly; Under the strain of 17.5%, the deformation energy reaches the highest point, and then decreases rapidly and is close to constant, indicating that the energy of the material tends to be basically stable and may fracture. The blue curve in Figure 7 shows the stress-strain curve of the “B-top 2” interface structure. The tensile process of “B-top 2” structure has gone through three stages. The first stage is the elastic deformation stage when the strain is less than 2.5%. Secondly, when the strain was between 2.5% and 15%, it was a typical plastic deformation stage. Finally, the material fractured when the strain exceeded 15%, but the stress did not drop sharply to zero, indicating that the “B-top 2” interface structure was the ductile fracture. The material completely breaks with the strain of 25%. Under the strain of 17.5%, the energy reaches the maximum, and the material has already broken. This is because the energy of the material does not change suddenly in the ductile fracture process. Even if the fracture occurs, some energies have not been completely released and remain in the material. When the strain increases further, the material is not enough to maintain the fracture energy generated in the fracture, the stress decreases sharply, and the energy also changes suddenly.
  • Electronic property
According to the deformation energy and stress-strain diagram in Figure 7, the interface models with the strain of 0%, 2.5%, 15%, 17.5%, and 25% are selected to analyze the charge density distributions and charge density difference, as shown in Figure 8. Figure 8a,f are the charge distribution diagram at the strain of 0%. The Fe atom at the interface is closely combined with the B atom, which has localization characteristics, charge exchange and transfer occur, and the atomic arrangement is regular. The interface structure is stable and has no obvious change at the strain of 2.5%. When the strain is 15%, the distance between Fe atoms in the second layer and Fe atoms at the interface increases, the charge density begins to decrease, and the charge exchange with the interface density weakens. The obvious fracture occurs in the Fe atoms at strain 17.5%, and the Fe atoms are arranged disorderly, but the bonding at the interface is still tight. When the strain increases to 25%, the internal fracture occurs in the Fe condition and the charge density in the local region of the internal Fe atom increases. In the Fe atom, it is mainly composed of Fe-Fe metal bonds. In the TiB2 atom, there are Ti-Ti metal bond, Ti-B covalent bond and B-B covalent bond. Among them, Ti-Ti metal bond shows a charge density distribution similar to that of Fe-Fe metal bond. In addition, the charge density values of Ti-B and B-B covalent bonds are high, which is conducive to strengthening the internal stability of TiB2. There is a strong charge exchange between Fe and B atoms at the interface, indicating that the interfacial combination between Fe atom and B atom is stable. Because of the strong covalent bond of the Fe-B bond, the interface is not easy to fracture, and the Ti-B covalent bond in ceramic particles is also strong, however, the Fe-Fe bond is weak and the fracture is easy to occur in the Fe matrix. It is consistent with the previous conclusion. To sum up, TiB2 is beneficial to enhance the interfacial bonding strength of the Fe matrix.
In addition, the formation of Fe-B covalent bond is conducive to improving the bonding strength at the interface.

4. Analysis on TiB2 as Heterogeneous Nucleation of γ-Fe

The heterogeneous nucleation potential of ceramic particles on metal matrix is greatly affected by the interfacial energy between ceramic phase and metal [19,34]. When the interfacial energy between TiB2 and γ-Fe is lower than that between γ-Fe and Fe melt (0.24 J/m2), effective heterogeneous nucleation occurs [35]. The interfacial energy of the “B-top 2” model at the Ti-rich condition is −0.81 J/m2, which is significantly lower than that of the solid-liquid interface. The interfacial bonding strength is stronger and the stability is higher. Therefore, the “B-top 2” interface model is most conducive to the heterogeneous nucleation of TiB2 on γ-Fe. It is theoretically shown that TiB2 can be used as the heterogeneous nucleation substrate of γ-Fe.

5. Conclusions

TiB2/316L stainless steel composites were prepared by SLM. The adhesion work, interface energy, and electronic structure of the TiB2/γ-Fe interfaces were used to investigate the heterogeneous nucleation potential of γ-Fe grains on TiB2 particles using the first principle. The main conclusions are summarized as follows:
(1) Under the same terminated (B or Ti-terminated), the “top 2” interface model has higher adhesion work, smaller interface distance and interface energy. Under the same stacking sequence, the B-terminated interface model has higher adhesion work and lower interface energy than the Ti-terminated one. Therefore, the “B-top 2” interface model has a larger adhesion work and smaller interface energy, which is the most stable structure of the six interface models.
(2) By analyzing the fracture properties of the “B-top 2” interface structure, the bonding strength of the “B-top 2” interface is higher than that of the Fe matrix. Moreover, it is difficult to fracture at the interface and belongs to ductile fracture, so the interface bonding is more stable.
(3) The “B-top 2” interface is mainly composed of the strong Fe-B covalent bond, and the “Ti-top 2” interface mainly consists of Fe-Ti metal bonds. The strength of the covalent bond is obviously higher than that of the metal bond. Therefore, the interface of the “B-top 2” model is more stable.
(4) The interface energy of the “B-top 2” model at the Ti-rich condition is lower than that of γ-Fe/Fe melt, indicating that TiB2 particles can promote heterogeneous nucleation of 316L stainless steel.

Author Contributions

Methodology, formal analysis, writing—original draft, Q.W.; writing—review and editing, P.B.; writing—original draft, writing—review and editing, Z.Z. All authors have read and agreed to the published version of the manuscript.

Funding

This research was funded by the National Natural Science Foundation of China (Grant No.51775521 and U1810112), the China Postdoctoral Science Foundation (2019M661068), the Key Research and Development Project of Shanxi Province (201903D121009), the Natural Science Foundation of Shanxi Province: 201801D221154, the Major Science and Technology Projects of Shanxi Province, China (No. 20181101009, 20181102012), Shanxi Foundation Research Projects for Application (201801D221234), Research Project Supported by Shanxi Scholarship Council of China (2019072).

Data Availability Statement

All data reported in this paper is contained within the manuscript.

Acknowledgments

The authors would like to thank the National Natural Science Foundation of China (Grant No.51775521 and U1810112), the China Postdoctoral Science Foundation (2019M661068), the Key Research and Development Project of Shanxi Province (201903D121009), the Natural Science Foundation of Shanxi Province: 201801D221154, the Major Science and Technology Projects of Shanxi Province, China (No. 20181101009, 20181102012), Shanxi Foundation Research Projects for Application (201801D221234), Research Project Supported by Shanxi Scholarship Council of China (2019072).

Conflicts of Interest

The authors declare no conflict of interest.

References

  1. Almangour, B.; Grzesiak, D.; Borkar, T.; Yang, J. Densification behavior, microstructural evolution, and mechanical properties of TiC/316L stainless steel nanocomposites fabricated by selective laser melting. Mater Des. 2018, 138, 119–128. [Google Scholar] [CrossRef]
  2. Almangour, B.; Grzesiak, D.; Yang, J. Rapid fabrication of bulk-form TiB2/316L stainless steel nanocomposites with novel reinforcement architecture and improved performance by selective laser melting. J. Alloys Compd. 2016, 680, 480–493. [Google Scholar] [CrossRef]
  3. Olsson, C.O.A.; Landolt, D. Passive films on stainless steels—Chemistry, structure and growth. Electrochim. Acta 2003, 48, 1093–1104. [Google Scholar] [CrossRef]
  4. Zhang, L.; Zhao, Z.; Bai, P.; Du, W.; Li, Y.; Yang, X.; Wang, Q. In-situ synthesis of TiC/graphene/Ti6Al4V composite coating by laser cladding. Mater. Lett. 2020, 270, 127711. [Google Scholar] [CrossRef]
  5. Abenojar, J.; Velasco, F.; Torralba, J.; Bas, J.; Calero, J.; Marcè, R. Reinforcing 316L stainless steel with intermetallic and carbide particles. Mater. Sci. Eng. A 2002, 335, 1–5. [Google Scholar] [CrossRef]
  6. Patankar, S.; Tan, M. Role of reinforcement in sintering of SiC/316L stainless steel composite. Powder Metall. 2013, 43, 350–352. [Google Scholar] [CrossRef]
  7. Zhao, Z.; Li, J.; Bai, P.; Qu, H.; Liang, M. Microstructure and Mechanical Properties of TiC-Reinforced 316L Stainless Steel Composites Fabricated Using Selective Laser Melting. Metals 2019, 9, 267. [Google Scholar] [CrossRef] [Green Version]
  8. Das, M.; Bhattacharya, K.; Dittrick, S.; Mandal, C.; Balla, V.; Sampath Kumar, T.; Bandyopadhyay, A.; Manna, I. In situ synthesized TiB–TiN reinforced Ti6Al4V alloy composite coatings: Microstructure, tribological and in-vitro biocompatibility. J. Mech. Behav. Biomed. 2014, 29, 259–271. [Google Scholar] [CrossRef]
  9. Niu, L.; Hojamberdiev, M.; Xu, Y. Preparation of in situ-formed WC/Fe composite on gray cast iron substrate by a centrifugal casting process. J. Mater. Process. Tech. 2010, 210, 1986–1990. [Google Scholar] [CrossRef]
  10. Wang, Q.; Zhao, Z.; Bai, P.; Du, W.; Liao, H.; Li, Y.; Liang, M.; Huo, P.; Zhang, L.; Tie, D. Effects of alloying elements X (Cr, Mn, Mo, Ni, Si) on the interface stability of TiC (001)/γ-Fe (001) in TiC/316L stainless steel composite formed by selective laser melting: First principles and experiments. Adv. Compos. Hybrid Mater. 2021. [Google Scholar] [CrossRef]
  11. Zhao, Z.; Zhang, L.; Bai, P.; Du, W.; Wang, S.; Xu, X.; Dong, Q.; Li, Y.; Han, B. Tribological Behavior of In Situ TiC/Graphene/Graphite/Ti6Al4V Matrix Composite Through Laser Cladding. Acta Metall. Sin. Engl. Lett. 2021. [Google Scholar] [CrossRef]
  12. Li, B.; Liu, Y.; Li, J.; Cao, H.; He, L. Effect of sintering process on the microstructures and properties of in situ TiB2–TiC reinforced steel matrix composites produced by spark plasma sintering. J. Mater. Process. Tech. 2010, 210, 91–95. [Google Scholar] [CrossRef]
  13. Antoni-Zdziobek, A.; Gospodinova, M.; Bonnet, F.; Hodaj, F. Solidification paths in the iron-rich part of the Fe–Ti–B ternary system. J. Alloys Compd. 2016, 657, 302–312. [Google Scholar] [CrossRef]
  14. Akhtar, F. Ceramic reinforced high modulus steel composites: Processing, microstructure and properties. Can. Metall. Quart. 2014, 53, 253–263. [Google Scholar] [CrossRef]
  15. Liu, S.; Zhang, Y.; Han, H.; Li, B. Effect of Mg–TiB2 master alloy on the grain refinement of AZ91D magnesium alloy. J. Alloys Compd. 2009, 487, 202–205. [Google Scholar] [CrossRef]
  16. Liu, R.; Yin, X.; Feng, K.; Xu, R. First-principles calculations on Mg/TiB2 interfaces. Comp. Mater. Sci. 2018, 149, 373–378. [Google Scholar] [CrossRef]
  17. Deng, C.; Xu, B.; Wu, P.; Li, Q. Stability of the Al/TiB2 interface and doping effects of Mg/Si. Appl. Surf. Sci. 2017, 425, 639–645. [Google Scholar] [CrossRef]
  18. Bai, P.; Wang, Q.; Zhao, Z.; Du, W.; Liang, M.; Liao, H.; Li, Y.; Zhang, L.; Han, B.; Li, J. Interfacial stability of TiC/γ-Fe in TiC/316L stainless steel composites prepared by selective laser melting: First principles and experiment. Metals 2020, 10, 1225. [Google Scholar] [CrossRef]
  19. Yang, Y.; Wang, H.; Liang, Y.; Zhao, R.; Jiang, Q. Fabrication of steel matrix composites locally reinforced with different ratios of TiC/TiB2 particulates using SHS reactions of Ni-Ti-B_4C and Ni-Ti-B_4C-C systems during casting. Mater. Sci. Eng. A 2007, 445, 398–404. [Google Scholar] [CrossRef]
  20. Vanderbilt, D. Soft self-consistent pseudopotentials in a generalized eigenvalue formalism. Phys. Rev. B 1990, 41, 7892–7895. [Google Scholar] [CrossRef]
  21. Segall, M.; Lindan, P.; Probert, M.; Pickard, C.; Hasnip, P.; Clark, S.; Payne, M. First-principles simulation: Ideas, illustrations and the CASTEP code. J. Phys. Condens. Matter 2002, 14, 2717–2744. [Google Scholar] [CrossRef]
  22. Saib, S.; Bouarissa, N. Electronic properties of GaN at high-pressure from local density and generalized gradient approximations. Comp. Mater. Sci. 2006, 376, 13–617. [Google Scholar] [CrossRef]
  23. Pfrommer, B.; Côté, M.; Louie, S.; Cohen, M. Relaxation of Crystals with the Quasi-Newton Method. J. Comput. Phys. 1997, 131, 233–240. [Google Scholar] [CrossRef] [Green Version]
  24. Chen, L.; Li, Y.; Peng, J.; Sun, L.; Li, B.; Wang, Z.; Zhao, S. A comparable study of Fe//MCs (M = Ti, V) interfaces by first-principles method: The chemical bonding, work of adhesion and electronic structures. J. Phys. Chem. Solids 2020, 138, 109292. [Google Scholar] [CrossRef]
  25. Chung, S.; Ha, H.; Jung, W.; Byun, J. An ab Initio Study of the Energetics for Interfaces between Group V Transition Metal Carbides and bcc Iron. Model. Simul. Mater. Sci. 2006, 46, 1523–1531. [Google Scholar] [CrossRef] [Green Version]
  26. Song, X.; Han, Y.; Wang, X.; Liu, W.; Wu, J.; Cui, H. First-Principles Study of Adhesion Strength and Stability of the TiB2/TiC Interface in Composite Materials. Ceram. Int. 2018, 44, 1756–1763. [Google Scholar] [CrossRef]
  27. Otani, S.; Ishizawa, Y. Preparation of TiB2 single crystals by the floating zone method. J. Cryst. Growth 1994, 140, 451–453. [Google Scholar] [CrossRef]
  28. Yang, J.; Zhang, P.; Zhou, Y.; Guo, J.; Ren, X.; Yang, Y.; Yang, Q. First-principles study on ferrite/TiC heterogeneous nucleation interface. J. Alloys Compd. 2013, 556, 160–166. [Google Scholar] [CrossRef]
  29. Shi, Z.; Liu, S.; Zhou, Y.; Yang, Q. First-principles calculation on the relationships of h-WC/γ-Fe interface. J. Phys. Chem. Solids 2018, 123, 11–18. [Google Scholar] [CrossRef]
  30. Xiong, H.; Zhang, H.; Dong, J. Adhesion strength and stability of TiB2/TiC interface in composite coatings by first principles calculation. Comp. Mater. Sci. 2017, 127, 244–250. [Google Scholar] [CrossRef]
  31. Wang, C.; Wang, C. Ni/Ni3Al interface: A density functional theory study. Appl. Surf. Sci. 2009, 255, 3669–3675. [Google Scholar] [CrossRef]
  32. Choe, W.; Miller, G.; Levin, E. Crystal Structure and Magnetism of Gd2MgGe2. J. Alloys Compd. 2001, 329, 121–130. [Google Scholar] [CrossRef]
  33. Wang, N.; Dong, L.; Gao, C.; Li, D. A study of structure, energy and electronic properties of TiB2/c-BN interface by first principles calculations. Opt. Mater. 2014, 36, 1459–1462. [Google Scholar] [CrossRef]
  34. Xiong, H.; Zhang, H.; Zhang, H.; Zhou, Y. Effects of alloying elements X (X=Zr, V, Cr, Mn, Mo, W, Nb, Y) on ferrite/TiC heterogeneous nucleation interface: First-principles study. J. Iron Steel Res. Int. 2017, 24, 328–334. [Google Scholar] [CrossRef]
  35. Jiang, Q.; Lu, H. Size dependent interface energy and its applications. Surf. Sci. Rep. 2008, 63, 427–464. [Google Scholar] [CrossRef]
Figure 1. (a) The SEM morphology of 316L stainless steel powder; (b) The SEM morphology of TiB2 powder; (c) Bright-field TEM image of distribution of TiB2 particles in the 316L matrix grain; (d) HRTEM and corresponding FFT patterns of the TiB2/316L stainless steel composites.
Materials 14 01573 g001
Figure 2. The relation between TiB2 (0001) surface energy of the difference of titanium chemical potential.
Materials 14 01573 g002
Figure 3. Six interface models of γ-Fe(111)/TiB2(0001): (a) B-top 1 site, (b) B-top 2site, (c) B-center site, (d) Ti-top 1 site, (e) Ti-top 2 site, (f) Ti- center site.
Materials 14 01573 g003
Figure 4. The relationship between TiB2 (0001)/γ-Fe(111) interfacial energy and different chemical potential of titanium.
Materials 14 01573 g004
Figure 5. Charge density difference for the TiB2(0001)/γ-Fe(111) interfaces: (a) B-top 1; (b) B-top 2; (c) B-center; (d) Ti-top 1; (e) Ti-top 2; (f) Ti-center.
Materials 14 01573 g005
Figure 6. Partial density of states (PDOS): (a) B-top 2; (b) Ti-top 2.
Materials 14 01573 g006
Figure 7. Profiles of tensile stress versus engineering strain (blue line) and deformation energy. (red line) of “B-top 2” interfacial model of TiB2(0001)/γ-Fe(111).
Materials 14 01573 g007
Figure 8. The charge density distributions (ae) and charge density difference (fj) of “B-top 2” interfacial model for TiB2(0001)/γ-Fe(111) at the strain (a,f) 0%; (b,g) 2.5%; (c,h) 15%; (d,i) 17.5%; (e,j) 25%.
Materials 14 01573 g008
Table 1. Calculated lattice constants (a), volume (V0), bulk modulus (B), and formation enthalpy (ΔH) of bulk γ-Fe and TiB2.
PhaseMethodA (Å)c (Å)V0 (Å3)B (GPa)ΔrH (eV/atom)
γ-FeGGAthis work3.4453.44540.85306-
GGA [24]3.4483.44841.01314.7-
Exp [25]3.4503.45041.06--
TiB2GGAthis work3.0293.22825.655231.53−1.10
GGA [26]3.0333.23125.73260.5−1.04
Exp [27]3.033.22925.67--
Table 2. The convergence of the surface energy concerning slab thickness of γ-Fe(111).
Layer (N)Surface Energy (J/m2)
γ-Fe(111)
52.69
72.56
92.55
112.55
Table 3. The change of interlayer distances (%) of TiB2(0001) surfaces with different termination atoms after relaxation.
SurfaceTerminationInterlayerThickness (N)
357911
TiB2TiΔ1–2−5.48−6.04−5.56−5.27−6.49
Δ2–3-−1.62−3.33−1.46−2.27
Δ3–4--−0.89−2.84−2.27
Δ4–5---−1.05−4.54
Δ5–6 ---−0.34
BΔ1–2−3.45−6.45−4.34−4.26−4.99
Δ2–3-−2.60−1.18−1.50−1.30
Δ3–4--−0.39−1.99−1.91
Δ4–5---−0.38−1.70
Δ5–6----−0.84
Table 4. Interfacial distance and adhesion work of TiB2(0001)/γ-Fe(111) after full relaxation.
TerminationStacking SequencesAfter Relaxation
d0 (Å)Wad (J/m2)
B-terminatedtop 11.992.6
top 21.244.16
center22.62
Ti-terminatedtop 12.141.58
top 22.113.2
center2.131.76
Publisher’s Note: MDPI stays neutral with regard to jurisdictional claims in published maps and institutional affiliations.

