3.1. Basic Properties of Pure Ga, Fe and Mixed Metals from Ab Initio Calculations
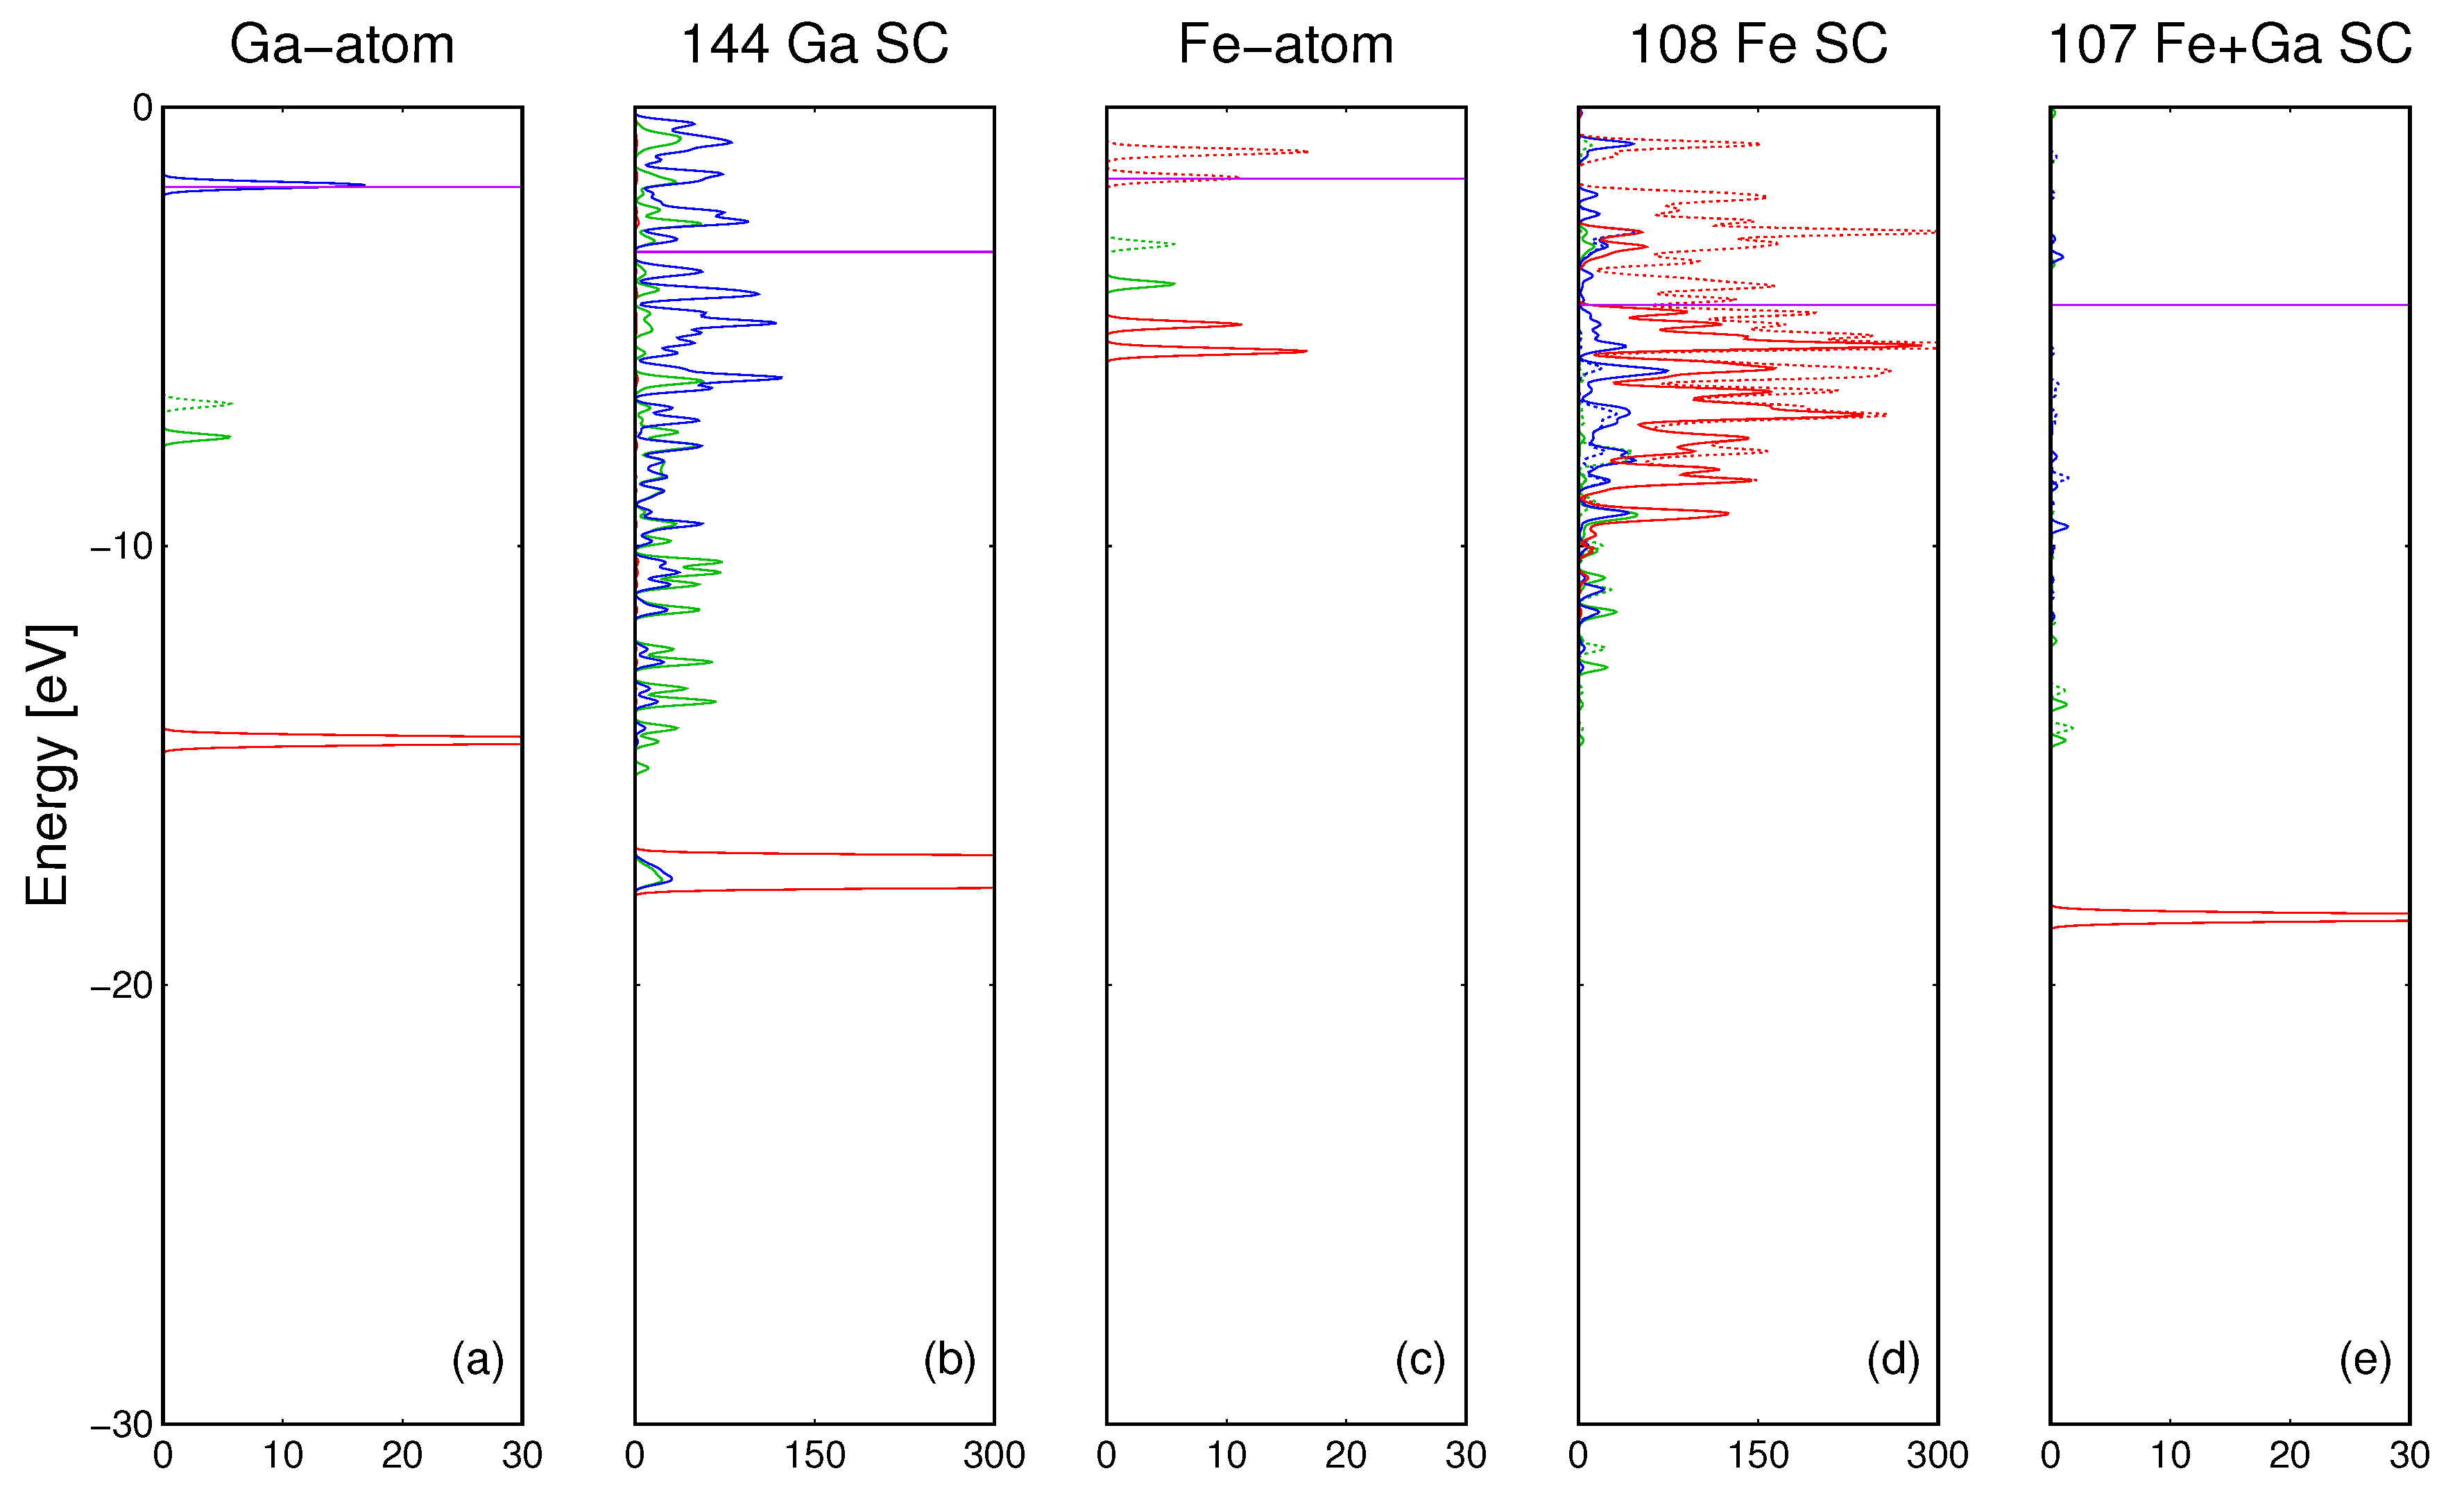
The properties of electronic bonding in the pure Ga metal may be compared by plots of DOS of single Ga atom and the Ga supercell consisting of 144 atoms (
Figure 2a). The results of the corresponding
ab initio calculations are presented in
Figure 4a,b. As it is shown, the bonding in gallium arises from the extensive overlap of the
Ga4s and
Ga4p orbitals. The
d states of Ga atoms do not participate in the metallic bonding in Ga.
For iron, the electronic bonding may be analyzed by plots of DOS of a single Fe atom and the Fe supercell consisting of 108 atoms. The results are compared in
Figure 4c,d. As it is shown, bonding between the iron atoms arises mainly from the extensive overlap of the
Fe3d orbitals. This is drastically different from Ga where
3d orbitals do not participate in the bonding. In summary, the properties of metallic Fe show important differences with respect to the Ga bonding.
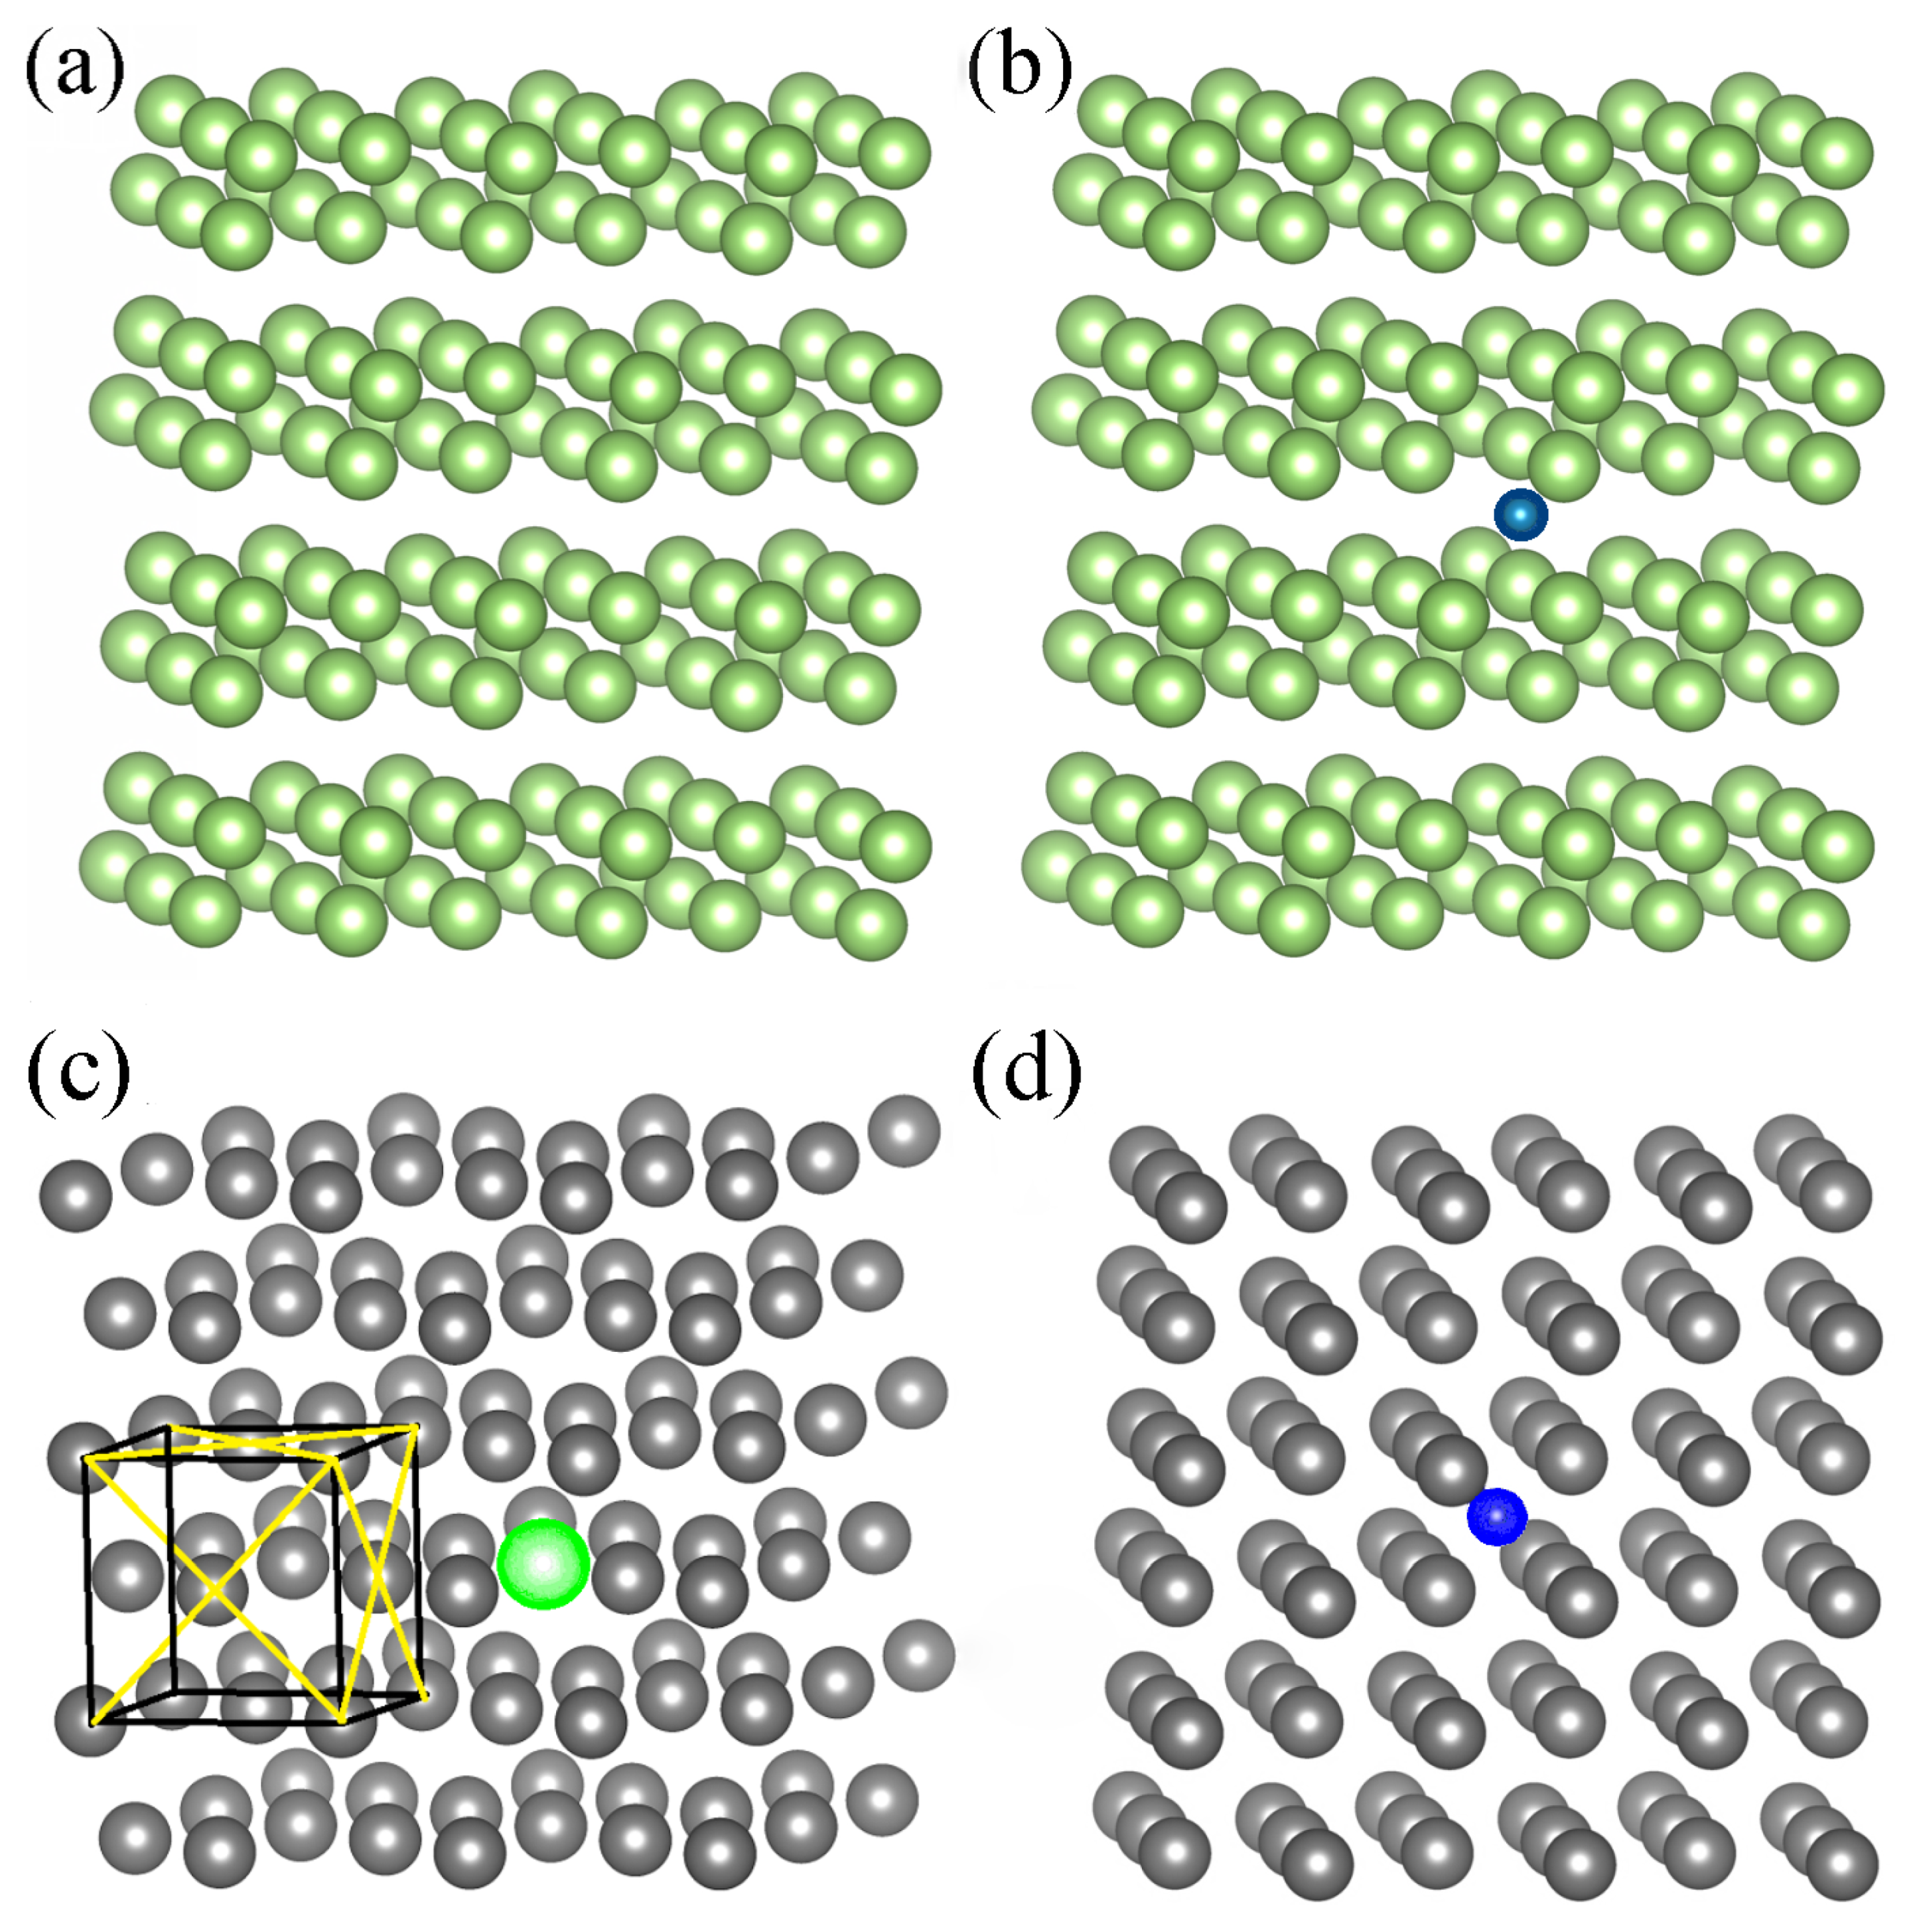
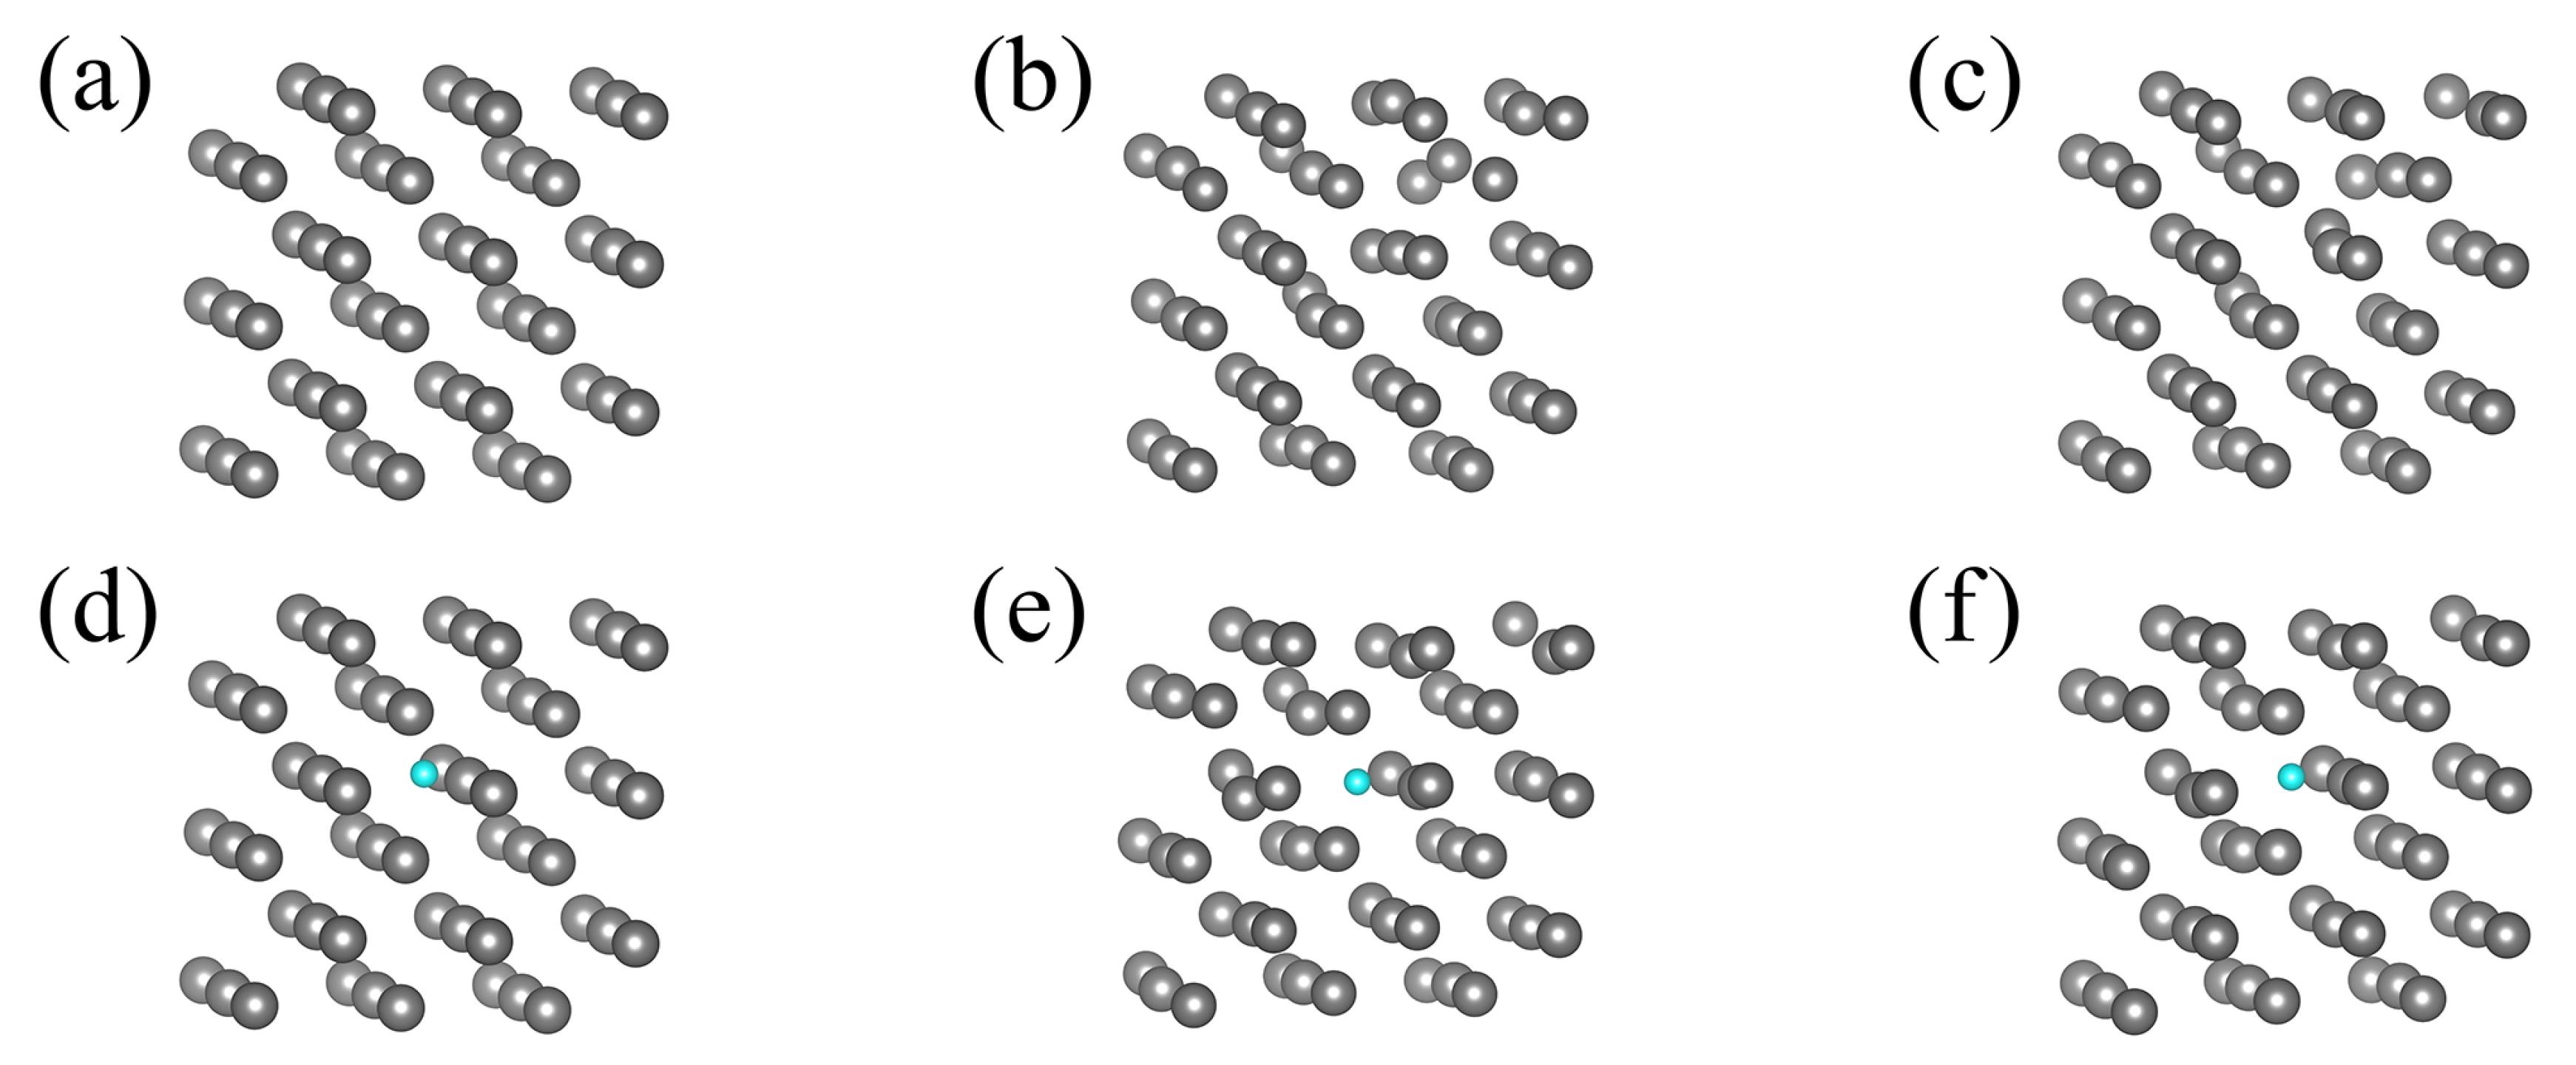
Finally, a single Ga atom immersed in the Fe matrix was modeled using total 108 atom cluster, composed of 107 Fe atoms and of a single Ga atom. The cluster with Ga atom incorporated is presented in
Figure 2c whereas the cluster of pure Fe is inferred from
Figure 2c by replacement of Ga by Fe atom (substitution of green by gray ball).
The results of the calculations are shown in
Figure 4e. As it is shown, the
3d states of Ga atoms do not participate in the bonding with Fe matrix. Also
Fe3d states are not involved. The bonding is due to interaction of Fe and Ga
4s and
4p states. The difference is due to different behavior of
Ga3d states which remain unaffected by surrounding Ga and Fe neighbors. This is demonstrated by the PDOS of Ga/107 Fe SC presented in
Figure 4e where
Ga3d preserved its molecular character (sharp line), not affected by the overlap with the neighboring Fe atoms.
The energetic effect of dissolution of single Ga atom in Fe was calculated taking into account that an Fe atom is replaced by a Ga atom, according to the formula:
where
(107 Fe-1 Ga) denotes total DFT energy of the cluster of atoms (numbers and symbols denote the cluster size and the type of constituting atoms). From the performed DFT calculations, the energy of Ga dissolution in the Fe matrix was determined as
(Fe-Ga) = 3.698 eV/atom. The value is relatively large indicating strong interaction between Ga and Fe atoms. The experimental data on liquid Fe:Ga solutions confirm qualitatively, these results by a drastic decrease of Fe melting temperature induced by small concentrations of gallium in iron [
15].
3.2. Interaction of N Atom Immersed in the Metal (Ga, Fe) Periodic Clusters
Similar analysis could be made for dissolution of nitrogen in both Fe and Ga solvents. As shown recently by Ponomareva et al., the calculated N dissolution energies in a solid Fe cluster depend on the cluster configuration [
34]. The pure Fe cluster could be inferred from
Figure 2c by replacement of Ga by Fe atom while Fe cluster with a single immersed N atom is presented in
Figure 2d. These clusters are used in our
ab initio calculations.
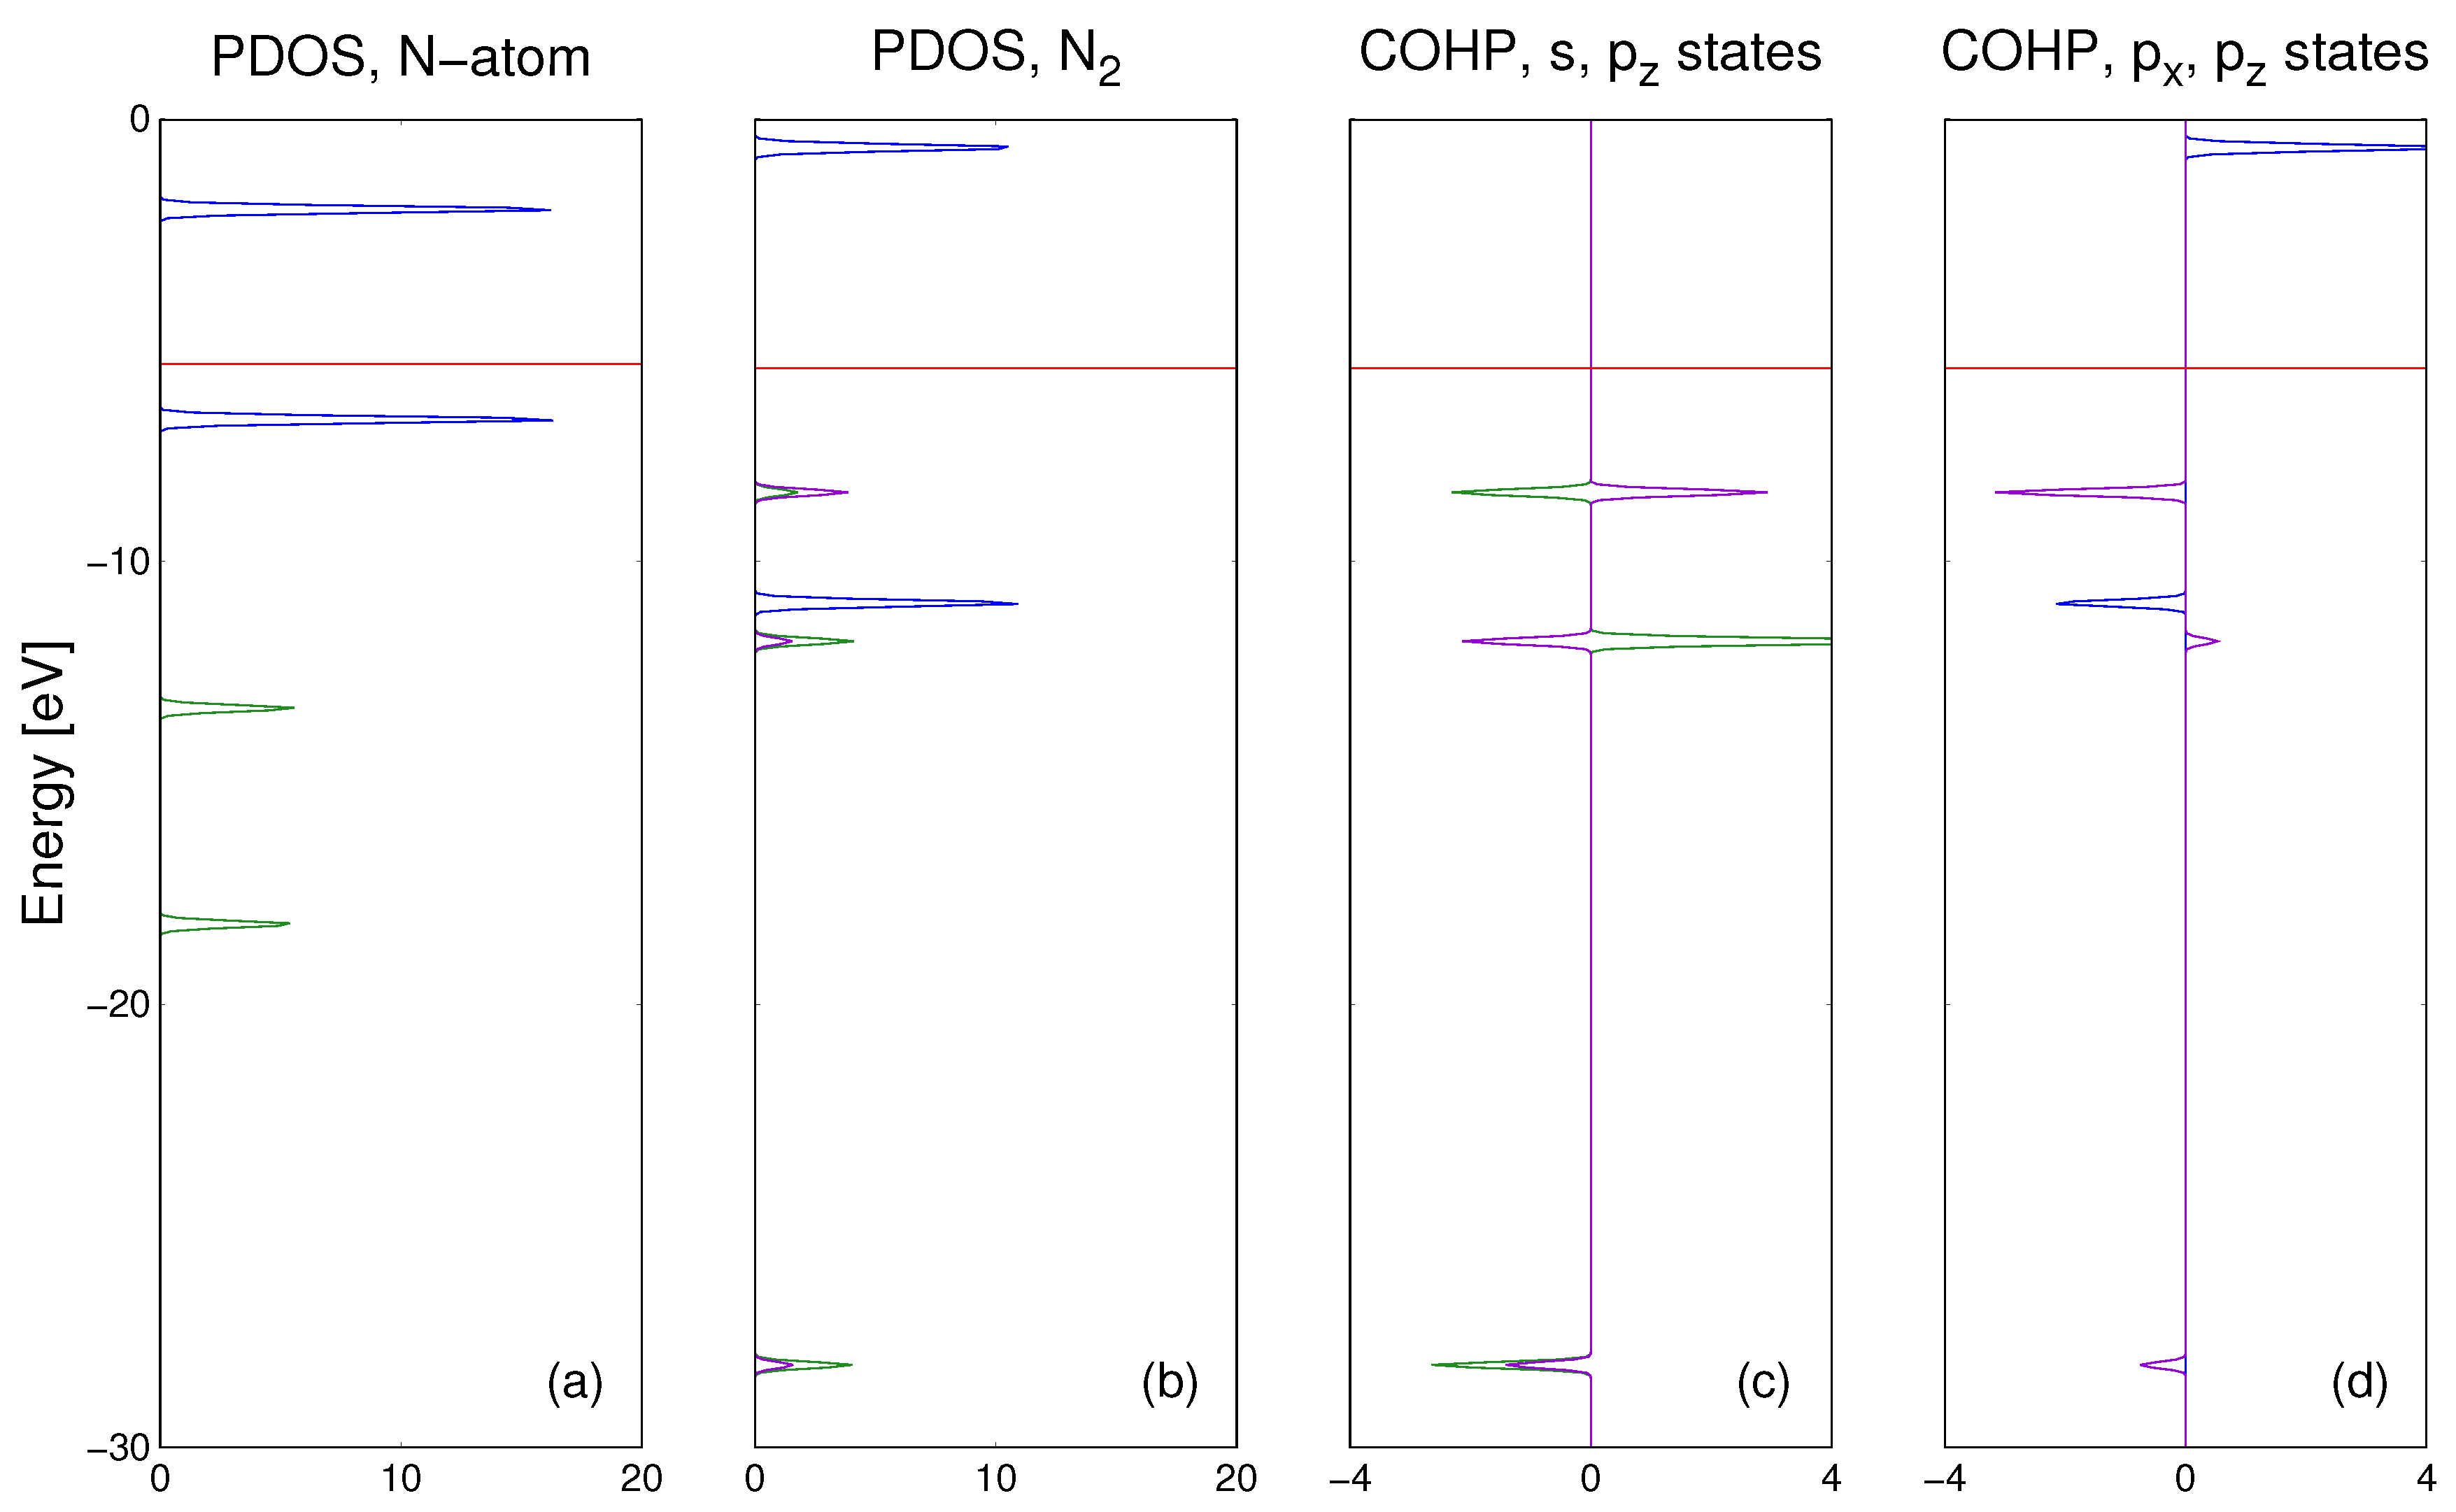
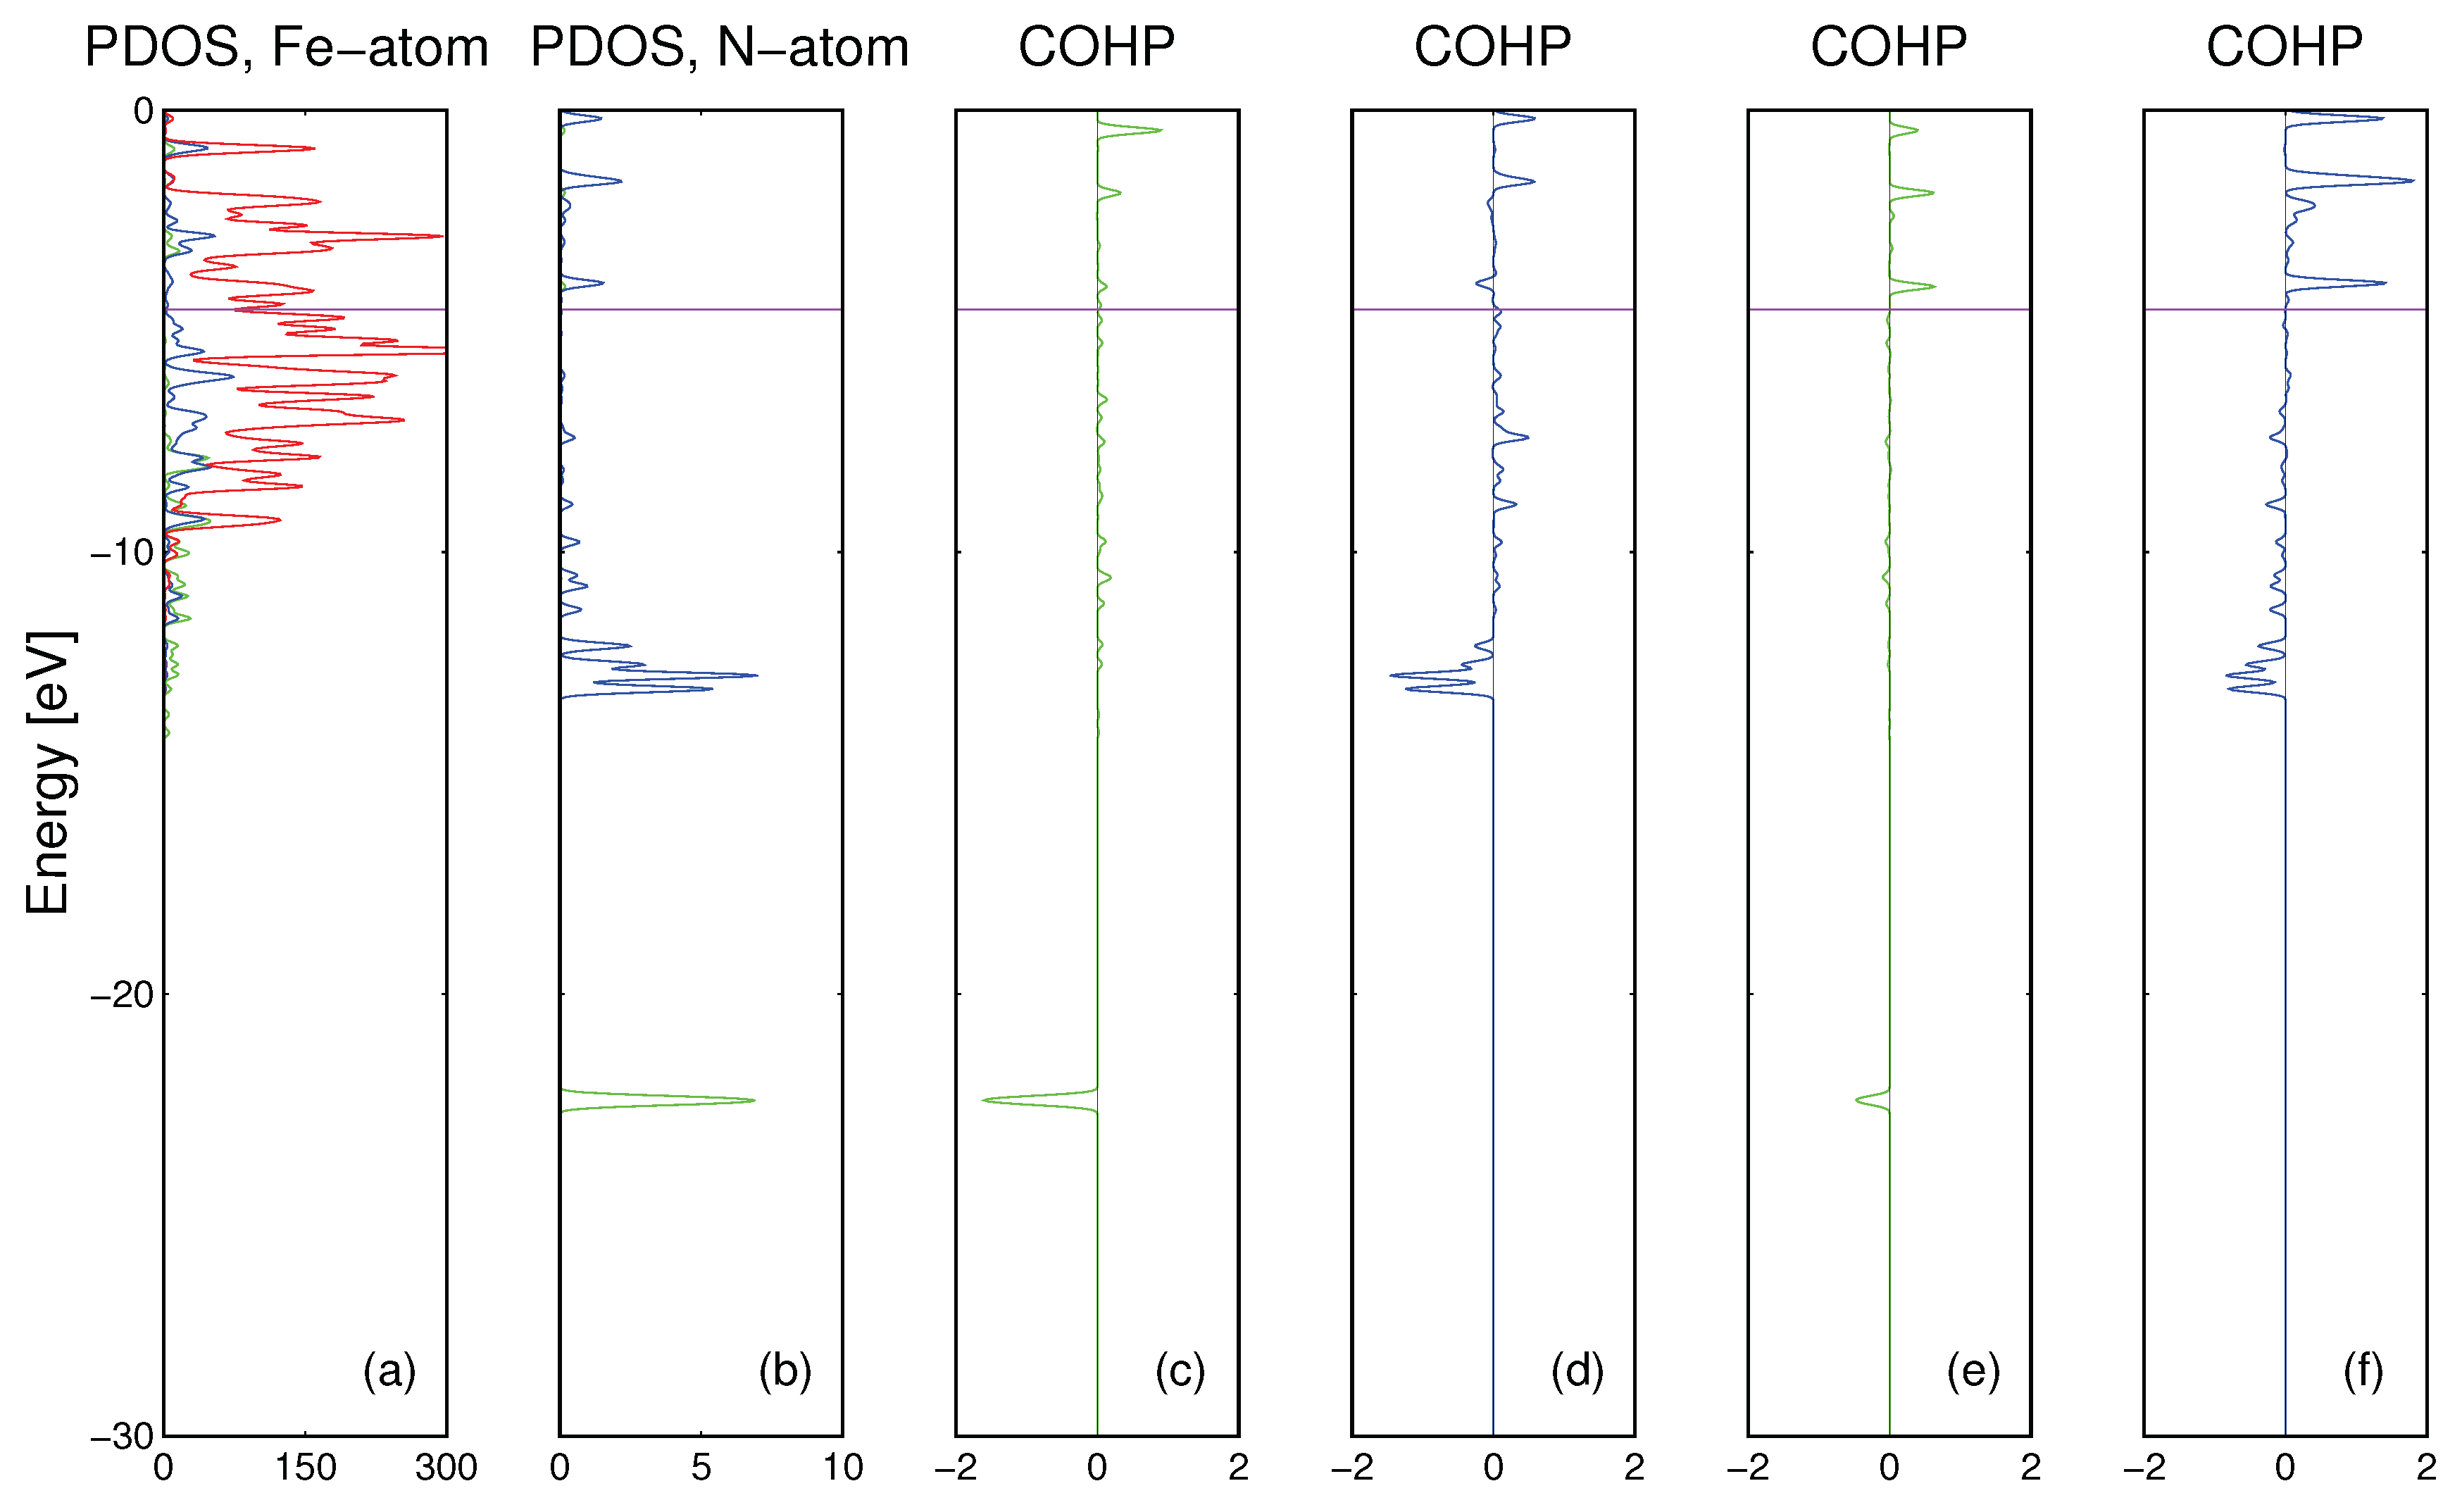
The
ab initio calculation results for nitrogen atom immersed in the Fe matrix are presented in
Figure 5. As it is shown the Fe atoms in the matrix are bonded by
Fe3d orbitals while the N atom could be bonded by its own
N2s and
N2p orbitals. The bonding has complex character, the
N2s overlap with
Fe4s and
Fe4p states is bonding while
N2s states are bonded to
Fe3d states very weakly. Thus, the bonding of
N2s states is essentially absent. In contrast to that, the bonding of
N2p states is strong, to both
Fe4s and
Fe4p and to
Fe3d orbitals. In summary, the interstitial nitrogen atom bonding to the Fe matrix is essentially only via
N2p states.
Please note that the approach is different from the one applied to the Ga-Fe cluster. The number of Fe atoms is preserved, and a single N atom is added into an interstitial position. Therefore, the energy of dissolution of single nitrogen atom in the Fe matrix is calculated using equation different than Equation (
1):
Using the calculated DFT values for the right-hand side of the equation, the energy of atomic N dissolution in the Fe matrix is:
eV/atom. Noting that the energy of molecular nitrogen is lower by the molecule dissociation contribution
eV, the energy of dissolution of single N
molecule could be obtained as:
Hence the resulting energy of dissolution of molecular nitrogen in Fe is eV/mol. The negative value, indicates a reduction in energy at dissolution of molecular nitrogen, thus promoting high solubility of nitrogen in Fe.
The cluster used for
ab initio calculations describing N interaction with the Ga matrix is presented in
Figure 2b.
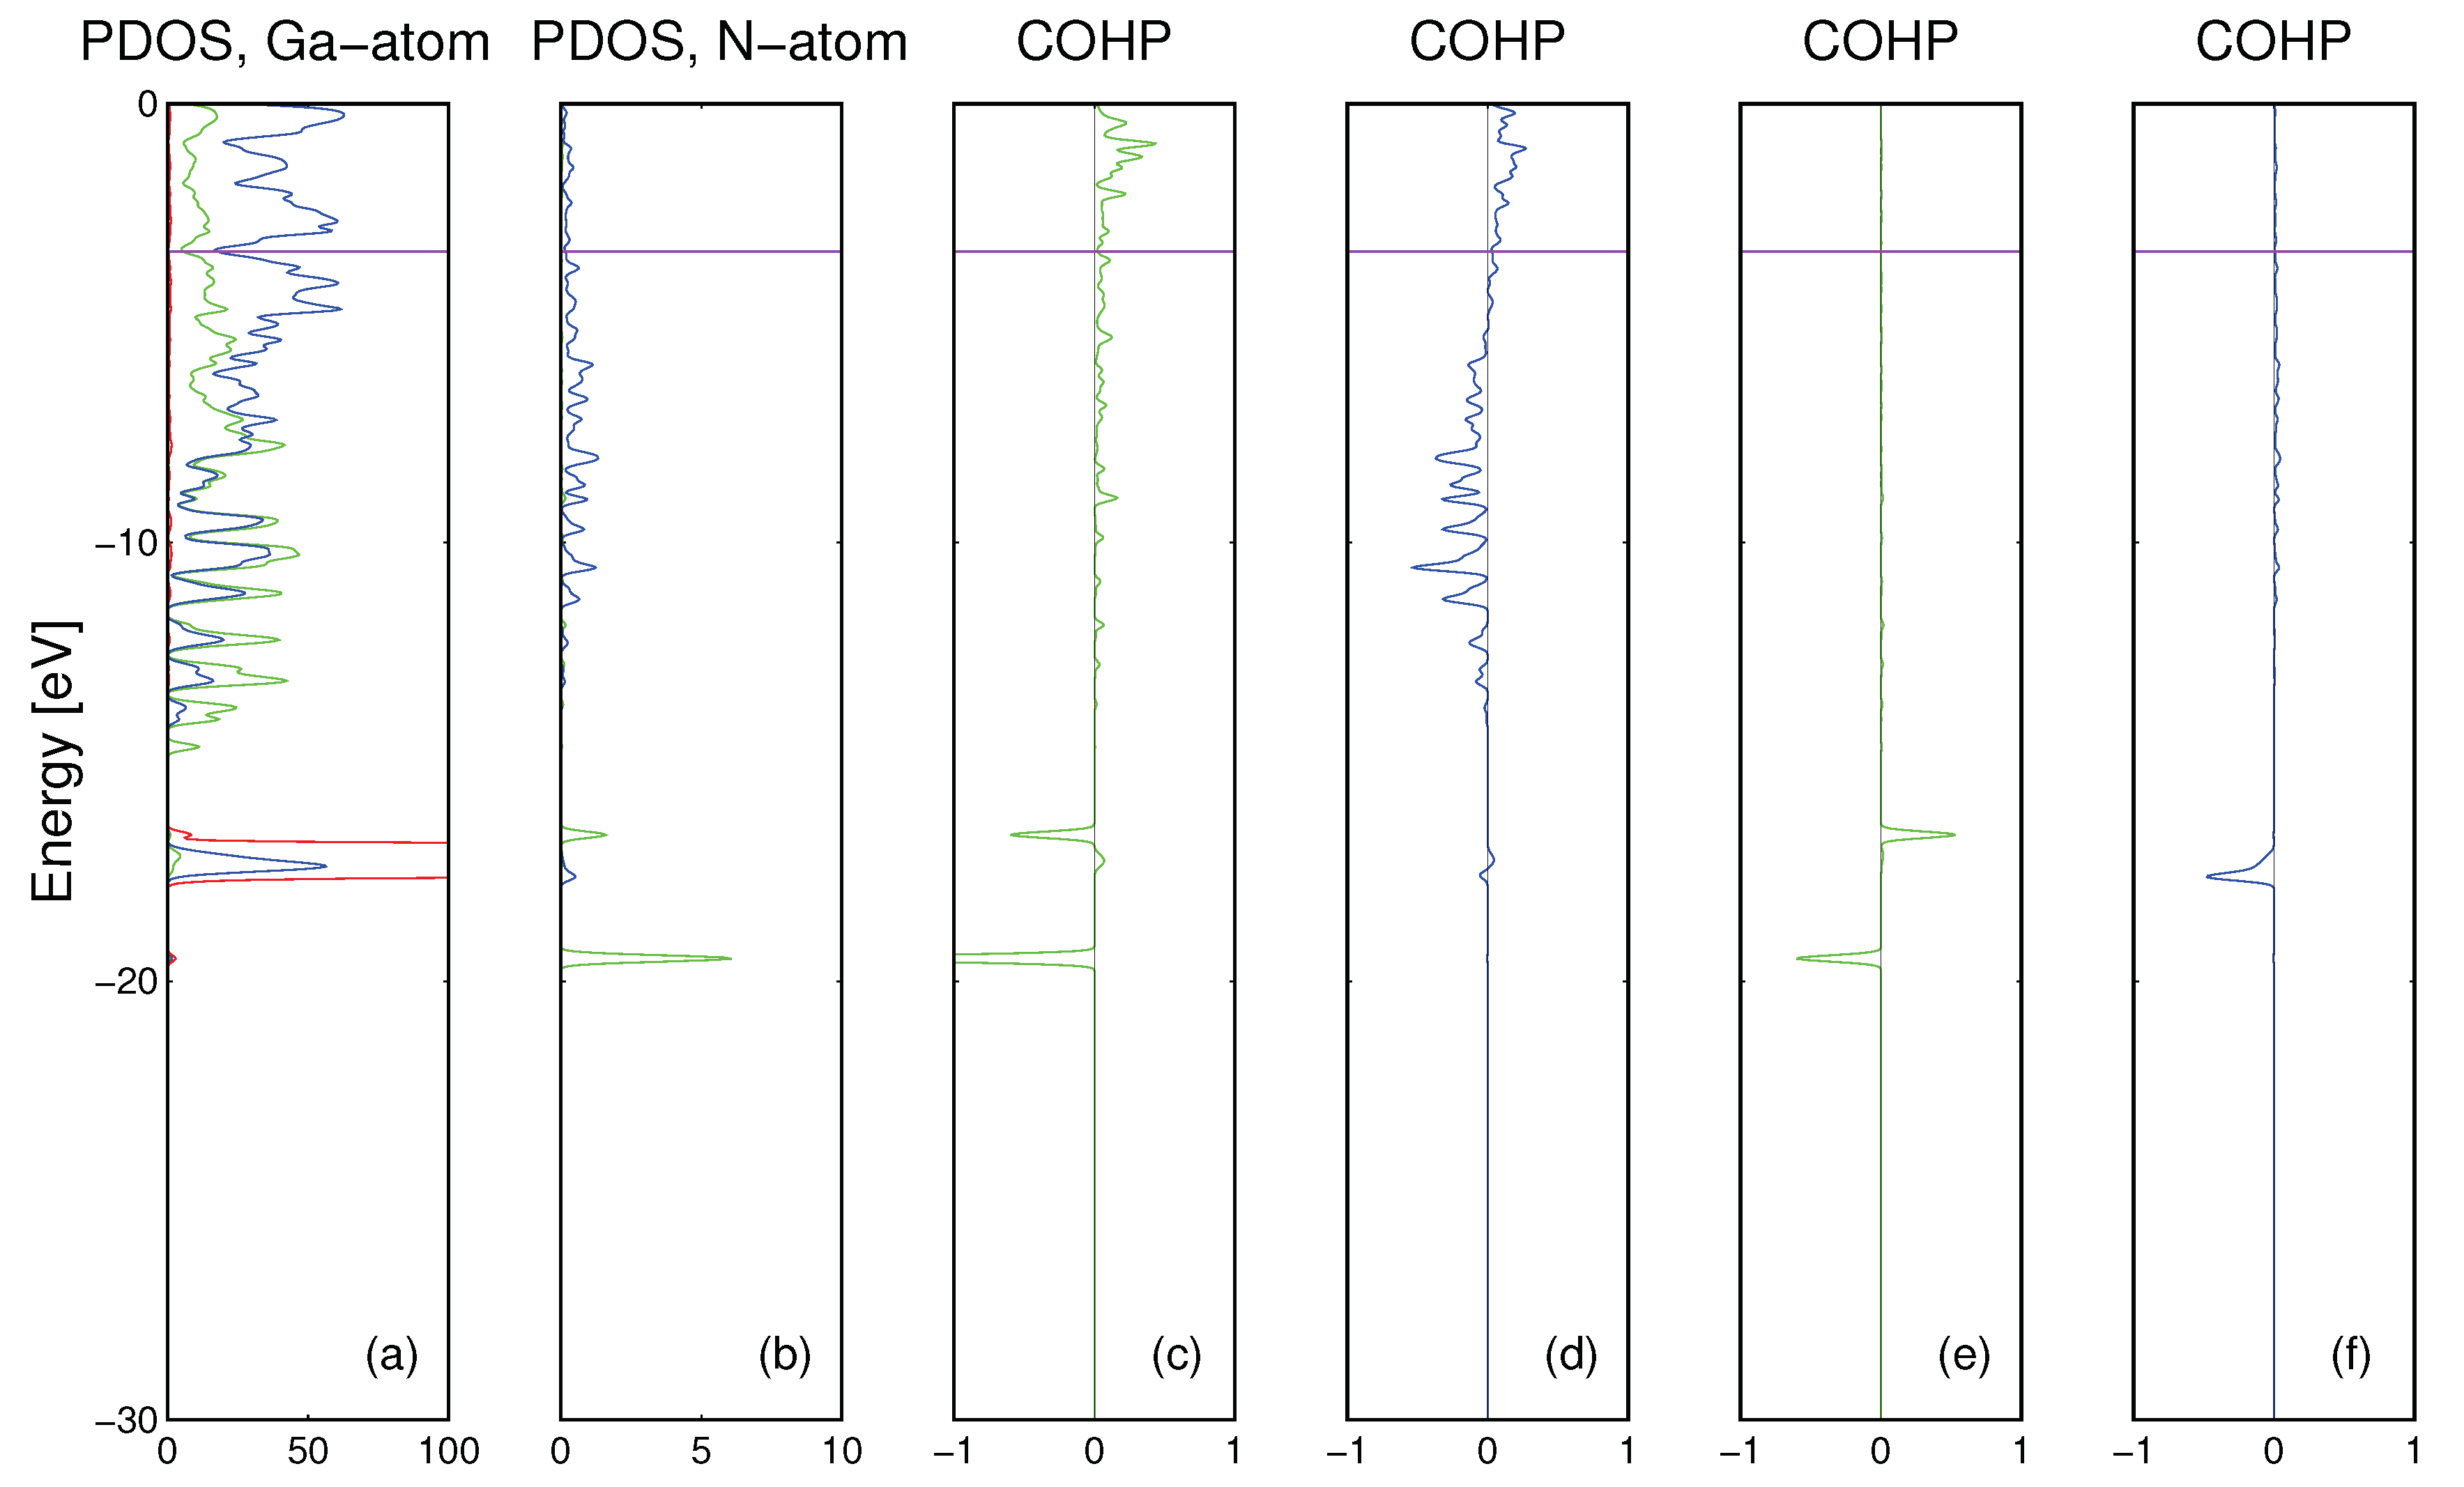
The results of the calculations for nitrogen atom in the Ga matrix are presented in
Figure 6. As it was already shown, gallium matrix atoms are bonded by
Ga4s and
Ga4p orbitals while N atom could be bonded by its own
N2s and
N2p orbitals. The N-Ga bonding is drastically different from the N-Fe case. The
N2s bond with Ga states is molecular in character with small energy dispersion and small magnitude while
N2p states are bonded by large dispersion state, i.e., they are extended in real space—
Figure 6d. There is a small contribution of
N2p-Ga3d bonding, due to extended nature of
N2p state—
Figure 6f. The bonding and antibonding overlaps between
N2s and
Ga3d states are compensated. Therefore as it is shown above, bonding of interstitial N atom to Fe and Ga matrices has different character.
Please note that the approach is similar to the one applied above to the Fe-N cluster. The number of Ga atoms is preserved, and a single N atom is added. The energy of dissolution of nitrogen single atom in the Fe matrix is calculated using Equation (
2). From the obtained DFT values, the energy of atomic N dissolution in the Ga matrix is:
eV/atom. Then the energy of dissolution of molecular nitrogen is obtained via Equation (
3). Thus, the energy of dissolution of molecular nitrogen in Ga is:
eV/mol. The energy is positive and significantly higher than for Fe, therefore the energy increase should be observed at dissolution of molecular nitrogen, and accordingly, the solubility of nitrogen in liquid Ga should be drastically lower than in Fe.
It was found however that the obtained total energy of the Ga-N system changes considerably, depending on the configuration used [
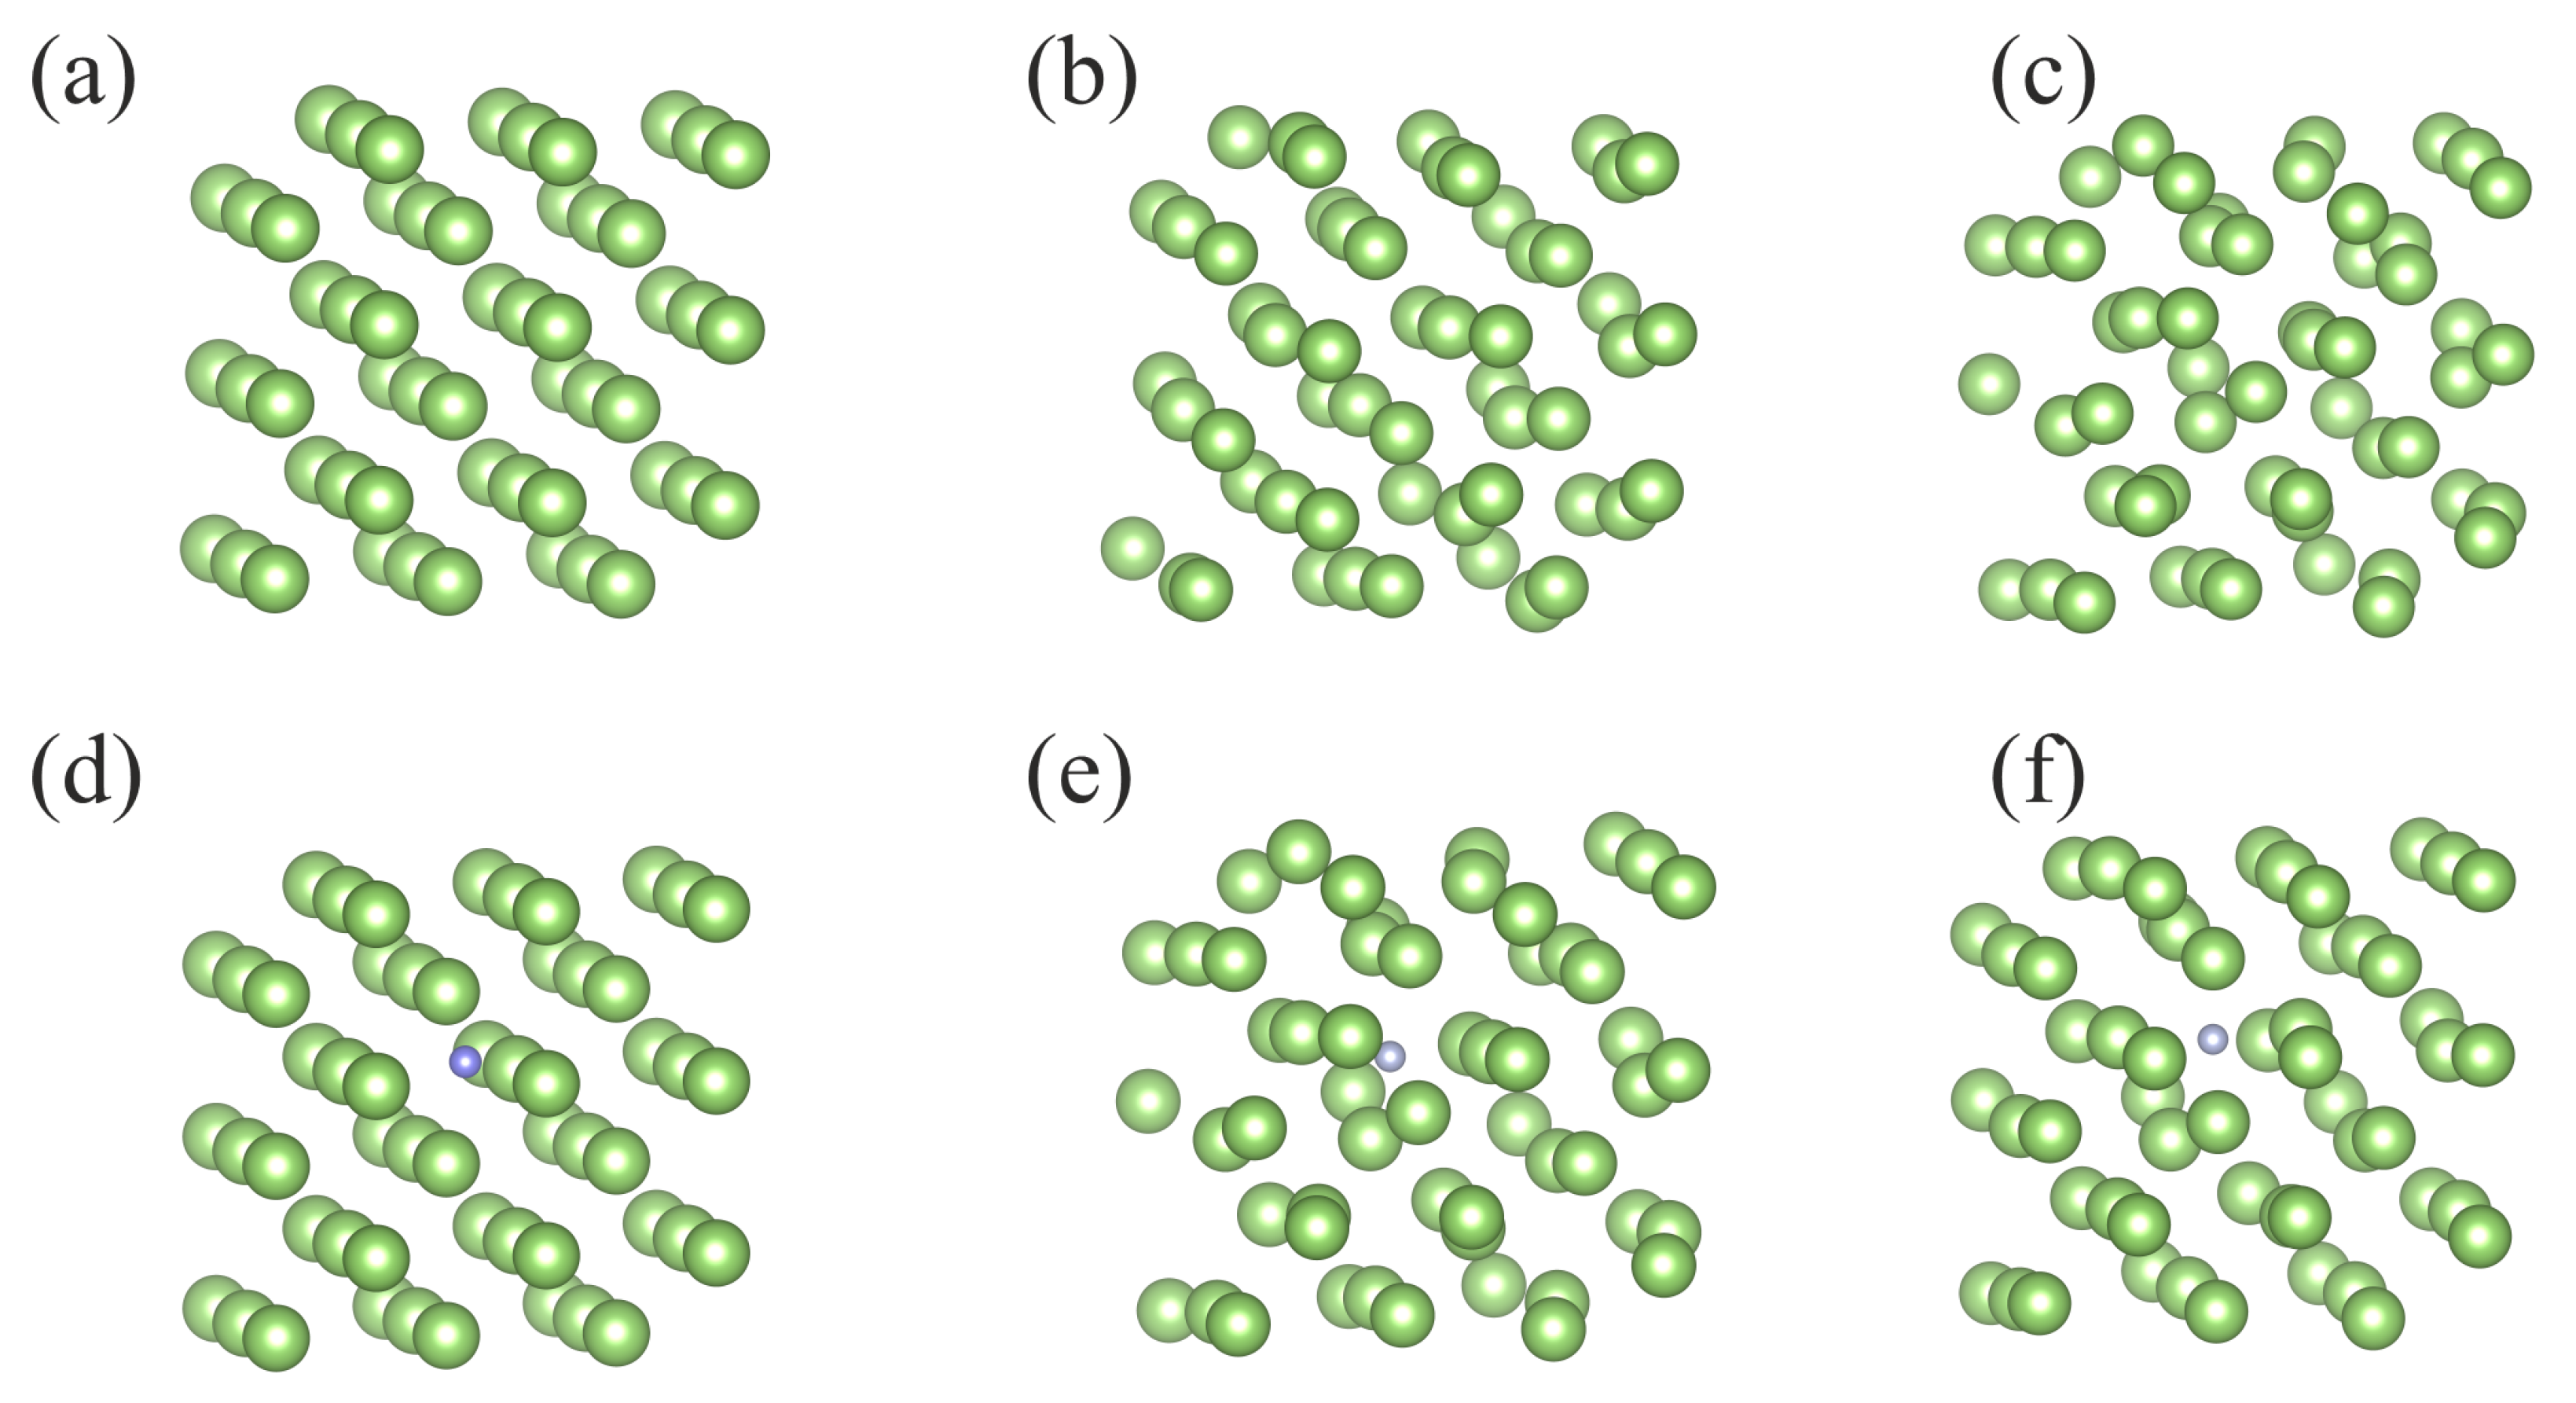
34]. Therefore, in order to average over configurational degrees of freedom and obtain representation relevant for the liquid, the molecular dynamics (MD)
ab initio simulations of the 54 Ga atom cluster, with and without a single N atom immersed in, have been performed. In such a model, the corresponding concentration of nitrogen was 0.01851 atomic fraction (at. fr.) The average temperature of the simulation was set to 500 K. The configurations of the system, the initial one and the ones after prescribed number of MD steps, is presented in
Figure 7. In fact, the temperature 500 K is above the melting point of Ga (
K at normal pressure). Therefore, after a short initial period, the configuration of atoms is changed completely. Thus, the initial configuration has no influence on the time averaged data.
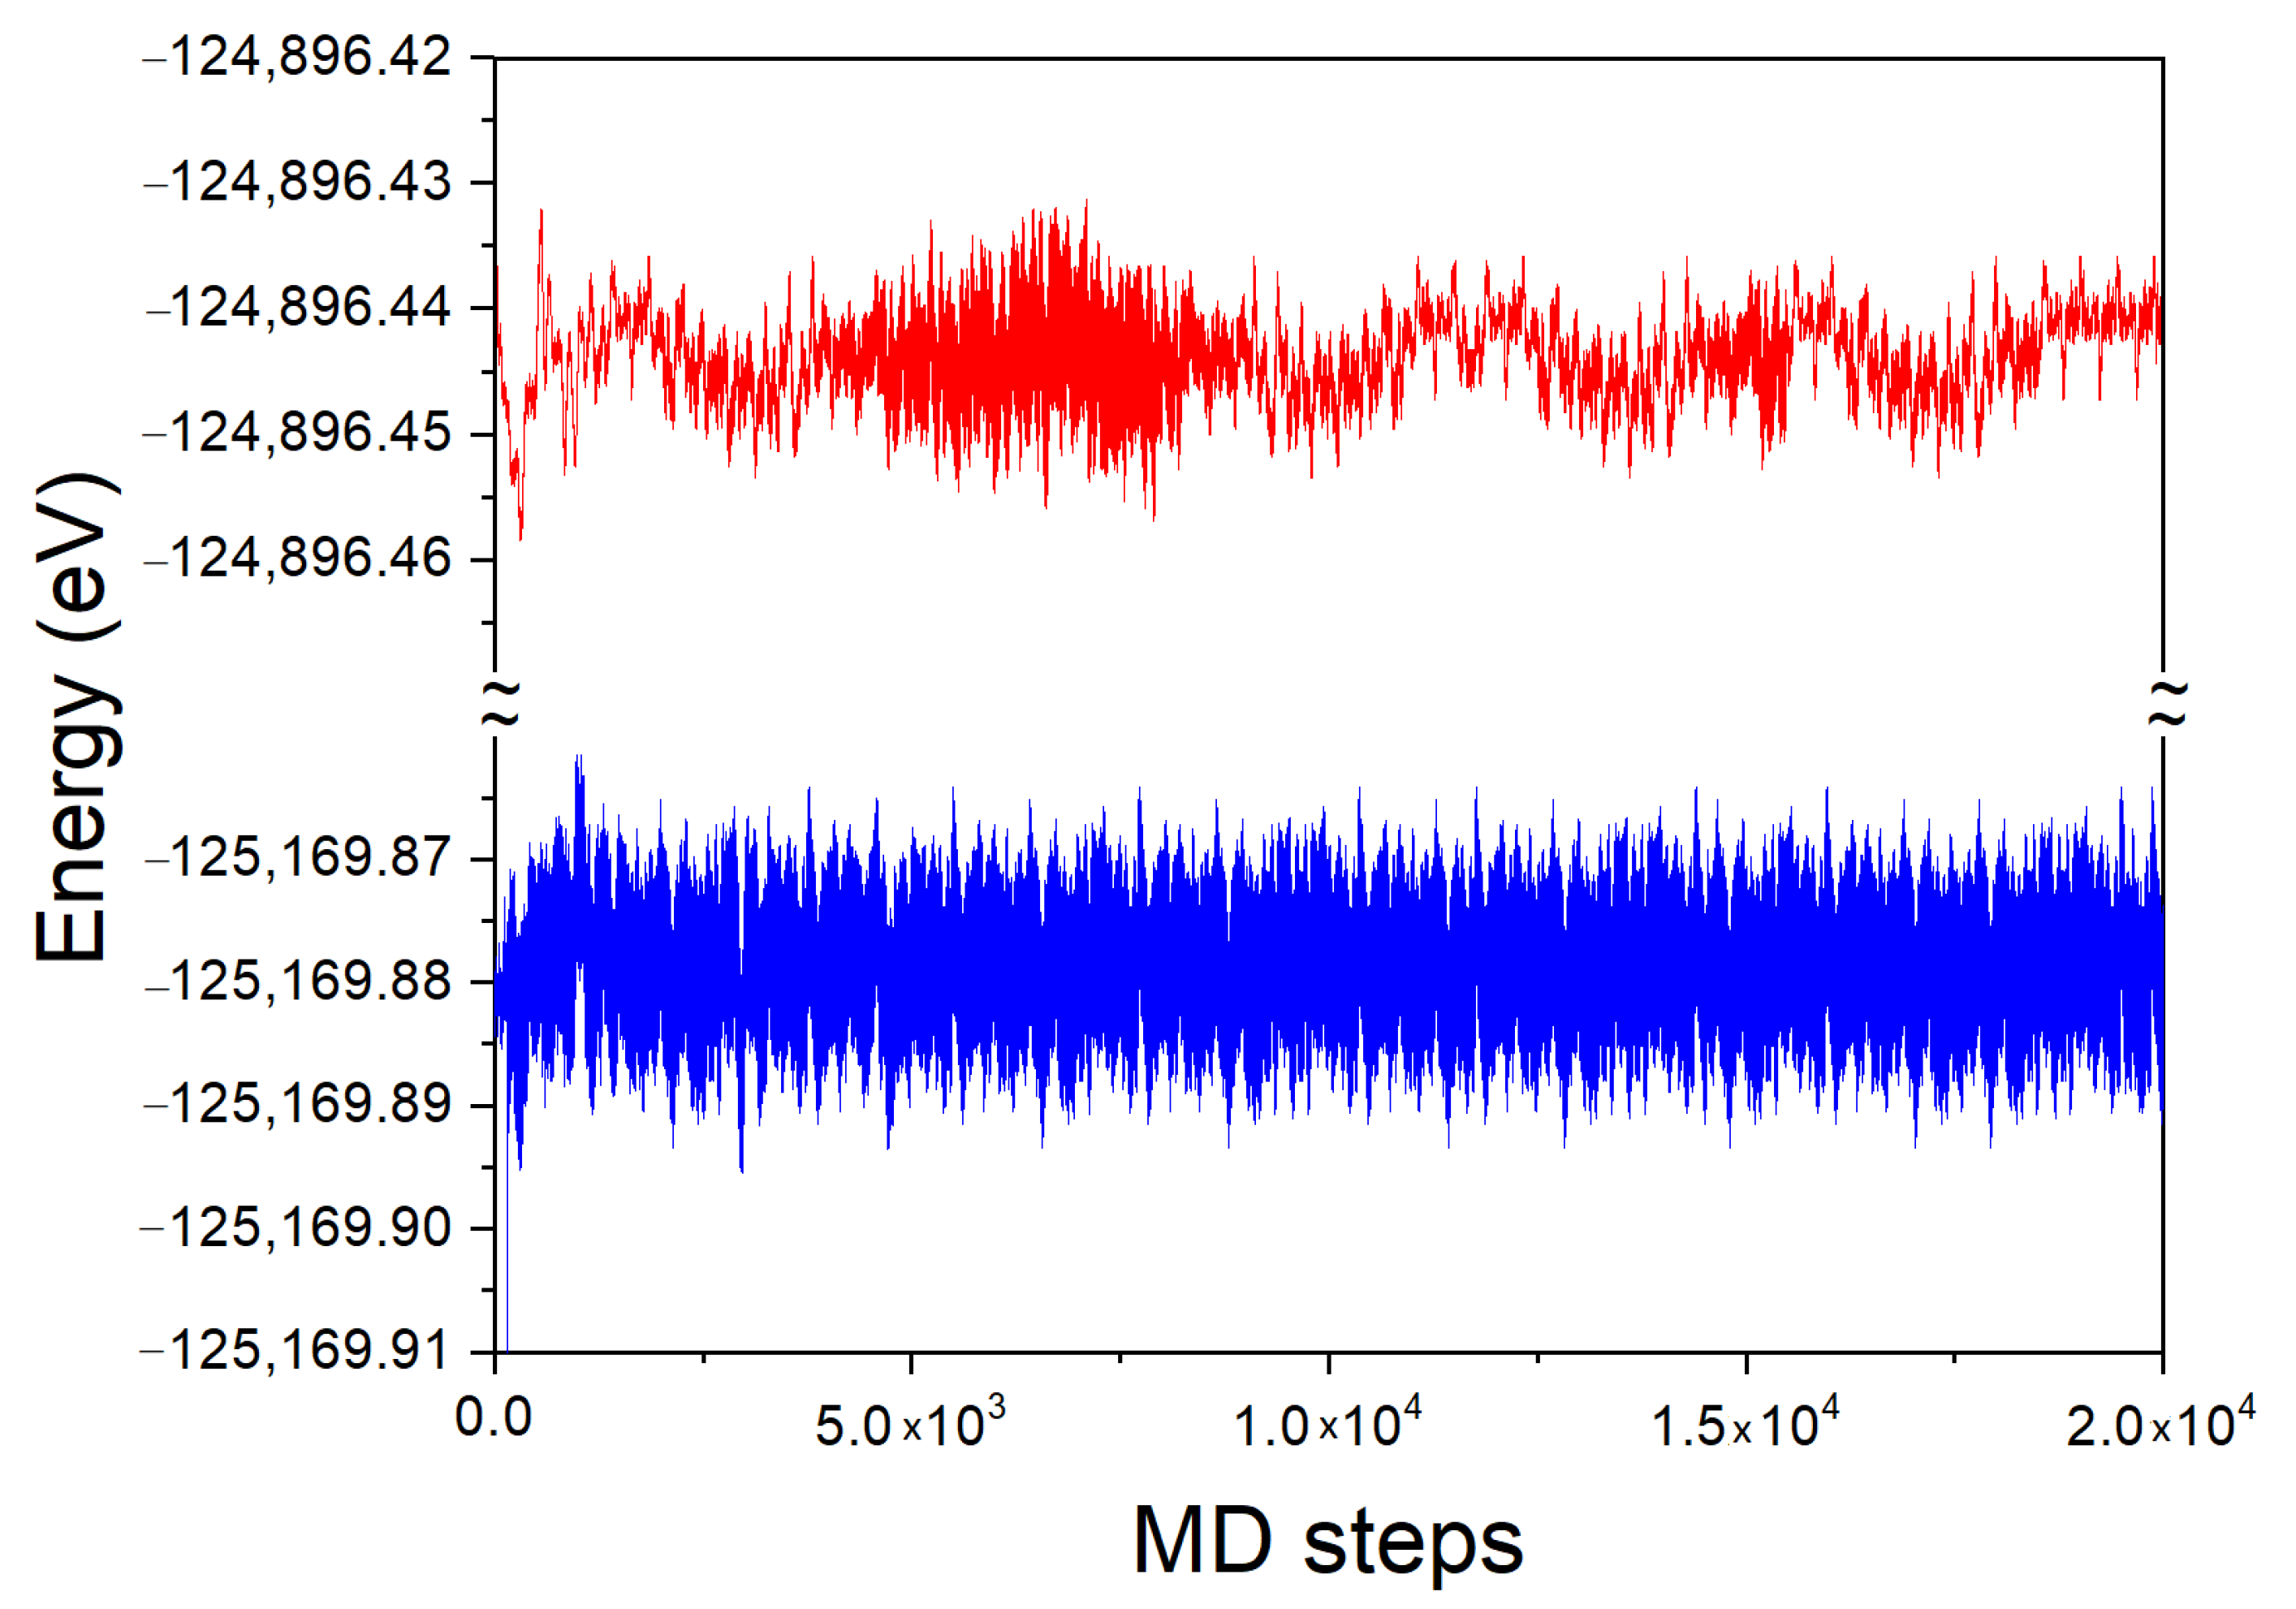
The time evolution of the total energy of the system for the 54 Ga atom cluster, with and without a single N atom immersed in, is presented in
Figure 8. In the simulation, the averaging was made using a sequence of time steps until a steady state has been achieved, as shown in
Figure 8. The averaging for the final result was undertaken when the error in the simulation was smaller than 0.001 of the total energy value.
Due to periodic boundary conditions, the system is not closed. Therefore, the energy of the system can change in time. The initial time evolution of the Ga cluster both with and without N atom is similarly fast. The system attains the energy, close to the average one after several hundred MD steps. As it is visible, the energy of the system fluctuates around the average one. The temporal evolution of the fluctuations is different in both cases. The system without N atom exhibits two different fluctuation types: first short lived one, typical for thermal noise of independent thermal motions of single atoms, and the second one which is long lived fluctuations typical for hydrodynamics, i.e., common motion of higher number of atoms. Due to sheer size of the simulation cell, this number cannot be too large. Anyway, such a phenomenon is clearly observed.
The system with the immersed N atom behaves differently. The thermal fluctuations are present with the noise similar to the previous one. Nevertheless, the hydrodynamic fluctuations are absent which may be attributed to the small size of the simulated system. Nitrogen atom strongly binds several atoms in the first coordination zone, hampering their motion. The remaining atoms are not able to move in coordinated manner, thus the system fluctuations are reduced to the thermal noise only.
The time averaged total energy was
(54 Ga-1 N) = −125,169.879 eV and
= −124,896.443 eV for these two clusters, respectively. The DFT energy of single N atom is
eV. In order to derive the DFT energy of dissolution, it should be noted that the total energy derived from the MD simulations contains two additional terms, not present in the standard DFT calculations. The first one is the average energy of thermal motion of atoms, which for a single nitrogen atom, is
, the value that arises from both kinetic and potential energy average. The second contribution is the zero-point energy
(N-Ga). For the above simulations conducted at
T = 500 K, the thermal energy value is
eV. From the standard DFT calculations at
T = 0 K, the zero-point energy value is
eV. Thus the N atom dissolution energy is given by relation different from Equation (
2):
From the above data, the DFT energy of dissolution of N in liquid Ga is
eV/atom. As mentioned earlier, the dissolution energy of molecular nitrogen should be lowered by the energy of N
molecule dissociation
eV. Accordingly, the energy of dissolution of a single N
molecule in Ga is given by:
Therefore, the resulting energy of dissolution of molecular nitrogen in Ga(l):
eV/mol. The energy change associated with single atom is half of the one for molecule, i.e.,
eV/atom. The energy is positive, therefore the energy increase occurs at dissolution of molecular nitrogen that leads generally, to relatively low N solubility in Ga as was already observed [
11,
35,
36].
Similar MD simulations were made for N dissolution in Fe using 54 Fe atoms cluster with single N atom immersed in the metal as presented in
Figure 9. As above, the concentration of nitrogen was 0.01851 at. fr. The technical details of the simulations were the same as these used for Ga and the temperature was again set at 500 K.
The evolution of the system looks differently than for the Ga case. At 500 K, Fe is in the solid phase, therefore the evolution of the system is typical for the crystal. The configurations shown in both Fe and Fe:N cases are typical for the solid phase where the long-range order is preserved, and the atoms are attached to their lattice sites. The presence of nitrogen does not induce melting, the order is still preserved. Nevertheless, the fluctuations change the lattice in a visible manner.
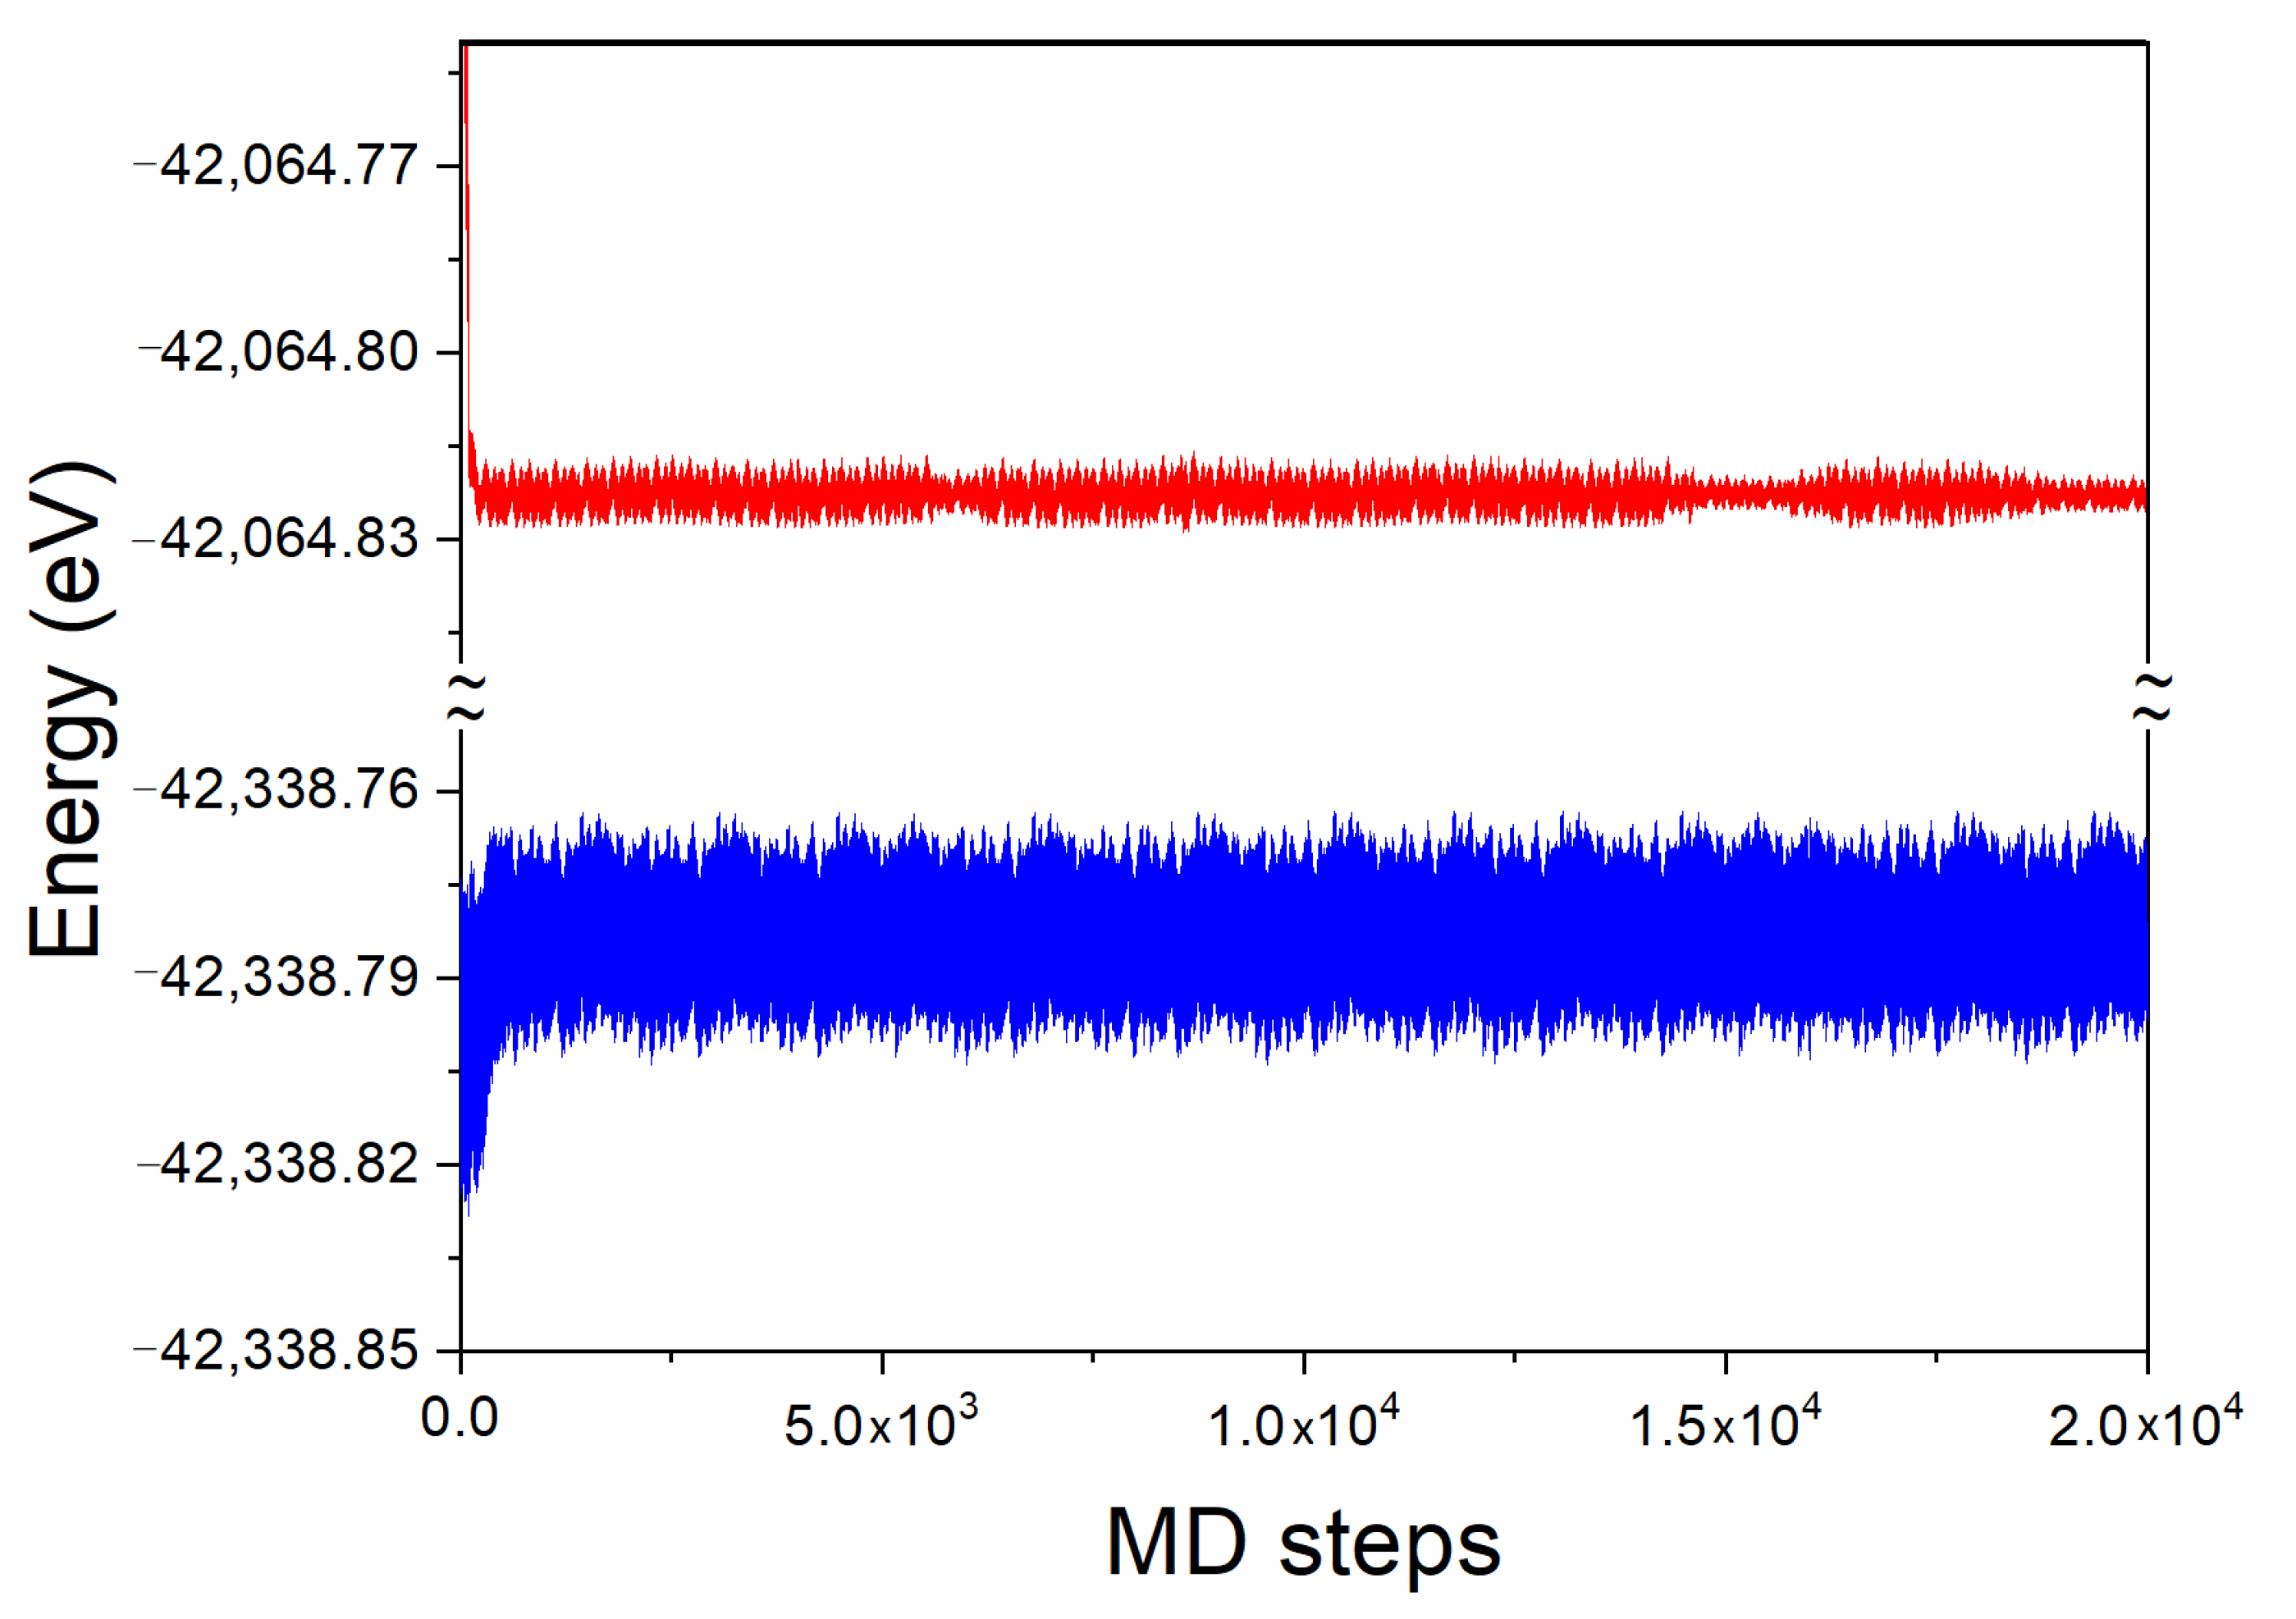
The time evolution of the system total energy for the Fe and Fe-N clusters, are presented in
Figure 10. As before, the final result was undertaken when the error in the simulation was smaller than 0.001 of the total energy value.
As above, due to periodic boundary conditions, the system is not closed so that the energy of the system may change in time. The time evolution of the Fe cluster both with and without N atom is the same as for the Ga case, similarly fast. The system attains the energy, close to average one after several hundred MD steps. The energy of the system fluctuates around the average. The thermal fluctuations are present with the noise similar but larger for N atom present. The hydrodynamic fluctuations are absent as the system is essentially solid.
The time averaged total energy was
= −42,338.783 eV and
= −42,064.823 eV for these two clusters, respectively. As for Ga cluster, the DFT energy of single N atom and the kinetic energy must be taken into account, using the same values, i.e.,
= −269.422 eV and
eV, respectively. The zero-point energy value from standard DFT calculations is
eV. The N atom dissolution energy, obtained from Equation (
4) is
eV/atom. The energy of dissolution of single N
molecule in Fe, given by Equation (
5) is
eV/mol, and accordingly the part associated with single atom is:
eV/atom. The energy is almost zero, i.e., much lower than the value obtained for liquid Ga, indicating that the solubility of nitrogen in Fe should be much higher at the otherwise, similar conditions.
3.3. Equilibrium between N Gas and Nitrogen Dissolved in Ga and Fe Metals
The equilibrium between gas and liquid phases entails equality of chemical potentials. In case of dissolution of nitrogen from the diatomic form in its gas phase in a metallic liquid it is recognized that the N
molecule dissociates in contact with liquid metals. For Ga solvent, it was demonstrated by Romanowski et al. [
12,
13] by DFT modeling of both N
dissociative chemisorption and dissolution processes. As iron has higher bonding energy to nitrogen than gallium, it is expected that dissolution of nitrogen in liquid Fe is also dissociative that leads to universal relation for equilibrium:
Direct comparison of the chemical potential of both species is not possible as there is no direct prescription to obtain chemical potential at given temperature and pressure.
The chemical potential equality can be analyzed by calculating the enthalpy and entropy differences for nitrogen in the liquid and gas phases separately and combine them in the Gibbs free energy. That causes considerable difficulties as in the standard approach, the enthalpy difference at zero temperature, equal to the ab initio energy difference between the vapor and the liquid, is considered. The other contributions are treated as entropy term, i.e., their contribution to chemical potential is proportional to the temperature. Typically, the value of the proportionality constant is adjusted by fit to the available experimental data.
The entropy difference could not be obtained at zero K as the vapor-phase entropy has singularity there (for discussion of the singularity please refer to
Appendix A). Therefore, the separate calculation path was proposed for the total difference in chemical potential at the condensed/vapor, i.e., liquid (or solid)/vapor (l-v) phase transition for nitrogen. The enthalpy difference at the solid-vapor transition is calculated at zero K. The entropy difference at this transition is obtained at normal conditions. The difference in total chemical potential must be supplemented by changes occurring during the transition to these points. The entire paths are fairly complex, nevertheless, the same results were obtained independently by Jackson and Walsh [
37] for bulk and by us for the properties of gas adsorbed at the surfaces of solids [
38]. The equations here are written in formulation given in reference [
38], with the sign reversed, i.e., using dissolution energy as defined in
Section 2.1, for the vapor–solid chemical potential difference:
where the normal temperature and pressure are defined as:
T = 20 °C = 298.15 K and
p = 1 bar. The terms in the above equation are defined as:
- (i)
The first term is the enthalpy change at dissolution for single N atom, calculated as
ab initio energy difference between the vapor and the solid (liquid):
It was shown recently [
39] that the energy difference obtained from DFT calculations (Equation (
1)) does not correspond to the enthalpy change during vaporization as the thermodynamic state energy is increased by the energy of vibrations at the ground state, the effect called zero-point energy (ZPE) [
39]. As these values are not identical, they contribute to the enthalpy difference giving
where the zero-point energy difference is:
As pointed out by Ponomareva et al. [
34] and discussed in
Section 2.1, the energy depends on the atomic configuration used for the calculation. Therefore, in our approach, the enthalpy difference was evaluated for configurations resulting from the MD simulations at 500 K. As discussed in
Section 2.1, the dissolution energy was obtained using its MD value, the average thermal energy of single N atom at 500 K
(1 N) and zero-point energy
(N-Ga) (see Equation (
4)).
- (ii)
Difference in chemical potential related to the entropy change at dissolution, calculated at normal conditions,
- (iii)
Difference in enthalpy change between both phases at the transition from 0 K to normal conditions, i.e.,
,
- (iv)
The chemical potential change caused by the temperature change from
to,
- (v)
The pressure induced change of the chemical potential
as
.
- (vi)
Term related to the concentration of N in the metal liquid. The latter contribution may be calculated using standard chemical approximations for ideal solutions:
where
x is the concentration of N atoms in the solution.
3.4. Dissolution of Molecular Nitrogen in Liquid Gallium
The enthalpy of dissolution ((i) in the previous Section) for a single N atom consists of two contributions: energy of dissolution
eV/atom, and the zero-point energy contribution, given in Equation (
10), calculated as the difference of the zero-point energies for single N atom in the liquid
eV and that derived from vibrations in the N
molecule in the vapor
eV. Therefore, zero-point energy difference is
eV.
In summary, the enthalpy of dissolution for single N atom in the gallium metal, from N molecule is: eV/atom.
Please note that the contribution of dissolution entropy to the free energy (ii)
could be easily obtained. As both the vapor and the liquid N-containing phases are not ordered, the entropy change could be expressed by the appropriate volume ratio:
From the ideal gas law, the volume associated with single N atom at normal temperature and pressure is:
Å
. The volume associated with incorporation of the N atom into the Ga cluster is
Å
. Thus, the dissolution entropy related free energy change described by Equation (
16) is:
eV.
For the vapor phase, the entropy terms could be evaluated quite easily. In a good approximation, the specific heat of nitrogen in the gas phase is determined by the equipartition principle, i.e., it is constant. The thermal contributions (iii) and (iv) could be obtained be separate calculation for both phases. The vapor-phase contribution is obtained directly, as the heat capacity is constant.
The enthalpy difference is eV/molecule. The latter value for single N molecule could be recalculated for single N atom as: eV/atom. Generally, the contribution is small in relation to the enthalpy change at dissolution or to the difference in chemical potential related to dissolution entropy change thus not affecting the entire result considerably.
The second term is the nitrogen free energy difference between standard
T and a selected temperature
T. This could be directly obtained from already published data concerning the chemical potential of gaseous nitrogen at normal pressure [
40]:
where
is scaled temperature. From this data the free energy difference is readily obtained as:
The entropy contribution in the liquid may be obtained from evaluation of phonon related effects, directly. The phonon part of the vibrational energy
, the specific heat
, entropy
, and free energy
associated with the nitrogen atom immersed in gallium may be obtained as [
39,
41]:
where
and
is phonon frequency of a
j-th phonon mode. A simplified treatment may be used, based on Debye theory in which the acoustic phonon frequencies are approximated by linear dependence. Accordingly, the maximum phonon energy, known as the Debye energy, and its equivalents: frequency and the temperature, are related as follows:
. Using this simplified representation, the spectra sums are replaced by integrals, giving:
The N-Ga Debye temperature was obtained from the fit of
ab initio derived specific heat to the temperature dependence given by Equations (
23)–(26). The obtained value equal
K was used to evaluate other thermal contributions given by Equations (
23)–(26).
Evaluating the pressure related term ((v) in the previous Section) one must account that in Equation (
17), the pressure of molecular nitrogen is used. In our model, the expression scaled to atomic nitrogen has to be used, i.e.,
, where
p = 1 bar.
At equilibrium, the chemical potential difference vanishes, i.e.,
which allows us to express the equilibrium pressure above specified liquid phase via chemical potential contribution in the ideal gas approximation:
In the real gas case (at high pressure), the pressure
p in Equation (
27) must be interpreted as fugacity of N
gas (or activity, if divided by
p) accounting for intermolecular interactions due to high density of the gas.
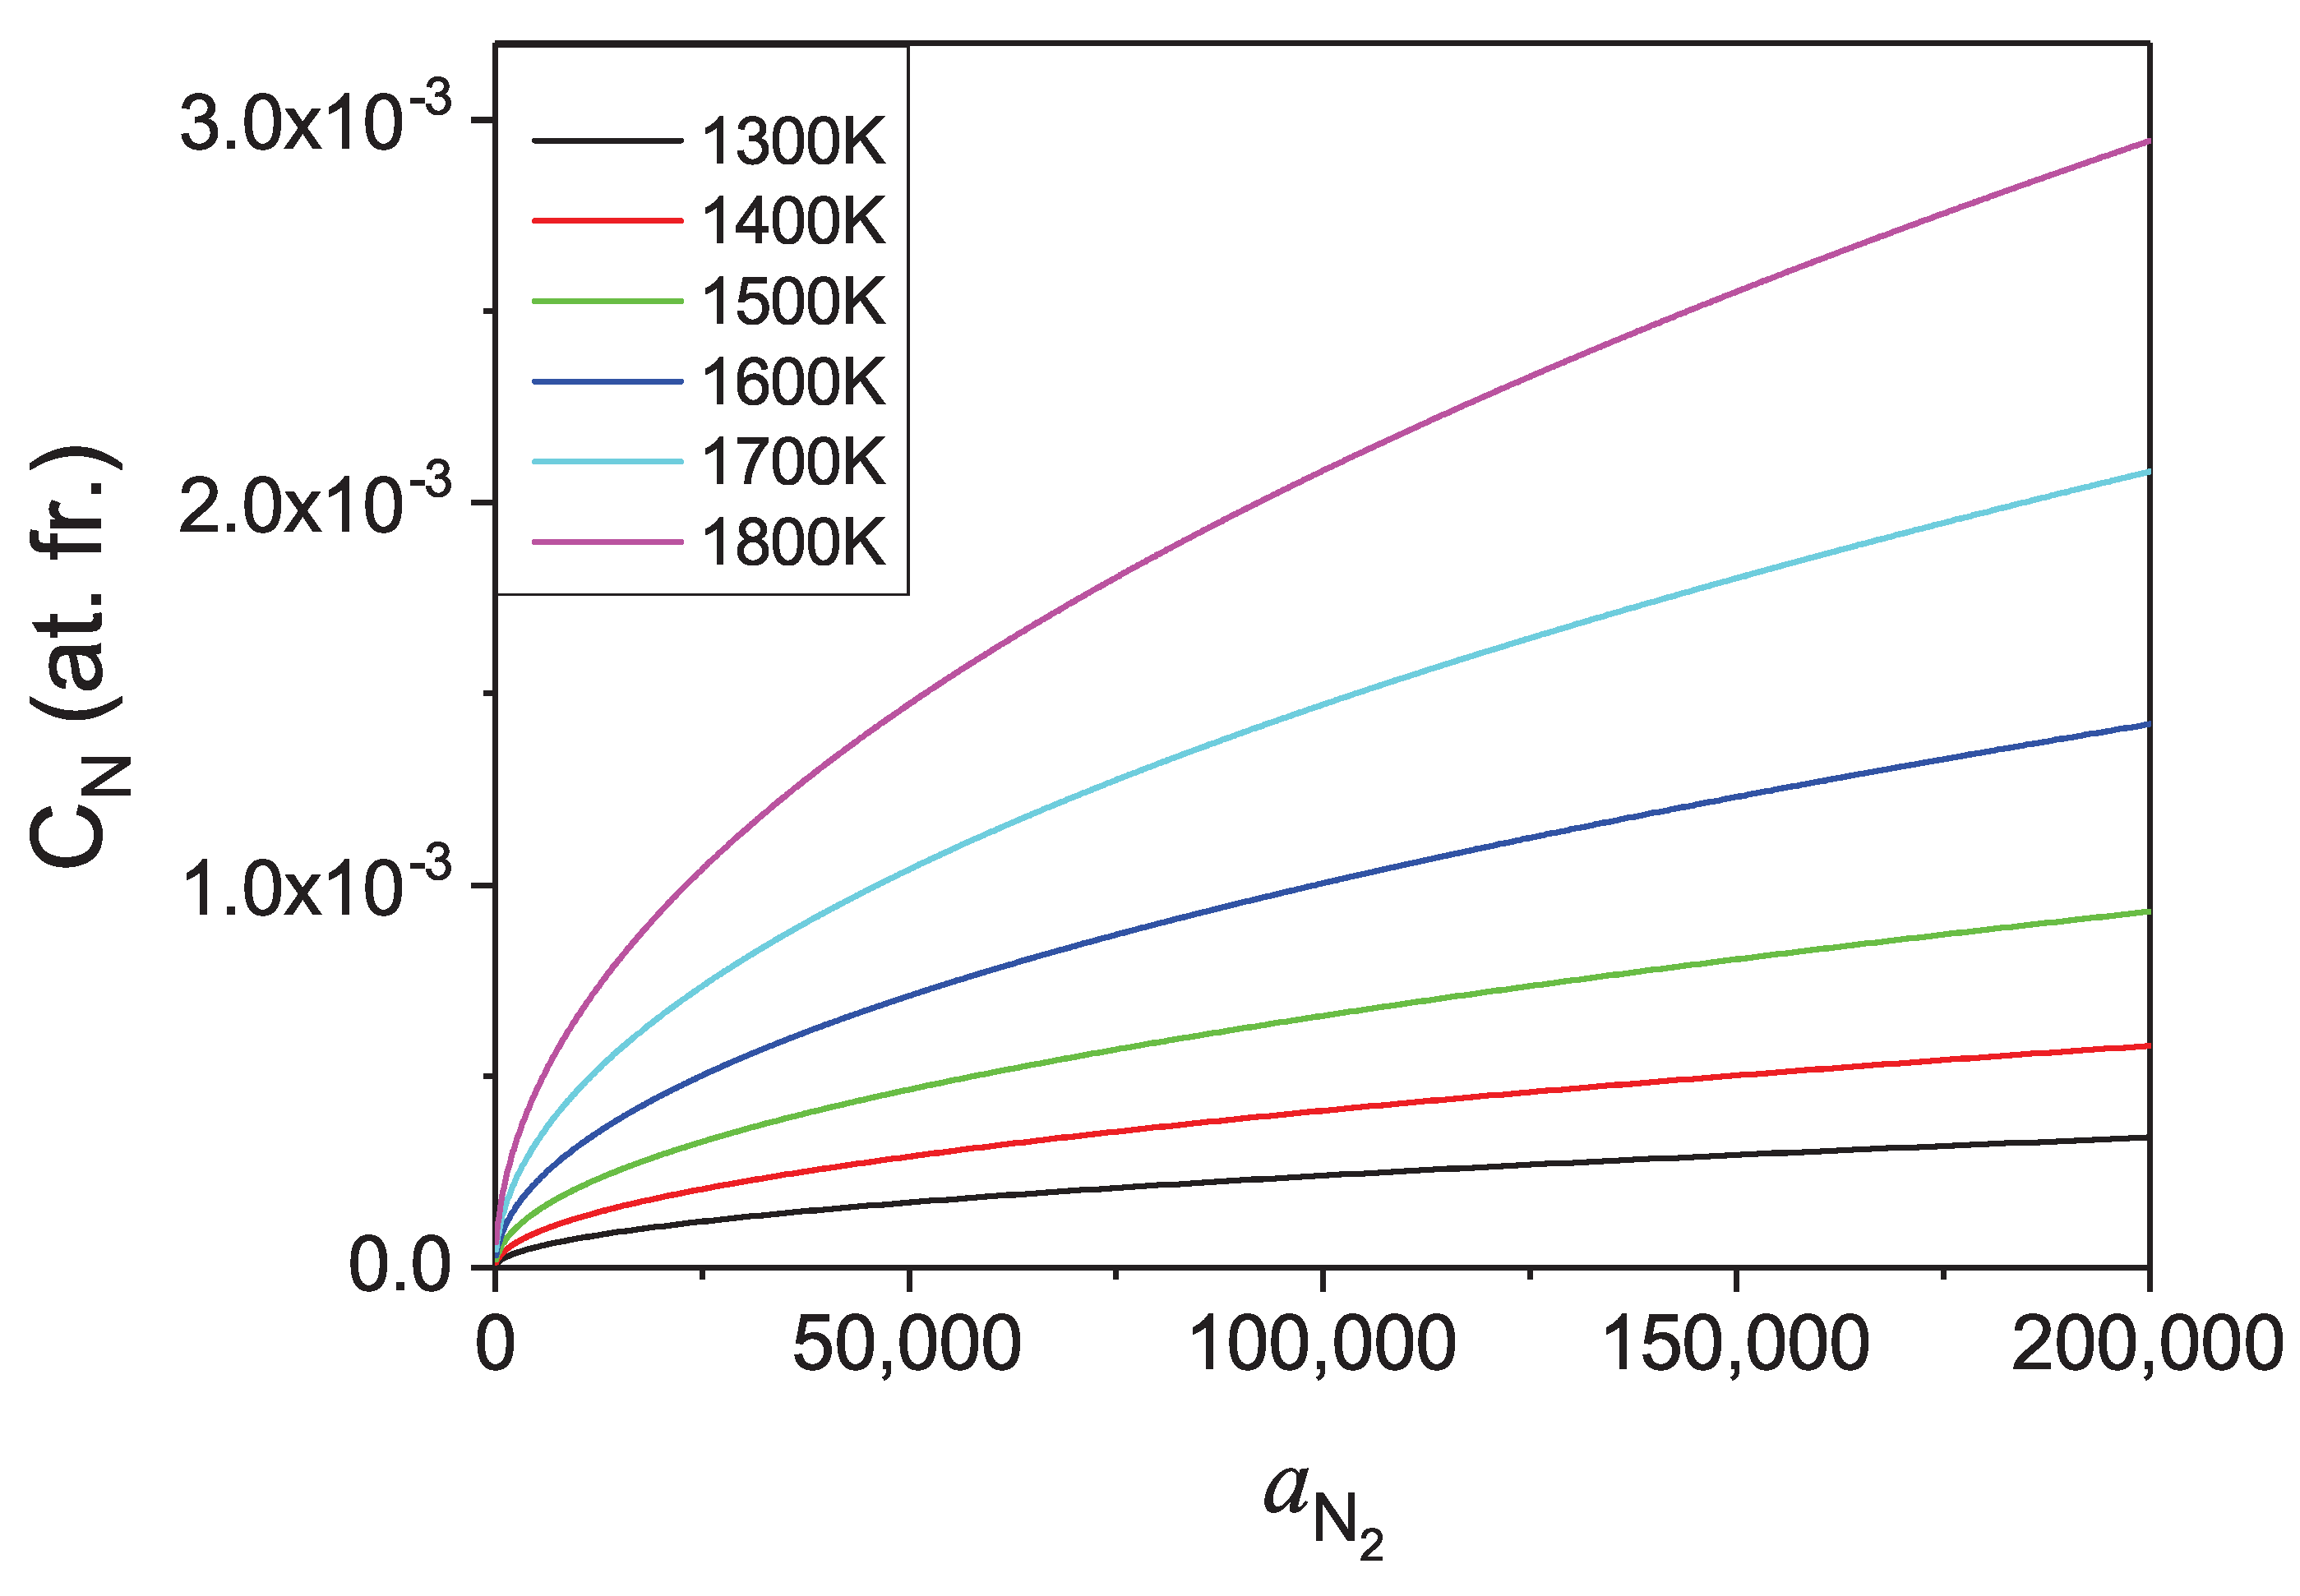
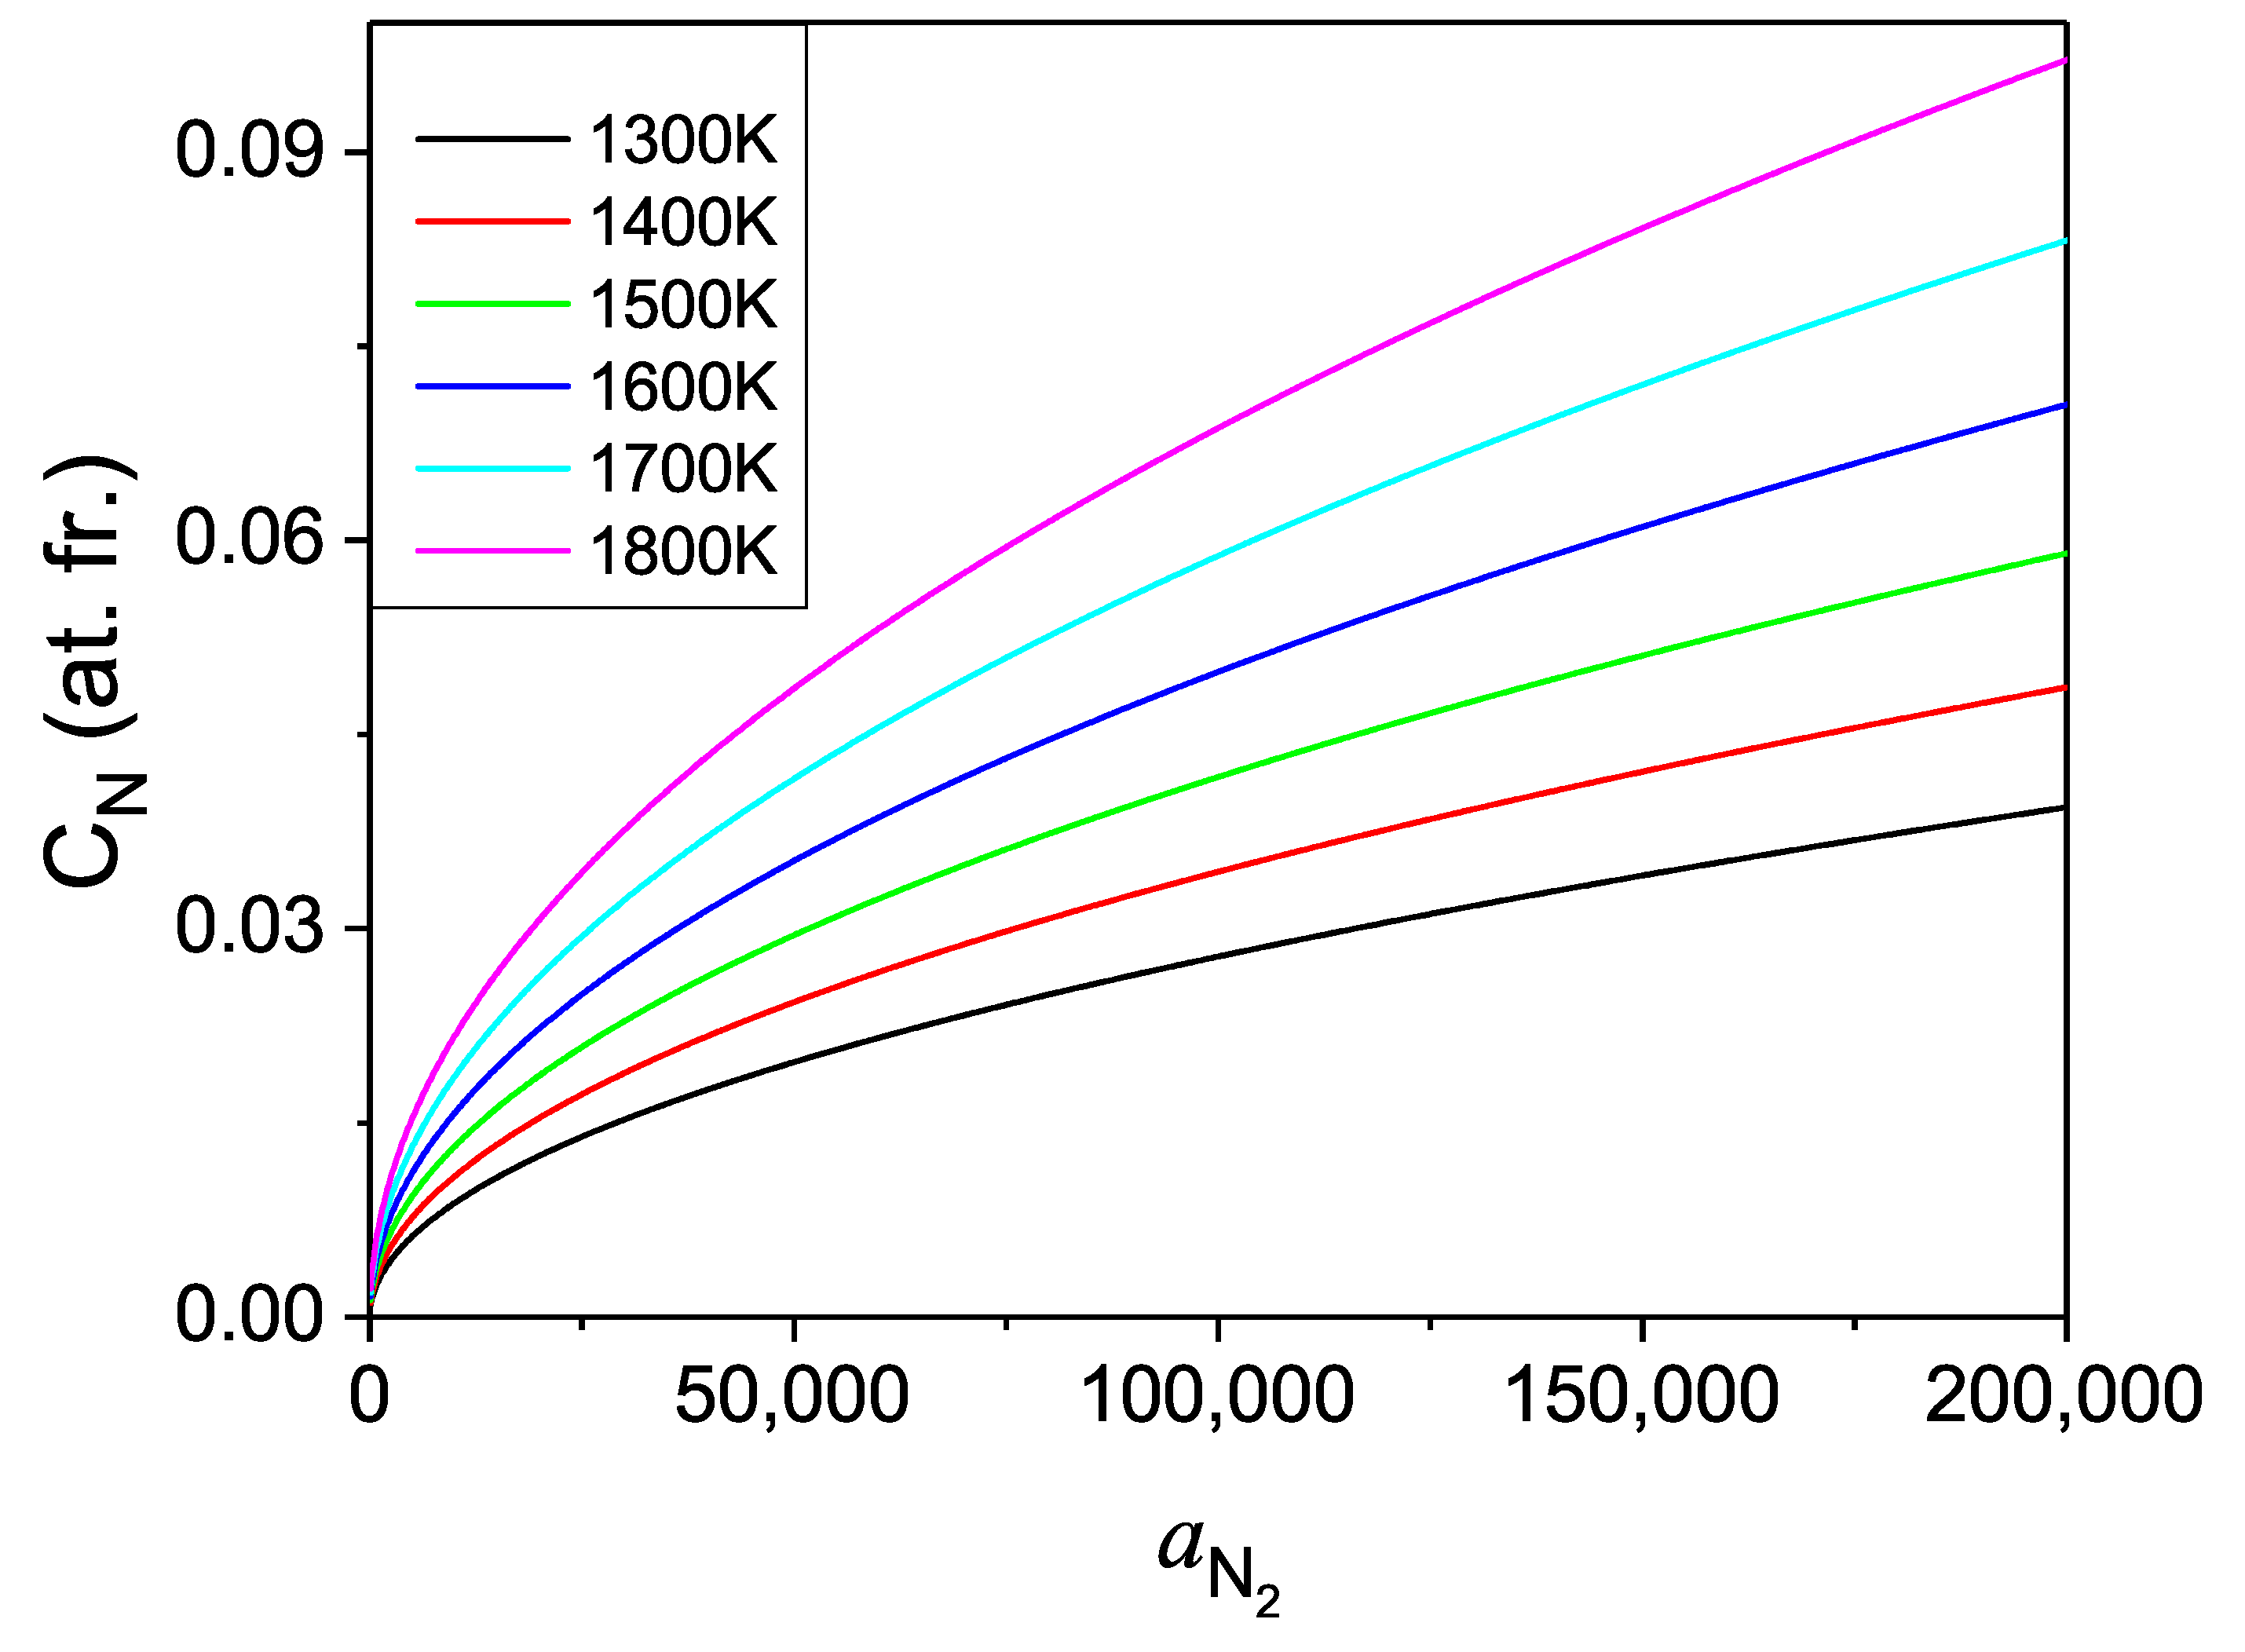
Therefore, the dependence of the concentration of nitrogen in liquid Ga on activity of the N
gas over the solution could be obtained. Such a dependence for several temperatures is presented in
Figure 11.
As in expressions for thermodynamic functions, the considered activities of N
gas replace the pressure where ideal gas equation of state is not fulfilled, the corresponding pressure had to be evaluated using the modified equation of state. Such equation of state of nitrogen derived from experimental data by Jacobsen et al. [
42] and confirmed by molecular dynamics and
ab initio simulations by Strak et al. [
43,
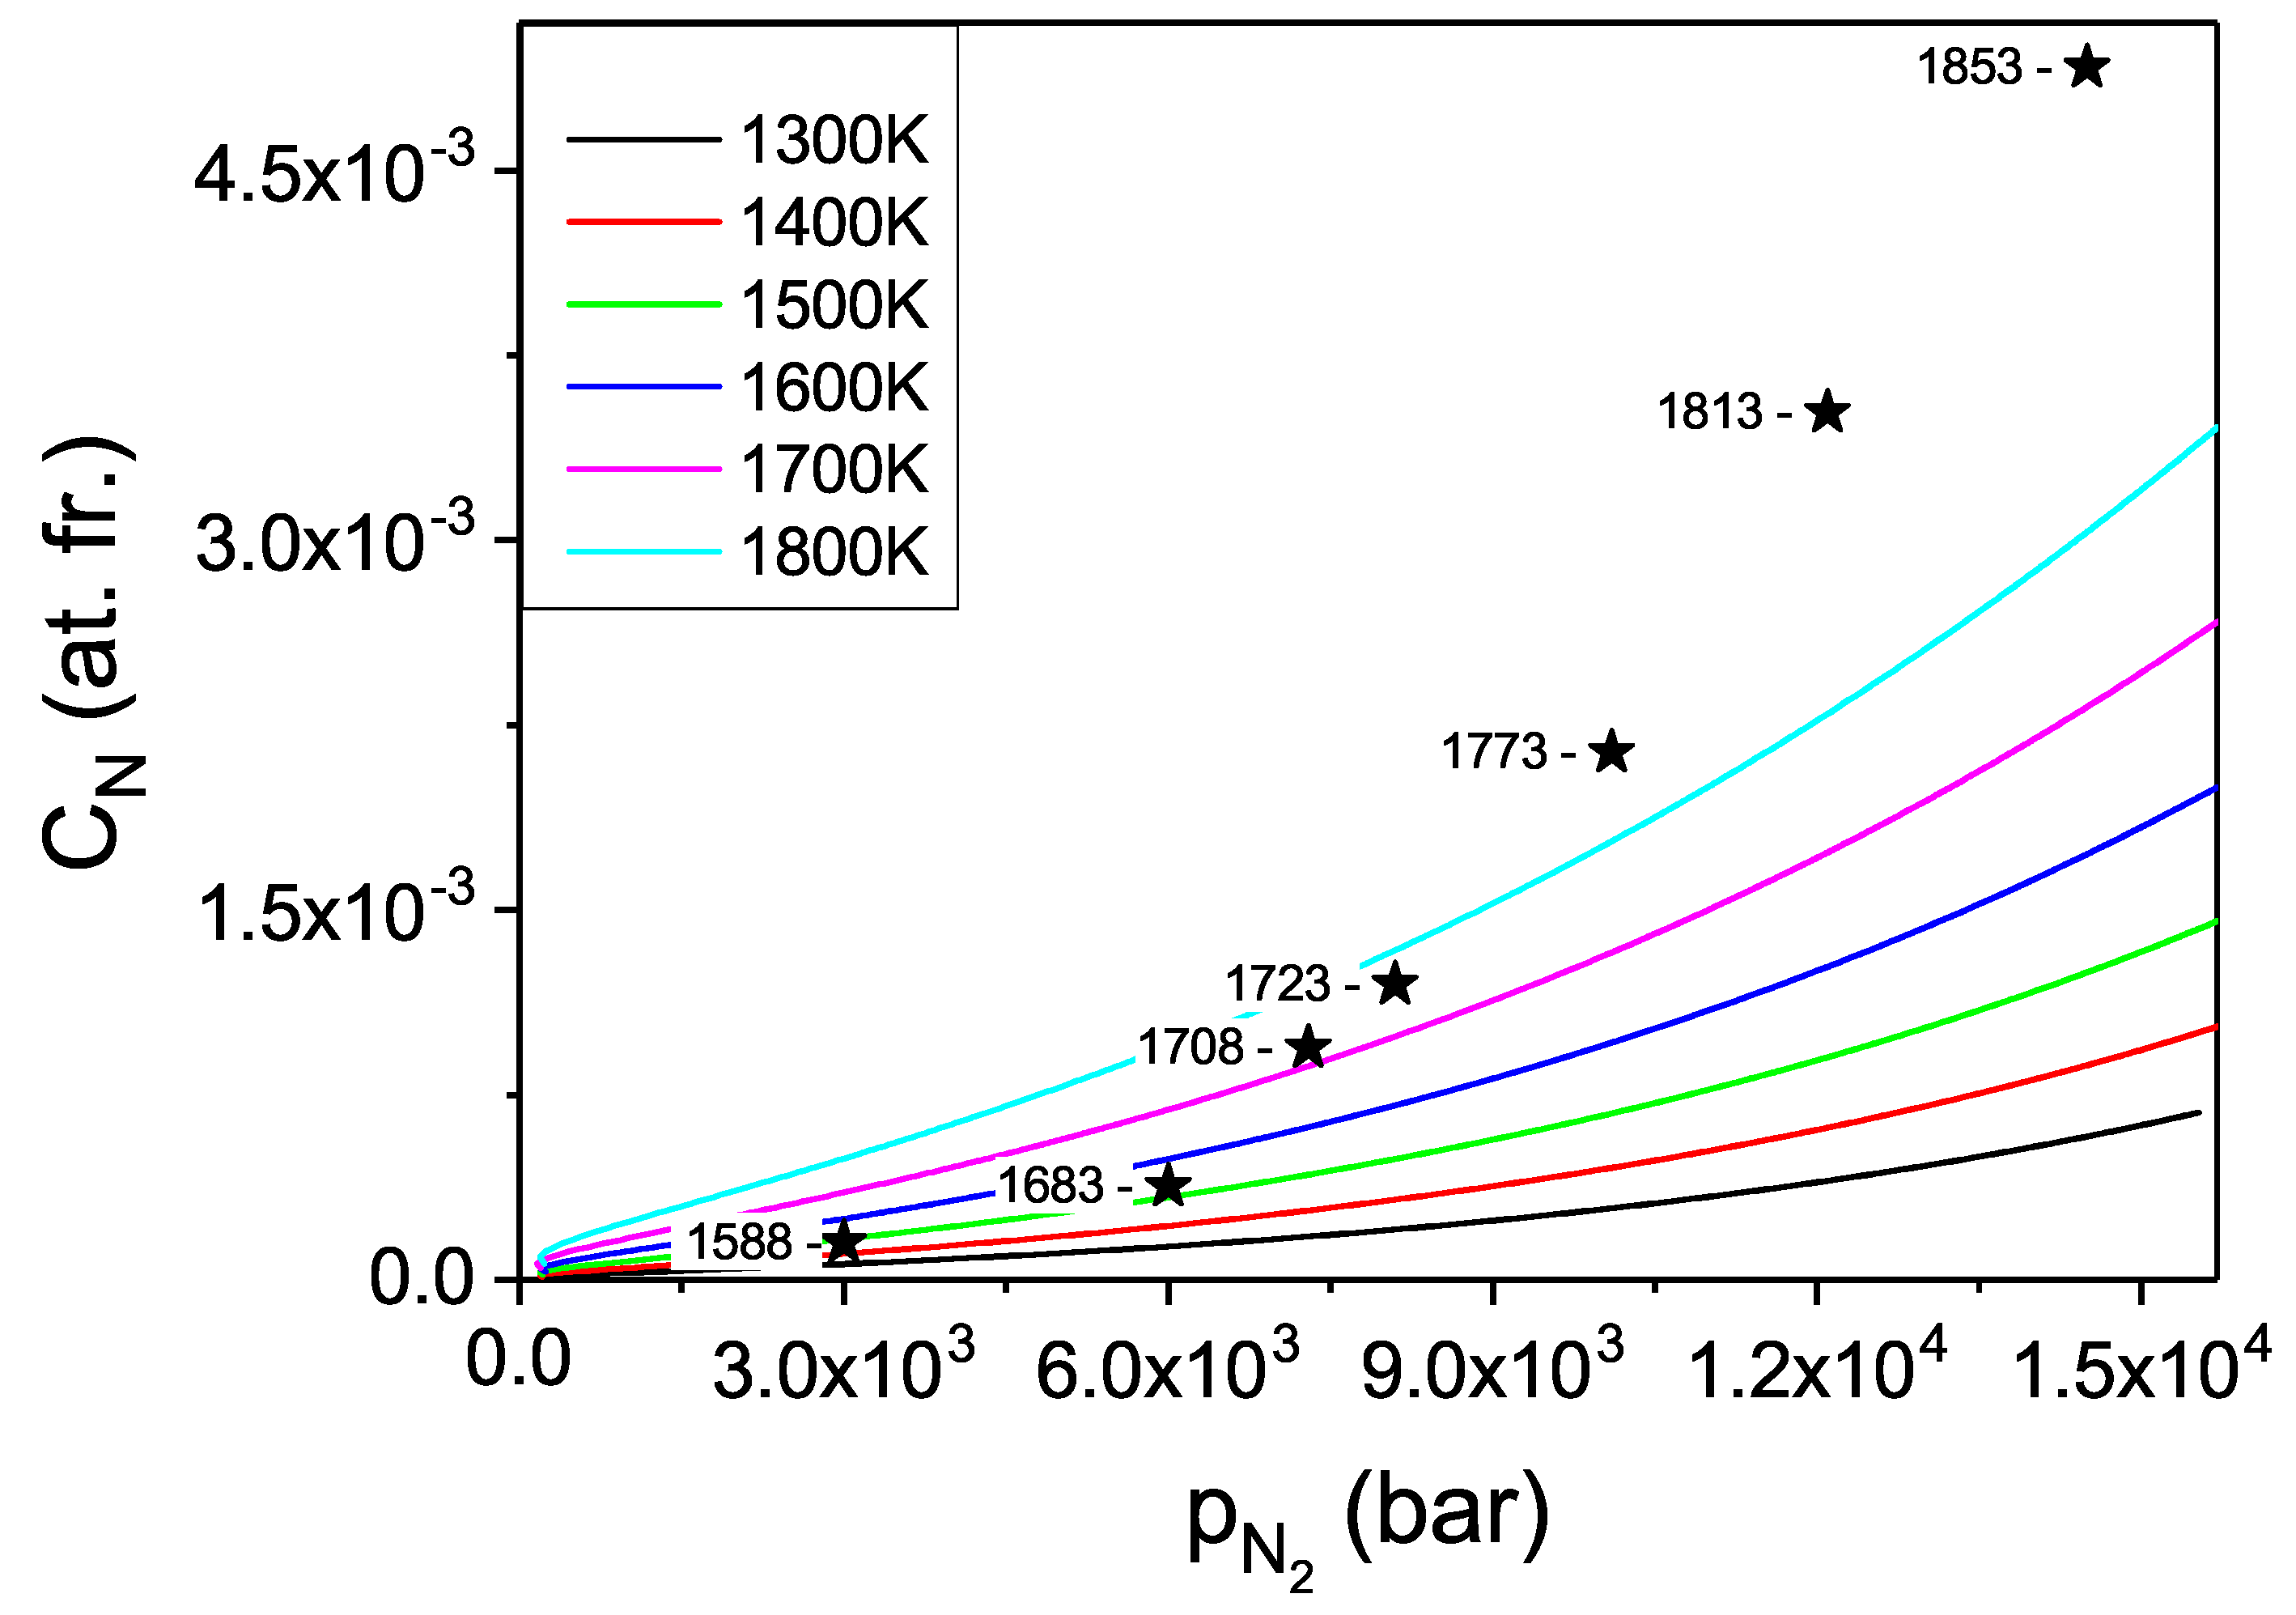
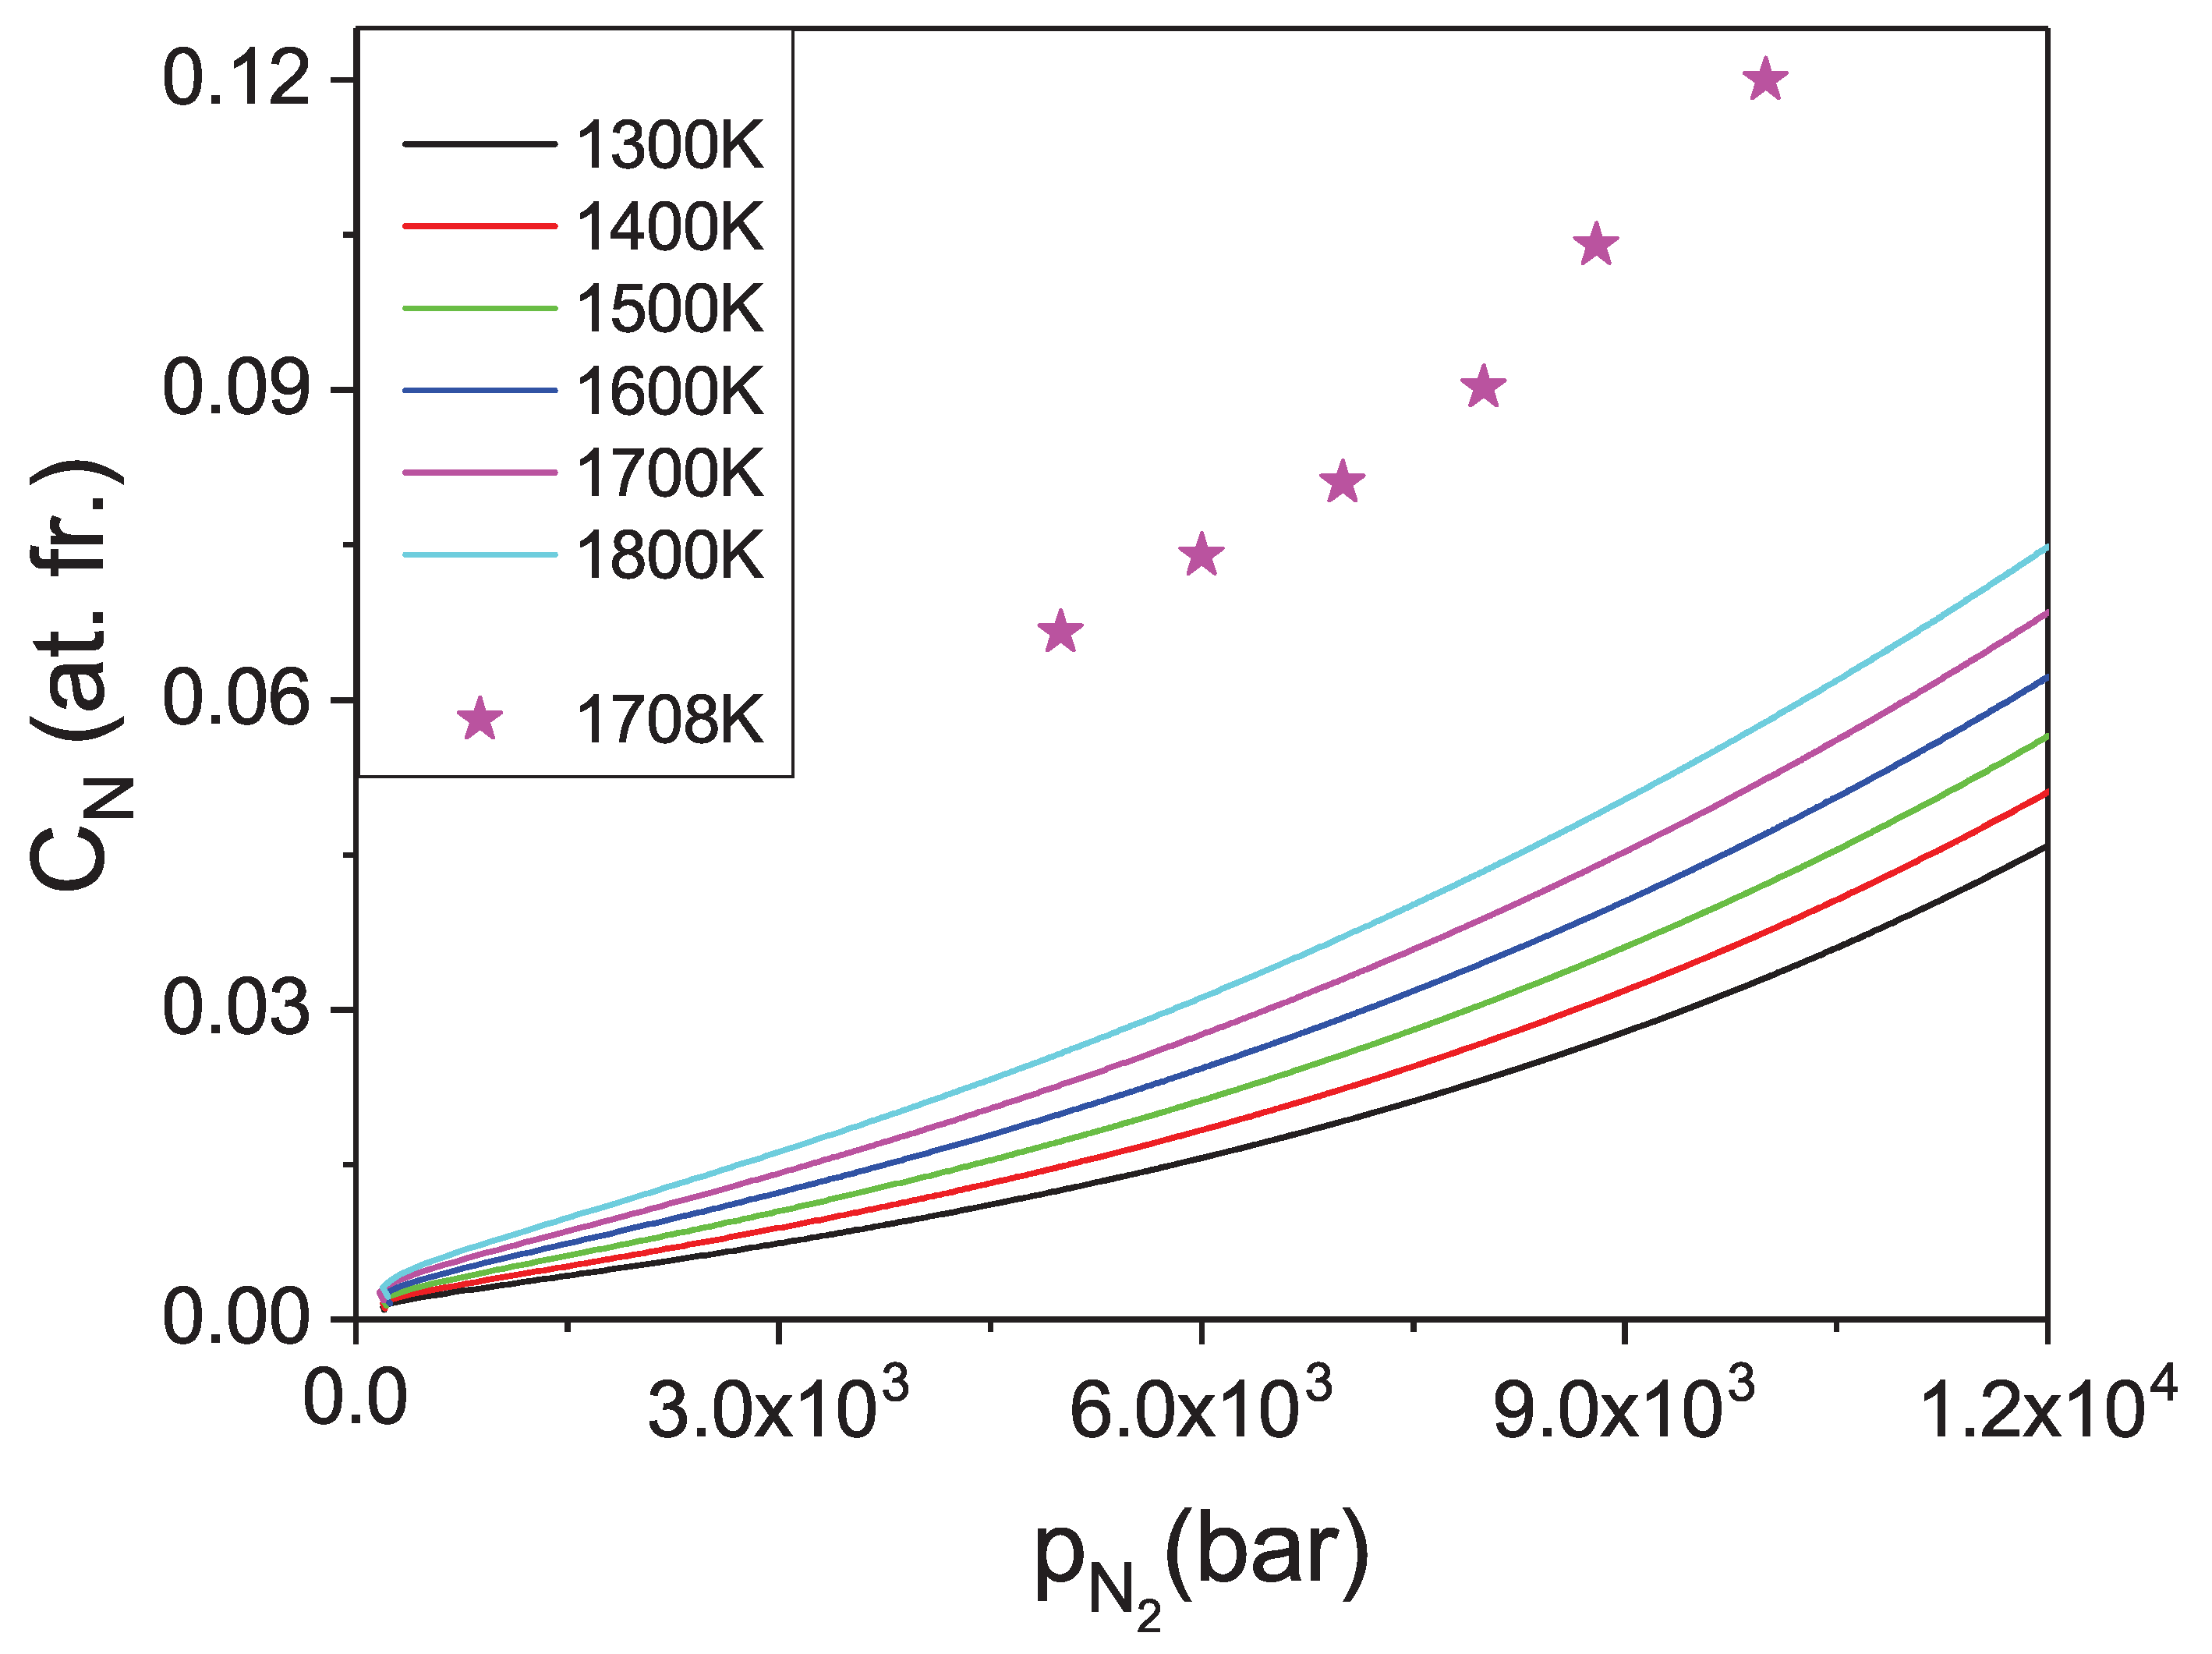
44] was used for the activity to pressure transition. In such a way, the nitrogen solubility as a function of pressure of N
pressure was evaluated and is presented in
Figure 12.
From the presented calculations, it follows that the solubility of nitrogen in liquid Ga is low, and accordingly, high pressures are required to attain technically viable rates of GaN crystallization [
11,
35,
36]. The technically used N
pressure was recovered using nitrogen equation of state for high pressures and high temperatures. It is interesting to mention that thermodynamic activity of a compressed N
gas at technically relevant pressures of the order of 10 kbar, is nominally much higher than the corresponding pressure itself. For example at 10 kbar of the molecular nitrogen pressure, the N
activity is about
at
T = 1300 K, i.e., about 14 times higher than the ideal gas value.
The solubility data [
34] experimentally evaluated for conditions corresponding to
p-T coordinates of Ga-GaN-N
triple points are in reasonably good agreement with the presented
ab initio results. The result is impressive as the obtained concentrations are exponentially dependent on the calculated quantities, i.e., thermodynamic potentials. The agreement is much better for lower concentrations where the ideal solution approximation is more precise. For higher pressures, the calculated data are consistently smaller than the measured ones, which is attributed to deviation from ideal solution approximation.
The calculated concentrations are relatively small, in the range of several atomic promilles, as already determined experimentally. They limit the possible crystallization rates as they are proportional to the equilibrium concentration and the supersaturation. The latter could be established using temperature difference, i.e., the difference in solubility, normalized to the equilibrium concentration. Thus, the temperature dependence is of importance here. As it is shown in
Figure 12, the concentration changes rapidly with the temperature, allowing the obtaining of high supersaturation via temperature difference between the dissolution and the growth zone in the metal. Unfortunately, high supersaturation accelerated growth often leads to pronounced Mullins-Sekerka instability [
45,
46] and consequently deterioration of the quality of the resulting crystals [
47].
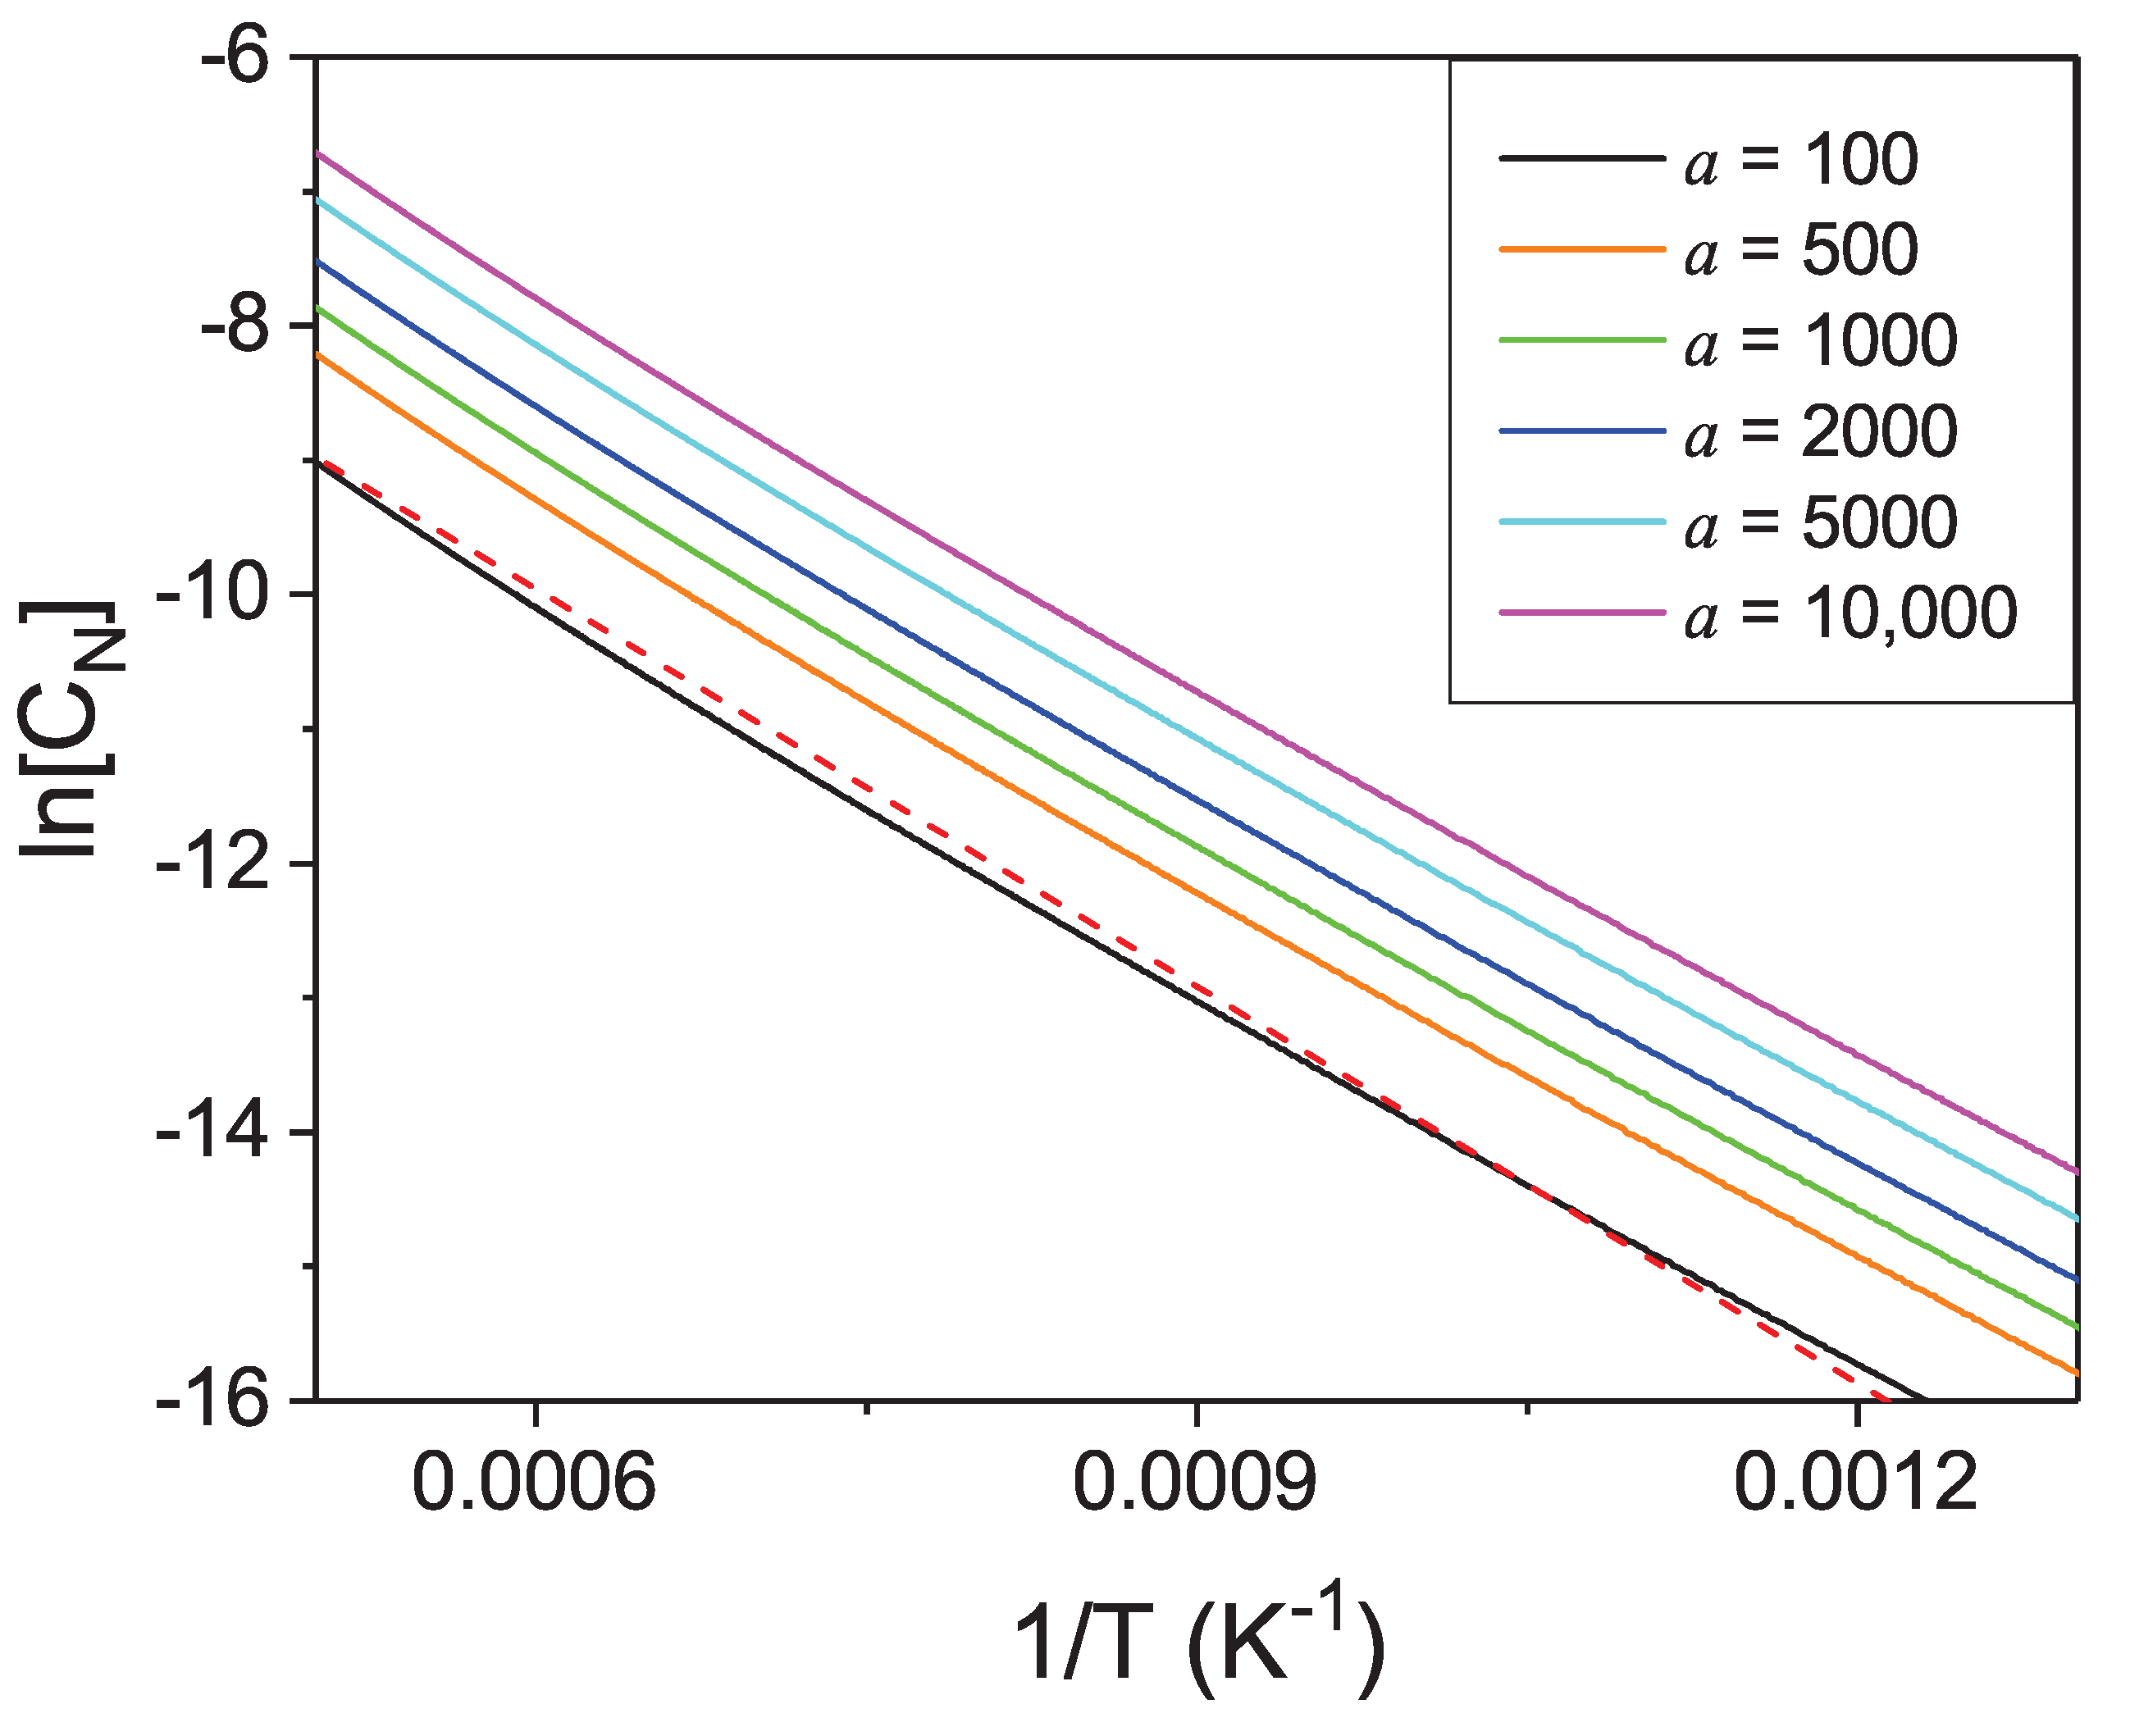
From this point it is interesting to analyze the temperature dependence of nitrogen solubility at constant activity, shown in
Figure 13. These data could be used in the plot of the Van’t Hoff type following the Van’t Hoff relation:
to determine thermodynamic heat of dissolution
.
From the linear fit, the value: eV/atom was obtained what is far from the ab initio obtained value eV/atom. As it is shown, the plot deviates from linear regime significantly. Such dependence is not typical for enthalpy dominated phase transition as the entropy related change of the enthalpy of dissolution is about 21% for the temperature increase to 1800 K. That confirms importance of the entropy related terms in the dissolution of nitrogen in liquid Ga, indicating that the above combined energy-entropy approach is necessary to obtain good agreement with the experimental data.
3.5. Dissolution of Molecular Nitrogen in Metallic Iron
Similar analysis could be made for dissolution of N-in-Fe. The enthalpy of vaporization (i) (in
Section 3.3) for single N atom from Fe solution consists of the two contributions. First is the energy of dissolution, equal to
eV/atom. Its value favors dissolution of nitrogen in metallic Fe. The second is zero-point energy difference, in the solution
eV, and already used molecular value in the vapor
eV, i.e., equal to
eV. Altogether, the enthalpy of dissolution is
eV.
The entropy of dissolution may be obtained from
ab initio data. The volume associated with N atom in the Fe cluster is
Å
. Using the ideal gas volume for normal pressure and temperature
Å
the dissolution free energy change could be obtained from Equation (
5) to get
eV. Thus, this value is only slightly different from that obtained for liquid Ga.
The entropy terms could be obtained following these for the previous case. The enthalpy difference for vapor is identical and equal to:
. The free energy difference of gaseous nitrogen is given by Equation (
7). The remaining solid contributions may be obtained from Equation (
16), using the Debye temperature which for N dissolved in metallic Fe was equal
K.
The pressure dependence of the N concentration in the Fe solvent could be obtained. Such data are presented in
Figure 14. Please note that in the presented diagrams the pressure related coordinate represents the chemical potential of compressed N
gas, i.e., the activity. The explicit pressure dependence should be recovered expressing the pressure as a function of activity via nitrogen equation of state.
From the obtained data it follows that the concentration values are more than one order of magnitude higher than in case of gallium. Thus, the Fe-based solution seems to be a much better option for efficient crystallization of large GaN single crystals. More physical insight may be obtained using technically relevant variable i.e., the pressure, which is recalculated from activity using the equation of state [
43,
44,
45]. The corresponding results are presented in
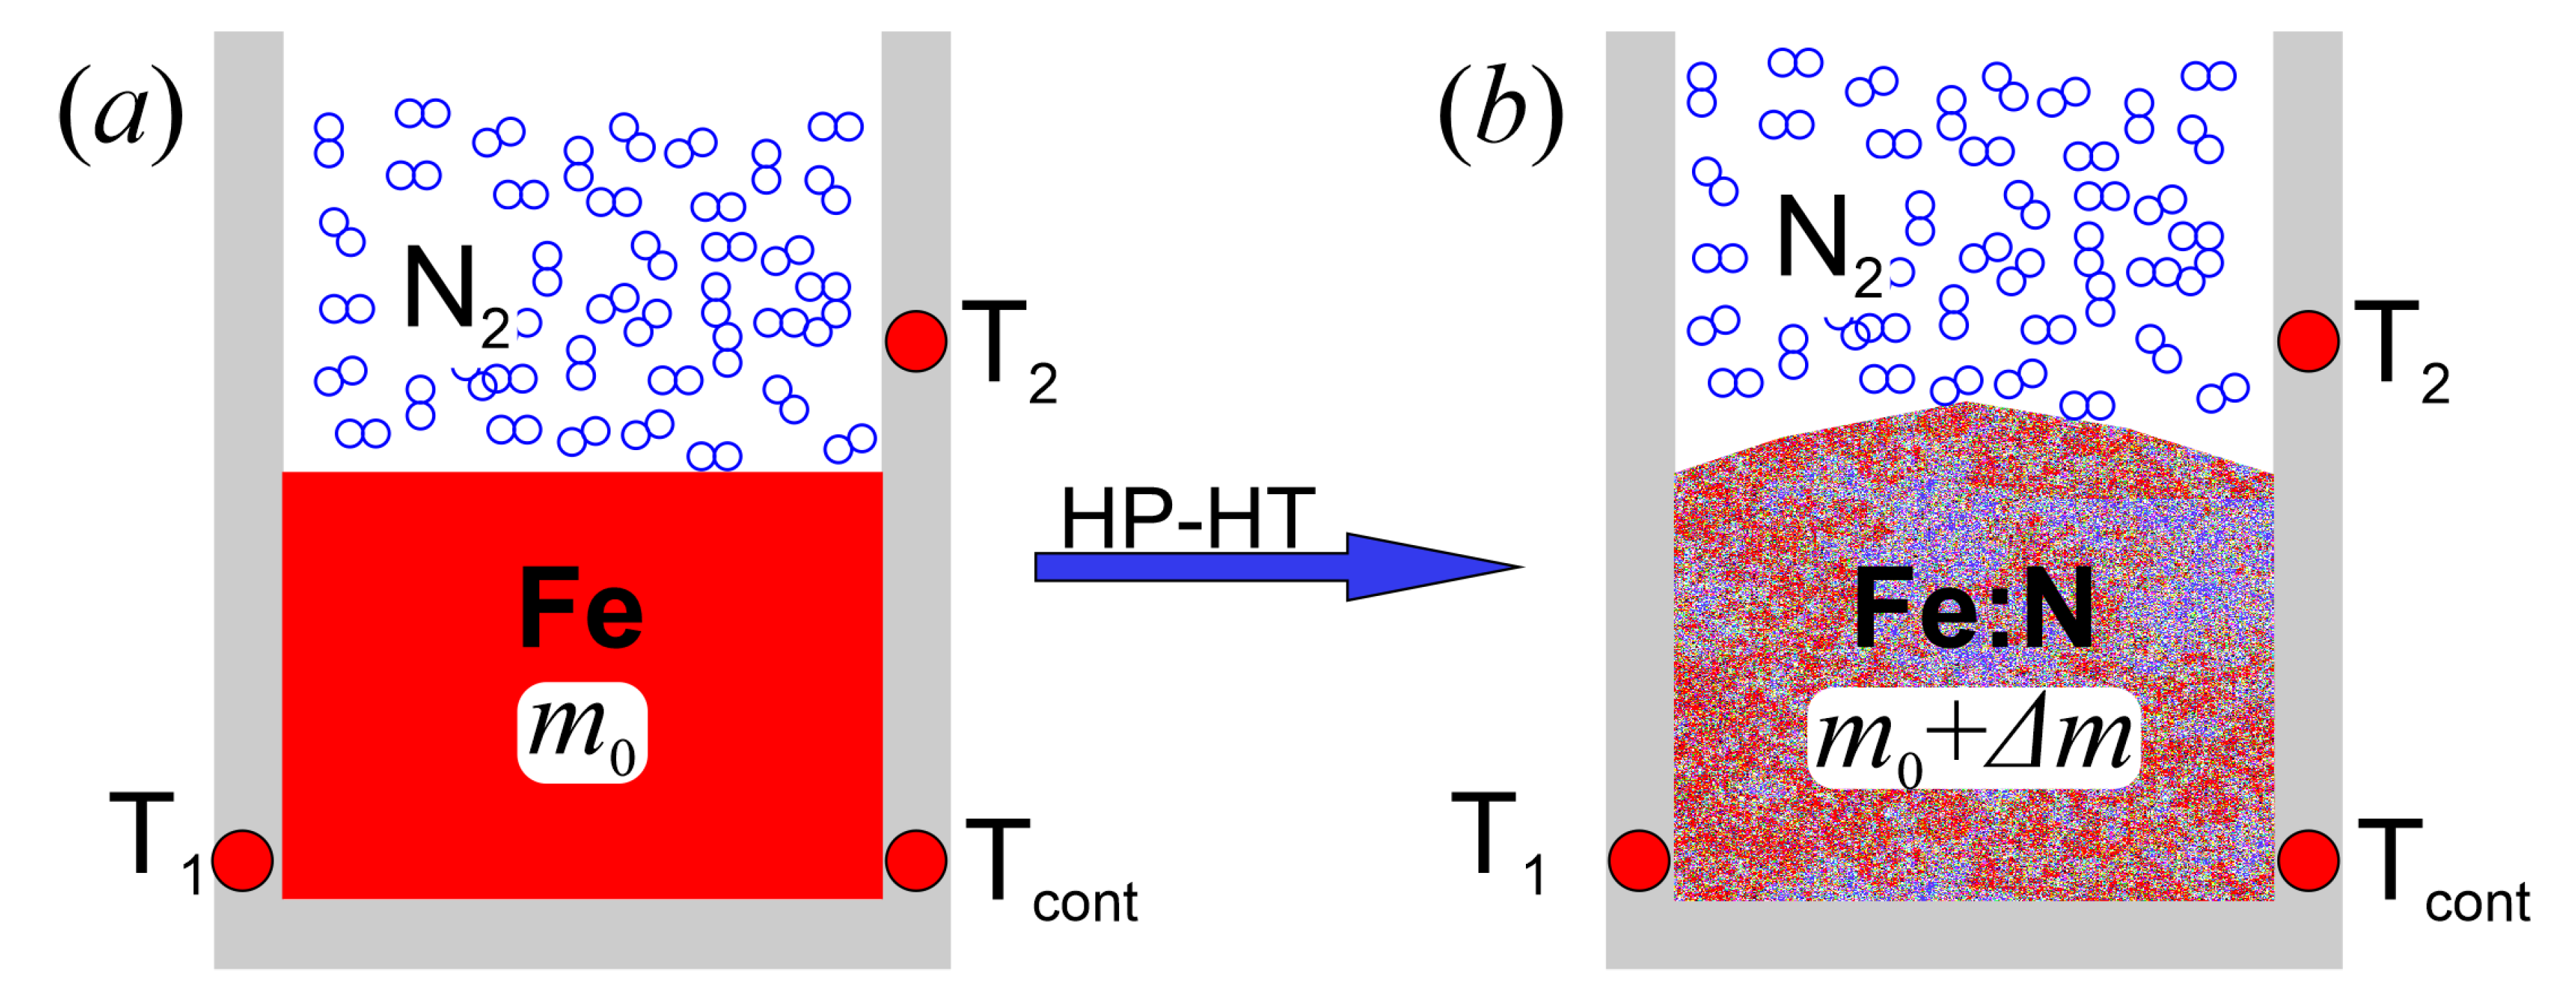
Figure 15. The experimental solubility data obtained according to the procedure described in
Section 2.2, for a constant temperature of 1708 K, are also included into the diagram. The experiment clearly confirmed high concentration of N in the Fe metal. Also, the character of the isothermal pressure dependence is well reproduced.
The obtained theoretical solubility is approximately half of the measured values. This is most likely related to the two factors: first mentioned in Ga case, is related to nonideality of the solution. The effective interaction is much stronger in the case of Fe than in the case of Ga. Therefore the interaction related deviation from ideality is larger. Second factor is related to the enthalpy calculations. In the above ab initio modeling only single N atom was inserted in the Fe cluster. In fact in the concentration range of 10 at.%, additional nitrogen atoms may be present in the neighborhood. The N-N attraction is strong, which leads to the decrease of the system energy and consequently lowering its chemical potential thus increasing the nitrogen concentration as observed experimentally.
The theoretical evaluations indicate that the solubility of nitrogen at technically possible limit conditions for large volume high temperature gas reactors, i.e., 10 kbar attains considerable values of about 5.8 at.% at T = 1800 K. These data are only slightly reduced by the lower temperatures, i.e., about 3.0 at.% at T = 1300 K. Thus, the temperature increase has drastically smaller influence on the concentration of N in iron than in gallium. This can complicate establishing supersaturation in the growth solution necessary for crystallization by application of the temperature gradient.
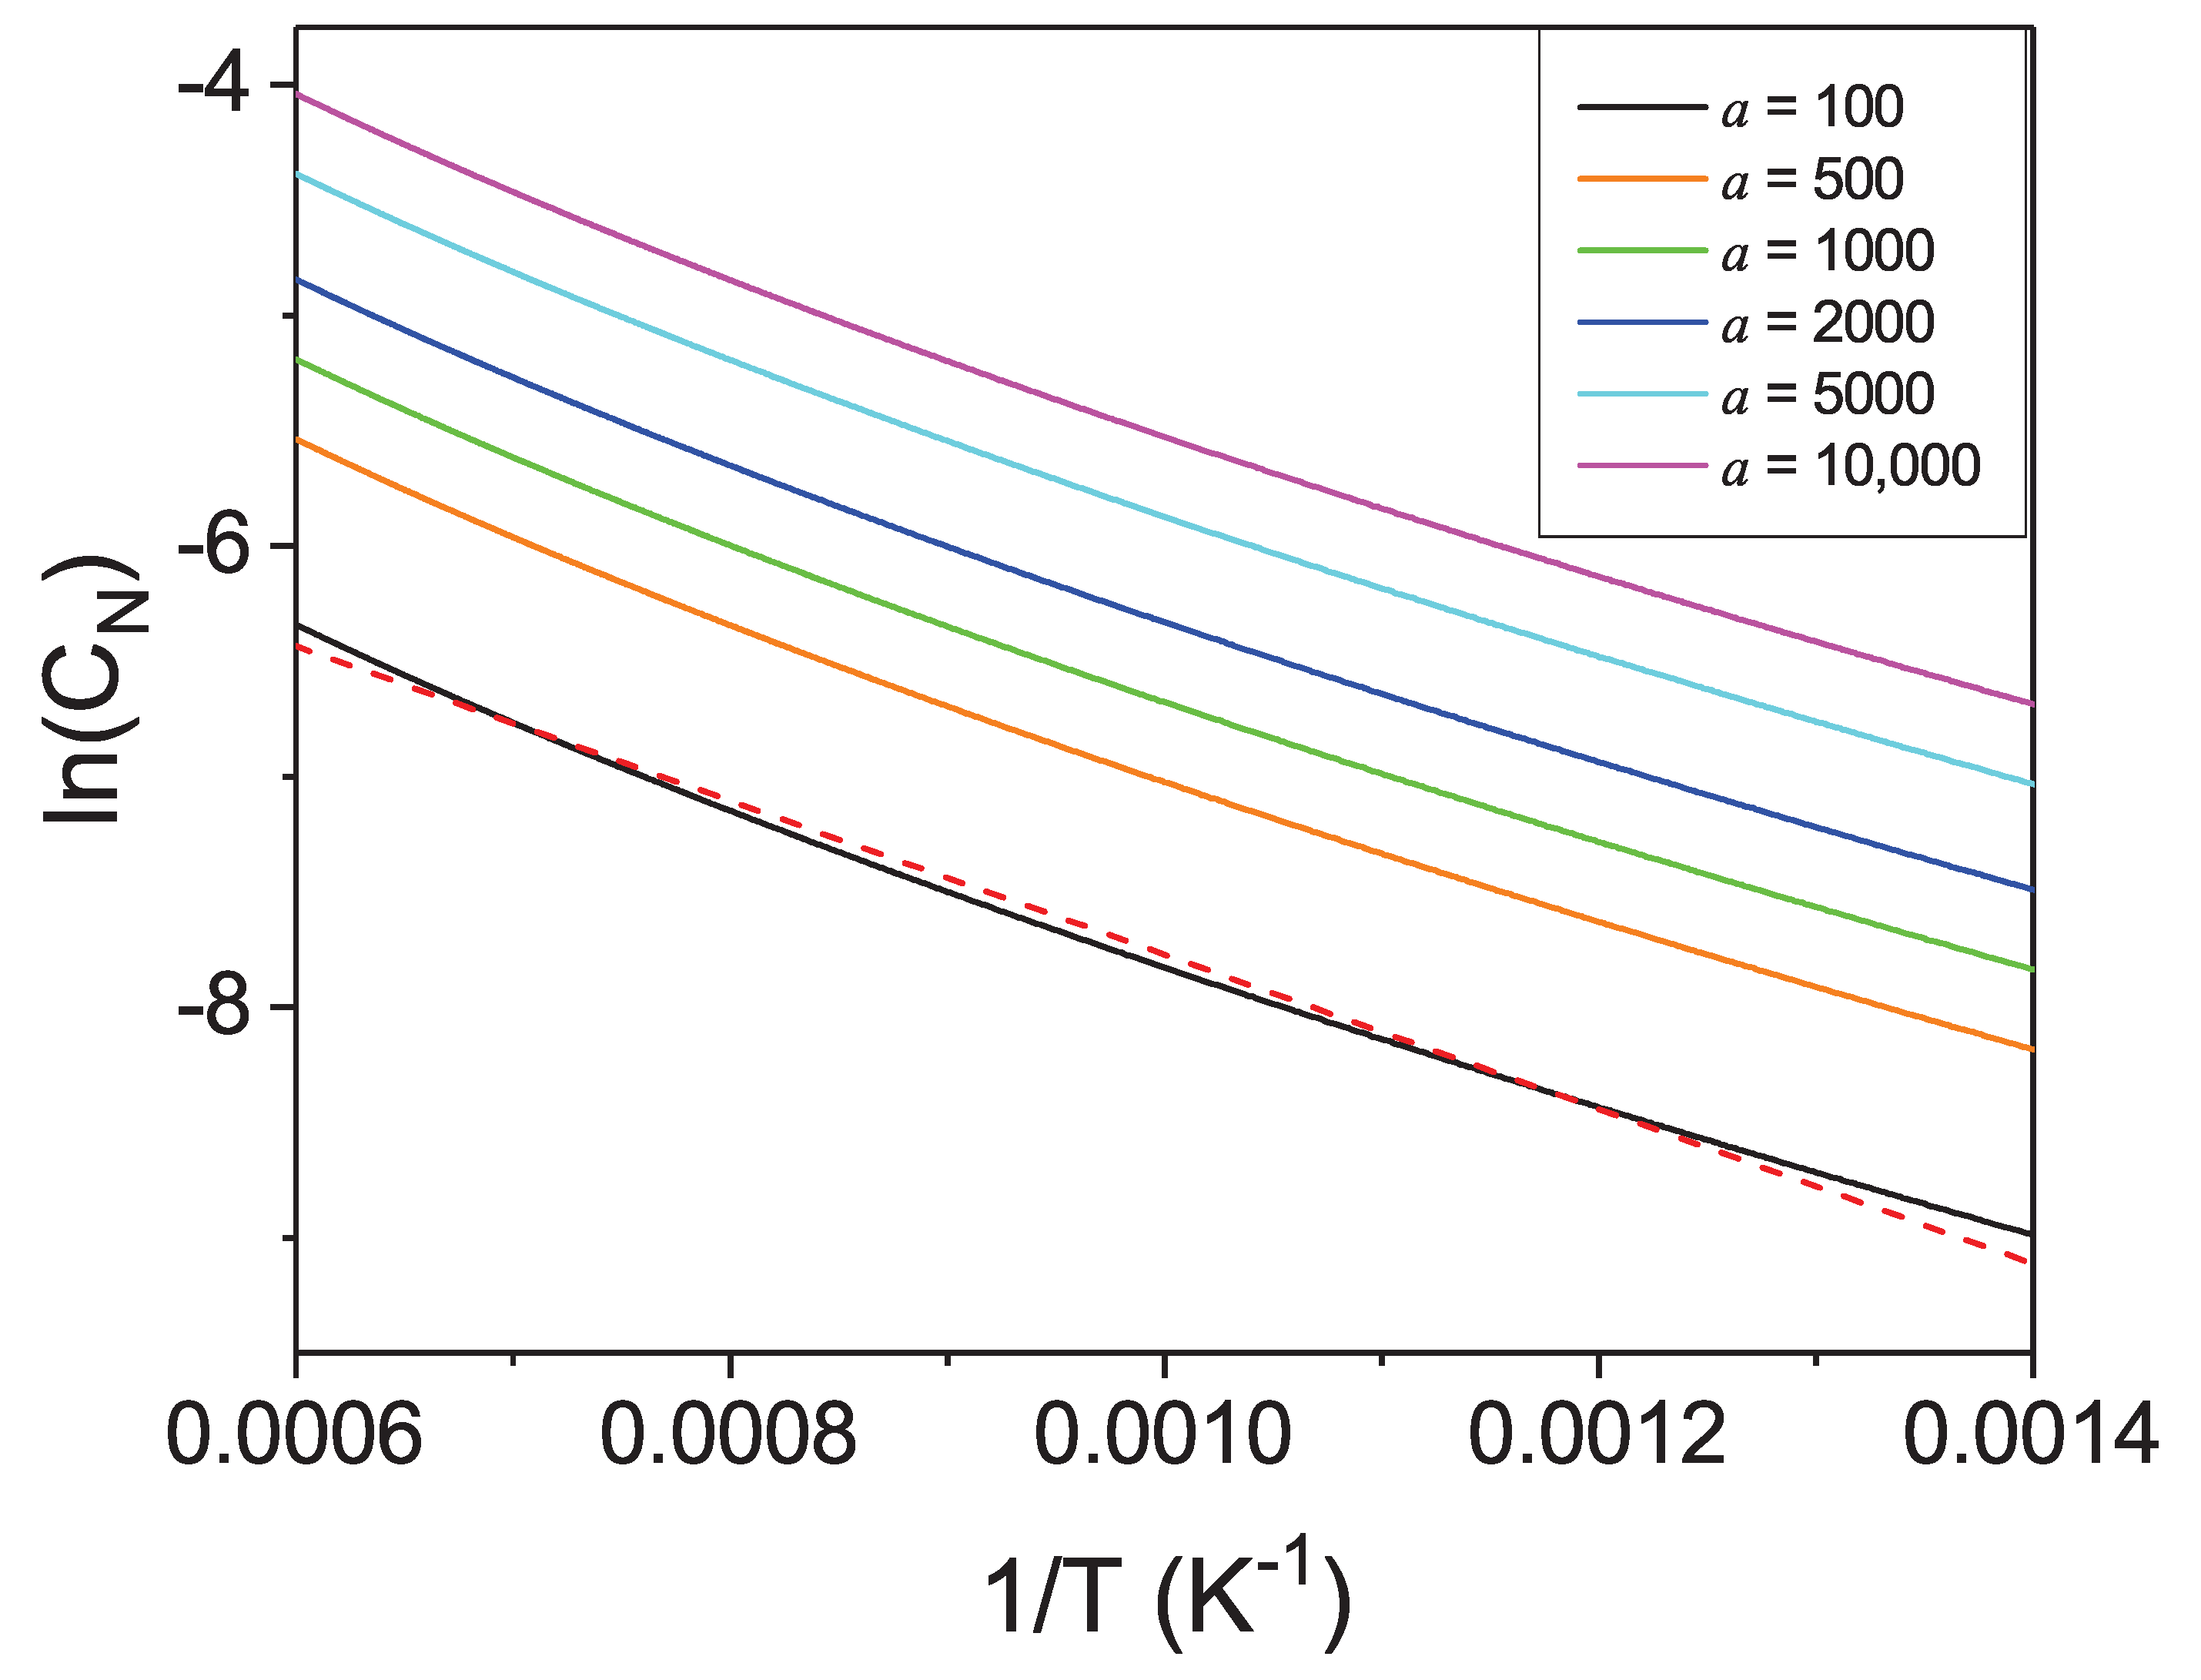
The temperature dependence may be studied using concentration vs inverse temperature plot for selected values of nitrogen activity as shown in
Figure 16. The Van’t Hoff relation (Equation (
28)) may be again used to determine thermodynamic heat of dissolution
. From the linear fit the following value was obtained
eV. This is much smaller than the
ab initio obtained value
eV that indicates that the entropy related, temperature-dependent term drastically lowers the enthalpy of dissolution. Additionally, the solubility does not follow the linear plot of the Van’t Hoff type, similarly to gallium. Even though the interaction term is approximately four times smaller than for gallium, the deviation from linearity is similar that confirms the role of entropy related terms in the dissolution of nitrogen in liquid metals.
The observed temperature dependence poses more stringent requirement for design of crystal growth apparatus in case of Fe solvent. In order to obtain a comparable supersaturation, much larger temperature difference than for gallium, should be applied. This could be beneficial as the best conditions for the growth is small supersaturation. In perspective, large high-quality crystals of GaN could be obtained from solutions in liquid Fe.


 ,
, 


