
Concrete Examination of 100-Year-Old Bridge Structure above the Kłodnica River Flowing through the Agglomeration of Upper Silesia in Gliwice: A Case Study

 ,
,  ,
,  ,
,  ,
, 
Abstract
:1. Introduction
1.1. Bridge Destruction, Processes, and the Life Cycle of the Bridge
1.2. The River, the Region, and Impurities
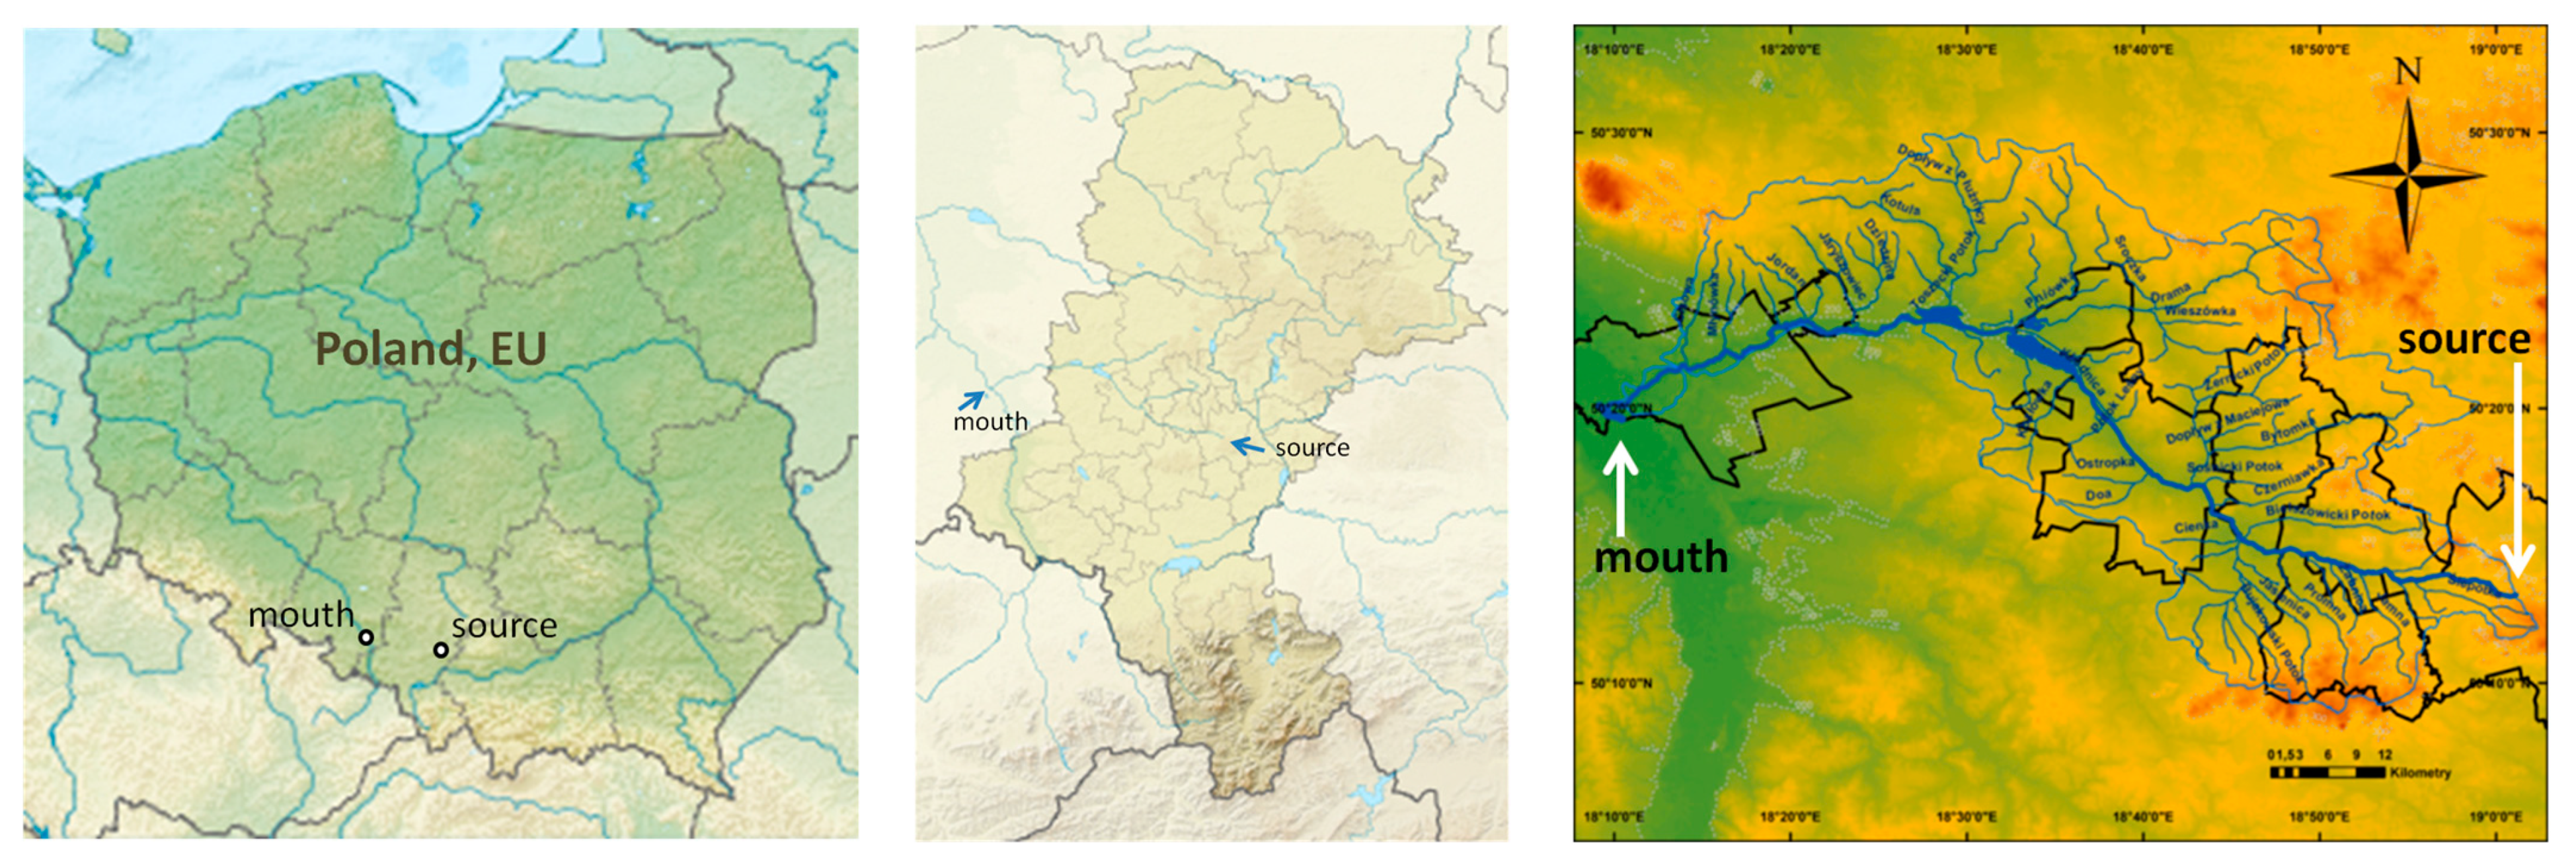
1.3. Description of the Studied Areas—The Kłodnica River and the Examined Bridge
1.3.1. Kłodnica River
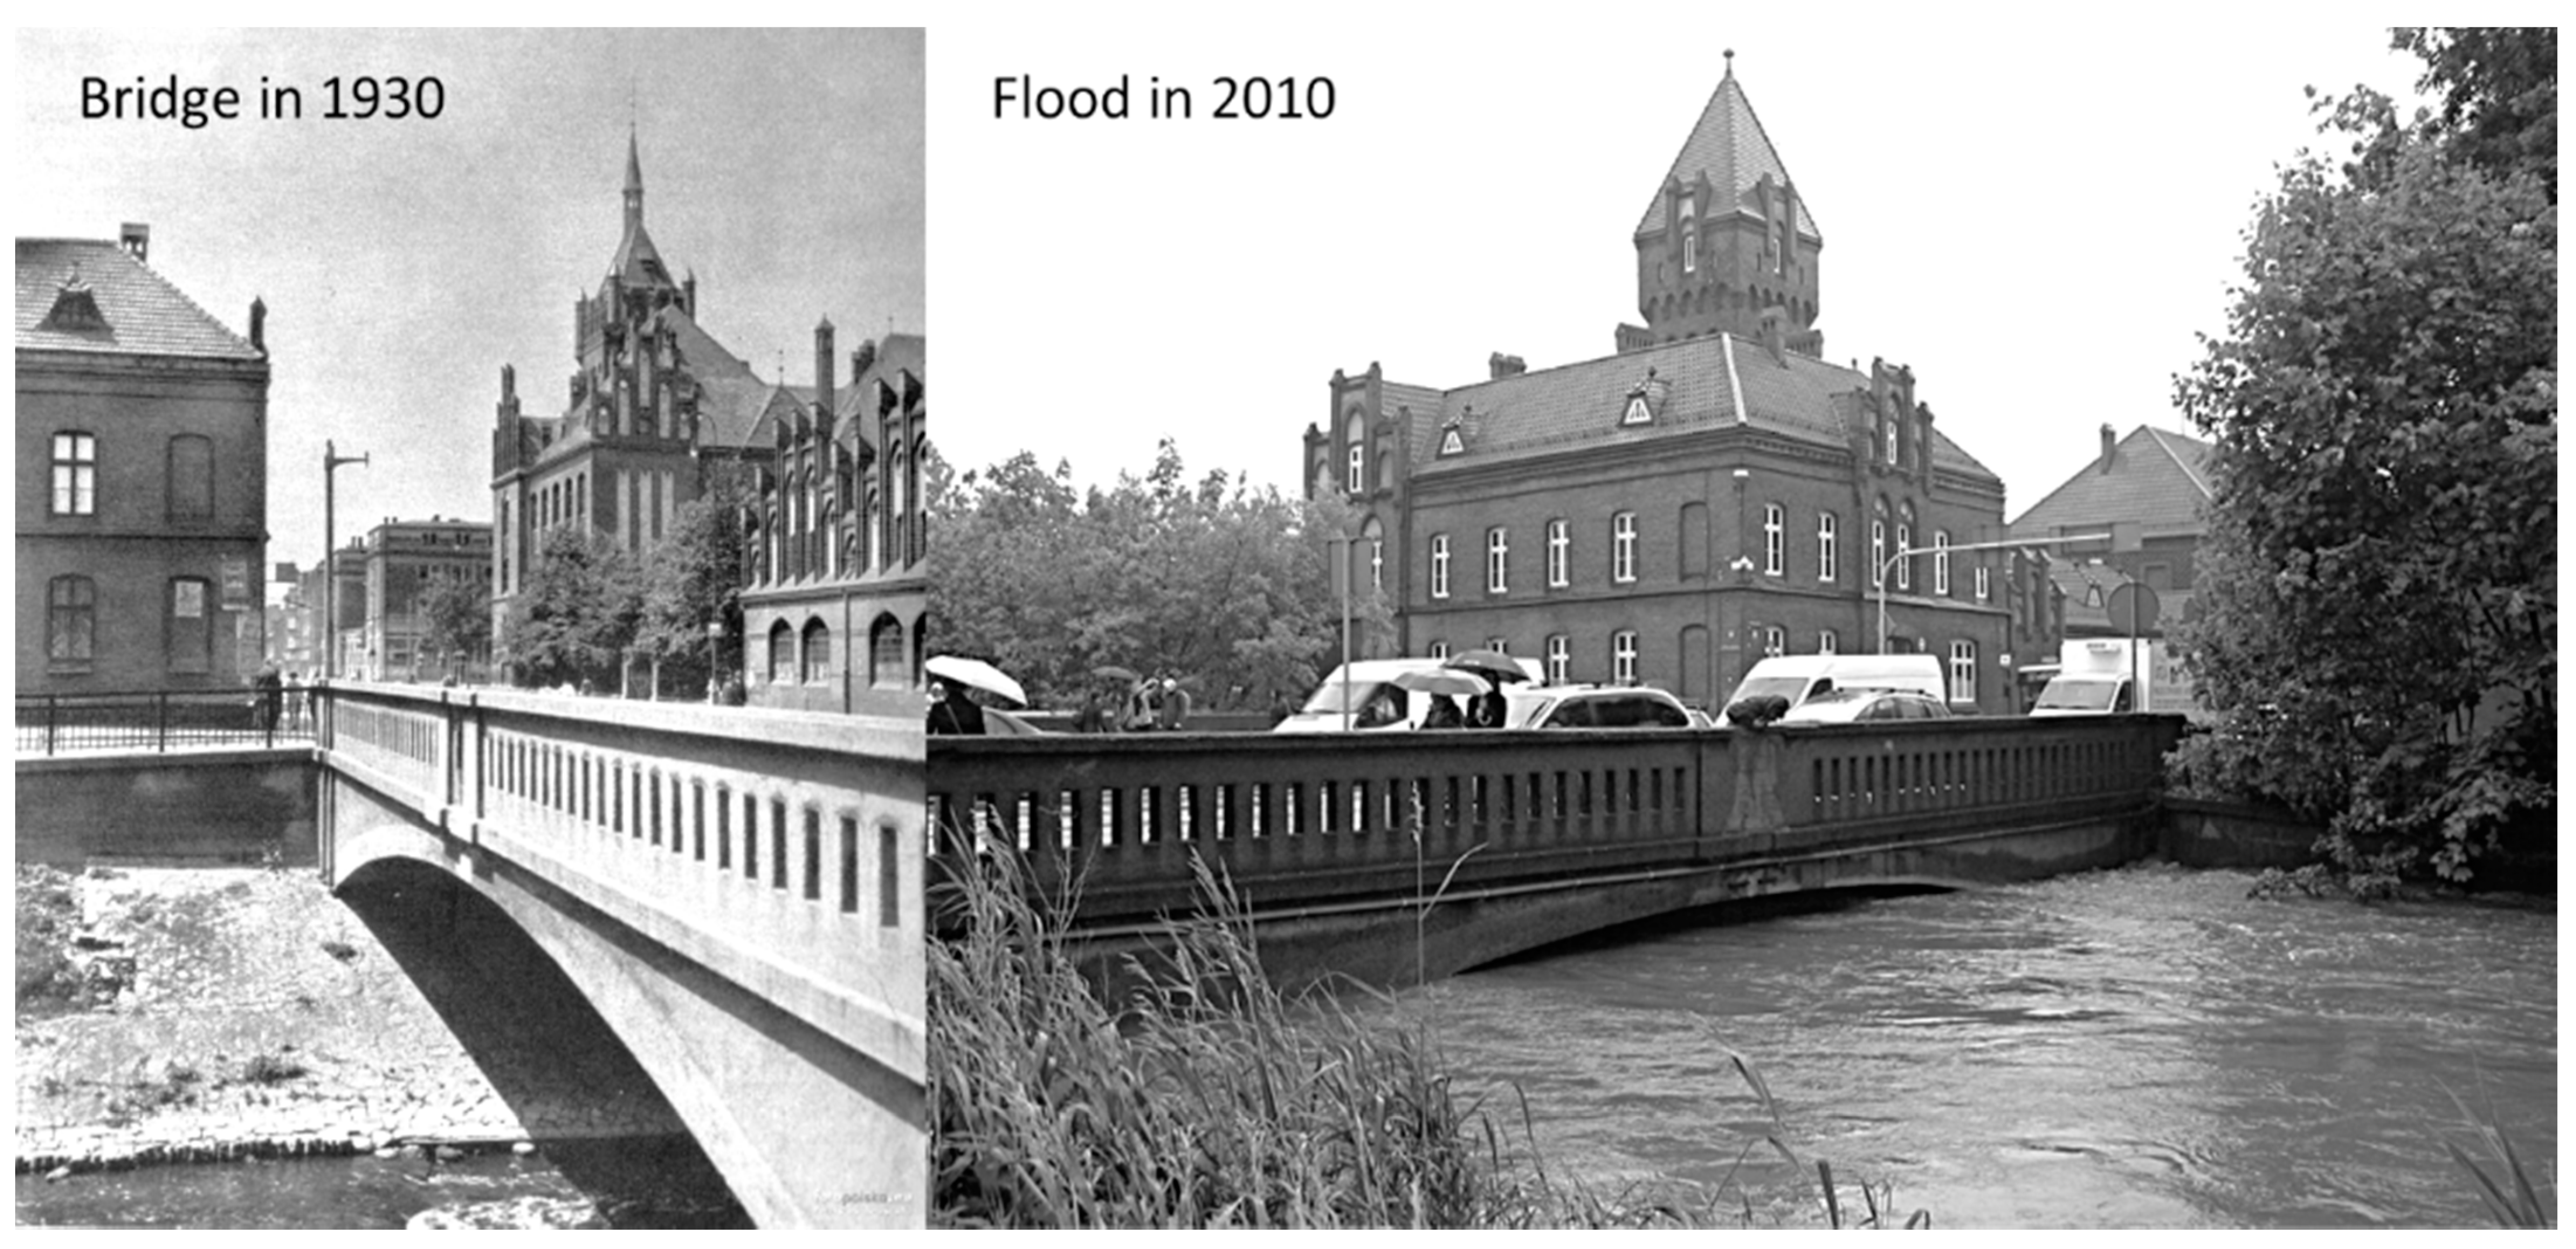
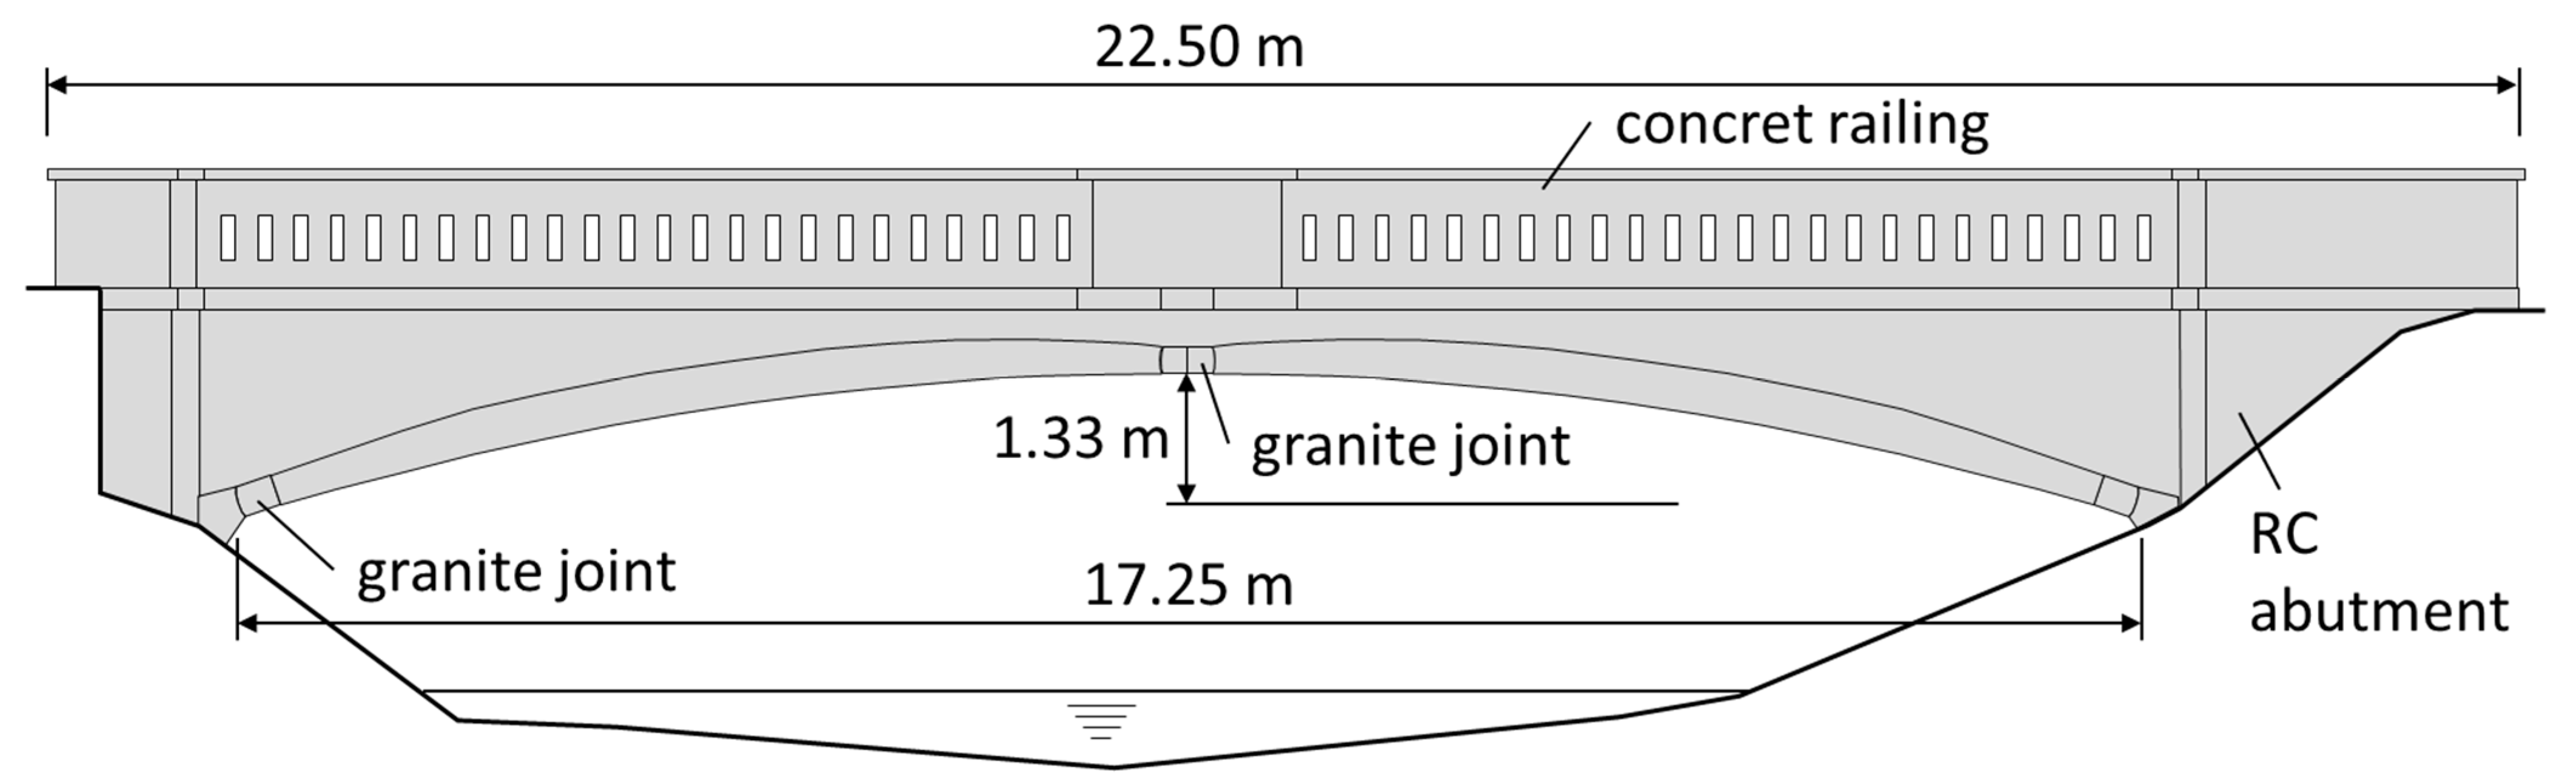
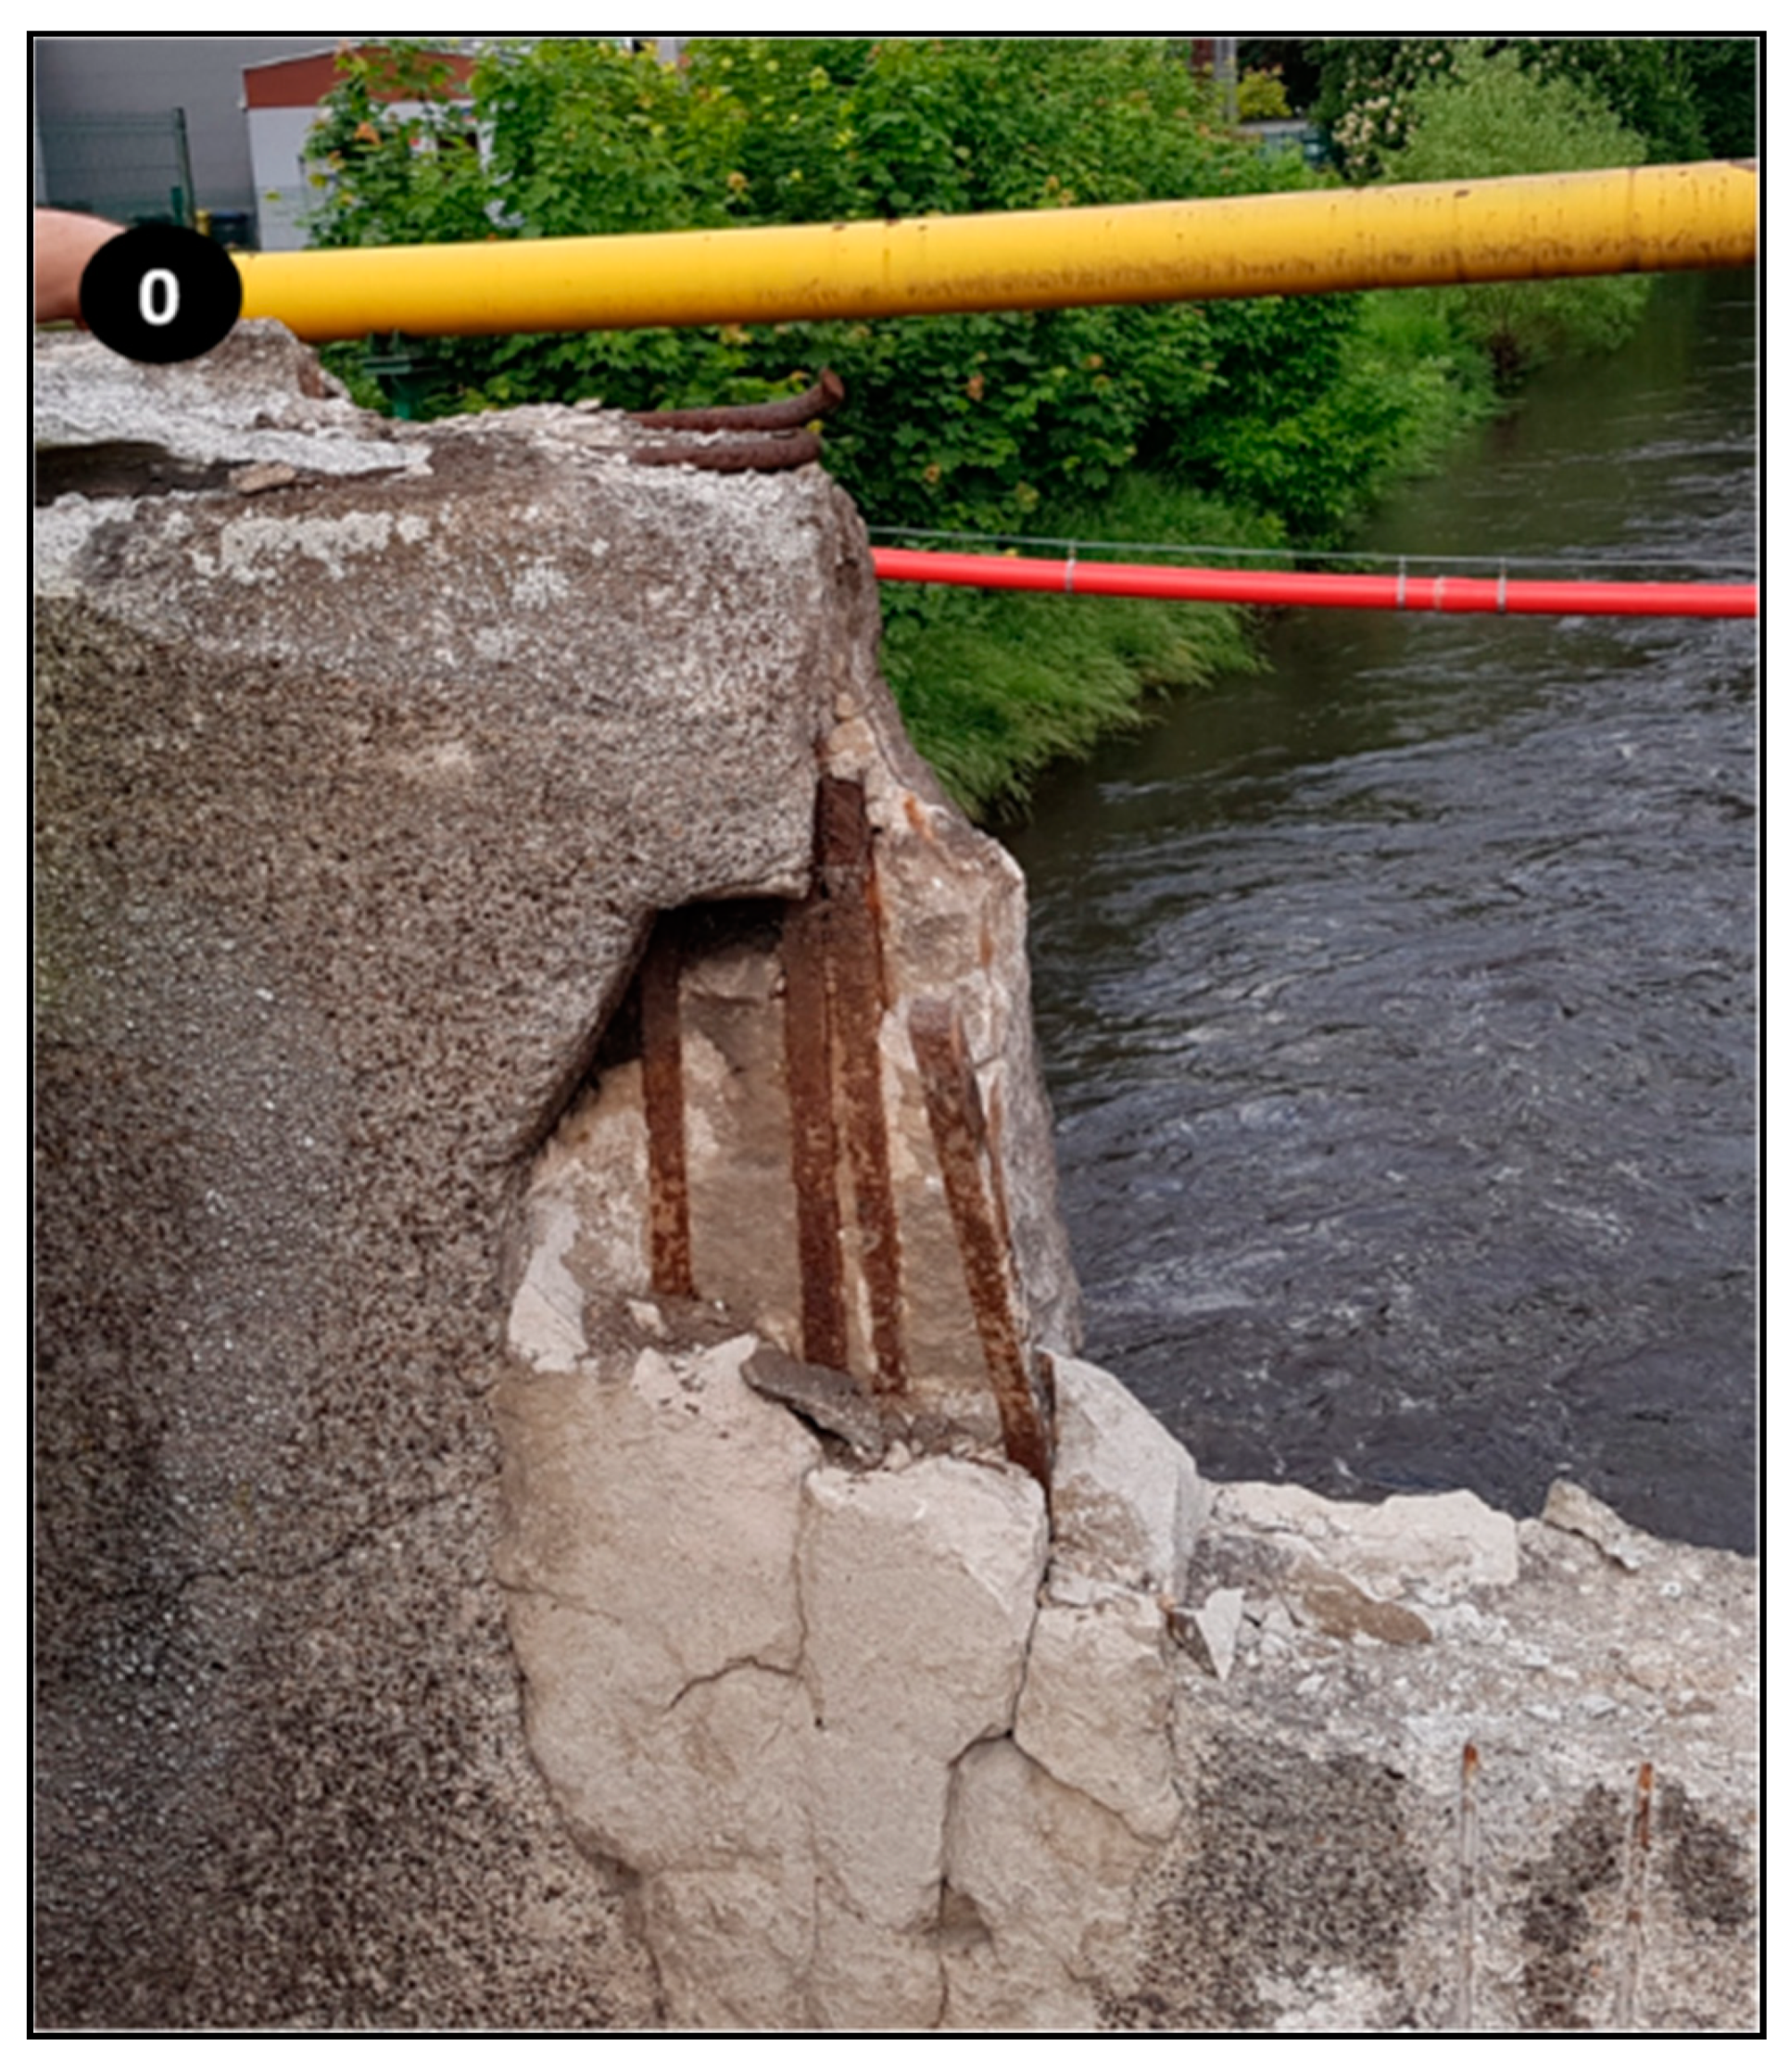
1.3.2. The Examined Bridge
2. Materials and Methods
2.1. Concrete Composition
2.2. pH Examination
2.3. Free Chloride Content Examination
2.4. Conductivity (Salinity) Examination
2.5. XRD (X-ray Diffraction) Examination
2.6. SEM (Scanning Electron Microscopy) Examination
2.7. Metals Determination
3. Results and Discussion
3.1. Concrete Composition and pH of Concrete Suspensions
3.2. Free Chlorides Content
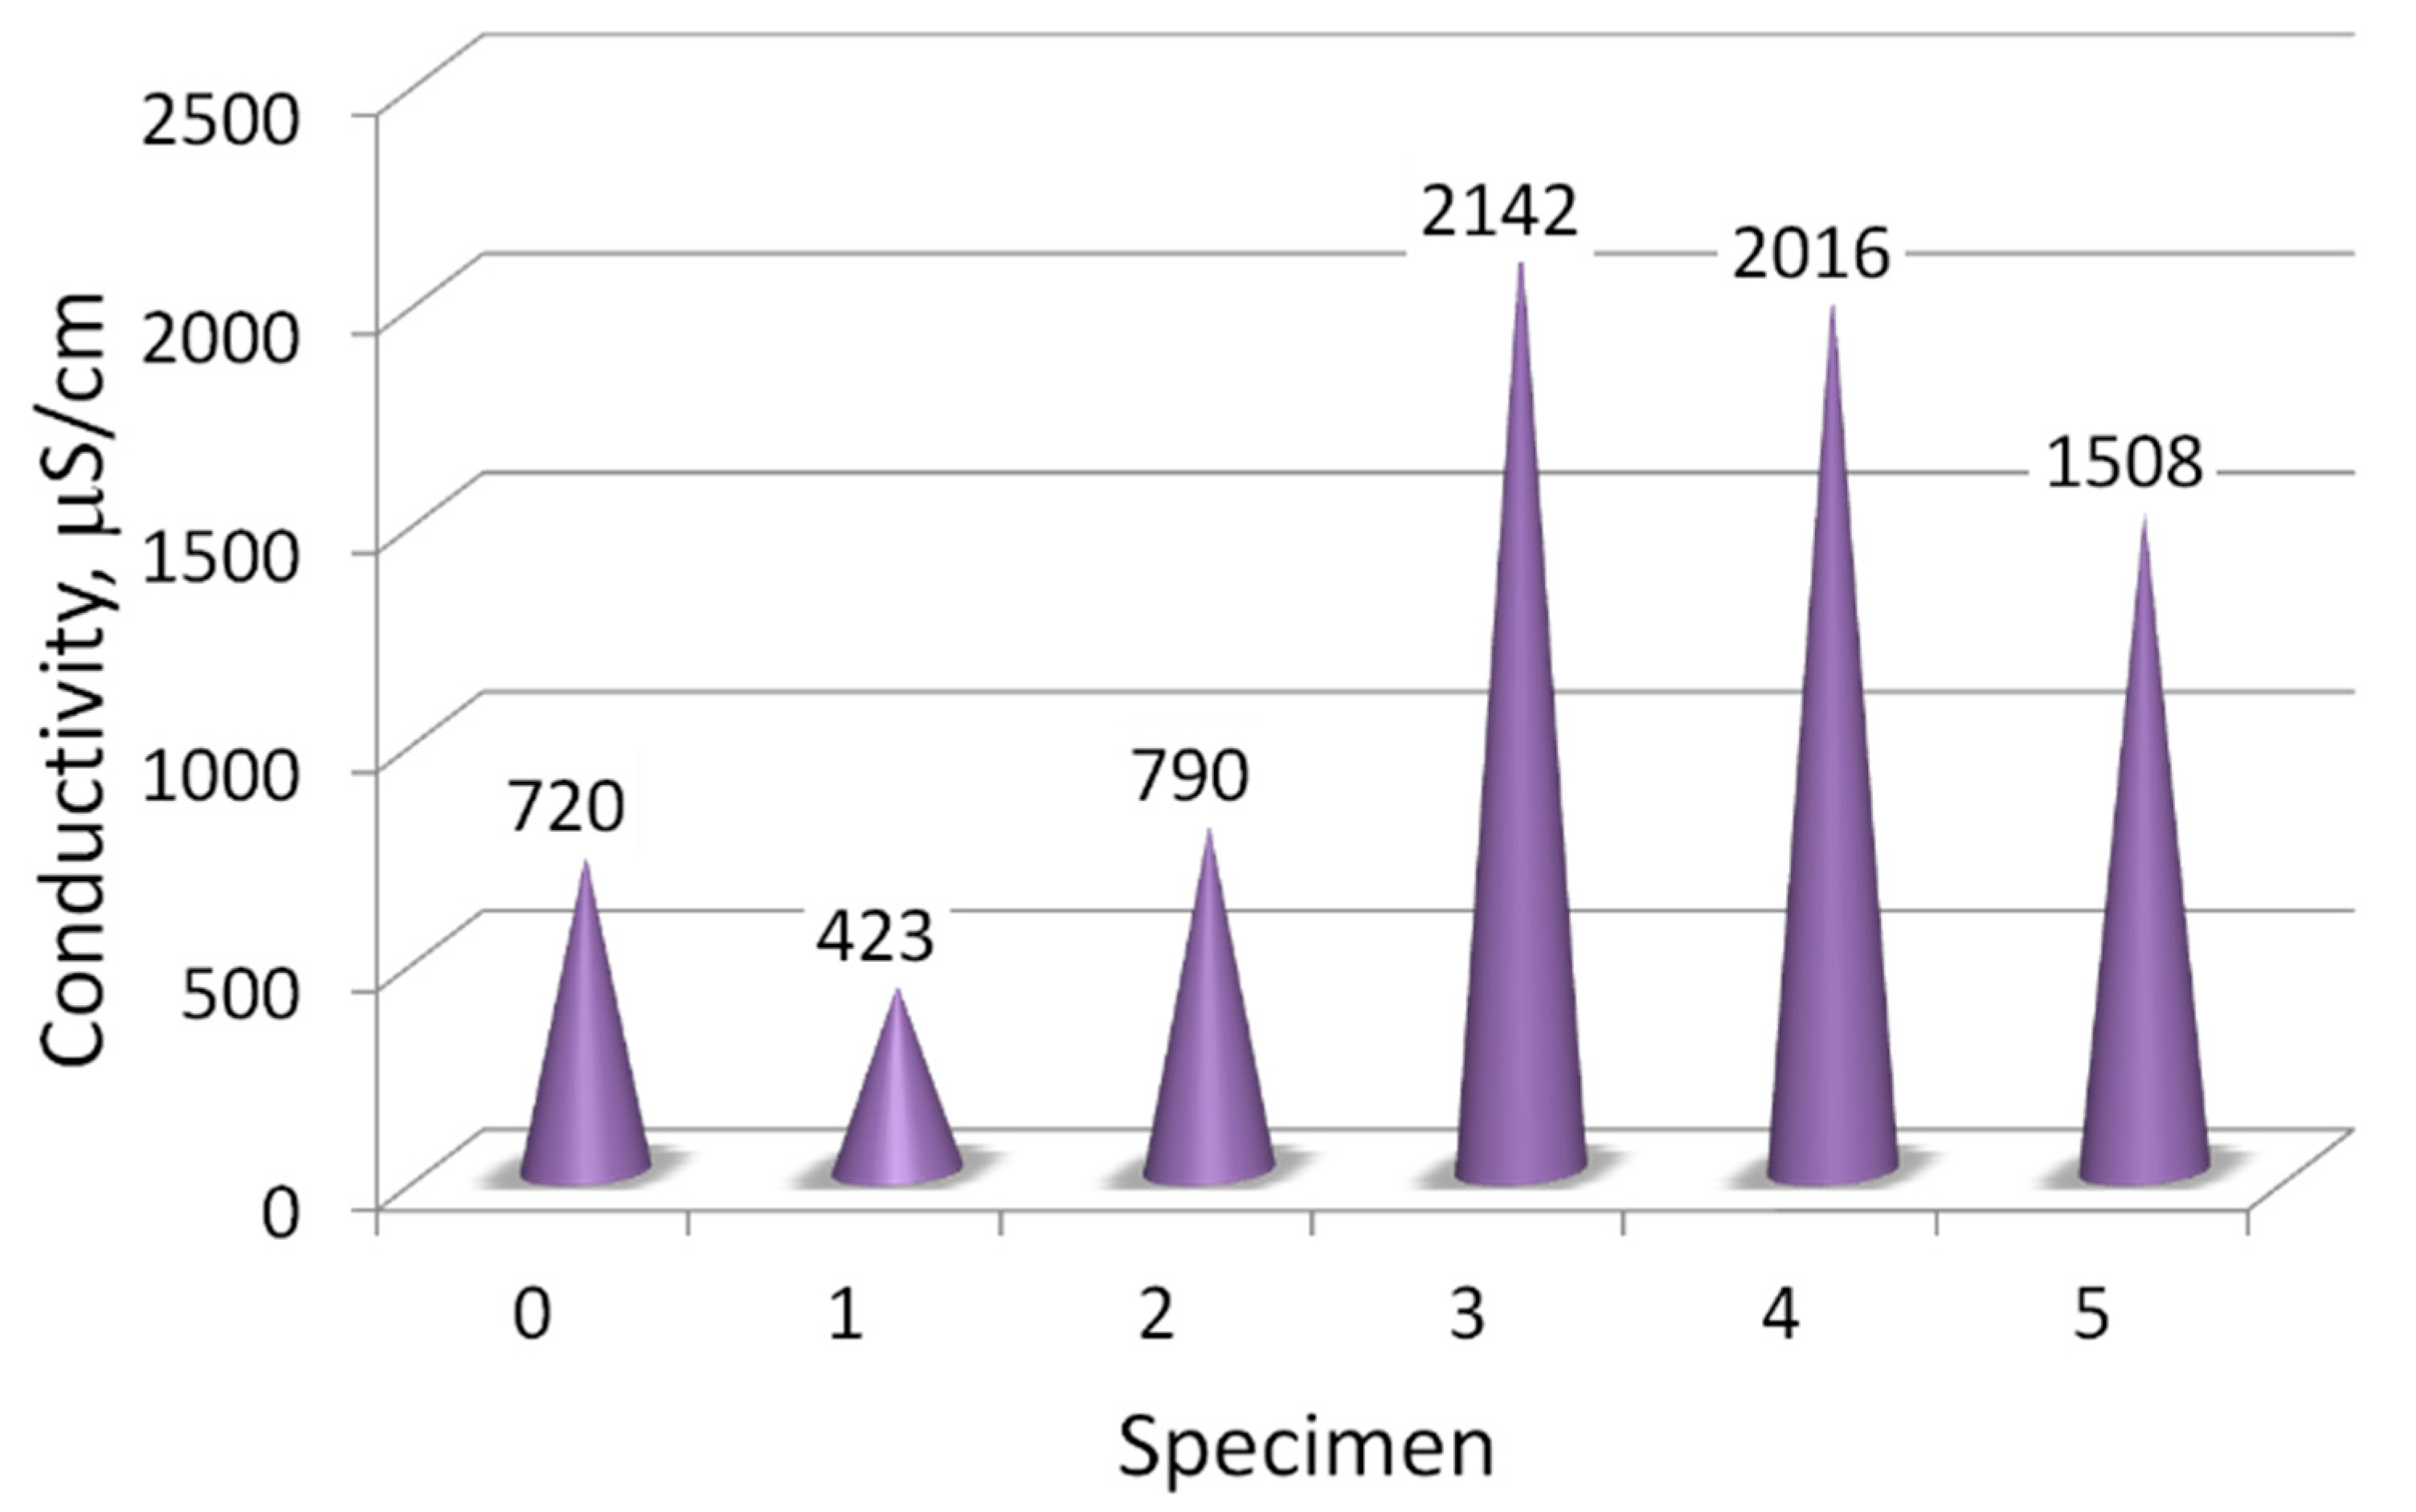
3.3. pH and Conductivity (Salinity) of Filtrates
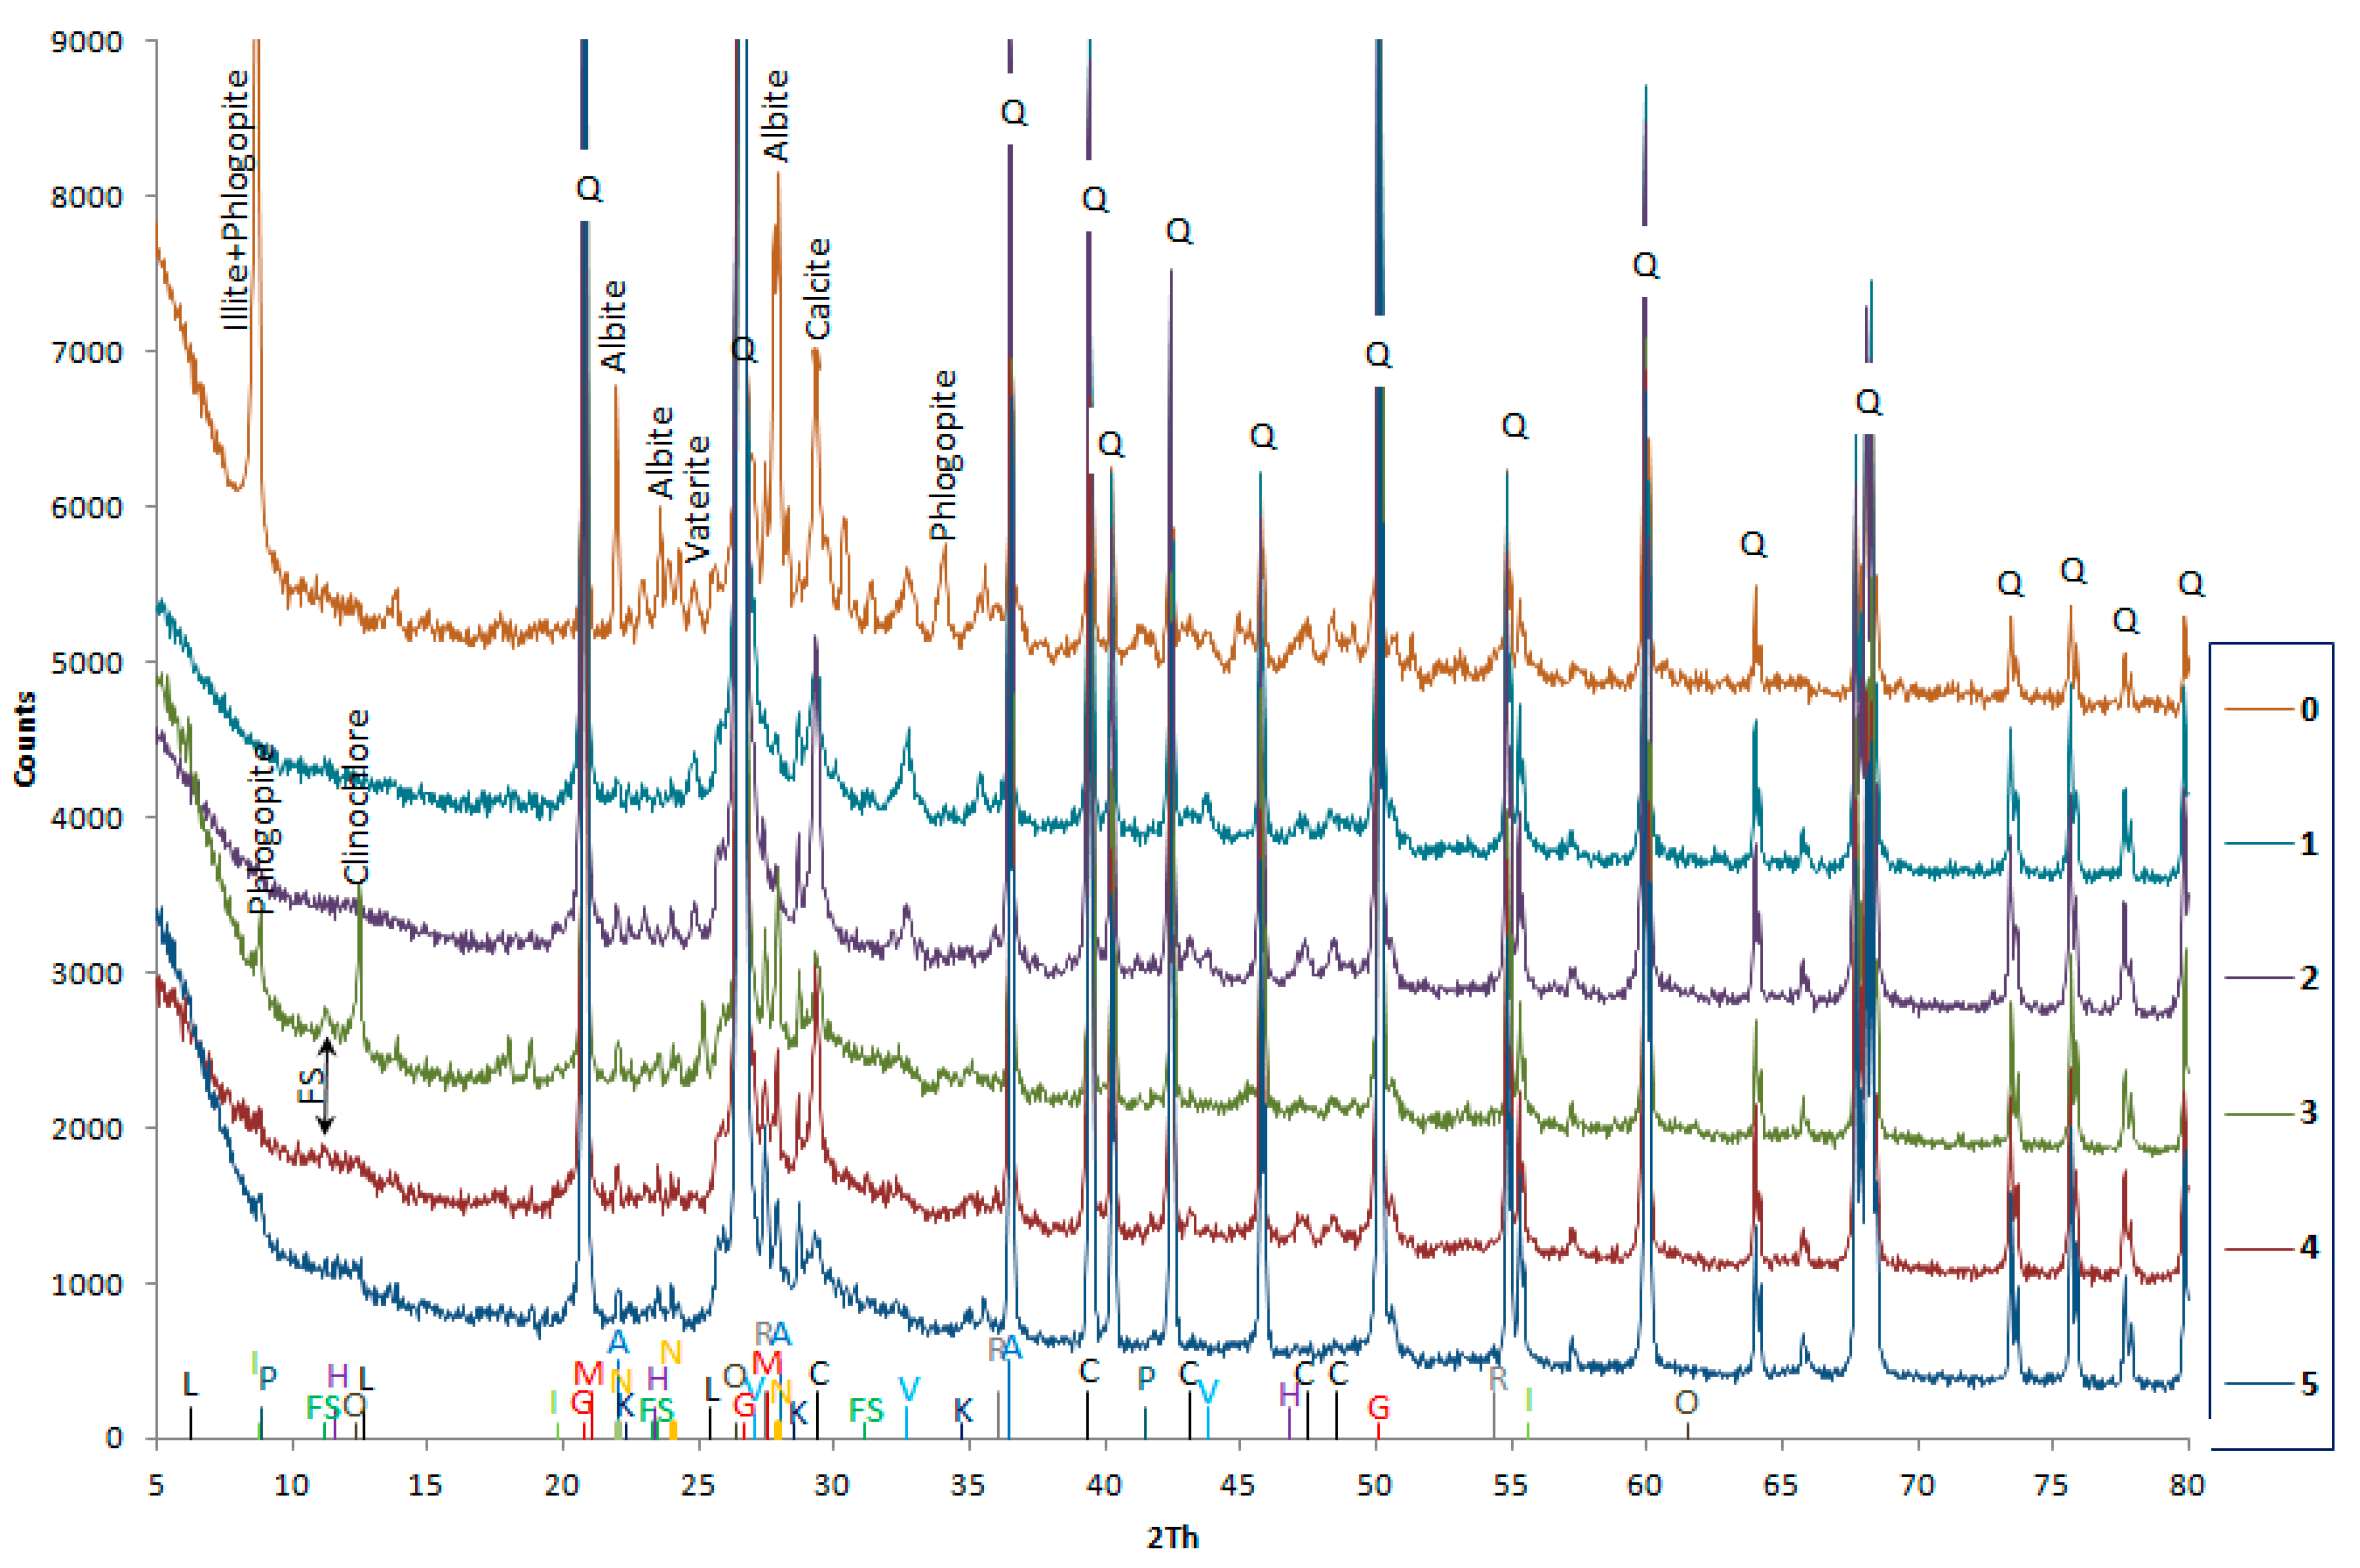
3.4. XRD
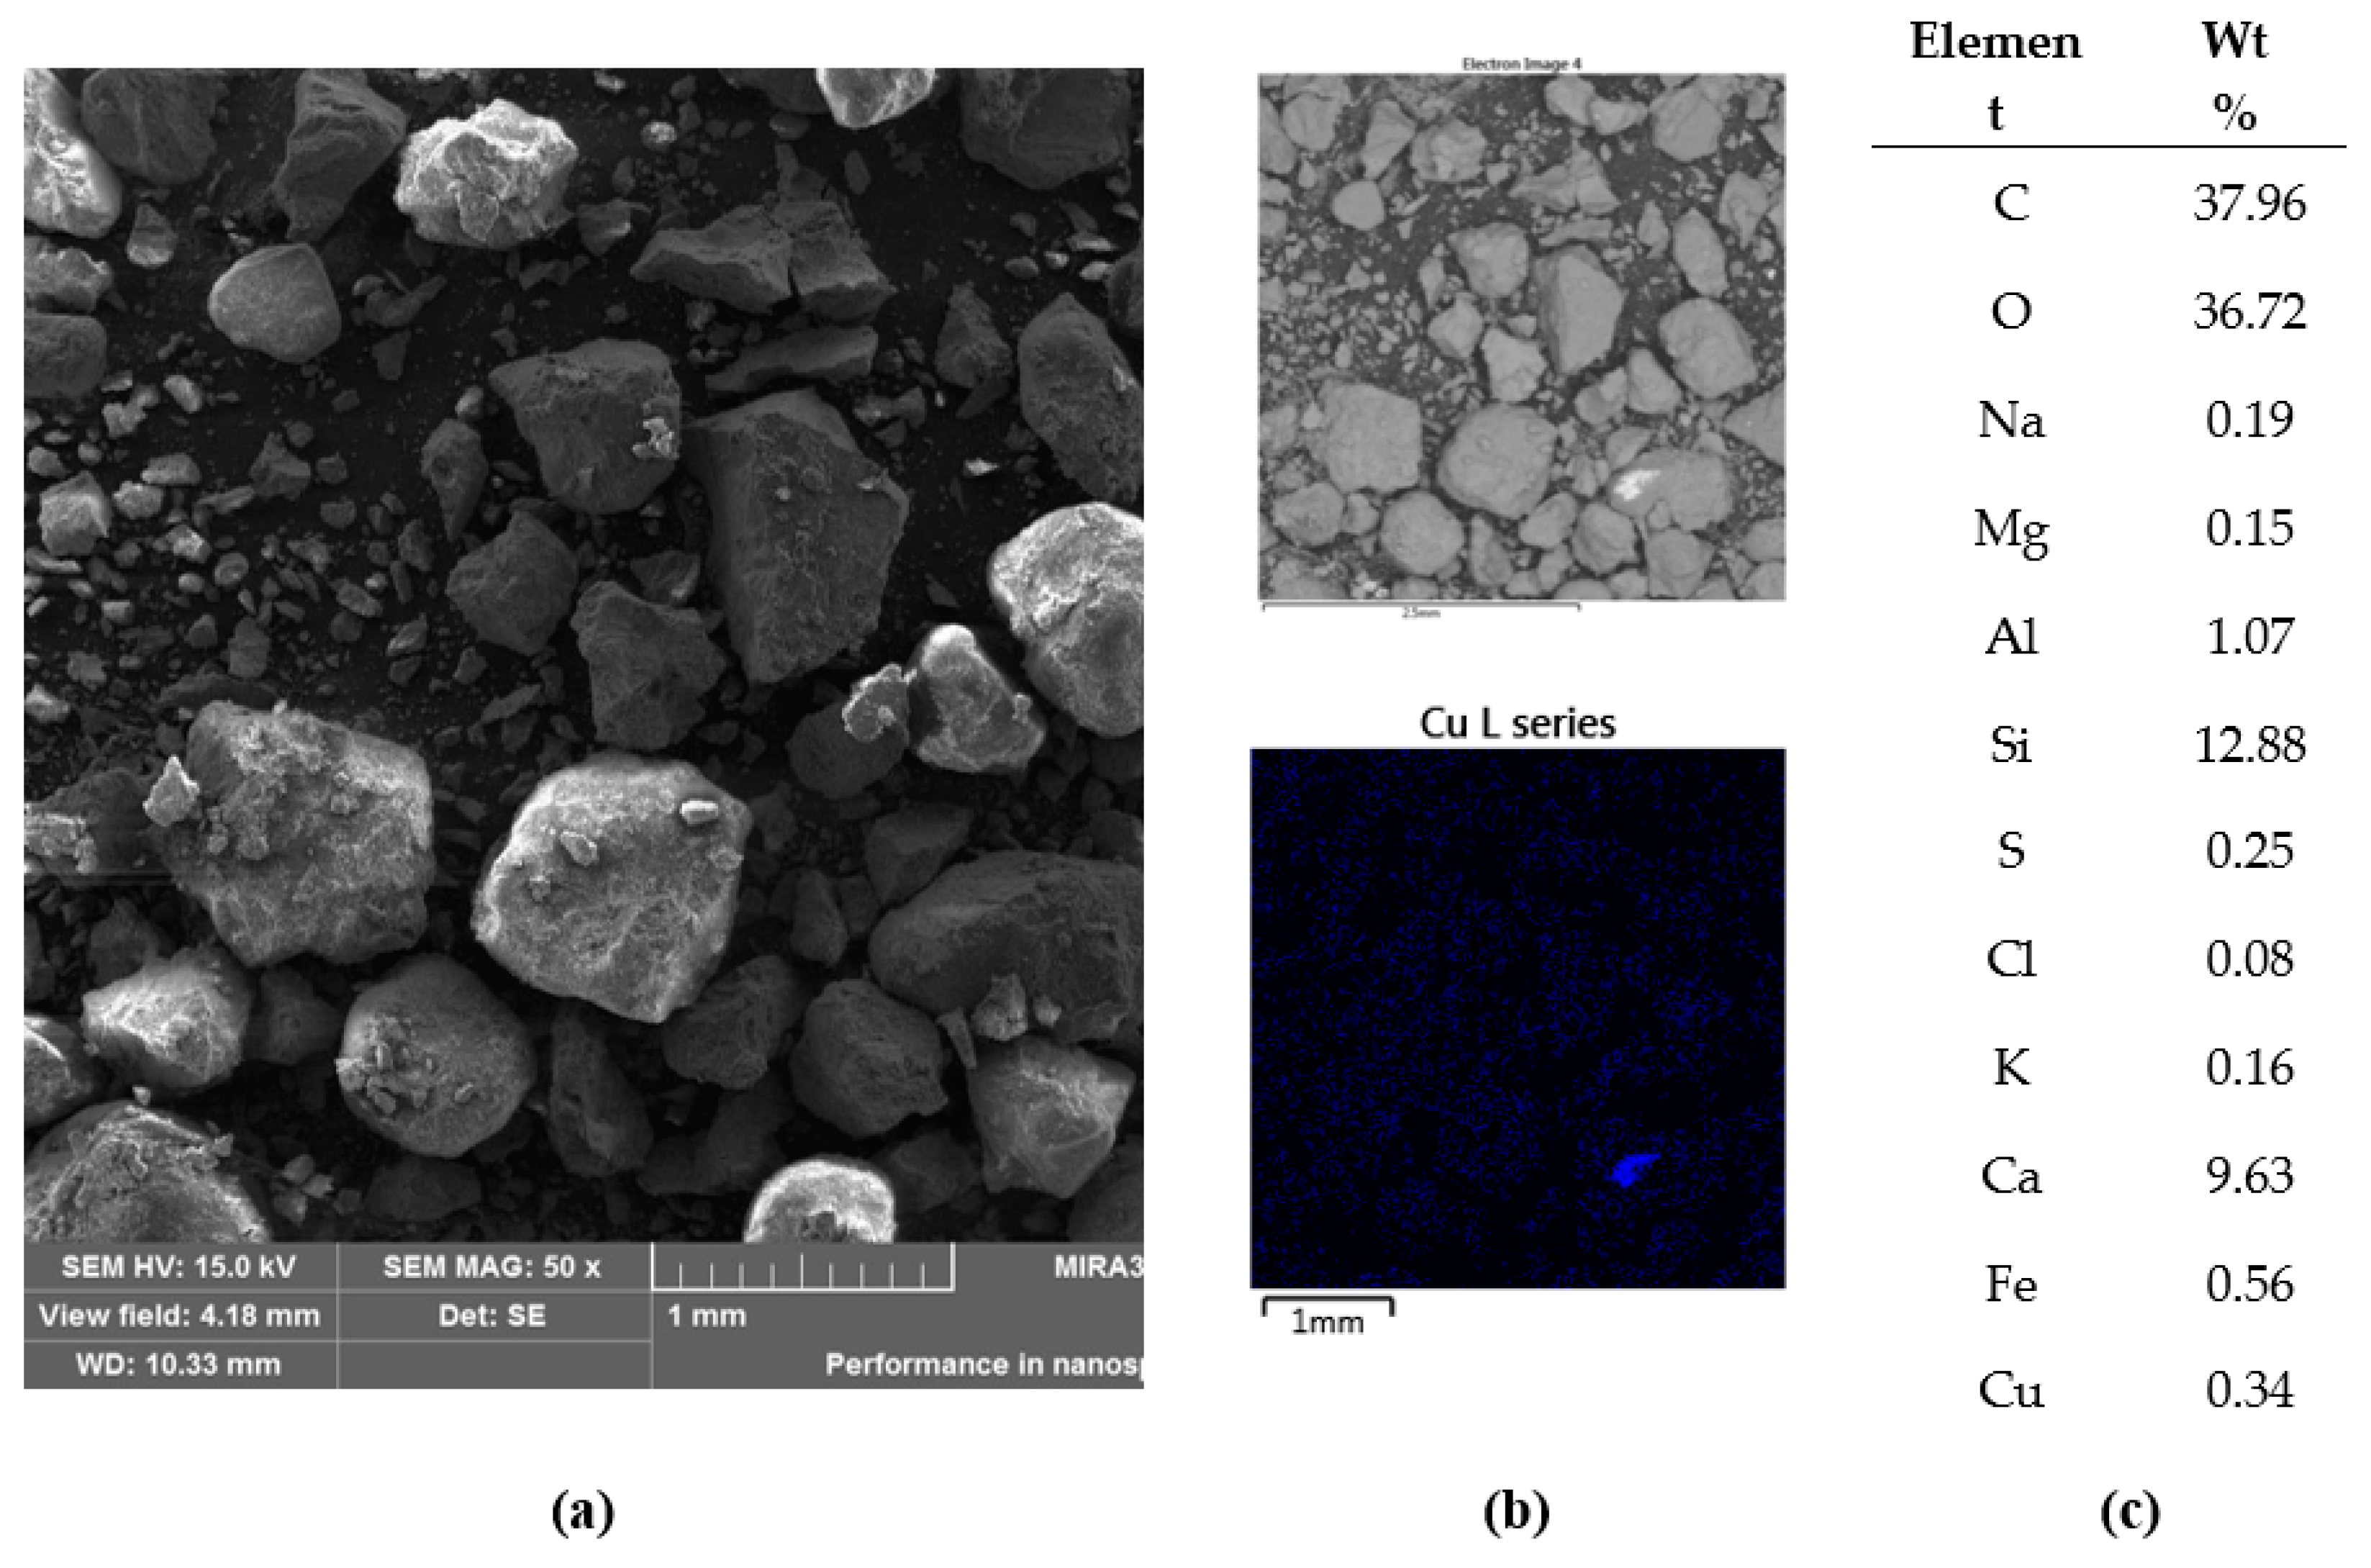
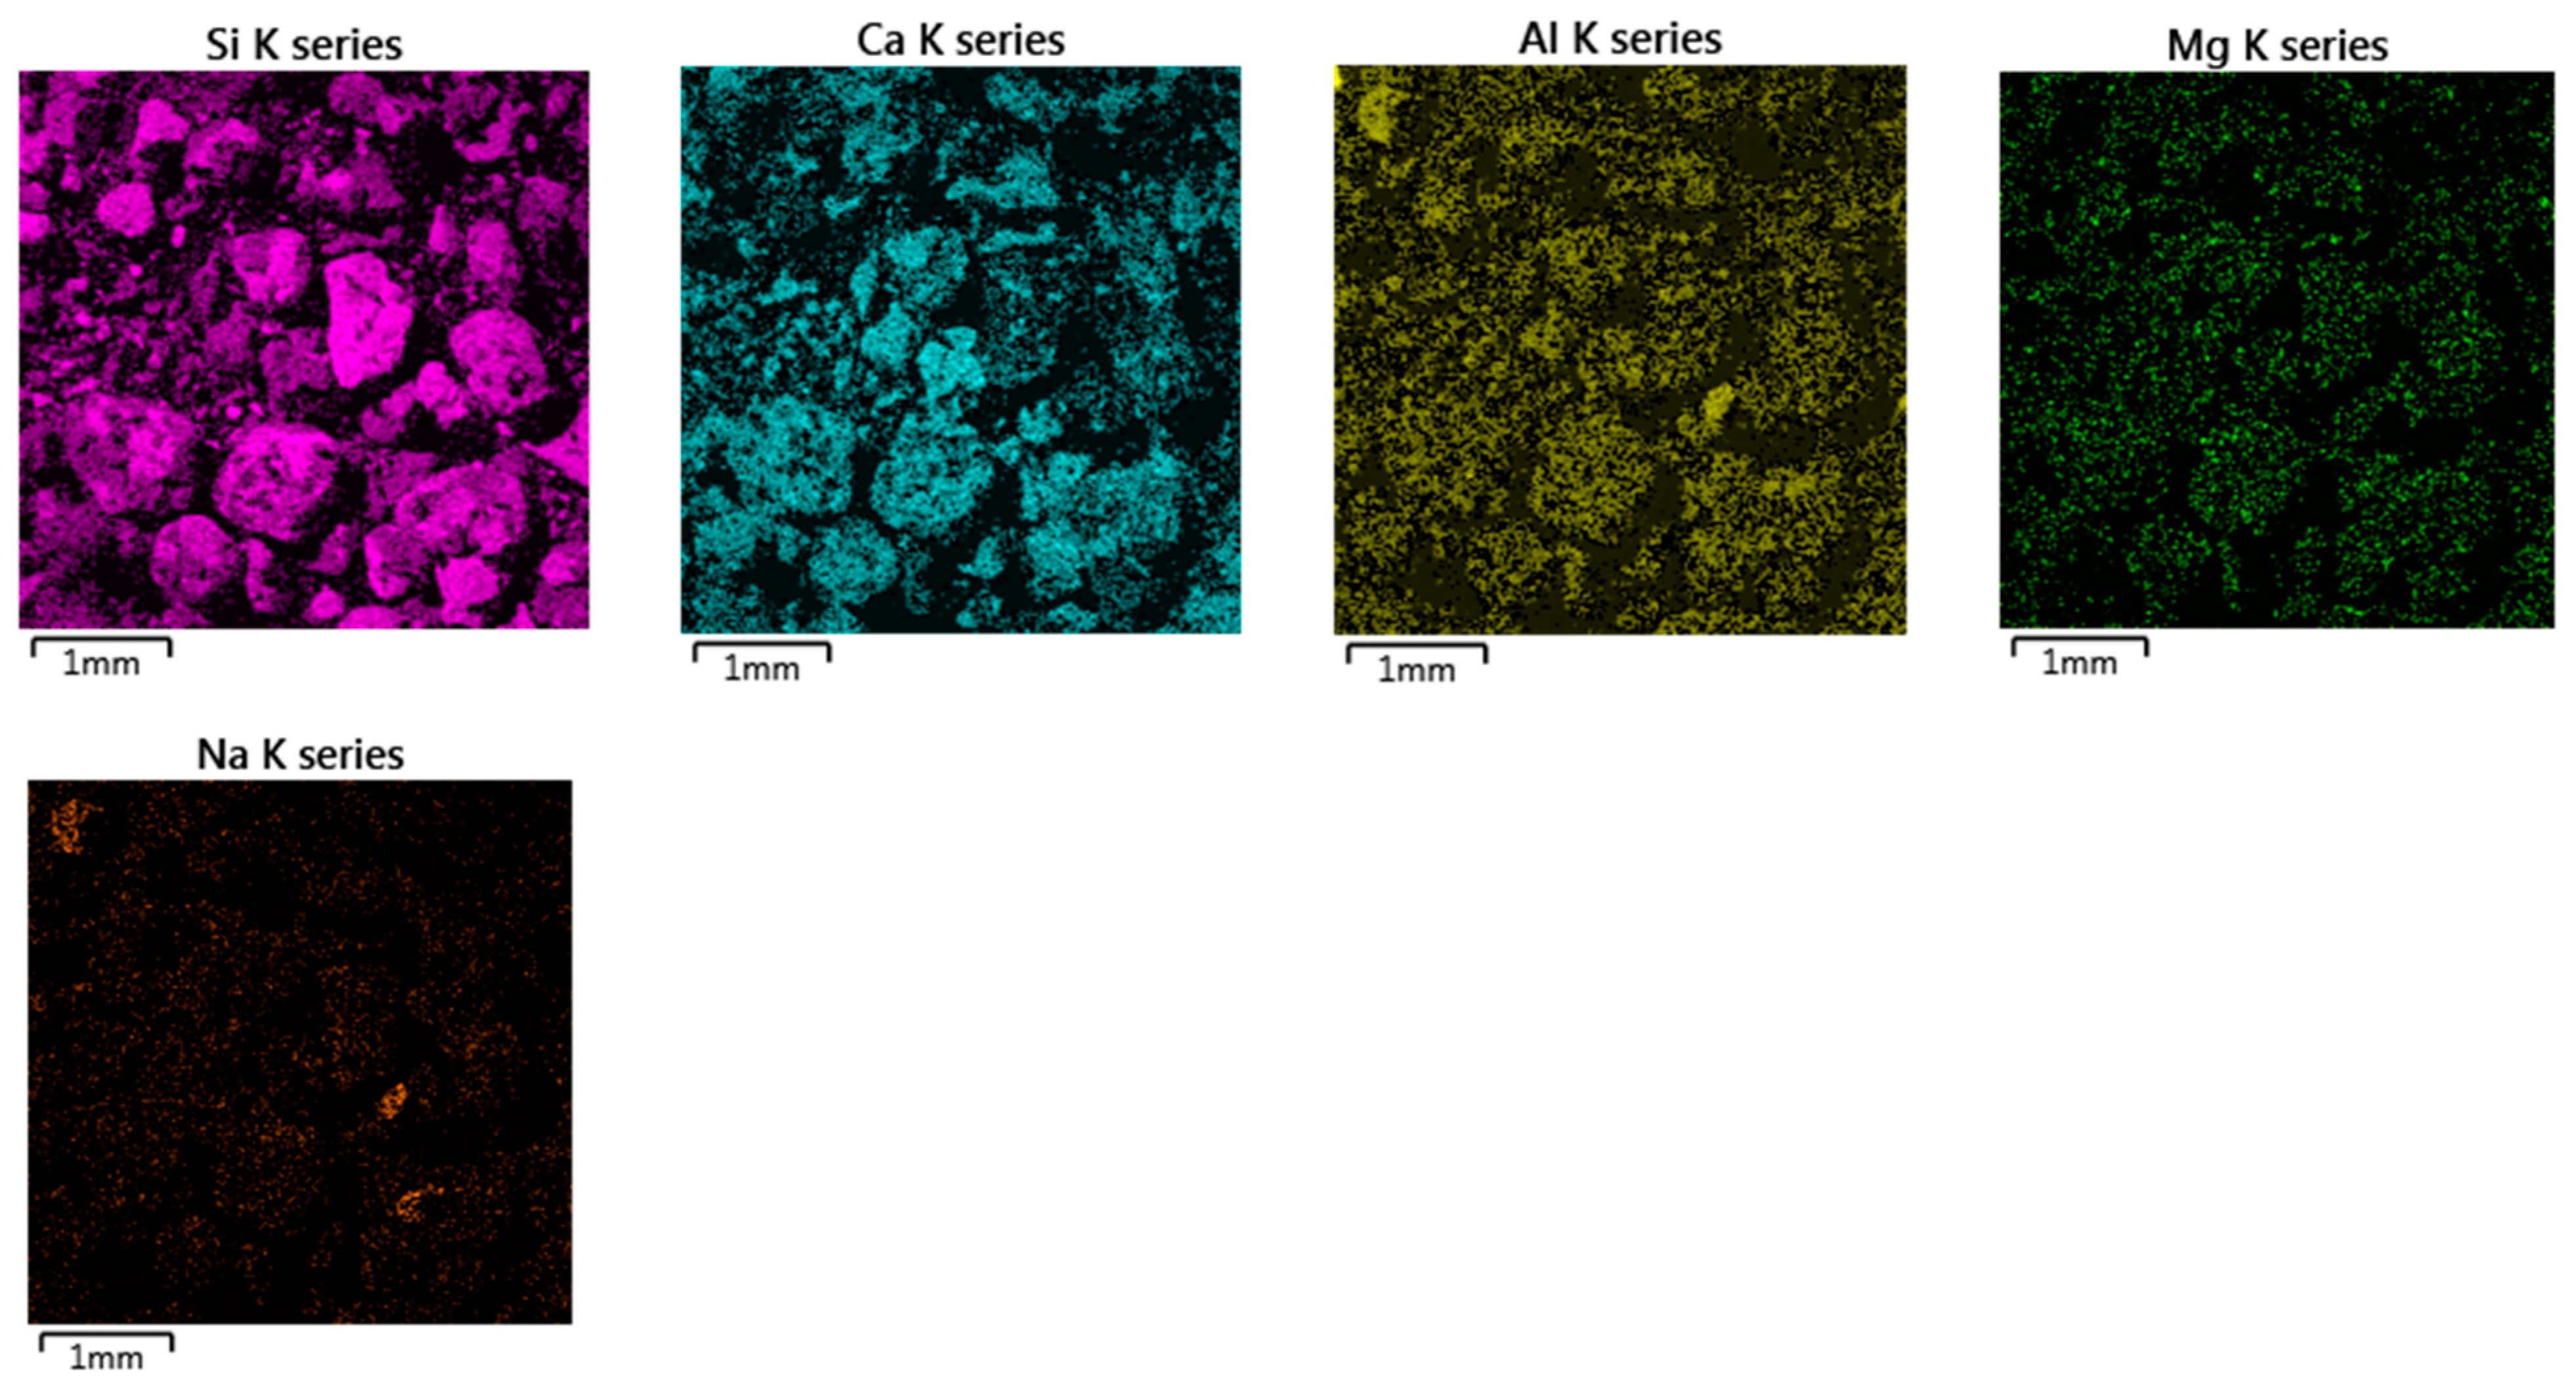
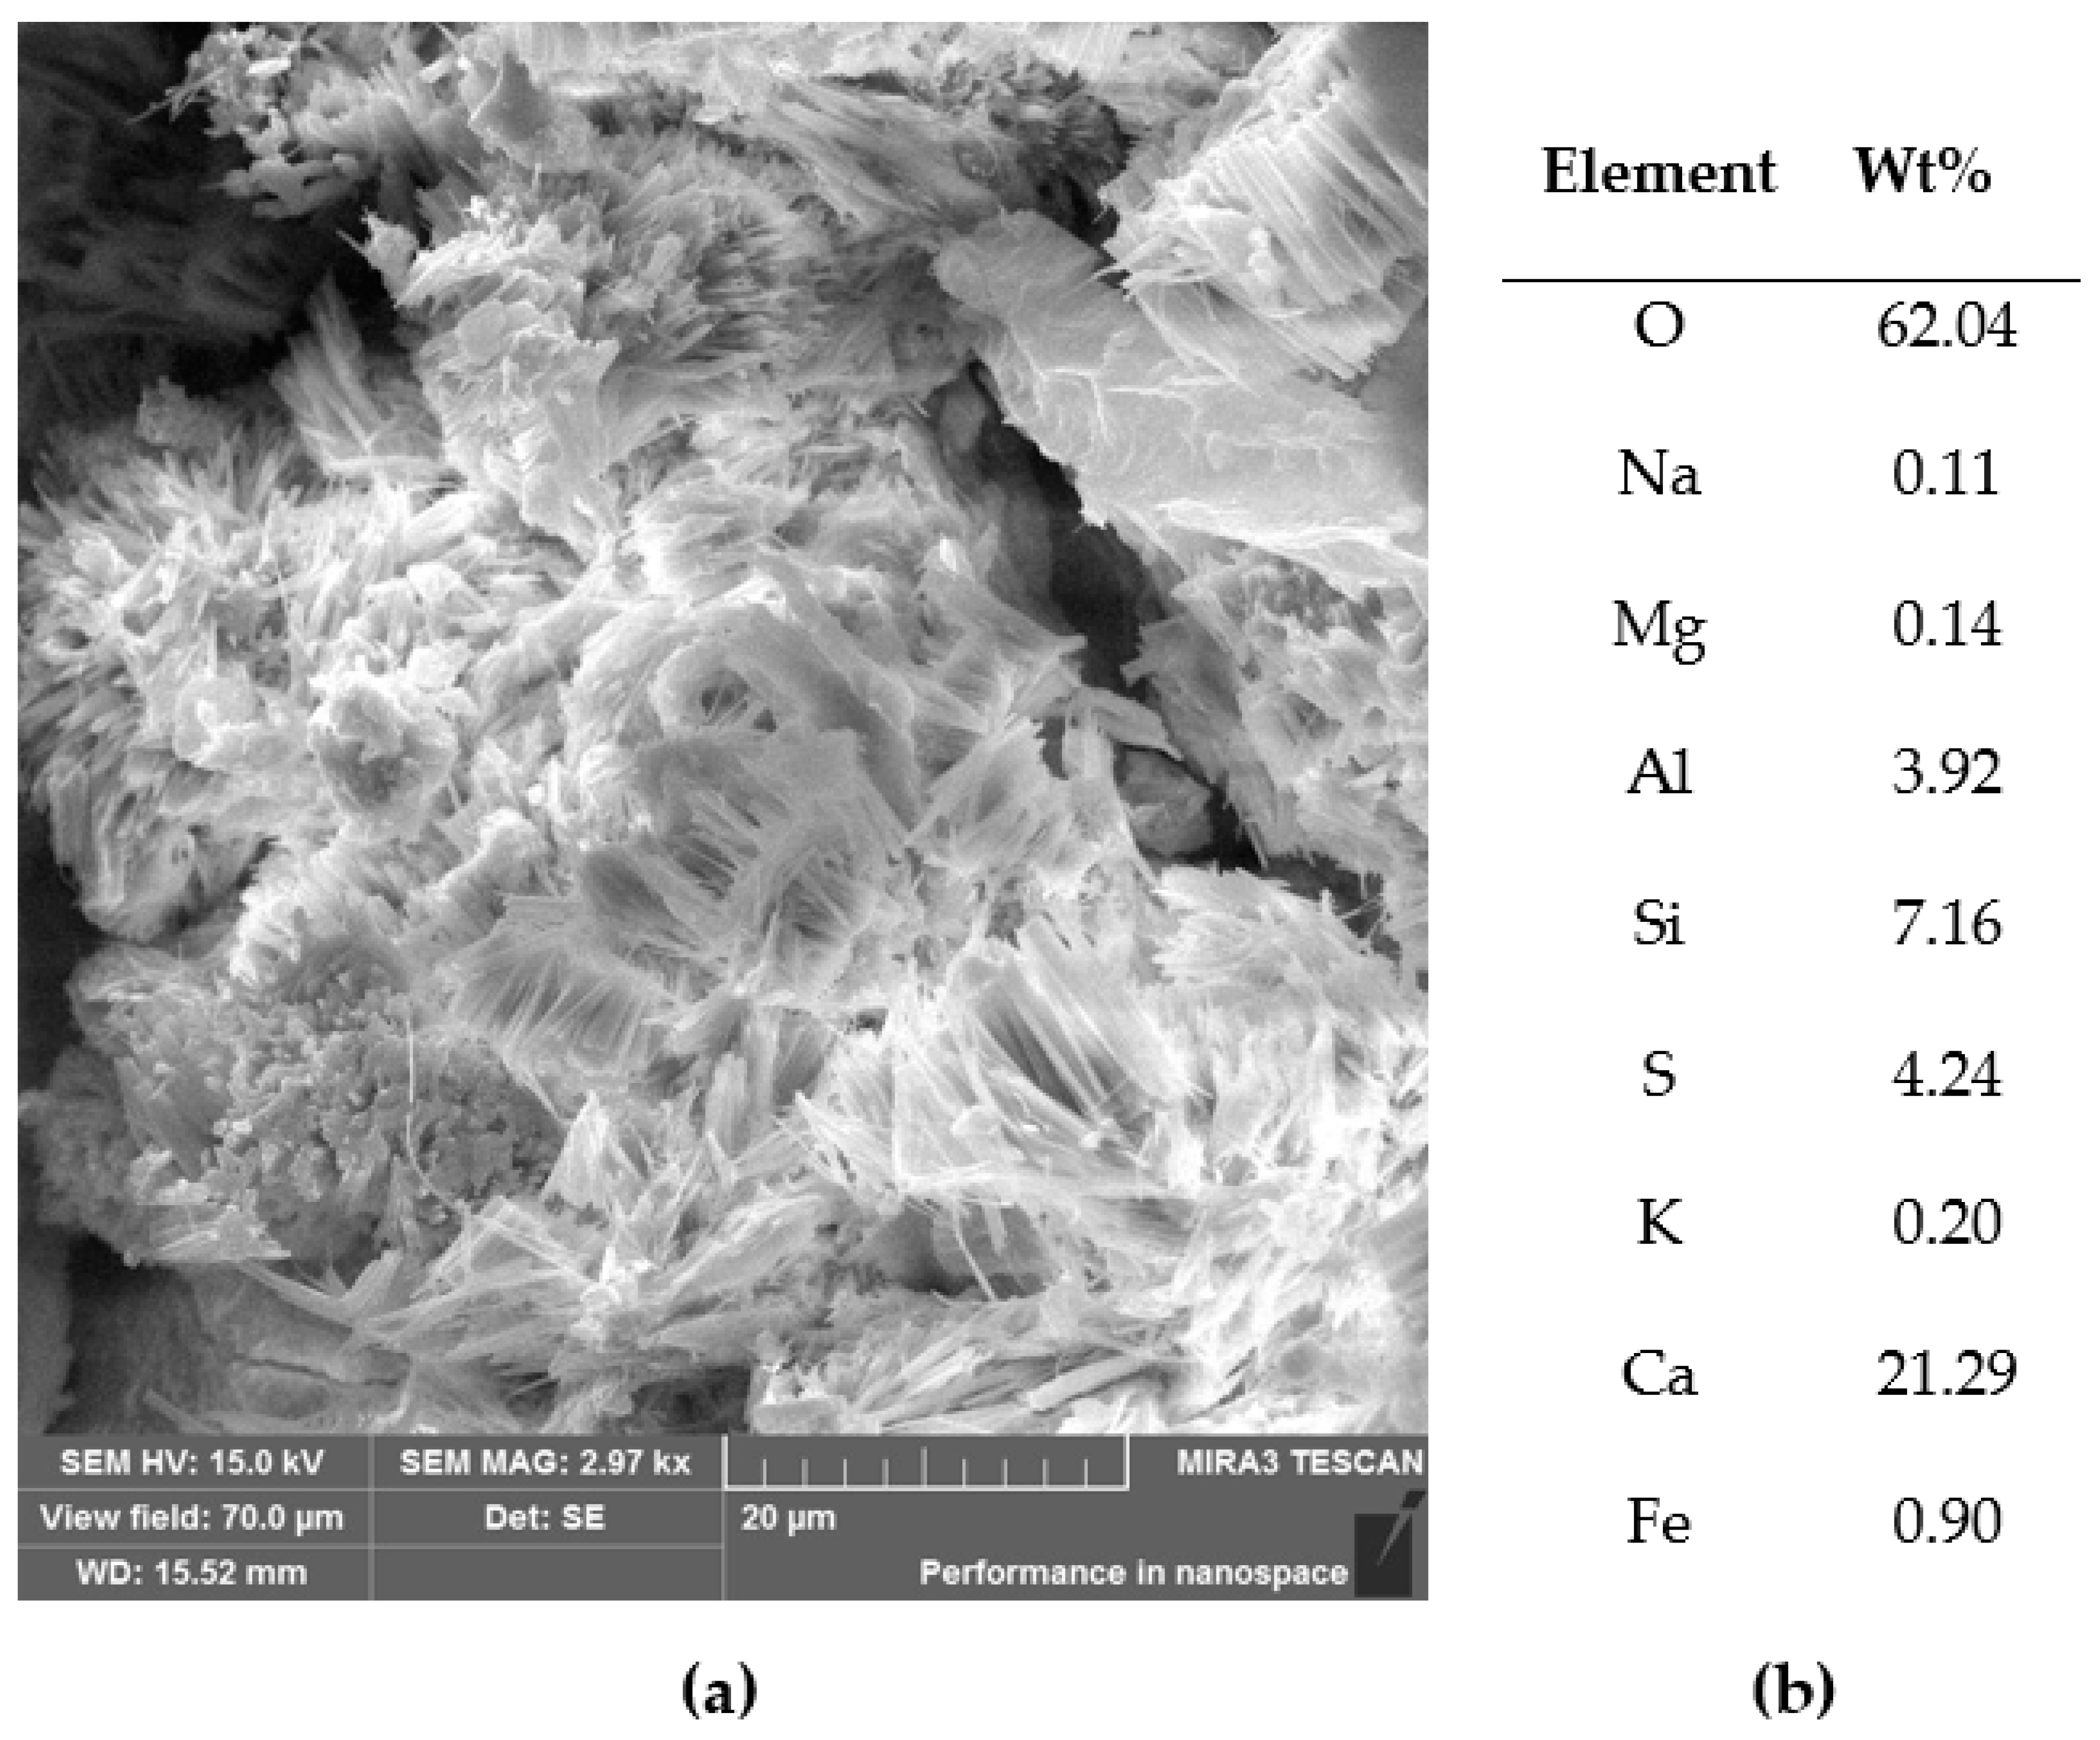
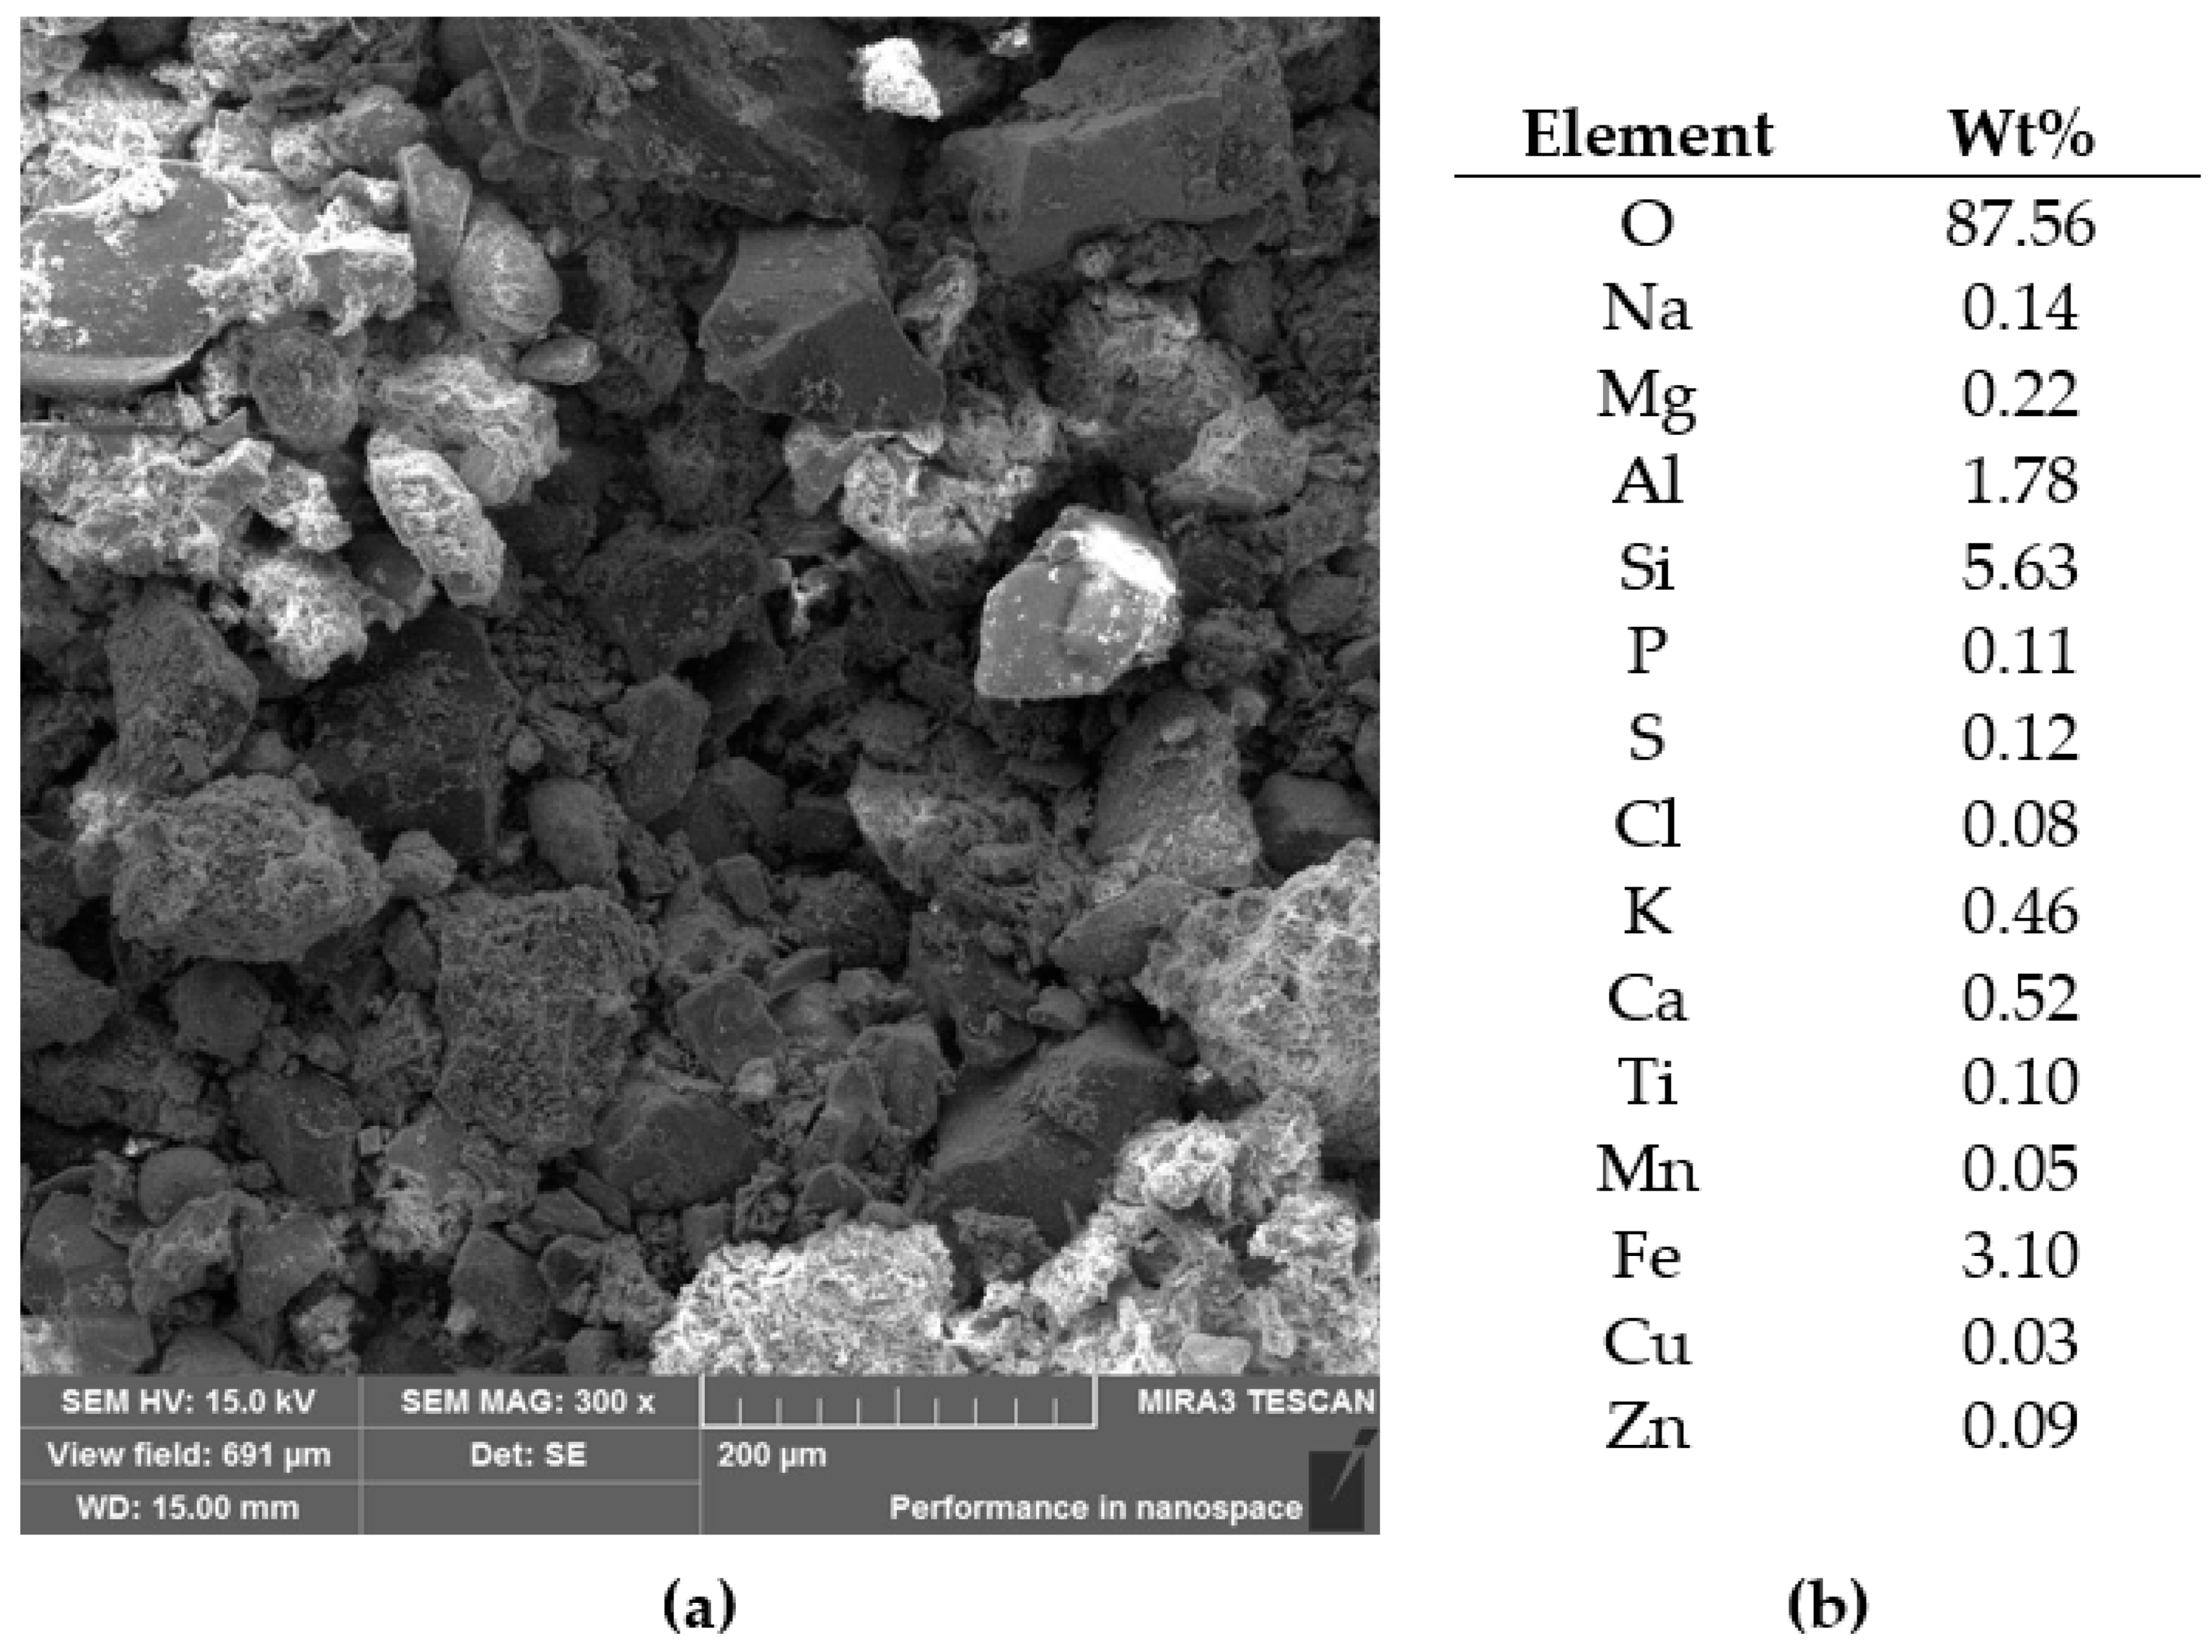
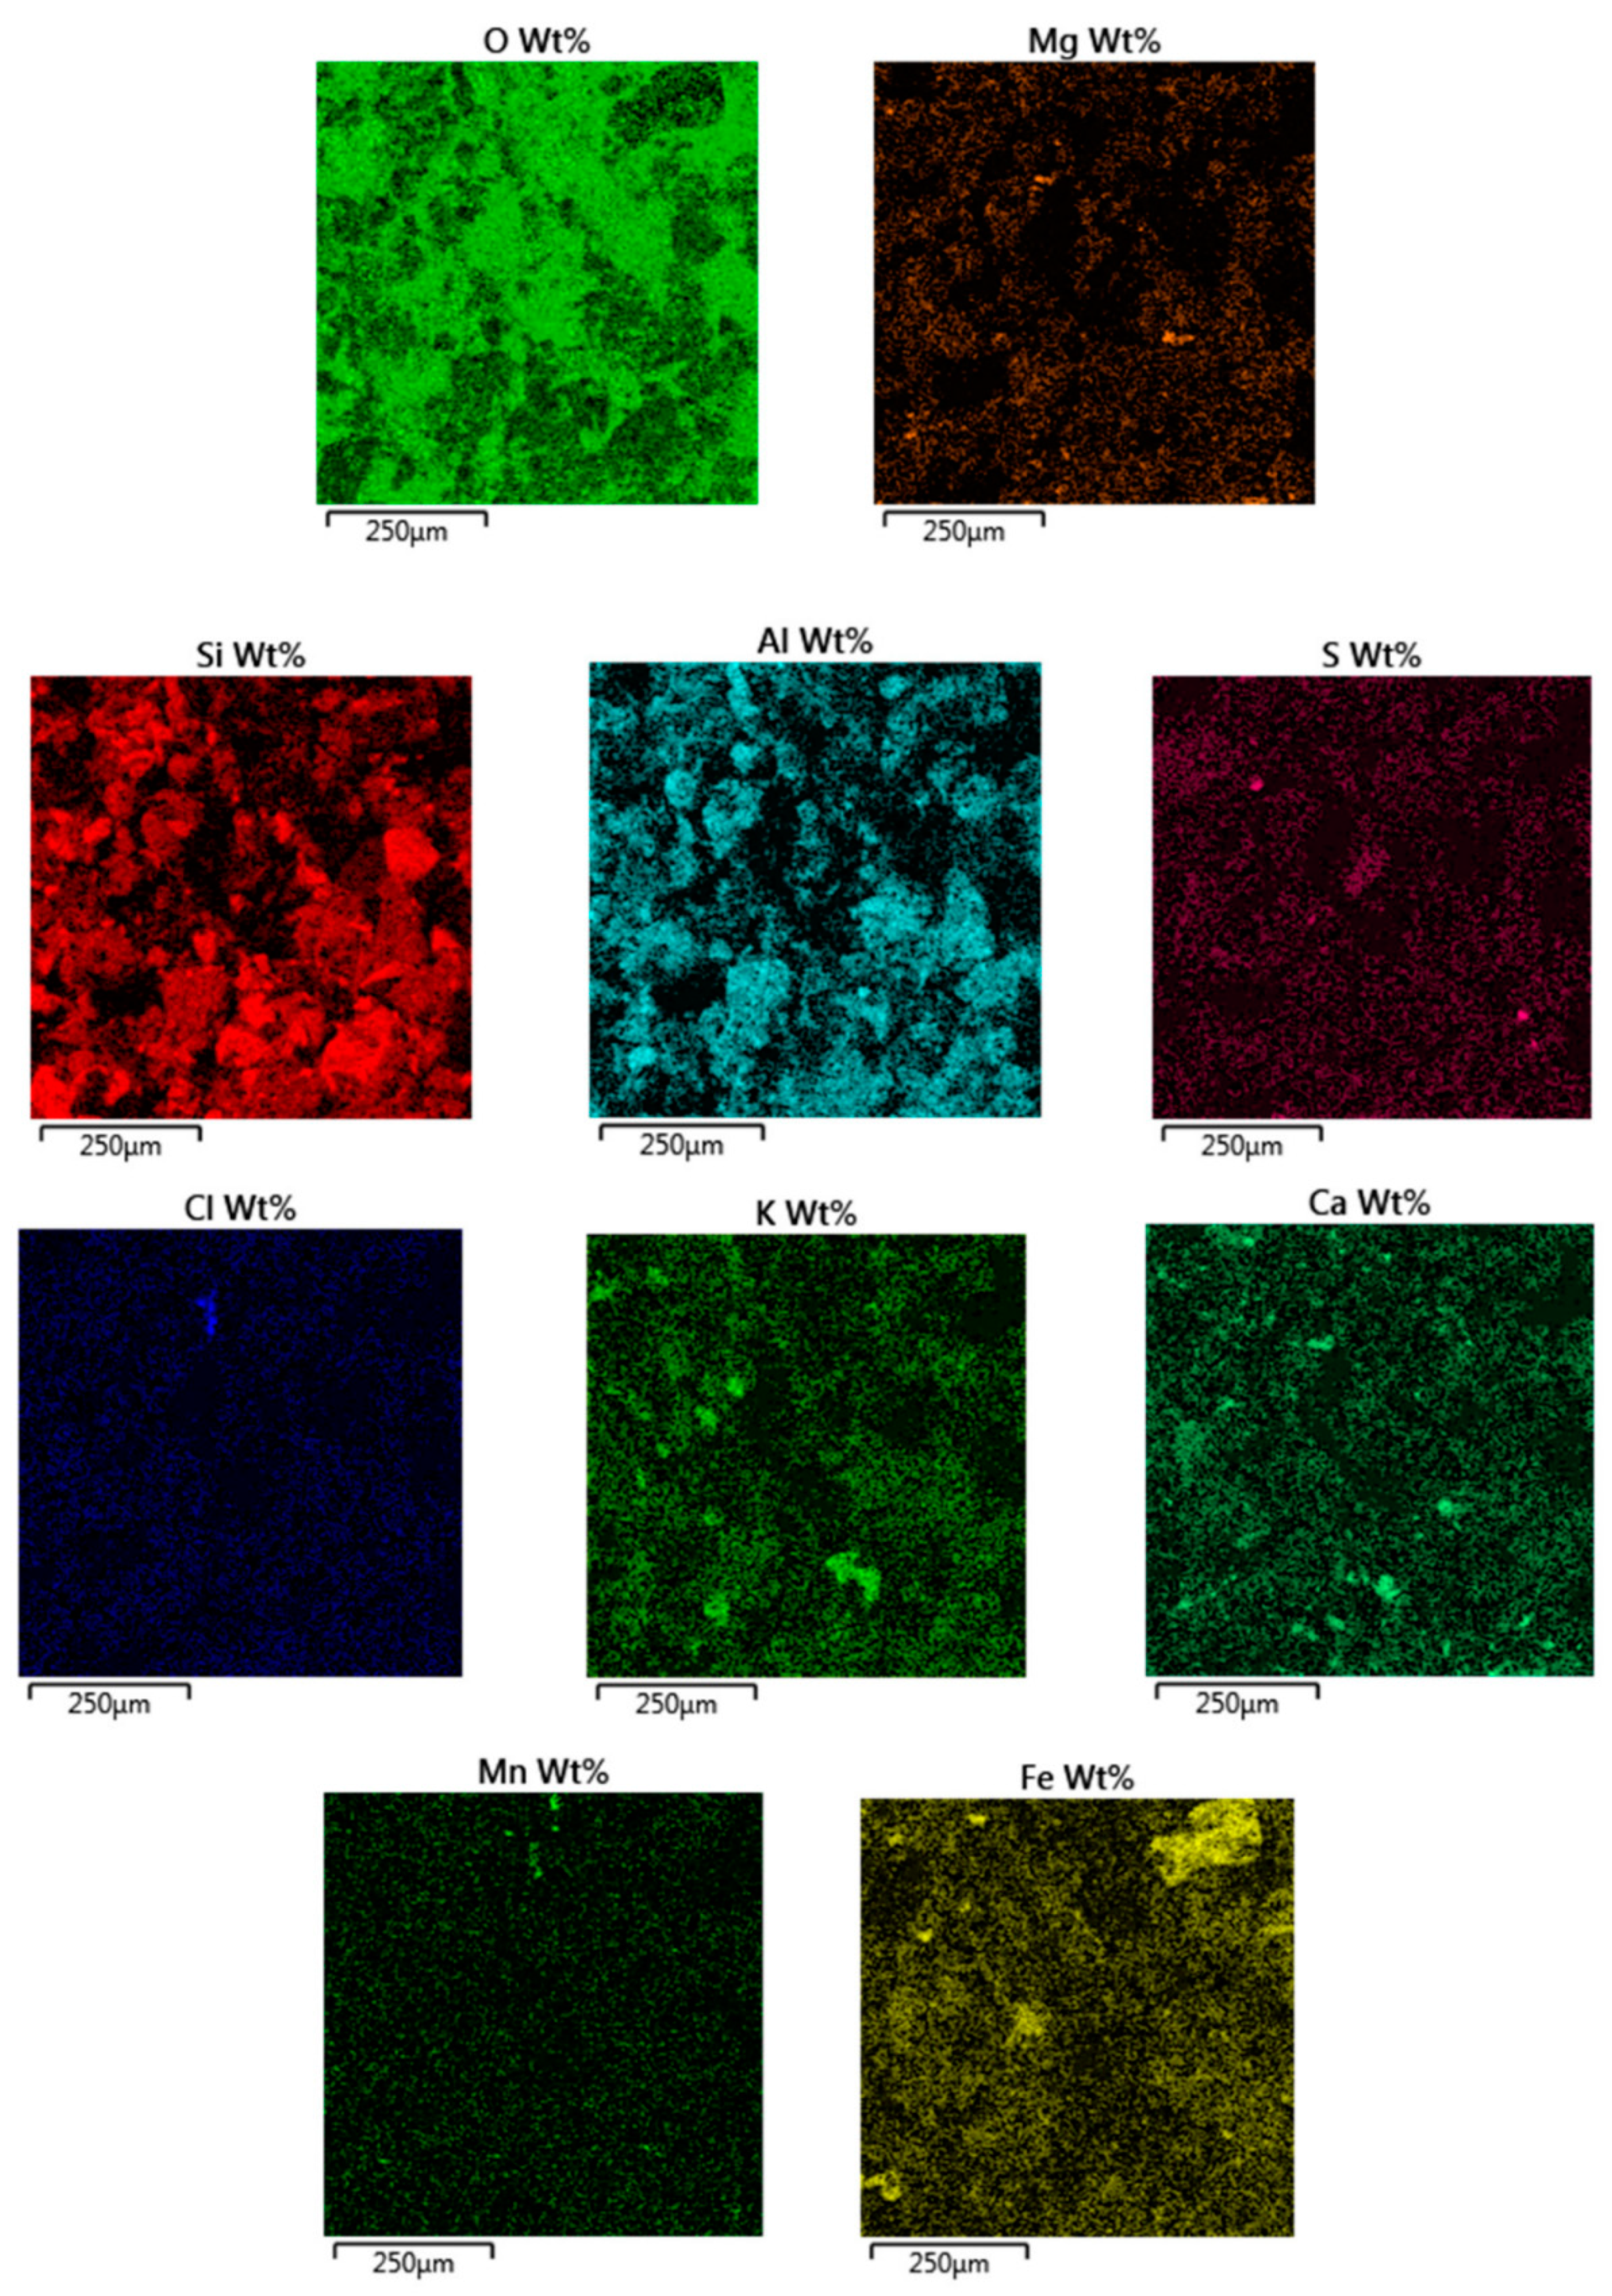
3.5. SEM
3.6. Elements Determination
4. General Discussion
5. Conclusions and Summary
Author Contributions
Funding
Institutional Review Board Statement
Informed Consent Statement
Data Availability Statement
Acknowledgments
Conflicts of Interest
References
- Yang, S.-Y.; Song, X.-B.; Jia, H.-X.; Chen, X.; Liu, X.-L. Experimental research on hysteretic behaviors of corroded reinforced concrete columns with different maximum amounts of corrosion of rebar. Constr. Build. Mater. 2016, 121, 319–327. [Google Scholar] [CrossRef]
- Yuan, W.; Guo, A.; Yuan, W.; Li, H. Experimental investigation on cyclic behavior of coastal bridge piers with non-uniform corrosion under biaxial quasi-static loads. Constr. Build. Mater. 2018, 190, 222–234. [Google Scholar] [CrossRef]
- Guo, A.; Li, H.; Ba, X.; Guan, X.; Li, H. Experimental investigation on the cyclic performance of reinforced concrete piers with chloride-induced corrosion in marine environment. Eng. Struct. 2015, 105, 1–11. [Google Scholar] [CrossRef]
- Wu, J.; Diao, B.; Zhang, W.; Ye, Y.; Liu, Z.; Wang, D. Chloride diffusivity and service life prediction of fatigue damaged RC beams under seawater wet-dry environment. Constr. Build. Mater. 2018, 171, 942–949. [Google Scholar] [CrossRef]
- Borah, M.M.; Dey, A.; Sil, A. Service life assessment of chloride affected bridge located in coastal region of India considering variation in the inherent structural parameters. Structures 2020, 23, 191–203. [Google Scholar] [CrossRef]
- Liang, M.-T.; Lan, J.-J. Reliability analysis for the existing reinforced concrete pile corrosion of bridge substructure. Cem. Concr. Res. 2005, 35, 540–550. [Google Scholar] [CrossRef]
- Wimpenny, D.; Slater, D. Evidence from the highways agency thaumasite investigation in Gloucestershire to support or contradict postulated mechanisms of thaumasite formation (TF) and thaumasite sulfate attack (TSA). Cem. Concr. Compos. 2003, 25, 879–888. [Google Scholar] [CrossRef]
- Hüthwohl, P.; Lu, R.; Brilakis, I. Multi-classifier for reinforced concrete bridge defects. Autom. Constr. 2019, 105, 102824. [Google Scholar] [CrossRef]
- Invernizzi, S.; Montagnoli, F.; Carpinteri, A. Fatigue assessment of the collapsed XXth Century cable-stayed Polcevera Bridge in Genoa. Procedia Struct. Integr. 2019, 18, 237–244. [Google Scholar] [CrossRef]
- Neville, A.M. Properties of Concrete, 3rd ed.; Longman Scientific & Technical: Harlow, UK, 1981. [Google Scholar]
- Xi, Y.; Bažant, Z.P.; Jennings, H.M. Moisture diffusion in cementitious materials Adsorption isotherms. Adv. Cem. Based Mater. 1994, 1, 248–257. [Google Scholar] [CrossRef]
- Martys, N.S.; Ferraris, C.F. Capillary transport in mortars and concrete. Cem. Concr. Res. 1997, 27, 747–760. [Google Scholar] [CrossRef]
- Duchesne, J.; Bérubé, M.-A. Effect of the cement chemistry and the sample size on ASR expansion of concrete exposed to salt. Cem. Concr. Res. 2003, 33, 629–634. [Google Scholar] [CrossRef]
- Davie, C.T.; Pearce, C.J.; Bićanić, N. Coupled Heat and Moisture Transport in Concrete at Elevated Temperatures—Effects of Capillary Pressure and Adsorbed Water. Numer. Heat Transf. Part A Appl. 2006, 49, 733–763. [Google Scholar] [CrossRef]
- Holm, A.; Krus, M.; Künzel, H.M.; Sedlbauer, K. Moisture Transport in Concrete—Field Tests and Hygrothermal Simulations. In Advances in Construction Materials 2007; Springer International Publishing: Berlin, Germany, 2007; pp. 405–418. [Google Scholar]
- Johannesson, B.; Yamada, K.; Nilsson, L.O.; Hosokawa, Y. Multi-species ionic diffusion in concrete with account to interaction between ions in the pore solution and the cement hydrates. Mater. Struct. 2006, 40, 651–665. [Google Scholar] [CrossRef]
- Neithalath, N. Evaluating the short- and long-term moisture transport phenomena in lightweight aggregate concretes. Mag. Concr. Res. 2007, 59, 435–445. [Google Scholar] [CrossRef]
- Panesar, D.; Chidiac, S. Capillary suction model for characterizing salt scaling resistance of concrete containing GGBFS. Cem. Concr. Compos. 2009, 31, 570–576. [Google Scholar] [CrossRef]
- Damrongwiriyanupap, N.; Li, L.; Xi, Y. Coupled diffusion of chloride and other ions in saturated concrete. Front. Arch. Civ. Eng. China 2011, 5, 267–277. [Google Scholar] [CrossRef]
- Ben Fraj, A.; Bonnet, S.; Khelidj, A. New approach for coupled chloride/moisture transport in non-saturated concrete with and without slag. Constr. Build. Mater. 2012, 35, 761–771. [Google Scholar] [CrossRef]
- Claisse, P.A. Transport Properties of Concrete, 1st ed.; Woodhead Publishing: Cambridge, UK, 2014. [Google Scholar] [CrossRef] [Green Version]
- Kurdowski, W. Cement and Concrete Chemistry; Springer International Publishing: Berlin/Heidelberg, Germany, 2014. [Google Scholar]
- Pla, C.; Tenza-Abril, A.; Valdes-Abellan, J.; Benavente, D. Influence of microstructure on fluid transport and mechanical properties in structural concrete produced with lightweight clay aggregates. Constr. Build. Mater. 2018, 171, 388–396. [Google Scholar] [CrossRef]
- Otieno, M.; Golden, G.; Alexander, M.G.; Beushausen, H. Acceleration of steel corrosion in concrete by cyclic wetting and drying: Effect of drying duration and concrete quality. Mater. Struct. 2019, 52, 50. [Google Scholar] [CrossRef]
- Liu, P.; Chen, Y.; Yu, Z.; Xing, F. Vertical water transport model in concrete based on the coupled effects of the capillarity, gravity and evaporation. Constr. Build. Mater. 2020, 240, 117880. [Google Scholar] [CrossRef]
- Żarski, M.; Płaszczyk, T.; Salamak, M. Integrated lifecycle analysis of a concrete bridge. In Proceedings of the 12th Central European Congress on Concrete Engineering CCC’2017, Tokaj, Hungary, 31 August–1 September 2017; pp. 140–148. [Google Scholar]
- Santos, R.; Costa, A.A.; Silvestre, J.D.; Pyl, L. Integration of LCA and LCC analysis within a BIM-based environment. Autom. Constr. 2019, 103, 127–149. [Google Scholar] [CrossRef]
- Sanchez, A.X.; Kraatz, J.A.; Hampson, K.D.; Longanathan, S. BIM for Sustainable Whole-of-life Transport Infrastructure Asset Management. In Proceedings of the IPWEA Sustainability in Public Works Conference, Tweed Heads, Australia, 27–29 July 2014. [Google Scholar]
- American Association of State Highway and Transportation Officials. AASHTO Guide Manual for Bridge Element Inspection; American Association of State Highway and Transportation Officials: Washington, DC, USA, 2011. [Google Scholar]
- Federal Highway Administration National Highway Institute. Bridge Inspector’s Reference Manual; 12-049 Report; United States Department of Transportation, Federal Highway Administration National Highway Institute: Washington, DC, USA, 2012.
- Thompson, P.D.; Small, E.P.; Johnson, M.; Marshall, A.R. The Pontis Bridge Management System. Struct. Eng. Int. 1998, 8, 303–308. [Google Scholar] [CrossRef]
- Hanji, T.; Tateishi, K. Review of Recent Bridge Asset Management Systems. In Proceedings of the International Symposium on EcoTopia Science 2007, ISETS07, Nagoya, Japan, 23–25 November 2007; pp. 1322–1326. [Google Scholar]
- Hooks, J.M. Long-Term Bridge Performance (LTBP) Program Protocols; 16-007 Report Version 1; Federal Highway Administration National Highway Institute: Washington, DC, USA, 2016.
- National Cooperative Highway Research Program. Bridge Life-Cycle Cost Analysis; Report 483; National Cooperative Highway Research Program; National Cooperative Highway Research Program: Washington, DC, USA, 2003. [Google Scholar]
- Van derWeijden, C.H.; Middleburg, J.J. Hydrogeochemistry of the River Rhine: Long term and seasonal variability, elemental budgets, base levels and pollution. Water Res. 1989, 23, 1247–1266. [Google Scholar] [CrossRef]
- Absalon, D. Water management in the Upper Oder catchment basin. Eur. Geogr. 1994, 7/8, 60–63. [Google Scholar]
- Jankowski, A.T. The influence of waters from hard-coal mines on the hydrochemical relations of Upper Silesian Coal Basin (USCB) rivers. Geogr. Pol. 1997, 685, 51–64. [Google Scholar]
- Tsai, L.J.; Yu, K.C.; Chang, J.S.; Ho, S.T. Fractionation of heavy metals in sediment cores from the Ell-Ren River, Taiwan. Water Sci. Technol. 1998, 37, 217–224. [Google Scholar] [CrossRef]
- Brannstrom, C.; Oliveira, A.M.S. Human modification of stream valleys in the western plateau of Sao Paulo, Brazil: Implica-tions for environmental narratives and management. Land Degrad. Dev. 2000, 11, 535–548. [Google Scholar] [CrossRef]
- MacNeil, C.; Styles, P. River Pollution Incidents 2013. Isle of Man; Technical Report; 2014; Available online: https://www.researchgate.net/publication/268387027_River_Pollution_Incidents_2013 (accessed on 8 January 2021).
- Ogbonna, D.N. The Impact of Untreated Sewage Wastes discharge on the Physico-chemical properties of Rivers in Port Har-court Metropolis. World J. Sci. Res. Rev. 2014, 2, 1–19. [Google Scholar]
- Wijaya, A.R.; Ohde, S.; Shinjo, R.; Ganmanee, M.; Cohen, M.D. Geochemical fractions and modeling adsorption of heavy metals into contaminated river sediments in Japan and Thailand determined by sequential leaching technique using ICP-MS. Arab. J. Chem. 2019, 12, 780–799. [Google Scholar] [CrossRef]
- Adhena, K.; Estifanos, S.; Hagos, M.; Abrha, B. Physico-chemical characterization of stream water in maichew area, Southern Tigray, Ethiopia. Glob. Sci. J. 2020, 8, 3. [Google Scholar]
- Dube, T.; Chibanda, M.; Manhire, B.; Rutanhira, C.; Mabugu, C.; Makaka, C.; Makaure, J.; Muteveri, T. Sewage Effluent Causes Metal Pollution of a Sub-tropical River System in Zimbabwe. Bull. Environ. Contam. Toxicol. 2020, 104, 339–344. [Google Scholar] [CrossRef]
- Han, X.; Xie, Z.; Tian, Y.; Yan, W.; Miao, L.; Zhang, L.; Zhu, X.; Xu, W. Spatial and seasonal variations of organic corrosion inhibitors in the Pearl River, South China: Contributions of sewage discharge and urban rainfall runoff. Environ. Pollut. 2020, 262, 114321. [Google Scholar] [CrossRef]
- McCoy, K.; Hodgson, D.; Clark, P.; Morritt, D. The effects of wet wipe pollution on the Asian clam, Corbicula fluminea (Mollusca: Bivalvia) in the River Thames, London. Environ. Pollut. 2020, 264, 114577. [Google Scholar] [CrossRef] [PubMed]
- Patel, P.; Bablani, S.; Patel, A. Impact Assessment of Urbanization and Industrialization Using Water Quality Index on Sabaramati River, Ahmedabad. SSRN Electron. J. 2020. [Google Scholar] [CrossRef]
- Zhou, Q.; Yang, N.; Li, Y.; Ren, B.; Ding, X.; Bian, H.; Yao, X. Total concentrations and sources of heavy metal pollution in global river and lake water bodies from 1972 to 2017. Glob. Ecol. Conserv. 2020, 22, e00925. [Google Scholar] [CrossRef]
- Fajer, M.; Rzetala, M.A. Mill pond sediments as the indicator of the environment of the drainage area (an example of Liswarta River, Odra basin, Poland). Environ. Sci. Pollut. Res. 2018, 25, 5832–5847. [Google Scholar] [CrossRef] [PubMed] [Green Version]
- Tomza, I.; Lebecka, J. Radium-bearing waters in coal mines: Occurrence, methods of measurements and radiation hazard. In Proceedings of the International Conference on Radiation Hazards in Mining, Golden, CO, USA, 4–9 October 1981. [Google Scholar]
- Chałupnik, S.; Wysocka, M. Changes of radium concentration in discharge waters from coal mines in Poland as a result of mitigation. In Uranium, Mining and Hydrogeology; Merkel, B.J., Hasche-Berger, A., Eds.; Springer: Berlin/Heidelberg, Germany, 2008; ISBN 9783540877455. [Google Scholar] [CrossRef]
- Chałupnik, S.; Wysocka, M.; Janson, E.; Chmielewska, I.; Wiesner, M. Long term changes in the concentration of radium in discharge waters of coal mines and Upper Silesian rivers. J. Environ. Radioact. 2017, 171, 117–123. [Google Scholar] [CrossRef]
- Absalon, D.; Matysik, M. Changes in water quality and runoff in the Upper Oder River Basin. Geomorphology 2007, 92, 3–4, 106–118. [Google Scholar] [CrossRef]
- Barchańska, H.; Sajdak, M.; Szczypka, K.; Swientek, A.; Tworek, M.; Kurek, M. Atrazine, triketone herbicides, and their degradation products in sediment, soil and surface water samples in Poland. Environ. Sci. Pollut. Res. 2017, 24, 644–658. [Google Scholar] [CrossRef]
- Grabania, M. Upper Silesian Industrial District. Numbers-Facts-Problems; Silesia Publishing House: Katowice, Poland, 1964. [Google Scholar]
- Barbusiński, K.; Nocoń, W. Heavy Metal Compounds in the Bottom Sediments of the River Klodnica. Ochrona Srodowiska 2011, 33, 13–17. Available online: http://www.os.not.pl/docs/czasopismo/2011/1-2011/Barbusinski_1-2011.pdf (accessed on 8 January 2021). (In Polish).
- Barbusiński, K.; Nocoń, W.; Nocoń, K.; Kernert, J. The Role of Suspended Solids in the Transport of Heavy Metals in Surface Water, Exemplified by the Kiodnica River (Upper Silesia). Ochrona Srodowiska 2012, 34, 33–38. Available online: http://www.os.not.pl/docs/czasopismo/2012/2-2012/Barbusinski_2-2012.pdf (accessed on 8 January 2021). (In Polish).
- Czaja, S. Changes in Water Relations in Conditions of Strong Anthropopressure (on the Example of the Katowice Conurbation); University of Silesia: Katowice, Poland, 1999; pp. 73–75. (In Polish) [Google Scholar]
- Czaplicka-Kotas, A.; Ślusarczyk, Z.; Zagajska, J.; Szostak, A. Analysis of changes in the ion content of selected heavy metals in the water of the Goczałkowice Lake in the 1994–2007 years. Ochr. Srodowiska 2010, 32, 51–56. (In Polish) [Google Scholar]
- Kostecki, M.; Kowalski, E.; Domurad, A. Limnological tests of the dam reservoir Dzierżno Małe. Part II. Heavy metals in water and bottom sediments of the Drama river. Arch. Environ. Prot. 1998, 24, 45–56. (In Polish) [Google Scholar]
- Kostecki, M. Impact of cascade development on the content of heavy metals in bottom sediments of the Gliwice Canal. Arch. Environ. Prot. 2001, 27, 63–87. (In Polish) [Google Scholar]
- Nocoń, W.; Kostecki, M. Hydro-chemical characteristic of the Bytomka River. Arch. Environ. Prot. 2005, 31, 31–42. (In Polish) [Google Scholar]
- Nocoń, W.; Kostecki, M.; Kozłowski, J. Hydrochemical characteristics of the Kłodnica River. Ochr. Srodowiska 2006, 28, 39–44. (In Polish) [Google Scholar]
- Nocoń, W.; Nocoń, K.; Barbusiński, K.; Kernert, J. The influence of zinc-lead ore mining industry on the level of the Biała Przemsza bottom sediments contamination. Arch. Civ. Eng. Environ. 2012, 5, 65–70. [Google Scholar]
- Wójcicki, K.J. The valley-fill deposits of the Kłodnica River (Southern Poland): Environmental drivers of facies changes from the late vistulian through the holocene. Geochronometria 2010, 35, 49–66. [Google Scholar] [CrossRef] [Green Version]
- Wikipedia. Kłodnica. Available online: https://pl.wikipedia.org/wiki/K%C5%82odnica (accessed on 8 January 2021).
- Main Office of Geodesy and Cartography in Poland. Available online: https://www.geoportal.gov.pl/dane (accessed on 2 August 2013).
- Płonka, G. Outline of the History of Ligota and Panewnik: From the Beginning to Modern Times; Silesia Scientific: Katowice, Poland, 2010. (In Polish) [Google Scholar]
- Szaraniec, L. Settlements and Neighborhoods of Katowice; Silesia Scientific: Katowice, Poland, 1996. (In Polish) [Google Scholar]
- Rutkiewicz, P.; Malik, I.; Wistuba, M.; Osika, A. High concentration of charcoal hearth remains as legacy of historical ferrous metallurgy in southern Poland. Quat. Int. 2019, 512, 133–143. [Google Scholar] [CrossRef]
- Schmidt, J. History of Water Problems in Gliwice; PG Electronnics: Gliwice, Poland, 2002; ISBN 8386192317. (In Polish) [Google Scholar]
- Girczys, J.; Kupich, I. Chemical composition of mine water discharged from Zn-Pb ore mines in view of its management. J. Polish Miner. Eng. 2010, 11, 1–8. [Google Scholar]
- Szopa, S. Environmental Hazards Related to the Occurrence of Special Forms of Thallium, Arsenic and Antimony in the Waters and Bottom Sediments of the Kłodnica River. Ph.D. Thesis, Silesian University of Technology, Gliwice, Poland, 2013. [Google Scholar]
- Salamak, M.; Fross, K. Bridges in Urban Planning and Architectural Culture. Procedia Eng. 2016, 161, 207–212. [Google Scholar] [CrossRef] [Green Version]
- Salamak, M. Bridge solids kinematics in linear structures located on mining areas. In Proceedings of the 13th International Multidisciplinary Scientific Conference SGEM, Albena, Bulgaria, 16–22 June 2013; Volume 1, pp. 265–272. [Google Scholar] [CrossRef]
- Bargmann, H. Historische Bautabellen: Normen und Konstruktionshinweise 1870 bis 1960; Werner Verlag: Munich, Germany, 1993. [Google Scholar]
- Fotopolska.eu. Most nad Kłodnicą. Available online: https://fotopolska.eu/Gliwice/b282923,Most.html (accessed on 13 May 2019).
- CEN. EN ISO 12570:2000/A2:2018 Hygrothermal Performance of Building Materials and Products—Determination of Moisture Content by Drying at Elevated Temperature; CEN: Brussels, Belgium, 2018. [Google Scholar]
- Behnood, A.; Van Tittelboom, K.; Belie, N.D. Methods for measuring pH in concrete: A review. Constr. Build. Mater. 2016, 105, 76–188. [Google Scholar] [CrossRef]
- Miszczak, E.; Twardowska, I. ICP-MS as a Tool for the Environmental Impact Assessment of Waste and Leakage, Institute of Fundamentals of Environmental Engineering, Polish Academy of Sciences in Zabrze. 2011. Available online: http://www.labportal.pl/article/icp-ms-jako-narzedzie-do-oceny-oddzialywania-na-srodowisko-odpadow-i-wyciekow (accessed on 6 October 2011).
- Jia, X.; Gong, D.; Xu, B.; Chi, Q.; Zhang, X. Development of a novel, fast, sensitive method for chromium speciation in wastewater based on an organic polymer as solid phase extraction material combined with HPLC–ICP-MS. Talanta 2016, 147, 155–161. [Google Scholar] [CrossRef]
- Bartoszek, B.; Grynkiewicz-Bylina, B.; Gawlik-Jędrysiak, M. Testing the Process of Leaching the Dangerous Elements from Samples of Construction Materials Used in Geoengineering Objects; Research Project; KOMAG Institute of Mining Technology: Gliwice, Poland, 2020; (Not Published, In Polish). [Google Scholar]
- PN. PN-EN 12457-4: 2006 Characterization of Waste—Leaching—Conformity Test for Leaching of Granular Waste Materials and Sludge—Part 4: One-Stage Batch Test with a Liquid/Solid Ratio of 10 L/kg for Materials with a Particle Size of Less THAN 10 mm (no Reduction or with Size Reduction); PN: Warszawa, Poland, 2006. [Google Scholar]
- Słomka-Słupik, B.; Zybura, A. Changes of the cement paste structure under decalcification. Cem. Wap. Bet. 2010, 15, 333–339. Available online: http://cementwapnobeton.pl/pdf/2010/2010_6/Slomka-06-10.pdf (accessed on 13 May 2019).
- Słomka-Słupik, B.; Bury, T. Concrete decalcification as a threat of destruction of selected nuclear power plants objects. Ochr przed Koroz 2017, 60, 157–161. (In Polish) [Google Scholar]
- Słomka-Słupik, B.; Podwórny, J.; Staszuk, M. Corrosion of cement pastes made of CEM I and CEM III/A caused by a saturated water solution of ammonium chloride after 4 and 25 days of aggressive immersion. Constr. Build. Mater. 2018, 170, 279–289. [Google Scholar] [CrossRef]
- Baldermann, C.; Baldermann, A.; Furat, O.; Krüger, M.; Nachtnebel, M.; Schroettnerd, H.; Juhart, J.; Schmidt, V.; Tritthart, J. Mineralogical and microstructural response of hydrated cement blends to leaching. Constr. Build. Mater. 2019, 229, 116902. [Google Scholar] [CrossRef]
- Samson, E.; Marchand, J.; Beaudoin, J. Modeling the influence of chemical reactions on the mechanisms of ionic transport in porous materials. Cem. Con. Res. 2000, 30, 1895–1902. [Google Scholar] [CrossRef]
- Thaulow, N.; Sahu, S. Mechanism of concrete deterioration due to salt crystallization. Mater. Charact. 2004, 53, 123–127. [Google Scholar] [CrossRef]
- Egüez, Á.H.; De Belie, N.; De Schutter, G. Proposed mechanism for the formation of oxychloride crystals during sodium chloride application as a deicer salt in carbonated concrete. Constr. Build. Mater. 2016, 109, 188–197. [Google Scholar] [CrossRef]
- Kušter, M.M.; Ožbolt, J.; Balabanić, G. Reinforced concrete bridge exposed to extreme maritime environmental conditions and mechanical damage: Measurements and numerical simulation. Eng. Struct. 2020, 205, 110078. [Google Scholar] [CrossRef]
- Shia, W.; Najimia, M.; Shafei, B. Reinforcement corrosion and transport of water and chloride ions in shrinkage-compensating cement concretes. Cem. Concr. Res. 2020, 135, 106121. [Google Scholar] [CrossRef]
- Zhao, G.; Li, J.; Shi, M.; Cui, J.; Xie, F. Degradation of cast-in-situ concrete subjected to sulphate-chloride combined attack. Constr. Build. Mater. 2020, 241, 117995. [Google Scholar] [CrossRef]
- PN. PN-EN 206-1: 2003/Ap1: 2004 Concrete. Part 1. Requirements, Properties, Production, and Compliance, Point 5.2.8; PN: Warszawa, Poland, 2004. [Google Scholar]
- Ravikumar, P.; Prakash, K.L.; Somashekar, R.K. Evaluation of water quality using geochemical modeling in the Bellary Nala Command area, Belgaum district, Karnataka State, India. Carbonates Evaporites 2013, 28, 365–381. [Google Scholar] [CrossRef]
- Bolewski, A. Detailed Mineralogy; Geological Publications: Warsaw, Poland, 1975. (In Polish) [Google Scholar]
- Cwalina, B. Biodeterioration of concrete. Archit. Civ. Eng. Environ. 2008, 1, 133–140. [Google Scholar]
- Hillier, S.R.; Sangha, C.M.; Plunkett, B.A.; Walden, P.J. Long-term leaching of toxic trace metals from Portland cement concrete. Cem. Concr. Res. 1999, 29, 515–521. [Google Scholar] [CrossRef]
- Malviya, R.; Chaudhary, R. Leaching behavior and immobilization of heavy metals in solidified/stabilized products. J. Hazard. Mater. 2006, 137, 207–217. [Google Scholar] [CrossRef]
- Martemianov, D.; Xie, B.-B.; Yurmazova, T.; Khaskelberg, M.; Wang, F.; Wei, C.-H.; Preis, S. Cellular concrete-supported cost-effective adsorbents for aqueous arsenic and heavy metals abatement. J. Environ. Chem. Eng. 2017, 5, 3930–3941. [Google Scholar] [CrossRef]
- Giergiczny, Z.; Król, A. Immobilization of heavy metals (Pb, Cu, Cr, Zn, Cd, Mn) in the mineral additions containing concrete composites. J. Hazard. Mater. 2008, 160, 247–255. [Google Scholar] [CrossRef]


| Metal | Metals in Bottom Sediments (Min–Max) in 2011–2012 (mg/kg) | Metals in Suspensions (Min–Max) in 2011–2012 (mg/kg) | Metals in Suspensions (Max) at the End of the 90s (mg/kg) |
|---|---|---|---|
| Zn | 35–500 | <6610 | 11,500 |
| Pb | 7–80 | 4–599 | 742 |
| Cu | 1–46 | >100 | 2462 |
| Ni | 1–30 | 3–74 | 3317 |
| Cr | 1–24 | <40 | 1613 |
| Cd | 1.3–8.1 | 0.2–72.9 | 120 |
| Fe | <1000 | 720–6300 | 385,072 |
| Mn | 10–1000 | 13–9600 | 22,107 |
| Year | Chlorides (mg Cl−/L) | Sulphates (mg SO42−/L) | Solute (mg/L) | Mg (mg/L) | Cr (mg/L) | Cu (mg/L) | Pb (mg/L) | Fe (mg/L) |
|---|---|---|---|---|---|---|---|---|
| 1992 | 1117–2647 | 213–432 | 2588–3965 | nd | nd | 0.01 | 0.01–0.02 | nd |
| 2002 | 904–2107 | 221–597 | 2436–4966 | 50–103 | 0.01 | 0.01–0.015 | 0.042 | 0.292–0.874 |
| 2003 | 1700–3200 | 300–700 | 3800–7000 | nd | nd | nd | nd | nd |
| 2004 | 1100–2500 | 250–630 | 2700–5700 | nd | nd | nd | nd | nd |
| 2005 | 2920–3430 | 360–730 | 6240–7460 | 129–159 | 0.01 | 0.01 | 0.002 | 0.129–0.275 |
| 2006 | 986–2266 | 160–492 | 2270–5170 | nd | 0.01 | 0.01 | 0.01–0.04 | 0.11–0.18 |
| 2007 | 1713–1890 | 250–600 | 4575 | 99 | 0.003 | 0.004 | 0.001 | 0.1–0.3 |
| 2008 | 1397–1787 | 247–552 | 3099–4406 | 59–94 | 0.015 | 0.02 | nd | nd |
| 2012 | 1824–2039 | 410–640 | 4320–3890 | nd | <0.01 | 0.054 | nd | nd |
| 2018 | 883–1904 | 289–582 | 2109–5073 | nd | nd | 0.004 | nd | nd |
| Year | Cu (mg/L) | Cd (μg/L) | Pb (μg/L) | Ni (μg/L) |
|---|---|---|---|---|
| 2016 | 0.01–0.012 | 0.15–0.39 | 0.6–2.1 | 3.9–4.1 |
| 2017 | nd | 0.15 | 1.09–2.28 | 5.28–5.40 |
| 2018 | 0.004 | 0.07–0.34 | 1.2–2.1 | 3.0–3.1 |
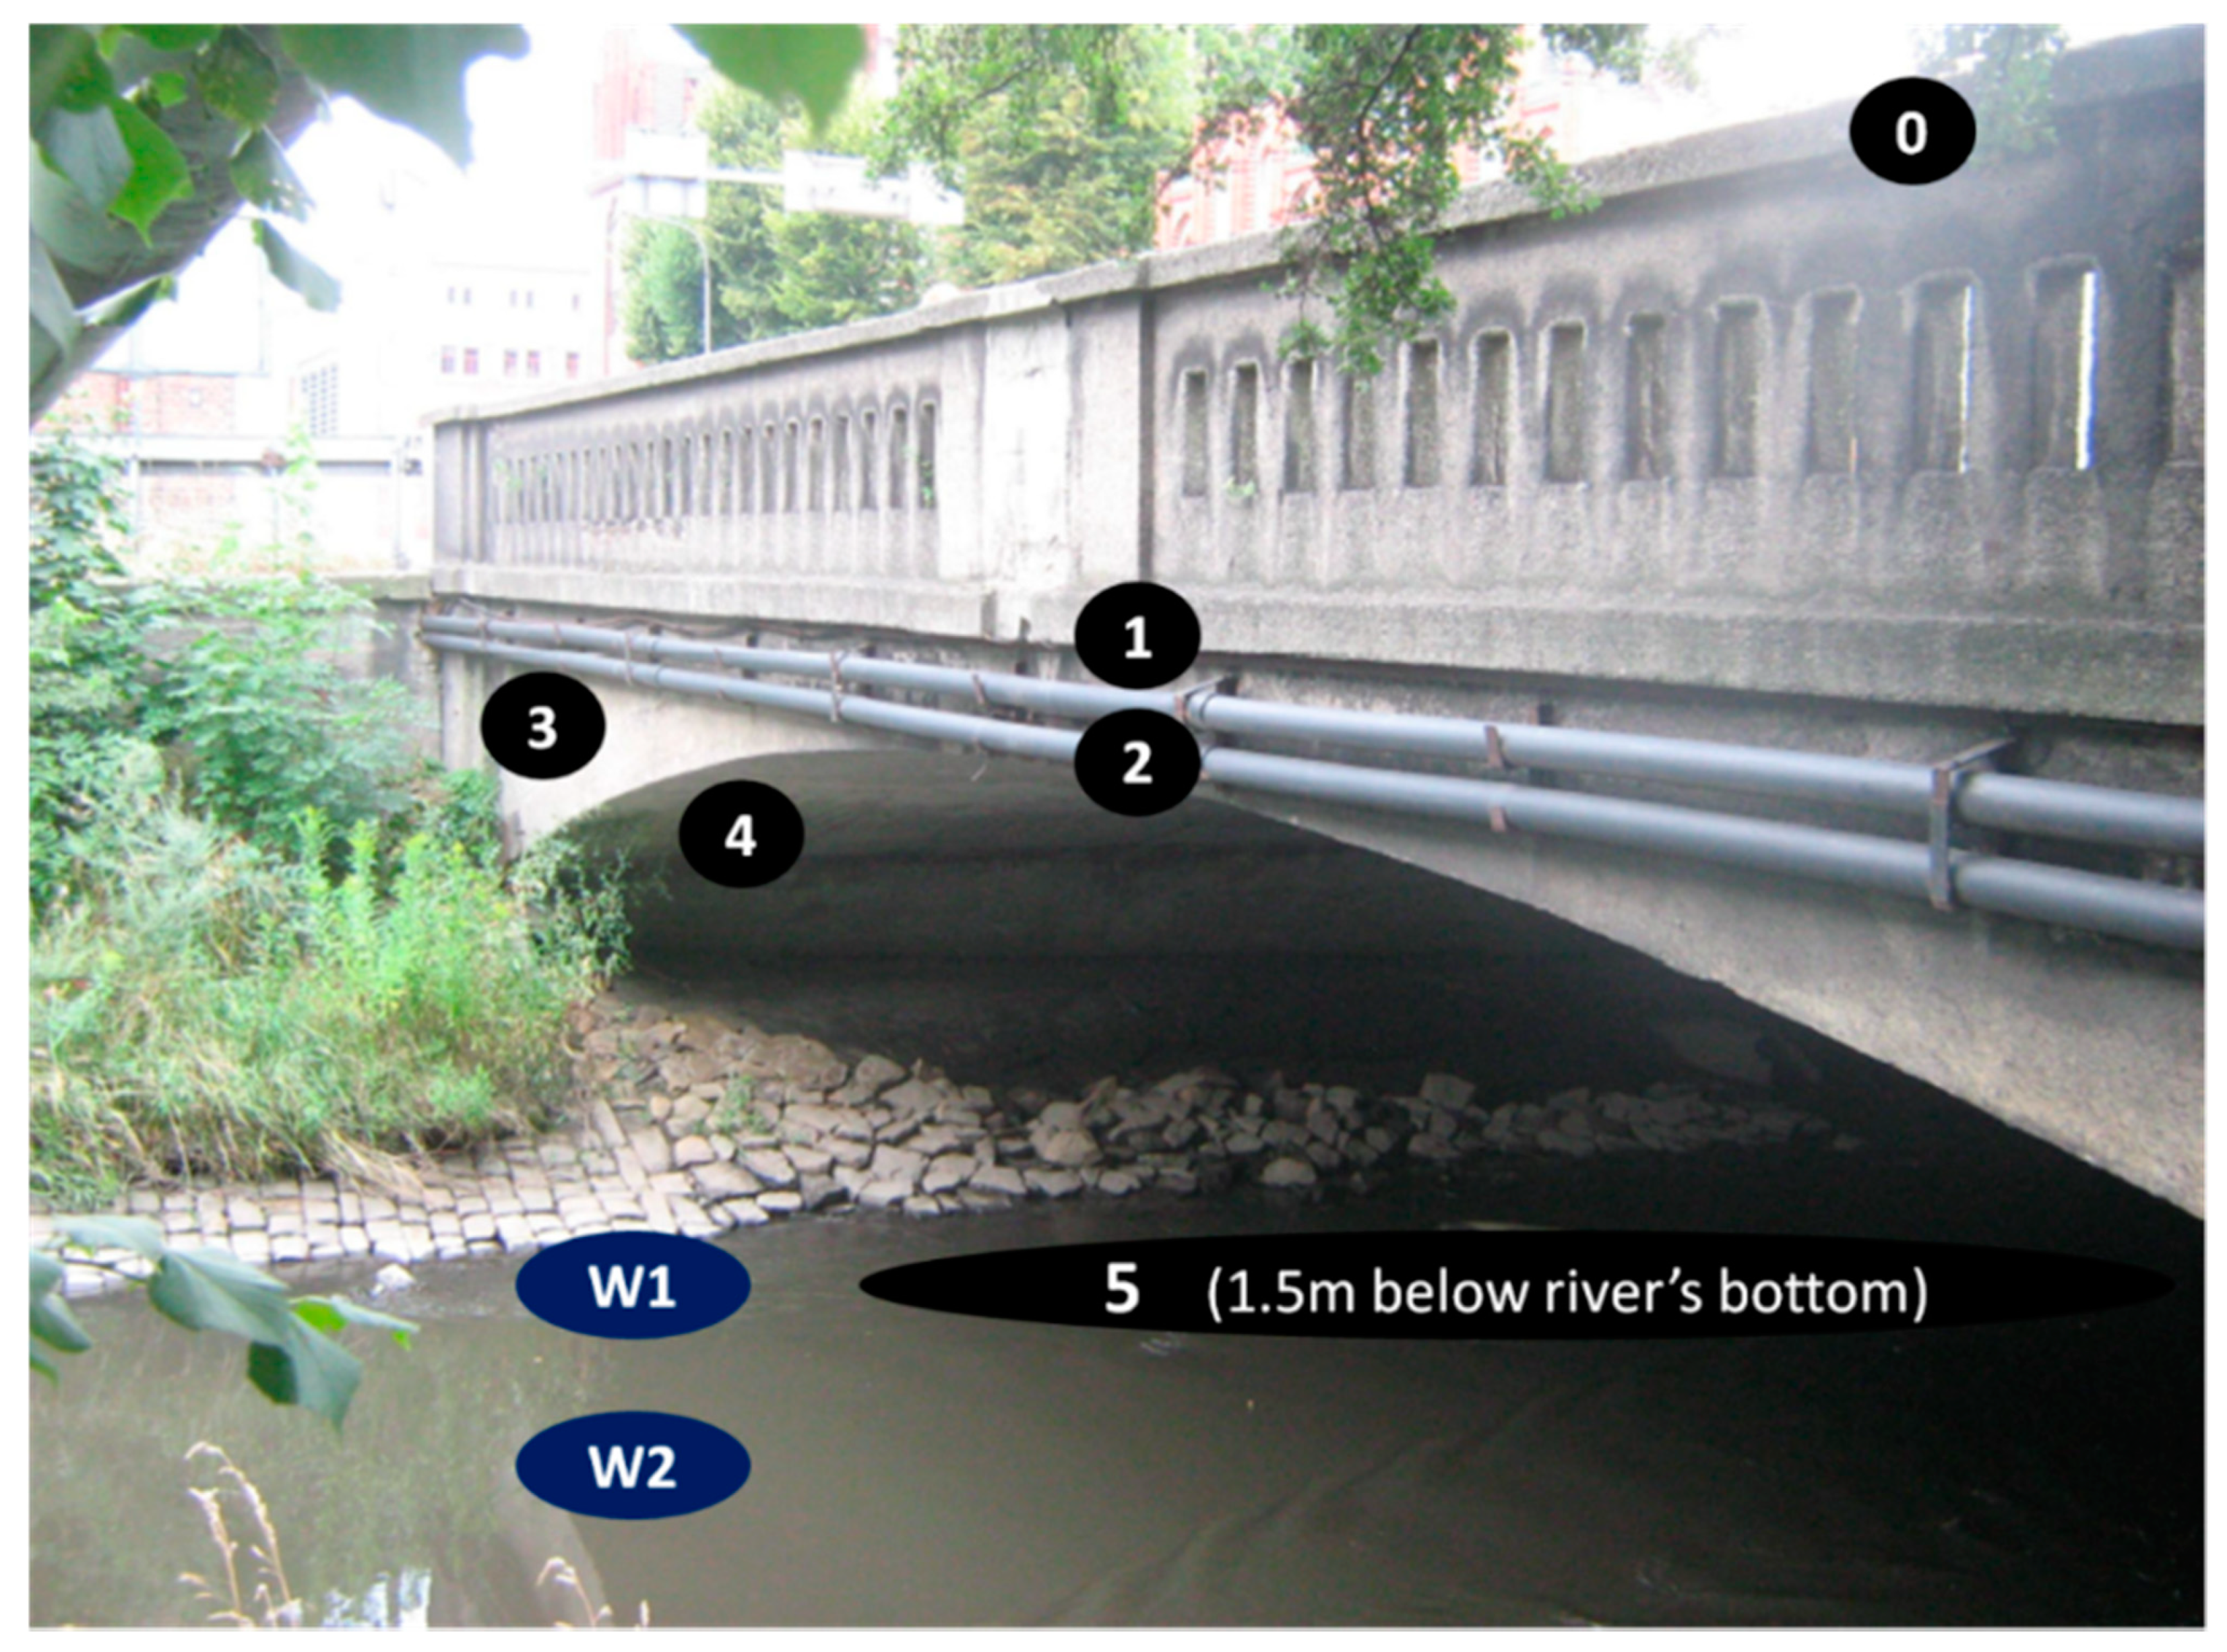
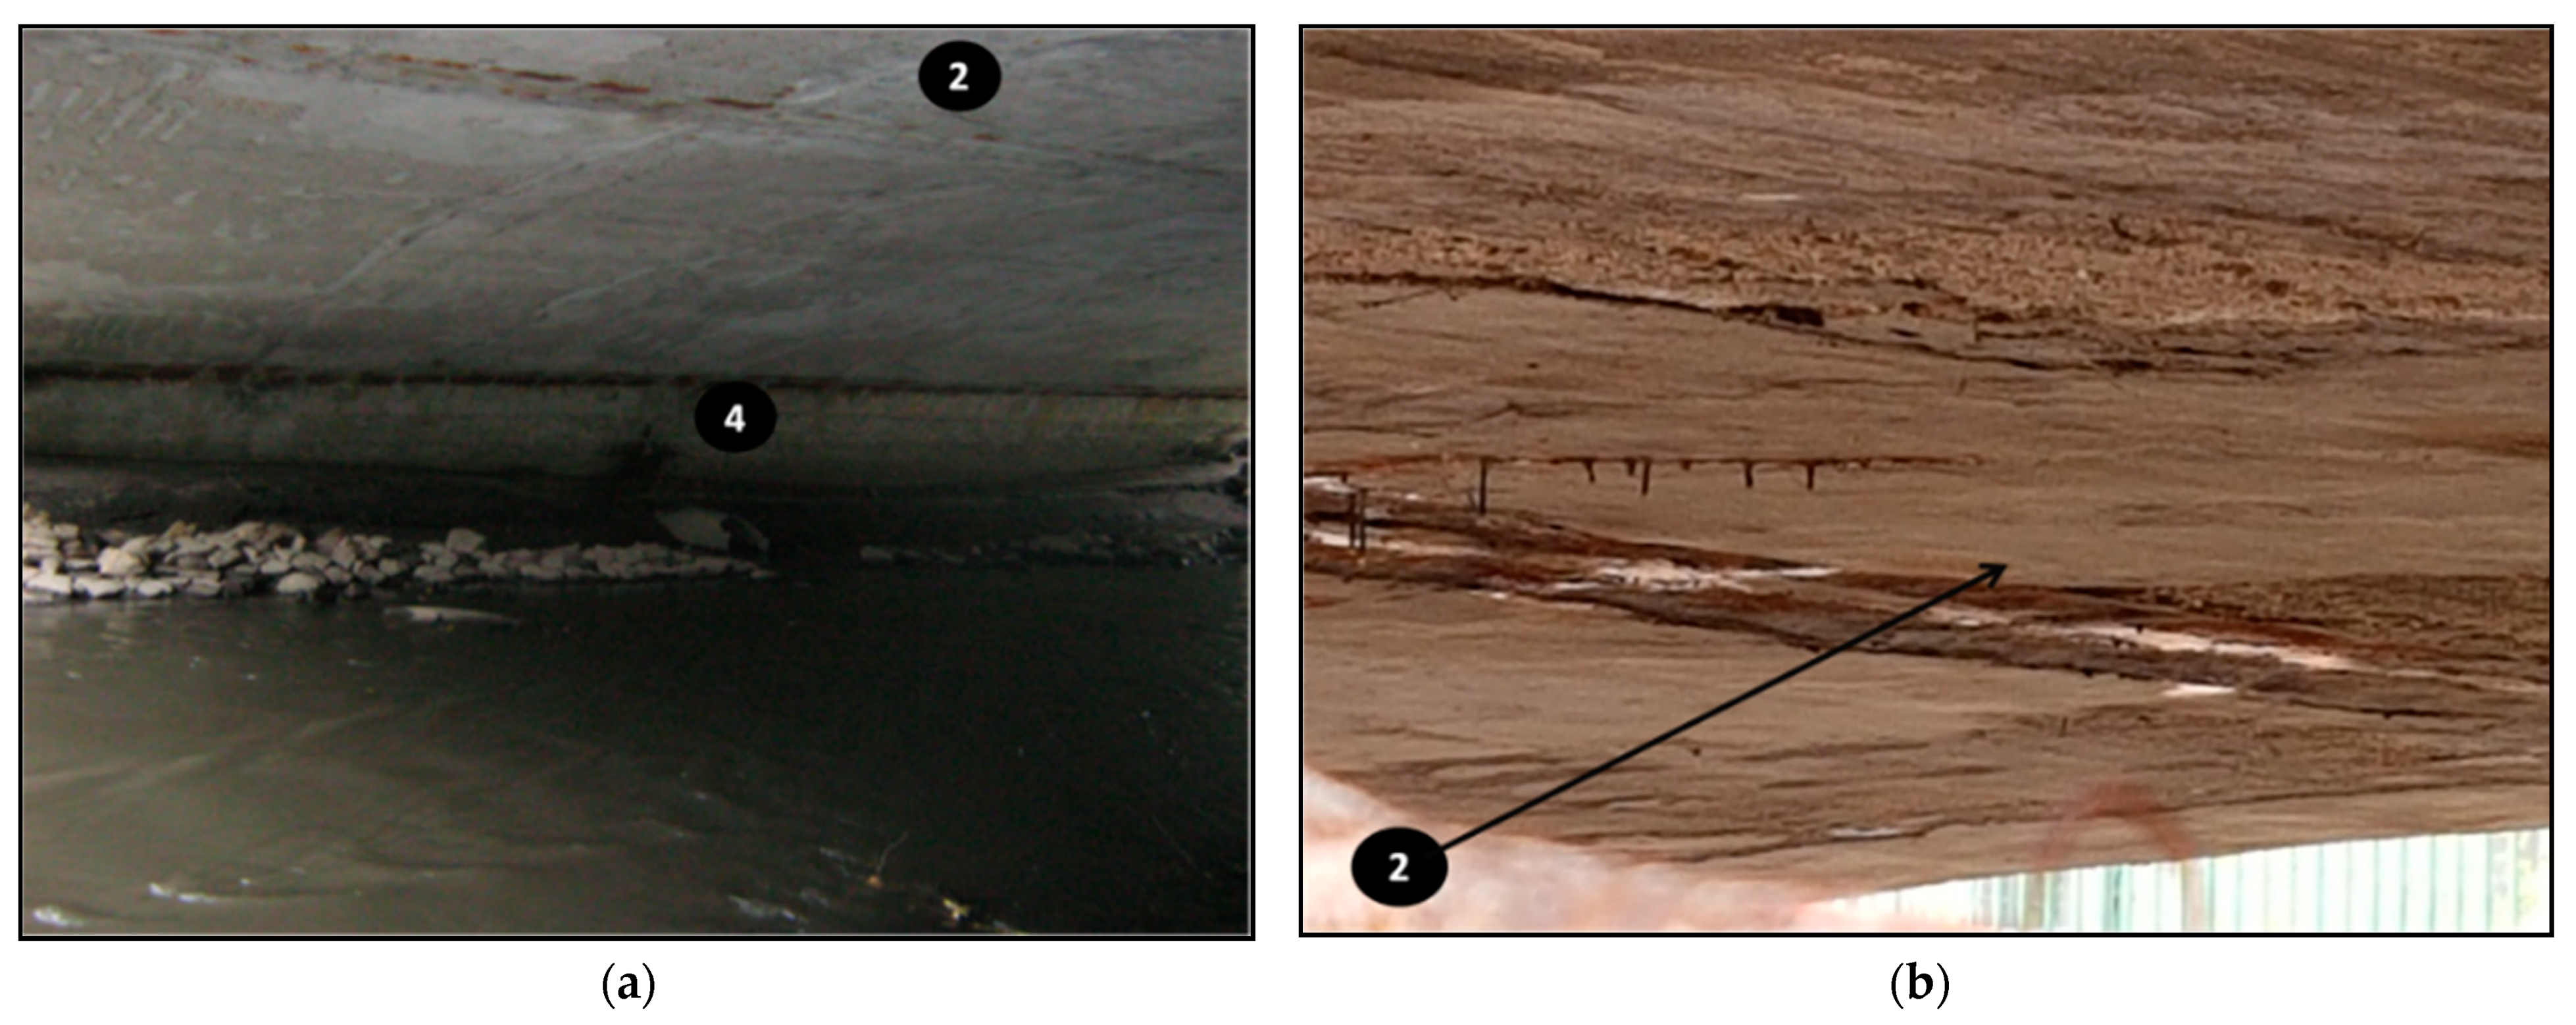
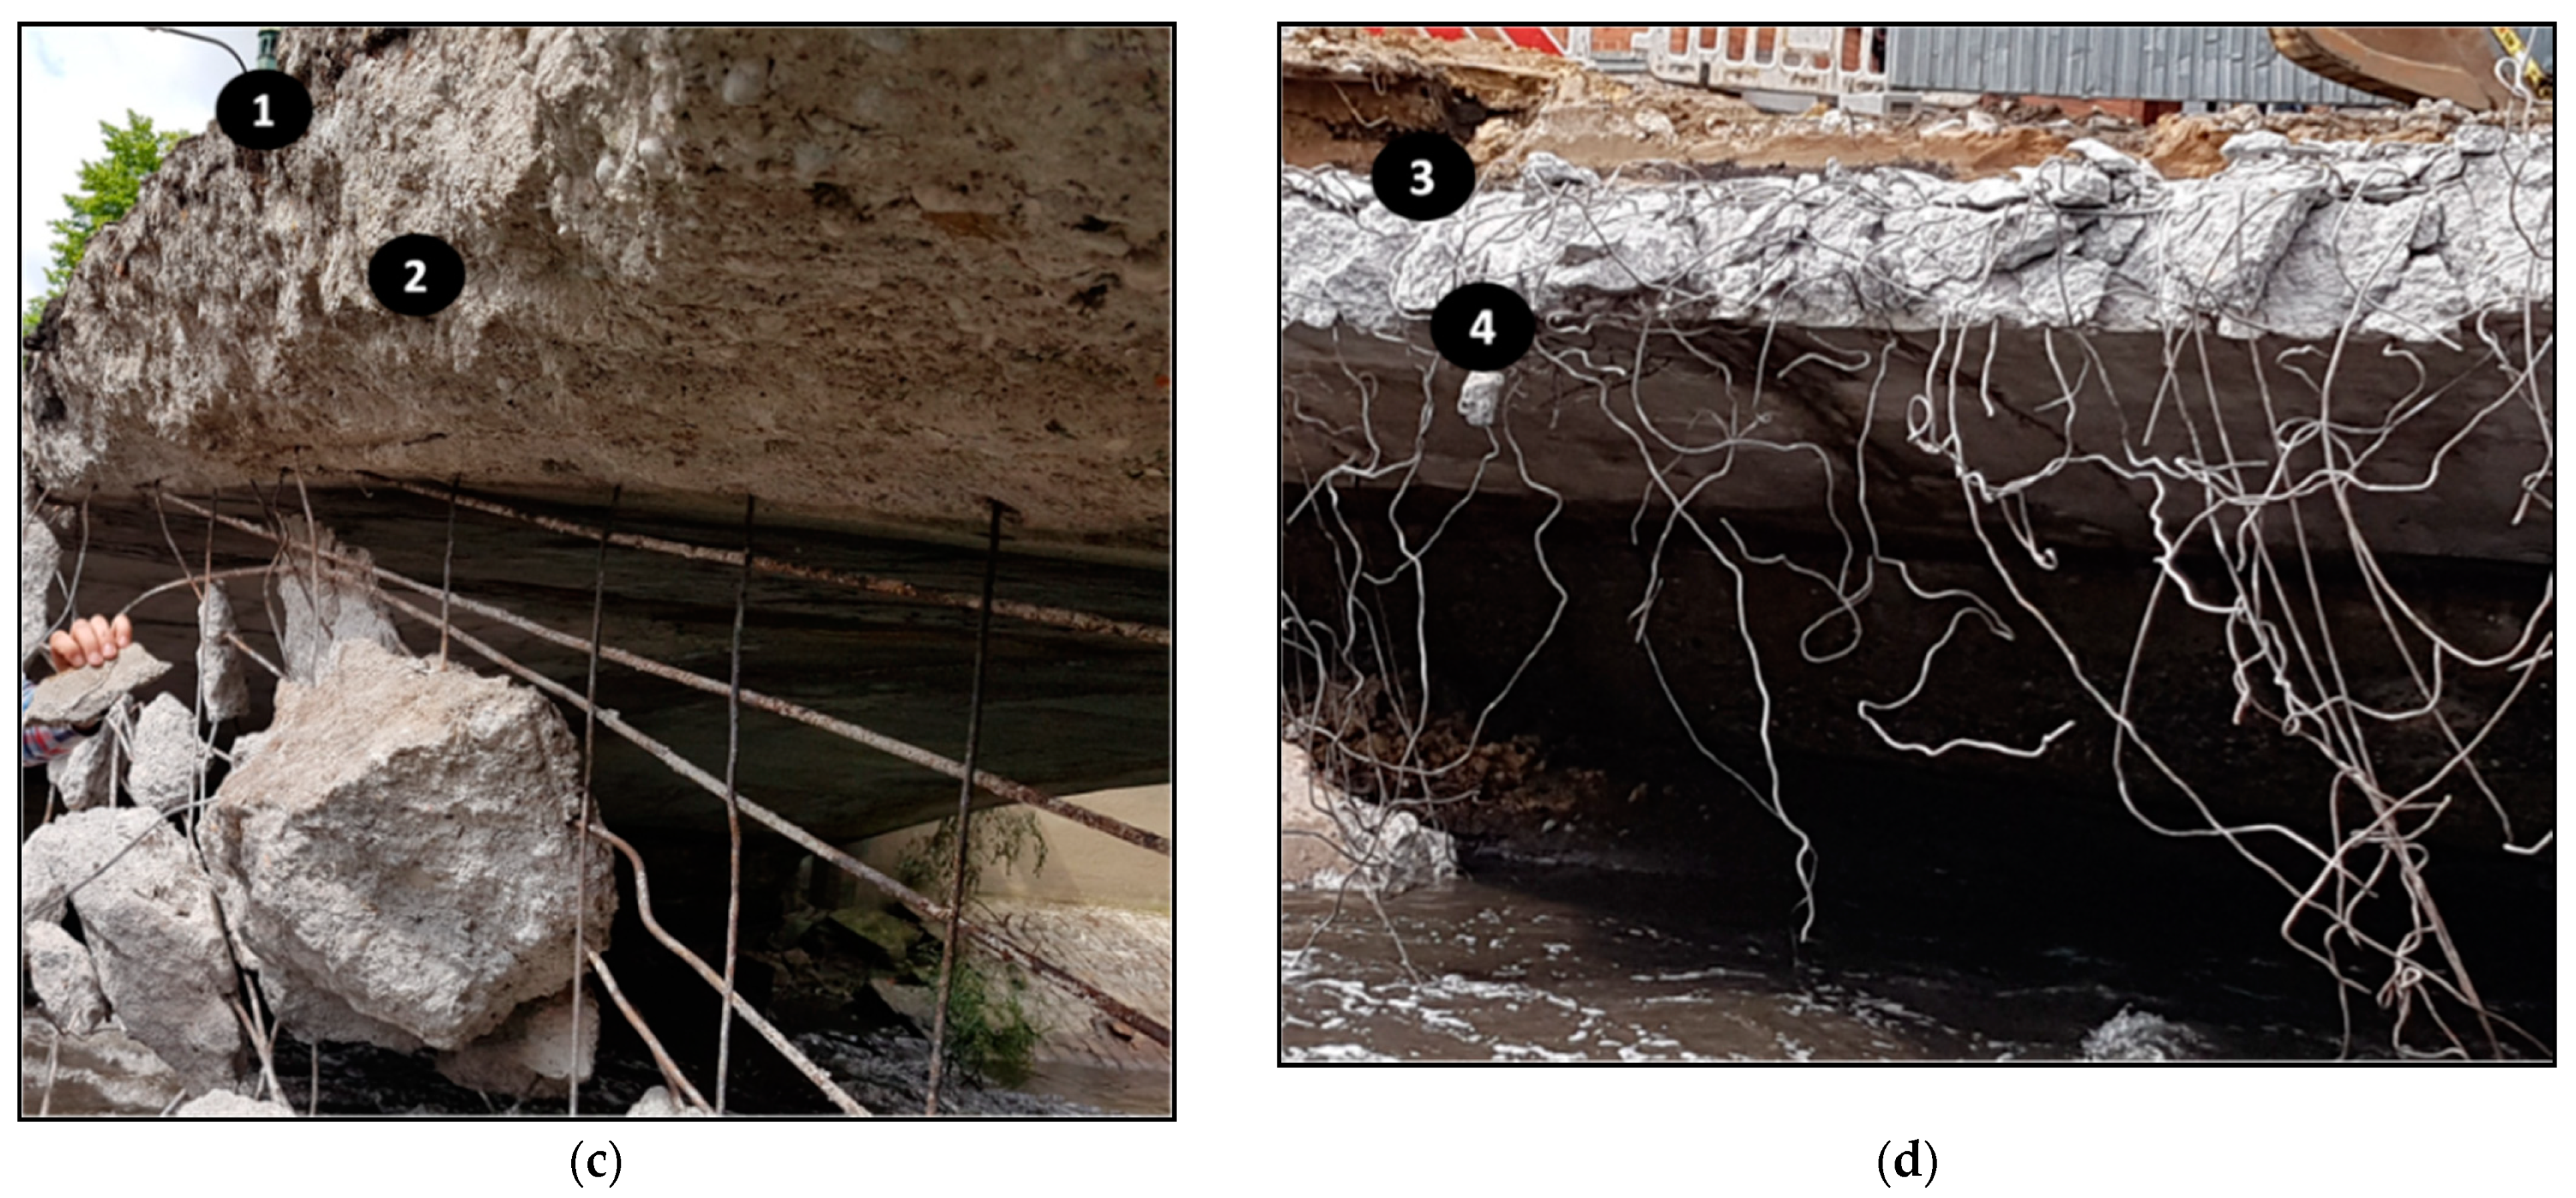
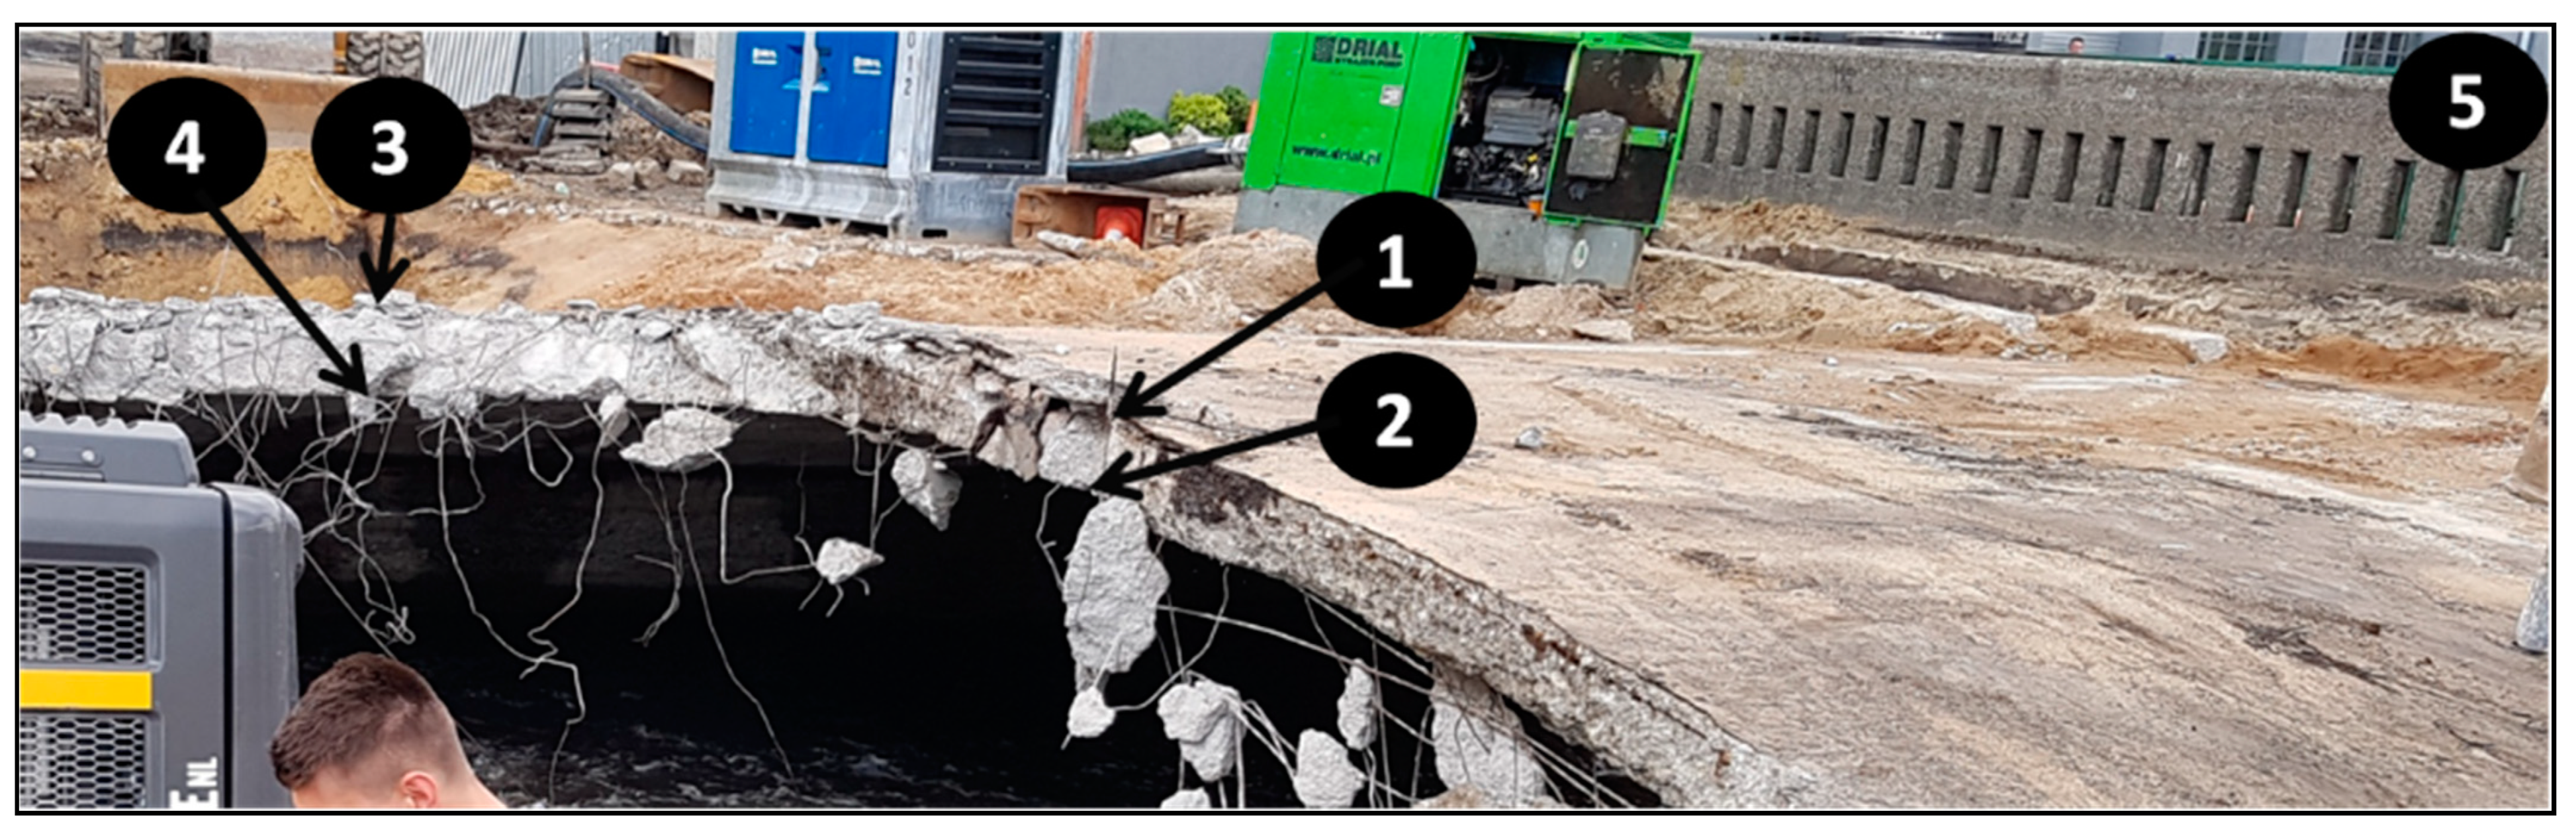
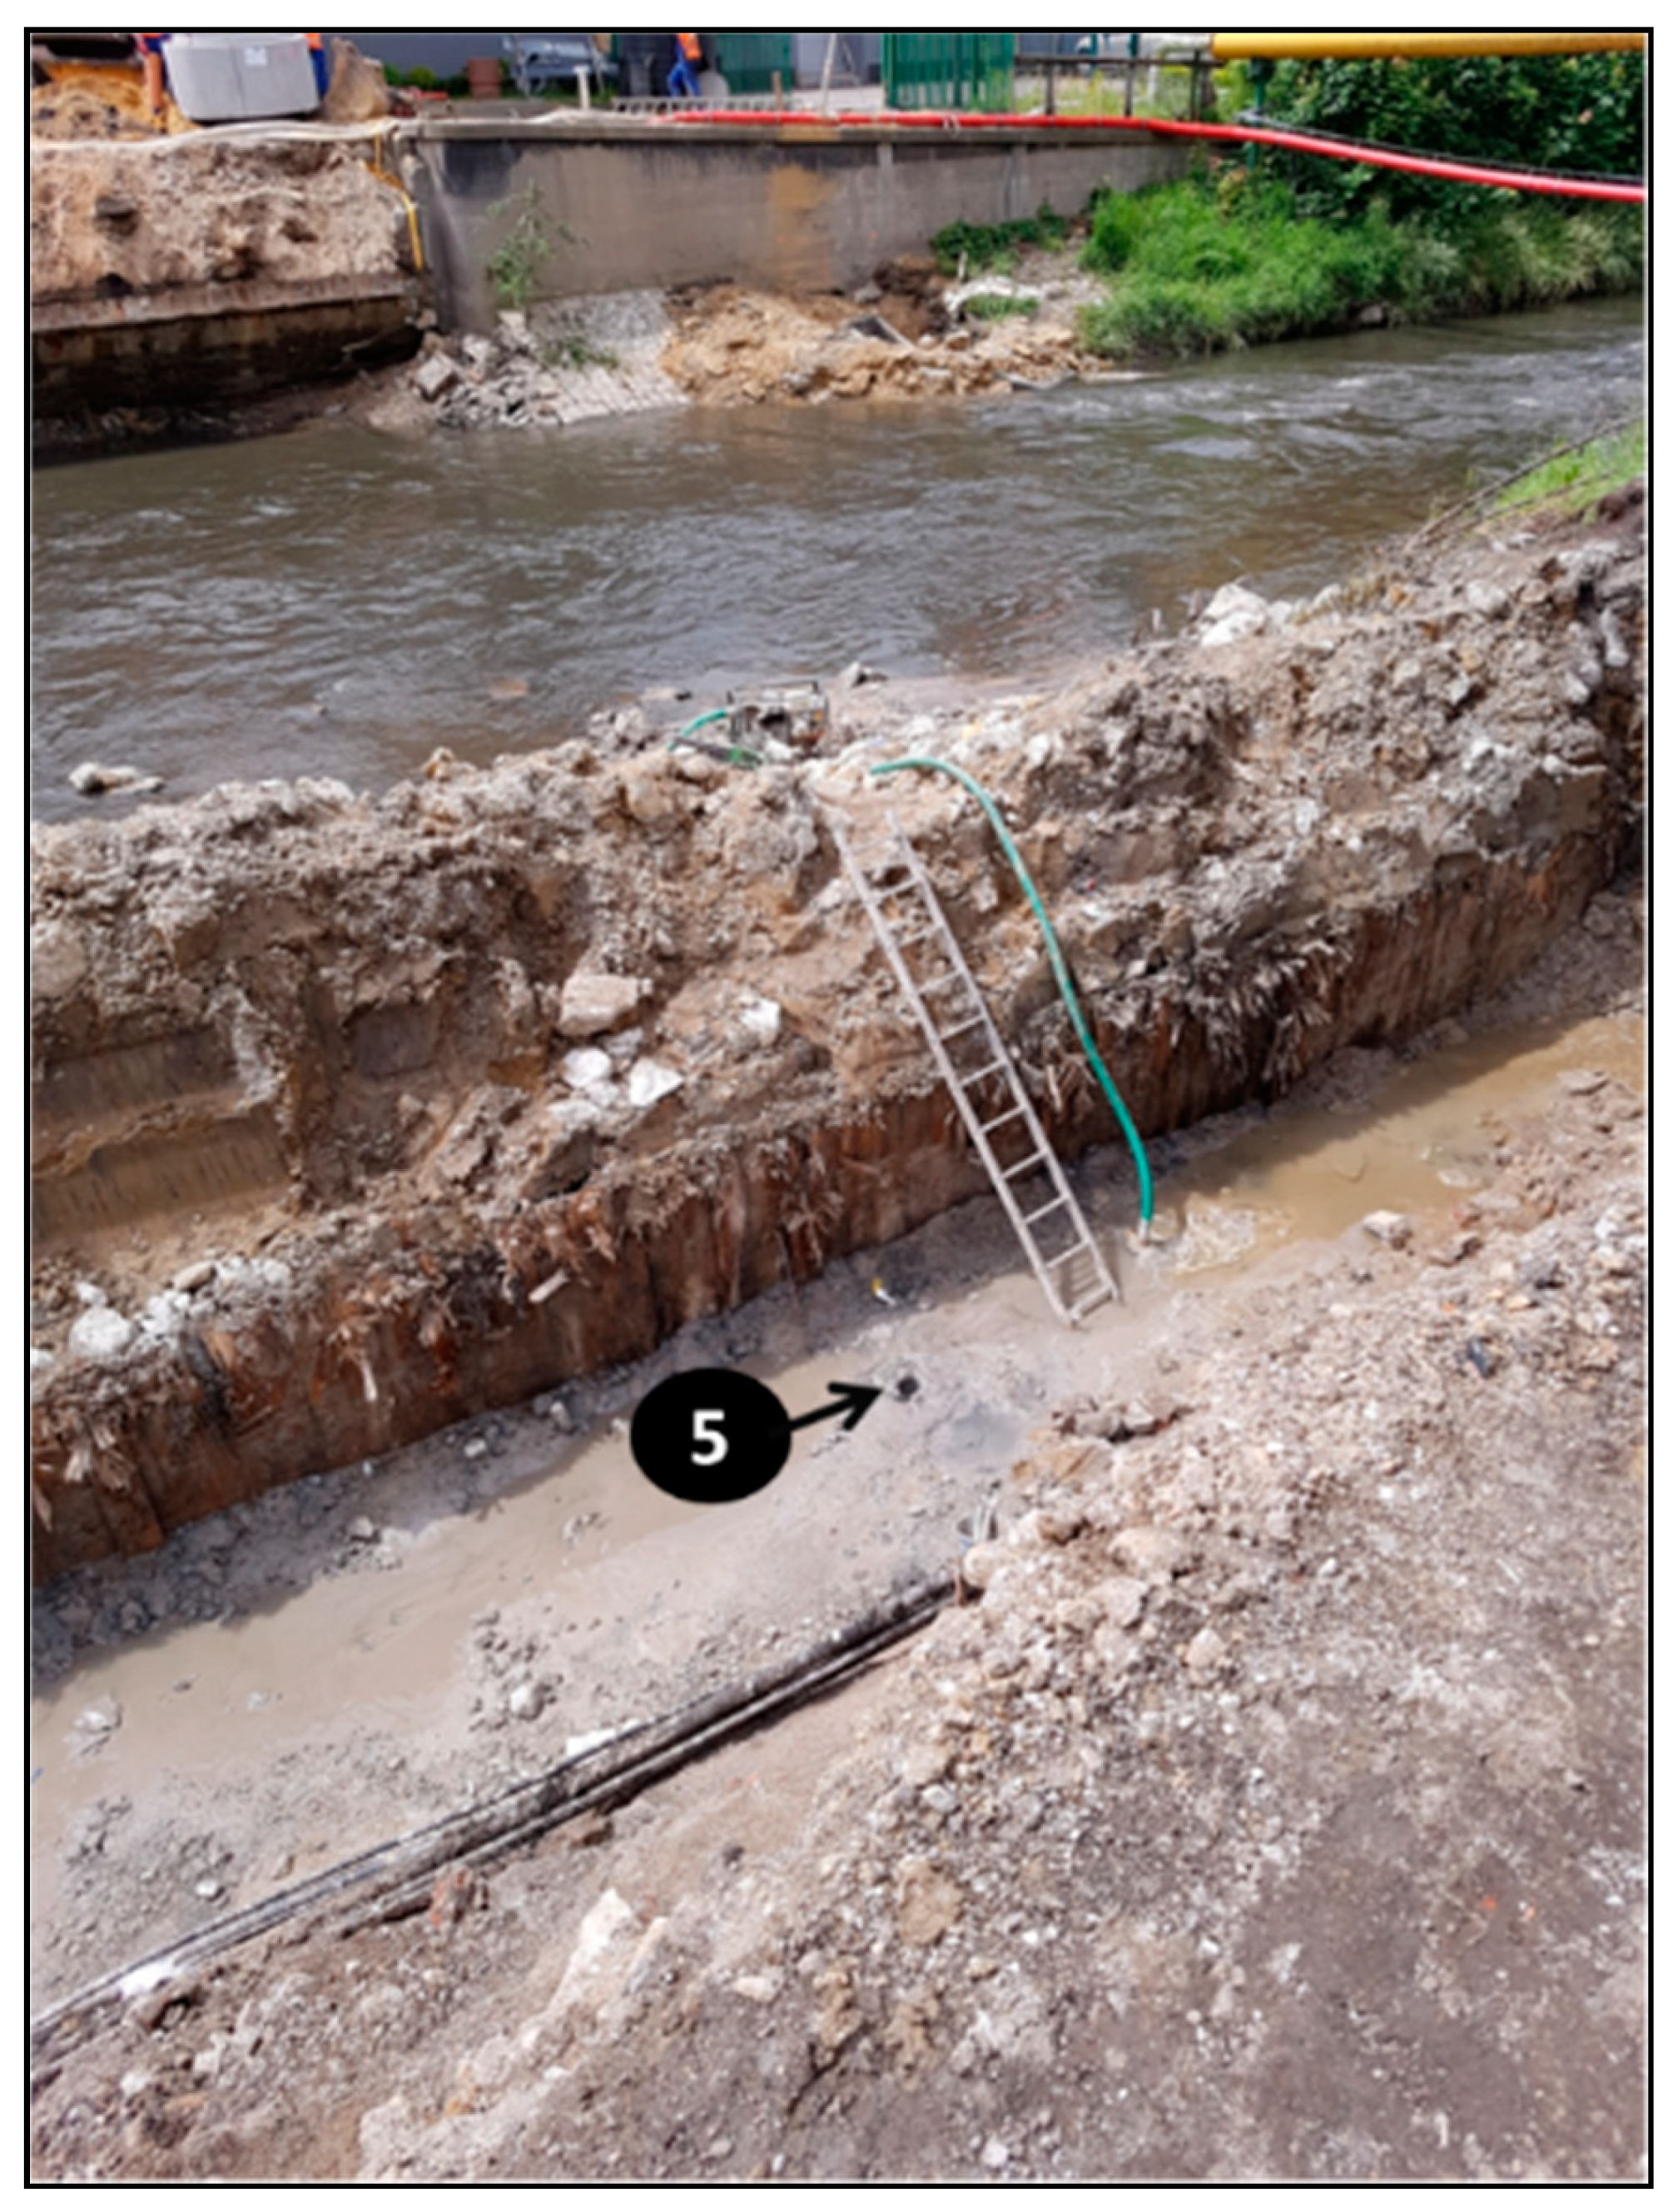
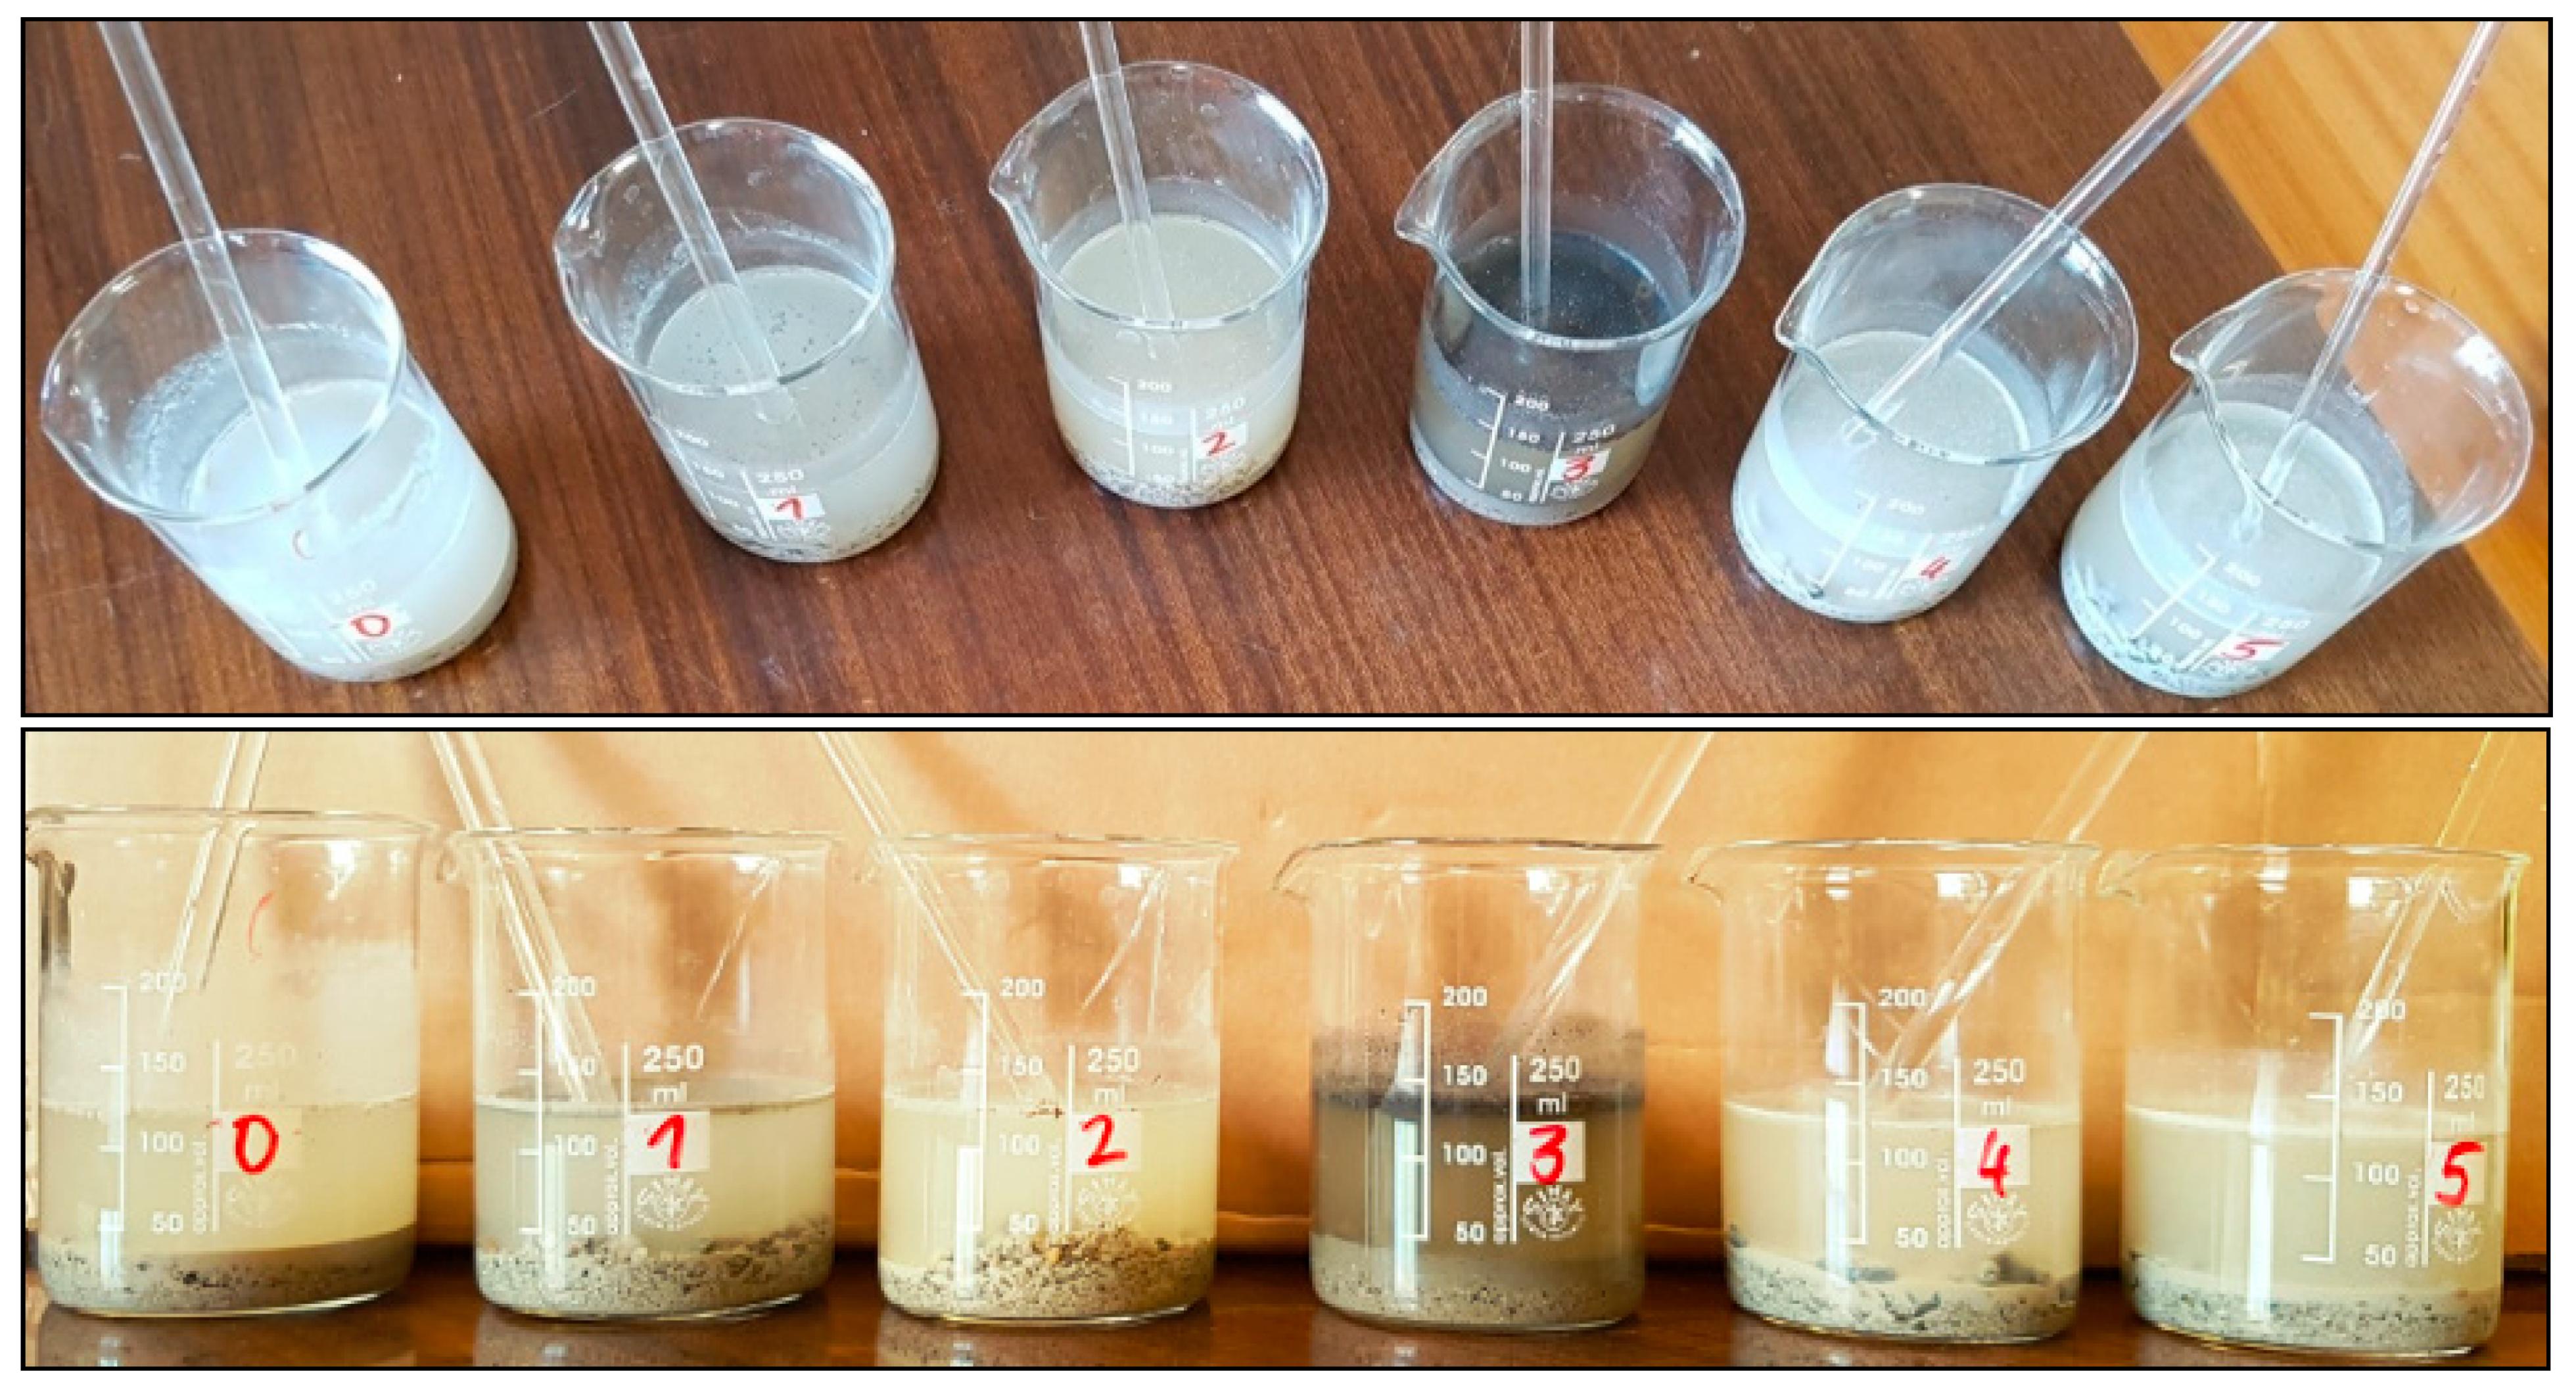
| Sample | Location of the Sample | Comments/Criteria |
|---|---|---|
| 0 | Concrete railings | Exposed to the influence of the urban environment, road transport, river condensate |
| 1 | Top part of the crown block | Exposed to river condensates but mainly to salt and rainwater solutions leaking asphalt and exposed to internal components (e.g., bitumen from insulation) |
| 2 | Bottom part of the crown block | Most exposed to vapors |
| 3 | Top part of the extremity of an arch | Exposed to corrosion in the least way |
| 4 | Bottom part of the extremity of an arch | Exposed to vapors and freezing |
| 5 | Drilled from foundations 1.5 m below the bottom of the river | About 1 m below the ordinate of the river bottom, exposed to groundwater |
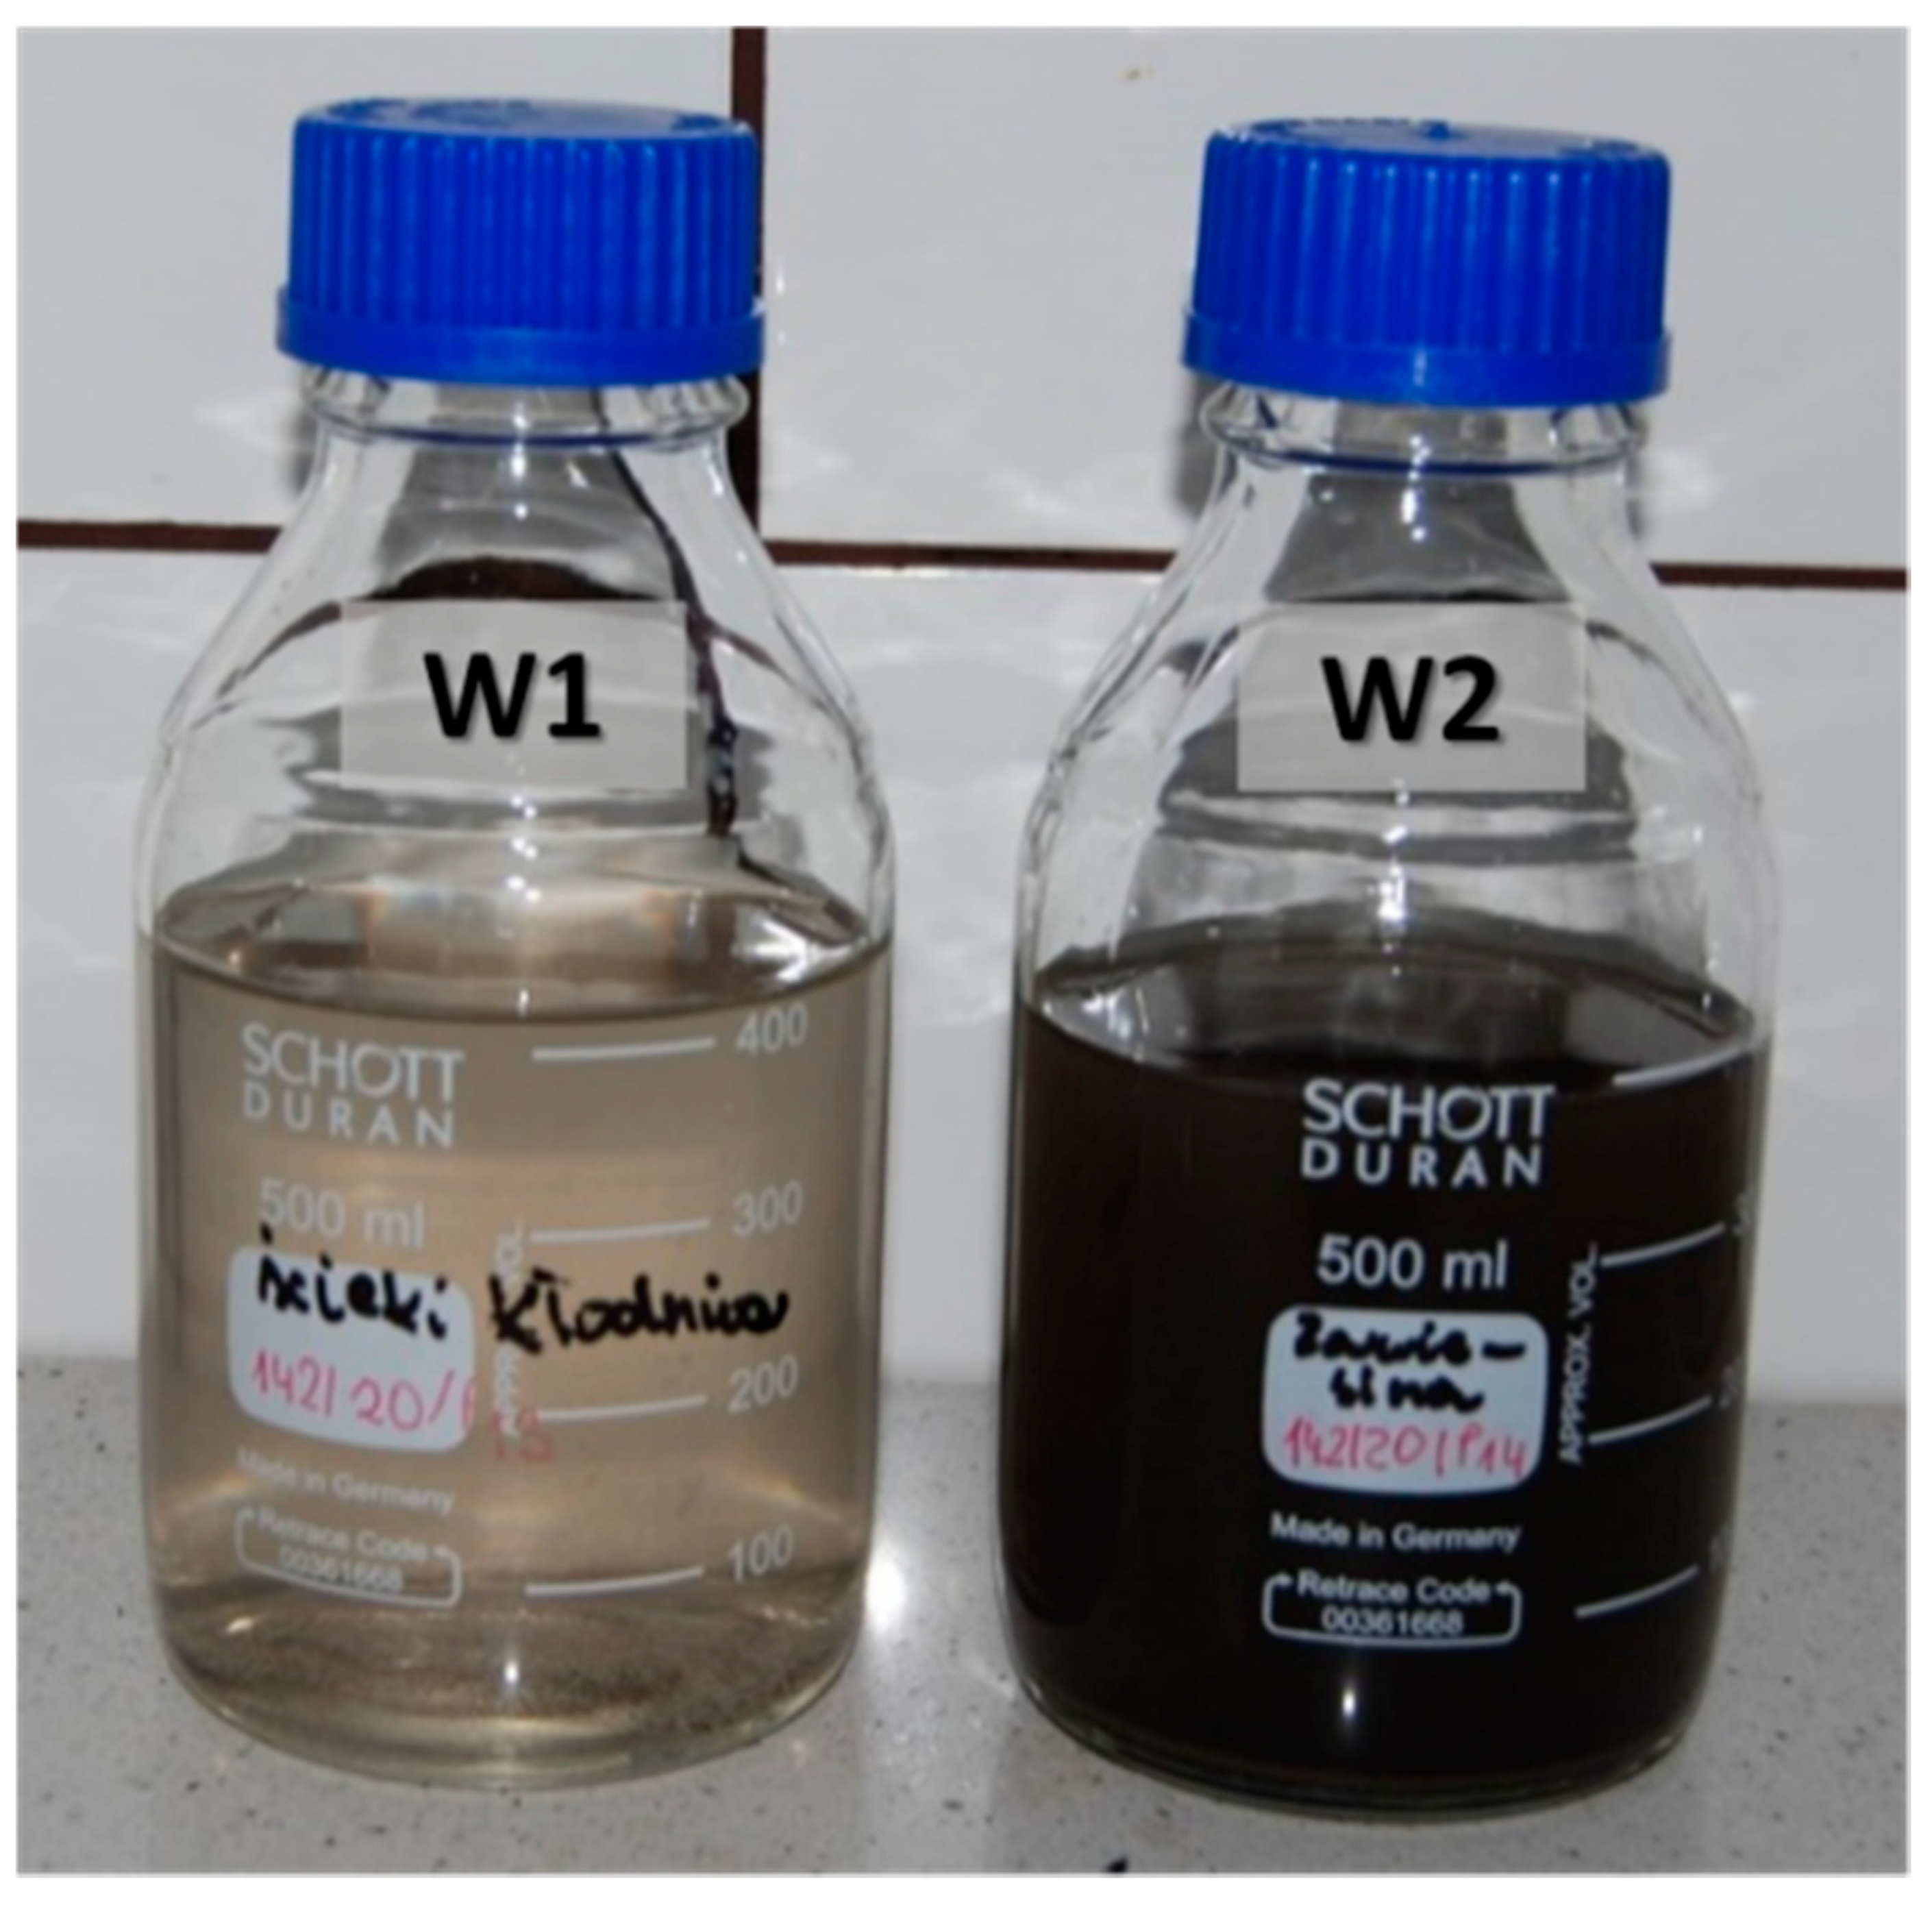
| W1 | Flowing water from the river | Collected at the riverbank, upstream |
| W2 | Water with sediment from the river taken at the river bottom | Samples after dynamic elution of suspension and filtration: (a) Water; (b) dried at 40 °C to a constant sediment mass |
| Specimen | Moisture, %mas. | pH | Soluble Phase, %mas. |
|---|---|---|---|
| 0 | 5.3 | 11.00 | 16.7 |
| 1 | 5.1 | 10.62 | 9.9 |
| 2 | 2.8 | 10.51 | 12.1 |
| 3 | 5.9 | 12.00 | 17.6 |
| 4 | 6.2 | 11.94 | 12.0 |
| 5 | 5.0 | 11.72 | 10.5 |
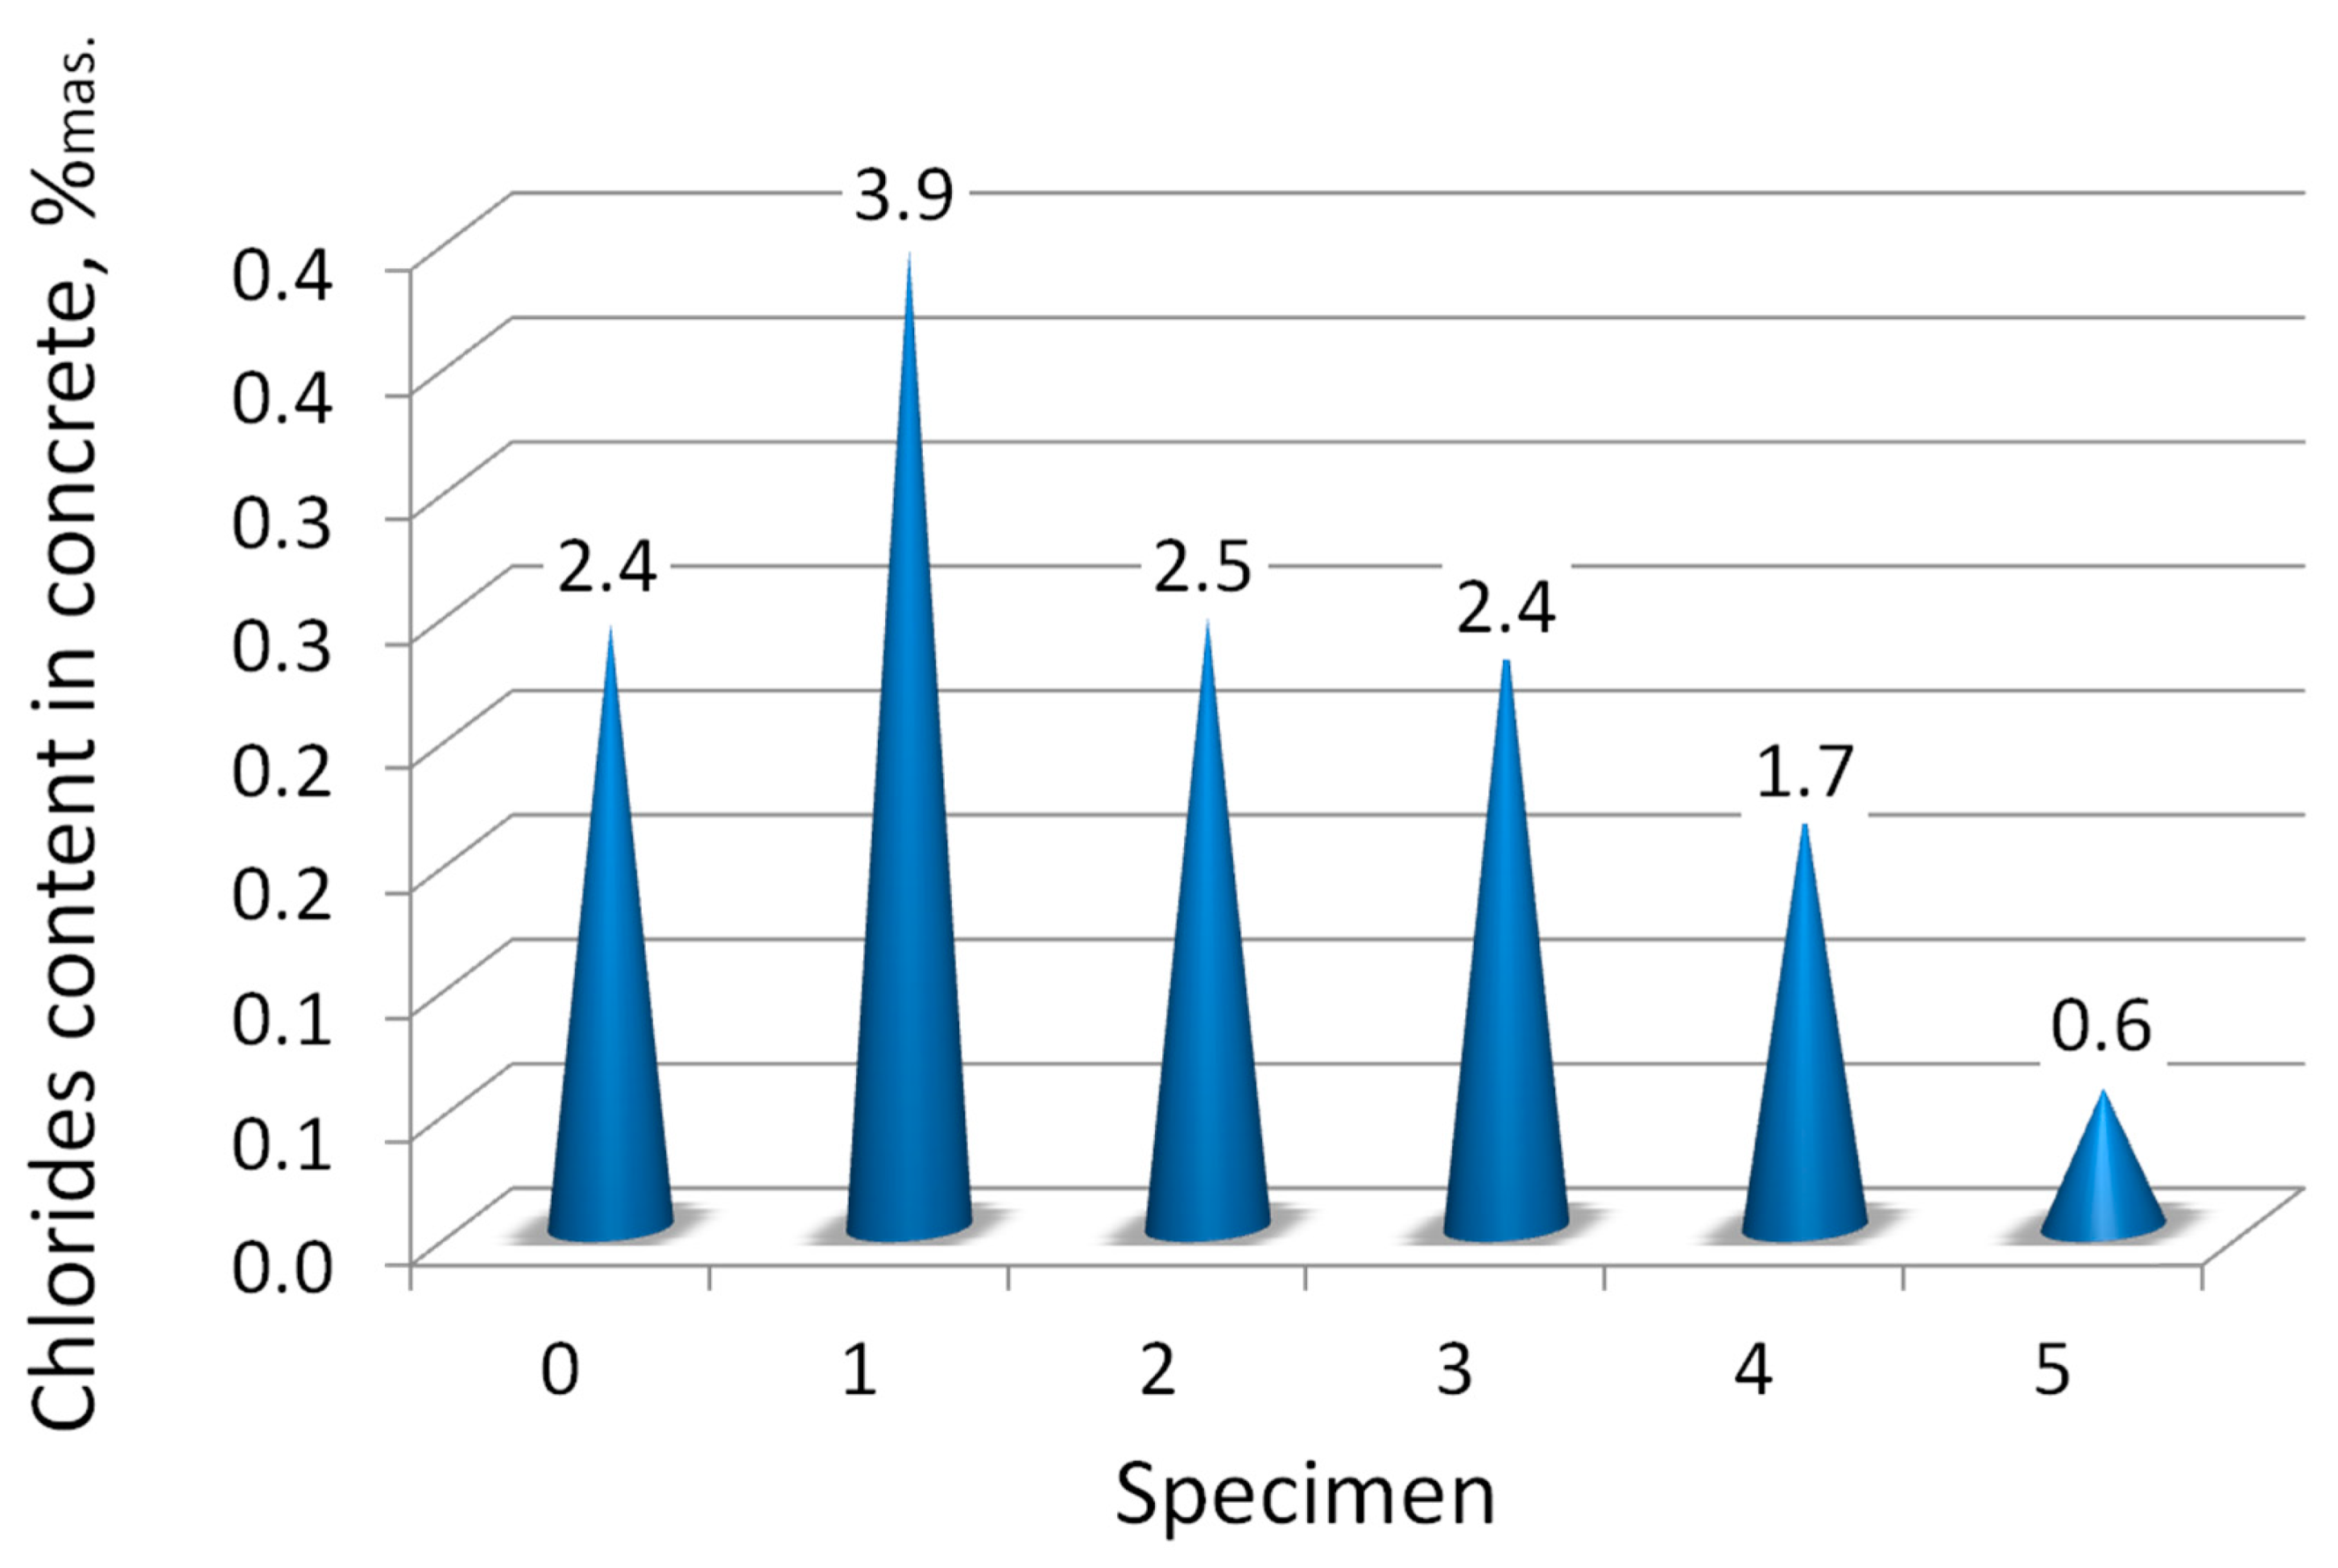
| Specimen | Free Chlorides Content in Concrete, %mas. | Free Chlorides Content in Soluble Phases, %mas. |
|---|---|---|
| 0 | 2.43 | 14.58 |
| 1 | 3.93 | 39.58 |
| 2 | 2.46 | 20.22 |
| 3 | 2.41 | 13.70 |
| 4 | 1.68 | 14.03 |
| 5 | 0.56 | 5.33 |
| Specimen | Chlorides Content, mg/L |
|---|---|
| W1 | 3547 |
| W2 | 2995 |
| Specimen | 0 | 1 | 2 | 3 | 4 | 5 | W1 | W2 |
|---|---|---|---|---|---|---|---|---|
| pH | 11.05 | 9.95 | 7.13 | 12.03 | 12.04 | 11.91 | 7.67 | 7.92 |
| Sample No. | SiO2 | CaCO3 | CaCO3 | (Na,Ca)Al(Si,Al)3O8 | KAl(SiO4) | Al2CaO8Si2 | Al3H2KO12Si3 | Al2H4O9Si2 | Al0.33C0.165H2.96Mg0.67O2.975 | AlKO8Si3 | TiO2 | CaAl2Si2O8.4H2O | KMg3(Si3Al)O10(F,OH)2 | (Mg,Fe)6(Si,Al)4O10(OH)8 | Ca4Al2O6Cl2.10H2O |
|---|---|---|---|---|---|---|---|---|---|---|---|---|---|---|---|
| Q—Quartz | C—Calcite | V—Vaterite | A—Albite | K—Kalsilite | N—Anorthite | I—Illite | O—Kaolinite | H—Hydrotalcite | M—Microcline | R—Rutile | G—Gismondine | P—Phlogopite | L—Clinochlore | FS—Hydrocalumite | |
| 0 | √ | √ | √ | √ | √ | √ | √ | ||||||||
| 1 | √ | √ | √ | √ | √ | ||||||||||
| 2 | √ | √ | √ | √ | √ | √ | √ | √ | √ | √ | |||||
| 3 | √ | √ | √ | √ | √ | √ | √ | √ | √ | √ | √ | ||||
| 4 | √ | √ | √ | √ | √ | √ | √ | √ | |||||||
| 5 | √ | √ | √ | √ | √ | √ | √ | √ | √ |
| Metal Contents | Specimen W1 xav ± sx | Specimen W2 xav ± sx |
|---|---|---|
| Mg | 151973 ± 4209 | 150631 ± 6780 |
| Co | 1.088 ± 0.040 | 1.159 ± 0.037 |
| Se | 2.185 ± 0.829 | 2.125 ± 1.045 |
| Sn | 0.013 ± 0.020 | 0.003 ± 0.001 |
| V | ±0.072 | 0.607 ± 0.067 |
| Ni | <1 | <1 |
| Mo | 2.313 ± 0.153 | 2.237 ± 0.173 |
| Sb | 1.784 ± 0.104 | 2.221 ± 0.084 |
| Cr | <1 | <1 |
| Cu | 1.003 ± 0.392 | 3.217 ± 0.274 |
| Ba | 61.256 ± 7.287 | 61.579 ± 8.677 |
| Hg | <0.0075 | <0.001 |
| Mn | 293.3 ± 26.7 | 411.9 ± 11.9 |
| Zn | 4.785 ± 0.134 | 7.799 ± 1.713 |
| Pb | 0.022 ± 0.001 | <0.001 |
| Cr (VI) | <0.075 | <0.091 |
| Fe | <1 | <1 |
| As | 1.161 ± 0.147 | 1.057 ± 0.255 |
| Cd | 0.009 ± 0.010 | 0.029 ± 0.006 |
| Metal Contents | Specimen 0 xav ± sx | Specimen 1 xav ± sx | Specimen 2 xav ± sx | Specimen 3 xav ± sx | Specimen 4 xav ± sx | Specimen 5 xav ± sx |
|---|---|---|---|---|---|---|
| Mg | 0.133 ± 0.011 | 0.367 ± 0.009 | 1.114 ± 0.042 | 0.035 ± 0.042 | 0.015 ± 0.007 | 0.030 ± 0.013 |
| Co | <0.001 | <0.001 | 0.008 ± 0.001 | <0.001 | <0.001 | 0.003 ± 0.001 |
| Se | 0.004 ± 0.002 | 0.002 ± 0.001 | 0.003 ± 0.001 | 0.004 ± 0.002 | 0.002 ± 0.001 | 0.003 ± 0.001 |
| Sn | 0.002 ± 0.001 | 0.002 ± 0.001 | <0.001 | <0.001 | <0.001 | <0.002 |
| V | <0.001 | 0.017 ± 0.009 | 0.061 ± 0.002 | <0.001 | <0.001 | <0.001 |
| Ni | <0.001 | <0.001 | 0.007 ± 0.001 | 0.005 ± 0.001 | <0.001 | 0.097 ± 0.001 |
| Mo | 0.144 ± 0.003 | 0.007 ± 0.001 | 0.007 ± 0.001 | 0.003 ± 0.001 | 0.002 ± 0.001 | 0.003 ± 0.001 |
| Sb | 0.005 ± 0.002 | 0.005 ± 0.002 | 0.005 ± 0.001 | 0.002 ± 0.001 | 0.002 ± 0.001 | 0.002 ± 0.001 |
| Cr | 0.191 ± 0.001 | 0.116 ± 0.001 | 0.210 ± 0.005 | 0.035 ± 0.004 | 0.075 ± 0.002 | 0.048 ± 0.002 |
| Cu | 0.474 ± 0.031 | 0.240 ± 0.014 | 0.086 ± 0.004 | 0.125 ± 0.008 | 0.022 ± 0.011 | 0.591 ± 0.003 |
| Ba | 0.032 ± 0.002 | 0.045 ± 0.001 | 0.060 ± 0.002 | 0.187 ± 0.010 | 0.036 ± 0.019 | 0.060 ± 0.002 |
| Hg | <0.001 | <0.001 | <0.001 | <0.001 | <0.001 | <0.001 |
| Mn | <0.001 | <0.001 | <0.001 | <0.001 | <0.001 | <0.001 |
| Zn | <0.001 | <0.001 | <0.001 | 0.003 ± 0.001 | <0.001 | 0.007 |
| Pb | <0.001 | <0.001 | <0.001 | <0.001 | <0.001 | <0.001 |
| Cr (VI) | 0.176 ± 0.004 | 0.097 ± 0.001 | 0.207 ± 0.008 | 0.024 ± 0.001 | 0.013 ± 0.009 | 0.060 ± 0.001 |
| Fe | <0.001 | <0.001 | <0.001 | <0.001 | <0.001 | <0.001 |
| As | 0.004 ± 0.001 | 0.021 ± 0.003 | 0.039 ± 0.001 | 0.004 ± 0.001 | <0.001 | 0.004 ± 0.001 |
| Cd | <0.001 | <0.001 | <0.001 | <0.001 | <0.001 | <0.001 |
Publisher’s Note: MDPI stays neutral with regard to jurisdictional claims in published maps and institutional affiliations. |
© 2021 by the authors. Licensee MDPI, Basel, Switzerland. This article is an open access article distributed under the terms and conditions of the Creative Commons Attribution (CC BY) license (http://creativecommons.org/licenses/by/4.0/).
Share and Cite
Słomka-Słupik, B.; Podwórny, J.; Grynkiewicz-Bylina, B.; Salamak, M.; Bartoszek, B.; Drzyzga, W.; Maksara, M. Concrete Examination of 100-Year-Old Bridge Structure above the Kłodnica River Flowing through the Agglomeration of Upper Silesia in Gliwice: A Case Study. Materials 2021, 14, 981. https://doi.org/10.3390/ma14040981
Słomka-Słupik B, Podwórny J, Grynkiewicz-Bylina B, Salamak M, Bartoszek B, Drzyzga W, Maksara M. Concrete Examination of 100-Year-Old Bridge Structure above the Kłodnica River Flowing through the Agglomeration of Upper Silesia in Gliwice: A Case Study. Materials. 2021; 14(4):981. https://doi.org/10.3390/ma14040981
Chicago/Turabian StyleSłomka-Słupik, Barbara, Jacek Podwórny, Beata Grynkiewicz-Bylina, Marek Salamak, Bibianna Bartoszek, Wiktoria Drzyzga, and Marcel Maksara. 2021. "Concrete Examination of 100-Year-Old Bridge Structure above the Kłodnica River Flowing through the Agglomeration of Upper Silesia in Gliwice: A Case Study" Materials 14, no. 4: 981. https://doi.org/10.3390/ma14040981