1. Introduction
As the production of complex-shaped composite structures is a sequential process characterized by either manual or automated handling of unstable reinforcement fabrics, deviations from an ideal “as-planned” configuration can be observed. These deviations may vary in terms of the chosen process and material, as illustrated in
Figure 1, but they are never to be neglected. The design of composite parts is regularly carried out with only a small reserve in the mechanical capacity. Deviations in the fiber orientation and defects from the manufacturing process may result in reduced structural stiffness and strength or unpredicted failure. For this reason, conservative design concepts are mostly applied that are in conflict to an optimal lightweight design. Therefore, the use of machine vision to digitalize the quality assessment of the composite production is suggested.
The digitalization of composite materials, textile constructions, and inhomogeneous structures in general is driven by the development of simulation models and the trends in digital design and manufacturing. The local material behavior of composite materials can be obtained from virtual predictions (forming simulations [
1,
2,
3], drape simulations [
4,
5,
6], flow simulations [
7,
8,
9], or process-induced stress prediction [
10,
11]) or from destructive (microtome sections [
12,
13]) or non-destructive material examinations (computer tomography [
14,
15,
16], eddy current analysis [
17,
18], thermography [
19,
20], or X-ray analysis [
21,
22]) on existing parts.
Digital methods are used for the designing of structures; therefore, an ideal as-planned configuration is obtained. This configuration can be varied [
23] or even further optimized by virtual methods [
24,
25]. Following the variations found in both the manual production process and the industrial process guidance (
Figure 1), the actual resulting structural part exists as a variation of the ideal as-planned configuration within the limits of the process-dependent deviation in a representative “as-built” configuration. The examination of this configuration and its transition into a Digital Twin for the usage of adapted simulation models is desired. Research has been carried out to adapt to these process deviations by variations of the virtual models, as described in [
23]. The possibility to conduct simulations with a specific set of local material properties can improve the composite development and the quality of the virtually obtained results for composite behavior. This is illustrated in
Figure 2.
Several models on fiber-reinforced composite materials have been used on different length scales to describe the geometrical construction and to predict mechanical behavior. Those are not covered within this publication; however, models that predict the orientation and fiber distribution in a final structural preform or part affected by the source material and process influences will be mentioned. These virtual models were developed to predict the inhomogeneous fiber orientation of fiber-reinforced composites for short fiber-reinforced composites regarding injection molding [
26,
27] and compression molding [
28,
29] as well as continuous fiber reinforcements on the micro [
30,
31], meso [
32,
33,
34], and macro level [
9,
35,
36,
37] for both dry fabrics and pre-consolidated organo-sheets to obtain as-planned configurations suitable for the calculation of the structural stiffness or strength.
The results obtained by these models are suitable for use with an as-planned modeling approach. The results of the introduced models aim for prediction of the local fiber orientation in several composite-forming processes. These models include the process parameters and material specific input data. They represent a single possible and idealized as-planned configuration of the structure in question.
Regarding the design of a model following the as-built approach, efforts have already been made to provide fiber detection systems for the analysis of the real fiber orientation existing in composites aiming for a Digital-Twin configuration of a single available structure. In this sense, the definition of a Digital-Twin is a representation of each manufactured part in a virtual environment. To evaluate the local fiber orientations, microtome slices have been made from composite materials to examine the structural construction; however, the method is of a destructive nature [
38].
Micro CT scans have been used to build composite unit cell models to predict mechanical properties [
16]; however, the application on a global structural level is unknown. Eddy current sensor data can be used to evaluate the results of the preforming process [
18]. This method is applicable to large areas of composite structures and is able to deliver the local fiber orientation in the real state but is only applicable to carbon fibers or other conductive reinforcement materials since conductivity is crucial to this method.
Camera images have also been used for mapping the fiber orientation in numerical composite models [
39]. Thermography methods have also been used to determine the local fiber orientation in composite materials [
19,
40]. As with the other introduced methods, such as eddy current examination, the thermographic method aims toward an investigation of the finished composite product. Information on the local fiber orientation and the layer to which it is assigned must be evaluated with additional expense.
The possibilities to use the data are generally restricted by the effort of capturing and the availability at the site. Results from small samples correspond to the local structural geometry only and are not applicable on a structural level. Destructive examinations are also not desirable. However, their data can be used for the validation of computational models in discrete states. The prediction of anisotropic material behavior from computational models is part of the ongoing research [
31,
41,
42] as well as the mapping of actual material properties into models used in virtual simulation [
43].
The availability of the captured data, regardless of the capturing method, must be ensured in a virtual environment. The usability of real-production data within digital databases was covered in [
44]. In this contribution, a technological approach is introduced that relies on image processing methods to identify the local fiber orientations during the preforming process. The local information regarding the fiber orientation is monitored and evaluated during the production process through the optical examination of each layer. Therefore, no restrictions on the material and its physical or mechanical properties are made, if the surface texture is visible. Additionally, the process does not influence the production at all. The used carbon-fiber prepreg ensures the preservation of the captured state during the consolidation process due to its rigid and sticky nature. The data captured by machine vision is processed and evaluated to obtain information regarding the actual condition of composite parts after their fabrication. An approach is presented regarding importing the data back to the initial numerical design model by a standardized file format to replace the assumed fiber orientations, which are used in the parts design process, with real production data from every single manufactured part. This enables all the beneficial methods known from Digital Twin applications, such as optimization, quality assurance, and life performance analysis.
2. Materials and Methods
2.1. Composite Reinforcement Fabric
The carbon fiber prepreg Krempel KGBX 2508 HT 3K by the Krempel Group (Vaihingen, Germany) was used for the presented studies. Composites from this Twill woven fabric are characterized by mechanical properties along the main reinforcement directions 1 and 2 (determined according to DIN EN ISO 527-4) and in the diagonal direction 12 (according to ASTM 3518) found in
Table 1.
2.2. Apodius Vision System 3D by Hexagon
The Apodius Vision system 3D by Hexagon (
Figure 3) was applied for the presented examinations. The system comprises HP-C-V3D Vision Sensor hardware—designed to fit to an Absolute Arm with RS5 Laser Scanner—together with the custom-built Explorer 3D software package. This was used for capturing both the structural topology of the part as well as the surface images that are further processed to obtain information on the local fiber orientation. The topological information provided by the system can be used for several investigations, as shown in
Section 2.3.
However, the introduced method of building a digital twin with the Hexagon system does not generally require these measurements and can be carried out without the scanning of the part by the laser line scanner. The presented method may be carried out with the surface images mapped on geometrical information provided by a computer-aided design model (CAD) instead as well. Additional opportunities in using real captured topology data instead of idealized CAD data are shown in the following subsection.
2.3. Generic Robotic Limb Joint
The structural geometry used for the investigations presented was provided by the company Nägeli Swiss AG (Güttingen, Switzerland). The generic limb joint (
Figure 4a) for use in robotic applications is composed from two intersecting shell structures that are joined by a stepped lap (
Figure 4c). The dimensions of the limb were 180 × 180 × 150 mm
3 (H × W × T). Along with the relatively small size and the harsh edges with small radii, the capturing and evaluation of the shown part is challenging due to reflections and strong changes in the local fiber directions.
The robotic limbs used in the presented studies were manufactured by handy layup and manual draping of the two shells as illustrated above. The main orientations of the prepregs when draped onto the limbs are given in
Table 2. The values refer to the orientation in the seed point according to
Figure 5. The limb has been cured in accordance to the prepreg supplier guidelines to reach a complete cure of the resin. The achieved degree of cure as well as the final fiber volume content are given in
Table 2.
2.4. As-Planned Data
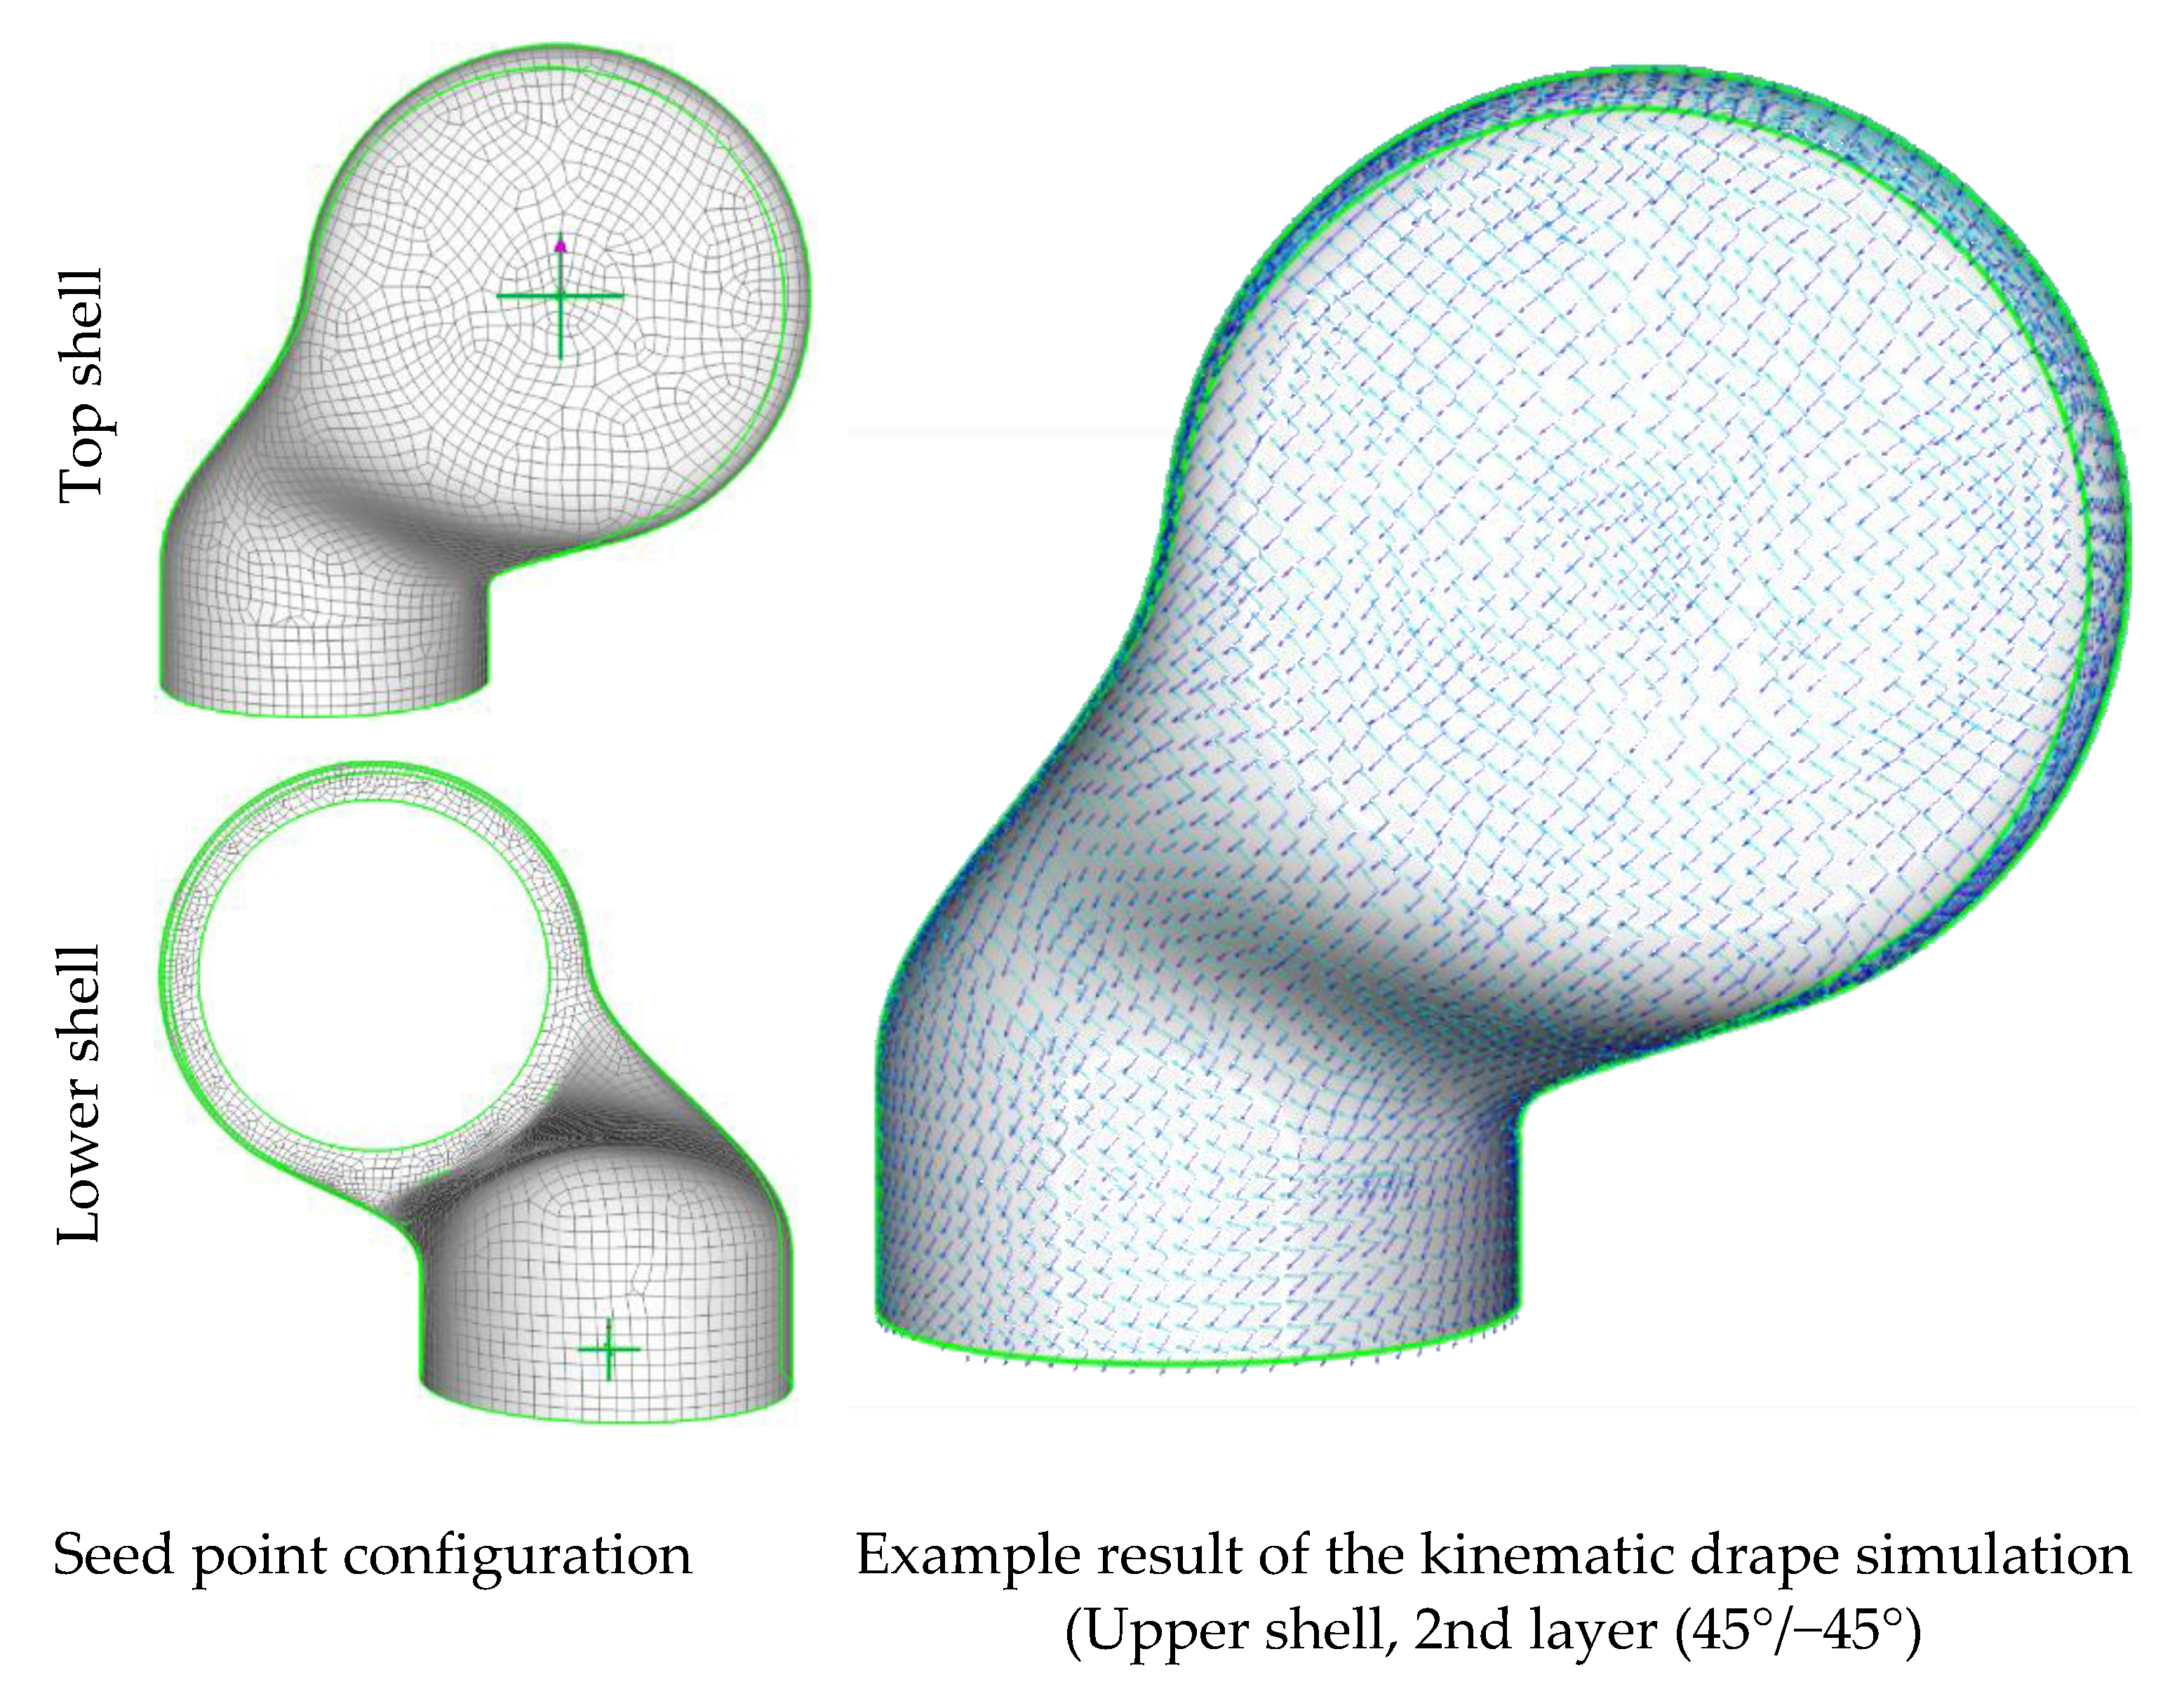
For the provision of the as-planned dataset, which can be used for the initial composite design of the structural part, ANSYS Composite PrePost (ACP) was used to create the fiber orientation from a kinematic drape simulation. This process includes the structural geometry as well a seed point that corresponds to the starting point of the fabric deposition process. The simplifications and restrictions of the kinematical drape algorithms do not take all possible influences into account but are consequent for most reinforcement fabrics, such as the pre-impregnated weave used for the investigations in this study.
The draping seed point for the kinematic drape simulation was set to the point where the fabric was initially placed on the mold for the manual hand layup used to produce the robotic limbs. This seed point is visualized along with an exemplarily result of the kinematic drape simulation in
Figure 5. The as-planned result is used as the target for the manual draping to achieve a minimal deviation for the as-built configuration.
2.5. As-Built Data
The main difference in comparing as-built data with an as-planned dataset is the uniqueness of the as-built set, since it references only the structure from which the data was retrieved. The as-planned data has a general character and represents a mean result, including the process parameters and the material input (depending on the way of generating the as-planned data), whereas the as-built dataset includes everything from deviations in the processing to deviations in the material. The real existing state is captured and processed. Therefore, statements and results obtained using the “as-built” data can only be accounted on the structure from which it was retrieved.
2.5.1. Ply Wise Scanning of Preform Geometry
The Apodius Vision system can be equipped with a laser line scanner as shown in
Section 2.2. This scanner enables the virtualization of structural geometries with a high level of details due to the excellent scanning resolution of <1 mm per point. The parts topology must be scanned by hand by hovering the scanner over the desired geometry. The laser line is always visible, and the scanning result can be seen in the Apodius Desktop environment at any time to check for missing spots and the achieved results.
As already mentioned, the processing of the surface mapping and the evaluation of the local fiber orientation (as shown in
Section 2.5.3) can be performed using an ideal CAD geometry of the structural part. However, the ply wise scanning can improve the process of mapping for thick parts, and additional information regarding the local thickness of each layer can be obtained. The investigations presented in this paper have been done by mapping the surface images (
Section 2.5.3) onto the CAD data of the part. The ply wise scanning was done to evaluate changes in the layer thickness. The thickness information can be calculated by determination of the distance from one ply to another, at certain points, such as the center of the discrete triangular element surface mesh. This procedure and the results are illustrated in
Section 3.1.1.
2.5.2. Scanning of Global Structural Geometry
The laser line scanner can be used not only to provide the geometrical model of every single layer while preparing the composites preform but also to scan the resulting structural part after preforming and after curing. The outer shell surface was scanned in this regard. The result can be used for quality assessment when compared to the initial CAD geometry. Unsymmetrical layups and complex geometries are known to provoke inhomogeneous thermal and chemical shrinkage during the consolidation.
With a virtual scan of the final part, examinations regarding these structural deformations can be carried out. For demonstration purposes, an unsymmetrical limb was manufactured as shown in
Table 1. The obtained point cloud from scanning both the limb manufactured with symmetrical layup as well as the point cloud obtained by scanning the unsymmetrical layup were compared with the initial CAD geometry by determining the Hausdorff distance [
45] of the initial CAD and the scanning result (
Section 3.1.1).
2.5.3. Evaluation of the Local Fiber Orientation
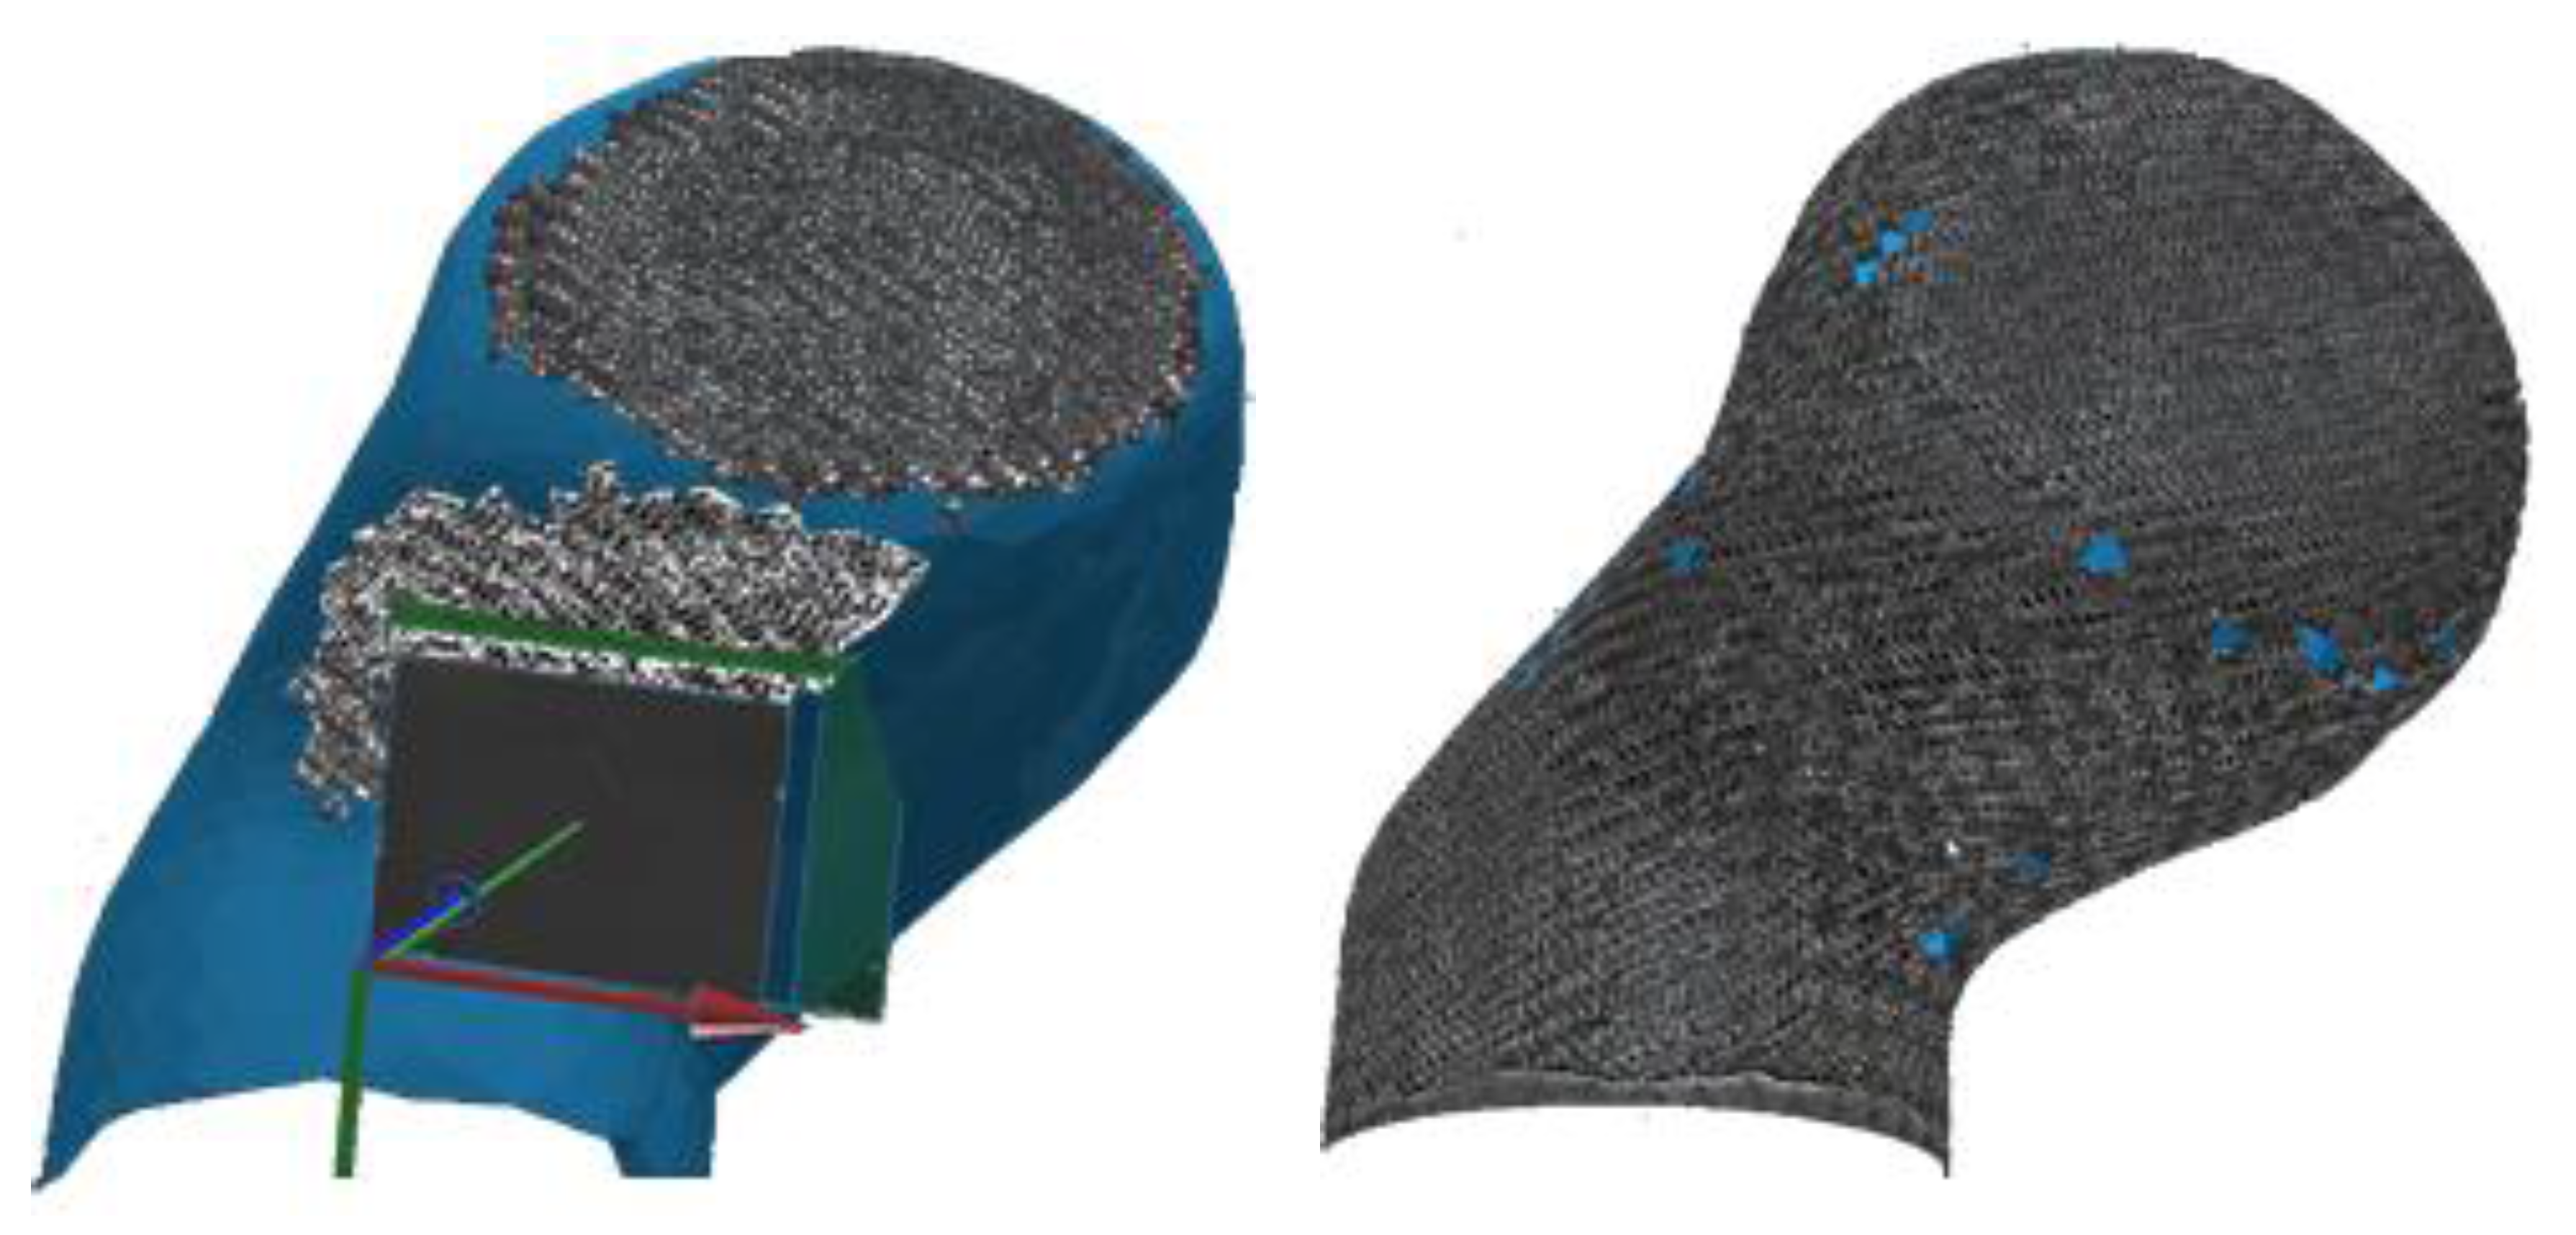
To evaluate the local fiber directions, images of the actual drape result were taken and mapped virtually onto the surface mesh, which was provided as a result from geometrical scanning or from the ideal CAD data. Here, the assumption is made that all fibers within a technical yarn are ideal parallel aligned. In this way, the evaluated fiber direction can be assigned to a local place on the structural part by evaluation of the yarn orientation. This procedure is shown in
Figure 6.
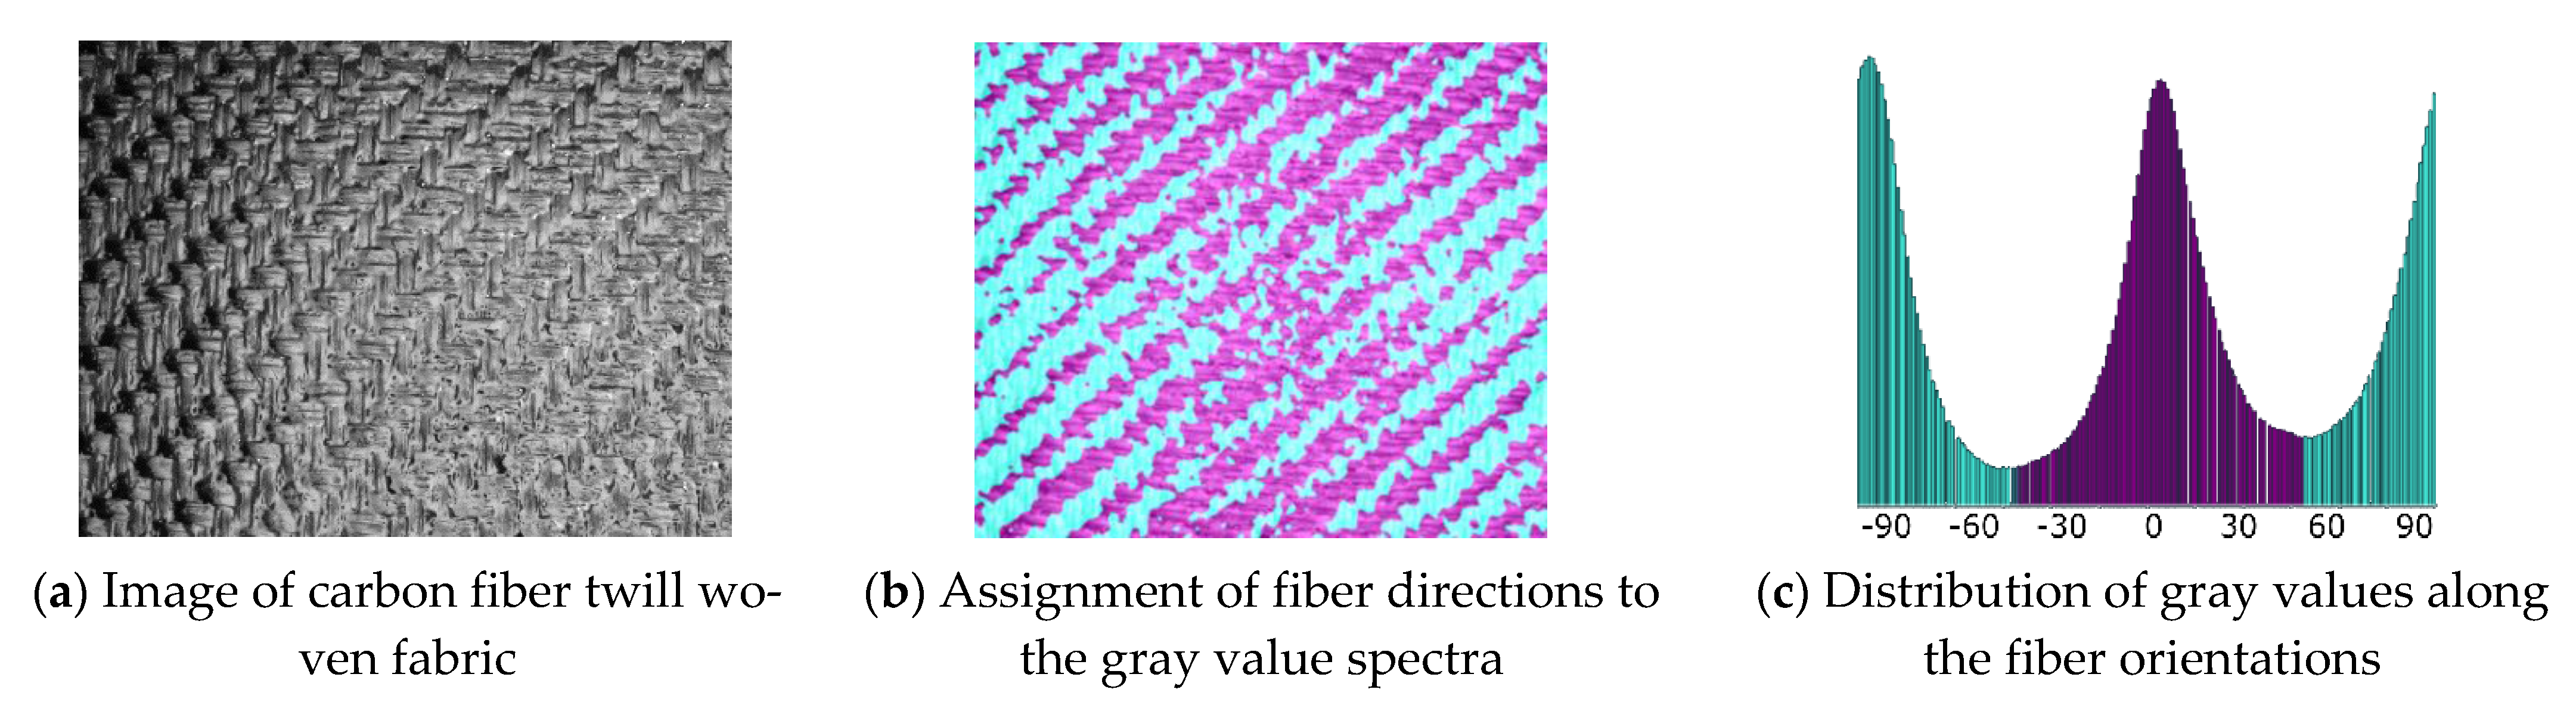
To assign the fiber directions correctly by vision analysis, a reference image of the material must be taught to the software. This is done by providing a picture of the material as shown in
Figure 7a. Since every region with alike properties has the same optical appearance, the gray values of the picture are analyzed, and every local region is examined by texture segmentation algorithms [
46]. This edge-oriented method is beneficial for fabric textures as for most of the commonly used fiber reinforcements. Every segment is accounted with a corresponding reinforcement direction. This step must be done manually by the user. Afterwards, the software can account for the local fiber orientation according to the found gray value within the spectra (
Figure 7c). Since the position of the camera system is known by the software, every captured image can be assigned to a position in space, and the region on the structural surface is known. With this information, the local fiber orientations can be mapped onto any mesh independent of its mesh size.
The results of the image capturing procedure are displayed in the Apodius desktop environment in real time, and blind spots can be identified. As an example,
Figure 8 shows the use of the system.
2.6. HDF5 File Format
For the transfer of the visually determined properties into commercial FEM programs such as ANSYS, the file format HDF5 was established. This is a hierarchically structured data model for storing and managing data. This makes it sufficient for storing the captured information regarding the discretized geometry (nodes and elements) and the local material properties (thickness and fiber orientation).
The position of the discretized geometry in space, the orientation of the material directions and other parameters, such as the layer thickness, local density, and the general material properties, can be stored. Then, the data can be retrieved, extended, or manipulated as needed. This is not limited to data types or data sizes and, thus, it allows the efficient and flexible processing of complex data. An example of the HDF5 file structure that is suitable for import into ANSYS is shown in
Figure 9.
ANSYS ACP makes it possible to import this information into an existing workload to be able to extend a created finite-element (FE) model with real recorded data of an existing component (as-built). The material fiber orientation as well as the local material thickness is interpolated and mapped onto the existing FE mesh, and the real-world data is utilized for virtual simulations.
2.7. Structural Bending Test
An important aspect of this work is to prove the accuracy of the material properties created by the import of real fiber orientations. Therefore, a two-point bending test was chosen to test the fabricated limbs, and we compared the results with numerical simulations done with the as-built datasets. As shown in
Figure 10, the whole test setup consisted of a fixation plate and a steel lever that was used to load the limb in a bending case scenario. During the bending test, a stamp was moved against the lever with a velocity of 5 mm/s to remain in a quasi-static range. The resulting displacement and reactional force were recorded by the used tensile test machine Zwick/Roell Z100.
3. Results
3.1. Modeling
3.1.1. Scanning
The distance of every element in a single layer to a certain (nearest) element in the next layer can be determined by calculating the surface to surface distance following the normal vector of the triangular element in question. As shown in
Figure 9, this information is stored within the HDF5 file or can be retrieved from stl surface files. As an example,
Figure 11 shows the determination of the local fabric thickness obtained from calculating the distance of the first reinforcement ply (45°/−45°) to the second ply (0°/90°) for the top shell of the limb. As for the data following the as-built concept, the calculated thickness only applies for the specific limb and the very specific layer.
The inhomogeneous thickness distribution illustrates the resulting local thickness as a function of the topology and material deformation since the radii and areas of higher shear strain influence the fabric thickness. However, the limb production process induces pressure on the stack of layers, and the thickness of each layer is reduced due to compressional forces and resin flow. Therefore, the information on the local thickness retrieved from the scanning of dry plies or pre-impregnated fabrics during the preforming cannot be used directly in a simulation of the consolidated part. The areas of increasing thickness and the relative fraction that each layer contributes to the resulting thickness can be determined.
Regarding scanning for the final consolidated part, the results from the scanning of a symmetrical and an unsymmetrical part (
Table 2) are shown in
Figure 12 along with the depiction of the Hausdorff distance.
The unsymmetrical fabricated limb experienced greater deformation on the neck due to the chemical shrinkage of the matrix resin. The L-shape of the structure induced a movement from the larger bottom part toward the neck of the limb. The symmetrical structure remained in shape despite the complex geometry. The results from this analysis only have qualitative character, since the relative alignment of the measured model and the ideal CAD model was done manually by hand.
3.1.2. Assignment of the As-Built Fiber Orientation
The information regarding the actual as-built fiber orientation must be captured for every part and every single ply, as explained earlier. These data must be imported ply-wise to the numerical model. For the investigations presented in this study, the composite simulation model Ansys Composite PrePost was used. This software package allows for a ply-wise description of composite materials according to an approach following the actual stacking similar to the composite structure manufacturing process.
Additionally, ACP supports the import of ply data using the introduced HDF5 file format. As the discretized mesh used for numerical modeling is not compulsorily identical to the mesh used for fiber orientation evaluation, the data must be mapped onto the FE mesh. To preserve the information obtained by the Apodius gray value evaluation, the target mesh size should be the same size or even smaller than the source mesh size. The results obtained by the Apodius gray value evaluation are shown for a representative layer in
Figure 13.
The fiber orientations obtained from the manual drape process are compared to the target as-planned configuration at discrete points in
Figure 14. The general orientations of the fibers are indicated by the visible lines. Since the limb geometry is very complex and pre-impregnated fabrics are hardly drapable, a significant deviation from the aspired result can be observed for some layers.
The results from
Figure 14 are exemplary. The presentation of all the obtained results from each ply is not possible in the frame of this publication. However, a procreation of errors can be seen from the shown as-built configurations. The dataset found in example 2 had a larger deviation from the aspired 45° orientation. The complex geometry leads to a significant displacement of the fibers. Therefore, the obtained simulation model deviated significantly from the as-planned model. The simulation result used for the composite design process is not representative for the present part, and its condition and would not result in usable findings.
3.2. Two-Point Bending Test and Structural Simulation
3.2.1. Mechanical Limb Bending Test
The produced limbs that delivered the as-built data were mechanically tested, and the resulting displacement–force curves were recorded. While most limbs could bear a maximum force of around 900 N, one limb already failed at 535 N. A deficit in the limb stacking was identified as the reason. The results are shown in the plot found in
Figure 15.
As shown in the force–displacement plots, the final failure was preceded by preliminary damage. An evaluation of the failed part could provide information on the nature of the preliminary damage; however, a virtual evaluation was only possible for models that were processed following the as-built approach and included information on the actual structural properties. Additionally, different failure modes could be observed during the mechanical limb tests. They are shown in
Figure 16. An investigation using a numerical model in the as-planned condition will always lead to the same result and would not be sufficient to analyze deviating parts.
3.2.2. Numerical Simulation of Limb Bending Test
A numerical simulation was conducted to analyze the stresses and strains during the bending deformation. Due to the number of as-built configurations, a variation of the force–displacement curves were obtained. The graphic plots in
Figure 17 show that the as-planned configuration was stiffer than the as-built configurations. This is due to draping errors, local fiber deflections, and a general idealization of the as-planned configuration.
The composite model was set up according to [
47] where two individual unidirectional plies are used to model every single fabric-reinforced layer. The fiber orientations, derived from evaluating the image data of the surfaces, are mapped in a unidirectional manner on the UD plies with half the original plies thickness. For the failure investigation, the Cuntze and the Puck Criterium [
48,
49] was used to evaluate the local composite failure. A prior investigation of the as-planned configuration, which was loaded according to the presented two-point-bending case, is shown in
Figure 18. The areas with the highest structural load, according to Cuntze, are visible. The fiber directions, as retrieved from the kinematic drape simulation, are visible in the plots that show the stress value in fiber direction for the corresponding positions.
The initial failure, as predicted by the as-planned simulation, can be found in two different areas located at the limps neck by nearly the same value for the Cuntze Criterion. Since compression is found on both sides of the neck, a geometrical nonlinearity as a result from a buckling deformation is assumed. Since the used material model does not include failure, an evaluation beyond this initial failure indication cannot be carried out. The stress plot (
Figure 18) is indicating that compression in the fiber direction is the reason for a Cunze Criterion > 1 that displays a failure due to exceeding the matrix compressional strength. A prediction of the initial failure location is hardly possible, but both areas are to be concerned.
As mentioned earlier, the manufacturing of the limbs led to different failure modes. We observed that the configurations that deviated only a little from the as-planned configuration failed in the same way as the as-planned simulation predicted (
Figure 19). Configurations that deviated a lot, as seen in
Figure 14, failed by delamination of the two jointed shells. Following the findings from the simulations, this may be due to compressional forces in the longitudinal direction of the segment joint area (
Figure 4). Following the as-built approach, a validation of the as-planned setting was not possible, since all manufactured limbs deviated from this configuration. However, the results from the numerical bending simulation using the as-planned configurations can be found in
Figure 19. As representatives for the as-built configurations, the datasets shown in
Figure 14 were used, since these examples were used as variants for small and strong deviations.
By using the as-built datasets for the structural simulation, different locations of failure can be observed. The as-planned dataset is giving one result only, even though the difference in the structural construction, resulting mainly from manual handling and fabrication, could be shown (
Figure 14). The analysis of the simulations using as-built datasets do match the later observed failure mode well enough to differentiate between them. The area that exceeds the materials strength is larger in the simulation results from example 1, whereas the as-planned results indicate two possible first failure locations. In addition, the result from example 2 could predict the exceeding load in a area where failure actually appeared. The fiber orientation of example 2 deviated a lot from the aspired as-planned configuration, as shown earlier. Therefore, a completely different load distribution was achieved, and different failure could be observed. The use of real product as-built data enables a prediction such as this. Comments on the classification of this result and recommendations regarding its use can be found in the next section.
4. Discussion
The need to develop a digital twin is evident in many aspects. The improvement of quality management, the reduction of rejects, and a further possibility to use virtual methods and models for the improvement of composites are only a few reasons. The increase of the lightweight character pushed further, and the competitiveness of the material also increased.
One possibility of transferring real material properties into a virtual environment is the optical capturing of fiber deposition states, their evaluation, and their transfer into known and established simulation tools. The Apodius system is based on captured images and has proven to be suitable in this regard. The topological scanning capabilities are helpful and can be used conditionally for analyses, such as local thickness evaluation. An analysis of defects or flaws is also conceivable. However, this only makes sense if the defects cannot be detected by the camera that is required. Otherwise, it is an additional step that adds time and costs.
Image acquisition in manual mode, as used in this project, is also complex and time-consuming. Nevertheless, the process is worthwhile, as the speed of composite production processes certainly allows for visual inspection with digital tools. An automated analysis can certainly capture the process without having to follow the speed of the measuring system during production. This was not the case in the manual measurements carried out. Here, the production time was equal to the data acquisition time, and the production had to be interrupted for the manual data acquisition.
The evaluation of the fiber angles within the process also involves the risk that the fiber orientation may still change during the process. However, an optical evaluation makes sense, as it is intuitive and can happen on a low-tech level. For safe process control, care and measures should be taken (the use of prepreg, binders, etc.). However, the application of such a vison system to a prepreg material is challenging compared to dry fiber fabrics. The resin residuals on the fabric surface decrease the contrast of the edges and/or increase the effects of the reflection of light. The illumination and the surrounding disturbance of the light can influence the quality of the measurements and should be as diffuse as possible.
The transfer of the recorded data into a standardized format was reliable. Within the project, it was possible to work closely with ANSYS Switzerland to enable the transfer of the data into an existing workspace, which is known as a valuable computational tool. The transfer of data within different software solutions is becoming increasingly important. Being able to use the specializations of individual software tools with a simple transfer of the models holds great potential for the use of virtual tools for digital composite development.
According to the idea of a digital twin, the tested limbs cannot be assigned to the as-planned configuration but only to the respective models. However, the totality of the mechanical test results with the confidence interval provides variations with which the as-planned configuration can be accounted for. Despite the as-built dataset being only relevant for the simulation of a very single structure, it enables the non-destructive simulation and prediction of stiffness, strength, or even durability without actually testing the present structure. Quality assessment methods are enabled, and a failure of the part during its lifespan can be traced back to its initial structural condition. The use of this technique in this regard requires well-fitted and validated simulation models.
The comparison of the results obtained with the as-planned and as-built models compared to the reality was good. The deviation was small for all observed cases and samples. During the examinations, an attempt was made to replicate the as-planned configuration. Therefore, large deviations were prevented. Despite the deviations in the layer structure, almost equal forces were achieved with the mechanical tests. However, different first ply failures were observed. The indicators for their occurrence could be predicted by the created as-built models.
A statistical comparison with the occurrence remains difficult, as the as-built configurations would have to be reproduced several times in an equal manner for this investigation. The presented results are not suitable for investigations regarding the used production process. However, in general, the presented study shows that parts manufactured with non-neglectable deviations can also bear the required loads as specified by the as-planned load level. This can be controlled and determined with simulation methods. This can reduce the amount of decisions for classifying products as committee parts. However, within this publication, emphasis was placed on the method demonstration and not on the interpretation of the simulation results. Therefore, the used model does not account for failure or stress redistribution effects after local cracks. The method is independent of the used simulation model.
5. Conclusions
By using the image analysis system and the ANSYS HDF5 import interface, a direct evaluation of the actual as-built properties of fiber composite components is made possible. Deviations from the original numerical as-planned design can be imported, and thus, an assessment of the actual performance of the component is enabled. Thus, active monitoring of the real fiber orientation during manufacturing can serve quality assurance purposes. Particularly in the case of manual placement of the reinforcing fiber layers, the effect of a deviation of the fiber angle from the ideal target condition can be evaluated, and the possible scrap can be reduced.
With the system presented here, the individual layers must be recorded manually and individually for each layer and position on the component. This procedure is time-consuming and, in its current form, it is only suitable for special components and high-performance applications. For a transfer of the technology to an industry of broad fiber composite applications, automated measurement and numerical evaluation is essential.
Archiving of the acquired data can not only provide quality assurance according to the as-planned model but can also be used to trace a failure mode back to the manufacturing conditions if the number of components and fracture pattern evaluation is sufficiently high after the component lifetime has been reached. For small businesses and small-scale manufactures, the system enables a system to qualify committee.
Most of the introduced systems, as well as the system presented, rely on expensive hardware and specific software packages and are vulnerable to changes in the environmental conditions. A smaller technological entry level can push a breakthrough of visual quality management systems and provide more industrial manufacturers with the possibility to quantify the condition of their fabricated composite structures.
Author Contributions
Conceptualization, methodology and writing—original draft preparation, O.D.; Methodology and formal analysis, A.A.; Formal analysis and investigation, N.G.; Project administration and funding acquisition, C.B. All authors have read and agreed to the published version of the manuscript.
Funding
This research received external funding. The results presented were carried out within the NextGenCoMan project that received funding from Innosuisse-Swiss Agency for Innovation Promotion under grant number 35197.1 IP-ENG.
Institutional Review Board Statement
Not applicable.
Informed Consent Statement
Not applicable.
Data Availability Statement
The data presented in this study are available on request from the corresponding author.
Acknowledgments
We would also like to thank the companies ANSYS Switzerland GmbH, namely Fabio Pavio and Nino Zehnder, Hexagon by Alexander Leutner, and Nägeli Swiss AG by Nikolaus and Dominik Nägeli, who were involved in the project, for their cooperation and the provision of material, tools, and software implementations.
Conflicts of Interest
The authors declare no conflict of interest.
References
- Haanappel, S.P.; Sachs, U.; Thije, R.H.T.; Rietman, B.; Akkerman, R. Forming of Thermoplastic Composites. Key Eng. Mater. 2012, 504, 237–242. [Google Scholar] [CrossRef]
- Wang, P.; Hamila, N.; Boisse, P. Thermoforming simulation of multilayer composites with continuous fibres and thermoplastic matrix. Compos. Part B Eng. 2013, 52, 127–136. [Google Scholar] [CrossRef]
- Hsiao, S.-W.; Kikuchi, N. Numerical analysis and optimal design of composite thermoforming process. Comput. Methods Appl. Mech. Eng. 1999, 177, 1–34. [Google Scholar] [CrossRef]
- Gereke, T.; Döbrich, O.; Hübner, M.; Cherif, C. Experimental and computational composite textile reinforcement forming: A review. Compos. Part A Appl. Sci. Manuf. 2013, 46, 1–10. [Google Scholar] [CrossRef]
- Döbrich, O.; Gereke, T.; Cherif, C. Drape simulation: Textile material model for correct property reproduction to improve the preform development process of fiber-reinforced structures. In Proceedings of the 12th International LS-DYNA® Users Conference, Dearborn, MI, USA, 3–5 June 2012. [Google Scholar]
- Boisse, P.; Borr, M.; Buet, K.; Cherouat, A. Finite element simulations of textile composite forming including the biaxial fabric behaviour. Compos. Part B Eng. 1997, 28, 453–464. [Google Scholar] [CrossRef]
- Gupta, M.; Wang, K.K. Fiber orientation and mechanical properties of short-fiber-reinforced injection-molded composites: Simulated and experimental results. Polym. Compos. 1993, 14, 367–382. [Google Scholar] [CrossRef]
- Rahman, W.A.; Sin, L.T.; Rahmat, A. Injection moulding simulation analysis of natural fiber composite window frame. J. Mater. Process. Technol. 2008, 197, 22–30. [Google Scholar] [CrossRef]
- Tseng, H.C.; Chang, R.Y.; Hsu, C.H. Predictions of fiber concentration in injection molding simulation of fiber-reinforced composites. J. Thermoplast. Compos. Mater. 2018, 31, 1529–1544. [Google Scholar] [CrossRef]
- Brauner, C.; Block, T.B.; Purol, H.; Herrmann, A.S. Microlevel manufacturing process simulation of carbon fiber/epoxy compo-sites to analyze the effect of chemical and thermal induced residual stresses. J. Compos. Mater. 2012, 46, 2123–2143. [Google Scholar] [CrossRef]
- Pascon, F.; Kharbouche, A.; van Eekelen, T.; Brauner, C.; Bach, M. An Integrated Virtual Tool Chain for the Simulation of Thermoset Composite Manufacturing Process. In Proceedings of the 16th Sampe Europe, Liege, Belgium, 13–15 September 2016. [Google Scholar]
- Vogler, T.; Hsu, S.-Y.; Kyriakides, S. Composite failure under combined compression and shear. Int. J. Solids Struct. 2000, 37, 1765–1791. [Google Scholar] [CrossRef]
- Thostenson, E.T.; Chou, T.W. On the elastic properties of carbon nanotube-based composites: Modelling and characterization. J. Phys. D Appl. Phys. 2003, 36, 573. [Google Scholar] [CrossRef]
- Aziz, A.A.; Saury, C.; Xuan, V.B.; Young, P. On the material characterization of a composite using micro CT image based finite element modeling. Nondestruct. Eval. Health Monit. Diagn. 2006, 6176, 617605. [Google Scholar] [CrossRef]
- Dastgerdi, J.N.; Anbarlooie, B.; Miettinen, A.; Hosseini-Toudeshky, H.; Remes, H. Effects of particle clustering on the plastic deformation and damage initiation of particulate reinforced composite utilizing X-ray CT data and finite element modeling. Compos. Part B Eng. 2018, 153, 57–69. [Google Scholar] [CrossRef]
- Desplentere, F.; Lomov, S.; Woerdeman, D.; Verpoest, I.; Wevers, M.; Bogdanovich, A. Micro-CT characterization of variability in 3D textile architecture. Compos. Sci. Technol. 2005, 65, 1920–1930. [Google Scholar] [CrossRef]
- Bardl, G.; Nocke, A.; Cherif, C.; Pooch, M.; Schulze, M.; Heuer, H.; Schiller, M.; Kupke, R.; Klein, M. Automated detection of yarn orientation in 3D-draped carbon fiber fabrics and preforms from eddy current data. Compos. Part B Eng. 2016, 96, 312–324. [Google Scholar] [CrossRef]
- Wu, D.; Cheng, F.; Yang, F.; Huang, C. Non-destructive testing for carbon-fiber-reinforced plastic (CFRP) using a novel eddy current probe. Compos. Part B Eng. 2019, 177, 107460. [Google Scholar] [CrossRef]
- Fernandes, H.; Zhang, H.; Maldague, X. An active infrared thermography method for fiber orientation assessment of fiber-reinforced composite materials. Infrared Phys. Technol. 2015, 72, 286–292. [Google Scholar] [CrossRef] [Green Version]
- Ishikawa, M.; Koyama, M. Influence of Composite Ply Layup on Active Thermographic Non-destructive Inspection of Carbon Fiber-Reinforced Plastic Laminates. J. Nondestruct. Eval. 2018, 37, 18. [Google Scholar] [CrossRef]
- Baranowski, T.; Dobrovolskij, D.; Dremel, K.; Hölzing, A.; Lohfink, G.; Schladitz, K.; Zabler, S.; Lohfink, G. Local fiber orientation from X-ray region-of-interest computed tomography of large fiber reinforced composite components. Compos. Sci. Technol. 2019, 183, 107786. [Google Scholar] [CrossRef]
- Wright, P.; Moffat, A.; Sinclair, I.; Spearing, S. High resolution tomographic imaging and modelling of notch tip damage in a laminated composite. Compos. Sci. Technol. 2010, 70, 1444–1452. [Google Scholar] [CrossRef] [Green Version]
- Polini, W.; Corrado, A. Digital twin of composite assembly manufacturing process. Int. J. Prod. Res. 2020, 58, 5238–5252. [Google Scholar] [CrossRef]
- Park, C.H.; Lee, W.I.; Han, W.S.; Vautrin, A. Simultaneous optimization of composite structures considering mechanical performance and manufacturing cost. Compos. Struct. 2004, 65, 117–127. [Google Scholar] [CrossRef]
- Eck, B.; Comas-Cardona, S.; Binetruy, C.; Aufrere, C. Multi-objective composite part mechanical optimization enhanced by a Process Estimator. Compos. Struct. 2015, 119, 620–629. [Google Scholar] [CrossRef]
- Wu, K.; Wan, L.; Zhang, H.; Yang, D. Numerical simulation of the injection molding process of short fiber composites by an integrated particle approach. Int. J. Adv. Manuf. Technol. 2018, 97, 3479–3491. [Google Scholar] [CrossRef]
- Yashiro, S.; Sasaki, H.; Sakaida, Y. Particle simulation for predicting fiber motion in injection molding of short-fiber-reinforced composites. Compos. Part A Appl. Sci. Manuf. 2012, 43, 1754–1764. [Google Scholar] [CrossRef]
- Advani, S.G.; Tucker, C.L., III. A numerical simulation of short fiber orientation in compression molding. Polym. Compos. 1990, 11, 164–173. [Google Scholar] [CrossRef]
- Li, Y.; Chen, Z.; Xu, H.; Dahl, J.; Zeng, D.; Mirdamadi, M.; Su, X. Modeling and Simulation of Compression Molding Process for Sheet Molding Compound (SMC) of Chopped Carbon Fiber Composites. SAE Int. J. Mater. Manuf. 2017, 10, 130–137. [Google Scholar] [CrossRef]
- Döbrich, O.; Gereke, T.; Cherif, C. Textile and Composite Modelling on a near Micro-scale: Possibilities and Benefits. In Proceedings of the 10th Europe-DYNA Conference, Wuerzburg, Germany, 15–17 June 2015. [Google Scholar]
- Verpoest, I.; Lomov, S.V. Virtual textile composites software WiseTex: Integration with micro-mechanical, permeability and structural analysis. Compos. Sci. Technol. 2005, 65, 2563–2574. [Google Scholar] [CrossRef]
- Boisse, P.; Zouari, B.; Gasser, A. A mesoscopic approach for the simulation of woven fibre composite forming. Compos. Sci. Technol. 2005, 65, 429–436. [Google Scholar] [CrossRef] [Green Version]
- Creech, G.; Pickett, A.K. Meso-modelling of non-crimp fabric composites for coupled drape and failure analysis. J. Mater. Sci. 2006, 41, 6725–6736. [Google Scholar]
- Pham, M.Q.; Döbrich, O.; Mersch, J.; Gereke, T.; Cherif, C. Meso-Scale Model for the Forming Process of Biaxial Reinforced Weft-Knitted Fabrics. In Proceedings of the IOP Conference Series: Materials Science and Engineering, 13th International Conference on Textile Composites (TEXCOMP-13), Milan, Italy, 17–19 September 2018; Volume 406. [Google Scholar]
- Guzman-Maldonado, E.; Wang, P.; Hamila, N.; Boisse, P. Experimental and numerical analysis of wrinkling during forming of multi-layered textile composites. Compos. Struct. 2019, 208, 213–223. [Google Scholar] [CrossRef]
- Boisse, P.; Hamila, N.; Hélénon, F.; Hagege, B.; Cao, J. Different approaches for woven composite reinforcement forming simulation. Int. J. Mater. Form. 2008, 1, 21–29. [Google Scholar] [CrossRef]
- Cherouat, A.; Borouchaki, H.; Giraud-Moreau, L. Mechanical and geometrical approaches applied to composite fabric forming. Int. J. Mater. Form. 2010, 3, 1189–1204. [Google Scholar] [CrossRef]
- Rief, S.; Glatt, E.; Laourine, E.; Aibibu, D.; Cherif, C.; Wiegmann, A. Modeling and CFD-simulation of woven textiles to determine permeability and retention properties. AUTEX Res. J. 2011, 11, 78–83. [Google Scholar]
- Stender, S.; Magura, N.; Fischer, K.; Emonts, M. Function-orientated Production of FRP Components. Light. Des. Worldw. 2019, 12, 18–25. [Google Scholar] [CrossRef]
- Fernandes, H.; Zhang, H.; Figueiredo, A.; Malheiros, F.; Ignacio, L.H.; Sfarra, S.; Ibarra-Castanedo, C.; Guimaraes, G.; Maldague, X. Machine Learning and Infrared Thermography for Fiber Orientation Assessment on Randomly-Oriented Strands Parts. Sensors 2018, 18, 288. [Google Scholar] [CrossRef] [Green Version]
- Döbrich, O.; Gereke, T.; Cherif, C. Modeling the mechanical properties of textile-reinforced composites with a near micro-scale approach. Compos. Struct. 2016, 135, 1–7. [Google Scholar] [CrossRef]
- Kästner, M.; Haasemann, G.; Brummund, J.; Ulbricht, V. Computation of Effective Stiffness Properties for Tex-Tile-Reinforced Composites Using X-FEM. In Mechanical Response of Composites; Springer: Dordrecht, The Netherlands, 2008; pp. 261–279. [Google Scholar]
- Bardl, G.; Nocke, A.; Hübner, M.; Gereke, T.; Pooch, M.; Schulze, M.; Heuer, H.; Schiller, M.; Kupke, R.; Klein, M.; et al. Analysis of the 3D draping behavior of carbon fiber non-crimp fabrics with eddy current technique. Compos. Part B Eng. 2018, 132, 49–60. [Google Scholar] [CrossRef]
- Zambal, S.; Eitzinger, C.; Clarke, M.; Klintworth, J.; Mechin, P.Y. A Digital Twin for Composite Parts Manufacturing: Effects of Defects Analysis Based on Manufacturing Data. In Proceedings of the 2018 IEEE 16th International Conference on Industrial In-formatics (INDIN), Porto, Portugal, 18–20 July 2018; pp. 803–808. [Google Scholar]
- Huttenlocher, D.; Klanderman, G.; Rucklidge, W. Comparing images using the Hausdorff distance. IEEE Trans. Pattern Anal. Mach. Intell. 1993, 15, 850–863. [Google Scholar] [CrossRef] [Green Version]
- Hermes, T.; Miene, A.; Kreyenhop, P. On Textures: A Sketch of a Texture-Based Image Segmentation Approach. In Classification and Information Processing at the Turn of the Millennium; Springer: Berlin/Heidelberg, Germany, 2000; pp. 210–218. [Google Scholar]
- Ladeveze, P.; LeDantec, E. Damage modelling of the elementary ply for laminated composites. Compos. Sci. Technol. 1992, 43, 257–267. [Google Scholar] [CrossRef]
- Cuntze, R. The predictive capability of failure mode concept-based strength criteria for multi-directional laminates—Part B. Compos. Sci. Technol. 2004, 64, 487–516. [Google Scholar] [CrossRef]
- Puck, A.; Schürmann, H. Failure Analysis of FRP Laminates by Means of Physically Based Phenomenological Models. In Failure Criteria in Fibre-Reinforced-Polymer Composites; Elsevier BV: Amsterdam, The Netherlands, 2004; pp. 832–876. [Google Scholar]
Figure 1.
Quality distribution of composite parts in the production method.
Figure 1.
Quality distribution of composite parts in the production method.
Figure 2.
Schematic explanation of the as-planned and as-built configurations for composite modeling.
Figure 2.
Schematic explanation of the as-planned and as-built configurations for composite modeling.
Figure 3.
Apodius Vision System 3D by Hexagon (a) with laser scanner (b) and camera (c) [source: Hexagon].
Figure 3.
Apodius Vision System 3D by Hexagon (a) with laser scanner (b) and camera (c) [source: Hexagon].
Figure 4.
Robotic limb joint.
Figure 4.
Robotic limb joint.
Figure 5.
Procedure and result of the kinematic drape simulation for the as-planned configuration.
Figure 5.
Procedure and result of the kinematic drape simulation for the as-planned configuration.
Figure 6.
Capturing and mapping of surface images onto the structural surface mesh.
Figure 6.
Capturing and mapping of surface images onto the structural surface mesh.
Figure 7.
Material teaching and the assigning of fiber directions due to the gray value distribution.
Figure 7.
Material teaching and the assigning of fiber directions due to the gray value distribution.
Figure 8.
Evaluation of the gray value distribution and assignment of material directions.
Figure 8.
Evaluation of the gray value distribution and assignment of material directions.
Figure 9.
HDF5 file structure with discrete data on material and geometry.
Figure 9.
HDF5 file structure with discrete data on material and geometry.
Figure 10.
Illustration of the structural limb bending test.
Figure 10.
Illustration of the structural limb bending test.
Figure 11.
Determination of local ply thickness from laser line scanning result.
Figure 11.
Determination of local ply thickness from laser line scanning result.
Figure 12.
Comparison of two meshes by determination of the Hausdorff distance.
Figure 12.
Comparison of two meshes by determination of the Hausdorff distance.
Figure 13.
Results from the manual draping and evaluation of fiber orientation for the 0° ply (top shell).
Figure 13.
Results from the manual draping and evaluation of fiber orientation for the 0° ply (top shell).
Figure 14.
Comparison of the as-planned and two different as-built configurations.
Figure 14.
Comparison of the as-planned and two different as-built configurations.
Figure 15.
Results of the mechanical two-point limb bending test.
Figure 15.
Results of the mechanical two-point limb bending test.
Figure 16.
Observed failure modes from the two-point bending test.
Figure 16.
Observed failure modes from the two-point bending test.
Figure 17.
Direct validation of the as-built simulation models by comparison with the as-planned data.
Figure 17.
Direct validation of the as-built simulation models by comparison with the as-planned data.
Figure 18.
Stresses and result of load evaluation according to Cuntze for as-planned configuration.
Figure 18.
Stresses and result of load evaluation according to Cuntze for as-planned configuration.
Figure 19.
Results of the two-point bending simulation for as-built configurations.
Figure 19.
Results of the two-point bending simulation for as-built configurations.
Table 1.
Composite properties from the Krempel KGBX 2508 HT 3K prepreg.
Table 1.
Composite properties from the Krempel KGBX 2508 HT 3K prepreg.
| Property | Symbol | Value | Std. Deviation | Image |
|---|
| Young’s modulus direction 1 and 2 | | 47.58 | GPa | 1.2 | GPa | ![Materials 14 00682 i001]() |
| Tensile strength direction 1 and 2 | | 549 | MPa | 19 | MPa |
| Failure strain direction 1 and 2 | | 1.14 | % | 0.03 | % |
| Shear modulus direction 12 | | 4.558 | GPa | 0.126 | GPa |
| Shear strength direction 12 | | 106 | MPa | 3.9 | MPa |
| Failure strain direction 12 | | 5.72 | % | 1.3 | % |
Table 2.
Layup scheme of the robotic limb.
Table 2.
Layup scheme of the robotic limb.
| Symmetrical Robotic Limb |
| Top shell layup | [45°/−45°, 0°/90°, 90°/0°, −45°/45°] | Lower shell layup | [45°/−45°, 0°/90°, 90°/0°, −45°/45°] |
| Unsymmetrical Robotic Limb |
| Top shell layup | [0°/90°]4 | Lower shell layup | [0°/90°]4 |
| Final degree of cure: 0.98 | Final fiber volume content: 46% |
| Publisher’s Note: MDPI stays neutral with regard to jurisdictional claims in published maps and institutional affiliations. |
© 2021 by the authors. Licensee MDPI, Basel, Switzerland. This article is an open access article distributed under the terms and conditions of the Creative Commons Attribution (CC BY) license (http://creativecommons.org/licenses/by/4.0/).


