
Deformation Behaviors and Energy Absorption of Composite Re-Entrant Honeycomb Cylindrical Shells under Axial Load


Abstract
:1. Introduction
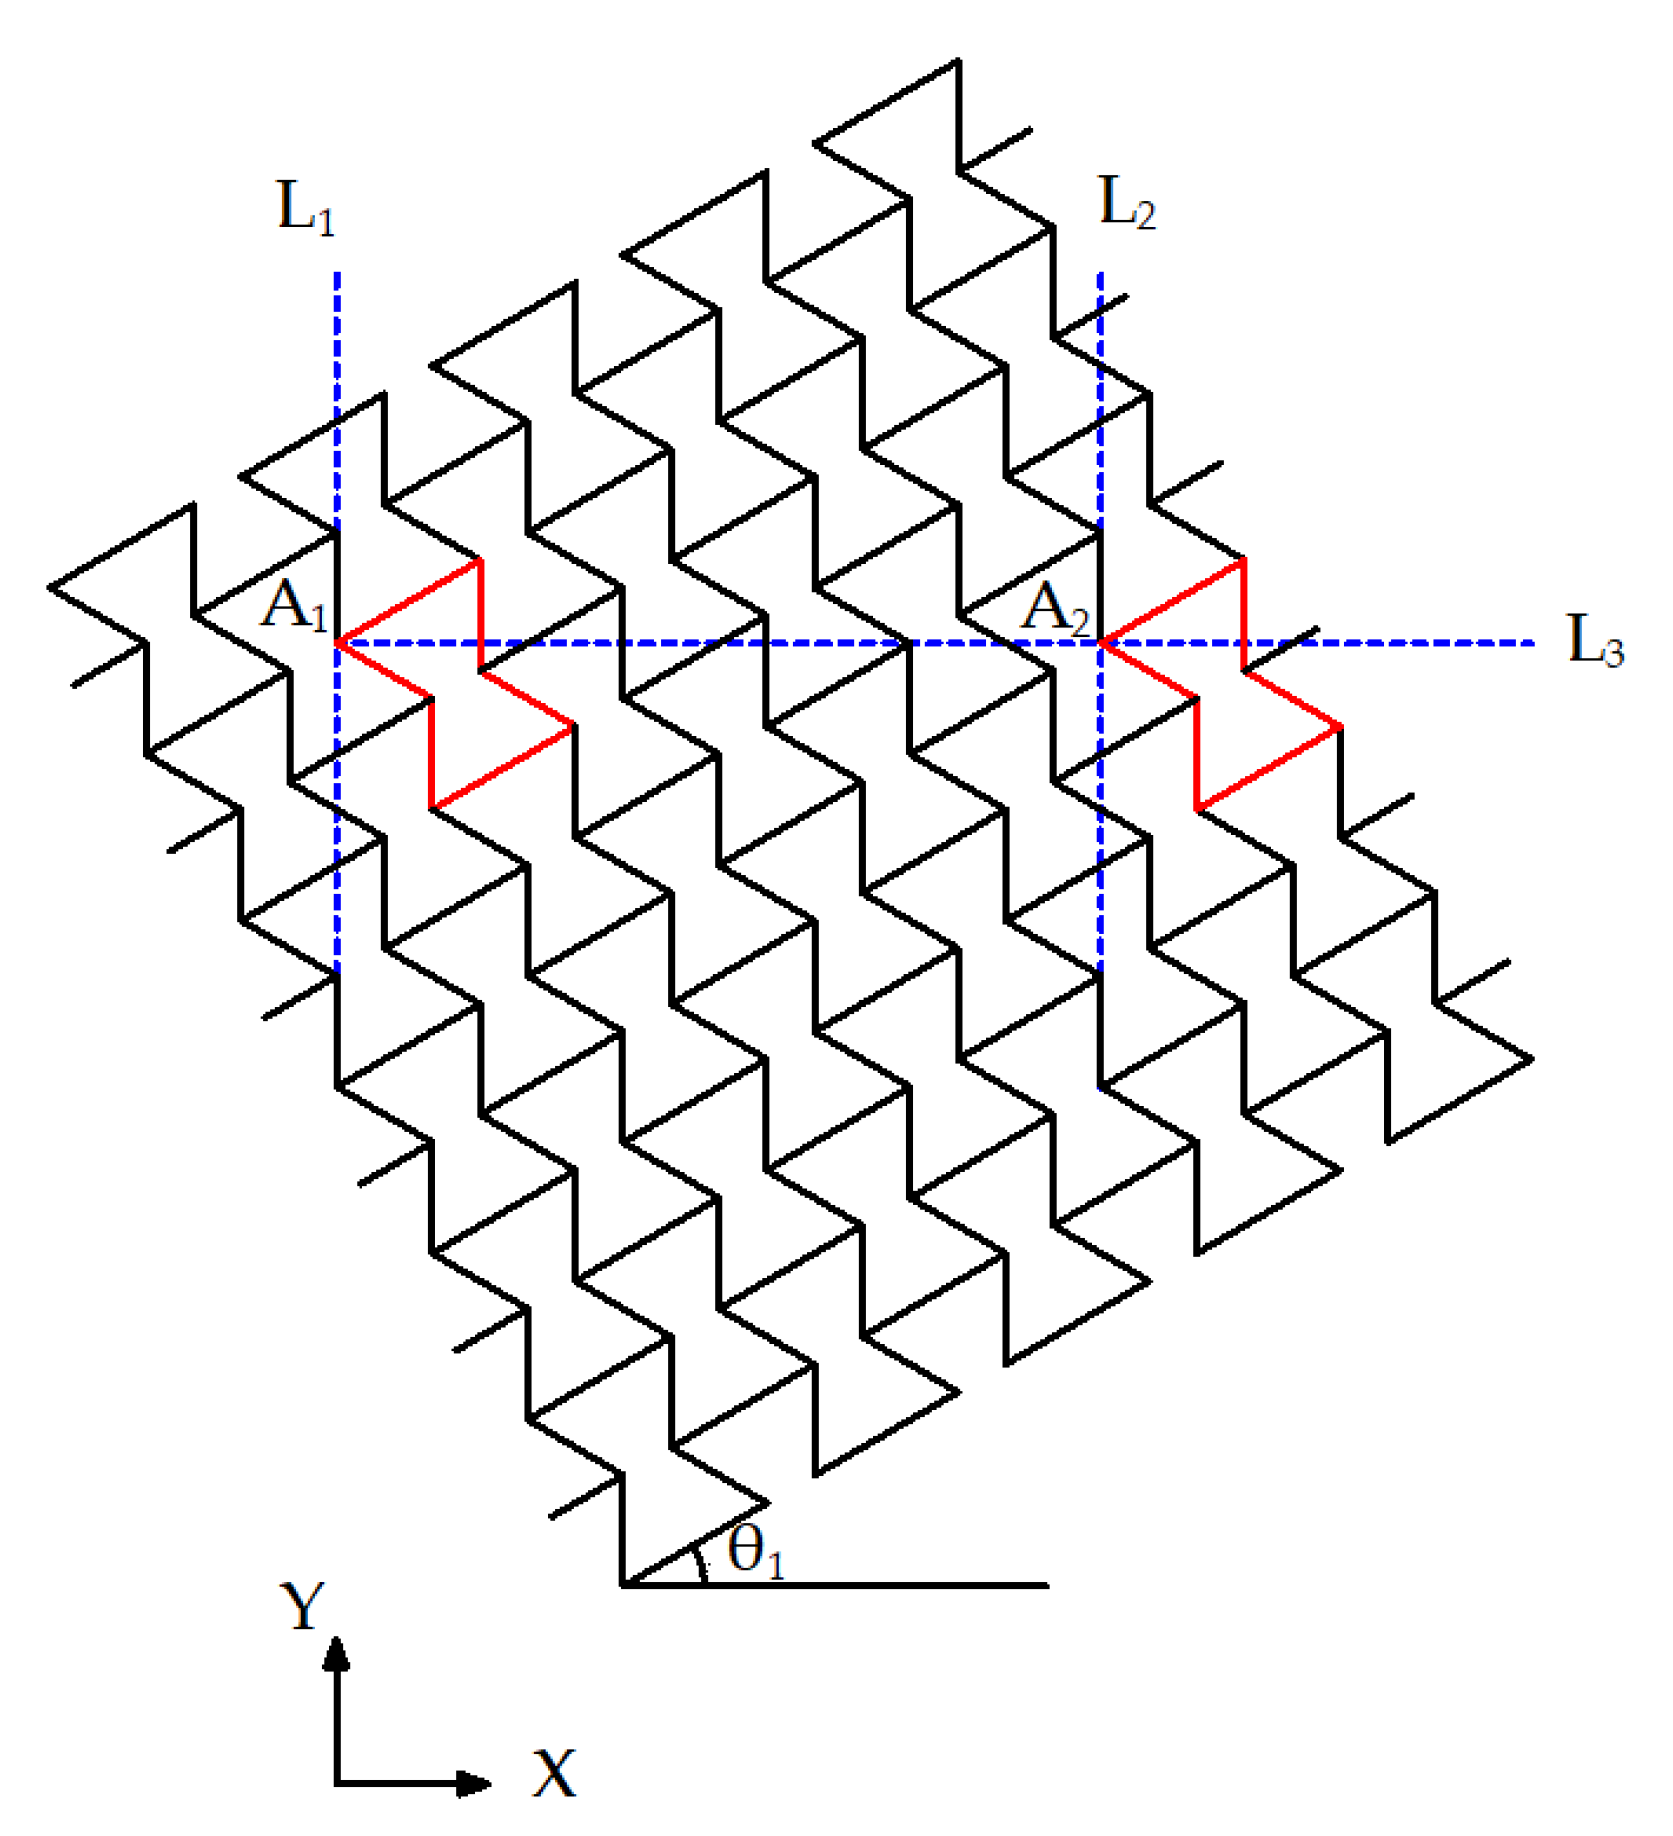
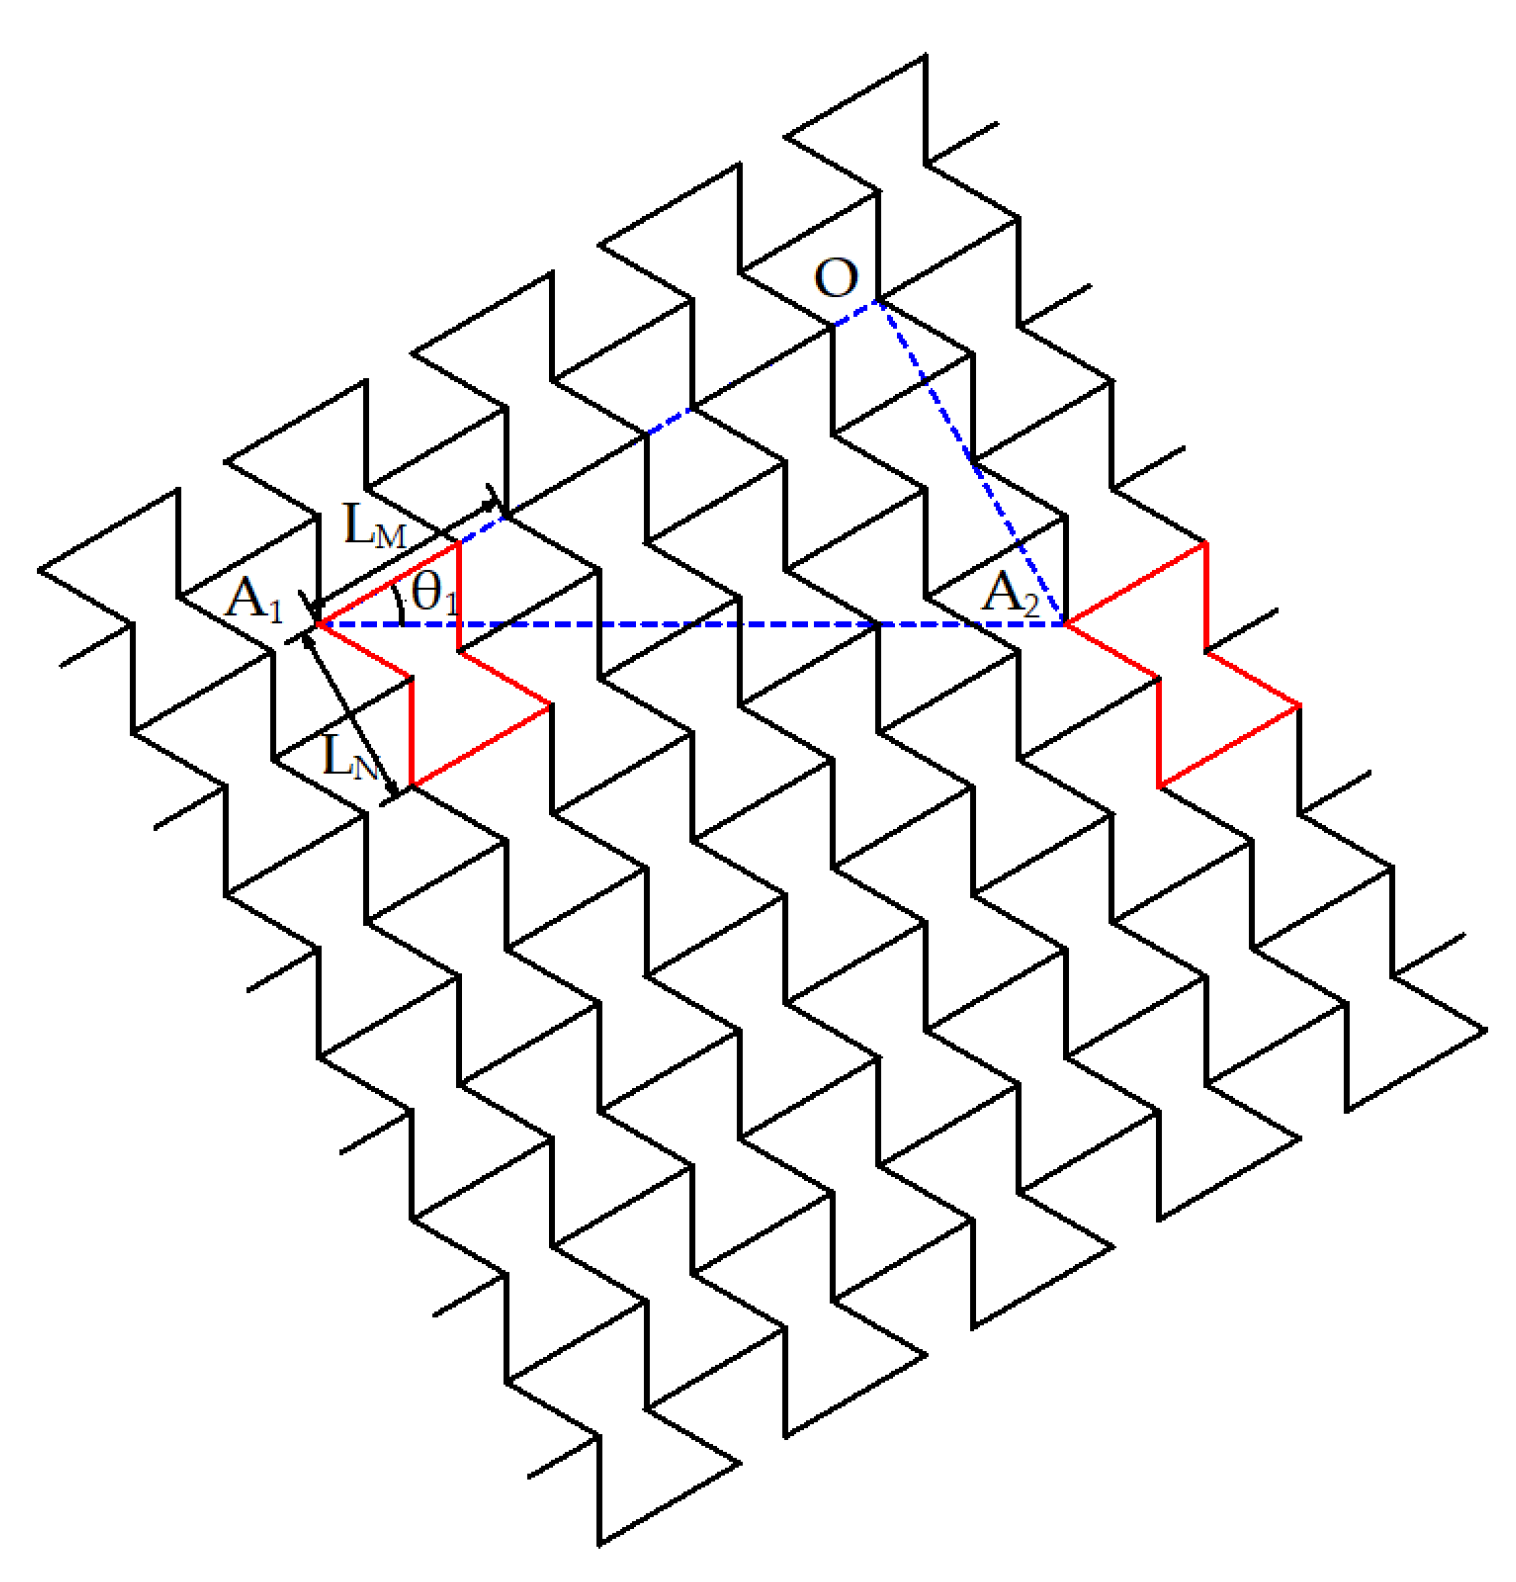
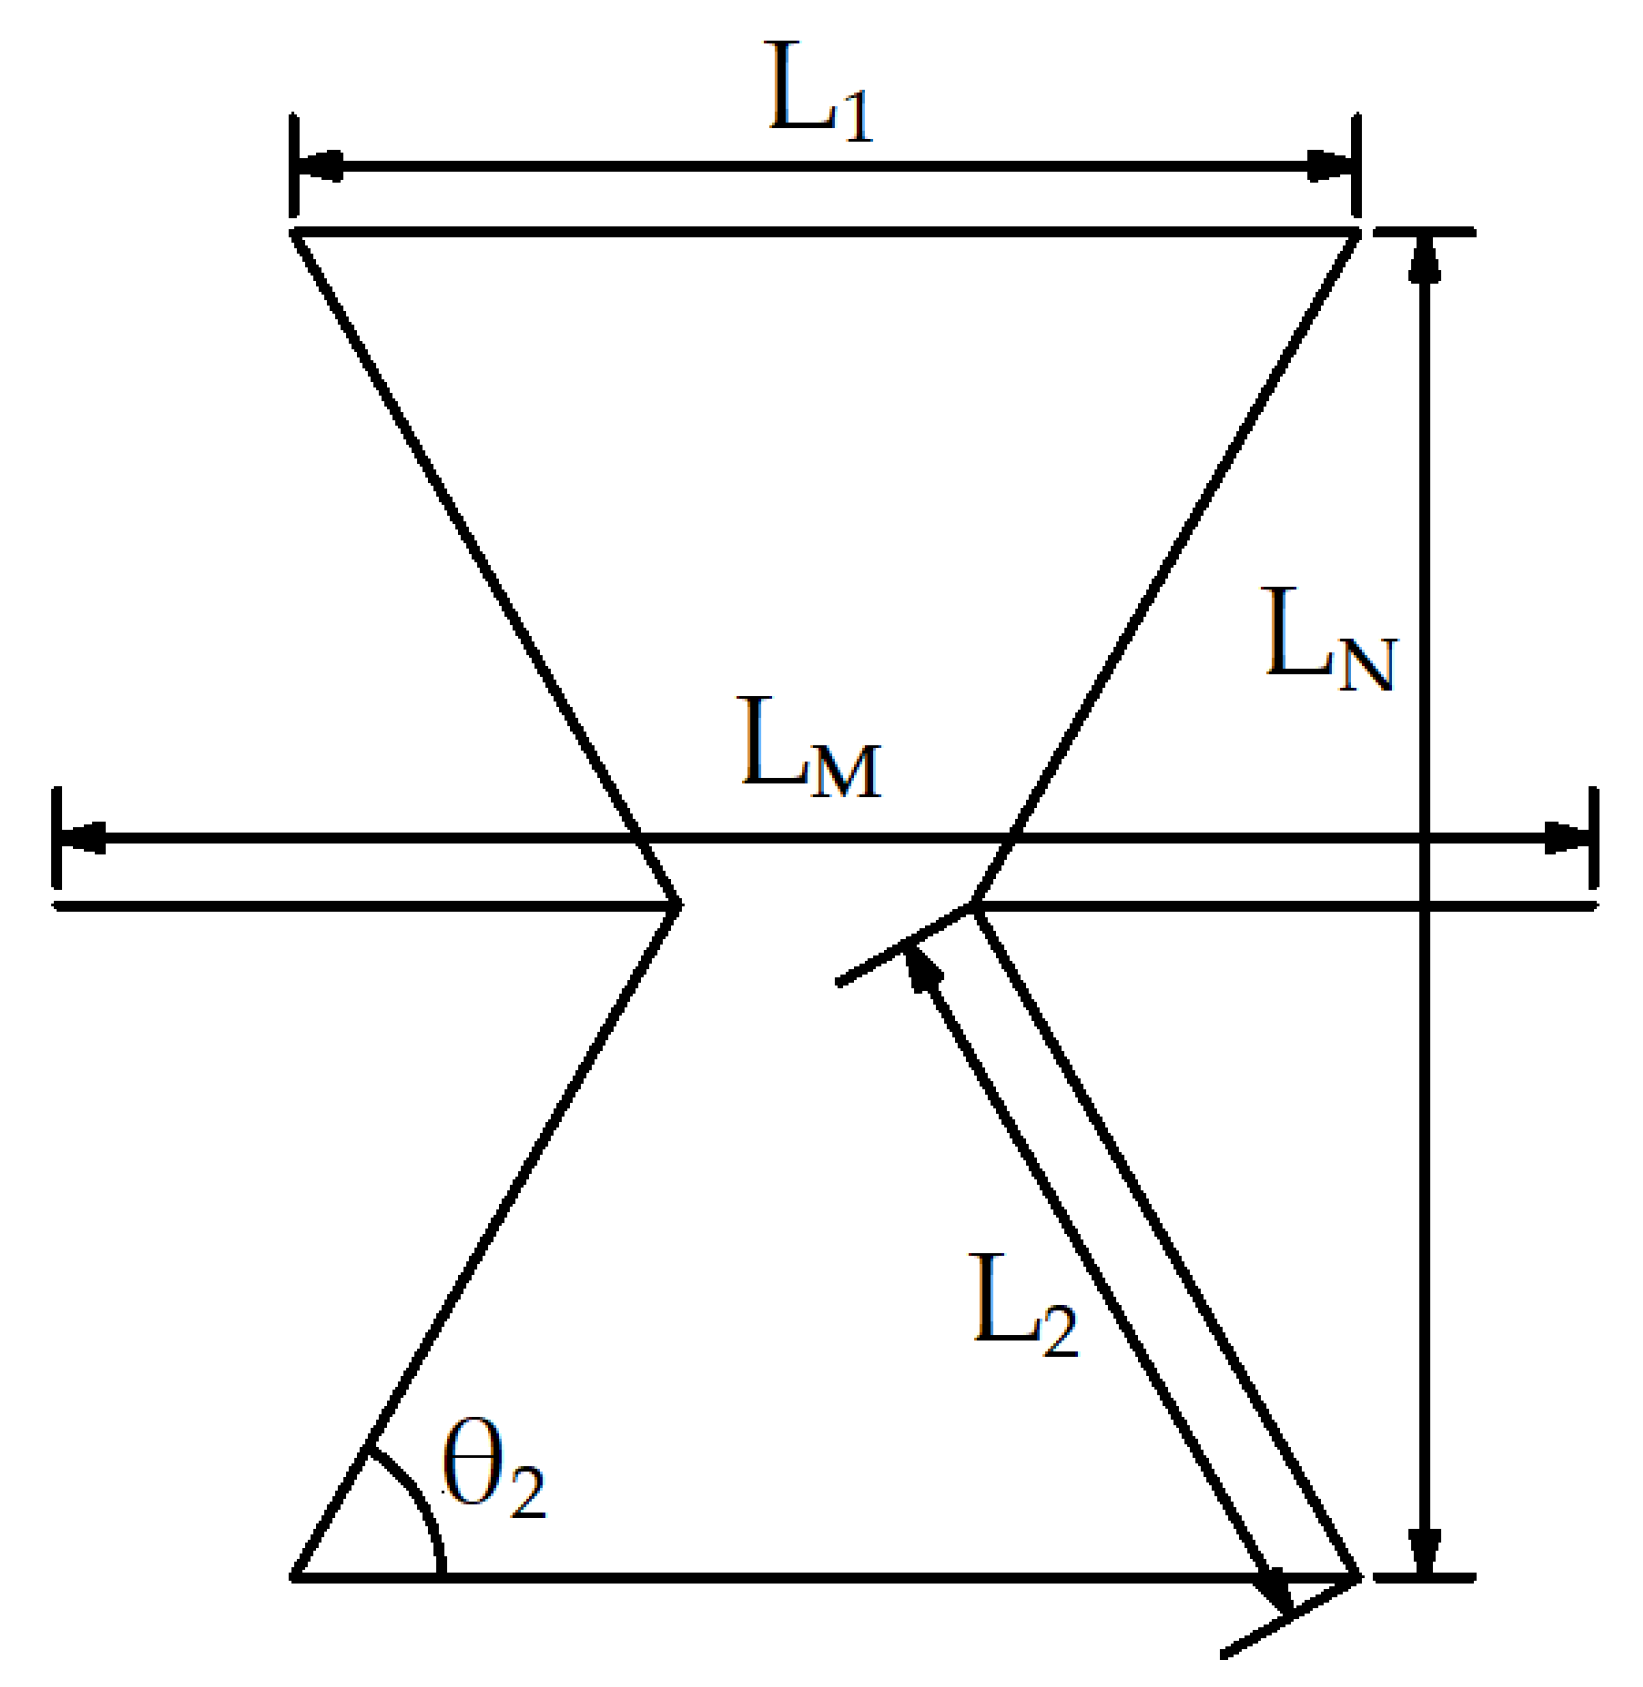
2. Models
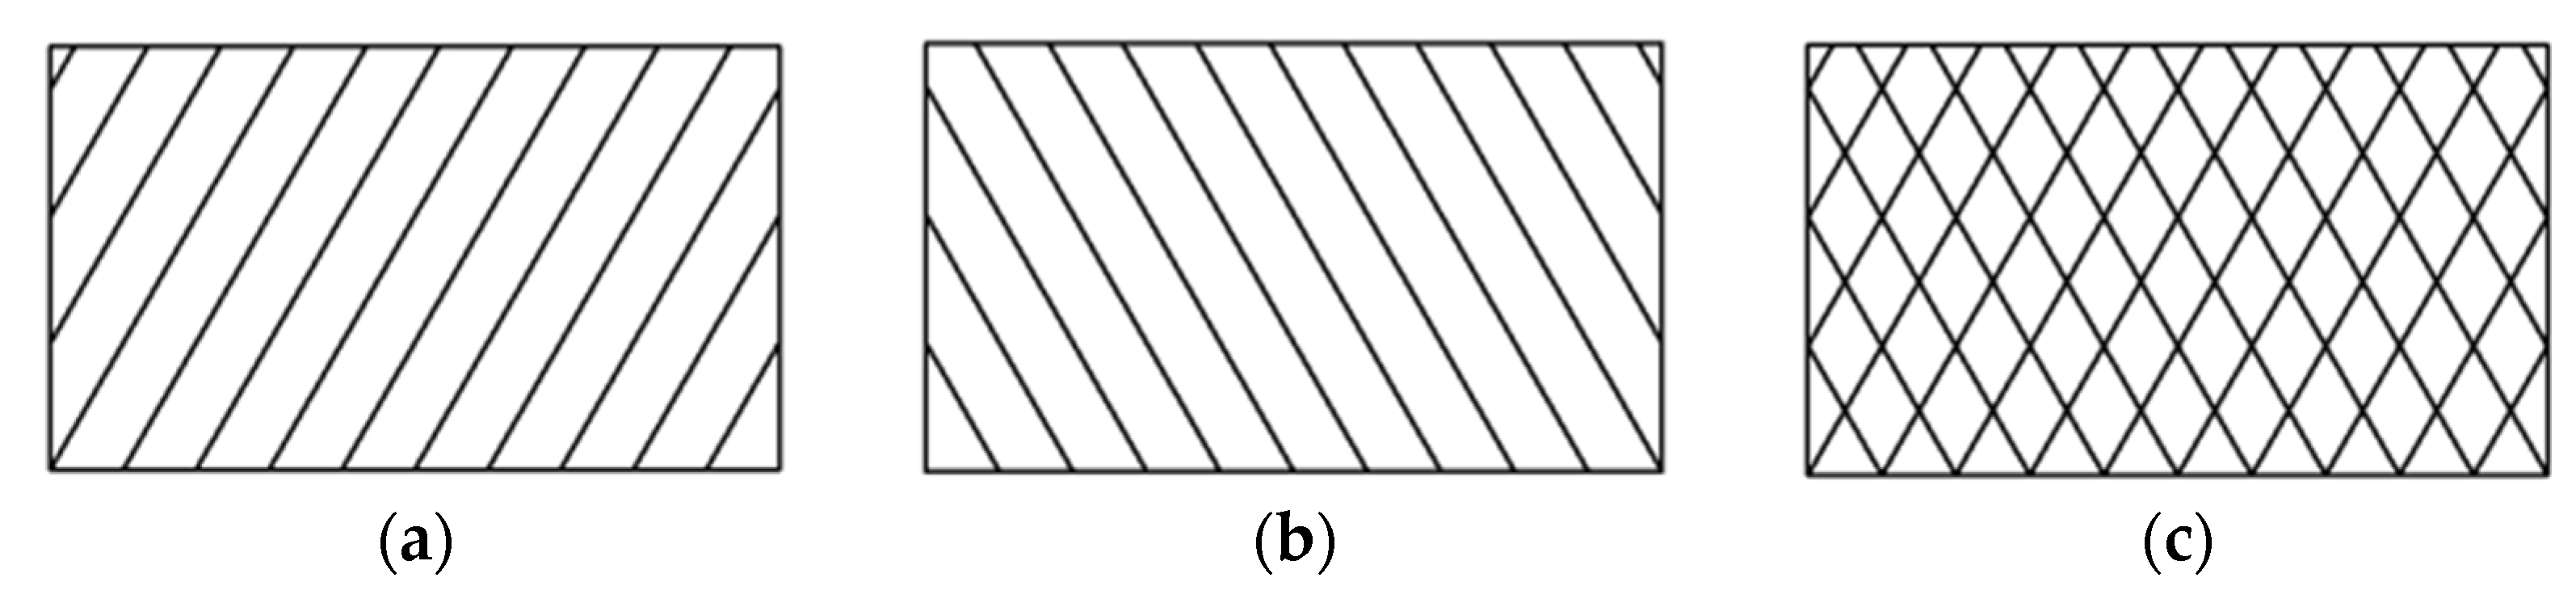
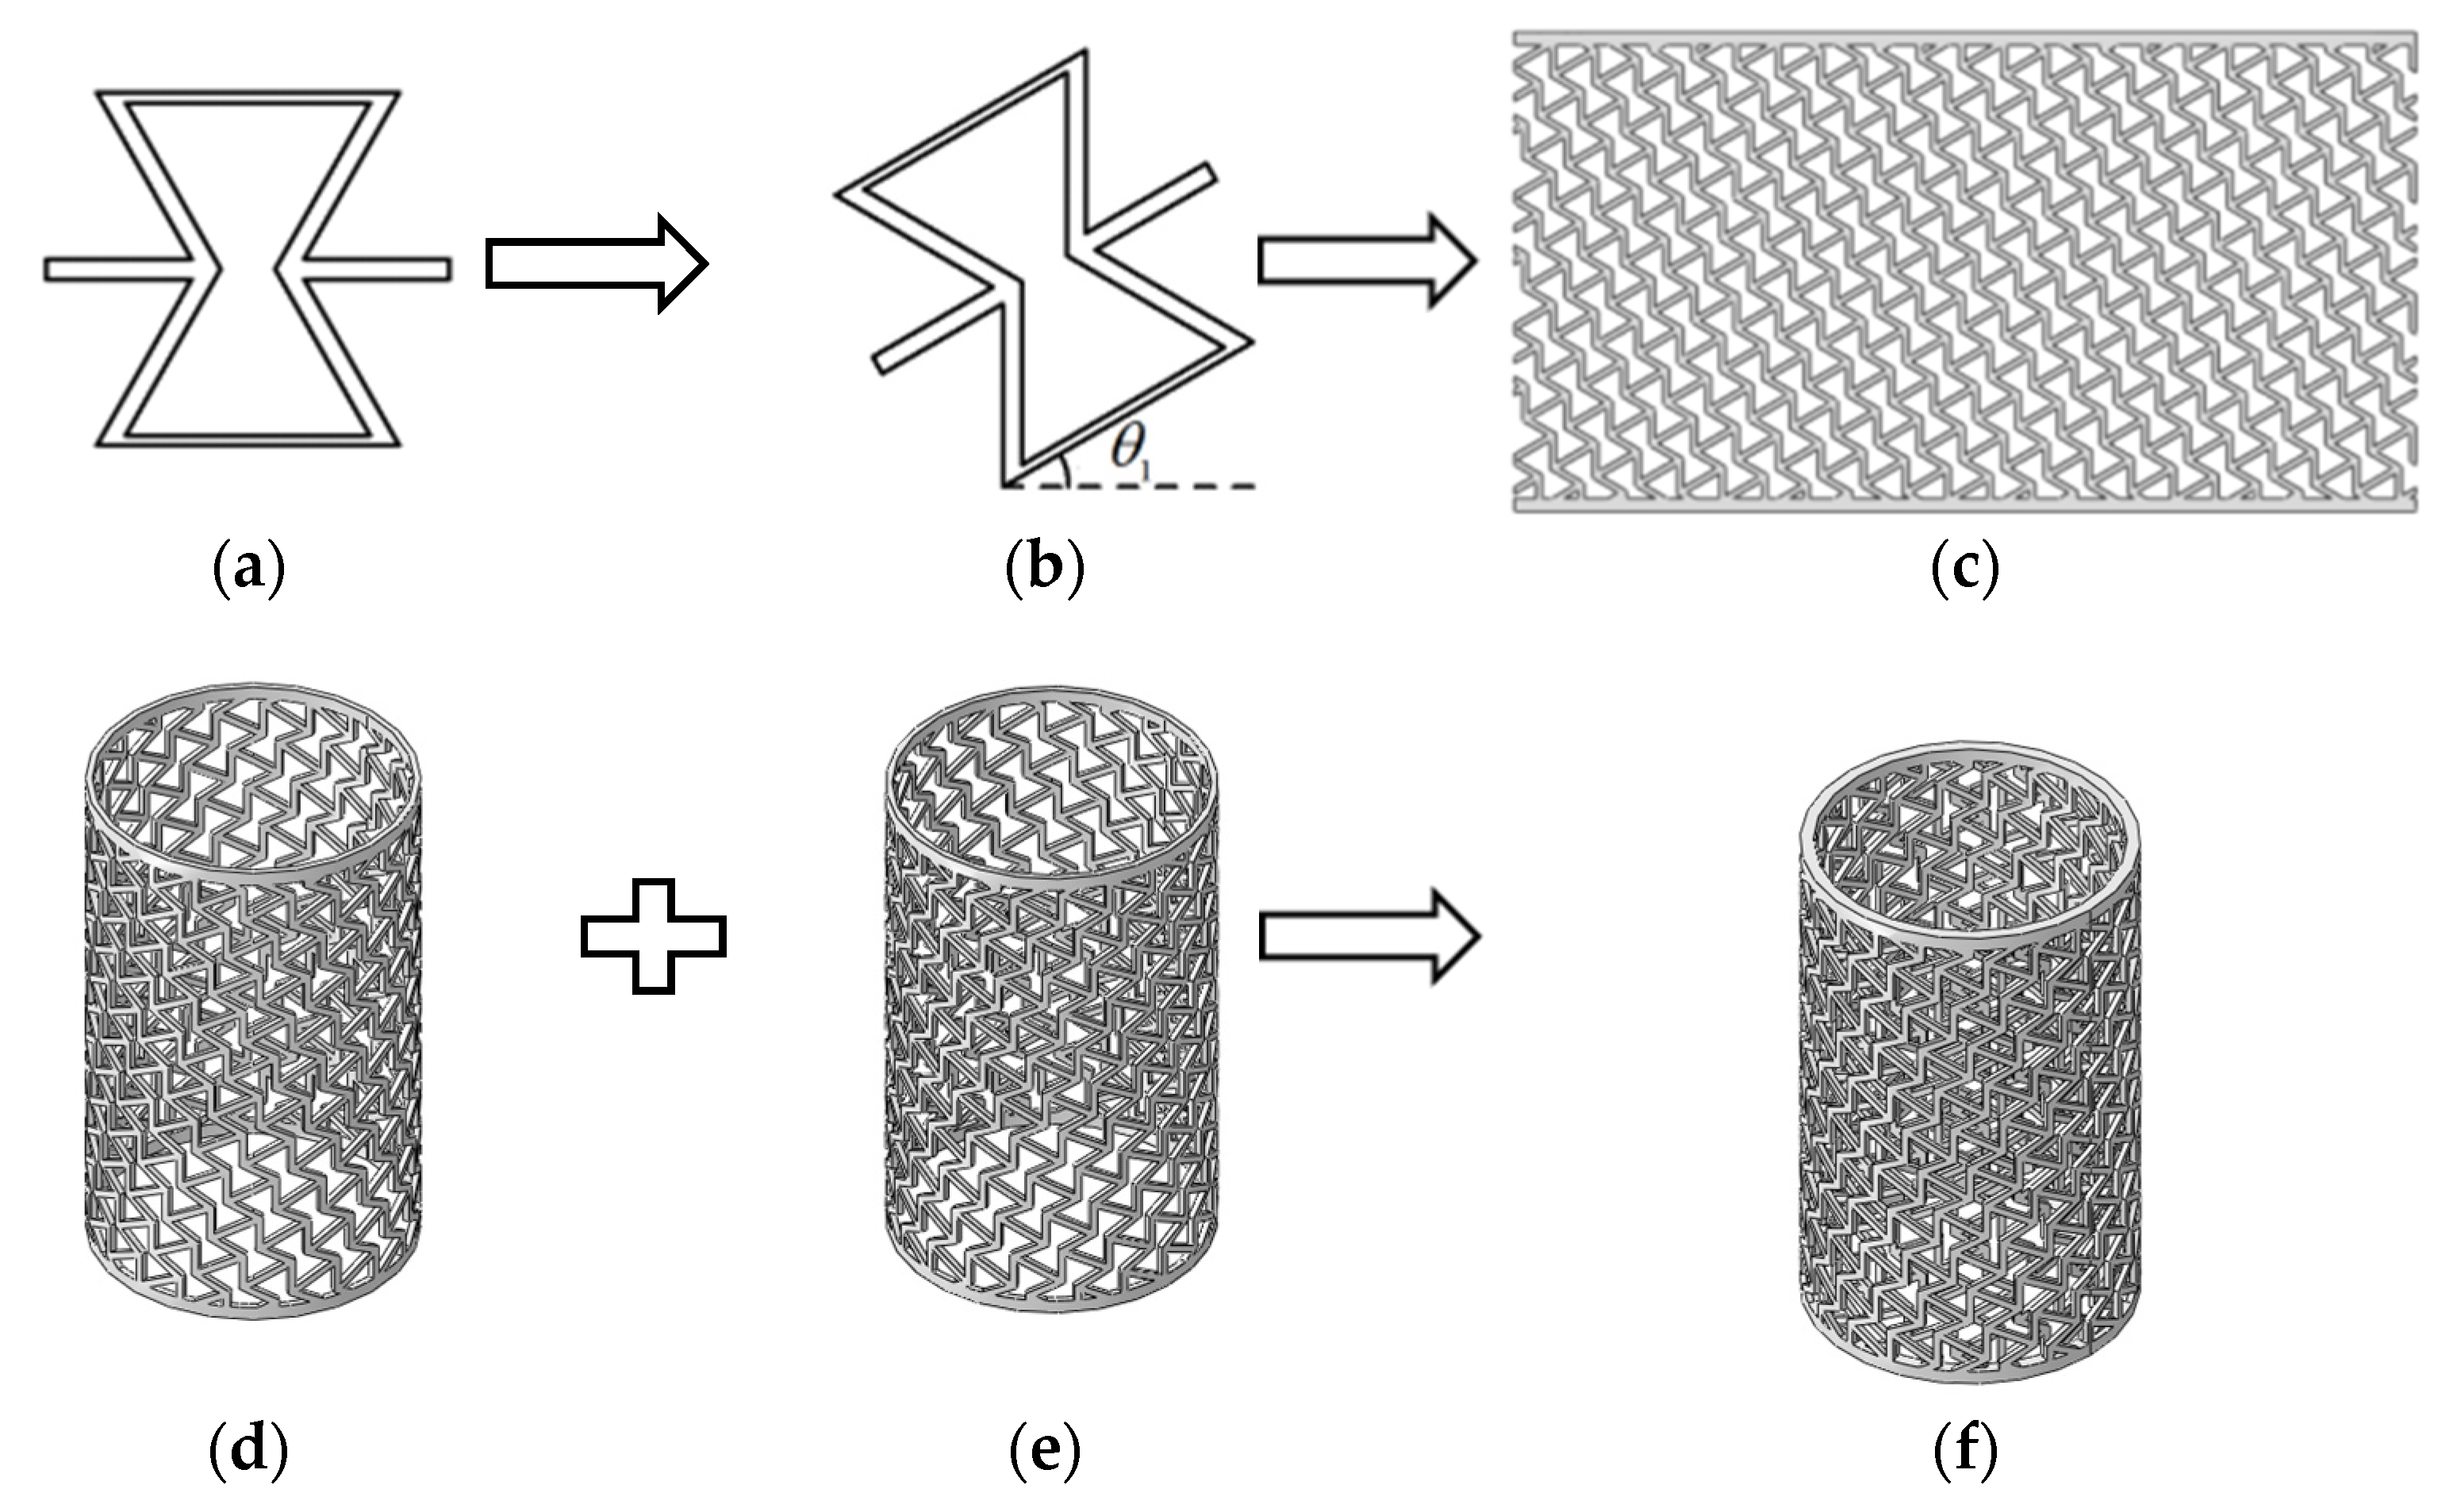
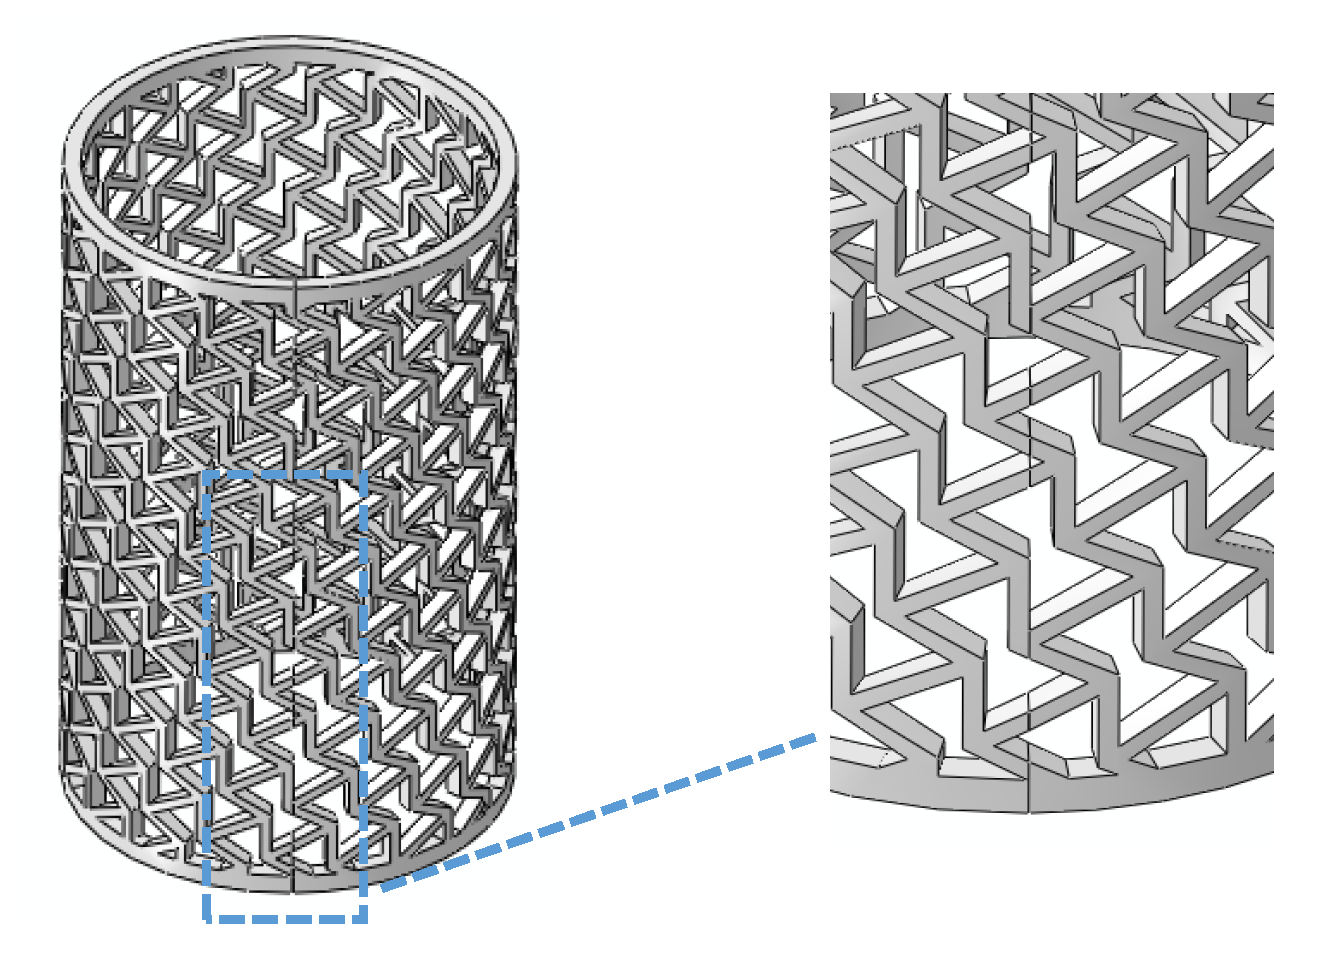
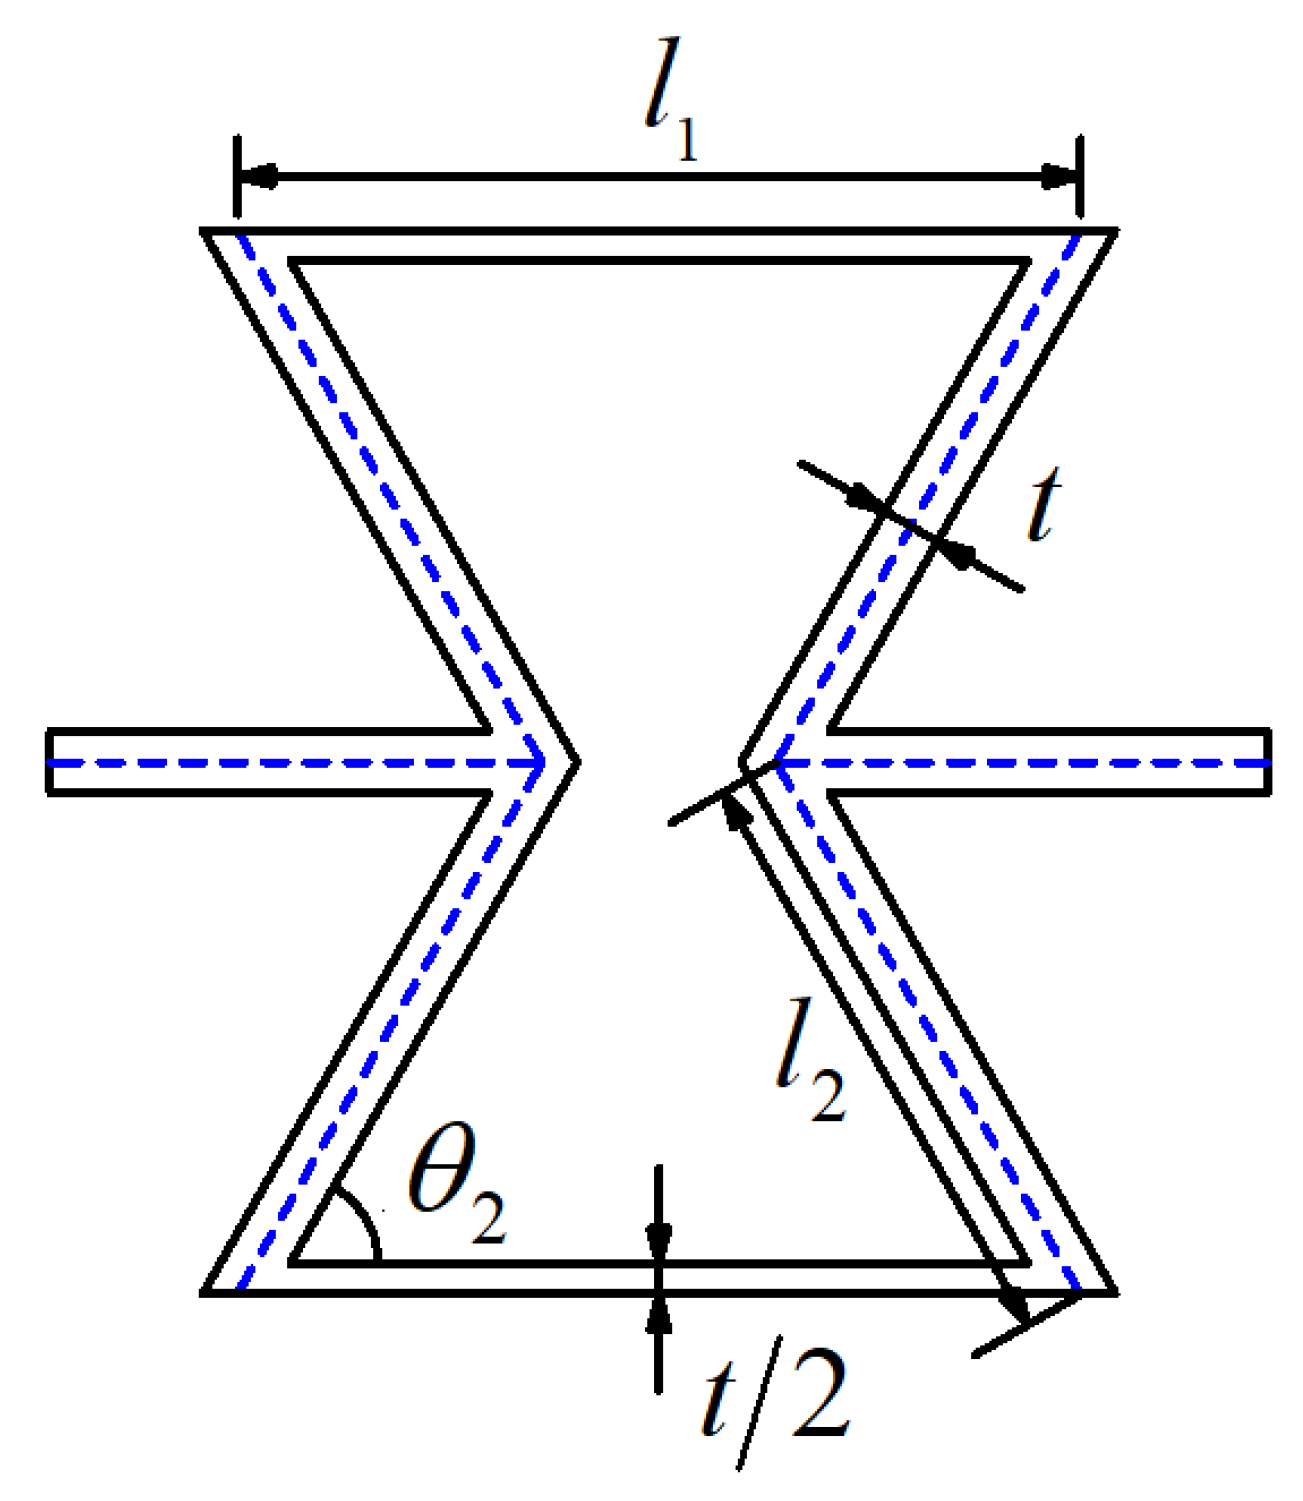
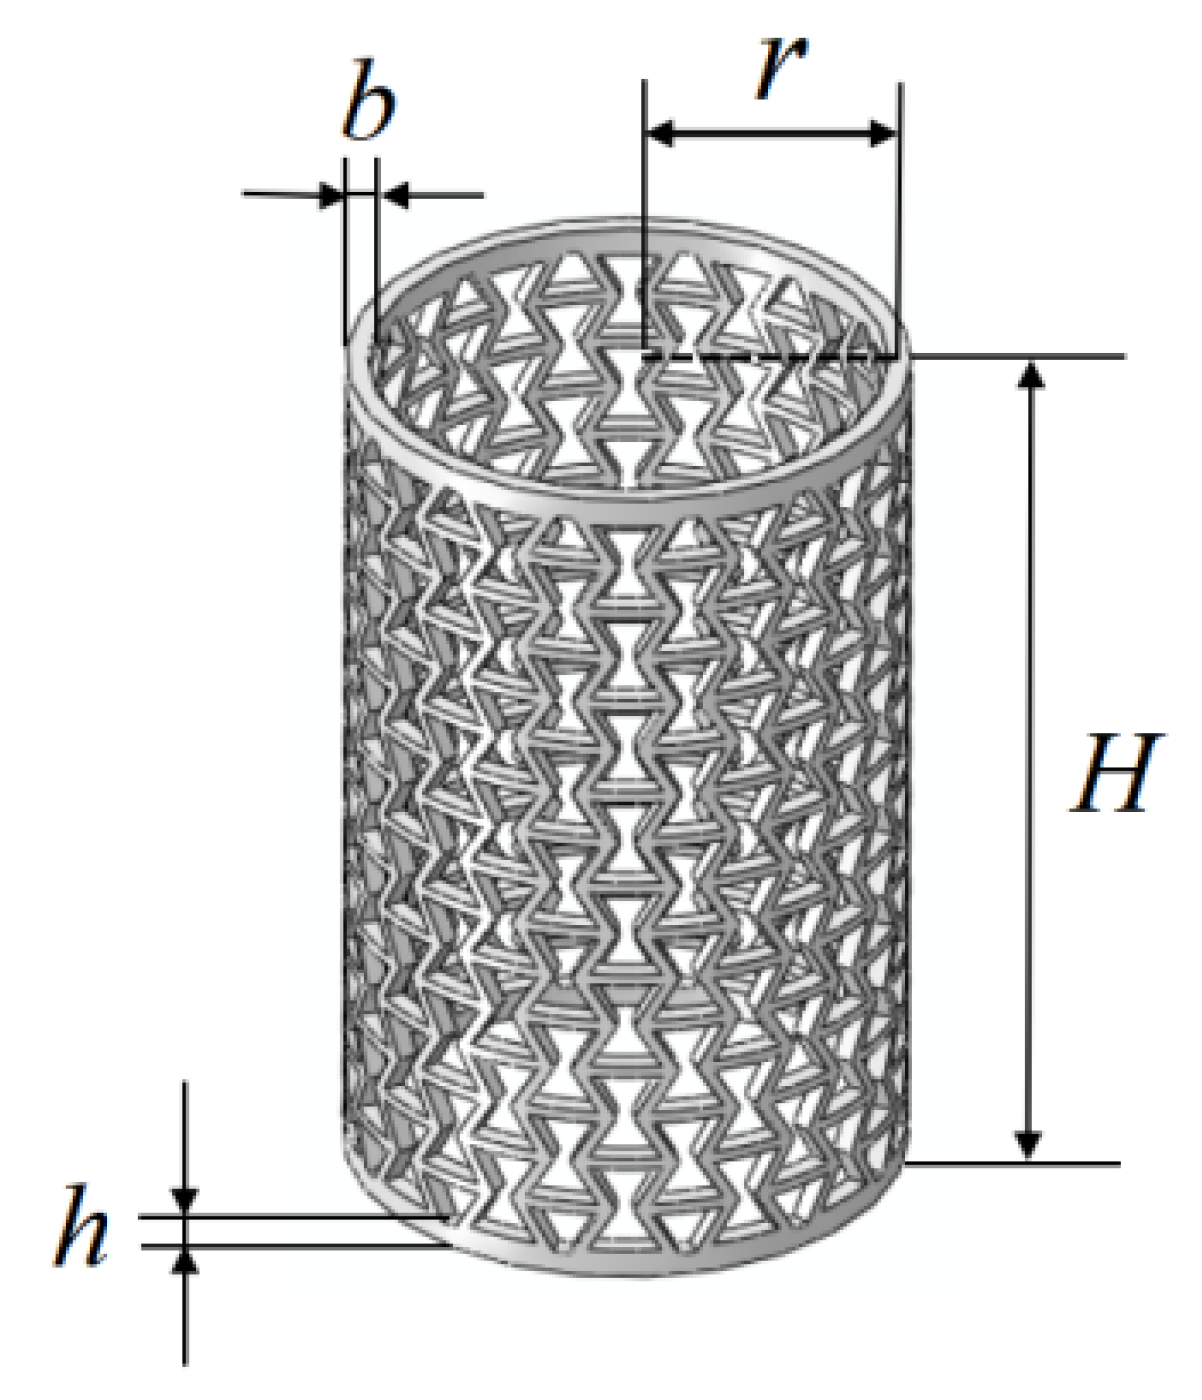
2.1. Models Design
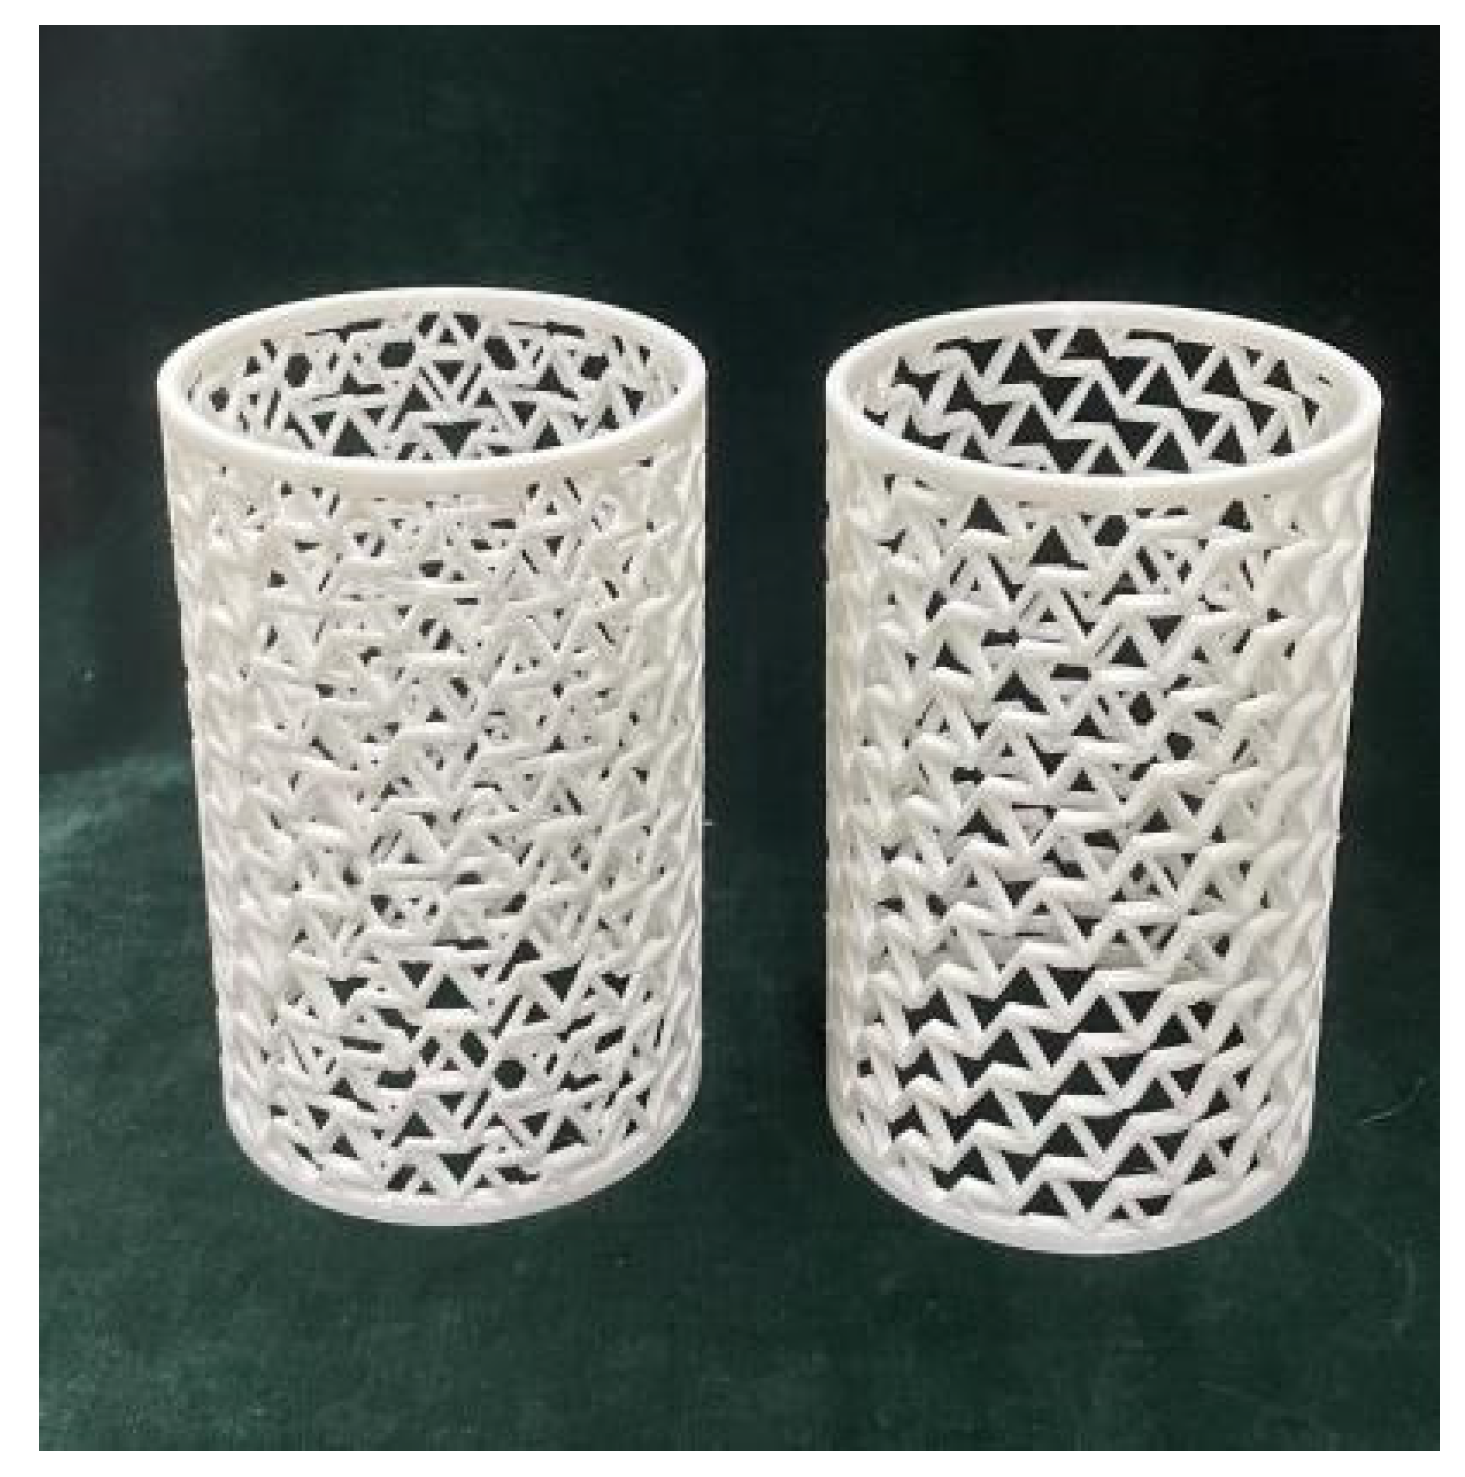
2.2. Fabrication of Models
3. Method
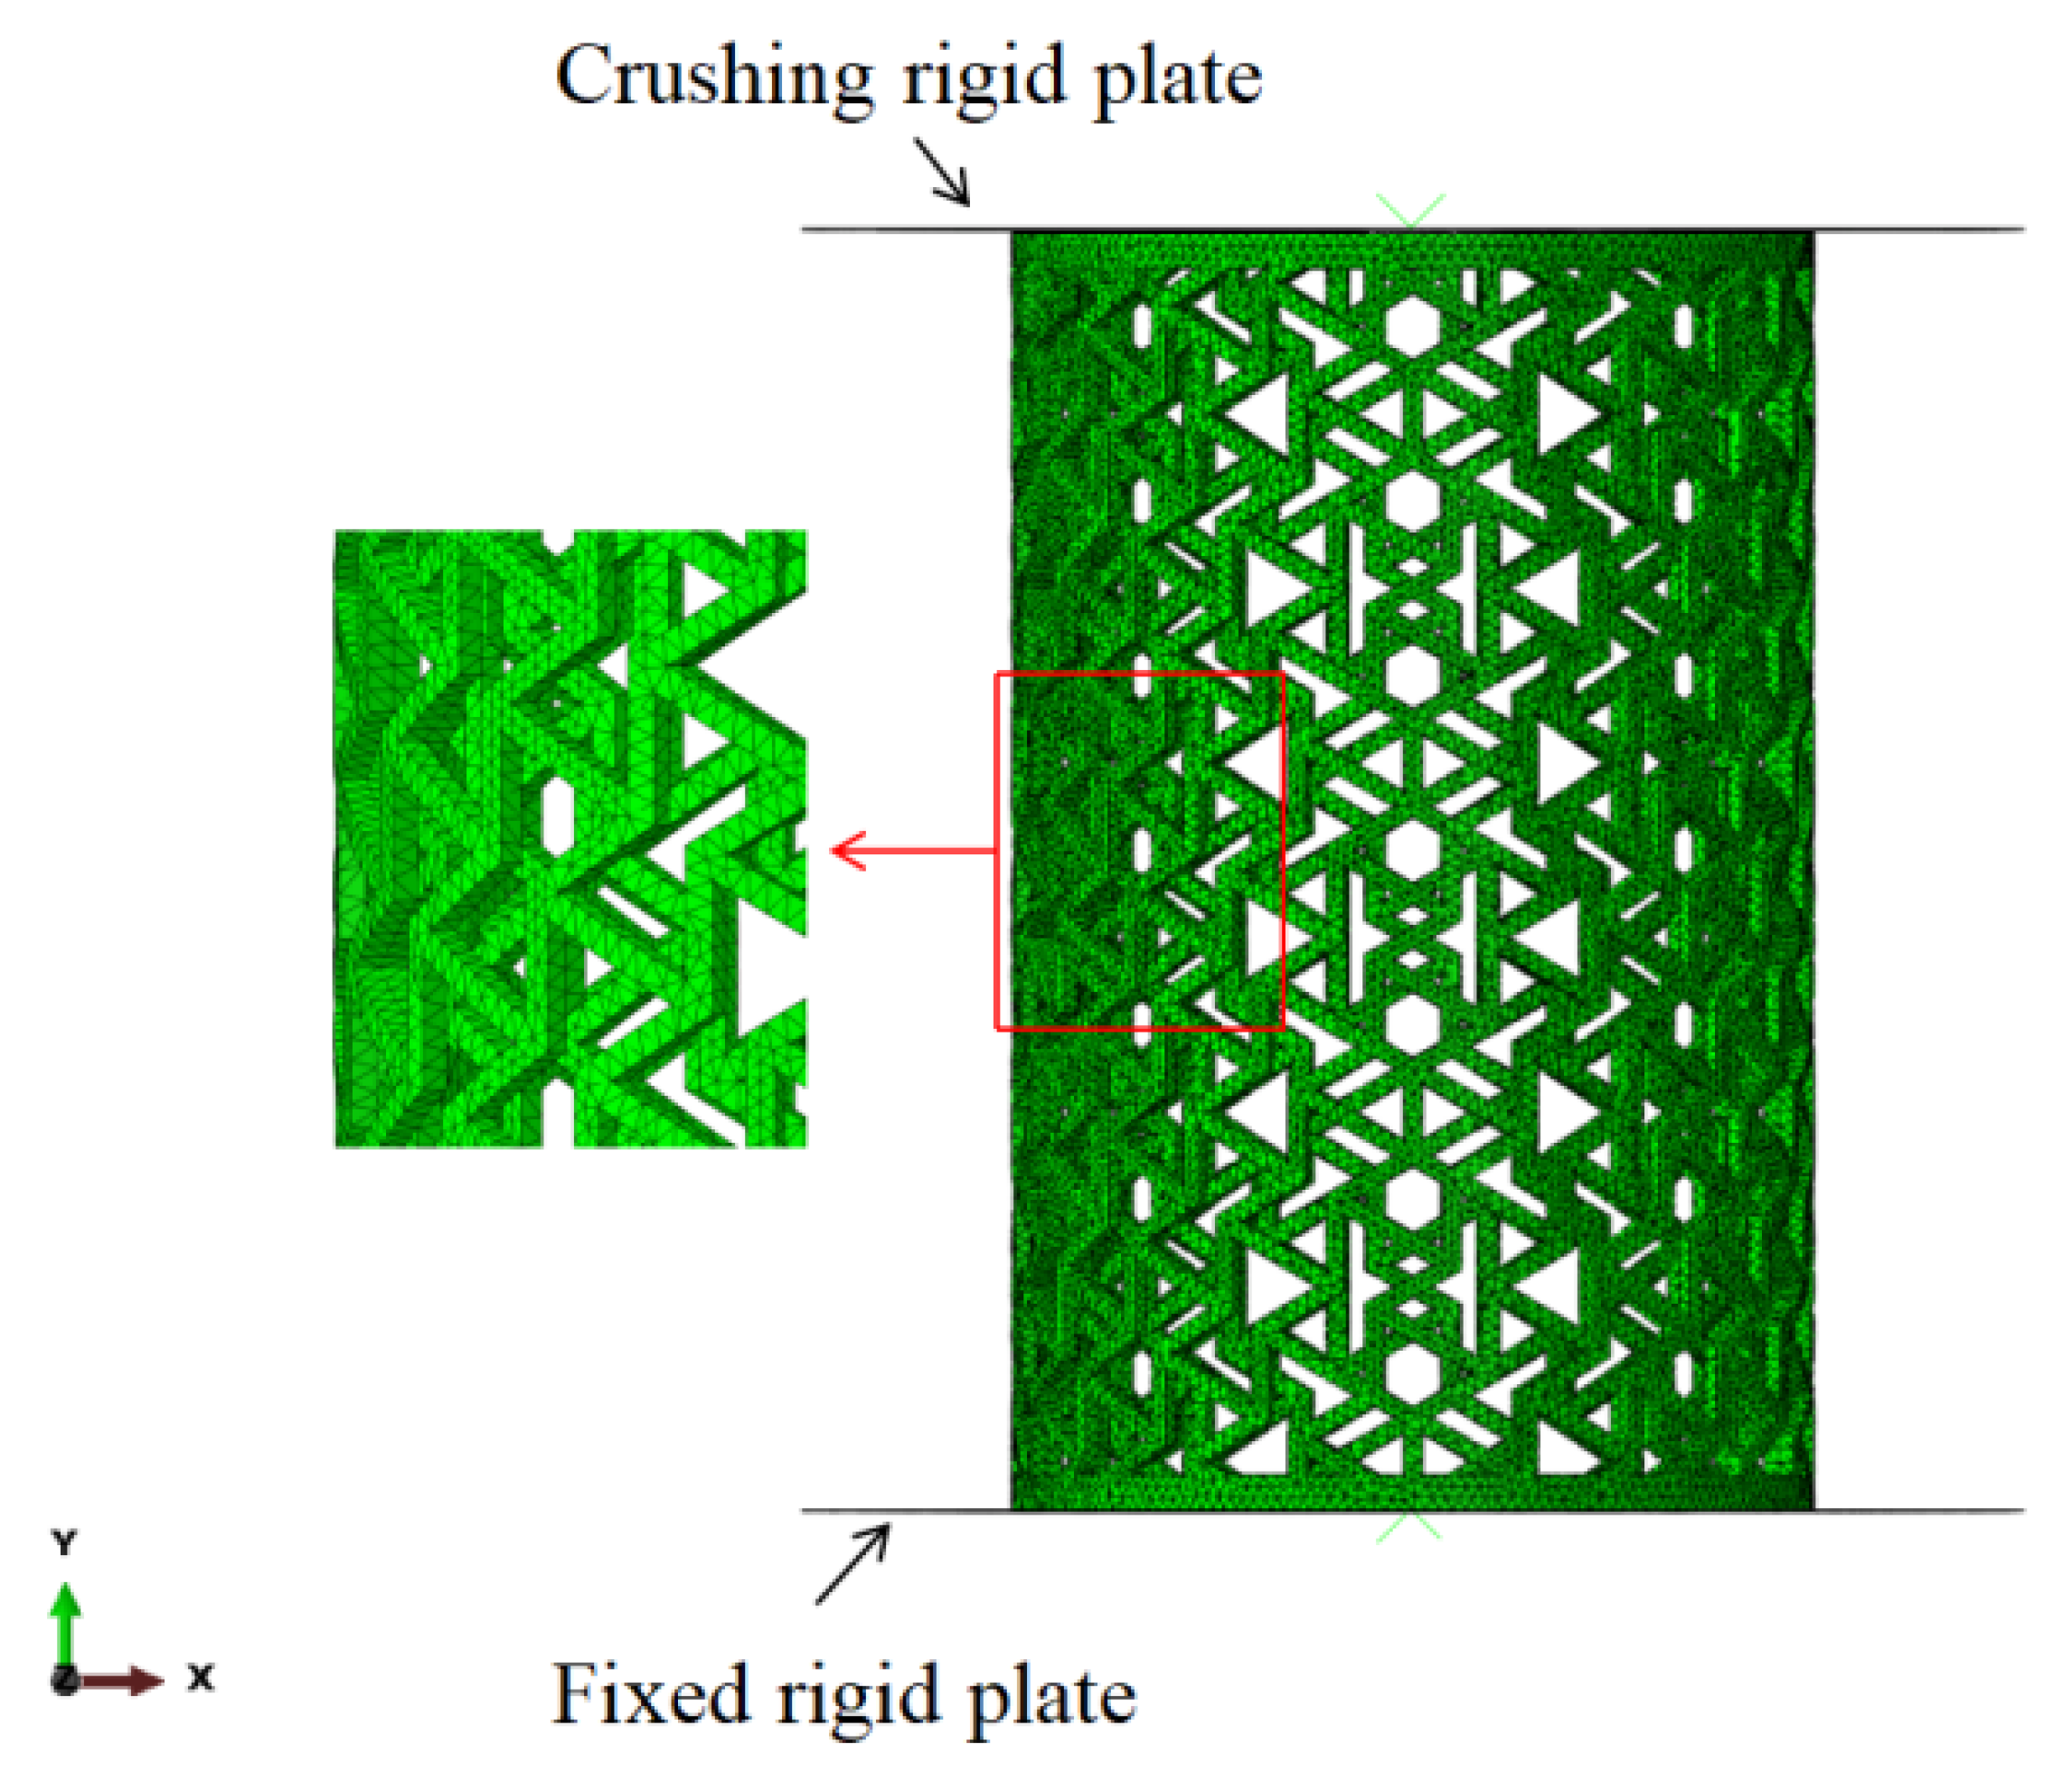
3.1. Experiment and Simulation
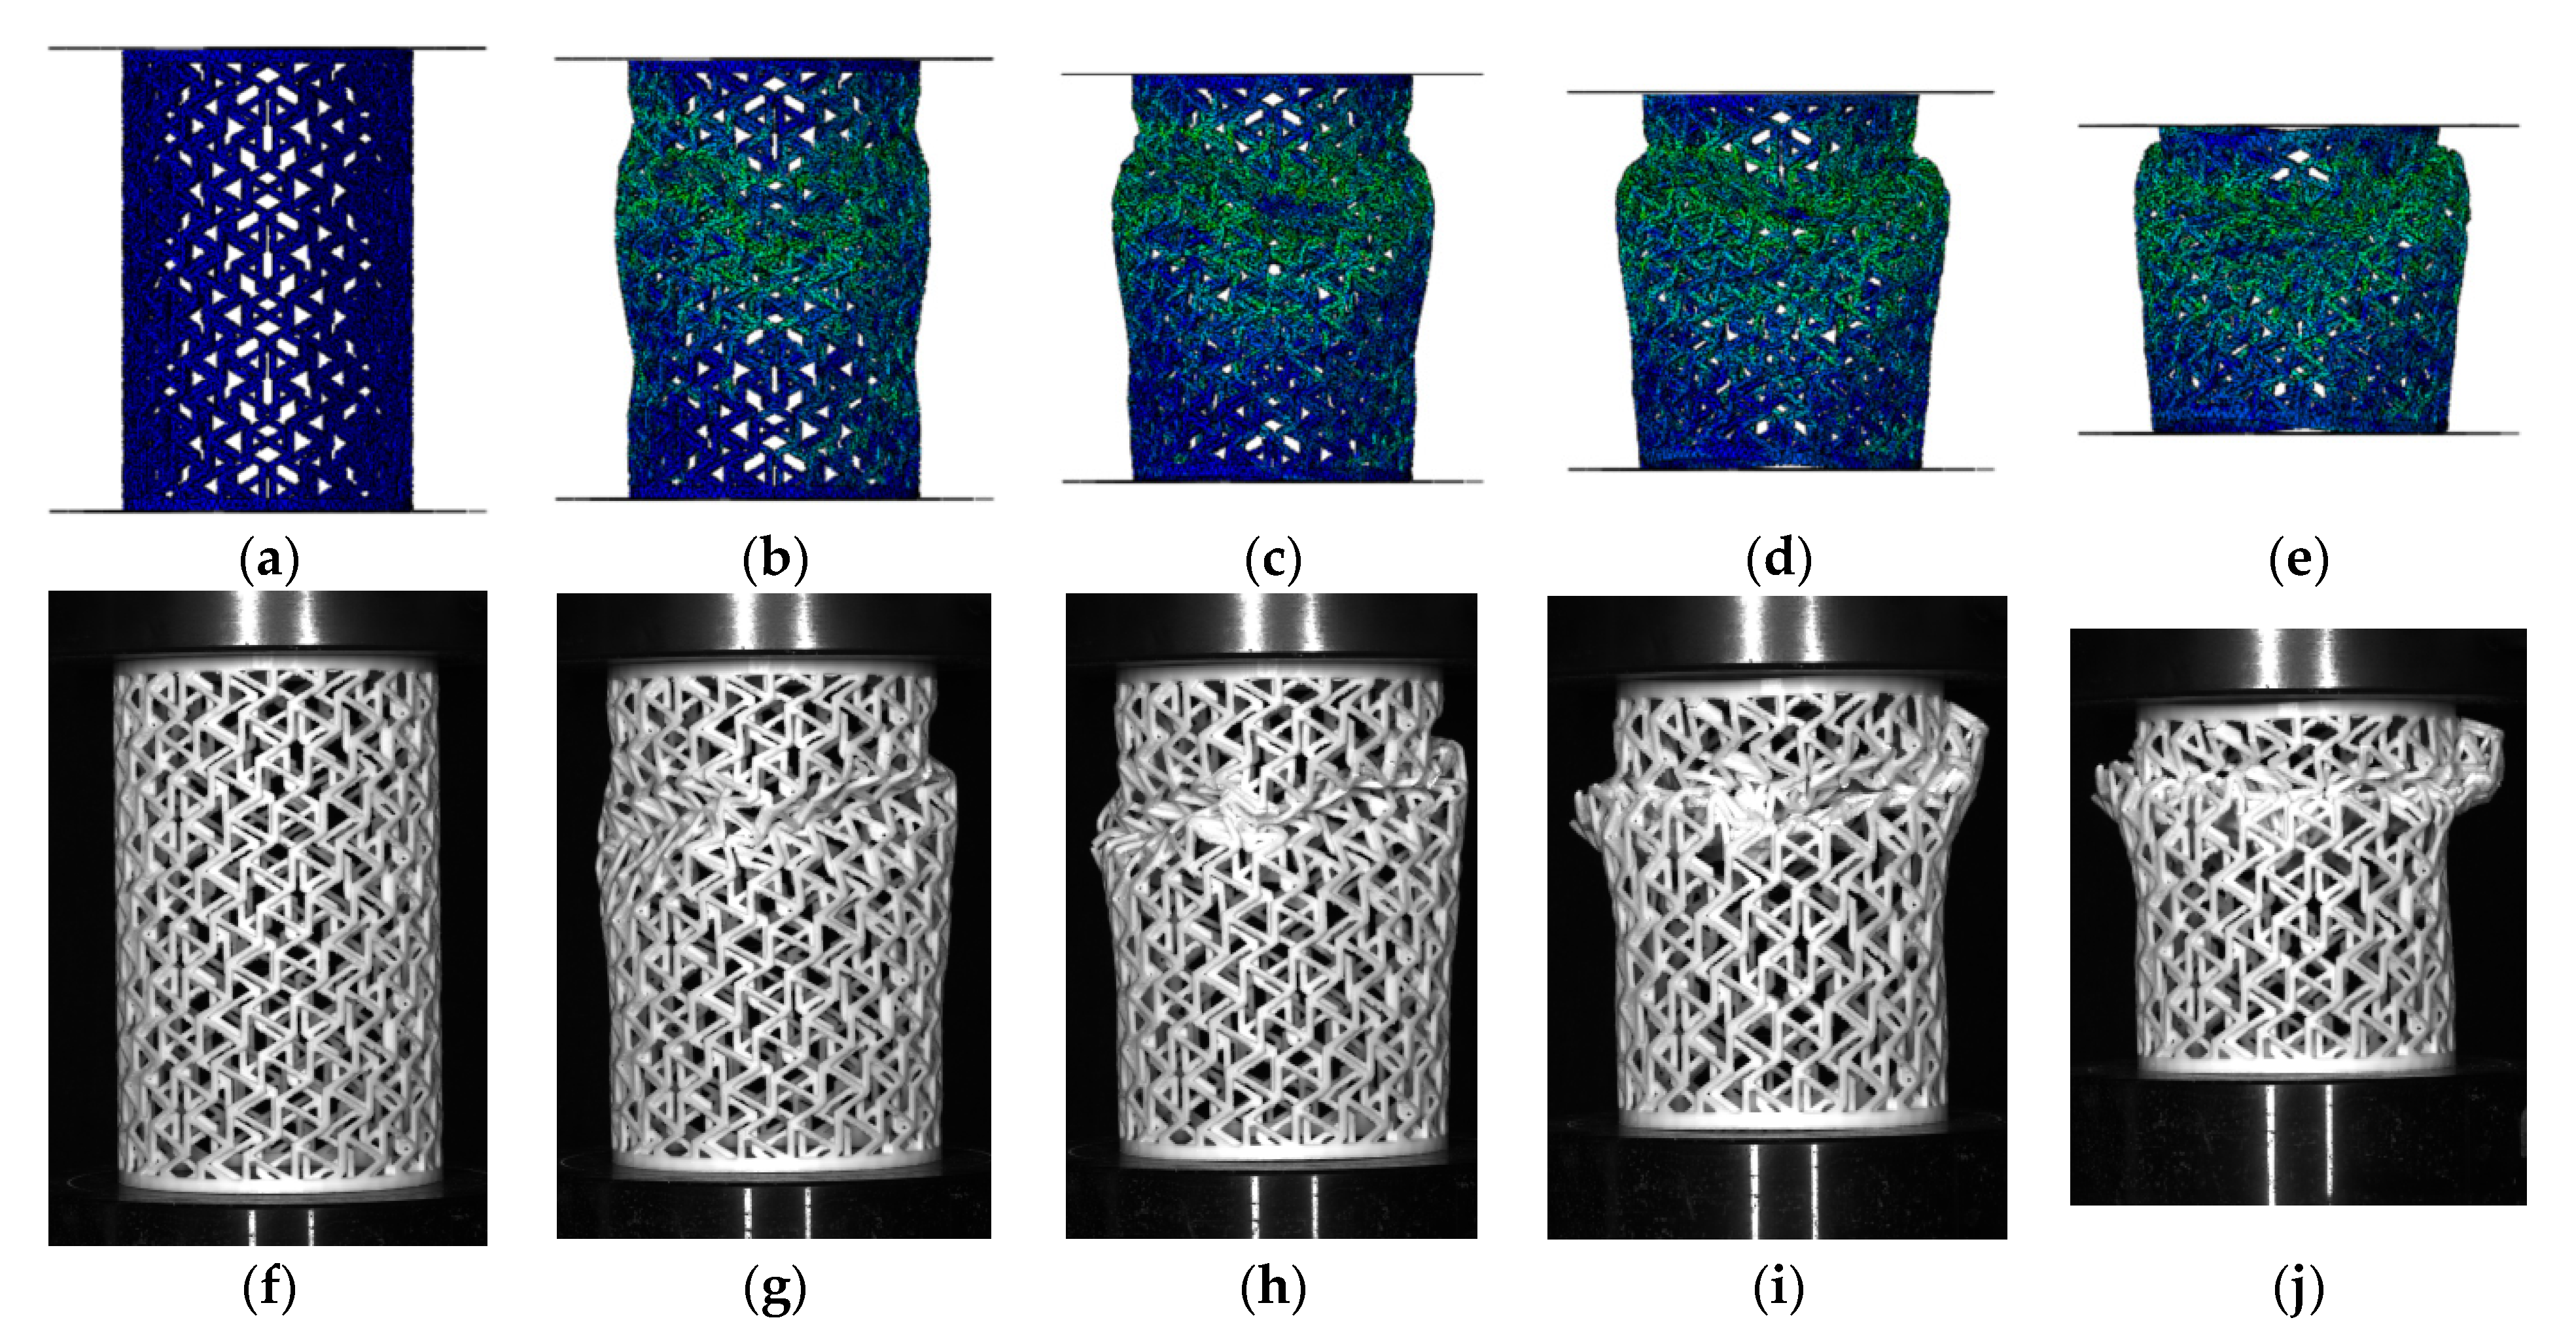
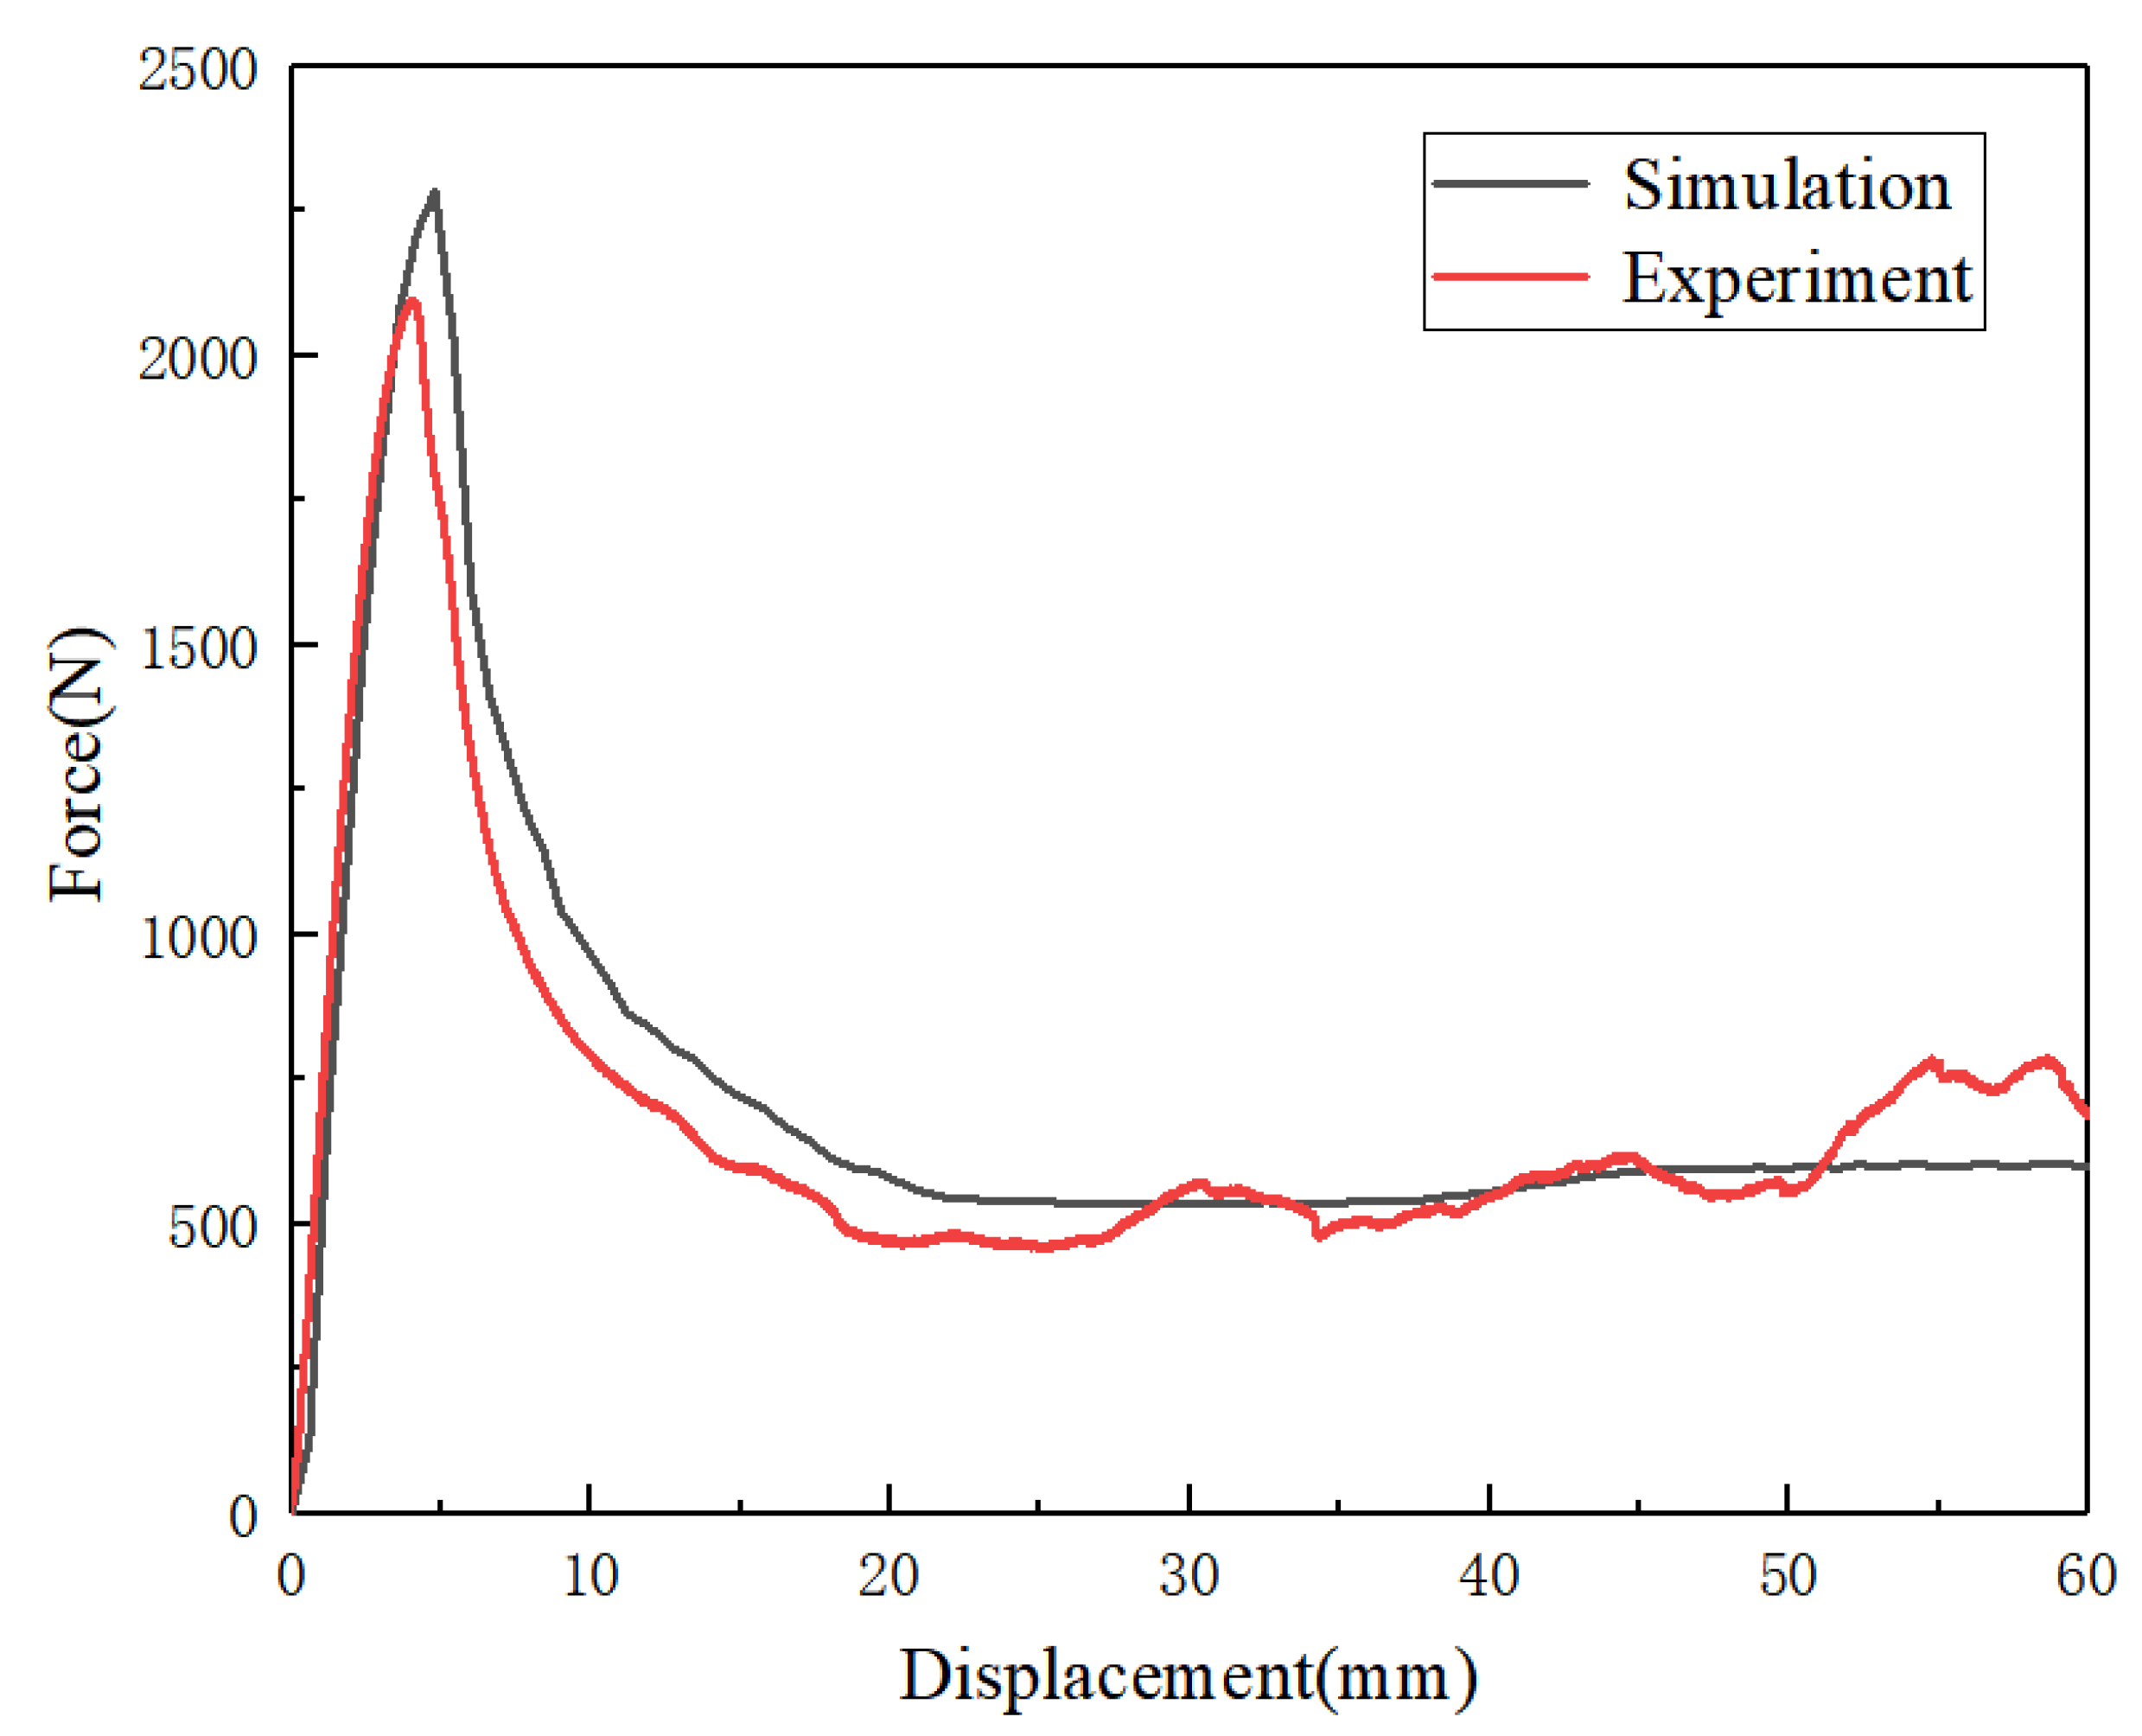
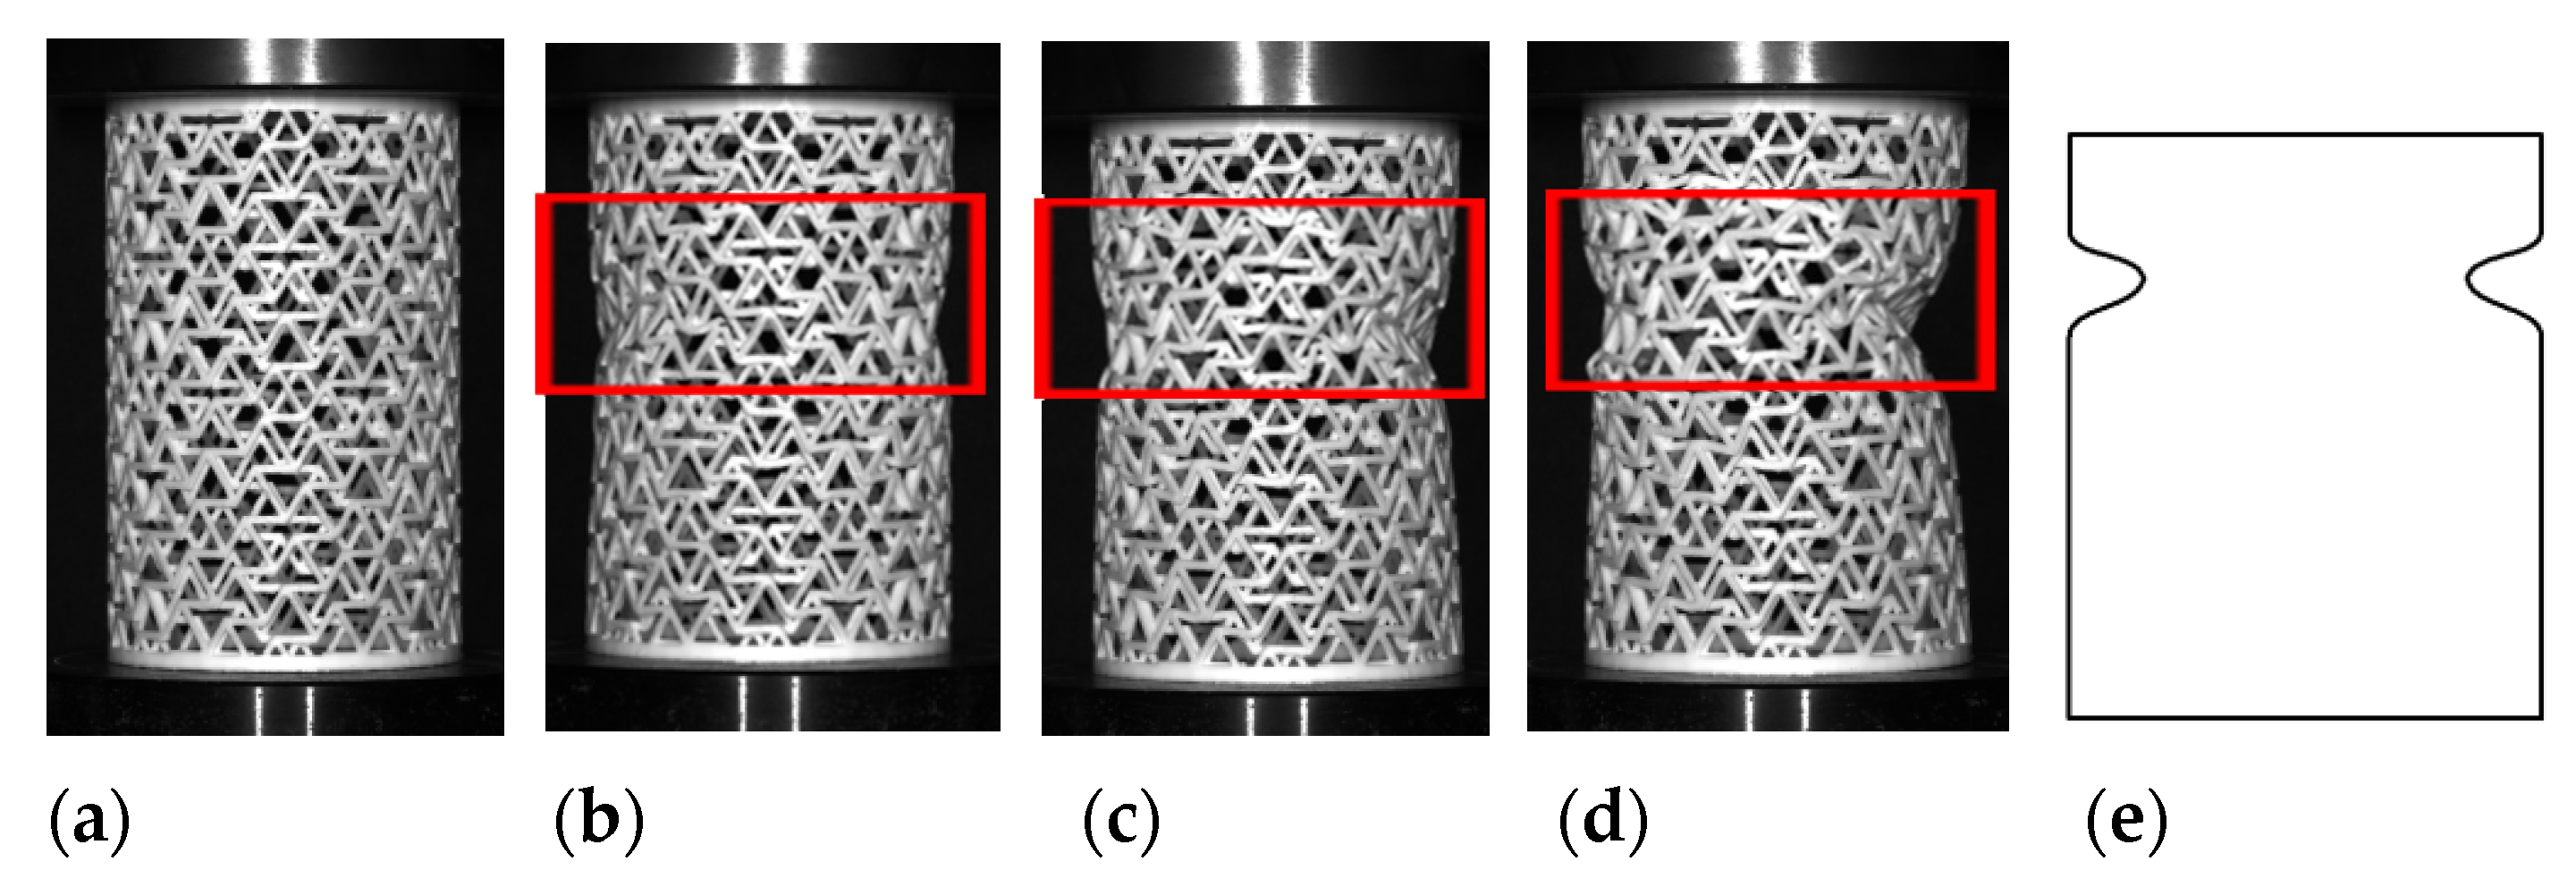
3.2. Validation of Simulation Results
4. Results and Discussions
4.1. The Theory of Energy Absorption
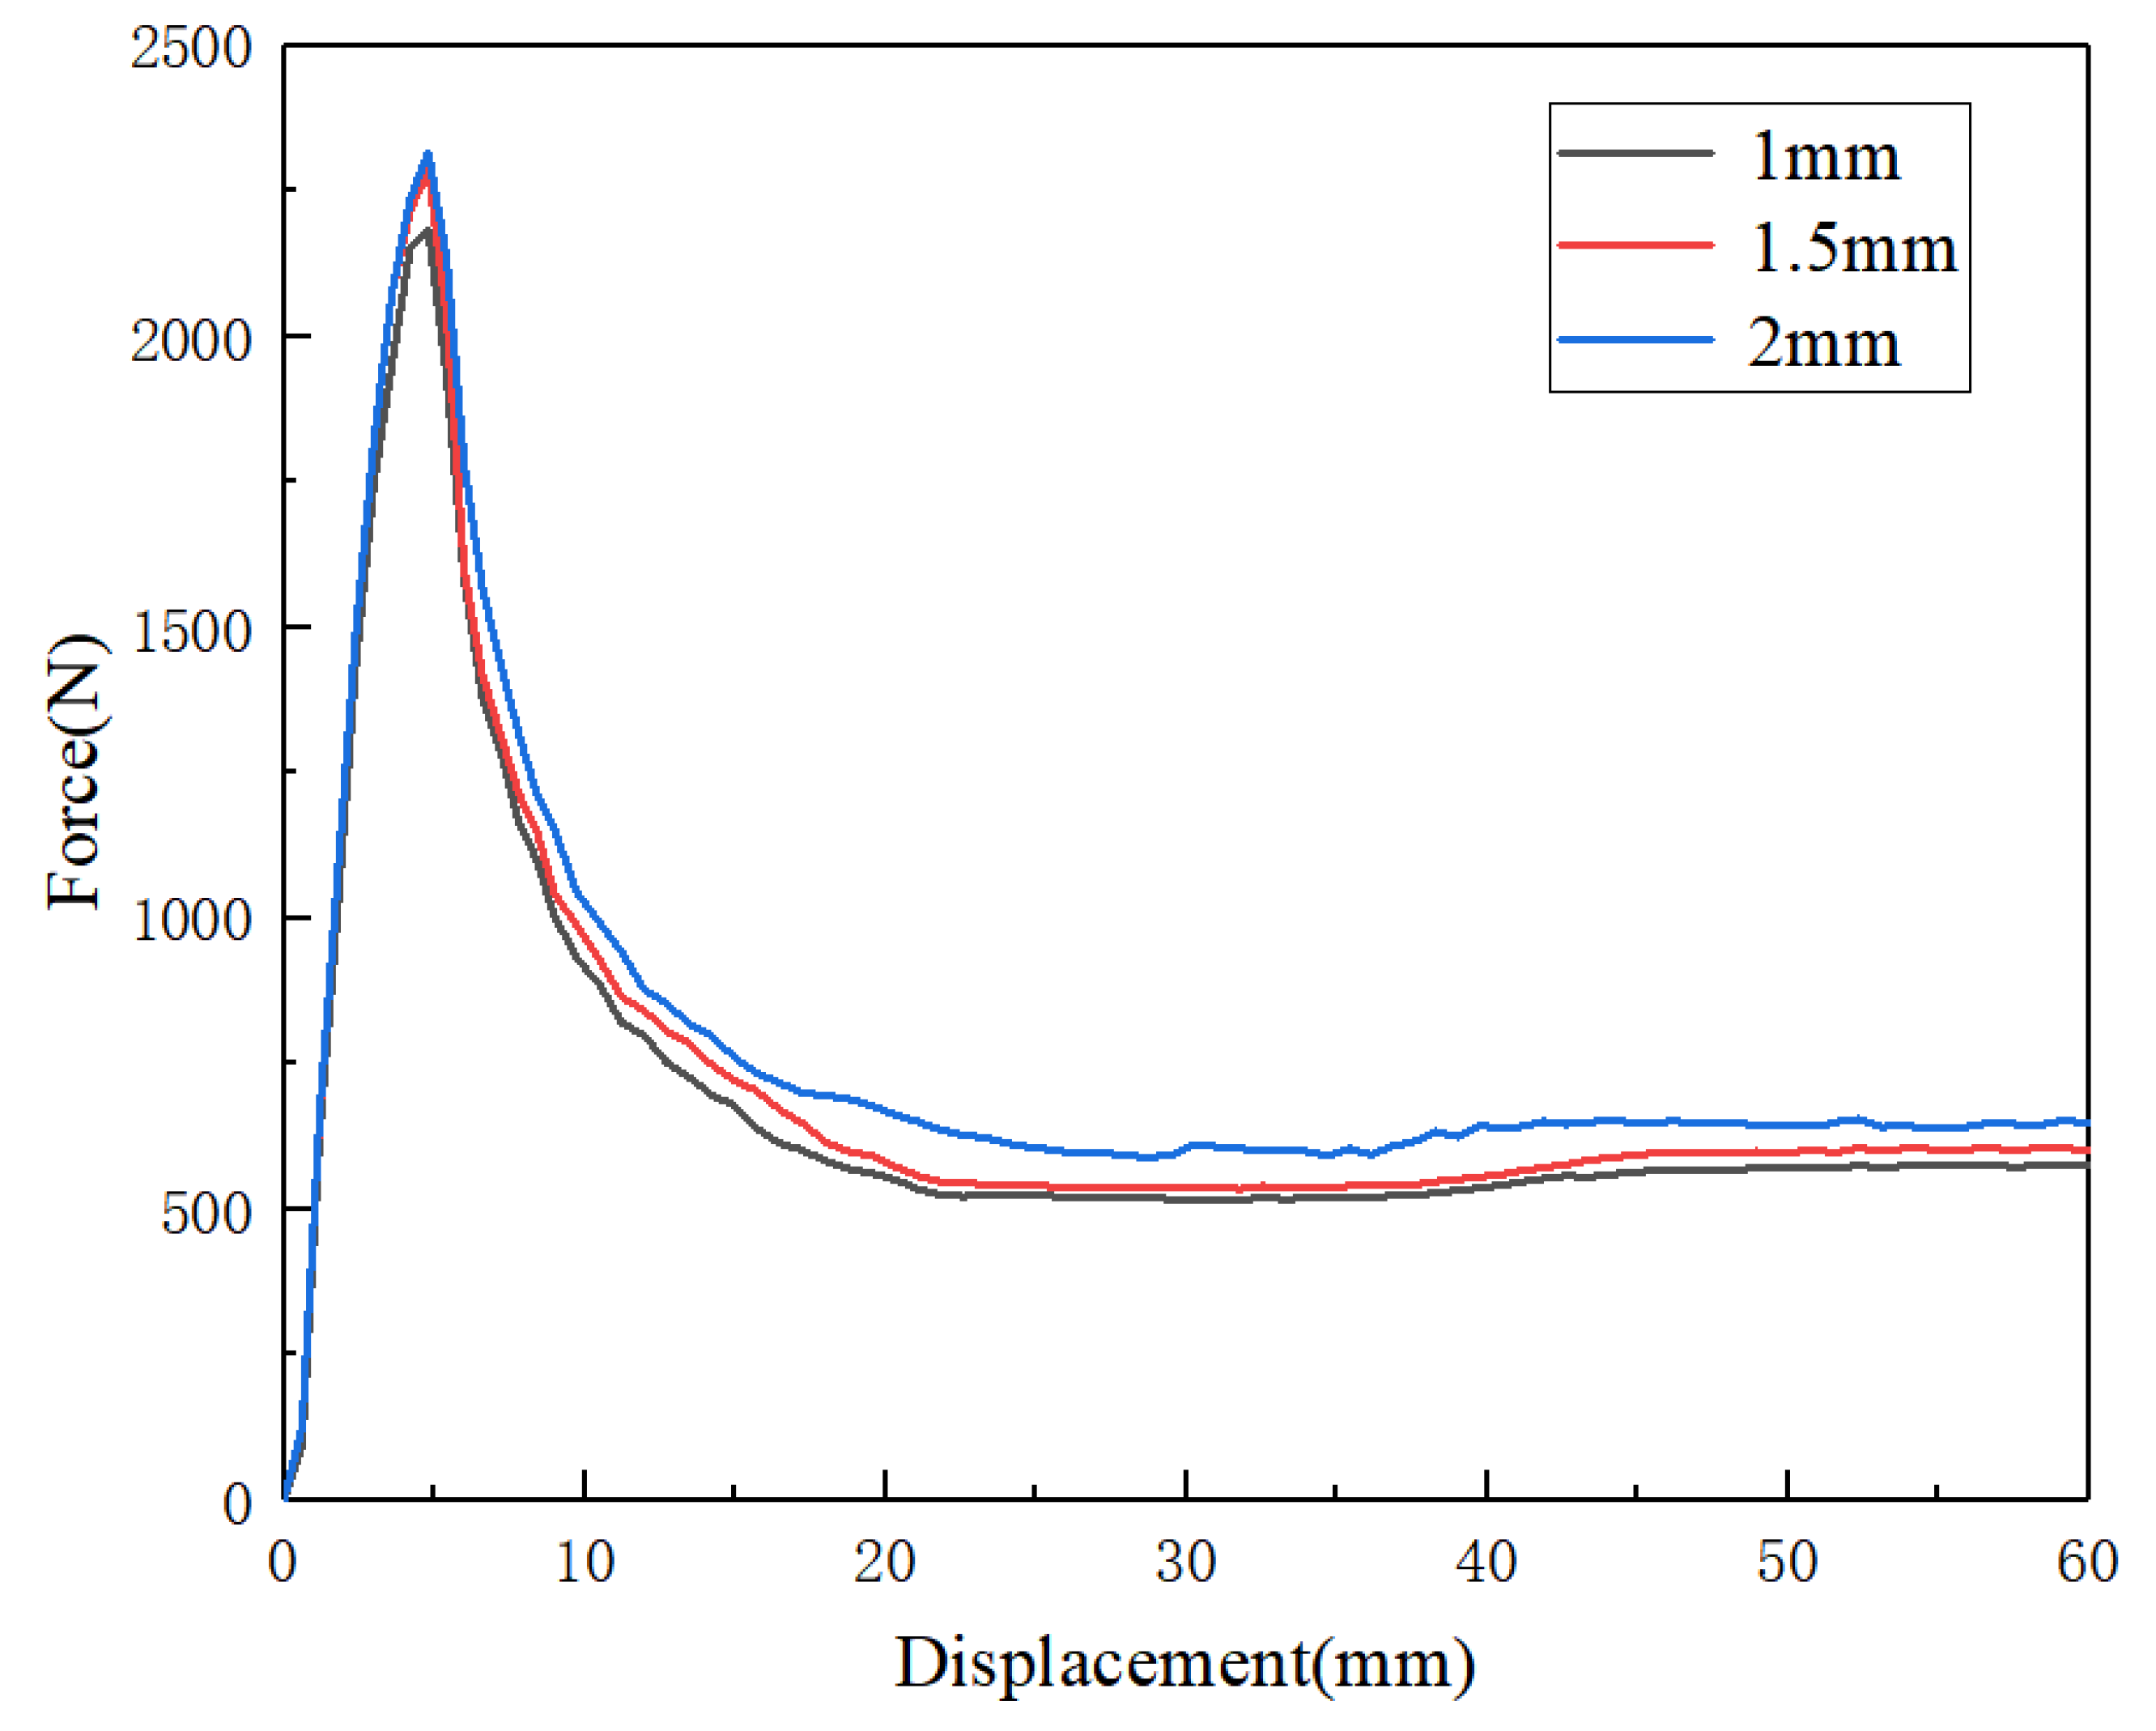
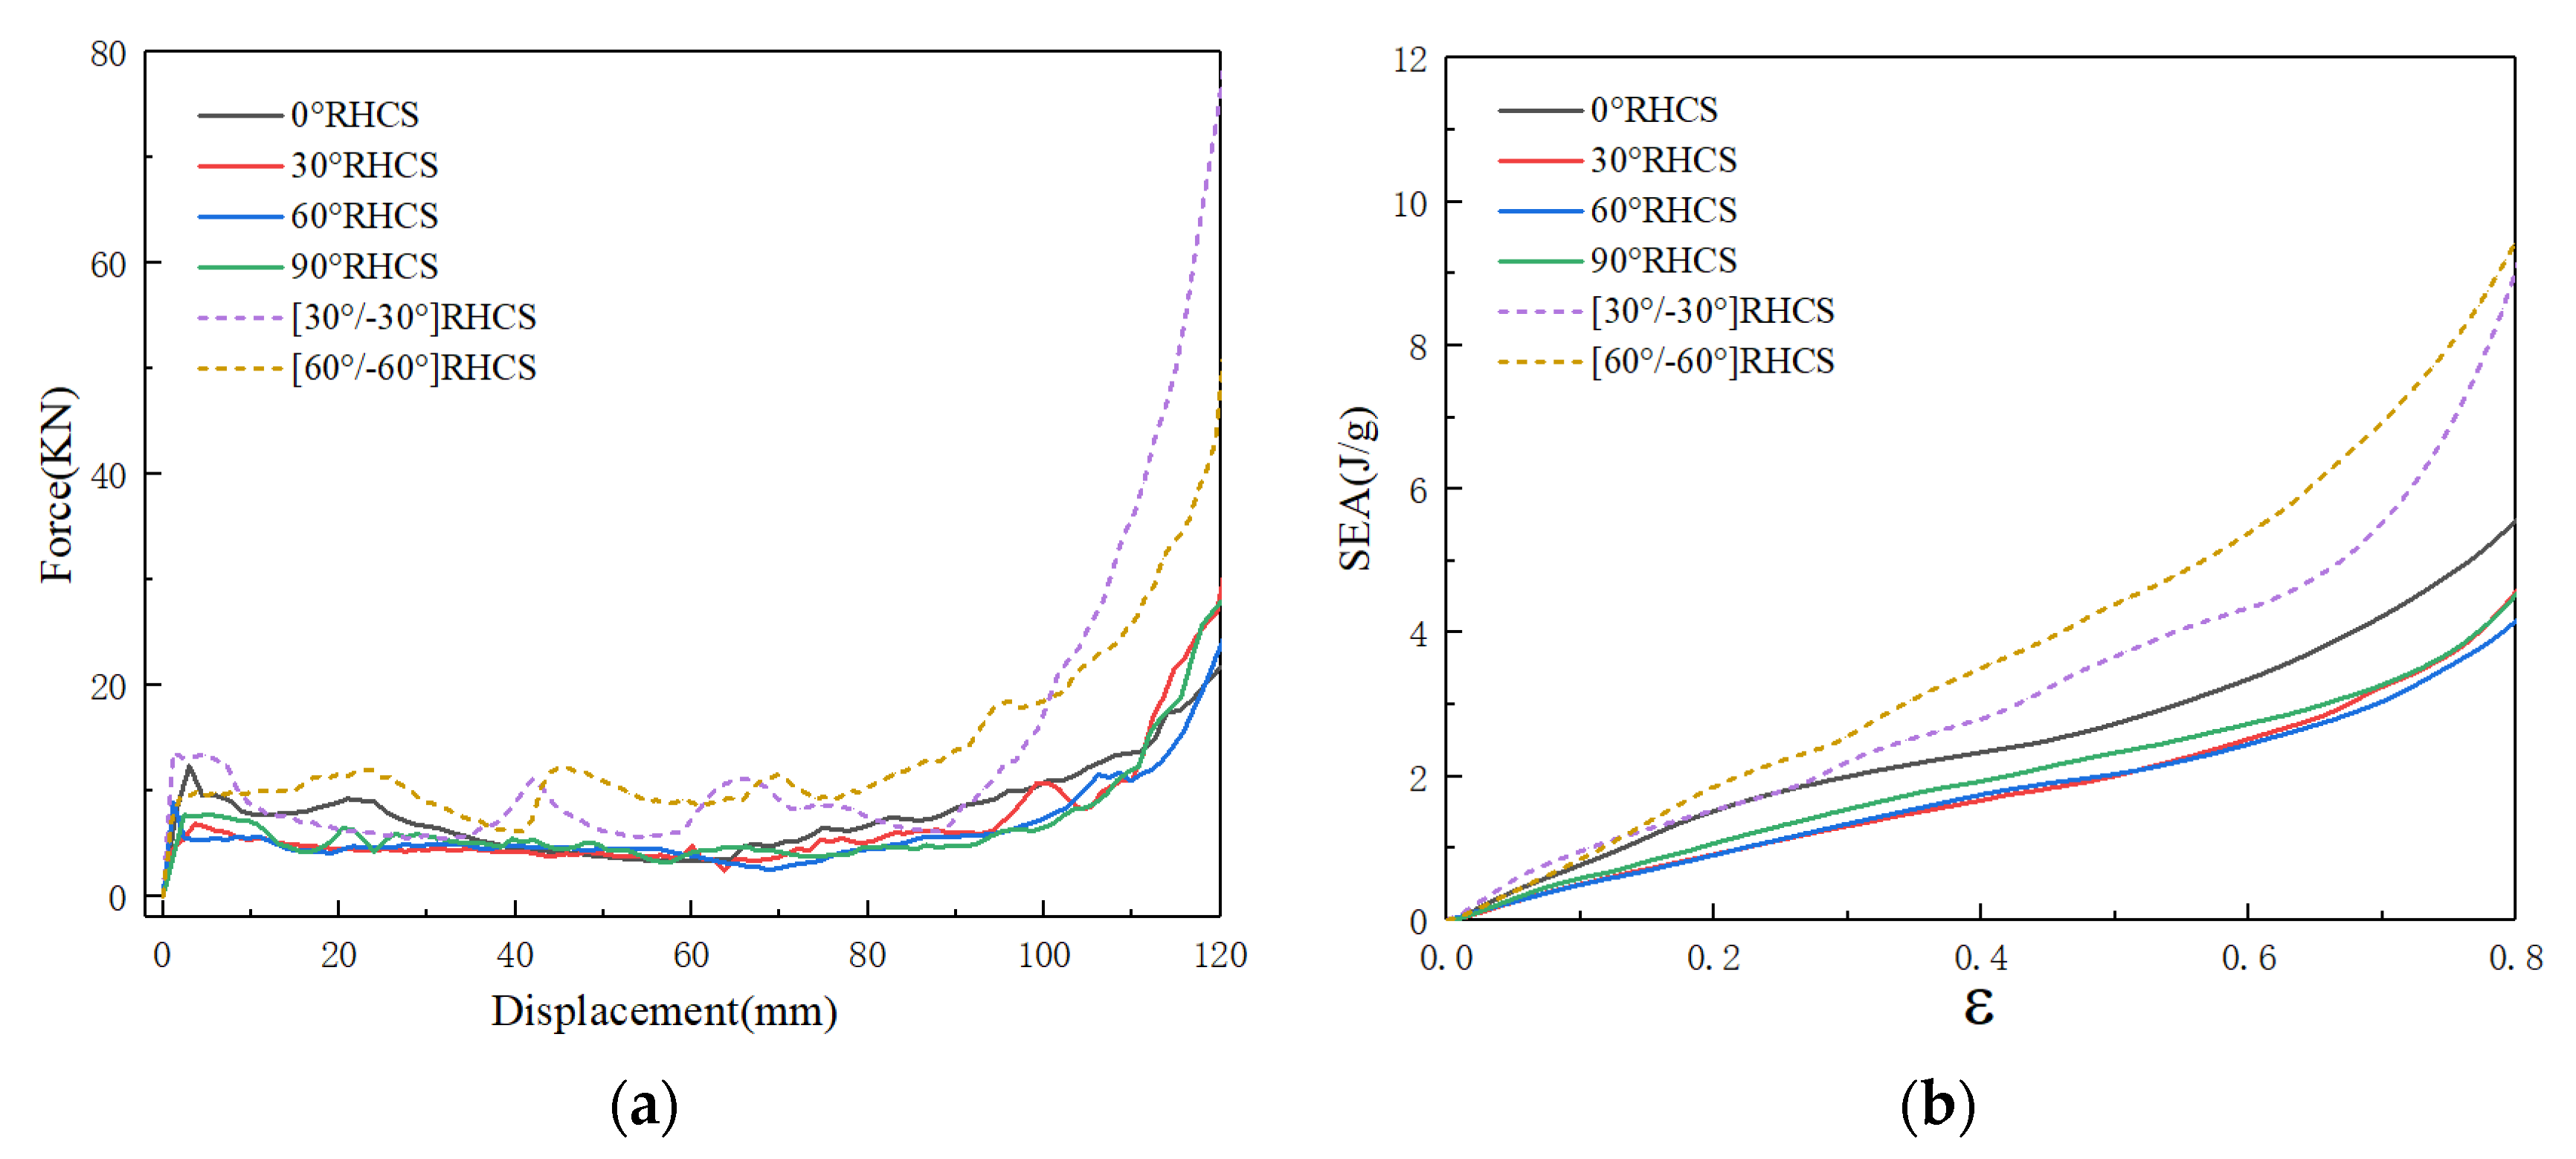
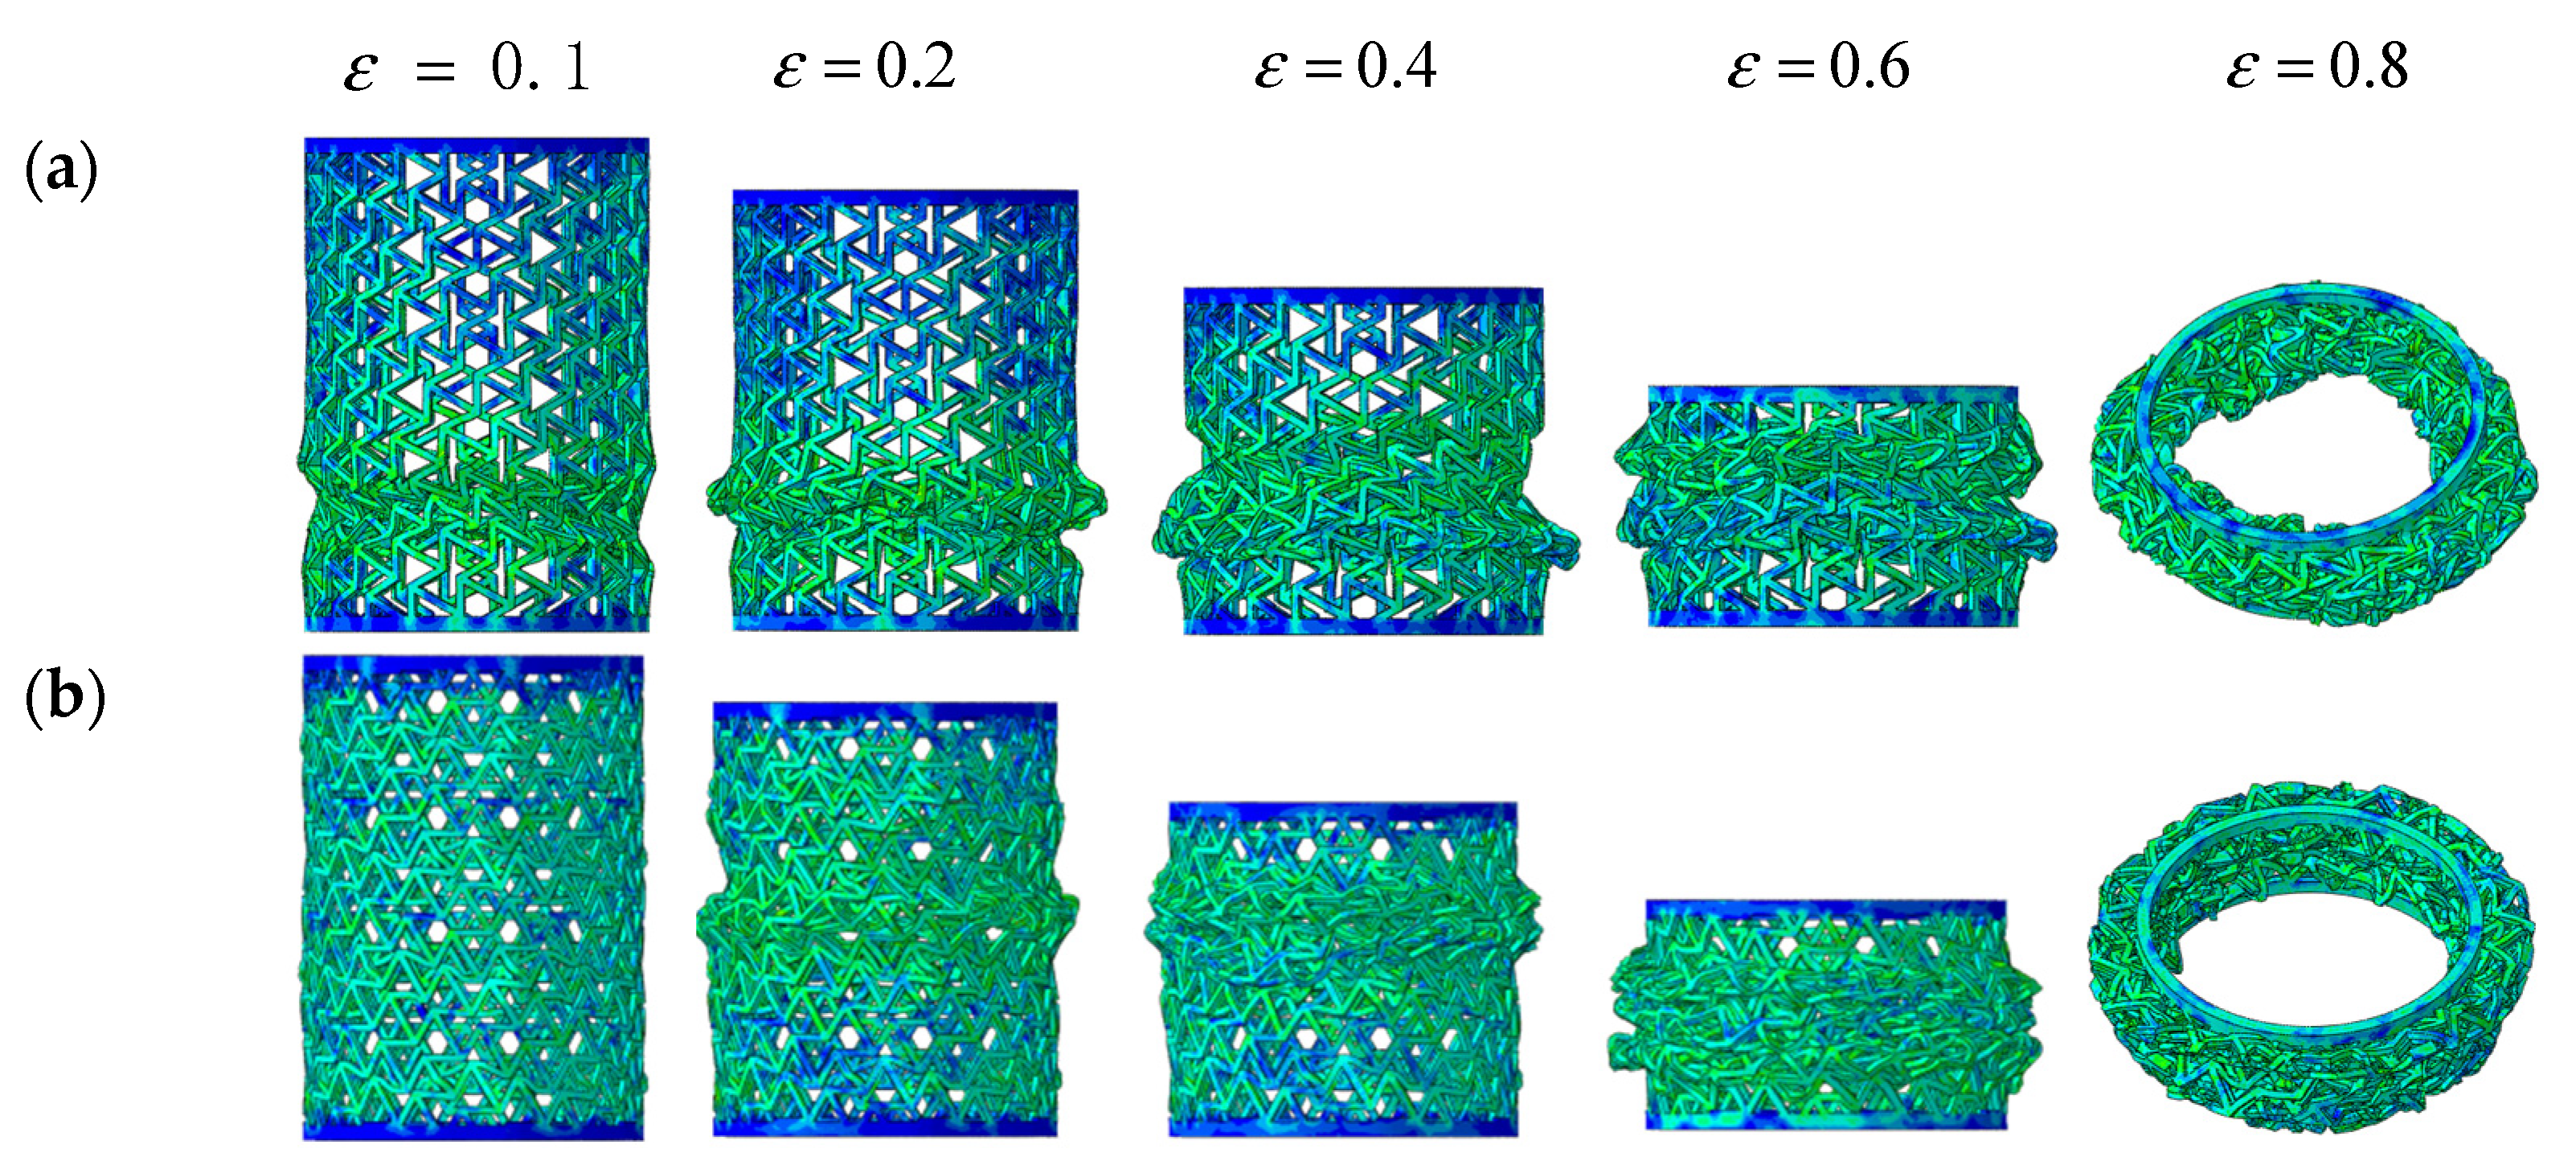
4.2. Quasi-Static Compression
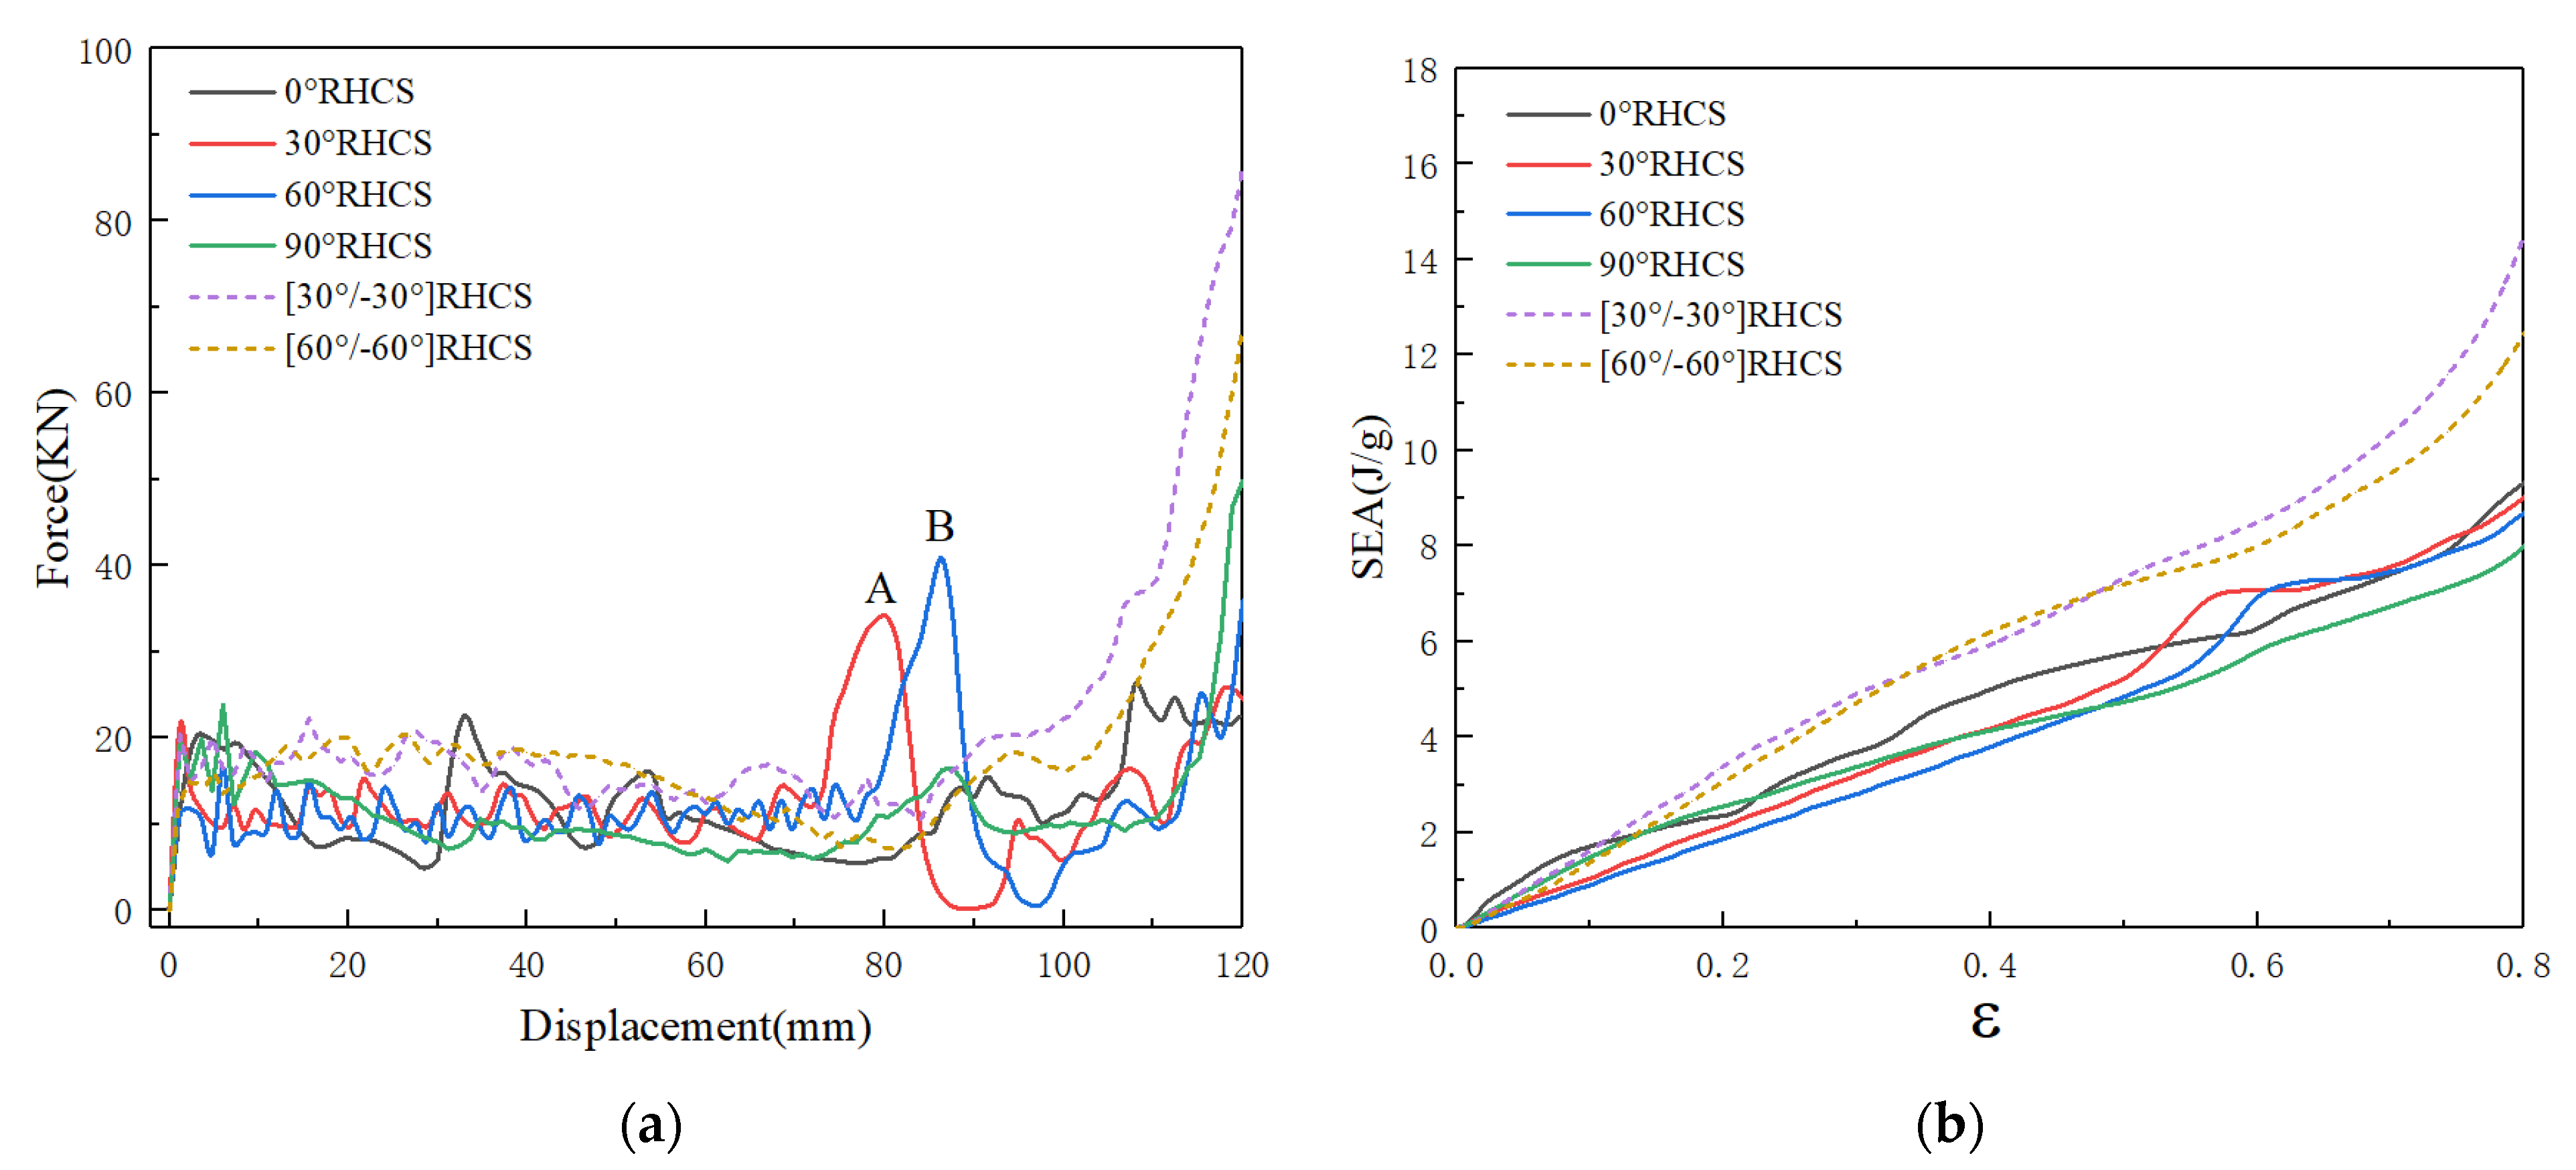
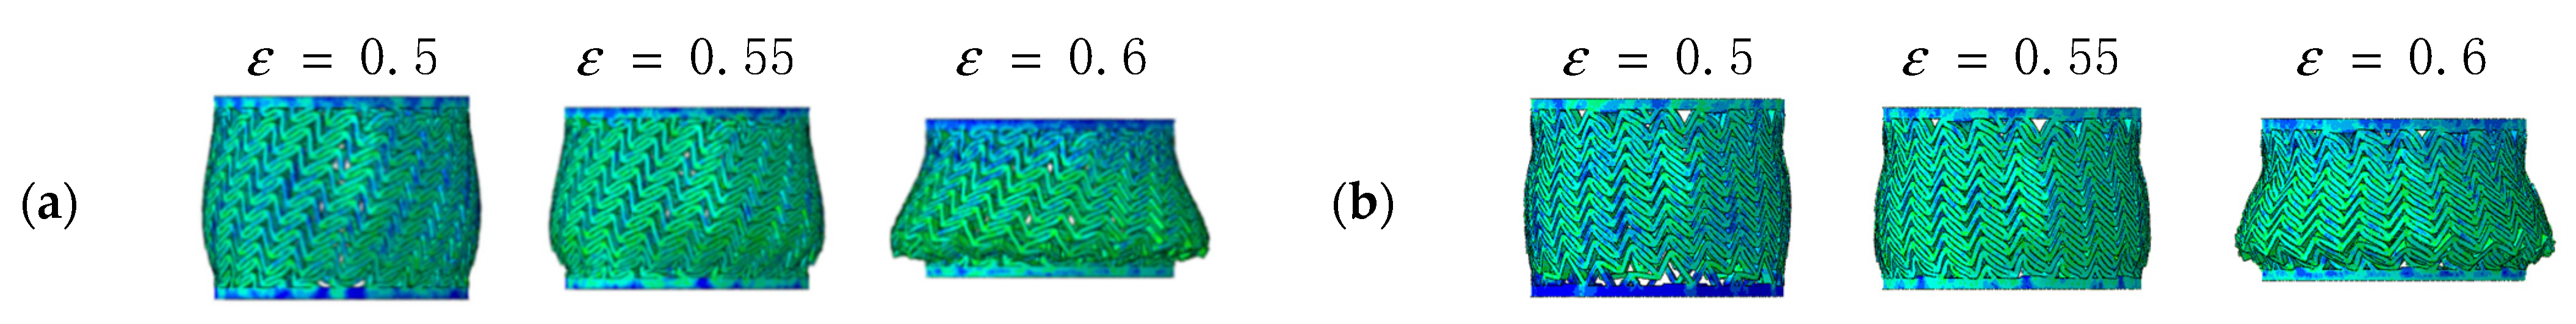
4.3. Low Velocity Impact
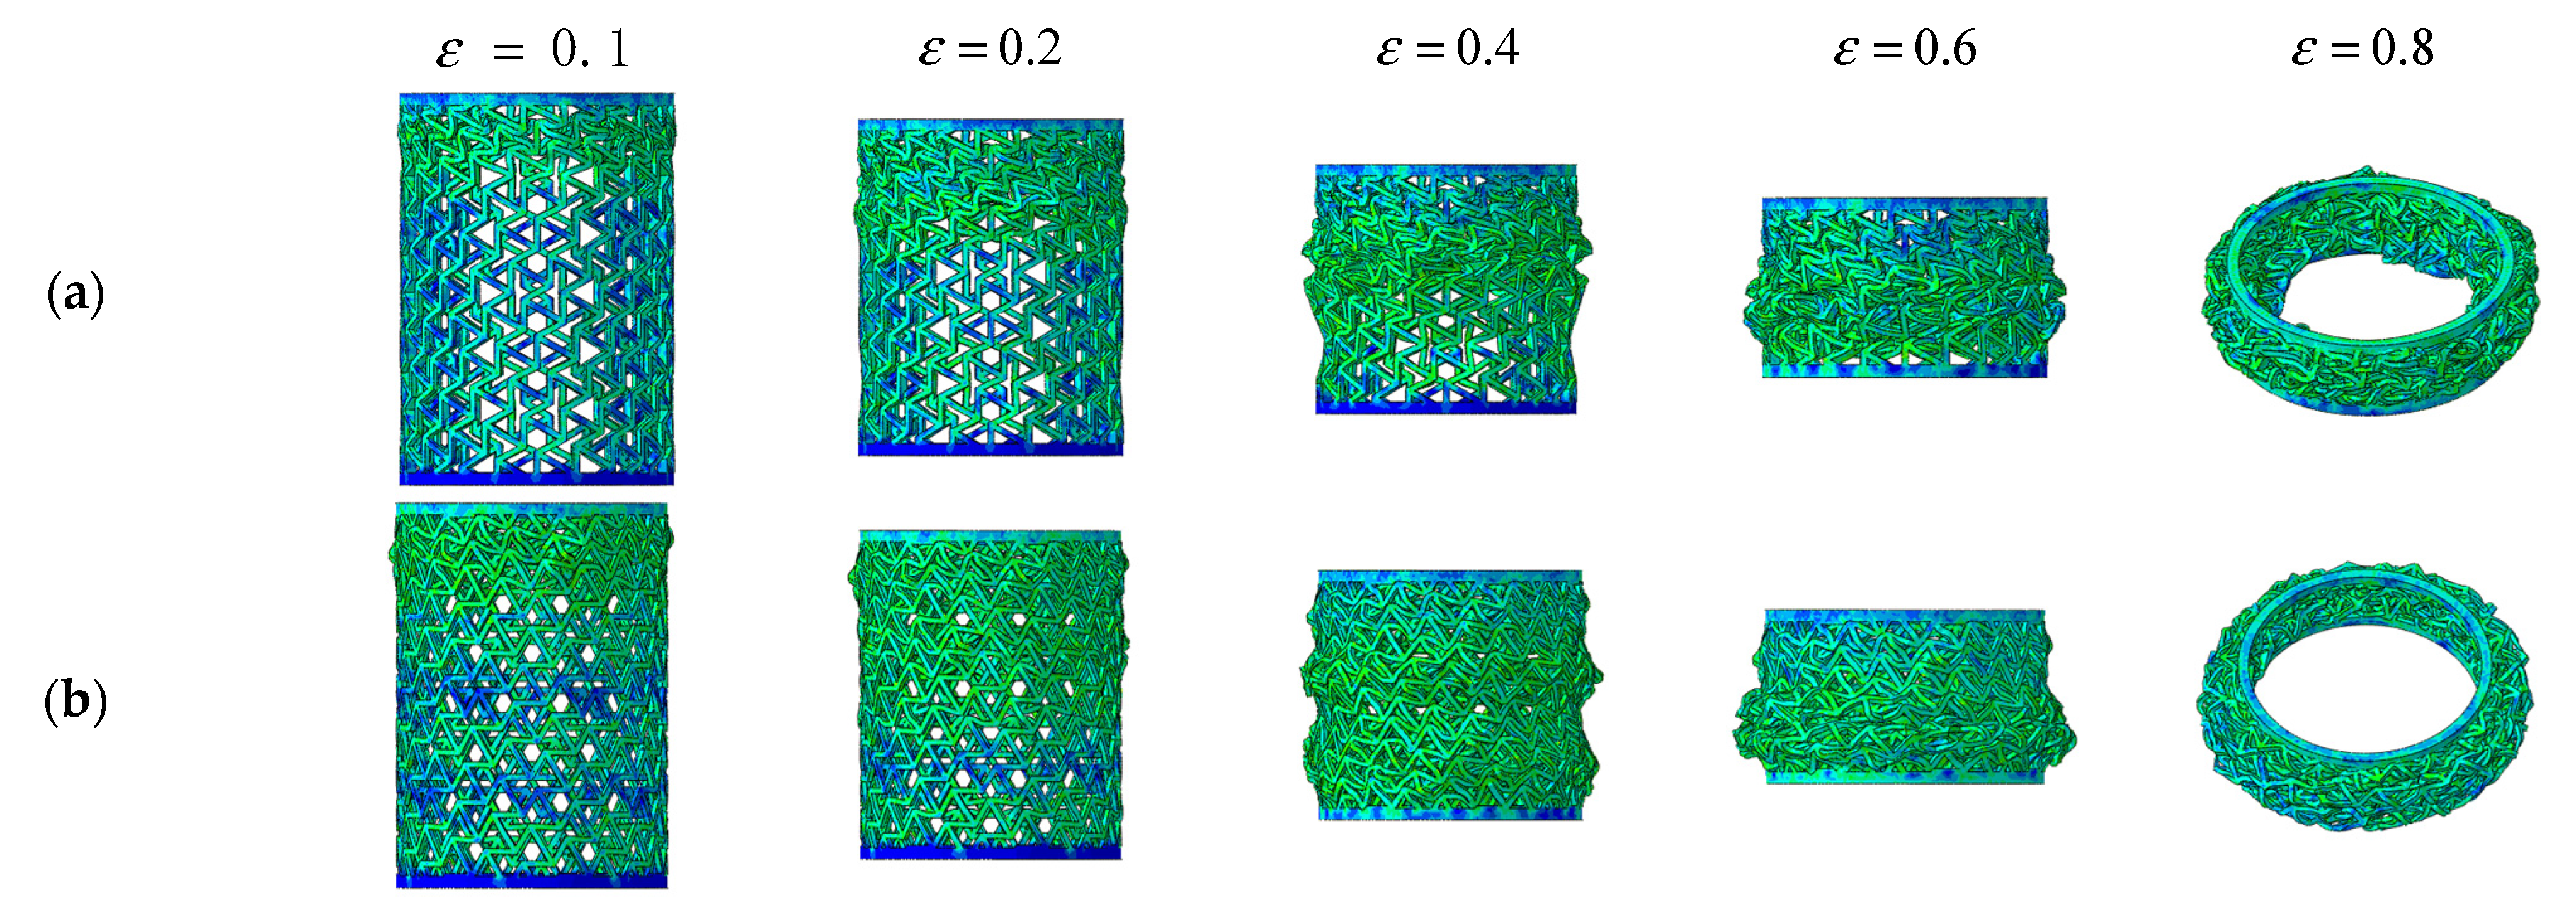
4.4. High Velocity Impact
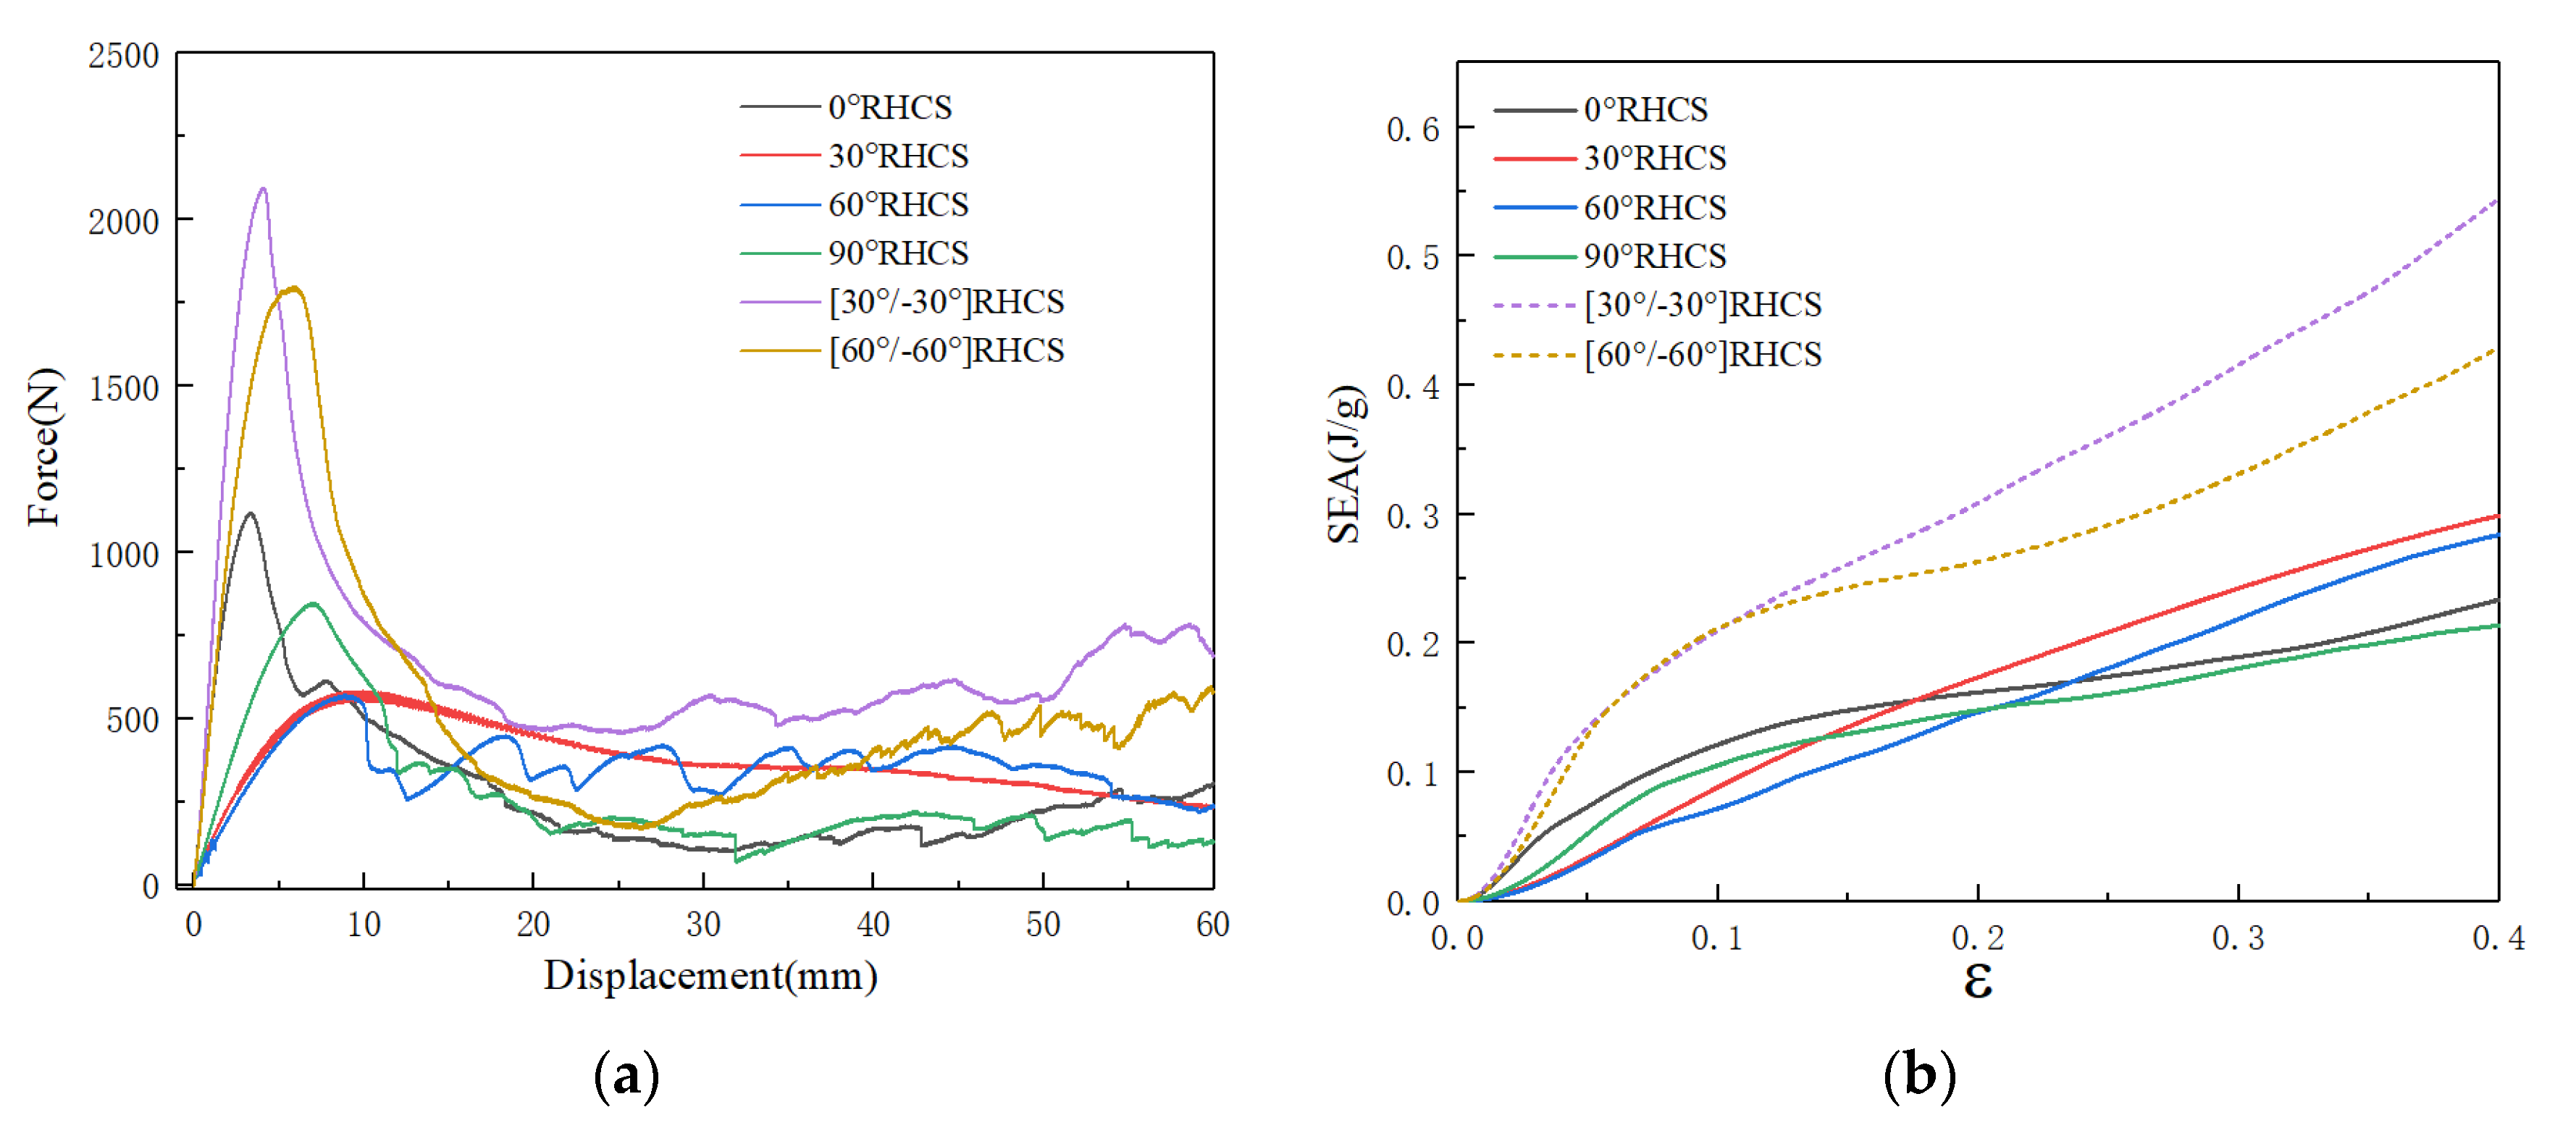
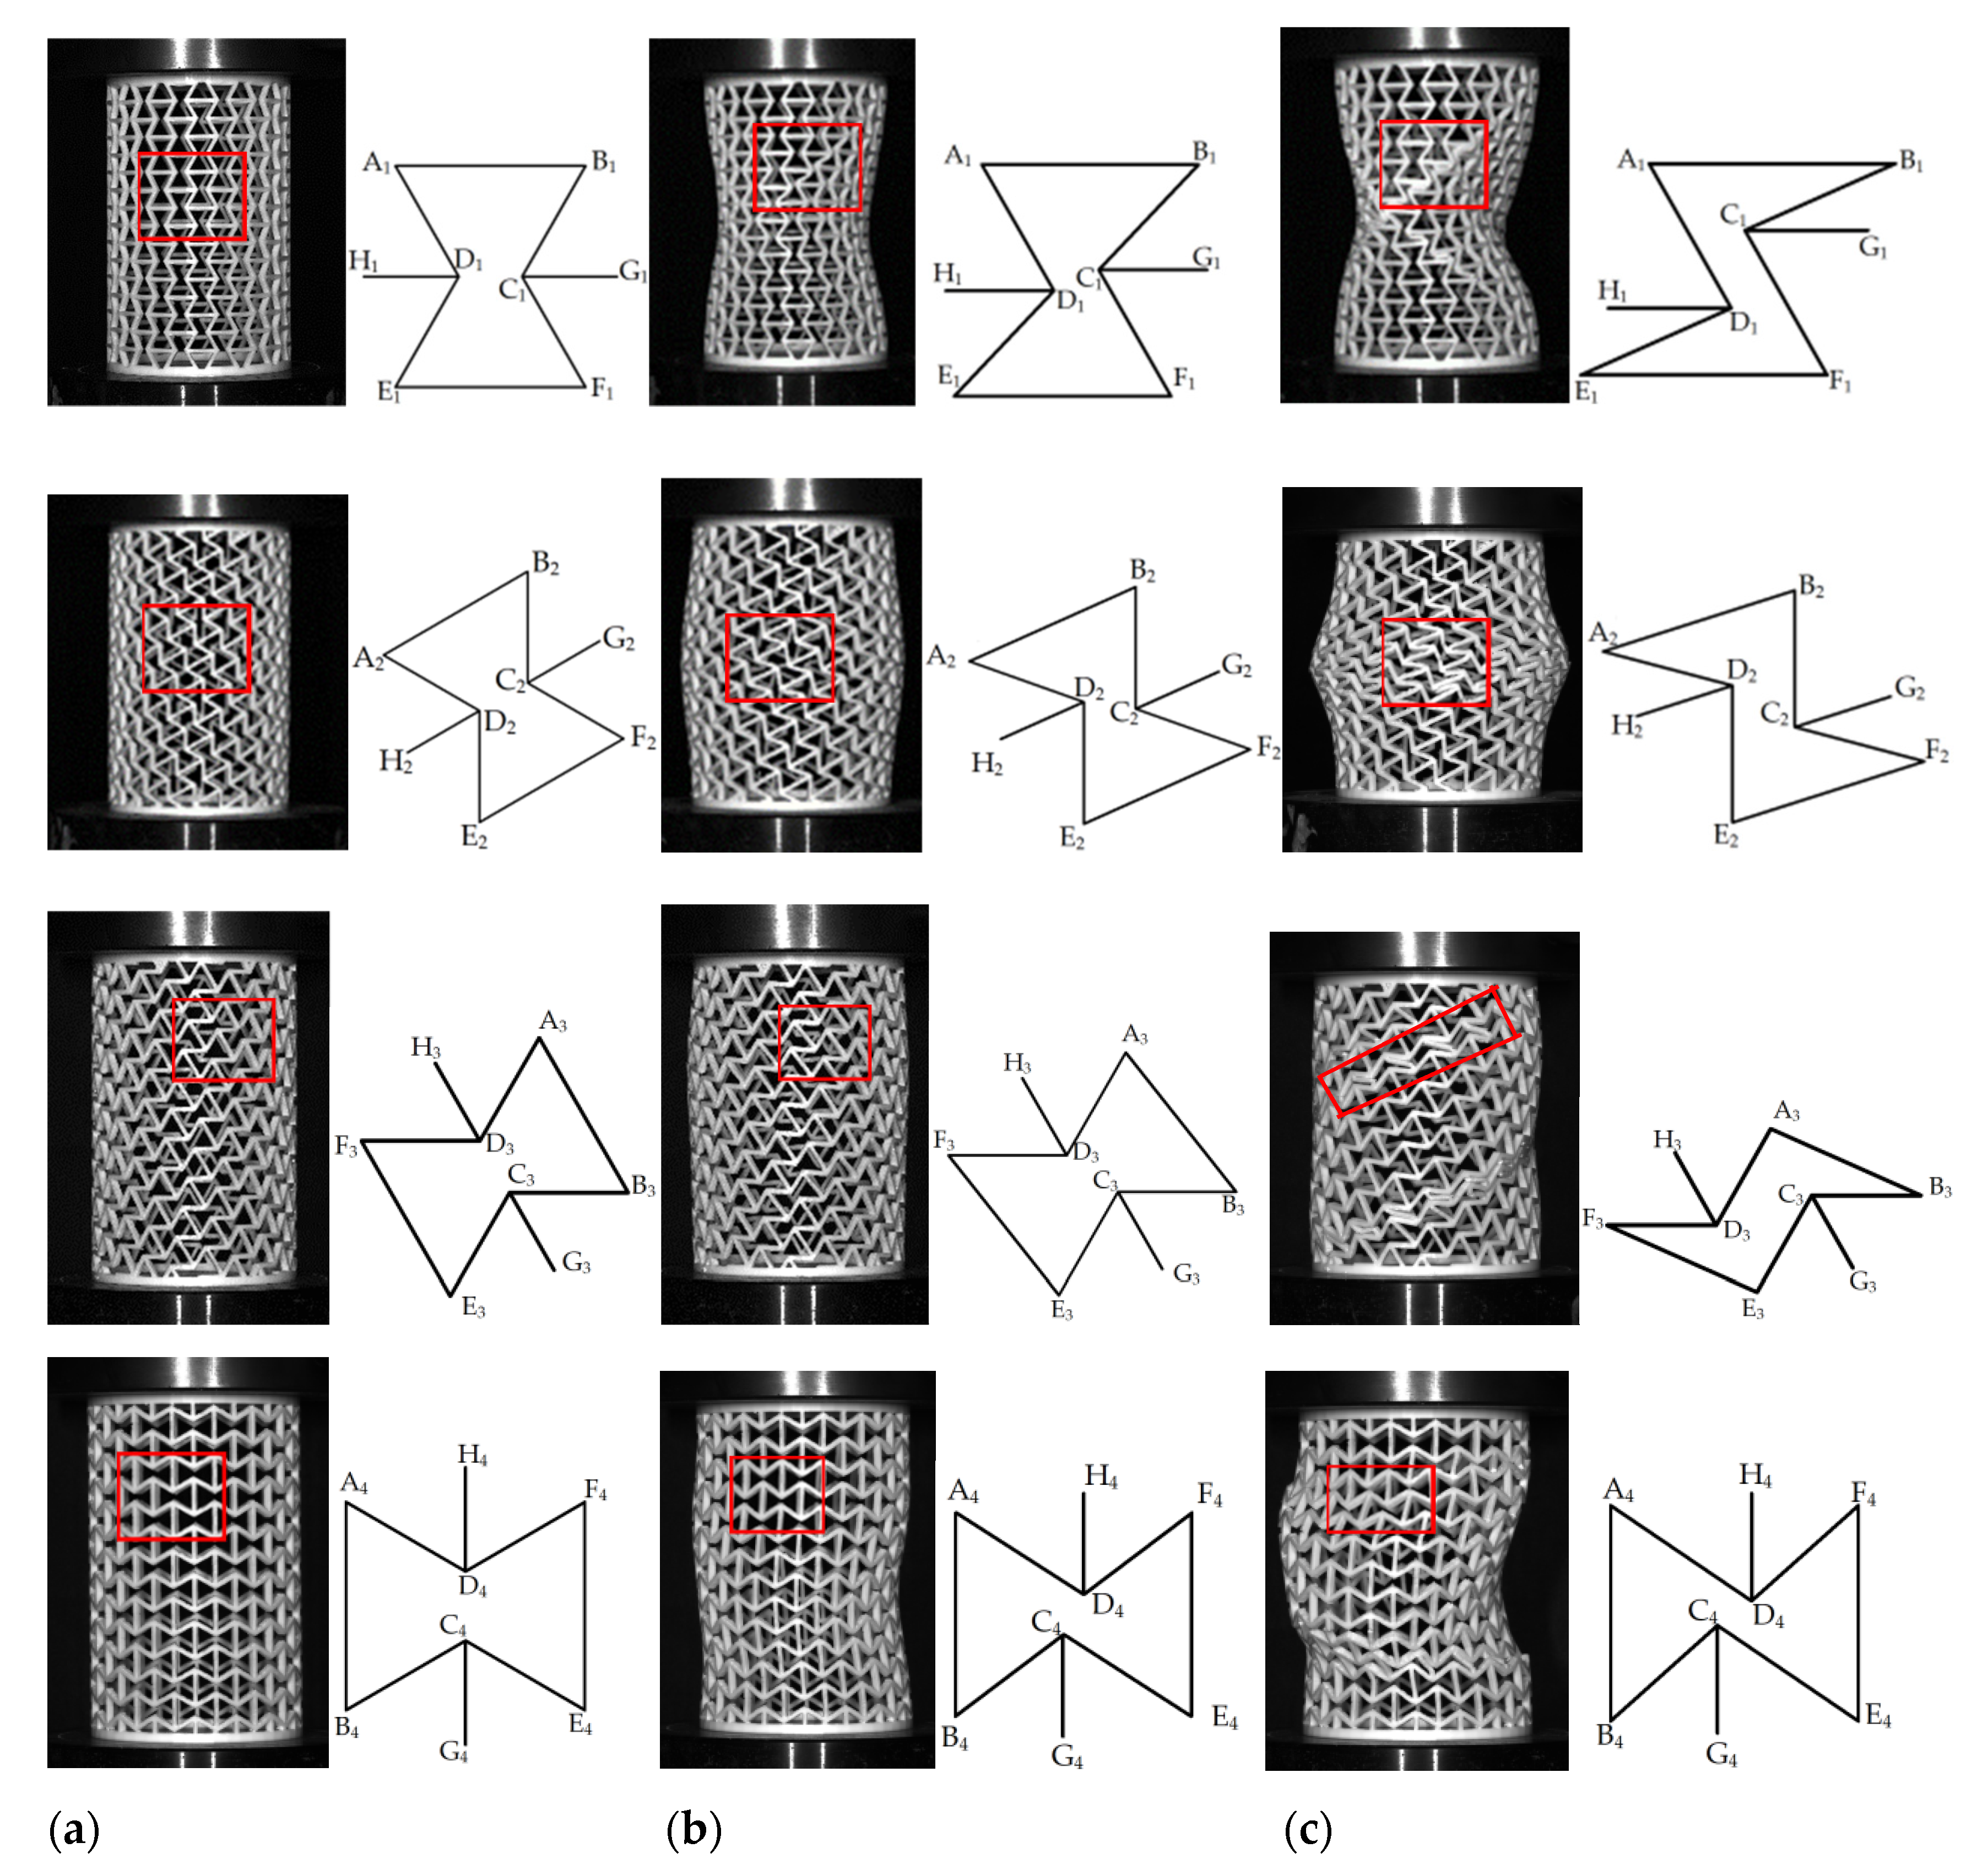
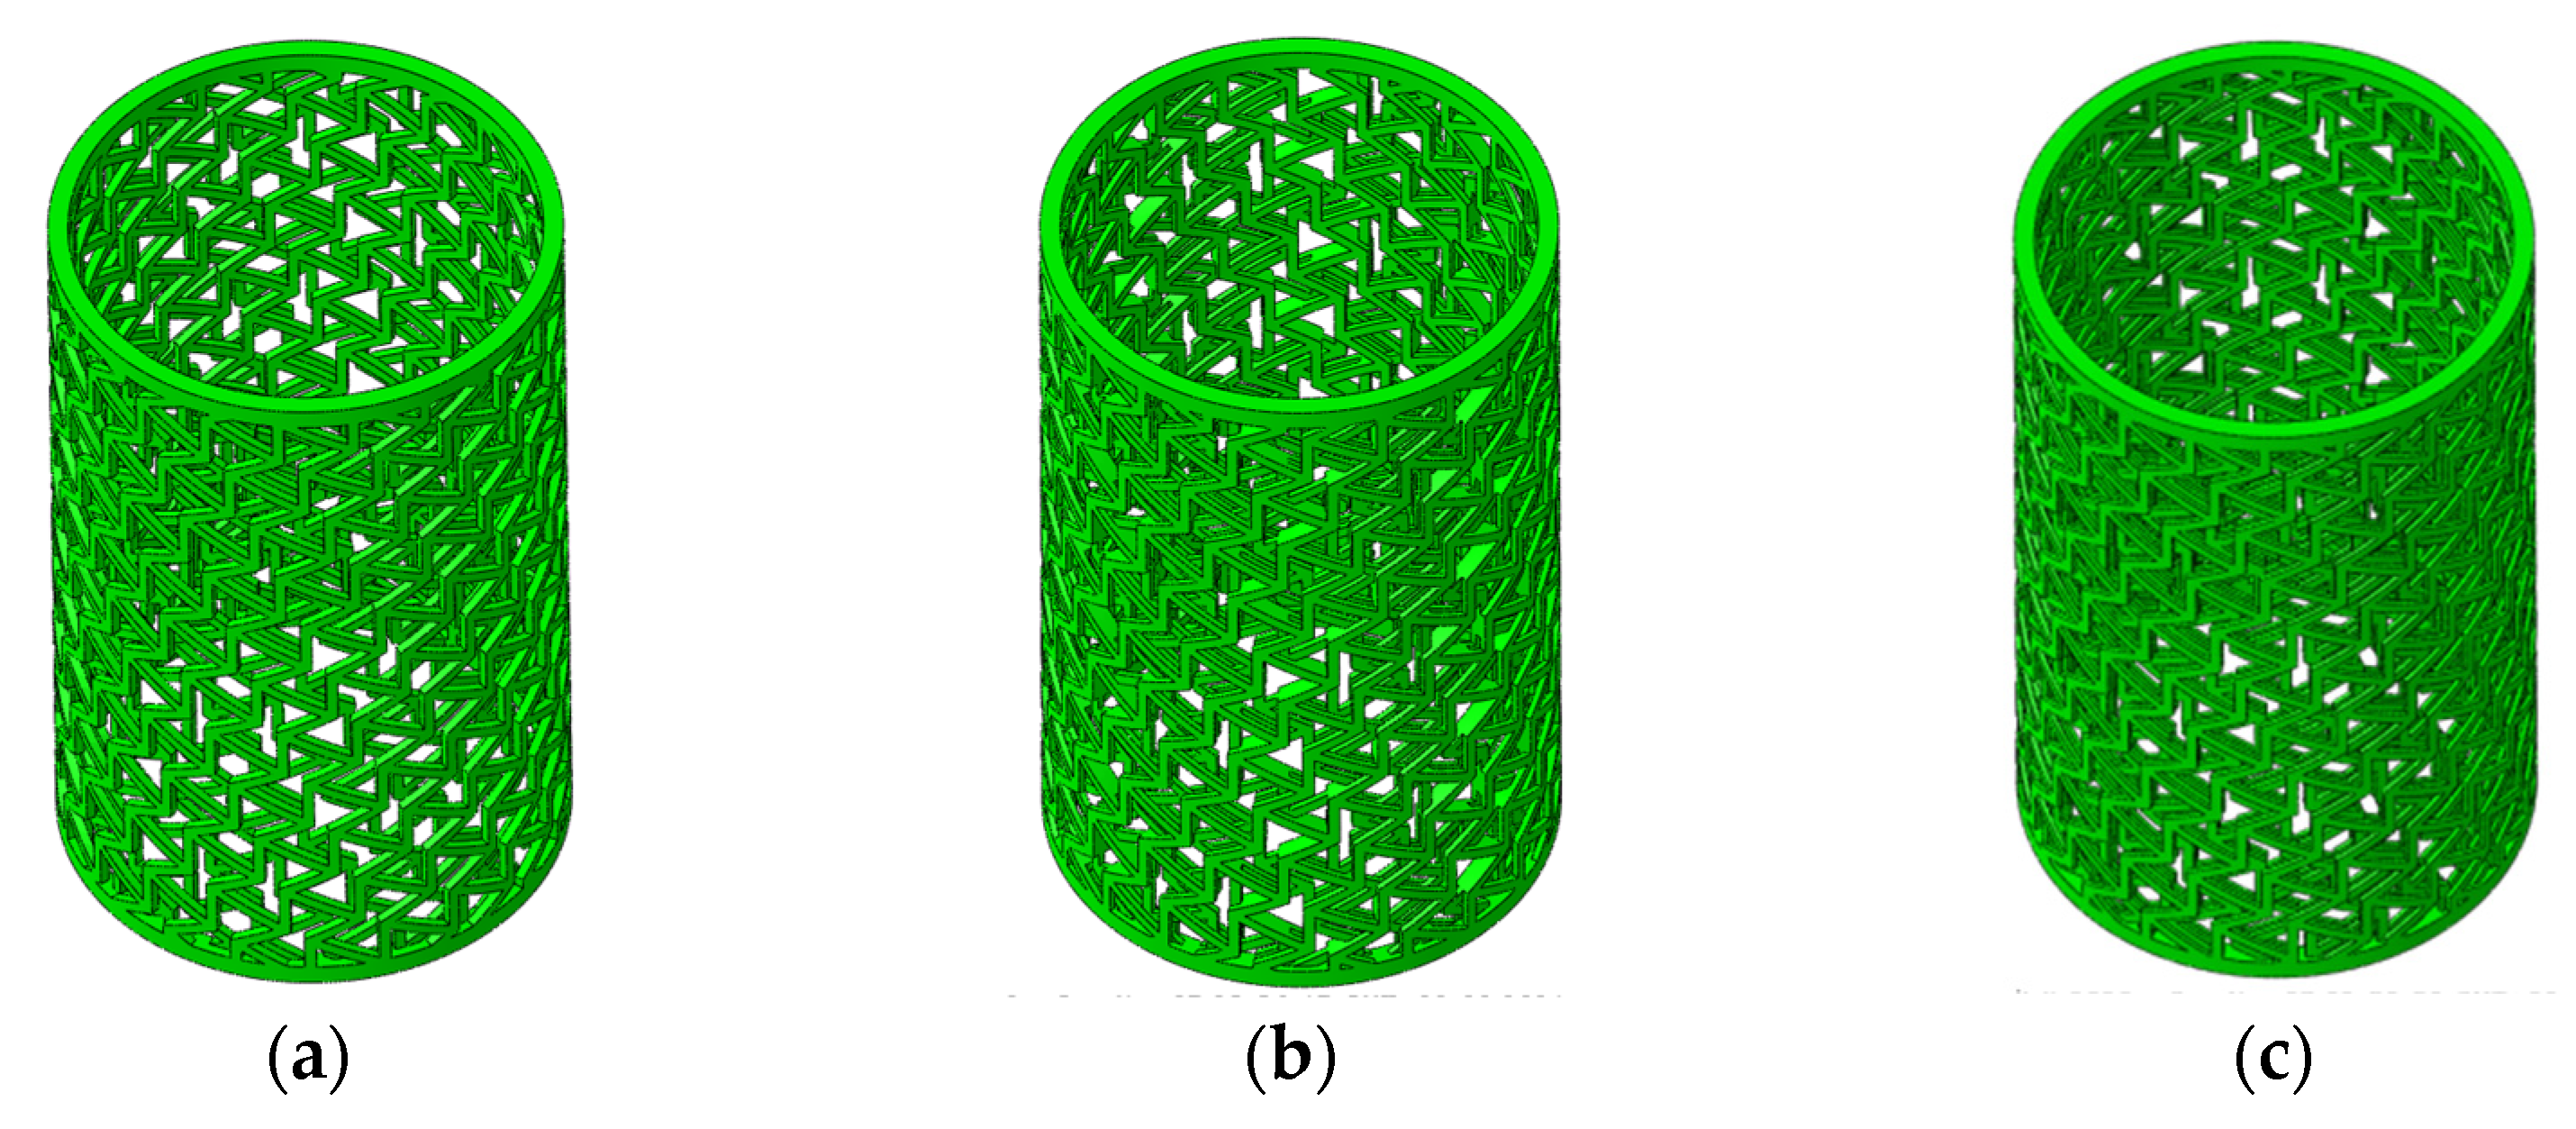
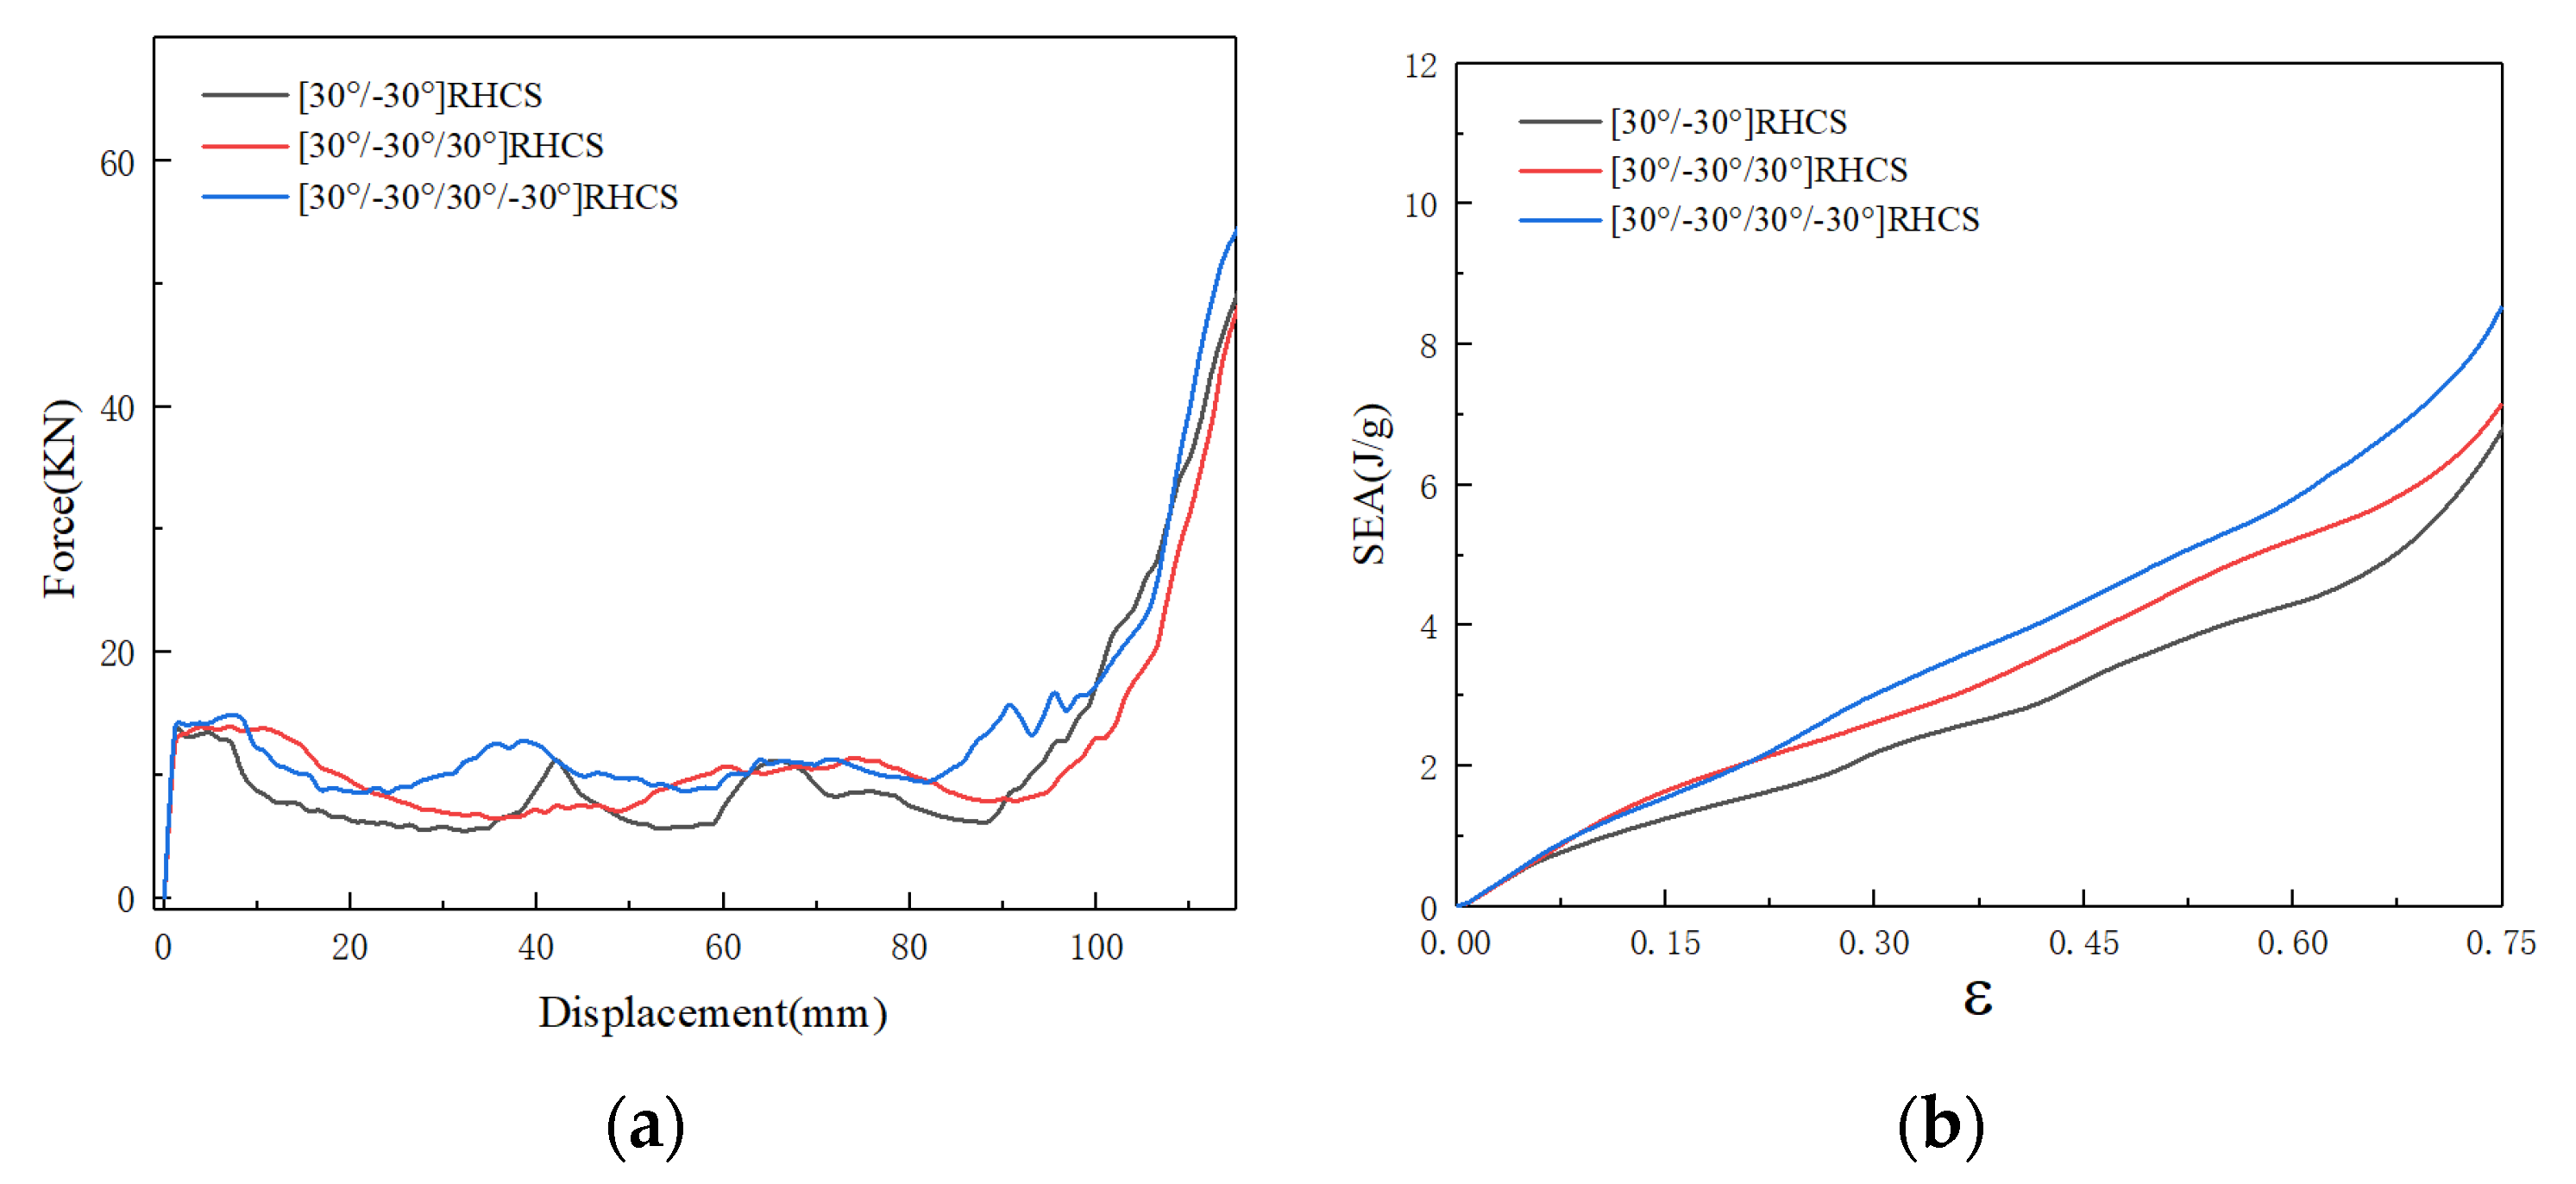
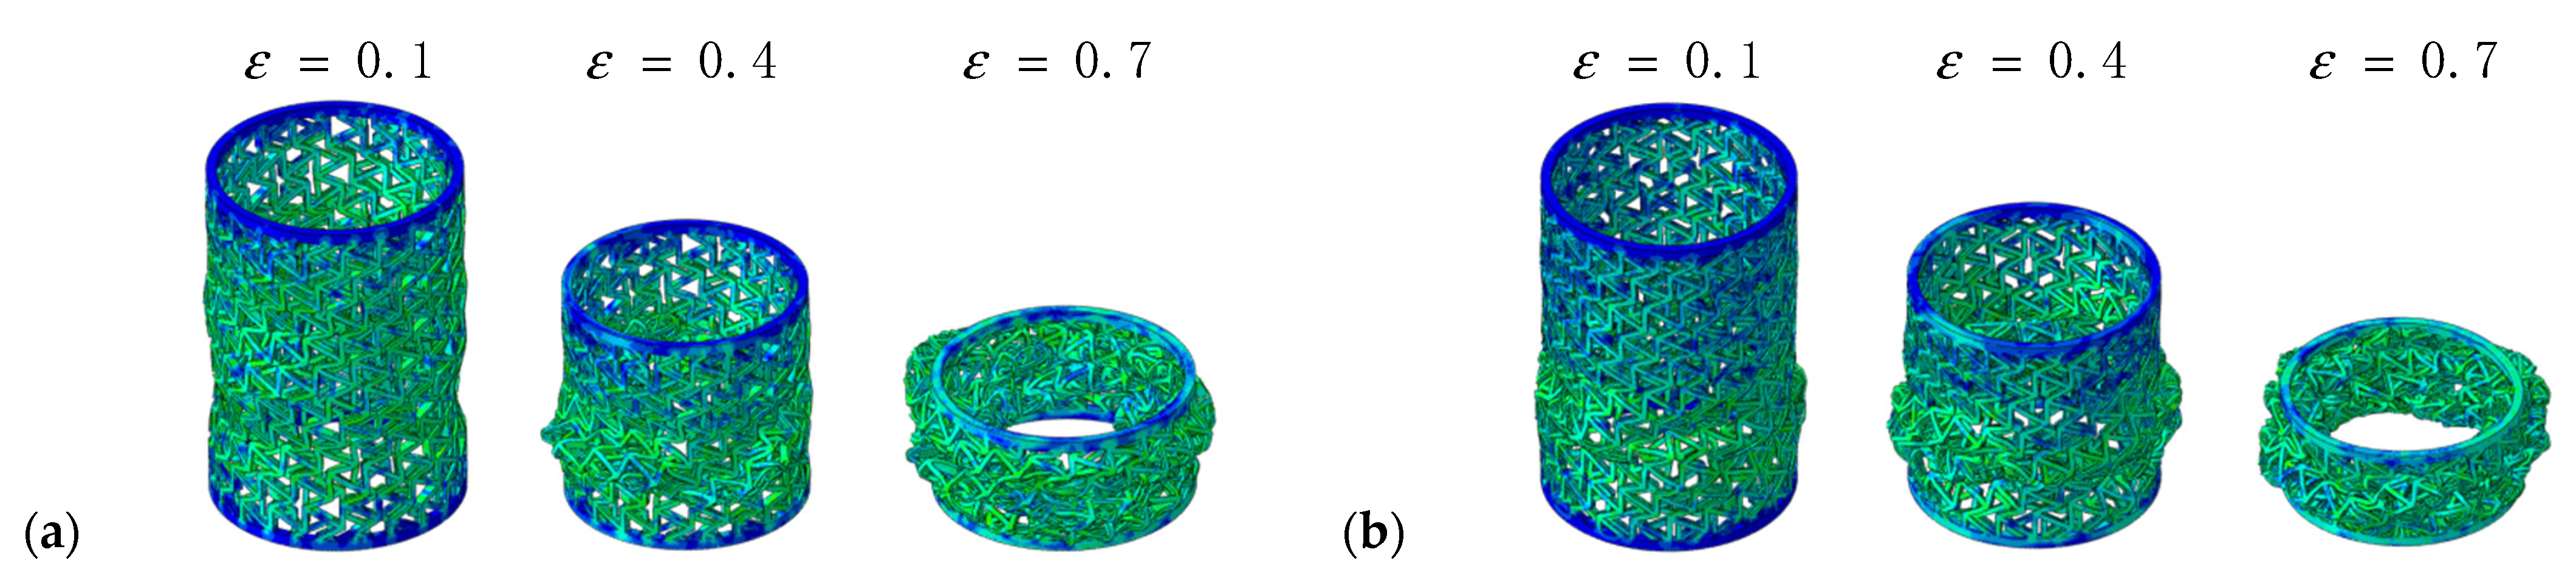
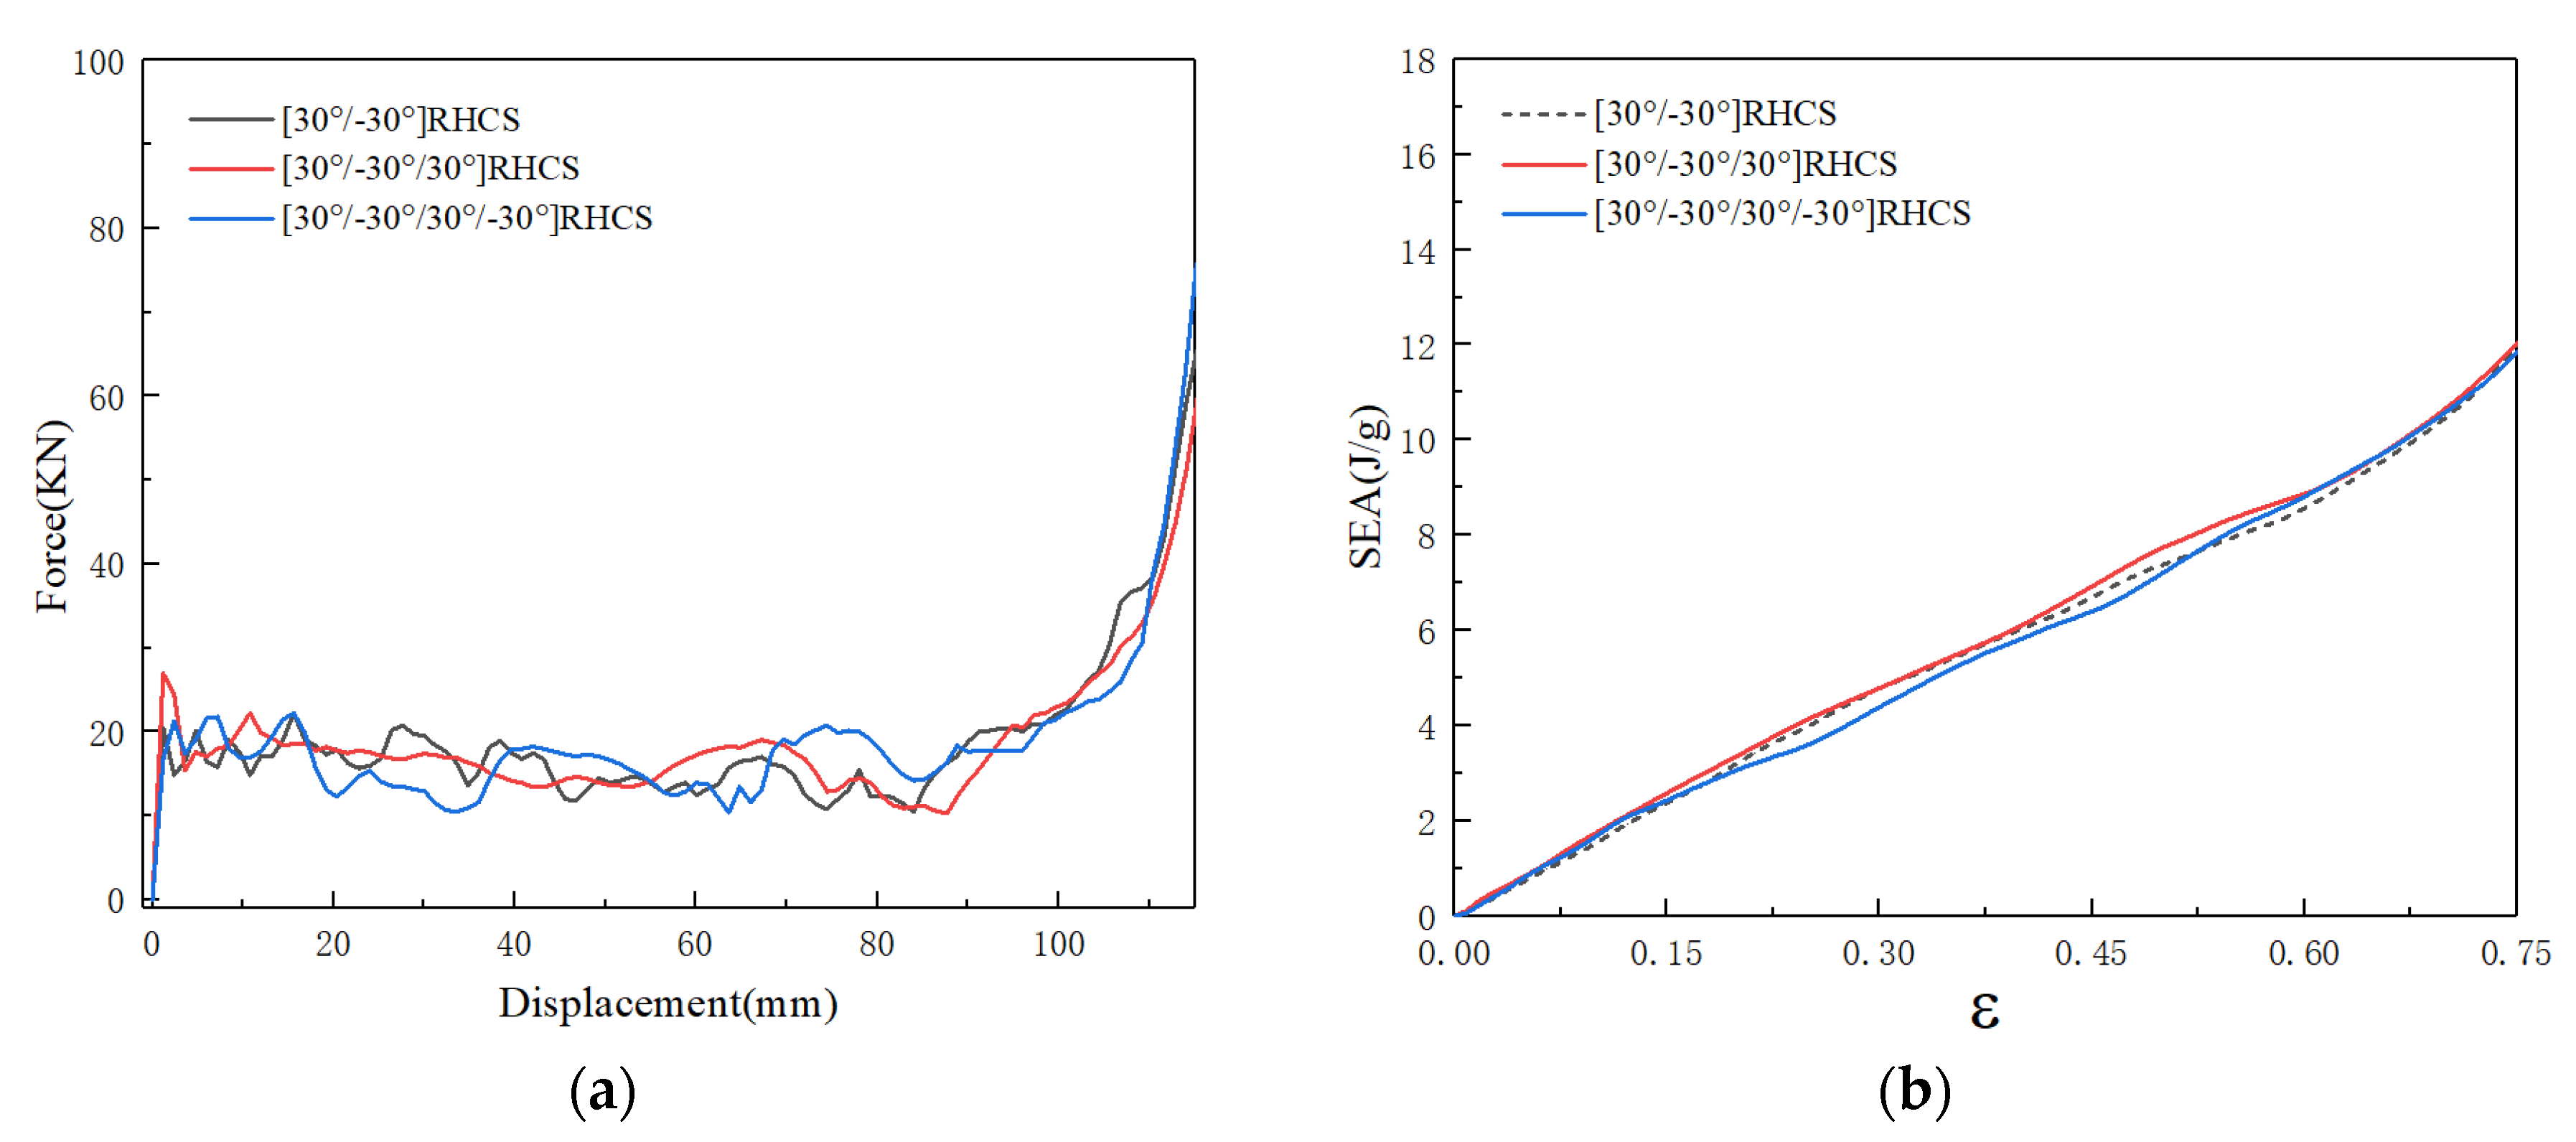
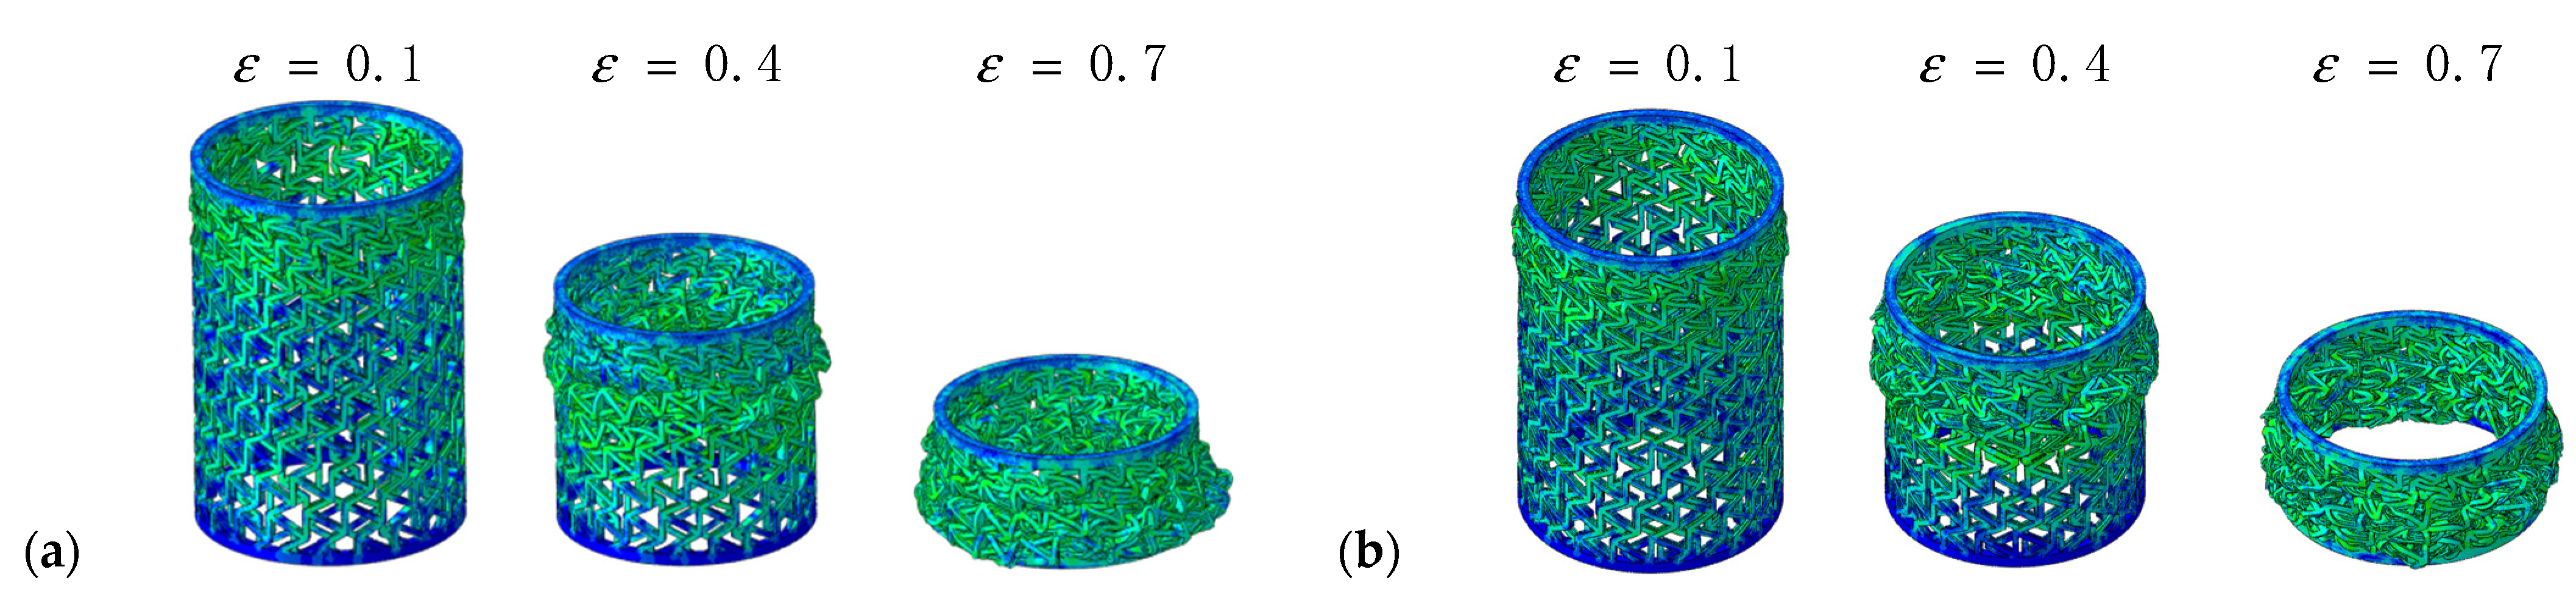
4.5. Multi-Layer Composite RHCSs
5. Conclusions
Author Contributions
Funding
Institutional Review Board Statement
Informed Consent Statement
Data Availability Statement
Conflicts of Interest
Appendix A


References
- Harkati, E.; Daoudi, N.; Bezazi, A.; Haddad, A.; Scarpa, F. In-Plane elasticity of a multi re-entrant auxetic honeycomb. Compos. Struct. 2017, 180, 130–139. [Google Scholar] [CrossRef] [Green Version]
- Liu, J.; Qin, H.; Liu, Y. Dynamic behaviors of phase transforming cellular structures. Compos. Struct. 2018, 184, 536–544. [Google Scholar] [CrossRef]
- Grima, J.N.; Evans, K.E. Auxetic behavior from rotating triangles. Int. J. Mech. Sci. 2006, 41, 3193–3196. [Google Scholar] [CrossRef]
- Lakes, R. Materials with structural hierarchy. Nature 1993, 361, 511–515. [Google Scholar] [CrossRef]
- Ju, J.; Summers, J.D. Compliant hexagonal periodic lattice structures having both high shear strength and high shear strain. Mater. Des. 2011, 32, 512–524. [Google Scholar] [CrossRef]
- Bianchi, M.; Scarpa, F.L.; Smith, C.W. Stiffness and energy dissipation in polyurethane auxetic foams. J. Mater. Sci. 2008, 43, 5851–5860. [Google Scholar] [CrossRef]
- Zhang, X.; Yang, D. Mechanical Properties of Auxetic Cellular Material Consisting of Re-Entrant Hexagonal Honeycombs. Materials 2016, 9, 900. [Google Scholar] [CrossRef] [Green Version]
- Wang, S.; Wang, H.; Ding, Y.; Yu, F. Crushing behavior and deformation mechanism of randomly honeycomb cylindrical shell structure. Thin-Walled Struct. 2020, 151, 106739. [Google Scholar] [CrossRef]
- Gao, Q.; Zhao, X.; Wang, C.; Wang, L.; Ma, Z. Multi-Objective crashworthiness optimization for an auxetic cylindrical structure under axial impact loading. Mater. Des. 2018, 143, 120–130. [Google Scholar] [CrossRef]
- Gao, Q.; Liao, W.; Wang, L. An analytical model of cylindrical double-arrowed honeycomb with negative Poisson’s ratio. Int. J. Mech. Sci. 2020, 173, 105400. [Google Scholar] [CrossRef]
- Gao, Q.; Zhao, X.; Wang, C.; Wang, L.; Ma, Z. Crashworthiness analysis of a cylindrical auxetic structure under axial impact loading. Sci. China Technol. Sci. 2020, 63, 140–154. [Google Scholar] [CrossRef]
- Ma, C.; Lei, H.; Liang, J.; Wu, W.; Wang, T.; Fang, D. Macroscopic mechanical response of chiral type cylindrical metastructures under axial compression loading. Mater. Des. 2018, 158, 198–212. [Google Scholar] [CrossRef]
- Ma, C.; Lei, H.; Liang, J.; Bai, Y.; Liang, J.; Fang, D. Experimental and simulation investigation of the reversible bi-directional twisting response of tetra-chiral cylindrical shells. Compos. Struct. 2018, 203, 142–152. [Google Scholar] [CrossRef]
- Yu, H.; Wu, W.; Zhang, J.; Chen, J.; Liao, H.; Fang, D. Drastic tailorable thermal expand chi-Ral planar and cylindrical shell structures explored with finite element simulation. Compos. Struct. 2019, 210, 327–338. [Google Scholar] [CrossRef]
- Wang, Y.; Ren, X.; Chen, Z.; Jiang, Y.; Cao, X.; Fang, S.; Zhao, T.; Li, Y.; Fang, D. Numerical and experimental studies on compressive behavior of Gyroid lattice cylindrical shells. Mater. Des. 2019, 186, 108340. [Google Scholar] [CrossRef]
- Ling, B.; Wei, K.; Qu, Z.; Fang, D. Design and analysis for large magnitudes of programmable Poisson’s ratio in a series of lightweight cylindrical metastructures. Int. J. Mech. Sci. 2021, 195, 106220. [Google Scholar] [CrossRef]
- Farrell, D.T.; McGinn, C.; Bennett, G.J. Extension twist deformation response of an auxetic cylindrical structure inspired by deformed cell ligaments. Compos. Struct. 2020, 238, 111901. [Google Scholar] [CrossRef]
- Xiang, J.; Du, J.X. Energy absorption characteristics of bio-inspired honeycomb structure under axial impact loading. Mater. Sci. Eng. A 2017, 696, 283–289. [Google Scholar] [CrossRef]
- Zhang, J.; Lu, G.; You, Z. Large deformation and energy absorption of additively manufactured auxetic materials and structures: A review. Compos. Part B 2020, 201, 108340. [Google Scholar] [CrossRef]
- Qi, D.; Lu, Q.; He, C.; Wu, W.; Xiao, D. Impact energy absorption of functionally graded chiral honeycomb structures. Extrem. Mech. Lett. 2020, 32, 100568. [Google Scholar] [CrossRef]
- Yan, L.; Zhu, K.; Chen, N.; Zheng, X.; Quaresimin, M. Energy-Absorption characteristics of tube-reinforced absorbent honeycomb sandwich structure. Compos. Struct. 2021, 255, 112946. [Google Scholar] [CrossRef]
- Wang, H.; Lu, Z.; Yang, Z.; Li, X. In-Plane dynamic crushing behaviors of a novel auxetic honeycomb with two plateau stress regions. Int. J. Mech. Sci. 2019, 151, 746–759. [Google Scholar] [CrossRef]
- Hosseini, S.M.; Shariati, M. Experimental analysis of energy absorption capability of thin-Walled composite cylindrical shells by quasi-static axial crushing test. Thin-Walled Struct. 2018, 125, 259–268. [Google Scholar] [CrossRef]
- Warrior, N.A.; Turner, T.A.; Cooper, E.; Ribeaux, M. Effects of boundary conditions on the energy absorption of thin-walled polymer composite tubes under axial crushing. Thin-Walled Struct. 2008, 46, 905–913. [Google Scholar] [CrossRef]
- Abdewi, E.F.; Sulaiman, S.; Hamouda, A.M.S.; Mahdi, E. Quasi-Static axial and lateral crushing of radial corrugated composite tubes. Thin-Walled Struct. 2008, 46, 320–332. [Google Scholar] [CrossRef]
- McGregor, C.; Vaziri, R.; Xiao, X. Finite element modelling of the progressive crushing of braided composite tubes under axial impact. Int. J. Impact Eng. 2010, 37, 662–672. [Google Scholar] [CrossRef]
- Lee, W.; Jeong, Y.; Yoo, J.; Huh, H.; Park, S.; Park, S.H.; Yoon, J. Effect of auxetic structures on crash behavior of cylindrical tube. Compos. Struct. 2019, 208, 836–846. [Google Scholar] [CrossRef]
- Guo, Y.; Zhang, J.; Chen, L.; Du, B.; Liu, H.; Chen, L.; Li, W.; Liu, Y. Deformation behaviors and energy absorption of auxetic lattice cylindrical structures under axial crushing load. Aerosp. Sci. Technol. 2020, 98, 105662. [Google Scholar] [CrossRef]
- Chen, L.; Zhang, J.; Du, B.; Zhou, H.; Liu, H.; Guo, Y.; Li, W.; Fang, D. Dynamic crushing behavior and energy absorption of graded lattice cylindrical structure under axial impact load. Thin-Walled Struct. 2018, 127, 333–343. [Google Scholar] [CrossRef]
- Sebaey, T.A.; Rajak, D.K.; Mehboob, H. Internally stiffened foam-filled carbon fiber reinforced composite tubes under impact loading for energy absorption applications. Compos. Struct. 2021, 112910. [Google Scholar] [CrossRef]
- Wang, L.; Liu, W.; Fang, Y.; Wan, L.; Huo, R. Axial crush behavior and energy absorption capability of foam-filled GFRP tubes manufactured through vacuum assisted resin infusion process. Thin-Walled Struct. 2016, 98, 263–273. [Google Scholar] [CrossRef]
- Supian, A.B.M.; Sapuan, S.M.; Zuhri, M.Y.M.; Zainudin, E.S.; Ya, H.H.; Hisham, H.N. Effect of winding orientation on energy absorption and failure modes of filament wound kenaf/glass fibre reinforced epoxy hybrid composite tubes under intermediate-velocity impact (IVI) load. J. Mater. Res. Technol. 2021, 10, 1–14. [Google Scholar] [CrossRef]
- Bisagni, C. Composite cylindrical shells under static and dynamic axial loading: An experimental campaign. Prog. Aero. Sci. 2015, 78, 107–115. [Google Scholar] [CrossRef]
- Ochelski, S.; Gotowicki, P. Experimental assessment of energy absorption capability of carbon-Epoxy and glass-Epoxy composite. Compos. Struct. 2009, 87, 215–224. [Google Scholar] [CrossRef]
- Hull, D. A unified approach to progressive crushing of fibre reinforced composite tubes. Compos. Sci. Technol. 1991, 40, 377–421. [Google Scholar] [CrossRef]
- Su, P.; Han, B.; Yang, M.; Wei, Z.; Zhao, Z.; Zhang, Q.-C.; Zhang, Q.; Qin, K.; Lu, T. Axial compressive collapse of ultralight corrugated sandwich cylindrical shells. Mater. Des. 2018, 160, 325–337. [Google Scholar] [CrossRef]
- Zhao, J. Optimal design of laminated composite cylindrical shells for maximum fundamental frequency using sequential permutation search with mode identification. Compos. Struct. 2022, 279, 114736. [Google Scholar] [CrossRef]
- Zhou, L. A new structural similitude method for laminated composite cylinders. Thin-Walled Struct. 2021, 164, 107920. [Google Scholar] [CrossRef]
- Wang, H.; Lu, Z.; Yang, Z.; Li, X. A novel re-entrant auxetic honeycomb with enhanced in-plane impact resistance. Compos. Struct. 2019, 208, 758–770. [Google Scholar] [CrossRef]
- Zhang, W.; Yin, S.; Yu, T.X.; Xu, J. Crushing resistance and energy absorption of pomelo peel inspired hierarchical honeycomb. Int. J. Impact Eng. 2019, 125, 163–172. [Google Scholar] [CrossRef]


| Specimen | Radius (mm) | Radial Width (mm) | Axial Height (mm) | Relative Densities |
|---|---|---|---|---|
| 0° RHCS | 44.56 | 3.6 | 146.56 | 0.405 |
| 30° RHCS | 44.1 | 3.6 | 146.56 | 0.405 |
| 60° RHCS | 44.56 | 3.6 | 146.56 | 0.405 |
| 90° RHCS | 44.1 | 3.6 | 146.56 | 0.405 |
| [30°/−30°] RHCS | 44.1 | 3.6 | 146.56 | 0.405 |
| [60°/−60°] RHCS | 44.56 | 3.6 | 146.56 | 0.405 |
| [30°/−30°/30°] RHCS | 44.1 | 3.6 | 146.56 | 0.405 |
| [30°/−30°/30°/−30°] RHCS | 44.1 | 3.6 | 146.56 | 0.405 |
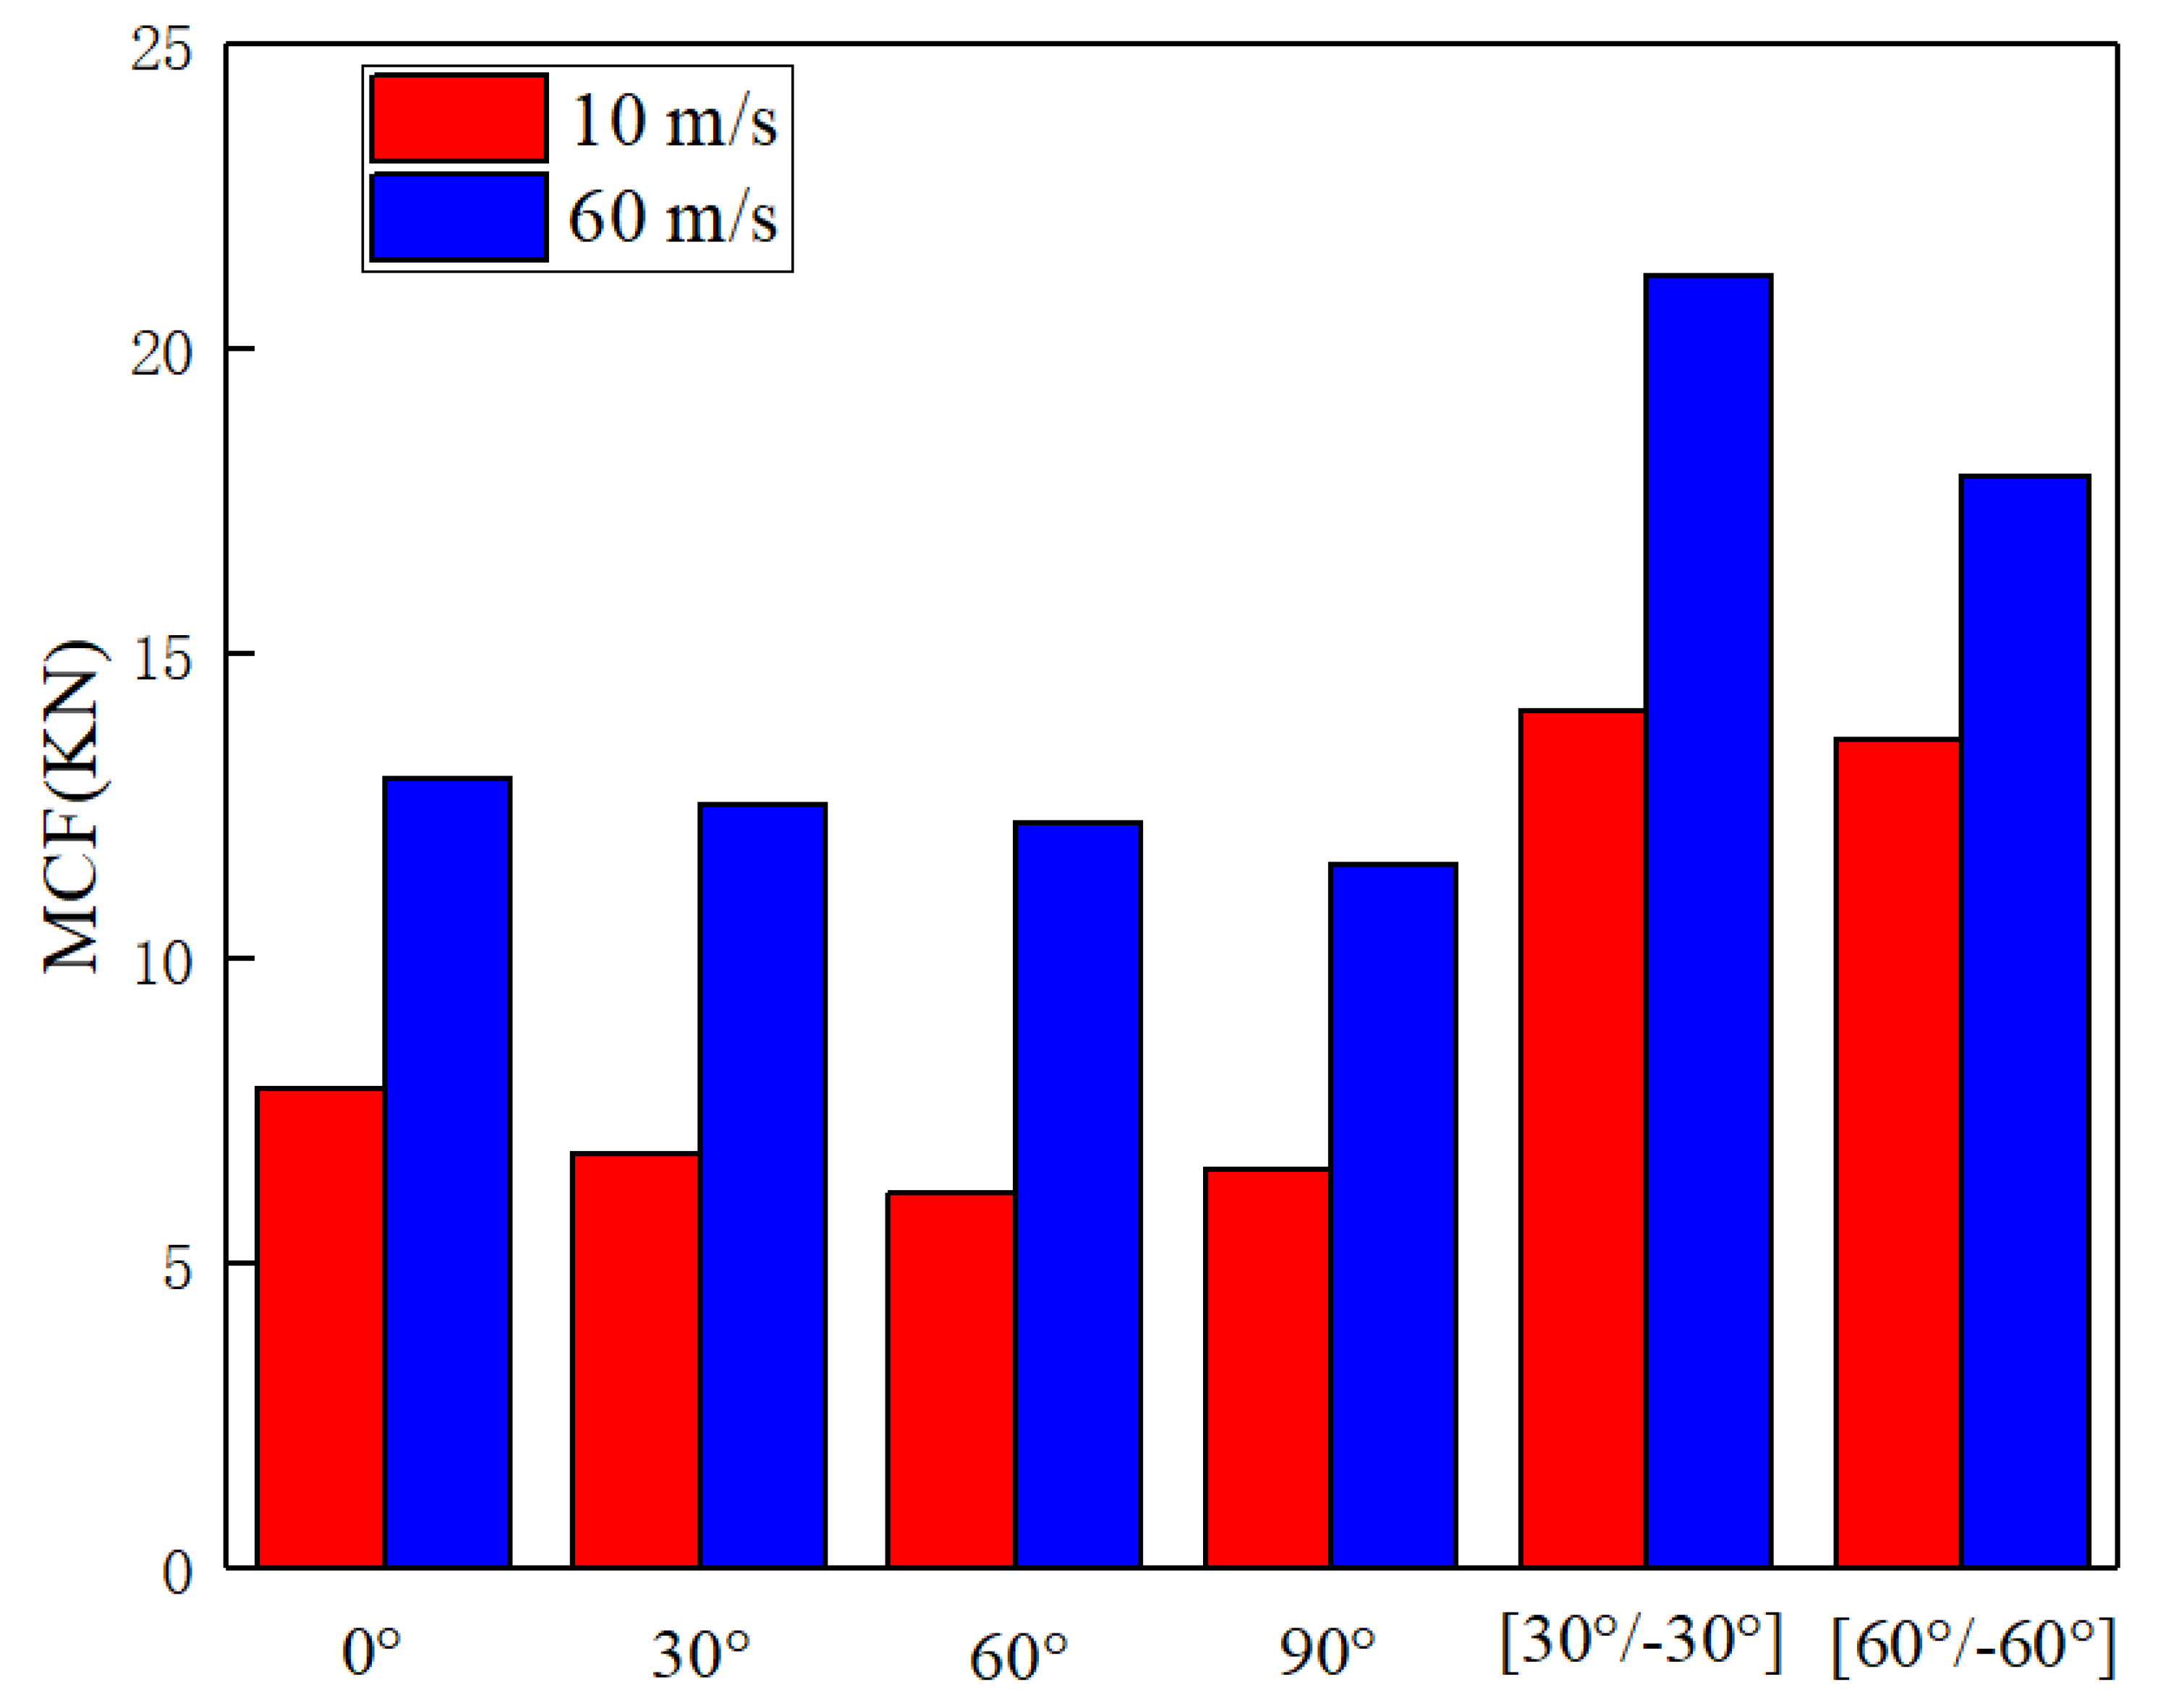
| Specimen | When V = 10 m/s, the Non-Dimension Equivalent Plateau Stress (MPa) | Improvement (Compared with 30° RHCS) | When V = 60 m/s, the Non-Dimension Equivalent Plateau Stress (MPa) | Improvement (Compared with 30° RHCS) |
|---|---|---|---|---|
| 0° RHCS | 0.0602 | 14.2% | 0.0989 | 2.17% |
| 30° RHCS | 0.0527 | 0 | 0.0968 | 0 |
| 60° RHCS | 0.0472 | −10.4% | 0.0934 | −3.51% |
| 90° RHCS | 0.0471 | −10.6% | 0.0891 | −7.95% |
| [30°/−30°] RHCS | 0.109 | 106.8% | 0.163 | 68.39% |
| [60°/−60°] RHCS | 0.104 | 97.3% | 0.137 | 41.53% |
Publisher’s Note: MDPI stays neutral with regard to jurisdictional claims in published maps and institutional affiliations. |
© 2021 by the authors. Licensee MDPI, Basel, Switzerland. This article is an open access article distributed under the terms and conditions of the Creative Commons Attribution (CC BY) license (https://creativecommons.org/licenses/by/4.0/).
Share and Cite
Ma, N.; Deng, Q.; Li, X. Deformation Behaviors and Energy Absorption of Composite Re-Entrant Honeycomb Cylindrical Shells under Axial Load. Materials 2021, 14, 7129. https://doi.org/10.3390/ma14237129
Ma N, Deng Q, Li X. Deformation Behaviors and Energy Absorption of Composite Re-Entrant Honeycomb Cylindrical Shells under Axial Load. Materials. 2021; 14(23):7129. https://doi.org/10.3390/ma14237129
Chicago/Turabian StyleMa, Nanfang, Qingtian Deng, and Xinbo Li. 2021. "Deformation Behaviors and Energy Absorption of Composite Re-Entrant Honeycomb Cylindrical Shells under Axial Load" Materials 14, no. 23: 7129. https://doi.org/10.3390/ma14237129