
Computation of High-Performance Concrete Compressive Strength Using Standalone and Ensembled Machine Learning Techniques

 , , , and
Abstract
:1. Introduction
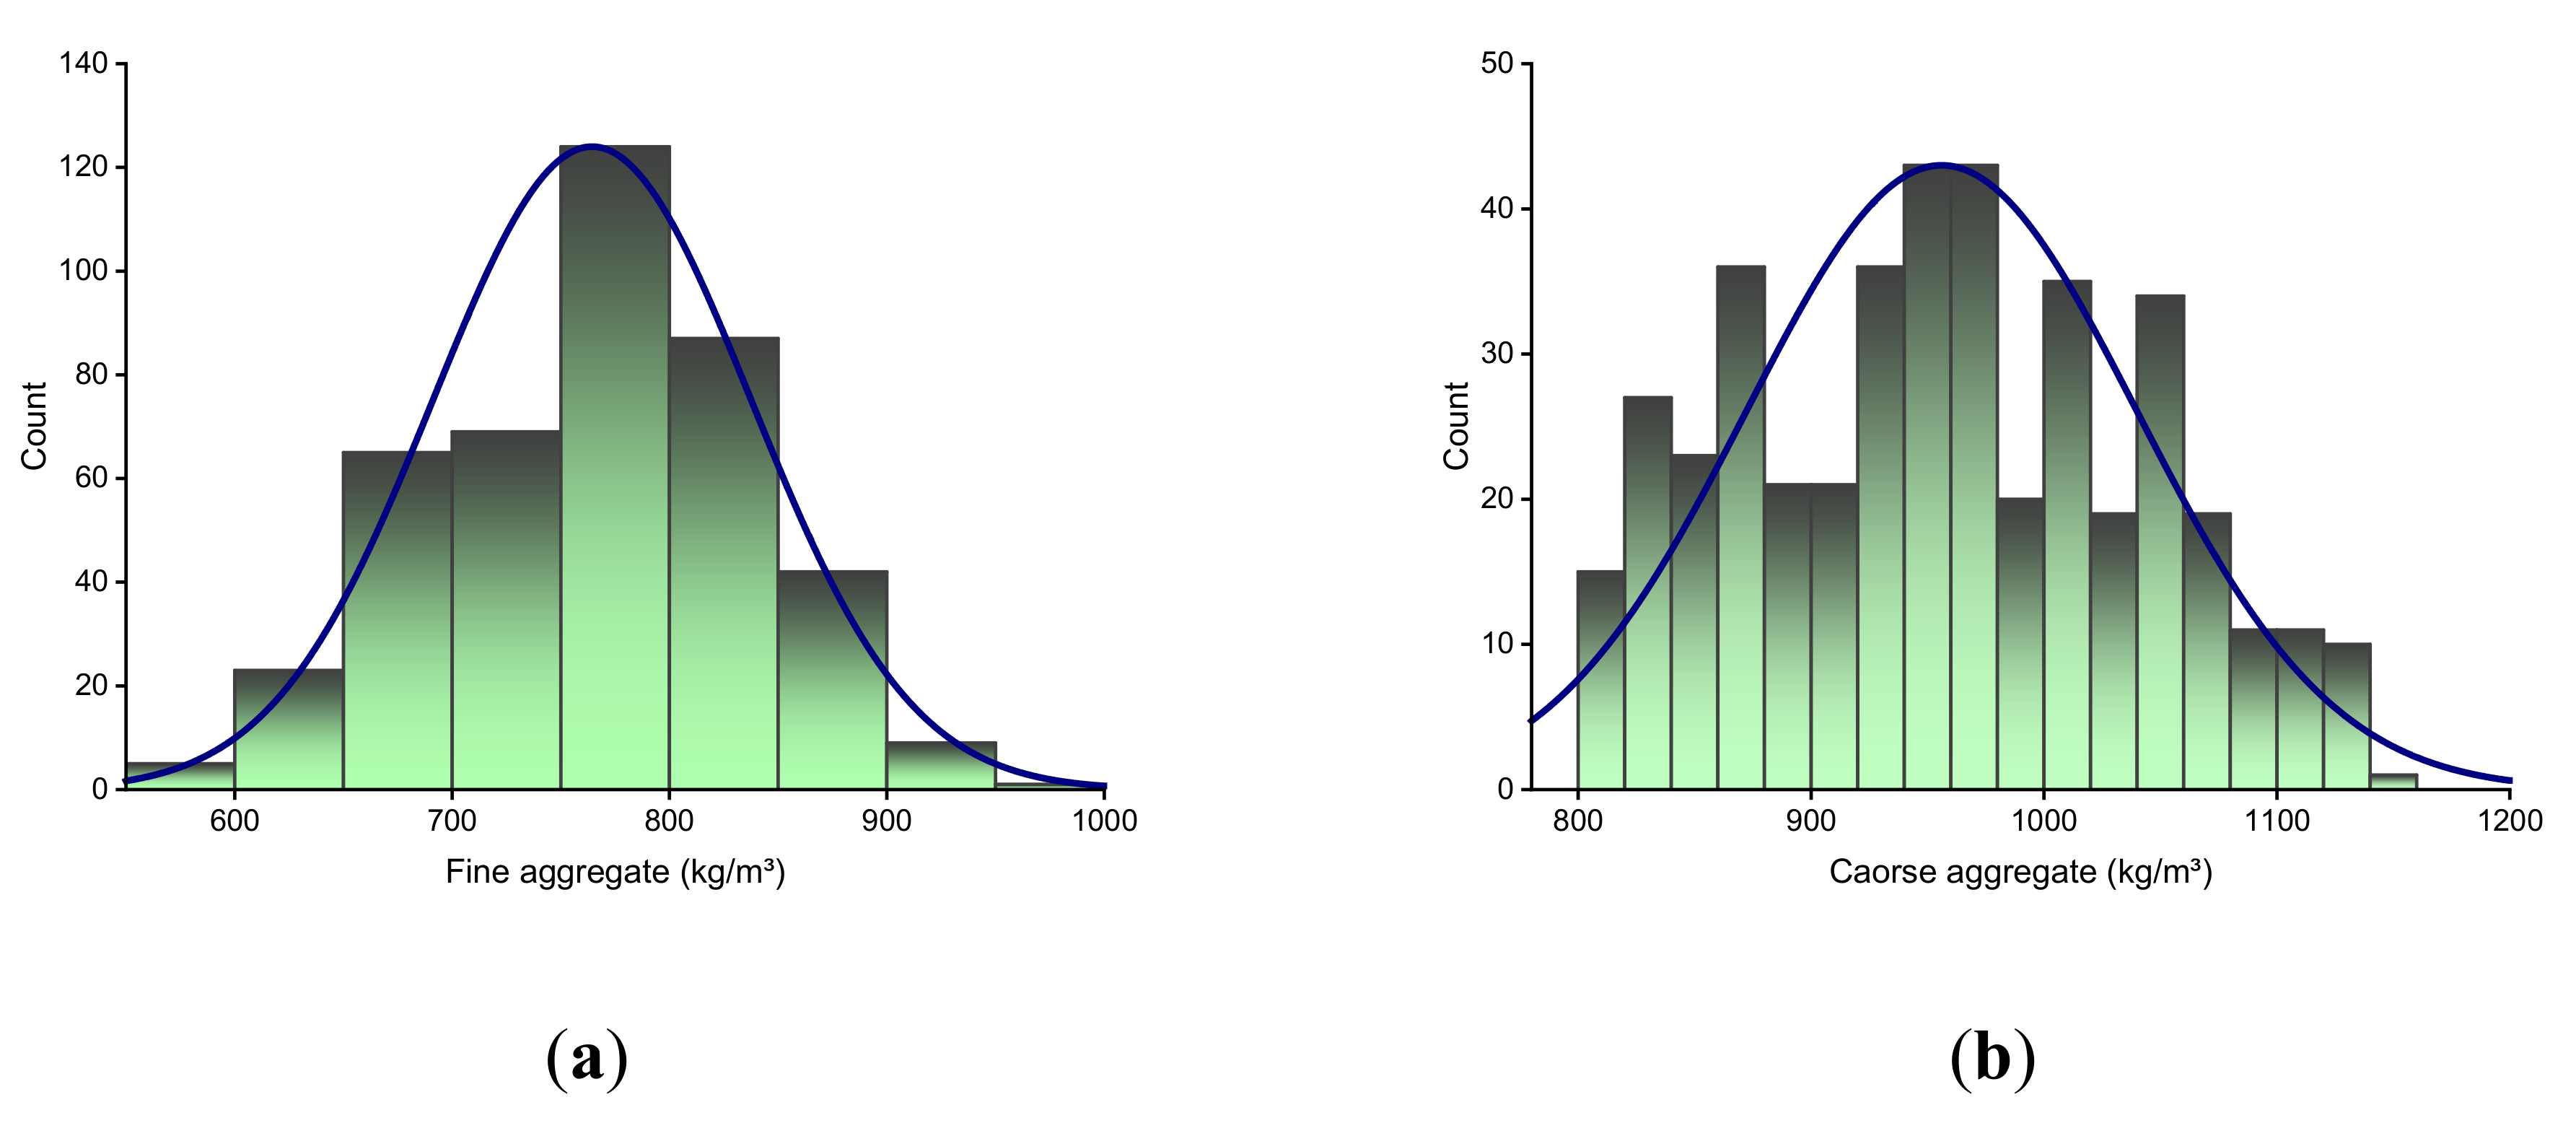
2. Data Description
3. Research Strategy
3.1. Random Forest
3.2. AdaBoost
3.3. Support Vector Machine
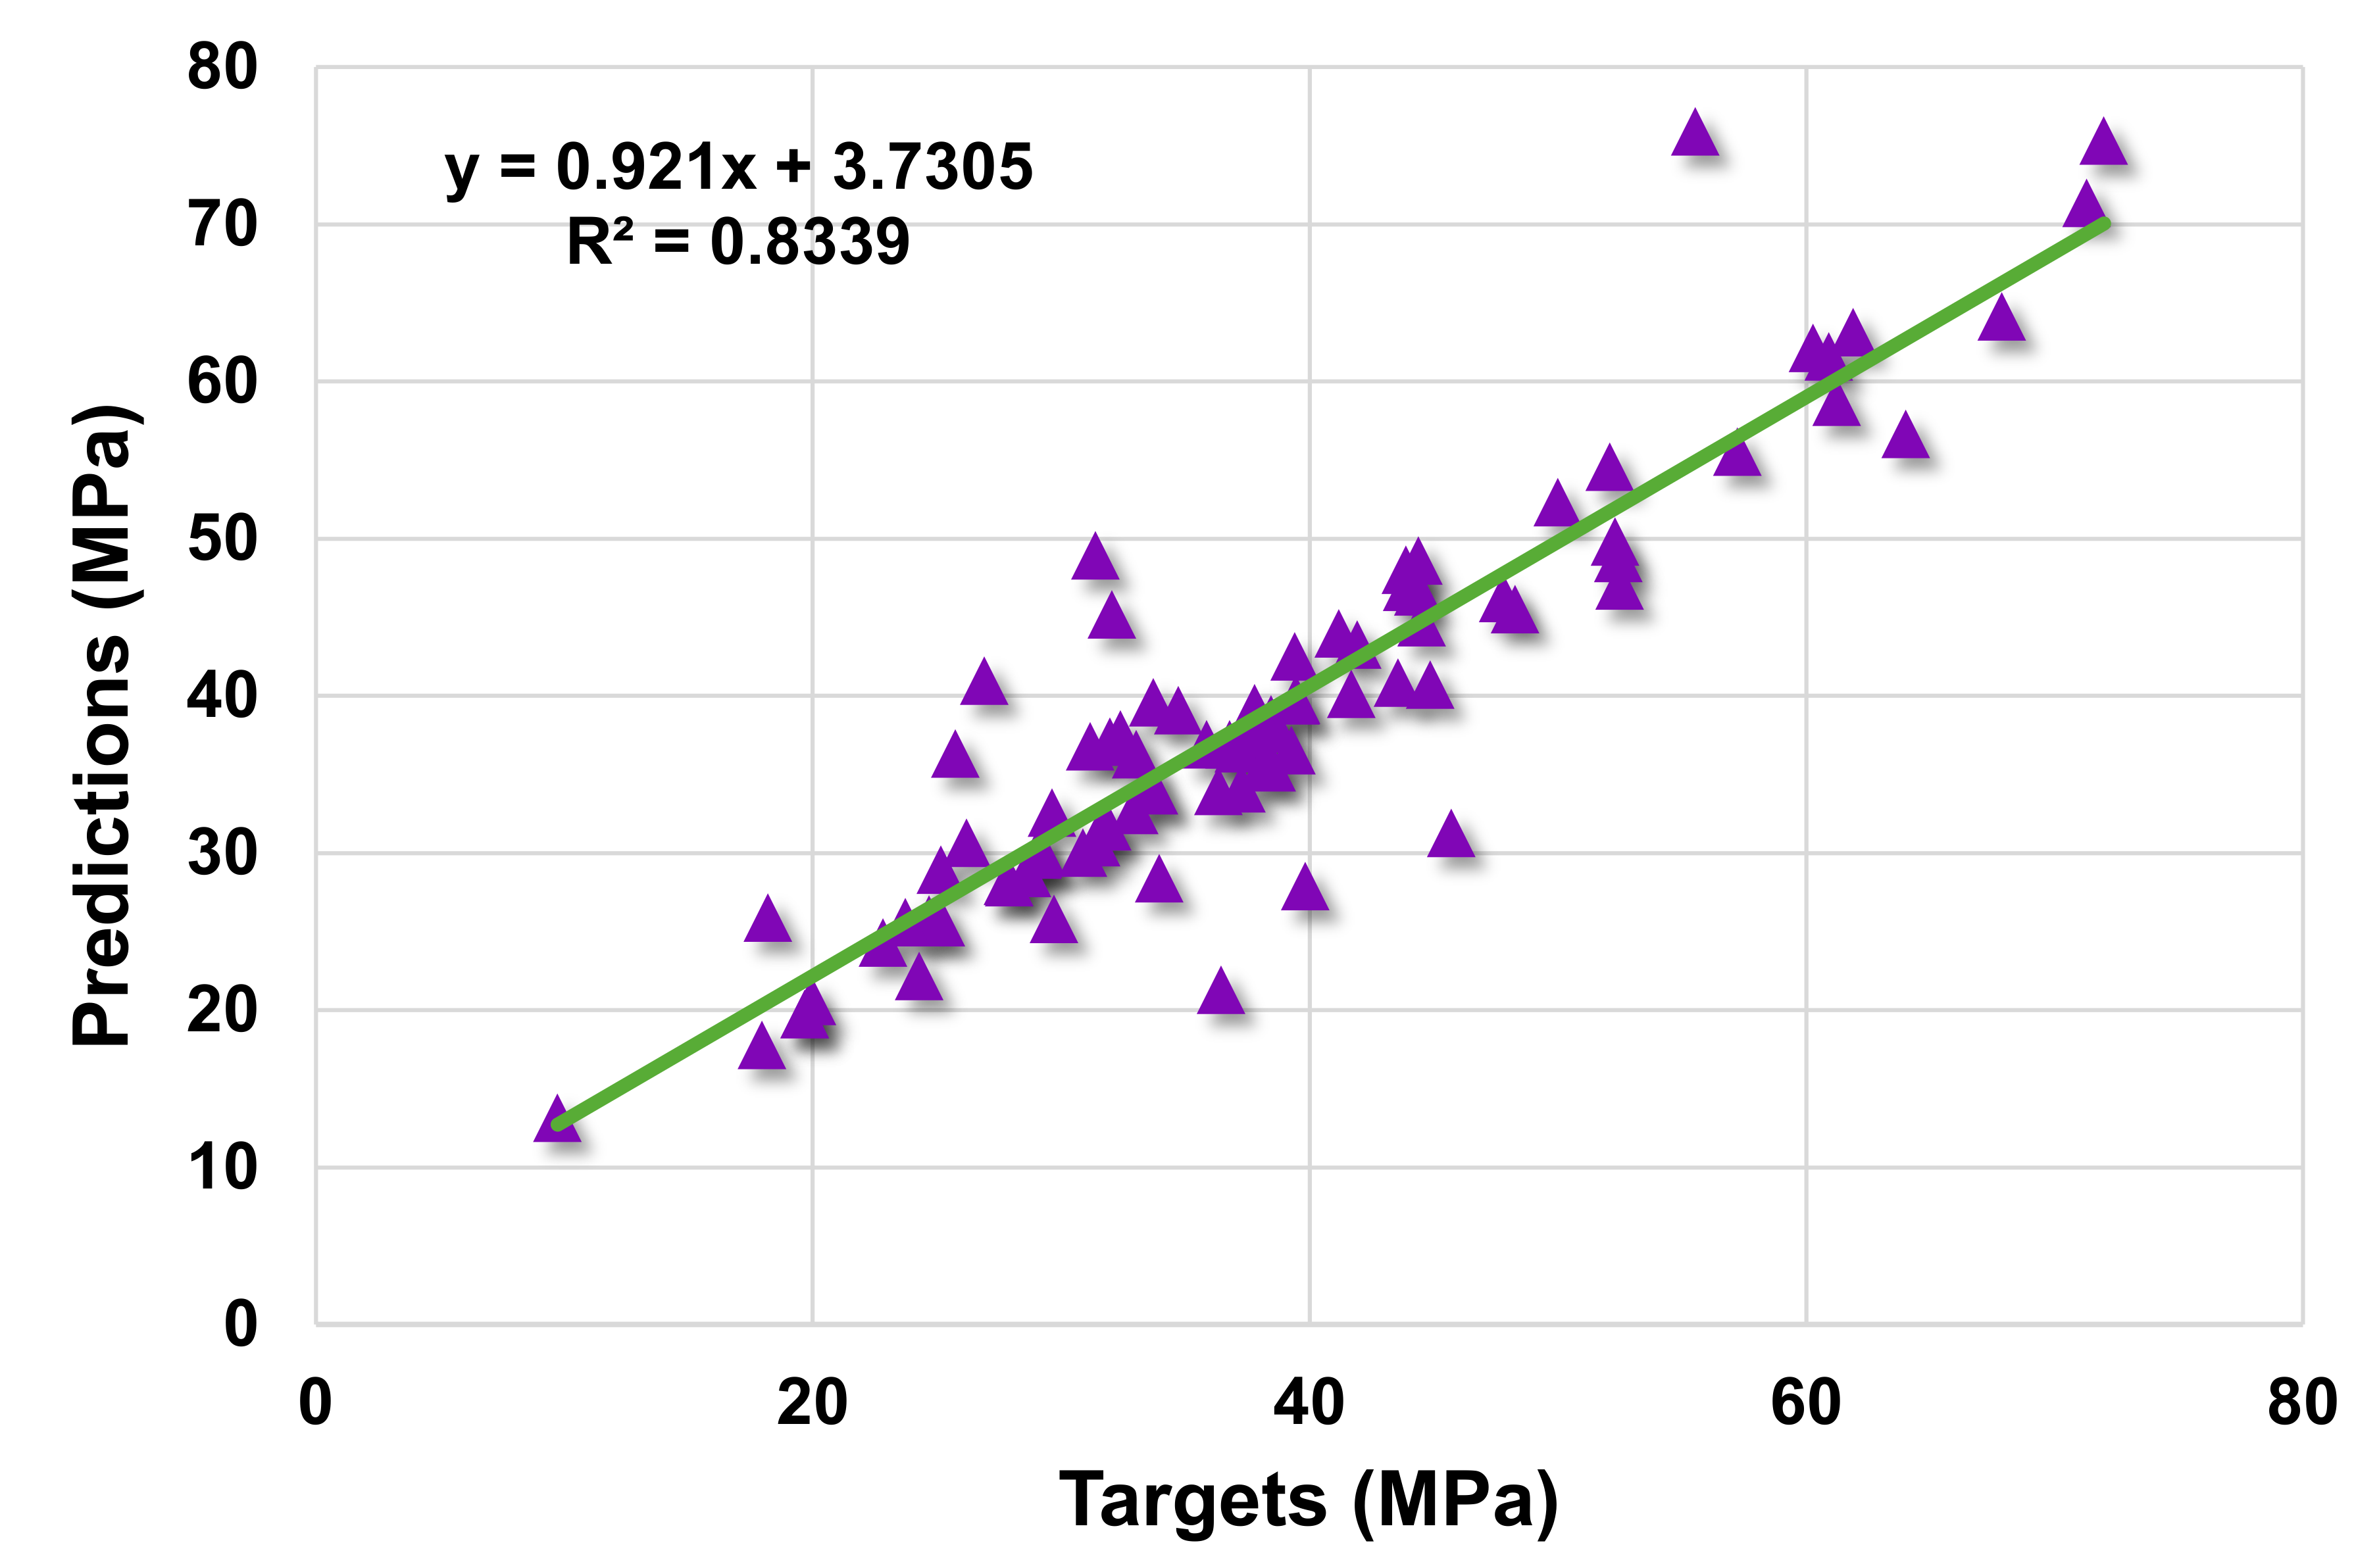
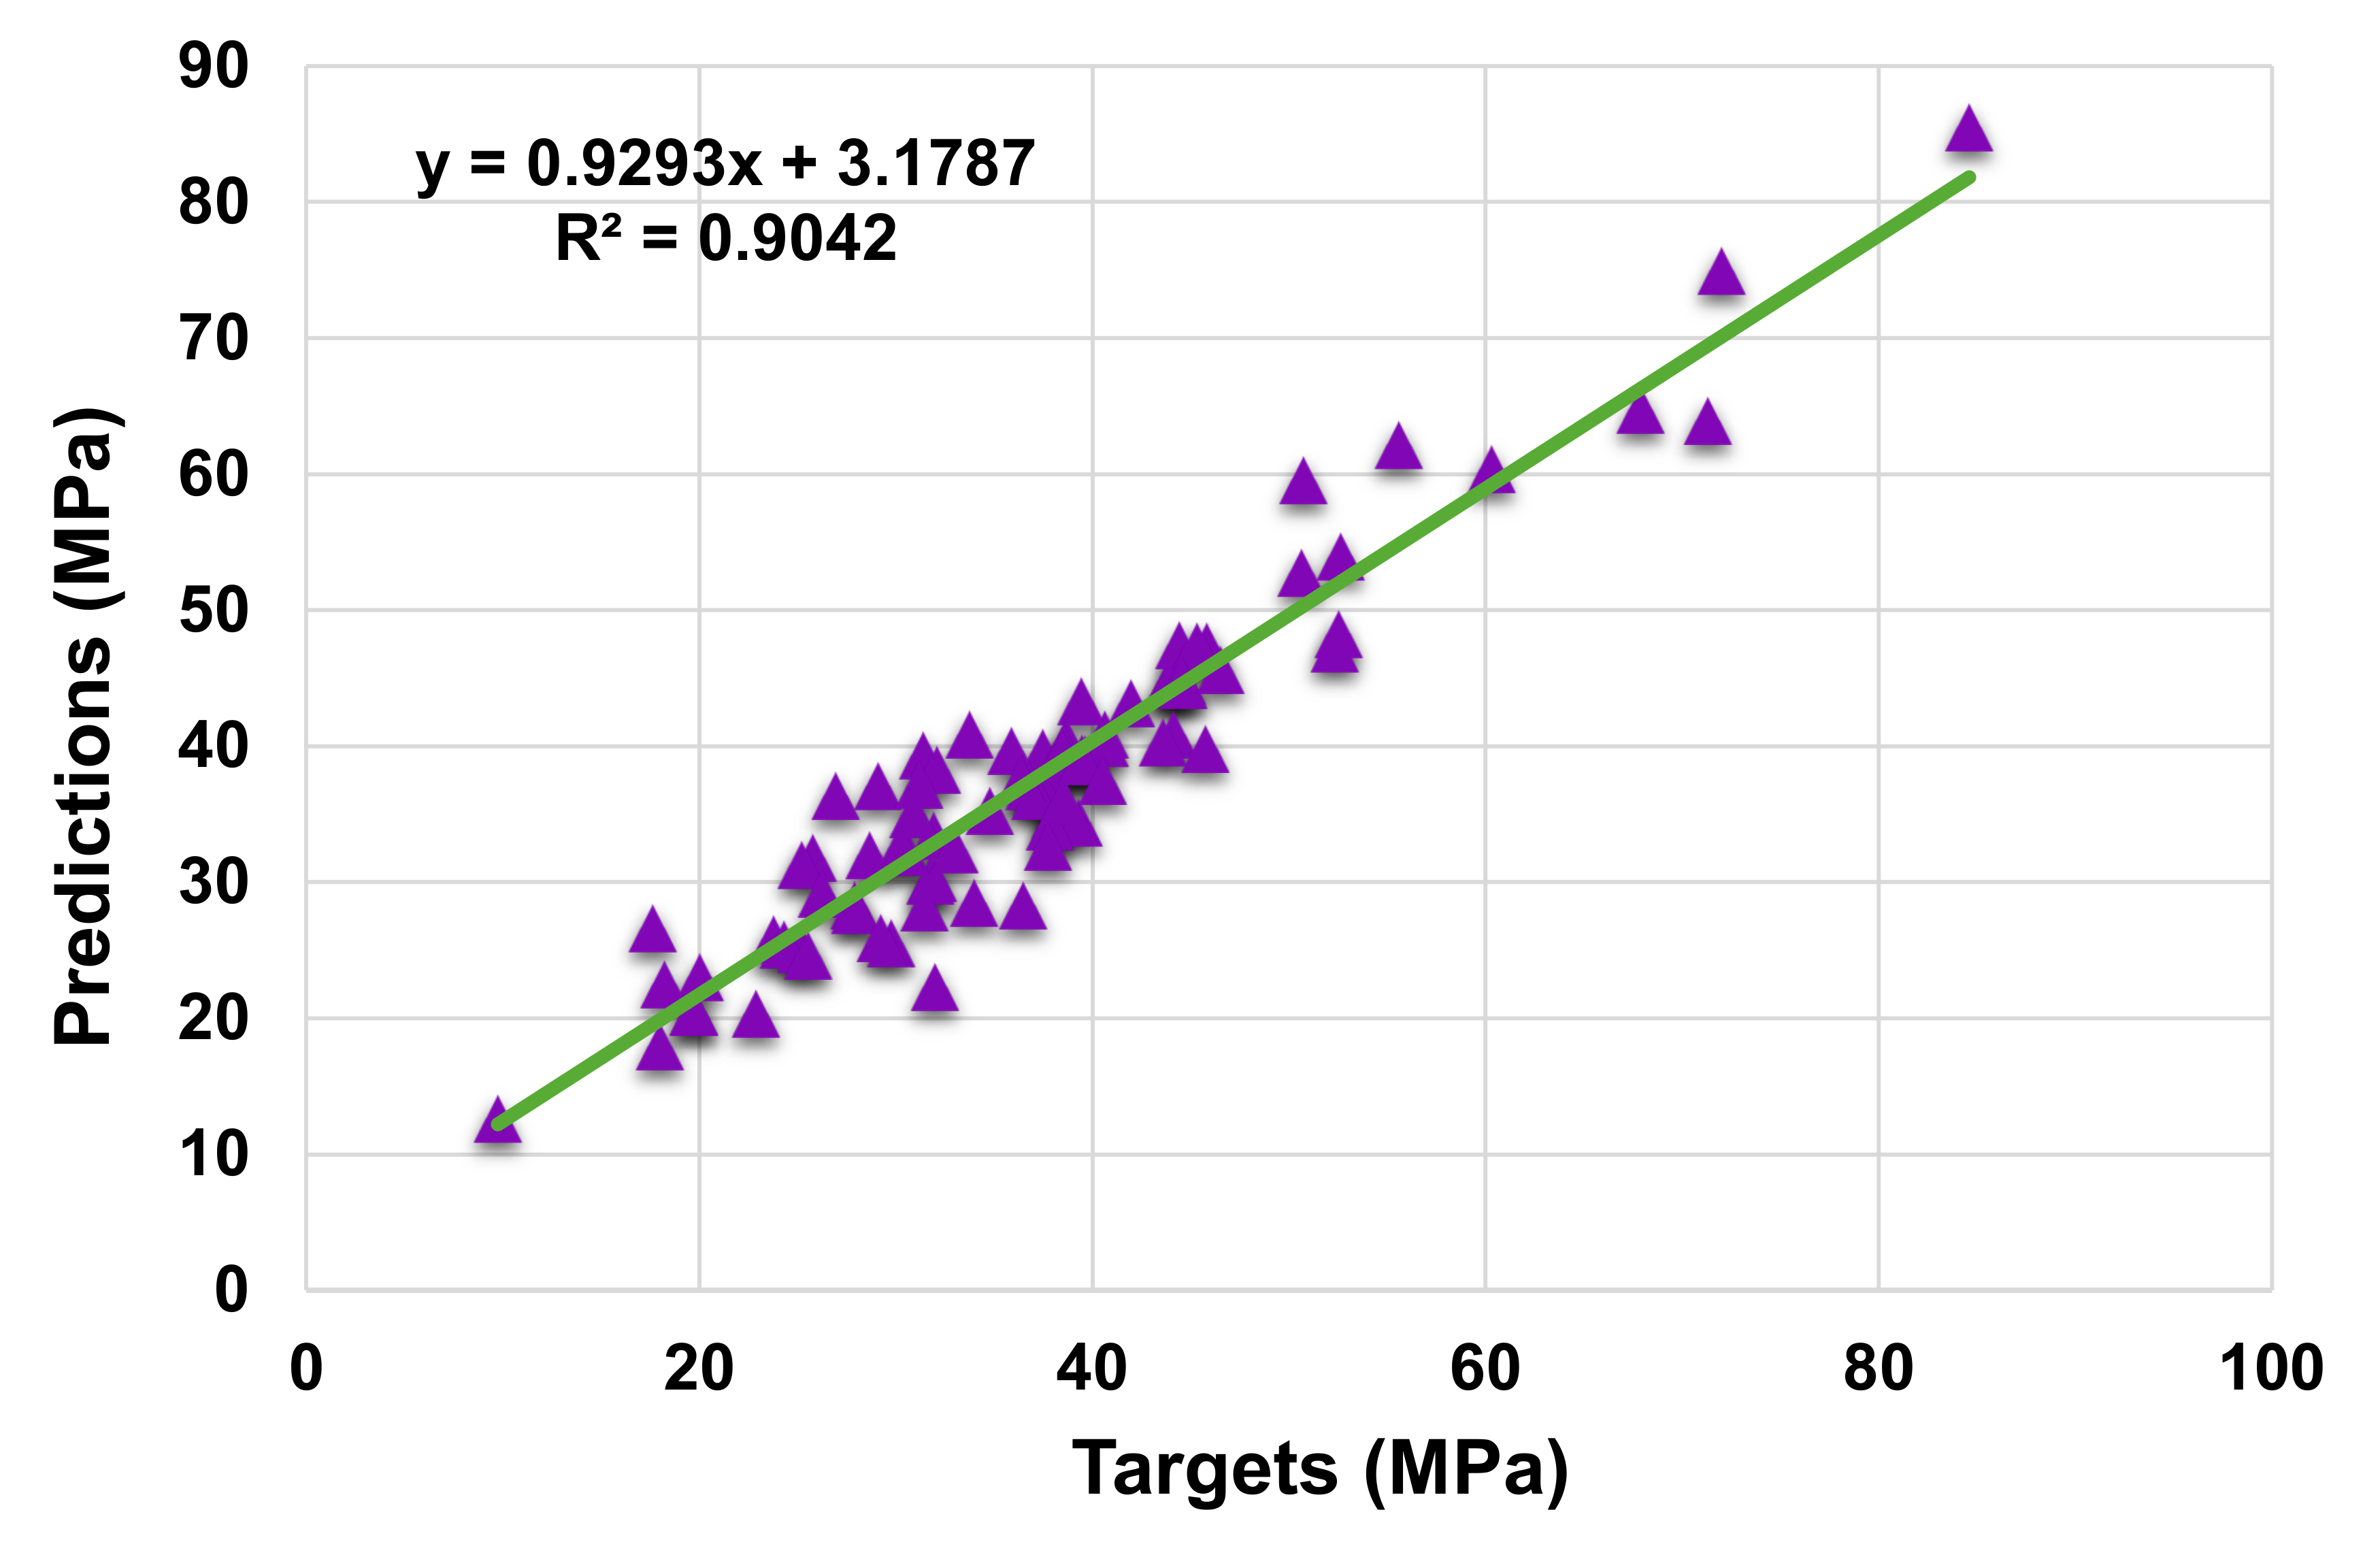
4. Results
4.1. Statistical Analysis
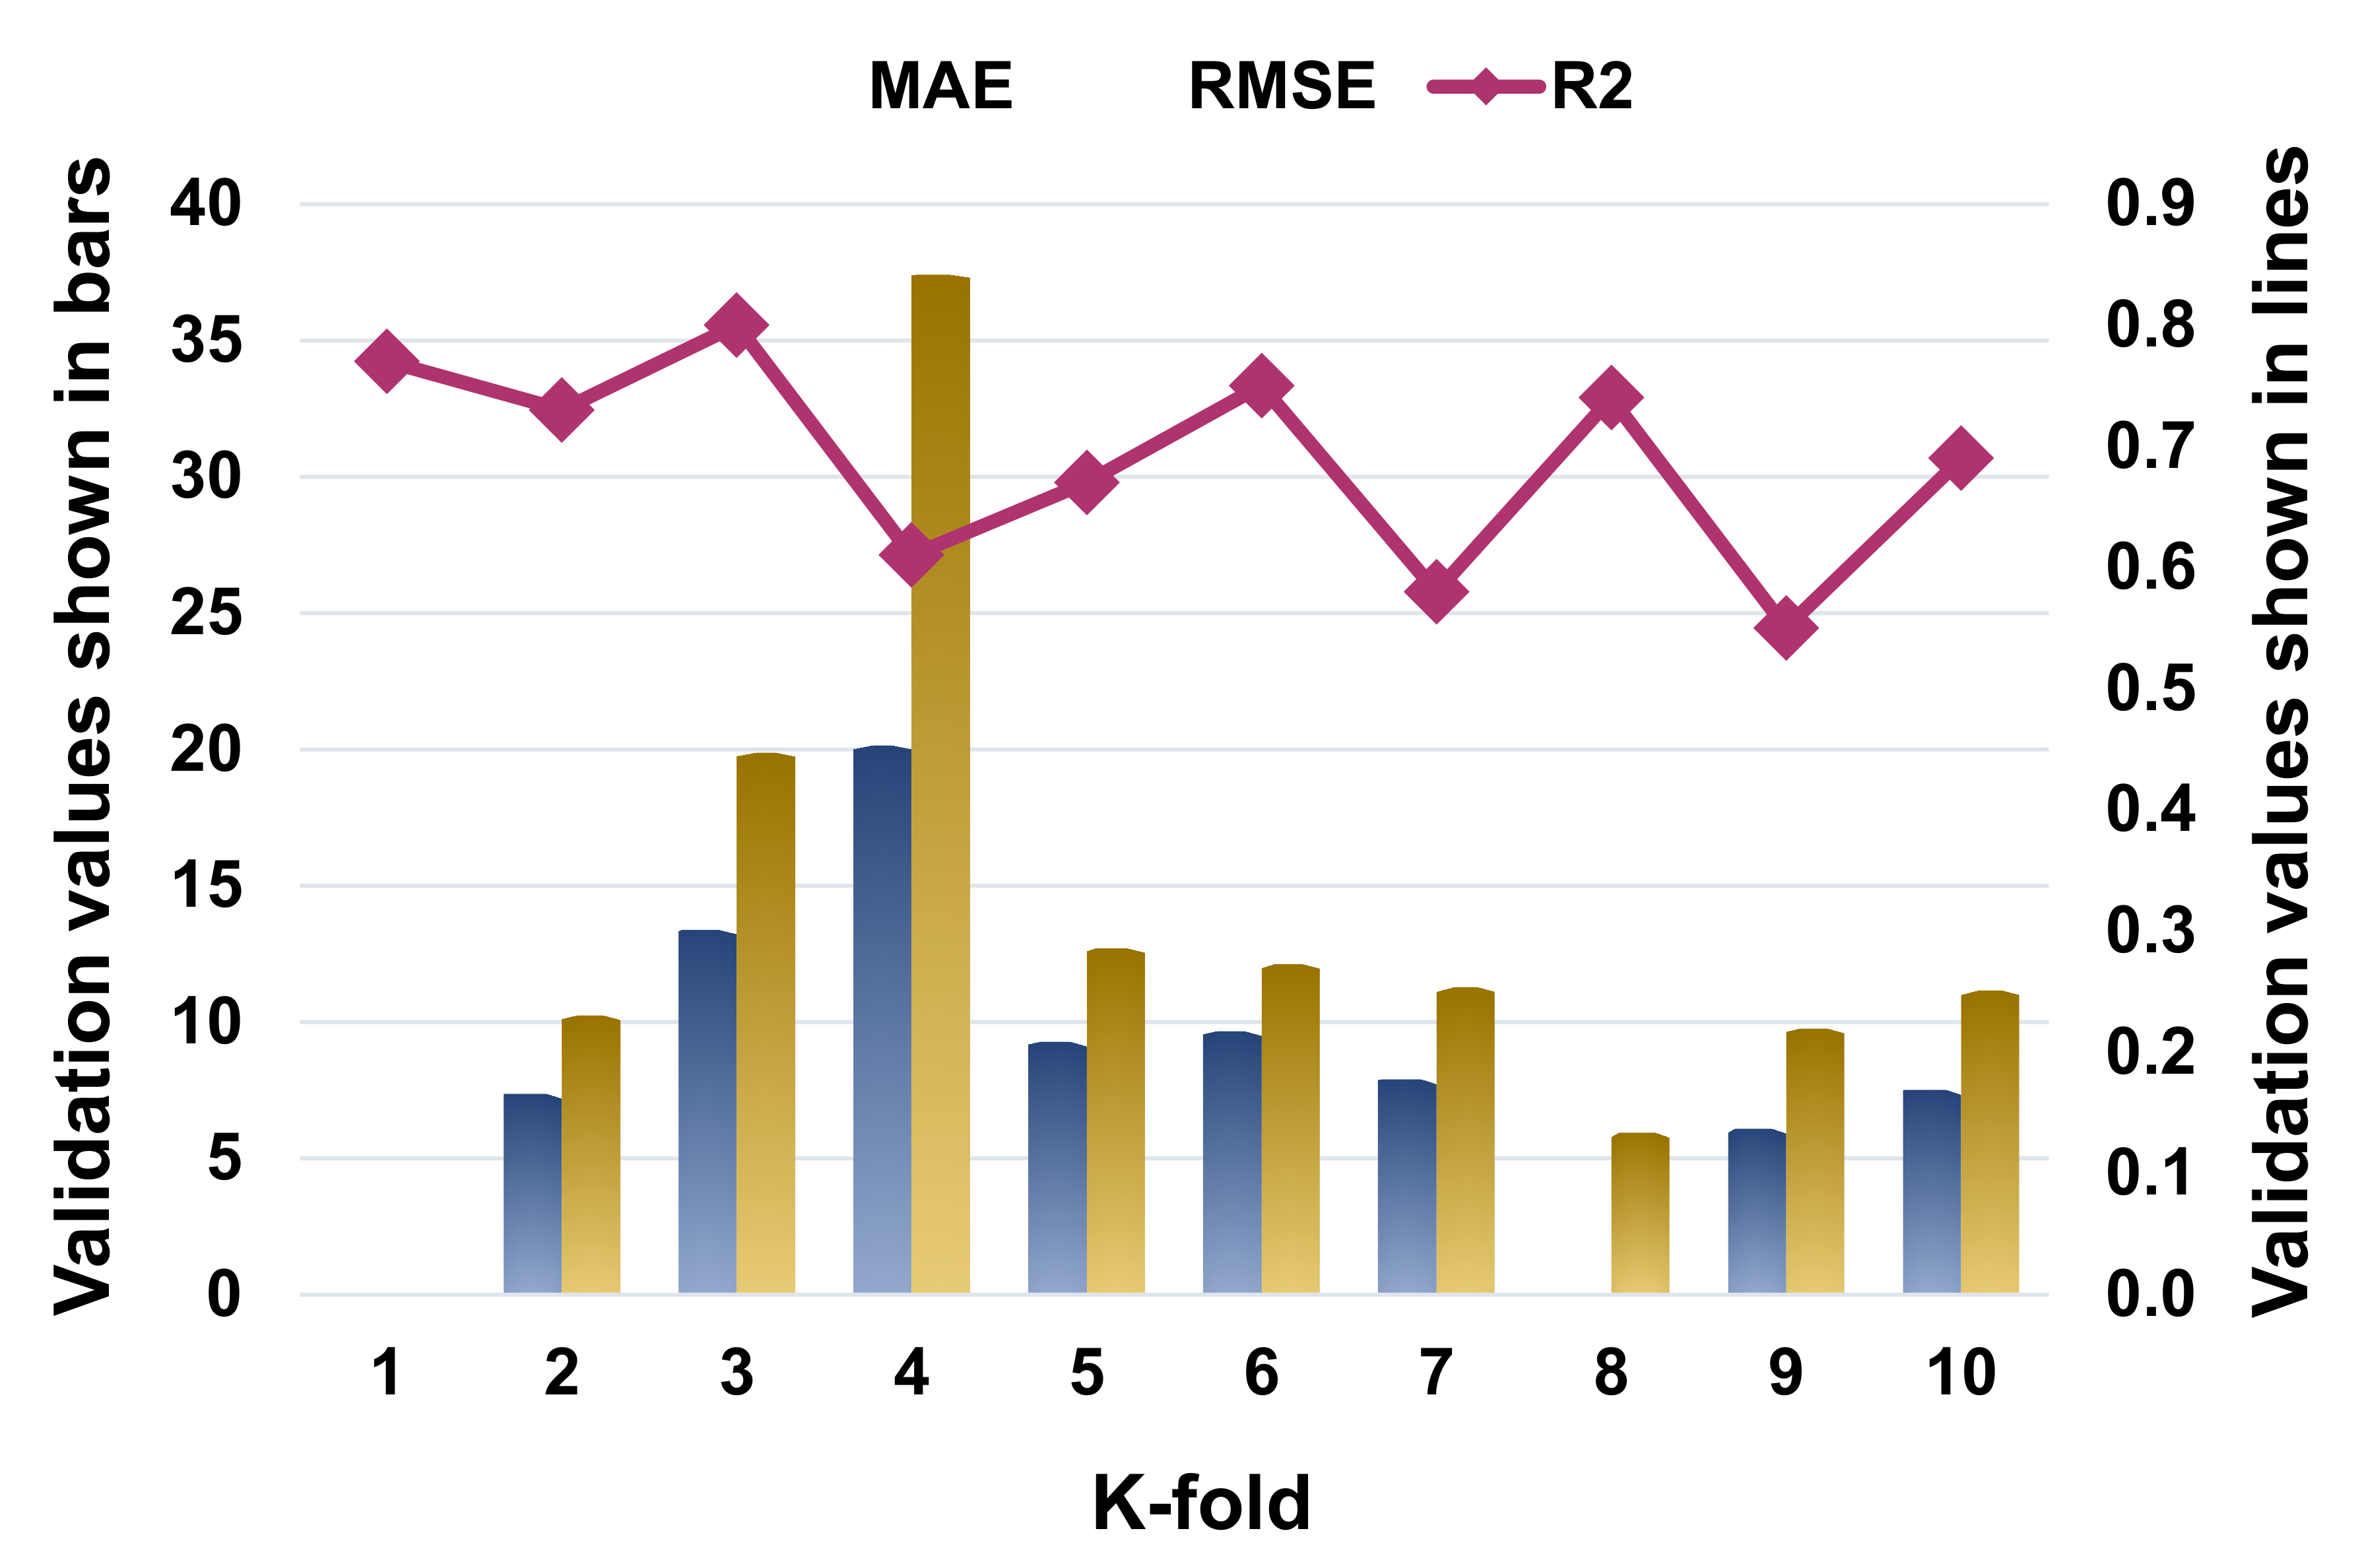
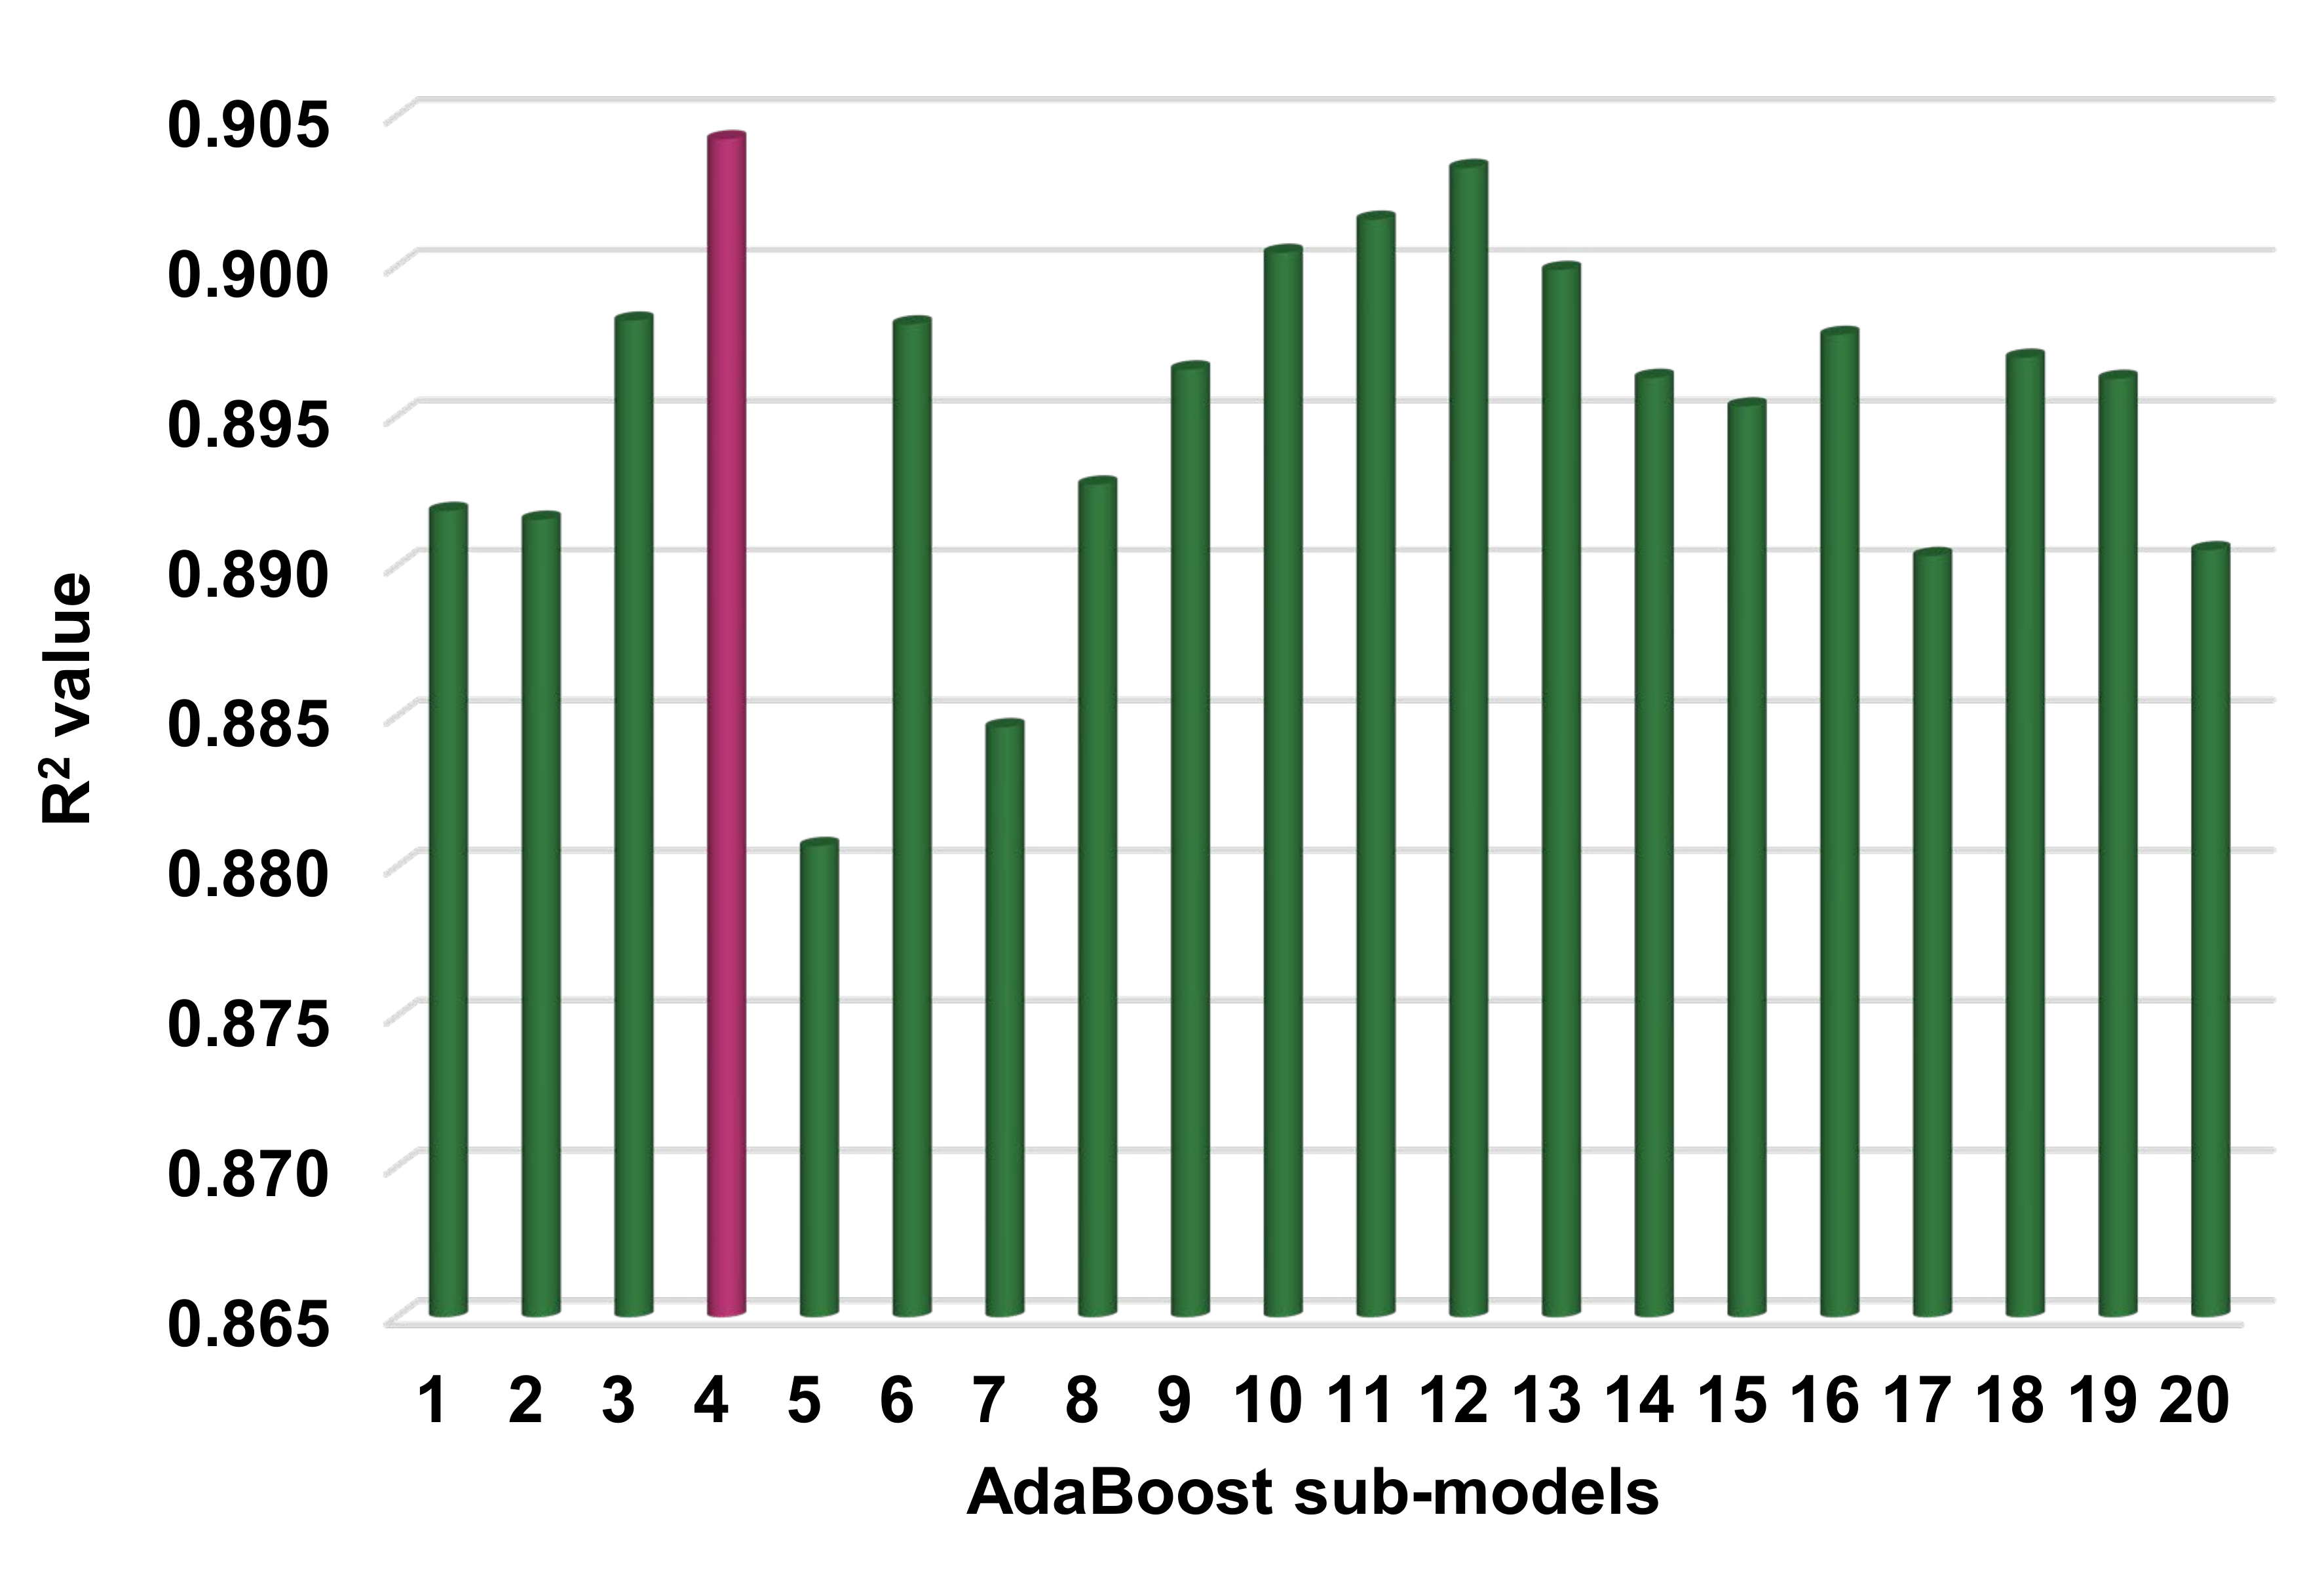
4.2. K-Fold Cross-Validation Checks
4.3. Sensitivity Analysis
5. Discussion
6. Conclusions
Author Contributions
Funding
Institutional Review Board Statement
Informed Consent Statement
Data Availability Statement
Acknowledgments
Conflicts of Interest
References
- Mangi, S.A.; Wan Ibrahim, M.H.; Jamaluddin, N.; Arshad, M.F.; Shahidan, S. Performances of concrete containing coal bottom ash with different fineness as a supplementary cementitious material exposed to seawater. Eng. Sci. Technol. Int. J. 2019, 22, 929–938. [Google Scholar] [CrossRef]
- Molay, T.G.G.; Leroy, M.N.L.; Fidele, T.; Franck, H.G.; Bienvenu, N.J.-M. Mechanical and physical performances of concretes made from crushed sands of different geological nature subjected to high temperatures. Eng. Sci. Technol. Int. J. 2019, 22, 1116–1124. [Google Scholar] [CrossRef]
- Ahmad, W.; Farooq, S.H.; Usman, M.; Khan, M.; Ahmad, A.; Aslam, F.; Yousef, R.A.; Abduljabbar, H.A.; Sufian, M. Effect of coconut fiber length and content on properties of high strength concrete. Materials 2020, 13, 1075. [Google Scholar] [CrossRef] [Green Version]
- Khan, M.; Ali, M. Use of glass and nylon fibers in concrete for controlling early age micro cracking in bridge decks. Constr. Build. Mater. 2016, 125, 800–808. [Google Scholar] [CrossRef]
- Khan, M.; Ali, M. Improvement in concrete behavior with fly ash, silica-fume and coconut fibres. Constr. Build. Mater. 2019, 203, 174–187. [Google Scholar] [CrossRef]
- Ahmad, W.; Ahmad, A.; Ostrowski, K.A.; Aslam, F.; Joyklad, P.; Zajdel, P. Application of Advanced Machine Learning Approaches to Predict the Compressive Strength of Concrete Containing Supplementary Cementitious Materials. Materials 2021, 14, 5762. [Google Scholar] [CrossRef]
- Liu, T.; Nafees, A.; Javed, M.F.; Aslam, F.; Alabduljabbar, H.; Xiong, J.-J.; Khan, M.I.; Malik, M.Y. Comparative study of mechanical properties between irradiated and regular plastic waste as a replacement of cement and fine aggregate for manufacturing of green concrete. Ain Shams Eng. J. 2021. [Google Scholar] [CrossRef]
- Shaker, F.; Rashad, A.; Allam, M. Properties of concrete incorporating locally produced Portland limestone cement. Ain Shams Eng. J. 2018, 9, 2301–2309. [Google Scholar] [CrossRef]
- Ahmad, W.; Ahmad, A.; Ostrowski, K.A.; Aslam, F.; Joyklad, P. A scientometric review of waste material utilization in concrete for sustainable construction. Case Stud. Constr. Mater. 2021, 15, e00683. [Google Scholar] [CrossRef]
- Mohamed, H.A. Effect of fly ash and silica fume on compressive strength of self-compacting concrete under different curing conditions. Ain Shams Eng. J. 2011, 2, 79–86. [Google Scholar] [CrossRef] [Green Version]
- Dalvand, A.; Ahmadi, M. Impact failure mechanism and mechanical characteristics of steel fiber reinforced self-compacting cementitious composites containing silica fume. Eng. Sci. Technol. Int. J. 2021, 24, 736–748. [Google Scholar] [CrossRef]
- Ahmad, W.; Ahmad, A.; Ostrowski, K.A.; Aslam, F.; Joyklad, P.; Zajdel, P. Sustainable approach of using sugarcane bagasse ash in cement-based composites: A systematic review. Case Stud. Constr. Mater. 2021, 15, e00698. [Google Scholar] [CrossRef]
- Salimi, J.; Ramezanianpour, A.M.; Moradi, M.J. Studying the effect of low reactivity metakaolin on free and restrained shrinkage of high performance concrete. J. Build. Eng. 2020, 28, 101053. [Google Scholar] [CrossRef]
- Uva, G.; Porco, F.; Fiore, A.; Mezzina, M. The assessment of structural concretes during construction phases. Struct. Surv. 2014, 32, 189–208. [Google Scholar] [CrossRef]
- Sangiorgio, V.; Uva, G.; Adam, J.M.; Scarcelli, L. Failure analysis of reinforced concrete elevated storage tanks. Eng. Fail. Anal. 2020, 115, 104637. [Google Scholar] [CrossRef]
- American concrete institute manual of concrete practice. In ACI Concrete Terminology; ACI CT-13; American Concrete Institute: Farmington Hills, MI, USA, 2013.
- Pedro, D.; De Brito, J.; Evangelista, L. Durability performance of high-performance concrete made with recycled aggregates, fly ash and densified silica fume. Cem. Concr. Compos. 2018, 93, 63–74. [Google Scholar] [CrossRef]
- Li, J.; Wu, Z.; Shi, C.; Yuan, Q.; Zhang, Z. Durability of ultra-high performance concrete—A review. Constr. Build. Mater. 2020, 255, 119296. [Google Scholar] [CrossRef]
- Semendary, A.A.; Hamid, W.K.; Steinberg, E.P.; Khoury, I. Shear friction performance between high strength concrete (HSC) and ultra high performance concrete (UHPC) for bridge connection applications. Eng. Struct. 2020, 205, 110122. [Google Scholar] [CrossRef]
- Park, S.; Wu, S.; Liu, Z.; Pyo, S. The role of supplementary cementitious materials (SCMs) in ultra high performance concrete (UHPC): A review. Materials 2021, 14, 1472. [Google Scholar] [CrossRef]
- Khatri, R.P.; Sirivivatnanon, V.; Gross, W. Effect of different supplementary cementitious materials on mechanical properties of high performance concrete. Cem. Concr. Res. 1995, 25, 209–220. [Google Scholar] [CrossRef]
- Ahmad, A.; Farooq, F.; Niewiadomski, P.; Ostrowski, K.; Akbar, A.; Aslam, F.; Alyousef, R. Prediction of compressive strength of fly ash based concrete using individual and ensemble algorithm. Materials 2021, 14, 794. [Google Scholar] [CrossRef]
- Ahmad, A.; Farooq, F.; Ostrowski, K.A.; Śliwa-Wieczorek, K.; Czarnecki, S. Application of Novel Machine Learning Techniques for Predicting the Surface Chloride Concentration in Concrete Containing Waste Material. Materials 2021, 14, 2297. [Google Scholar] [CrossRef] [PubMed]
- Ahmad, A.; Ostrowski, K.A.; Maślak, M.; Farooq, F.; Mehmood, I.; Nafees, A. Comparative Study of Supervised Machine Learning Algorithms for Predicting the Compressive Strength of Concrete at High Temperature. Materials 2021, 14, 4222. [Google Scholar] [CrossRef]
- Amin, M.N.; Iqtidar, A.; Khan, K.; Javed, M.F.; Shalabi, F.I.; Qadir, M.G. Comparison of Machine Learning Approaches with Traditional Methods for Predicting the Compressive Strength of Rice Husk Ash Concrete. Crystals 2021, 11, 779. [Google Scholar] [CrossRef]
- Shah, H.A.; Rehman, S.K.U.; Javed, M.F.; Iftikhar, Y. Prediction of compressive and splitting tensile strength of concrete with fly ash by using gene expression programming. Struct. Concr. 2021, 1–15. [Google Scholar] [CrossRef]
- Algaifi, H.A.; Alqarni, A.S.; Alyousef, R.; Bakar, S.A.; Ibrahim, M.H.W.; Shahidan, S.; Ibrahim, M.; Salami, B.A. Mathematical prediction of the compressive strength of bacterial concrete using gene expression programming. Ain Shams Eng. J. 2021. [Google Scholar] [CrossRef]
- Ruggieri, S.; Cardellicchio, A.; Leggieri, V.; Uva, G. Machine-learning based vulnerability analysis of existing buildings. Autom. Constr. 2021, 132, 103936. [Google Scholar] [CrossRef]
- Alexandridis, A.; Stavrakas, I.; Stergiopoulos, C.; Hloupis, G.; Ninos, K.; Triantis, D. Non-destructive assessment of the three-point-bending strength of mortar beams using radial basis function neural networks. Comput. Concr. 2015, 16, 919–932. [Google Scholar] [CrossRef]
- Chaabene, W.B.; Flah, M.; Nehdi, M.L. Machine learning prediction of mechanical properties of concrete: Critical review. Constr. Build. Mater. 2020, 260, 119889. [Google Scholar] [CrossRef]
- Song, H.; Ahmad, A.; Farooq, F.; Ostrowski, K.A.; Maślak, M.; Czarnecki, S.; Aslam, F. Predicting the compressive strength of concrete with fly ash admixture using machine learning algorithms. Constr. Build. Mater. 2021, 308, 125021. [Google Scholar] [CrossRef]
- DeRousseau, M.A.; Kasprzyk, J.R.; Srubar Iii, W.V. Computational design optimization of concrete mixtures: A review. Cem. Concr. Res. 2018, 109, 42–53. [Google Scholar] [CrossRef]
- Sun, J.; Ma, Y.; Li, J.; Zhang, J.; Ren, Z.; Wang, X. Machine learning-aided design and prediction of cementitious composites containing graphite and slag powder. J. Build. Eng. 2021, 43, 102544. [Google Scholar] [CrossRef]
- Song, H.; Ahmad, A.; Ostrowski, K.A.; Dudek, M. Analyzing the Compressive Strength of Ceramic Waste-Based Concrete Using Experiment and Artificial Neural Network (ANN) Approach. Materials 2021, 14, 4518. [Google Scholar] [CrossRef]
- Abuodeh, O.R.; Abdalla, J.A.; Hawileh, R.A. Assessment of compressive strength of Ultra-high Performance Concrete using deep machine learning techniques. Appl. Soft Comput. 2020, 95, 106552. [Google Scholar] [CrossRef]
- Ahmad, A.; Chaiyasarn, K.; Farooq, F.; Ahmad, W.; Suparp, S.; Aslam, F. Compressive Strength Prediction via Gene Expression Programming (GEP) and Artificial Neural Network (ANN) for Concrete Containing RCA. Buildings 2021, 11, 324. [Google Scholar] [CrossRef]
- Sufian, M.; Ullah, S.; Ostrowski, K.A.; Ahmad, A.; Zia, A.; Śliwa-Wieczorek, K.; Siddiq, M.; Awan, A.A. An Experimental and Empirical Study on the Use of Waste Marble Powder in Construction Material. Materials 2021, 14, 3829. [Google Scholar] [CrossRef] [PubMed]
- Machine Learning Repository, Center for Machine Learning and Intelligent Systems. Available online: https://archive.ics.uci.edu/ml/datasets/concrete+compressive+strength (accessed on 3 August 2007).
- Yeh, I.C. Modeling of strength of high-performance concrete using artificial neural networks. Cem. Concr. Res. 1998, 28, 1797–1808. [Google Scholar] [CrossRef]
- Yeh, I.C. Prediction of strength of fly ash and slag concrete by the use of artificial neural networks. J. Chin. Inst. Civil Hydraul. Eng. 2003, 15, 659–663. [Google Scholar]
- Yeh, I.C. Analysis of strength of concrete using design of experiments and neural networks. J. Mater. Civ. Eng. 2006, 18, 597–604. [Google Scholar] [CrossRef]
- Gandomi, A.H.; Roke, D.A. Assessment of artificial neural network and genetic programming as predictive tools. Adv. Eng. Softw. 2015, 88, 63–72. [Google Scholar] [CrossRef]
- Available online: https://anaconda.org/anaconda/anaconda-navigator (accessed on 3 August 2007).
- Farooq, F.; Ahmed, W.; Akbar, A.; Aslam, F.; Alyousef, R. Predictive modeling for sustainable high-performance concrete from industrial wastes: A comparison and optimization of models using ensemble learners. J. Clean. Prod. 2021, 292, 126032. [Google Scholar] [CrossRef]
- Aslam, F.; Farooq, F.; Amin, M.N.; Khan, K.; Waheed, A.; Akbar, A.; Javed, M.F.; Alyousef, R.; Alabdulijabbar, H. Applications of gene expression programming for estimating compressive strength of high-strength concrete. Adv. Civ. Eng. 2020, 2020, 8850535. [Google Scholar] [CrossRef]
- Farooq, F.; Nasir Amin, M.; Khan, K.; Rehan Sadiq, M.; Faisal Javed, M.; Aslam, F.; Alyousef, R. A comparative study of random forest and genetic engineering programming for the prediction of compressive strength of high strength concrete (HSC). Appl. Sci. 2020, 10, 7330. [Google Scholar] [CrossRef]


| Parameter | Input Variable (kg/m3) | ||||||
|---|---|---|---|---|---|---|---|
| Fine Aggregate | Coarse Aggregate | Cement | Water | Superplasticizer | Fly Ash | Blast Furnace Slag | |
| Mean | 764.4 | 956.1 | 265.4 | 183.1 | 7.0 | 62.8 | 86.3 |
| Standard Error | 3.5 | 4.1 | 5.1 | 0.9 | 0.3 | 3.2 | 4.3 |
| Median | 769.3 | 953.2 | 261.0 | 185.0 | 7.8 | 60.0 | 94.7 |
| Mode | 755.8 | 932.0 | 313.0 | 192.0 | 0.0 | 0.0 | 0.0 |
| Standard Deviation | 73.1 | 83.8 | 104.7 | 19.3 | 5.4 | 66.2 | 87.8 |
| Range | 398.6 | 344.0 | 438.0 | 125.2 | 32.2 | 200.1 | 359.4 |
| Minimum | 594.0 | 801.0 | 102.0 | 121.8 | 0.0 | 0.0 | 0.0 |
| Maximum | 992.6 | 1145.0 | 540.0 | 247.0 | 32.2 | 200.1 | 359.4 |
| Model | MAE | RMSE |
|---|---|---|
| Support vector regression | 3.329 | 5.325 |
| AdaBoost | 2.947 | 3.908 |
| Random forest | 2.223 | 3.183 |
| K-Fold | SVR | AdaBoost | Random Forest | ||||||
|---|---|---|---|---|---|---|---|---|---|
| MAE | RMSE | R2 | MAE | RMSE | R2 | MAE | RMSE | R2 | |
| 1 | 4.37 | 5.68 | 0.77 | 6.79 | 7.54 | 0.83 | 3.94 | 5.33 | 0.80 |
| 2 | 7.38 | 10.25 | 0.73 | 6.79 | 10.10 | 0.75 | 5.78 | 8.11 | 0.88 |
| 3 | 13.38 | 19.87 | 0.80 | 10.88 | 14.83 | 0.89 | 8.68 | 12.08 | 0.66 |
| 4 | 20.13 | 37.40 | 0.61 | 14.46 | 26.74 | 0.60 | 6.65 | 8.79 | 0.61 |
| 5 | 9.28 | 12.69 | 0.67 | 7.62 | 10.93 | 0.90 | 6.31 | 9.62 | 0.91 |
| 6 | 9.67 | 12.13 | 0.75 | 9.85 | 11.60 | 0.77 | 6.05 | 7.14 | 0.84 |
| 7 | 7.91 | 11.28 | 0.58 | 7.60 | 11.24 | 0.88 | 6.79 | 8.70 | 0.62 |
| 8 | 4.66 | 5.95 | 0.74 | 4.73 | 5.21 | 0.65 | 7.09 | 8.59 | 0.92 |
| 9 | 6.08 | 9.75 | 0.55 | 7.07 | 8.95 | 0.61 | 5.57 | 5.39 | 0.79 |
| 10 | 7.51 | 11.15 | 0.69 | 6.06 | 9.22 | 0.72 | 8.25 | 10.11 | 0.86 |
Publisher’s Note: MDPI stays neutral with regard to jurisdictional claims in published maps and institutional affiliations. |
© 2021 by the authors. Licensee MDPI, Basel, Switzerland. This article is an open access article distributed under the terms and conditions of the Creative Commons Attribution (CC BY) license (https://creativecommons.org/licenses/by/4.0/).
Share and Cite
Xu, Y.; Ahmad, W.; Ahmad, A.; Ostrowski, K.A.; Dudek, M.; Aslam, F.; Joyklad, P. Computation of High-Performance Concrete Compressive Strength Using Standalone and Ensembled Machine Learning Techniques. Materials 2021, 14, 7034. https://doi.org/10.3390/ma14227034
Xu Y, Ahmad W, Ahmad A, Ostrowski KA, Dudek M, Aslam F, Joyklad P. Computation of High-Performance Concrete Compressive Strength Using Standalone and Ensembled Machine Learning Techniques. Materials. 2021; 14(22):7034. https://doi.org/10.3390/ma14227034
Chicago/Turabian StyleXu, Yue, Waqas Ahmad, Ayaz Ahmad, Krzysztof Adam Ostrowski, Marta Dudek, Fahid Aslam, and Panuwat Joyklad. 2021. "Computation of High-Performance Concrete Compressive Strength Using Standalone and Ensembled Machine Learning Techniques" Materials 14, no. 22: 7034. https://doi.org/10.3390/ma14227034