Article

Effects of Non-Stoichiometry on the Ground State of the Frustrated System Li0.8Ni0.6Sb0.4O2

by
Evgeniya Vavilova
1,
Timur Salikhov
1,
Margarita Iakovleva
1,2,
Tatyana Vasilchikova
3,
Elena Zvereva
3,†,
Igor Shukaev
4,
Vladimir Nalbandyan
4 and
Alexander Vasiliev
3,5,*
1
Zavoisky Physical-Technical Institute, FRC Kazan Scientific Center of RAS, 420029 Kazan, Russia
2
3rd Physics Institute, University of Stuttgart, 70569 Stuttgart, Germany
3
Faculty of Physics, Lomonosov Moscow State University, 119991 Moscow, Russia
4
Faculty of Chemistry, Southern Federal University, 344090 Rostov-on-Don, Russia
5
Quantum Functional Materials Laboratory, National University of Science and Technology “MISiS”, 119049 Moscow, Russia
*
Author to whom correspondence should be addressed.
Deceased.
Materials 2021, 14(22), 6785; https://doi.org/10.3390/ma14226785
Submission received: 30 September 2021 / Revised: 4 November 2021 / Accepted: 7 November 2021 / Published: 10 November 2021
(This article belongs to the Special Issue Synthesis, Structure and Properties of Metal Oxides)

Abstract

:
The non-stoichiometric system Li0.8Ni0.6Sb0.4O2 is a Li-deficient derivative of the zigzag honeycomb antiferromagnet Li3Ni2SbO6. Structural and magnetic properties of Li0.8Ni0.6Sb0.4O2 were studied by means of X-ray diffraction, magnetic susceptibility, specific heat, and nuclear magnetic resonance measurements. Powder X-ray diffraction data shows the formation of a new phase, which is Sb-enriched and Li-deficient with respect to the structurally honeycomb-ordered Li3Ni2SbO6. This structural modification manifests in a drastic change of the magnetic properties in comparison to the stoichiometric partner. Bulk static (dc) magnetic susceptibility measurements show an overall antiferromagnetic interaction (Θ = −4 K) between Ni2+ spins (S = 1), while dynamic (ac) susceptibility reveals a transition into a spin glass state at a freezing temperature TSG ~ 8 K. These results were supported by the absence of the λ-anomaly in the specific heat Cp(T) down to 2 K. Moreover, combination of the bulk static susceptibility, heat capacity and 7Li NMR studies indicates a complicated temperature transformation of the magnetic system. We observe a development of a cluster spin glass, where the Ising-like Ni2+ magnetic moments demonstrate a 2D correlated slow short-range dynamics already at 12 K, whereas the formation of 3D short range static ordered clusters occurs far below the spin-glass freezing temperature at T ~ 4 K as it can be seen from the 7Li NMR spectrum.

1. Introduction

A rich variety of chemical and physical properties of honeycomb systems due to their crystal structure and peculiarities of electronic bonds has attracted an active interest of researchers in recent years. A well-known example is graphene [1,2], which has shown its unique properties such as high electrical and thermal conductivity, strength, and hydrophobicity. The 4d and 5d systems [3] with specifically strong spin-orbit entanglement are known to host a plethora of emergent quantum phases, such as the Weyl semimetals and topological insulators, as well as Kitaev physics [4,5]. In 3d honeycomb systems, the spin-orbit coupling is typically weak; however, the combination of low-dimensional nature of the lattice, strong electronic correlations, and enhanced quantum fluctuations promote the exotic spin liquid states [6], Berezinskii-Kosterlitz-Thouless transition [7,8], and suppression of long-range magnetic order [9]. Moreover, even though the honeycomb lattice is not magnetically frustrated for nearest spins, the competition of exchange interaction may occur due to significant contribution of next-nearest and next-next-nearest exchange couplings. This might result in formation of non-trivial spin structures, such as zig-zag or stripe type [10]. The presence of disorder and structural defects in honeycomb lattice can significantly modify the ground state of the system, in particular, formation of magnetic clusters with a finite correlation length and finite magnetization at T > 0 is possible [11]. Combination of such structural defects with magnetic frustration can result in an elusive phenomenon called “order by disorder” [12], or, in the presence of large amount of randomness, in spin-glass state [13].
In layered frustrated magnets at intermediate doping levels when the number of defects is high enough to destroy the long-range homogeneity, but insufficient for the total destruction of the two dimensionality of the magnetic matrix and short-range correlations, spin glass is a quite puzzling phenomenon. First, the possibility of a spin-glass state with non-zero freezing temperature in quasi two-dimensional objects was long considered to be a controversial issue [14]. Second, a spin-glass phase induced by geometrical frustration and disorder can often behave like a quantum or classical spin liquid in various aspects [15,16]. Third, the temperature evolution of static phases and spin excitations in a wide region above and below the glass transition point is not typical for ordinary spin glass. In particular, spin dynamics possesses the 2D character and spins remain fluctuating deeply below the freezing temperature [15,17]. At the same time, the clusters with local magnetic ordering are observed experimentally [9,17,18,19] and predicted by Monte-Carlo calculations [20] at some conditions. Such a combination of the properties of 3D spin glasses, 2D AFM ordering, 2D fluctuating magnetic states in in layered frustrated magnets with triangle, honeycomb and kagome geometry is often referred to as an unconventional spin glass [17,19,21,22]. An understanding of the origins and conditions of such unconventional spin state and possible methods for tuning from it to spin liquid or Neel state with domains is an actual problem of frustrated magnetism both for fundamental knowledge and for future practical applications. At the same time, the number of experimental works devoted to a detailed study of such a state is relatively small. This motivated us to study a two-dimensional honeycomb S = 1 magnet with an intermediate, in the mentioned above sense, number of defects using a combination of bulk and local experimental techniques. This combination has proven to be effective for investigating unconventional spin glasses [17,23,24,25].
For this purpose, we have chosen the complex transition metal oxide compound Li0.8Ni0.6Sb0.4O2. It is a Li-deficient derivative of zig-zag antiferromagnet Li3Ni2SbO6, which has 2D structural order of magnetic Ni2+ (S = 1) ions on a honeycomb lattice with non-magnetic Sb in the middle, while honeycomb layers being separated by Li ions [26,27,28]. This layered structure promotes two-dimensional ionic mobility, which makes such compounds to be the promising cathode materials [29,30,31]. Indeed, in previous work [32] it was shown that onset of ion mobility in Li0.8Ni0.6Sb0.4O2 is observed at T > 250 K. As it was mentioned above, the presence of structural defects in honeycomb 3d oxides, including those caused by cation substitution, affect not only the ionic mobility, but also radically change the ground state of the magnetic system [31,33]. Present work is addressed to the comprehensive study of the structural modification induced by Li deficiency and its impact on magnetic properties and the ground state of Li0.8Ni0.6Sb0.4O2 system.
The paper is organized as follows: experimental techniques are summarized in Section 2, the results of structure characterization, heat capacity, ac and dc susceptibility and 7Li nuclear magnetic resonance (NMR) are presented in Section 3 and discussed in Section 4. Main conclusions of work are summarized in Section 5. Structural details are given in the Supplementary Materials.

2. Experimental

Ion-exchange preparation of the Li-deficient Li0.8Ni0.6Sb0.4O2 sample from its sodium counterpart was reported previously [32,34]. Solid-state syntheses were performed using reagent-grade antimonic acid, hydrous nickel oxide (both analyzed gravimetrically) and dried lithium carbonate. The weighed portions were mixed thoroughly, pressed, reacted at 1070 K and, after regrinding and pressing, at 1270 K for 3 h. All samples were pale-green—a definite sign of purely divalent nickel (Ni2+)—because even small admixtures of Ni3+ (<<1%) are known to result in dark coloration.
For the X-ray powder diffraction (XRD) phase analysis, ARL X’TRA diffractometer equipped with a solid state Si (Li) detector and copper Kα radiation was used.
Measurements of static and dynamic magnetic susceptibilities were performed by means of a Quantum Design Magnetic Property Measurement System (MPMS) XL-7 magnetometer from Quantum Design. The temperature dependence of the static magnetic susceptibility was obtained at the magnetic field of B = 0.7 T in the temperature range 2–350 K. The ac susceptibility was measured at 2 < T < 25 K at frequencies 5, 59, 279 and 498 Hz. The dc field was not applied.
The specific heat measurements were carried out by a relaxation method using a Physical Property Measurement System (PPMS) system by Quantum Design, USA. The plate-shaped sample was obtained by cold pressing of the polycrystalline powder. Data were collected at zero magnetic field in the temperature range 2–210 K and under applied fields of 3, 6 and 9 T in the temperature range 2–30 K.
Nuclear magnetic resonance experiments were carried out using Redstone solid-state pulse spectrometer by Tecmag and resistive 0–1.5 T magnet by Bruker at the frequency 12 MHz. The NMR signals were observed on 7Li nuclei with spin I = 3/2 and gyromagnetic ratio γ = 16.546 MHz/T. The NMR spectra were obtained at a fixed frequency by step-by-step sweeping the field and integrating the solid-echo signal at each field point. 7Li longitudinal relaxation rate T1−1 was measured using a stimulated echo pulse sequence and 7Li transverse relaxation rate T2−1 was obtained by measuring the solid-echo integral as a function of τ, where τ is time between two π/2 pulses. Both relaxation rates were measured on the maximum of spectral intensity at each temperature.

3. Results

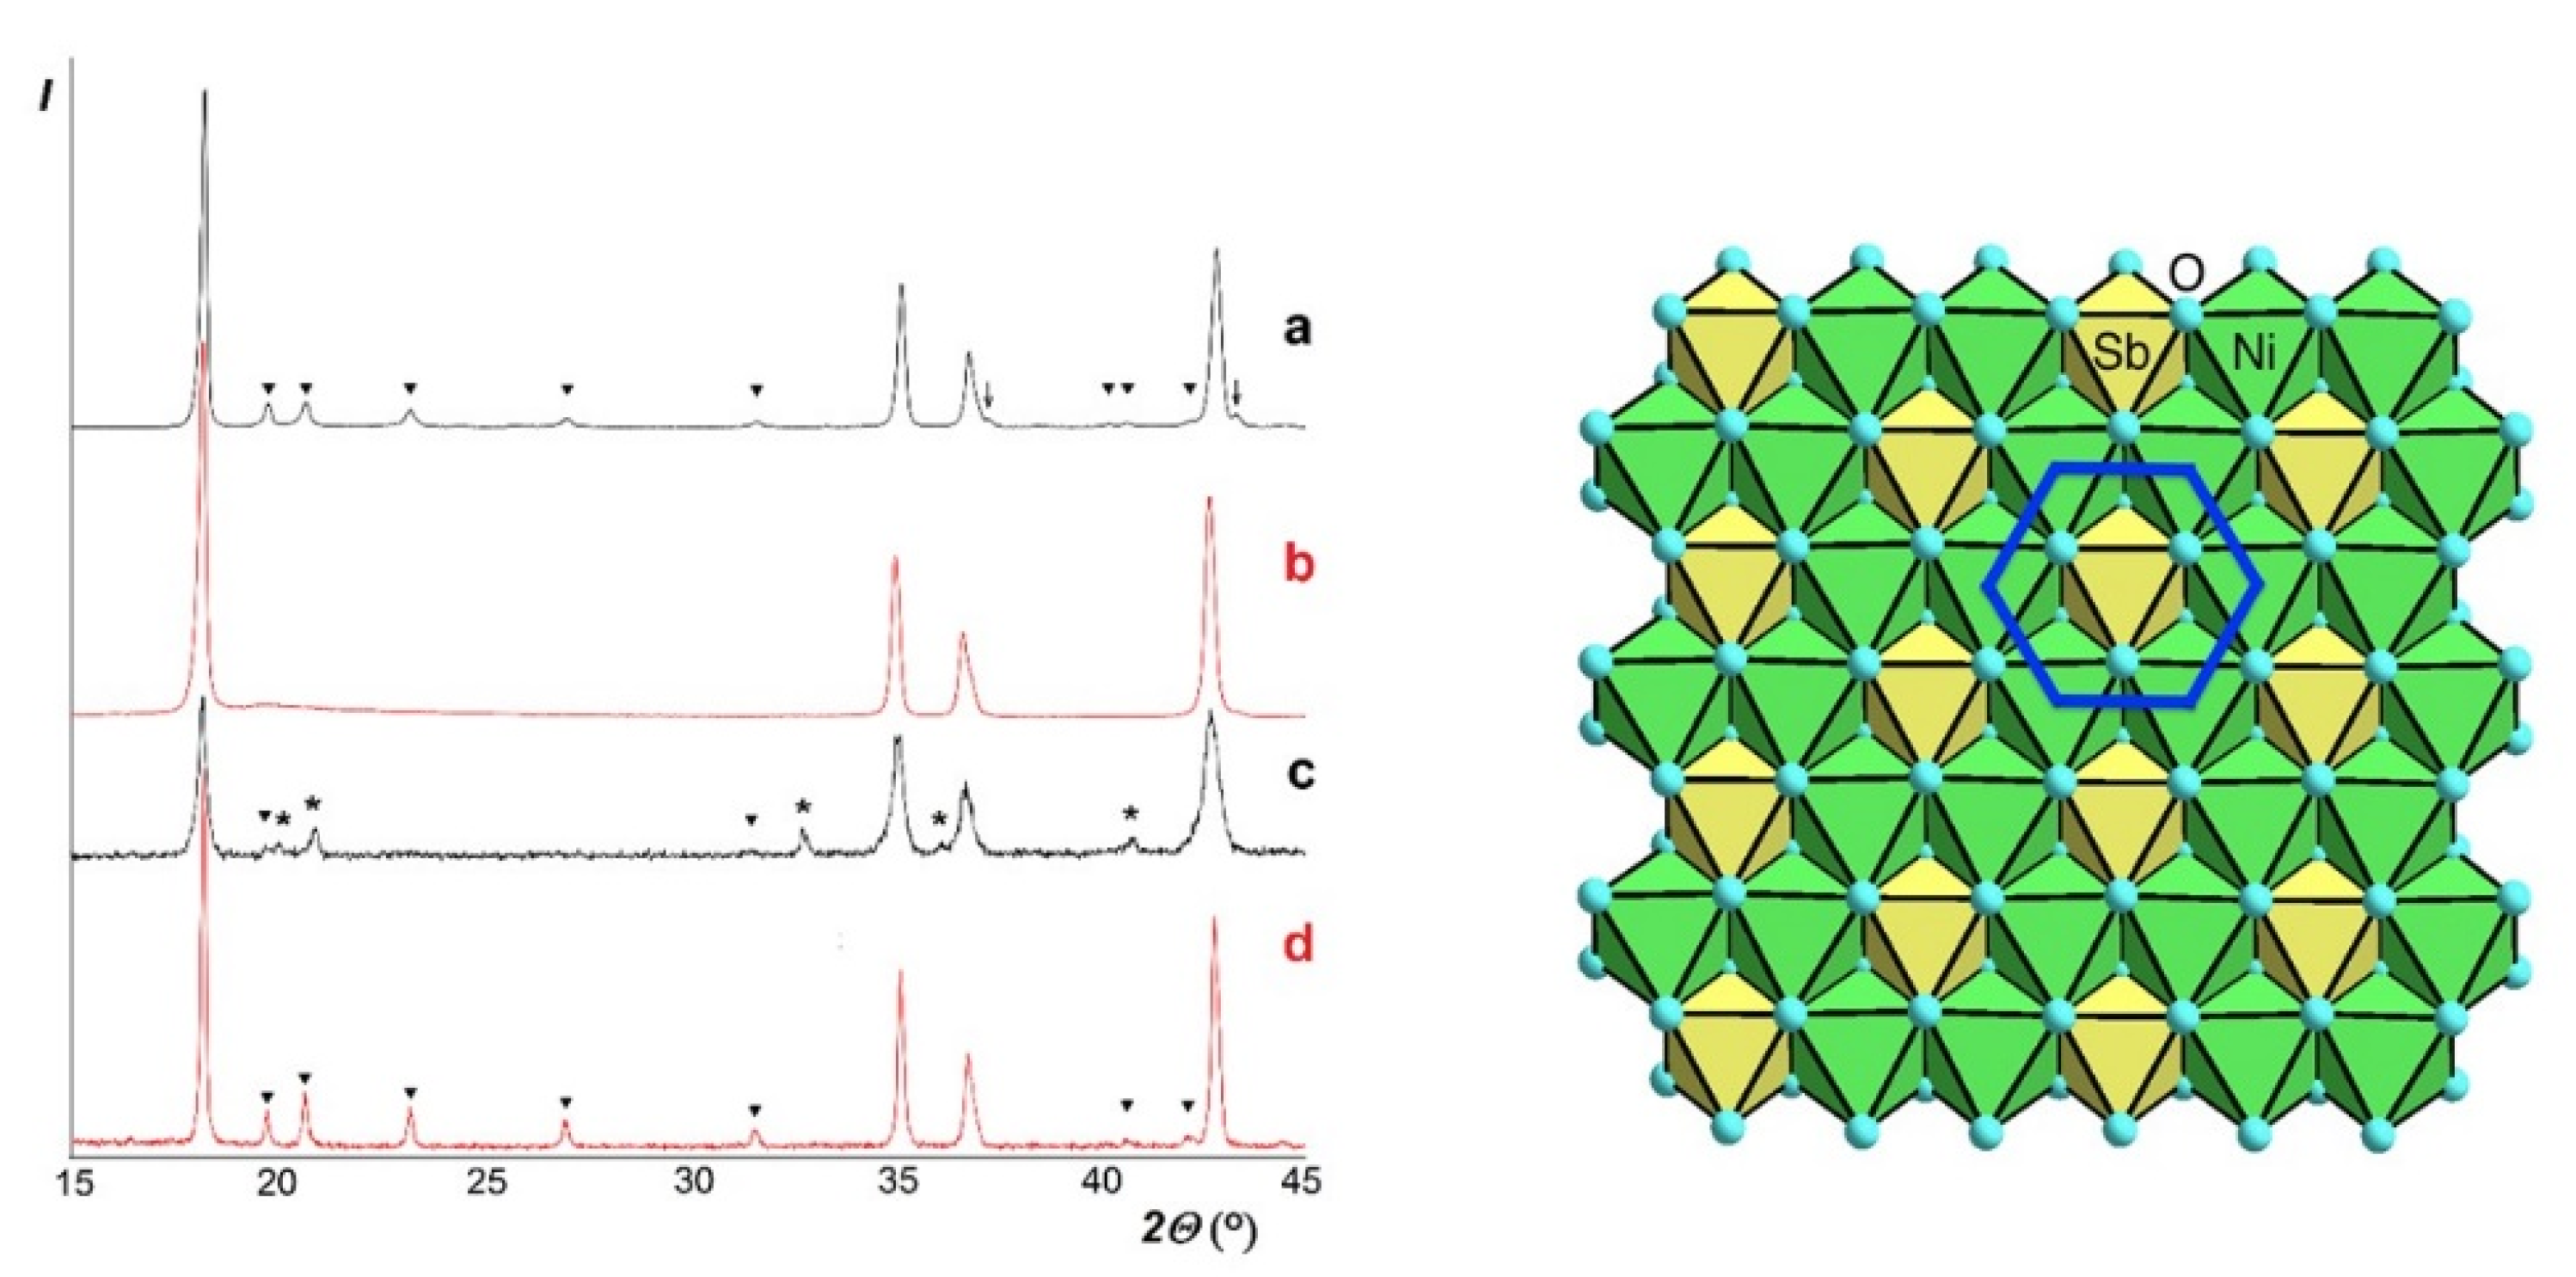
3.1. Chemisrty and Phase Relations

The completely filled stoichiometric analogue, Li3Ni2SbO6 [26] showed distinct superlattice reflections characteristic of the honeycomb ordering of Ni and Sb (Figure 1a). Its pseudo-trigonal crystal structure was determined as monoclinic with lattice parameters listed in Table 1. In contrast, its lithium-deficient derivative, Li0.8Ni0.6Sb0.4O2 [32,34], only showed elevated background in place of superlattice peaks at 2θ ≈ 19–24° (Figure 1b). Therefore, its crystal structure was refined as truly trigonal (rhombohedral) with disordered Ni/Sb distribution over the same Wyckoff position. In addition, an 8% Li/Ni site inversion was detected, similar to Li3Cu2SbO6 [35] and opposite to Li3Ni2SbO6 [26]. However, other structural details, including lattice parameters, bond lengths and R-factors were not reported in our previous publication [32]. Therefore, they are reported here (see Supplementary Information, Figure S1 and Tables S1–S3).
Because of considerable difference in oxidation states and ionic radii between Ni2+ and Sb5+, we suppose that their local order should exist, as supported by the above-mentioned elevated background. Therefore, to facilitate comparison with the ordered counterpart, we recalculated its rhombohedral (hexagonal) lattice parameters to the monoclinic superlattice setting (Table 1).
The cation deficiency results in ca. 1% volume expansion. It is a typical feature of layered phases. However, it is usually only due to increase in the interlayer spacing whereas rigid octahedral layers contract because of decrease in average radius of octahedral cations: here, Sb5+ substituting for Ni2+. In the present case, however, the lattice expands in all directions. Supposedly, this is due to simultaneous Li1+ substitution for Ni2+. As mentioned previously [32], Li0.8Ni0.6Sb0.4O2 could not be prepared by direct high-temperature synthesis. Moreover, when prepared by the low-temperature ion exchange and heated at 1270 K for just 30 min, Li0.8Ni0.6Sb0.4O2 decomposed showing appearance of superlattice reflections and a second phase, LiSbO3 (Figure 1c). This superlattice phase is not Li3Ni2SbO6 since in this case there should be NiSb2O6, not found experimentally. Therefore, it was concluded that the decomposing reaction can be expressed by the following equation: 3Li0.8Ni0.6Sb0.4O2 = 0.4 LiSbO3 + 0.8 Li2.5Ni2.25SbO6. The composition with y = 0.2, Li2.6Ni2.2SbO6 synthesized by solid-state reactions at 1070 and 1270 K (Figure 1d), was found to be a single-phase superlattice similar to that obtained by calcination of Li0.8Ni0.6Sb0.4O2 (“Li2.4Ni1.8Sb1.2O6”) (Figure 1c). Its refined monoclinic parameters are: a = 5.1809 (4) Å, b = 8.9759 (3) Å, c = 5.1598 (4) Å, β = 109.580 (2)°, close to those of Li3Ni2SbO6 (see Table 1).

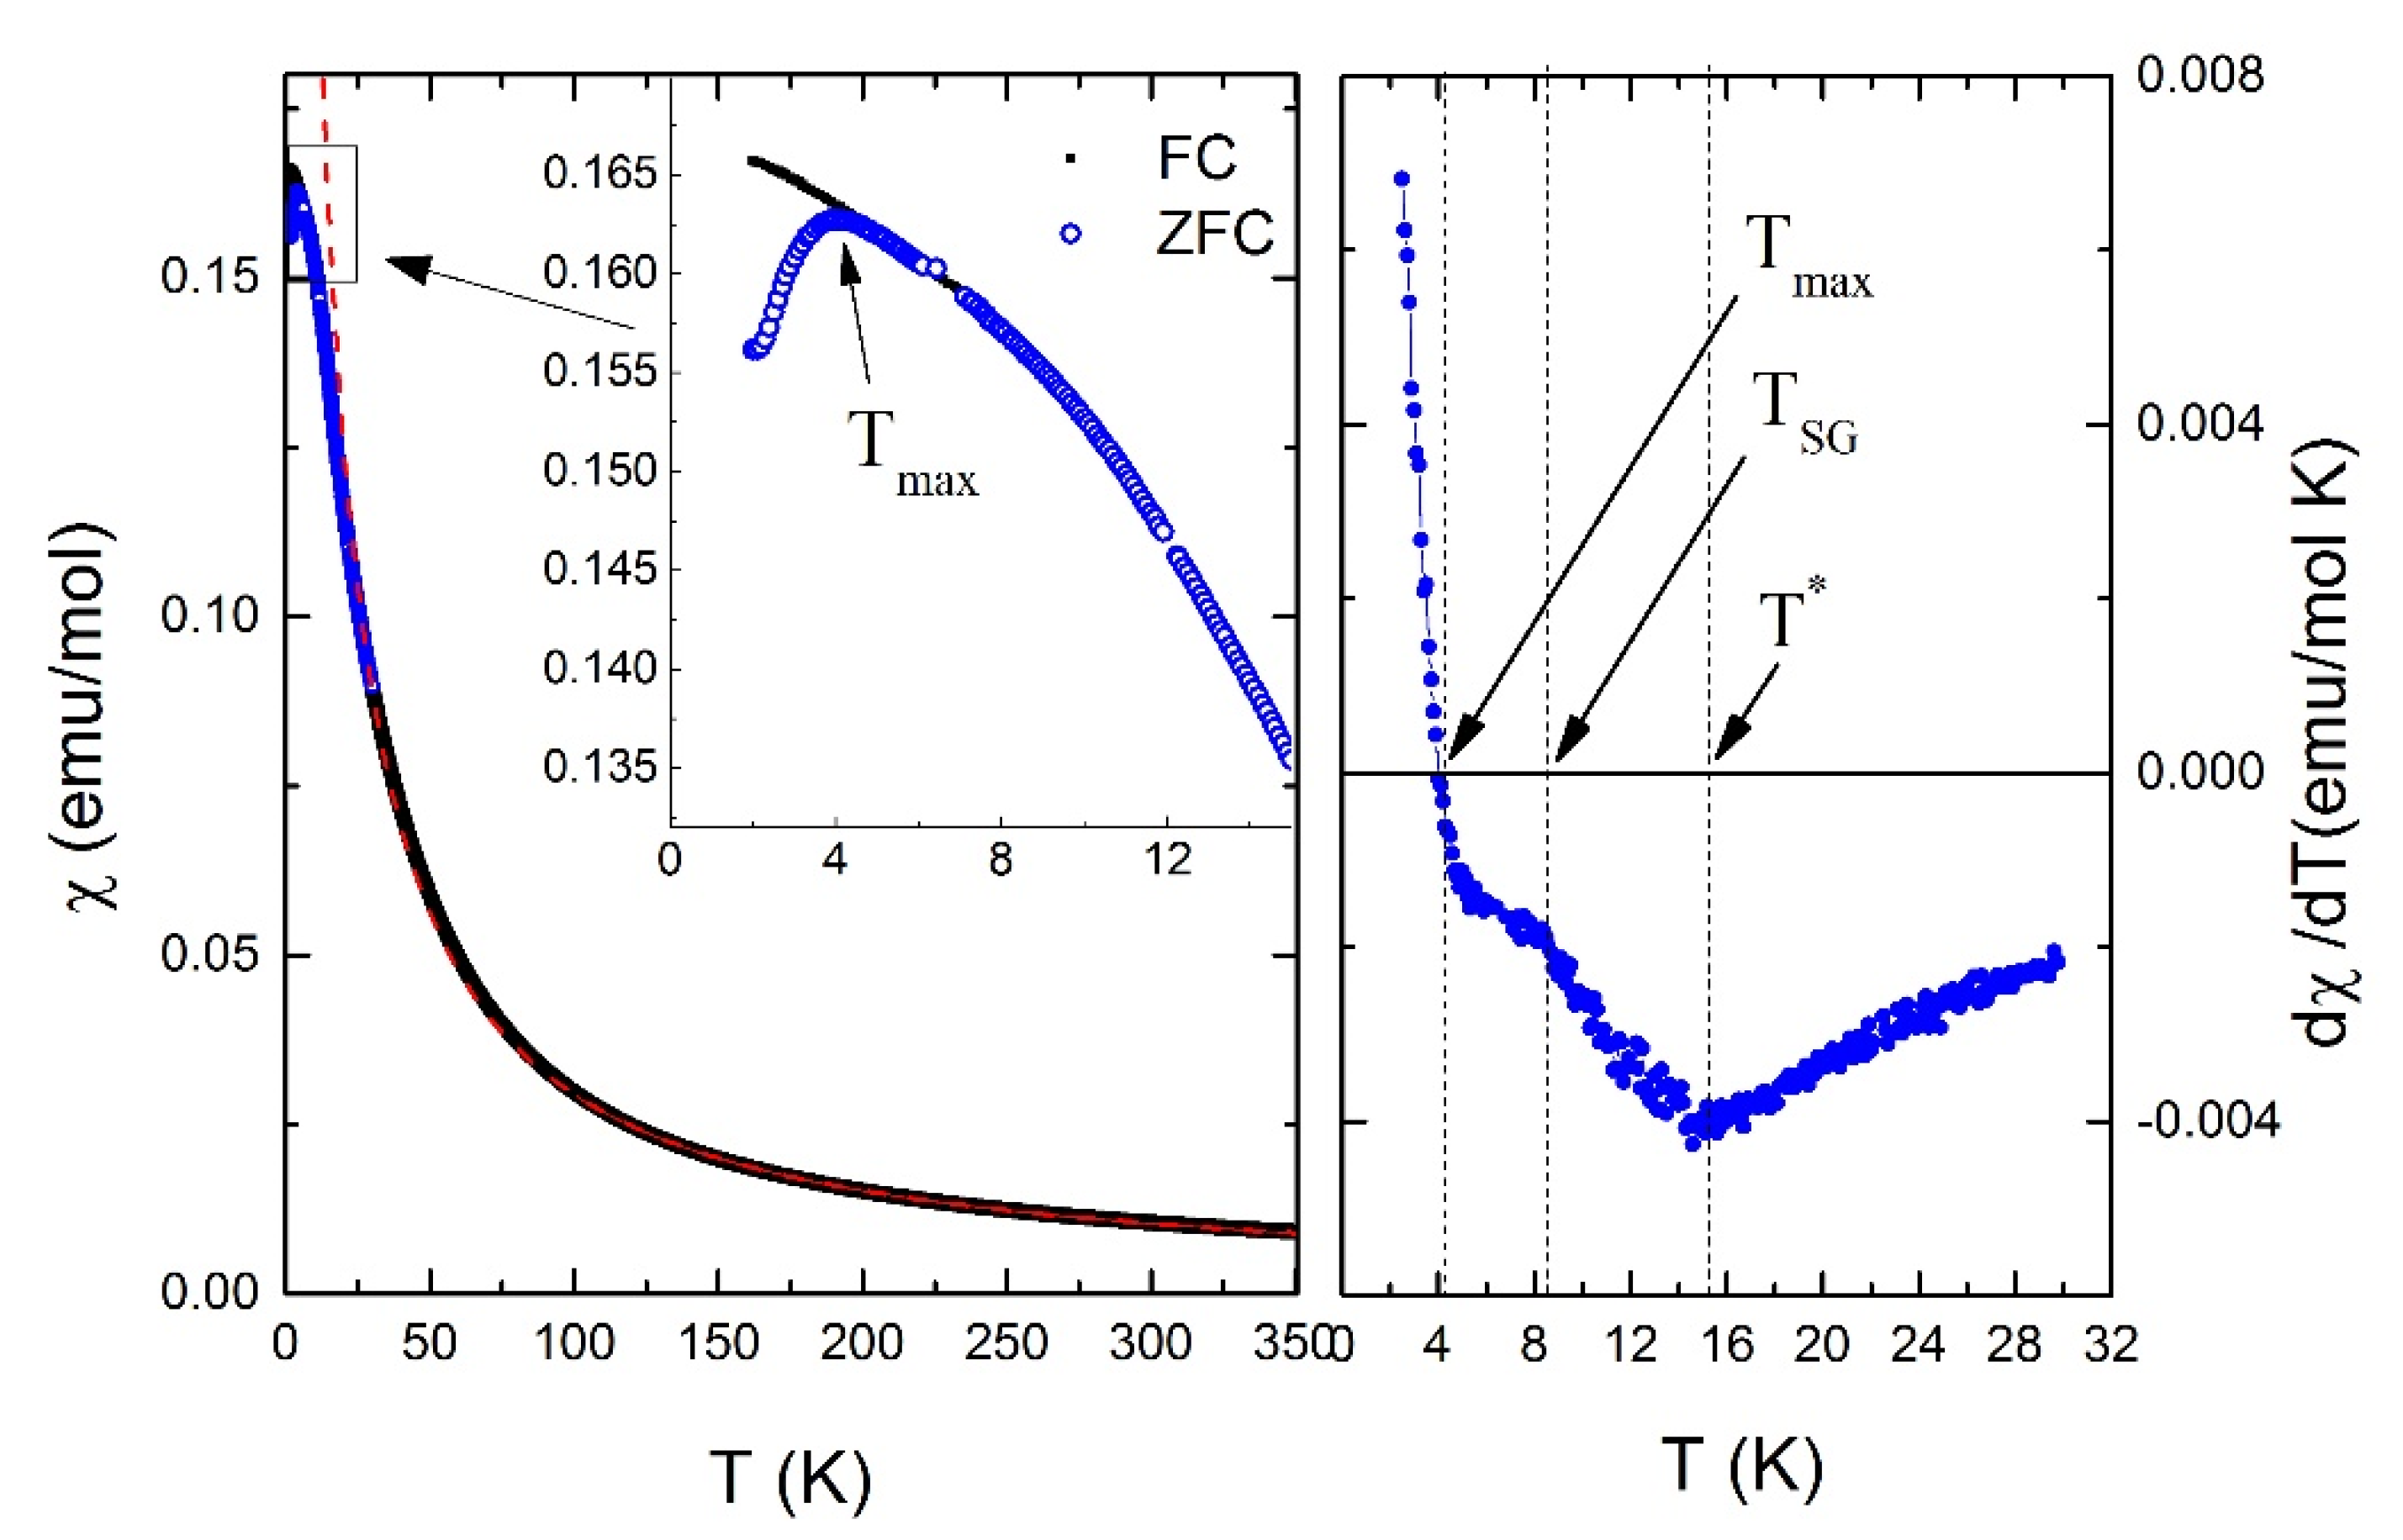
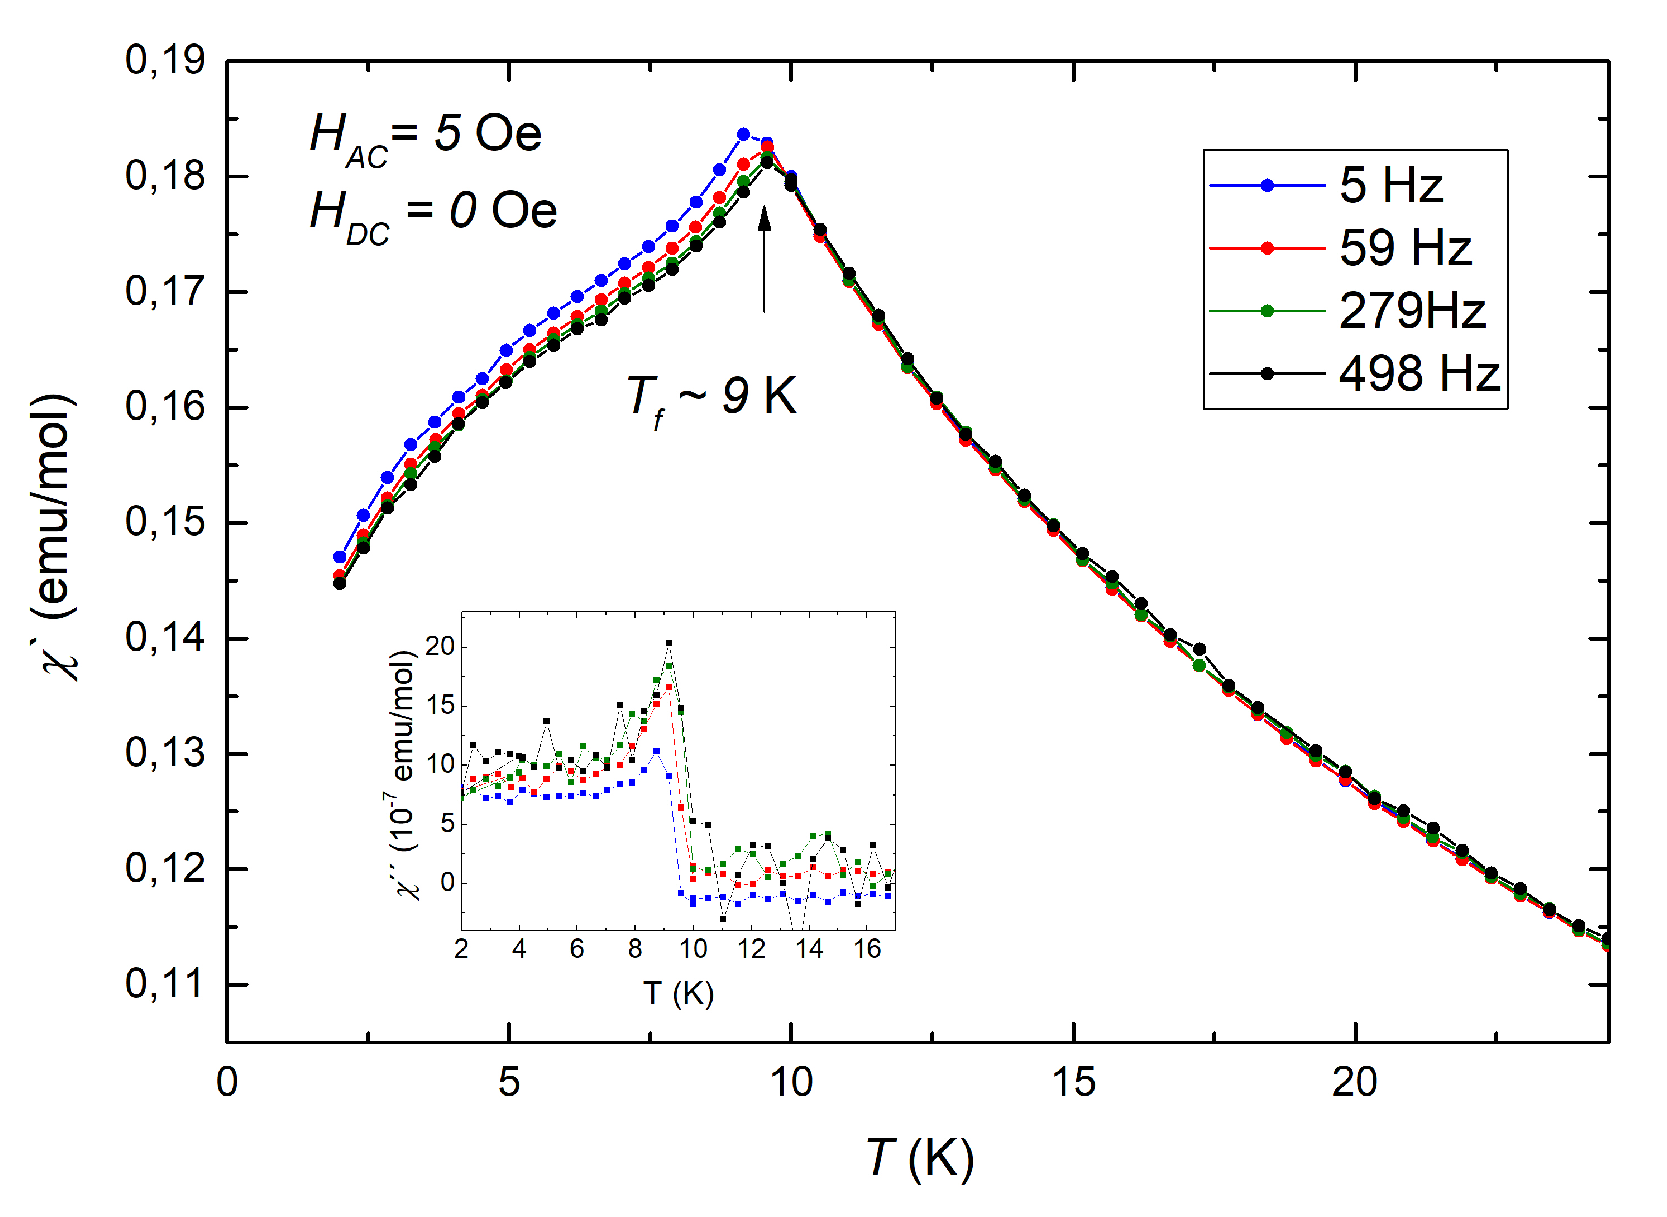
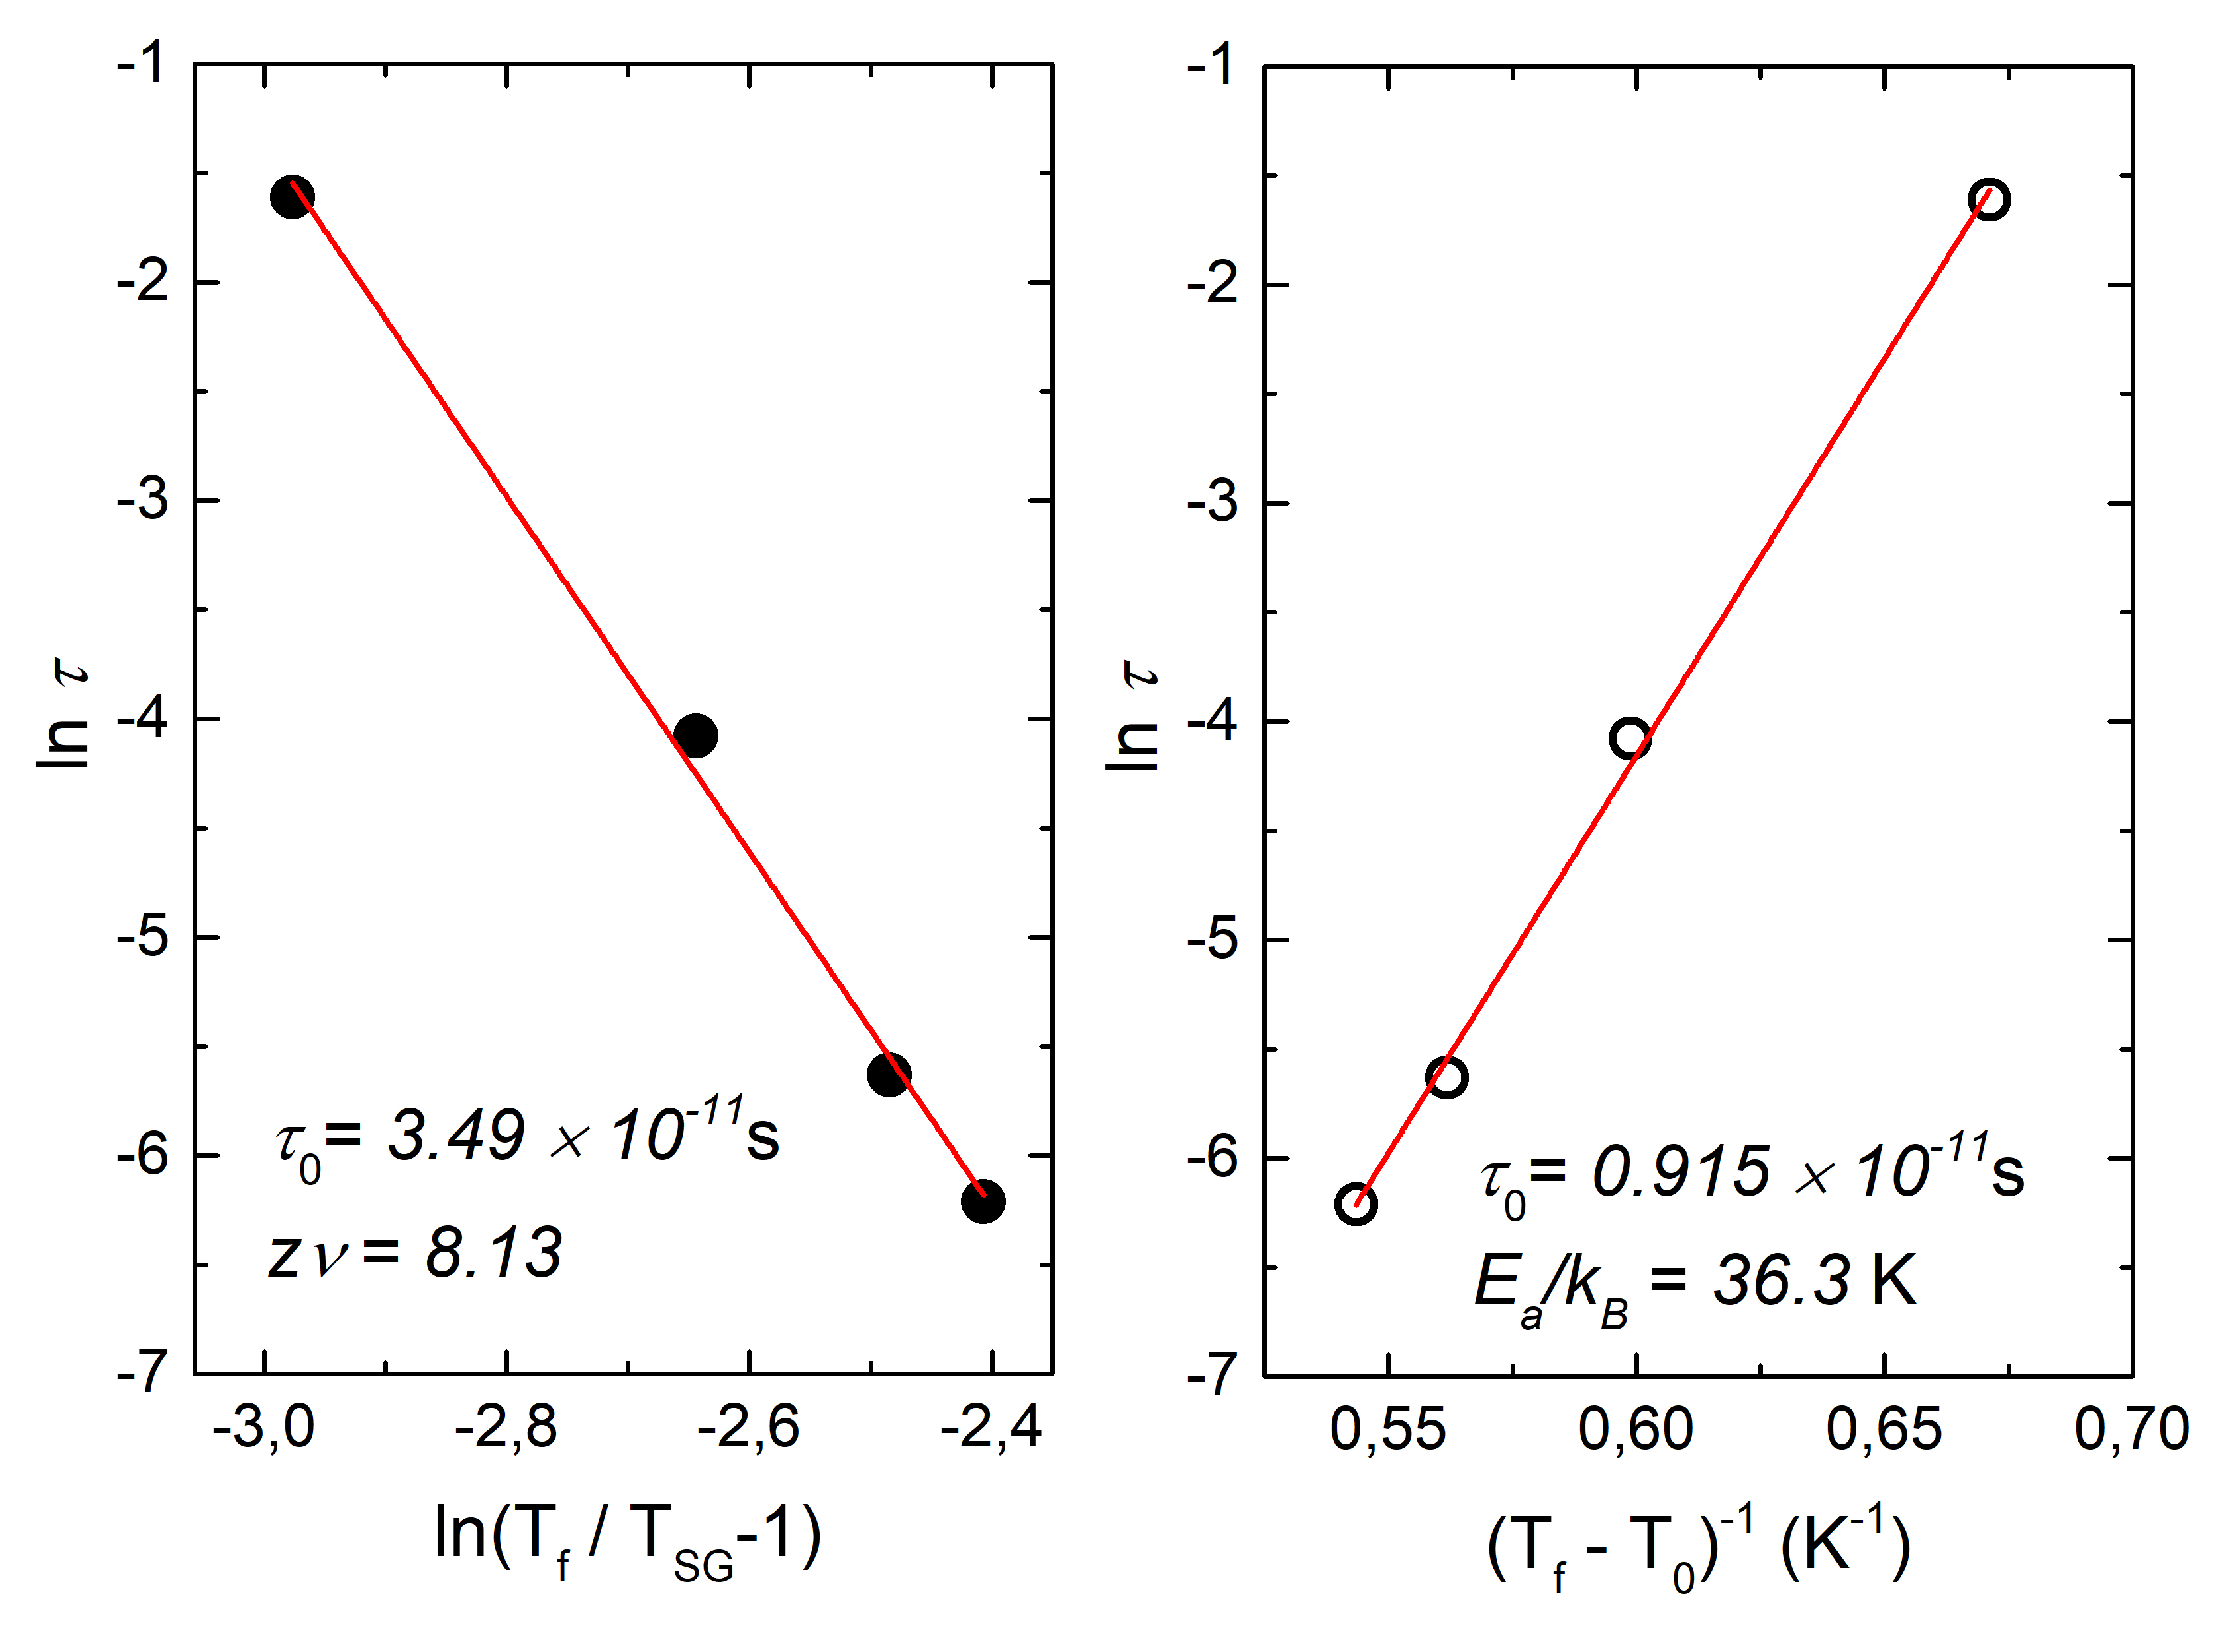
3.2. Magnetic Properties

The temperature-dependent bulk magnetic susceptibility χ of Li2.4Ni1.8Sb1.2O6 measured at B = 0.7 T is presented in Figure 2. As it was shown in previous work [32], the approximation of the high-temperature part of χ by Curie-Weiss law χ = C/(TΘ) (C is a Curie constant) leads to the Weiss temperature Θ = −4 K. This temperature is comparable to stoichiometric compound Li3Ni2SbO6, where θ is 8 K and positive. This indicates that the magnetic interactions in the Li-deficient compound Li2.4Ni1.8Sb1.2O6 are predominantly of antiferromagnetic nature. Remarkably, the magnetic susceptibility χ deviates from the Curie-Weiss law at temperatures below 75 K, which indicates the onset of strong correlation effects. Moreover, in the low-temperature region, several features can be distinguished, where the curve changes its shape drastically (see dχ/dT in Figure 2, right panel): these temperatures are T* ≈ 12 K, TSG ≈ 8 K and a wide maximum at Tmax = 4 K. No sharp peak typical for magnetic transition to long-range AFM order is observed.
Notably, the bifurcation between the zero-field cooled (ZFC) and field-cooled (FC) branches appears below 8 K and becomes pronounced in the vicinity of 4 K. This divergence of FC and ZFC regimes is a characteristic hallmark of spin glasses—magnetically frustrated systems with a multidegenerate ground state [13]. In these systems, the spins order in a random, non-coplanar manner below the freezing temperature. In contrast to ferro- and antiferromagnets, spin glasses are characterized by the presence of short-range order but lack of long-range periodicity. The FC mode breaks the random distribution of the local magnetization direction and promotes freezing of spins in a predominantly in-field orientation, which leads to an increase in the bulk magnetization with decreasing temperature. In our experiment, the total magnetization continues to grow below the point of divergence even in the ZFC mode, showing a pronounced maximum only at half the freezing temperature that is unusual for classical spin glasses.
At the same time, it is well known that the magnetization in the freezing phase is strongly dependent on the time factor and the conditions for switching on a small external field required for measurements. These phenomena are the reason that a more informative and unambiguous method for studying spin glasses is to measure not the DC but the AC susceptibility. Therefore, to access a higher sensitivity to the magnetic transition, the ac susceptibility was measured at different frequencies with small driving field (Hac = 5 Oe). The real part of the ac susceptibility χ′ (dispersion) exhibits a sharp cusp, as can be seen in Figure 3. At the same time, the imaginary part χ″ (absorption) associated with dissipative processes exhibits a step-like increase, which is typical for spin glass (lower inset in Figure 3) and excludes the case of the disordered AFM systems, where the value of χ″ is constant and remains zero below the transition temperature [36].
As expected for the spin glass systems, the position of maximum of χ′(T) which is called freezing temperature Tf shifts to higher temperatures as observation frequency is increased. This shift can be described by different empirical models, namely critical scaling approach (i) and Vogel-Fulcher law (ii):
i   τ = τ 0   T f T S G 1 z ν i i   τ = τ 0 exp E A k B T f T o
Here, kB is the Boltzmann constant; the spin relaxation time τ0, the activation energy EA, the spin freezing temperature on static limit TSG, a characteristic temperature of inter-spin or inter-cluster interactions T0 and dynamical critical exponent are fitting parameters. The freezing temperature Tf and the relaxation time τ (inversed AC-frequency) are determined from the experiment. Both models fit the experimental data reasonably well (see Figure 4) with parameters listed in Table 2. Obtained spin correlation times are of the order of 10−11 s, this value is at the border of the range of magnitudes typical for the canonical spin glasses (10−10–10−14 s [37]) and cluster spin glass, which demonstrates slower collective spin dynamics.
The typical activation energy EA/kB ~ 2 T0 values found for a canonical spin-glass CuMn [38], ~1.25 T0 for a geometrically frustrated system CaBaFe4O7 [39], however for cluster systems EA/kB is quite large: ~12 T0 for Li-doped CaBaFe4−xLixO7 (x = 0.4) [39], ~3.1 T0 for U2CuSi3 [40] and ~7 T0 for La0.5Sr0.5CoO3 [41]. In our case, EA/kB ~ 4 T0 and from this we can infer that for Li2.4Ni1.8Sb1.2O6 is close to being a cluster spin-glass.
The critical exponent value obtained for critical scaling is 8.13 ± 0.33, which also belongs to the range between 4 and 13 that is usually observed in spin glass materials [37]. Moreover, it is intimately close to the theoretically predicted value of 9.3 for 3D spin glass [42,43].

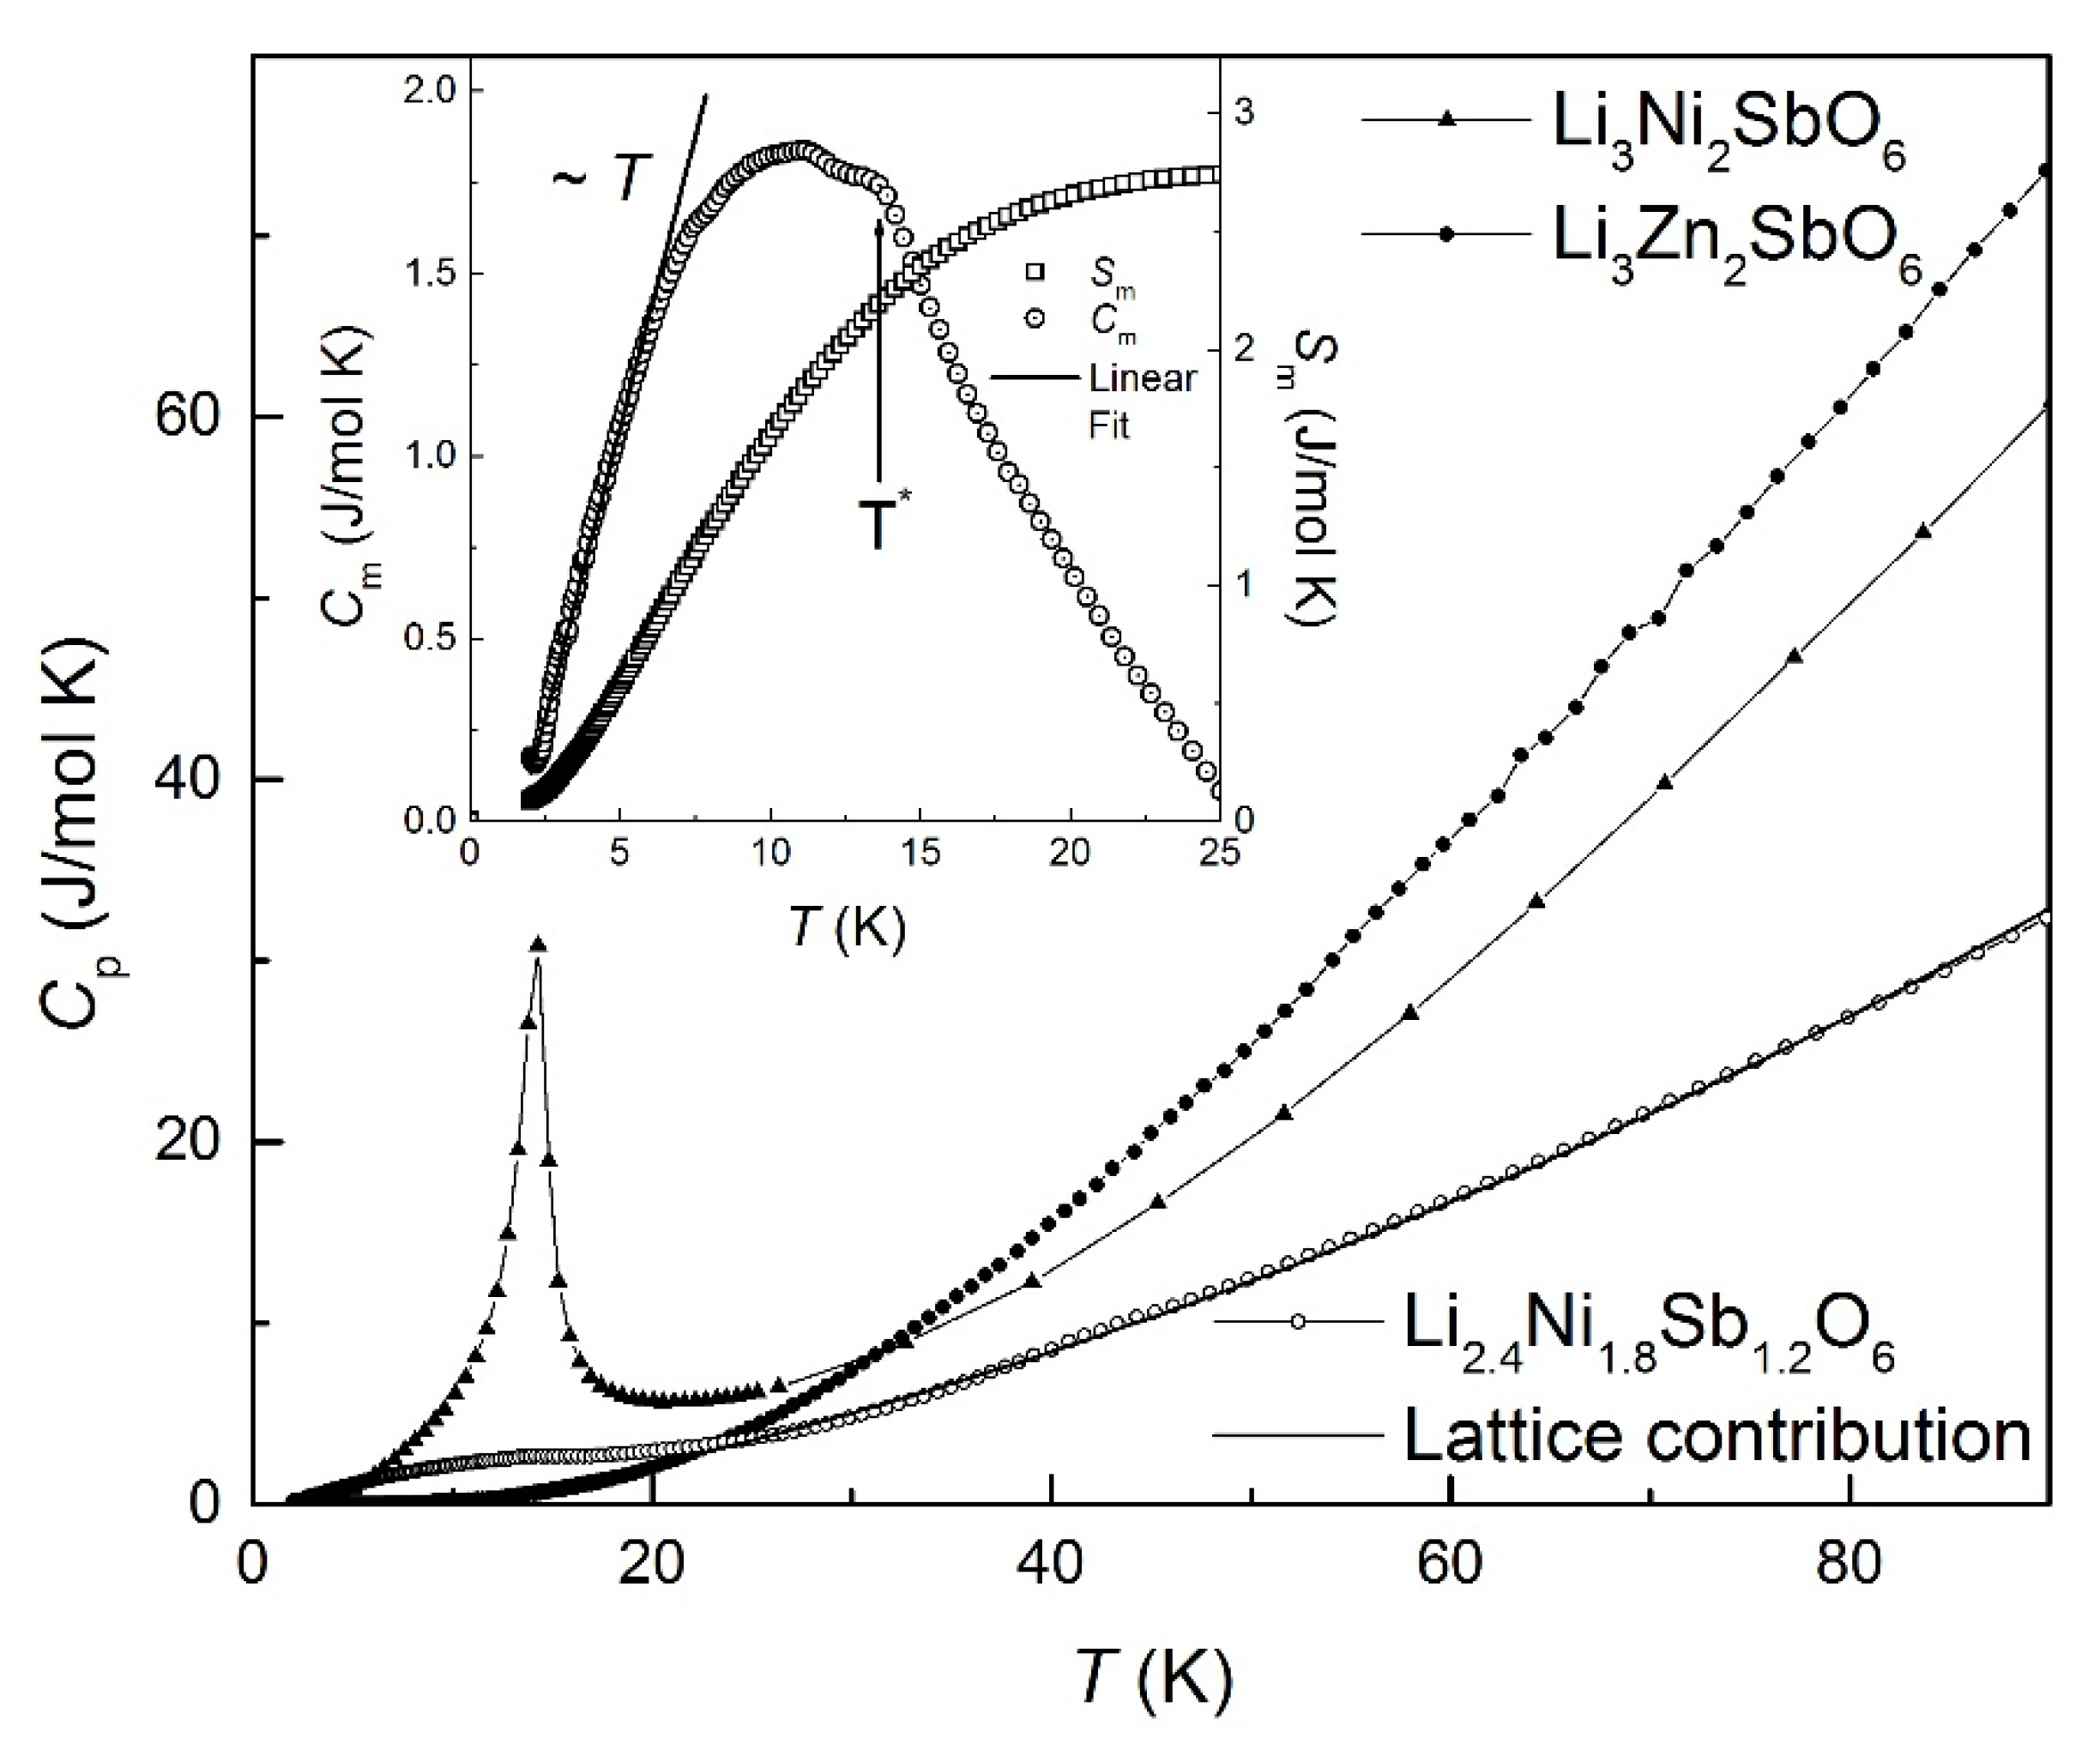
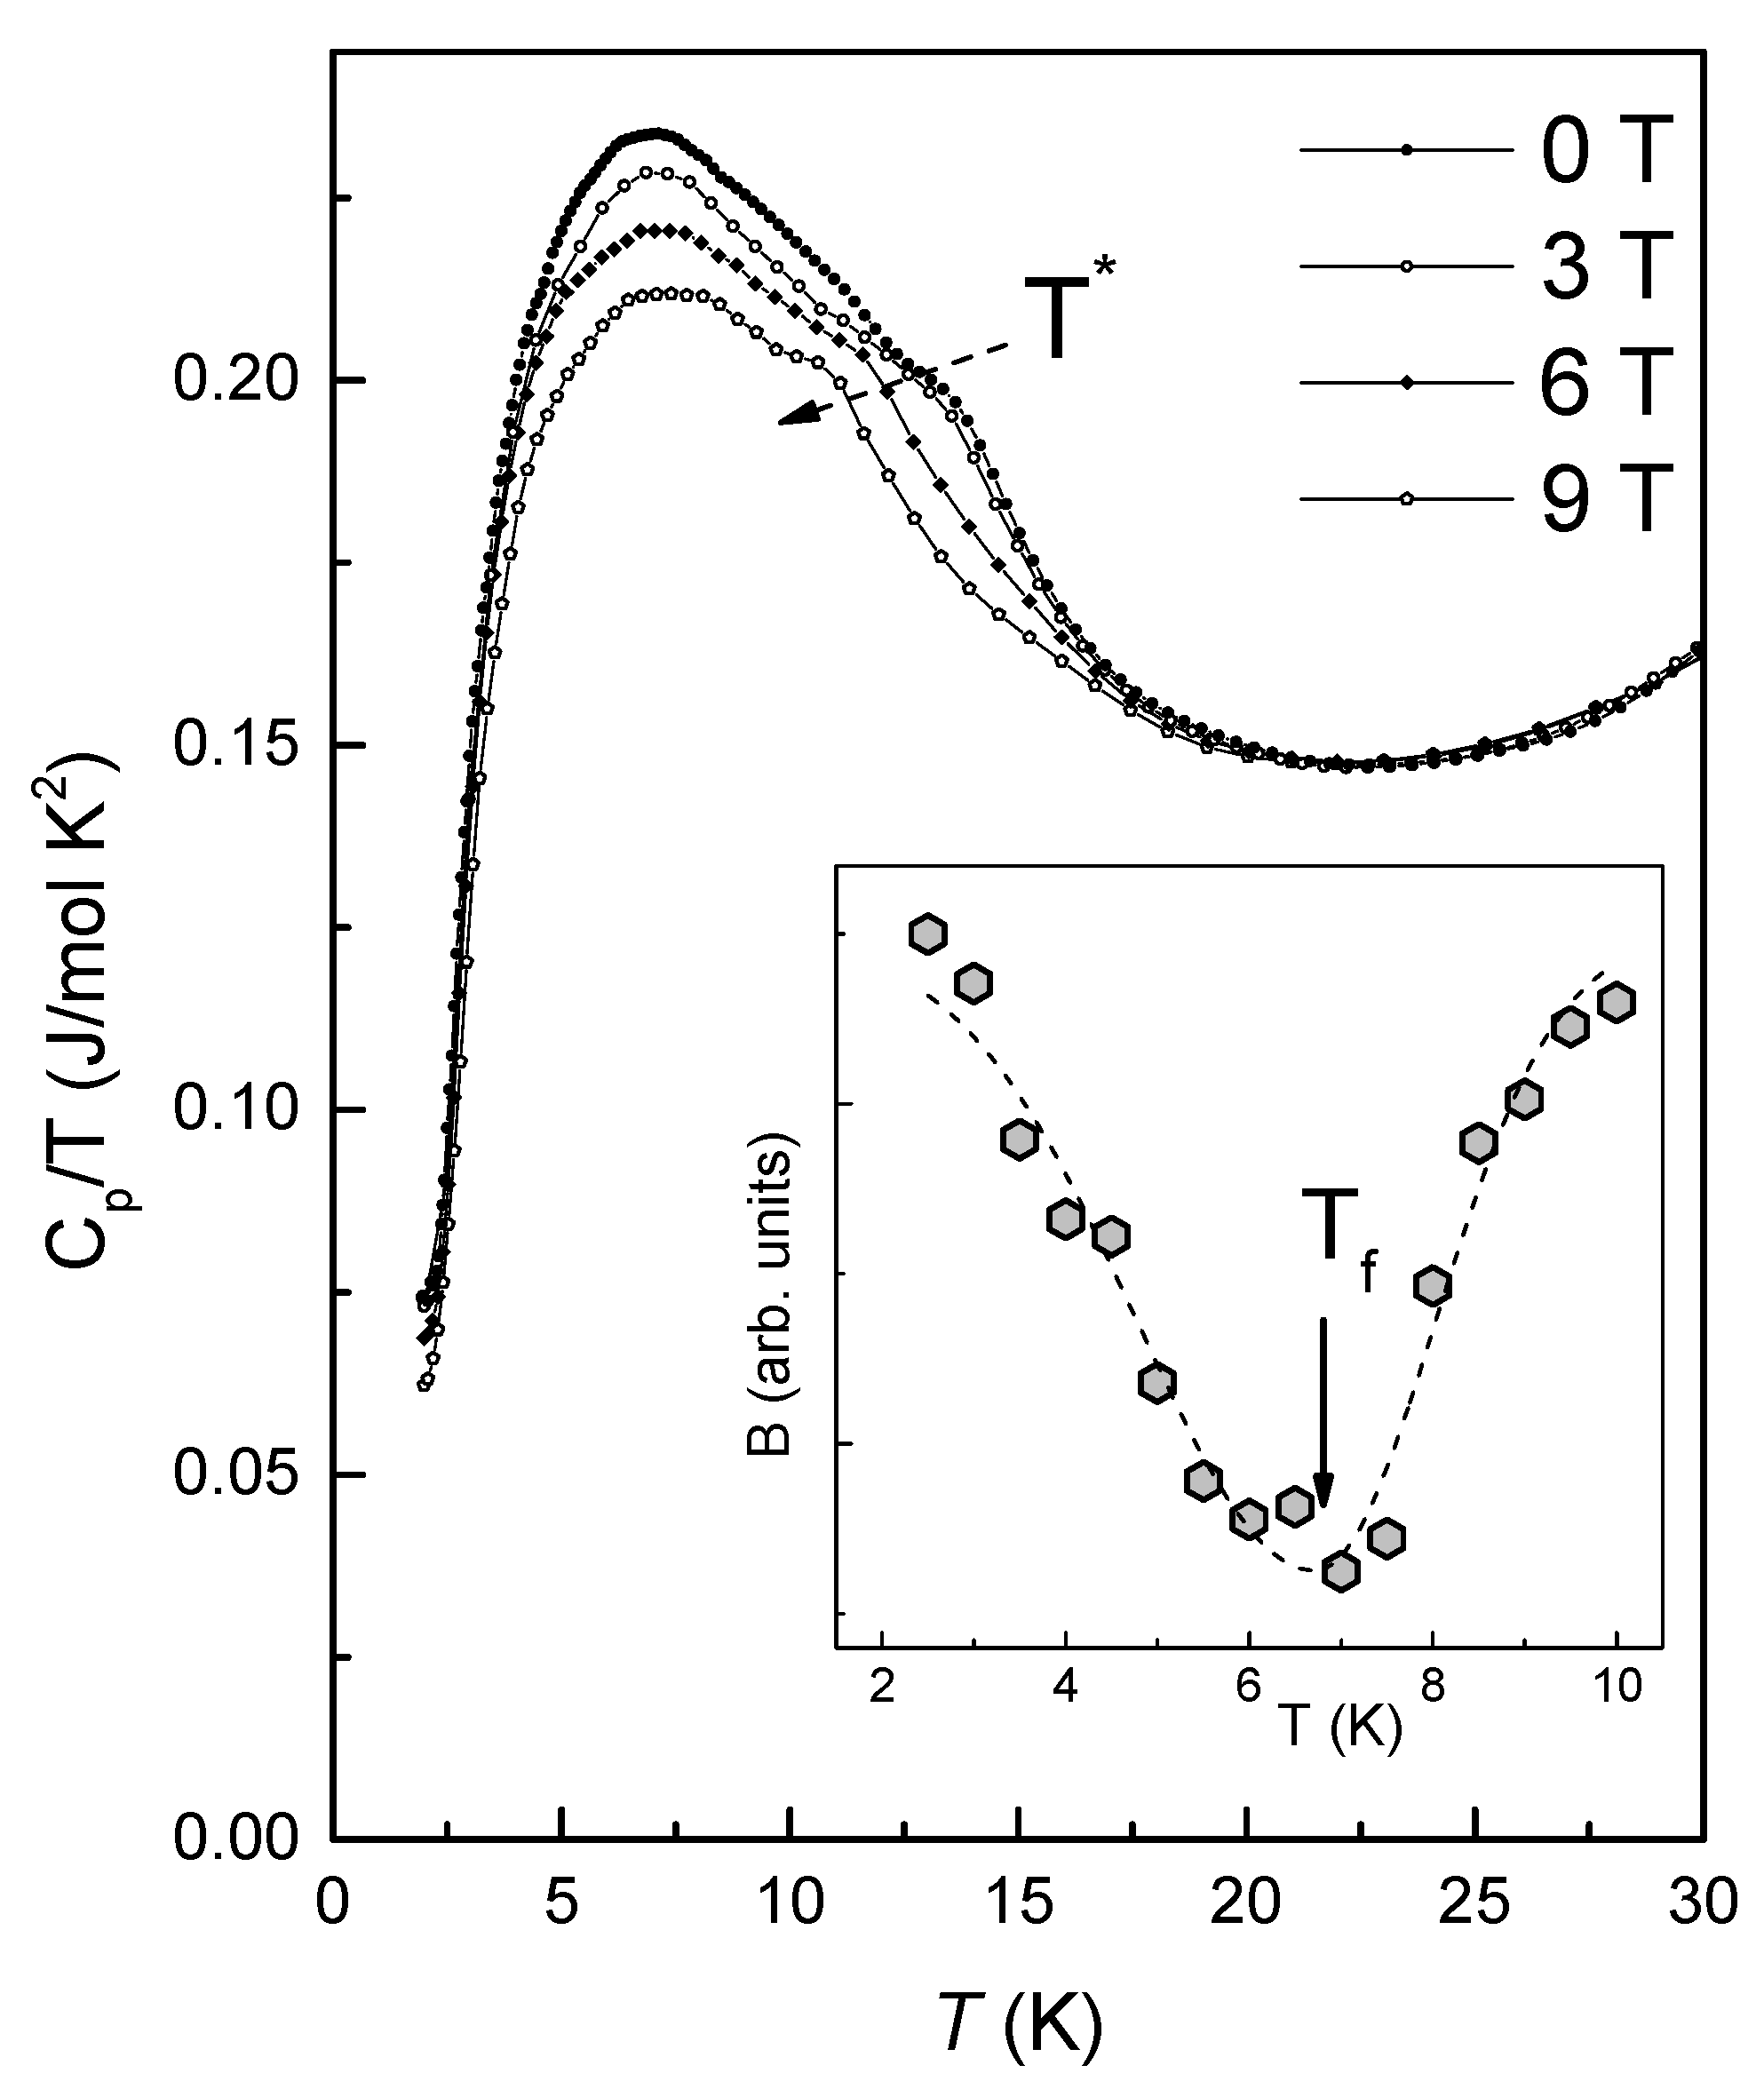
3.3. Specific Heat Study

The temperature dependences of specific heat Cp(T) of Li3Ni2SbO6 and Li2.4Ni1.8Sb1.2O6 systems are depicted in Figure 5. For undoped compound, in zero magnetic field, the Cp(T) demonstrates a distinct λ-shaped anomaly at TN ≈ 14 K, which is associated with Neel type 3D long-range magnetic order [26]. In contrast, in Li2.4Ni1.8Sb1.2O6 there is no apparent specific heat peak, but the broad maximum is observed in the region where magnetic susceptibility measurements reveal a spin-glass signature near 8 K. The lack of the λ-point in Cp(T) is exactly one of the features for spin glass phase transition [13], owing to the much-released entropy above TSG.
The magnetic contribution to the specific heat Cm(T) was determined by subtracting the lattice contribution using the data for the non-magnetic Li3Zn2SbO6. We assumed that this compound is reasonably isostructural to Li2.4Ni1.8Sb1.2O6 and can be used for an estimation of the pure lattice counterpart Clat(T) of the specific heat. Besides, we applied the standard scaling procedure [44] to the Cp(T) data for Li2.4Ni1.8Sb1.2O6 and Li3Zn2SbO6.
The obtained magnetic part Cm(T) (inset on Figure 5) demonstrates a rather broad hump, centered at T ≈ 10 K. Its amplitude, however, is significantly lower than ΔCtheor = 29.9 J/mol K, expected from the mean field theory for n = 1.8 of Ni2+ (S = 1) ions [45]:
Δ C t h e o r = n · 5 R   S S + 1 S 2 + S + 1 2
In addition, one can see the slight shoulder at about T* = 14 K, which is satisfactory agrees with anomaly at susceptibility data (see Figure 2). The magnetic entropy Sm(T) is also lower than the theoretical estimation ΔStheor = nRln(2S + 1) = 16.4 J/mol K [45], which confirms that most of the available entropy is already lost above Tf. It is worth noting that, in Li2.4Ni1.8Sb1.2O6, low temperature dependence of Cm is linear and can be considered as a sign of spin glass behavior [28,46,47].
The temperature dependencies of specific heat Cp(T) under external magnetic field clearly demonstrate the presence of the humps at T* (Figure 6). Moreover, this anomaly is field-sensitive, denoting to its antiferromagnetically ordering nature. The broad maximum on Cp(T), located at around 7 K, probably can be attributed to the spin glass phase transition. For more accurate analysis of Tf position we used approach, suggested by Brodale et al. [48]. From a sequential parabolic approximation Cp(H) = A + BH2 of the specific heat in the temperature range 2 K to 10 K one can obtain the T-dependence of parameter B (inset in Figure 6). The found minimum at T ~ 7 K indicates this as the temperature of the spin-glass transition TSG of Li2.4Ni1.8Sb1.2O6.

3.4. Nuclear Magnetic Resonance

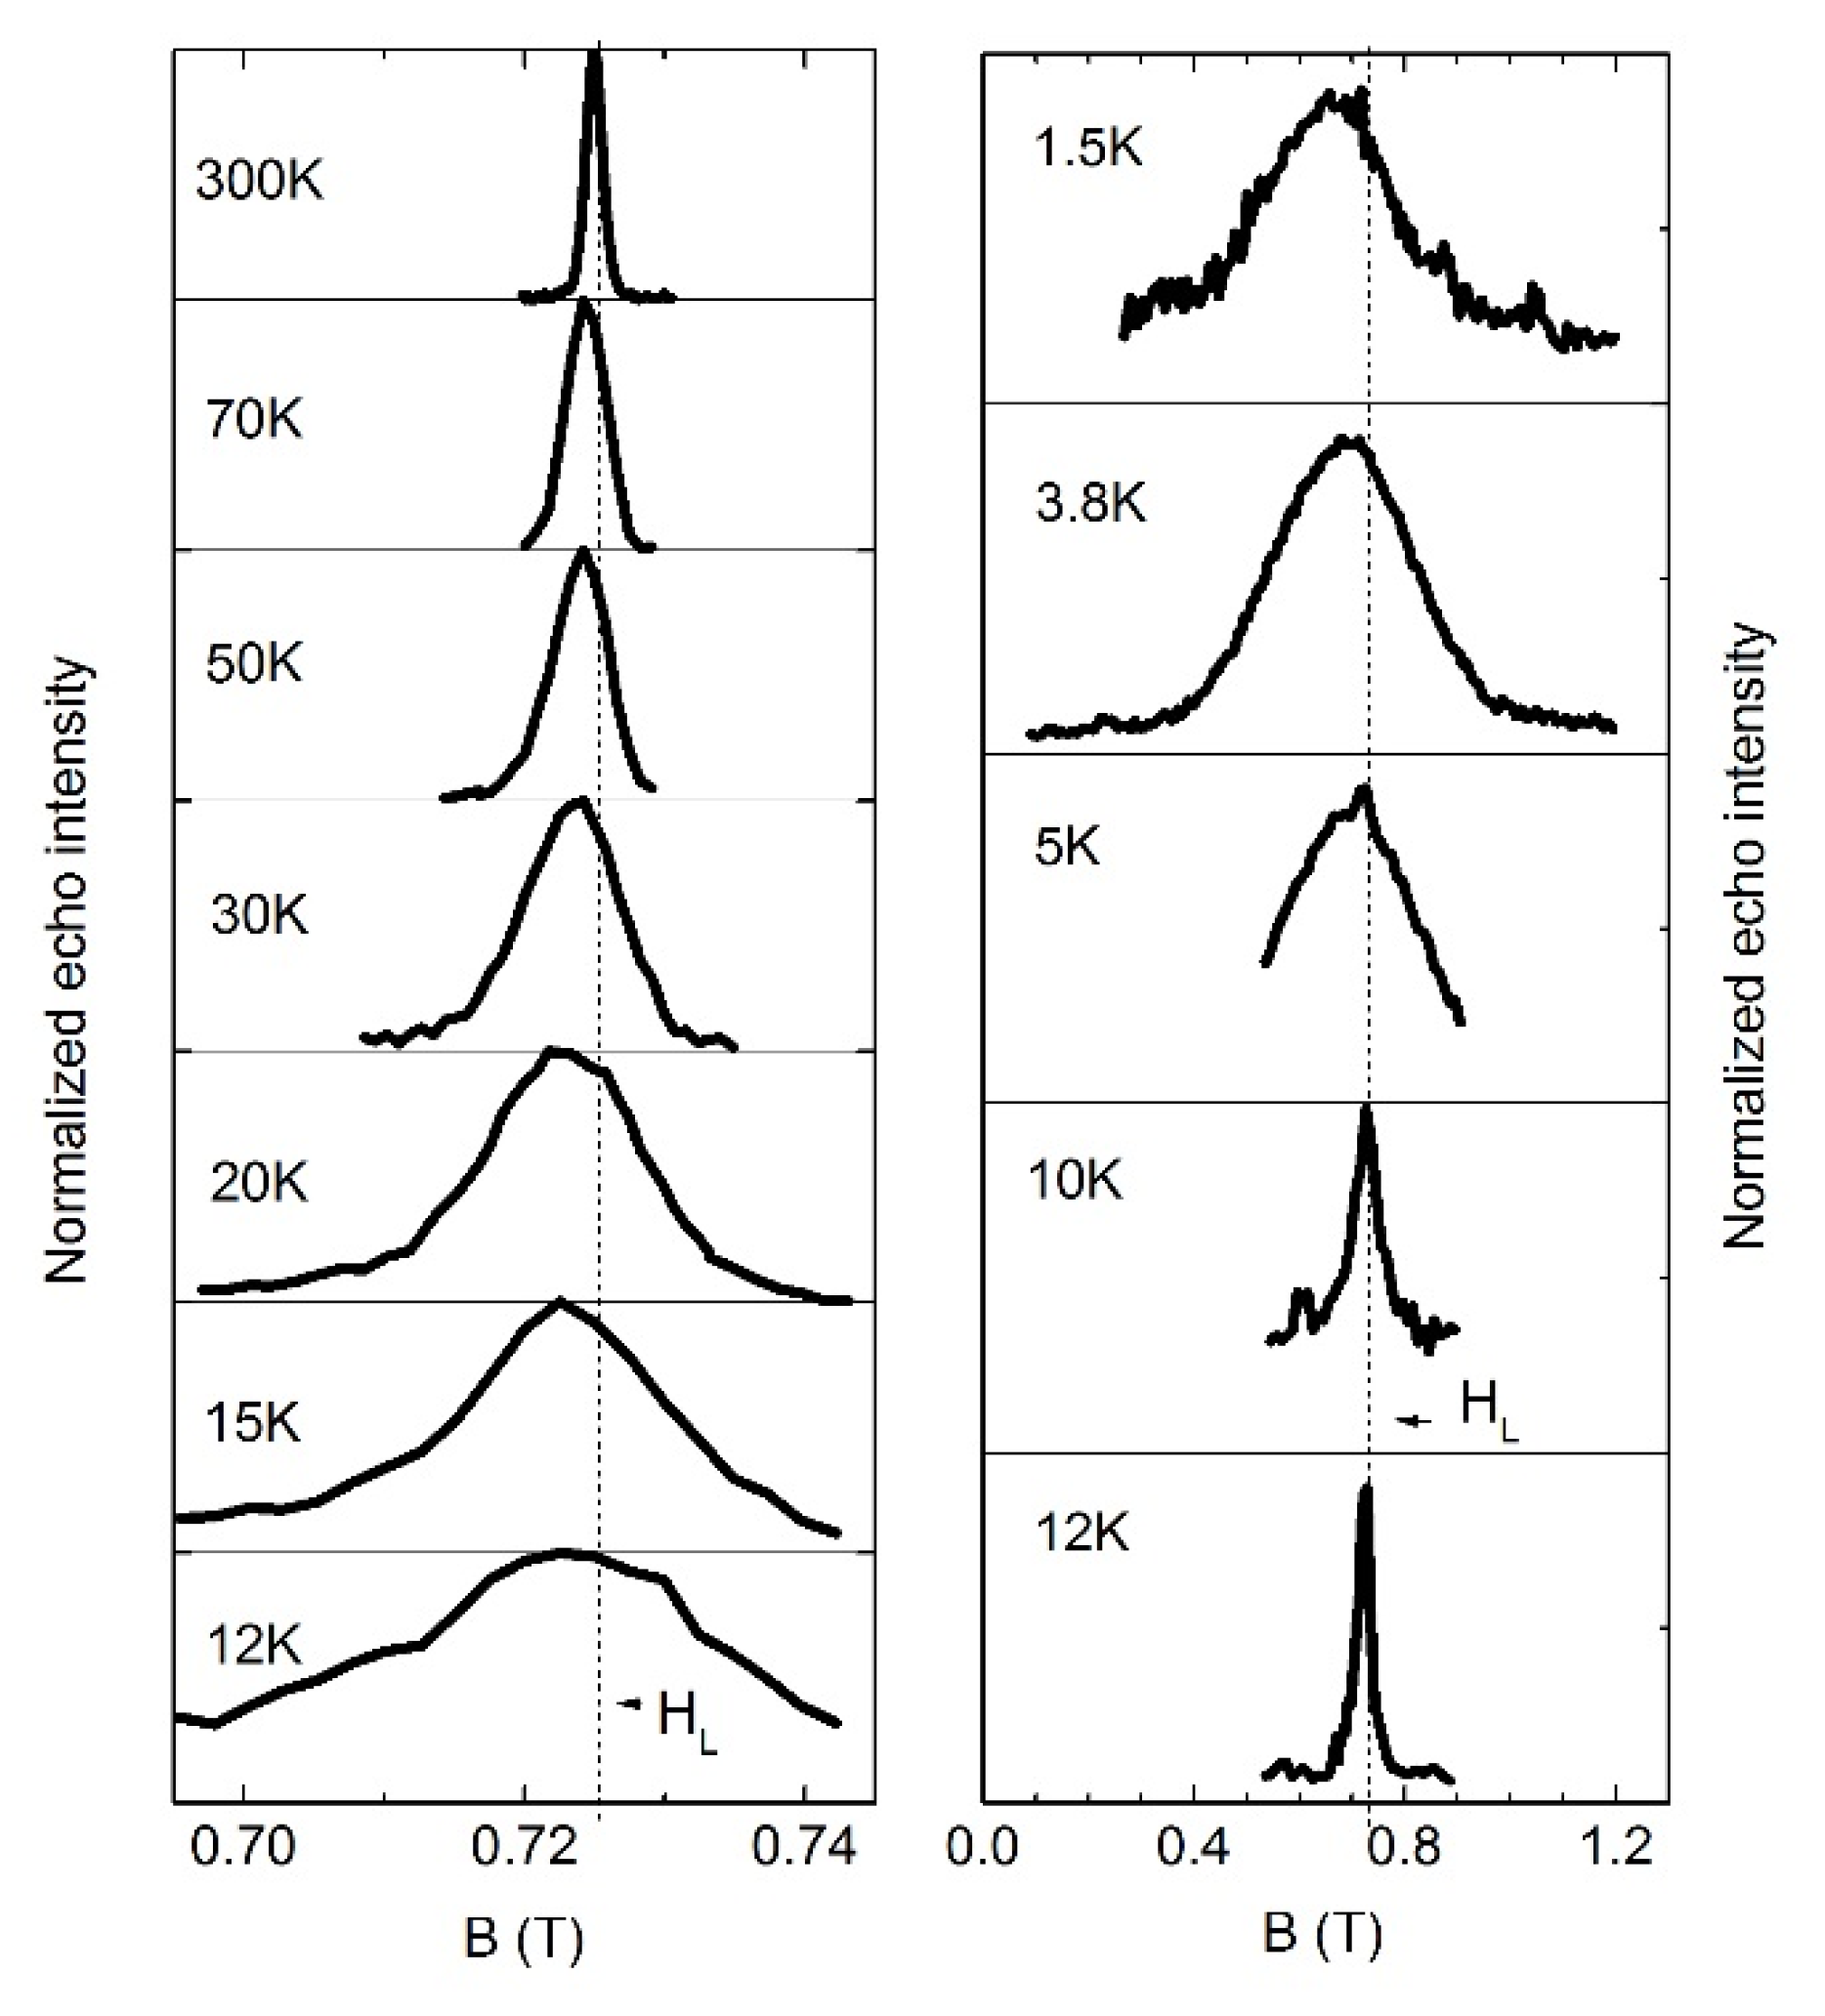
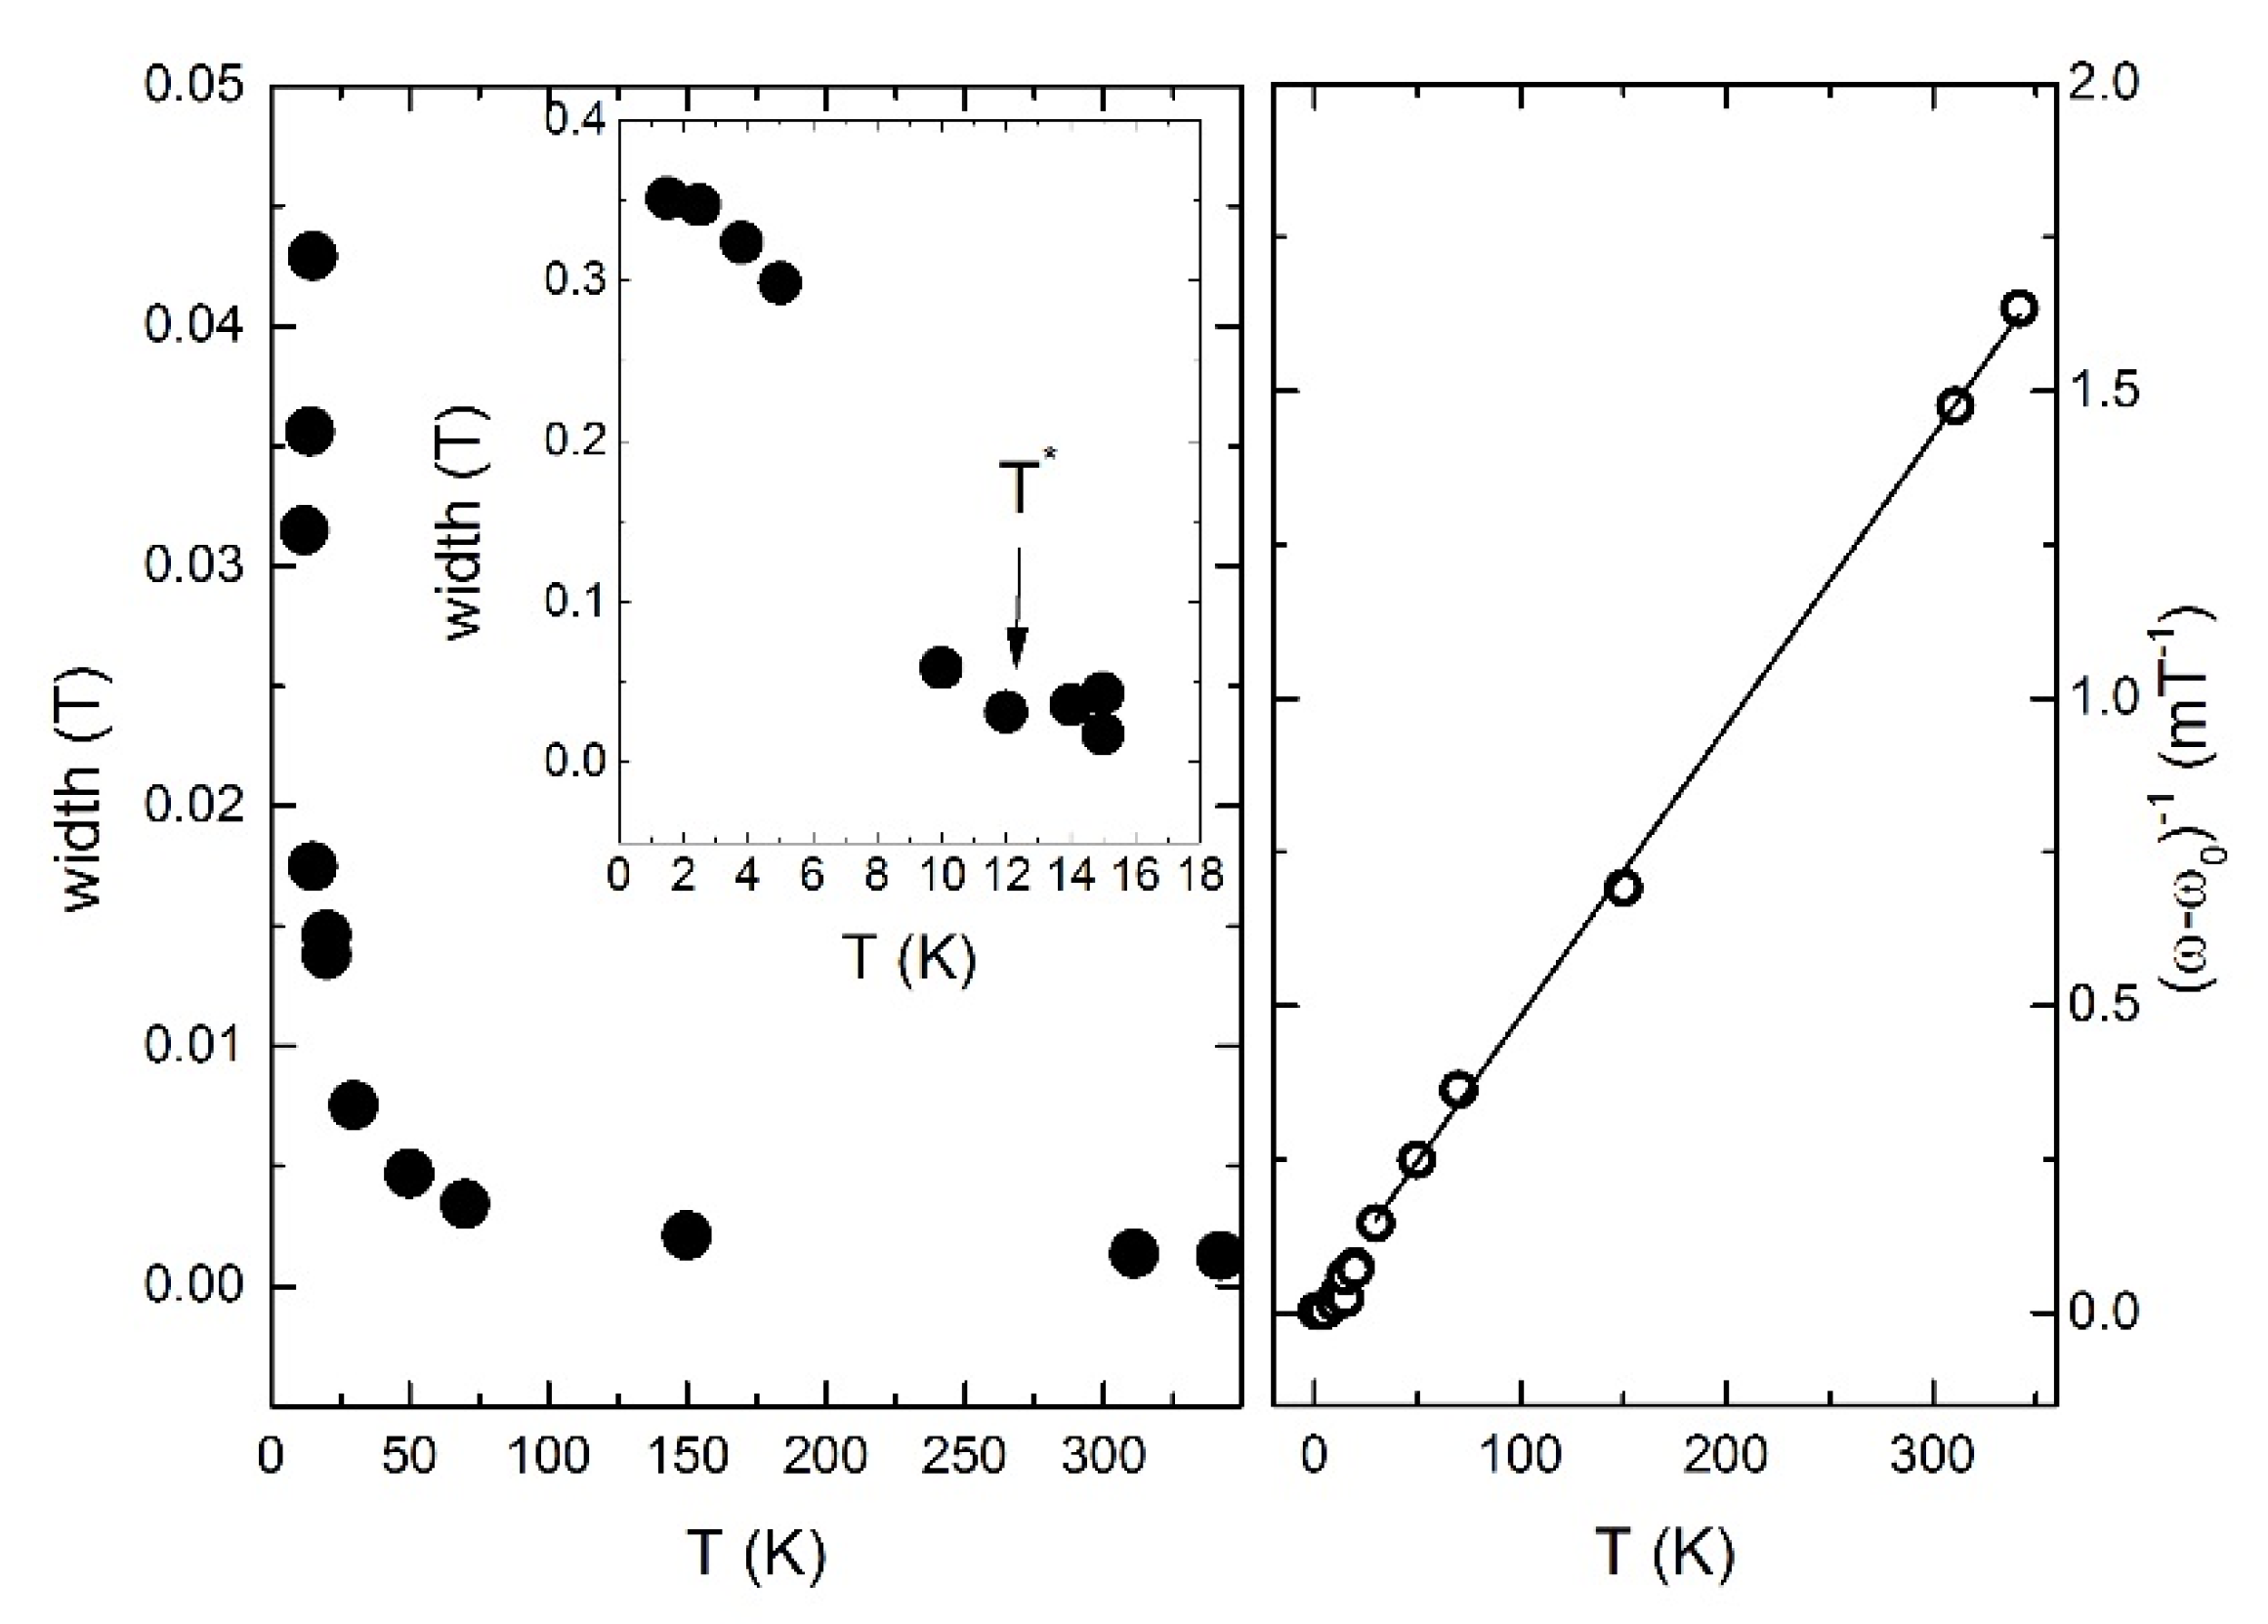
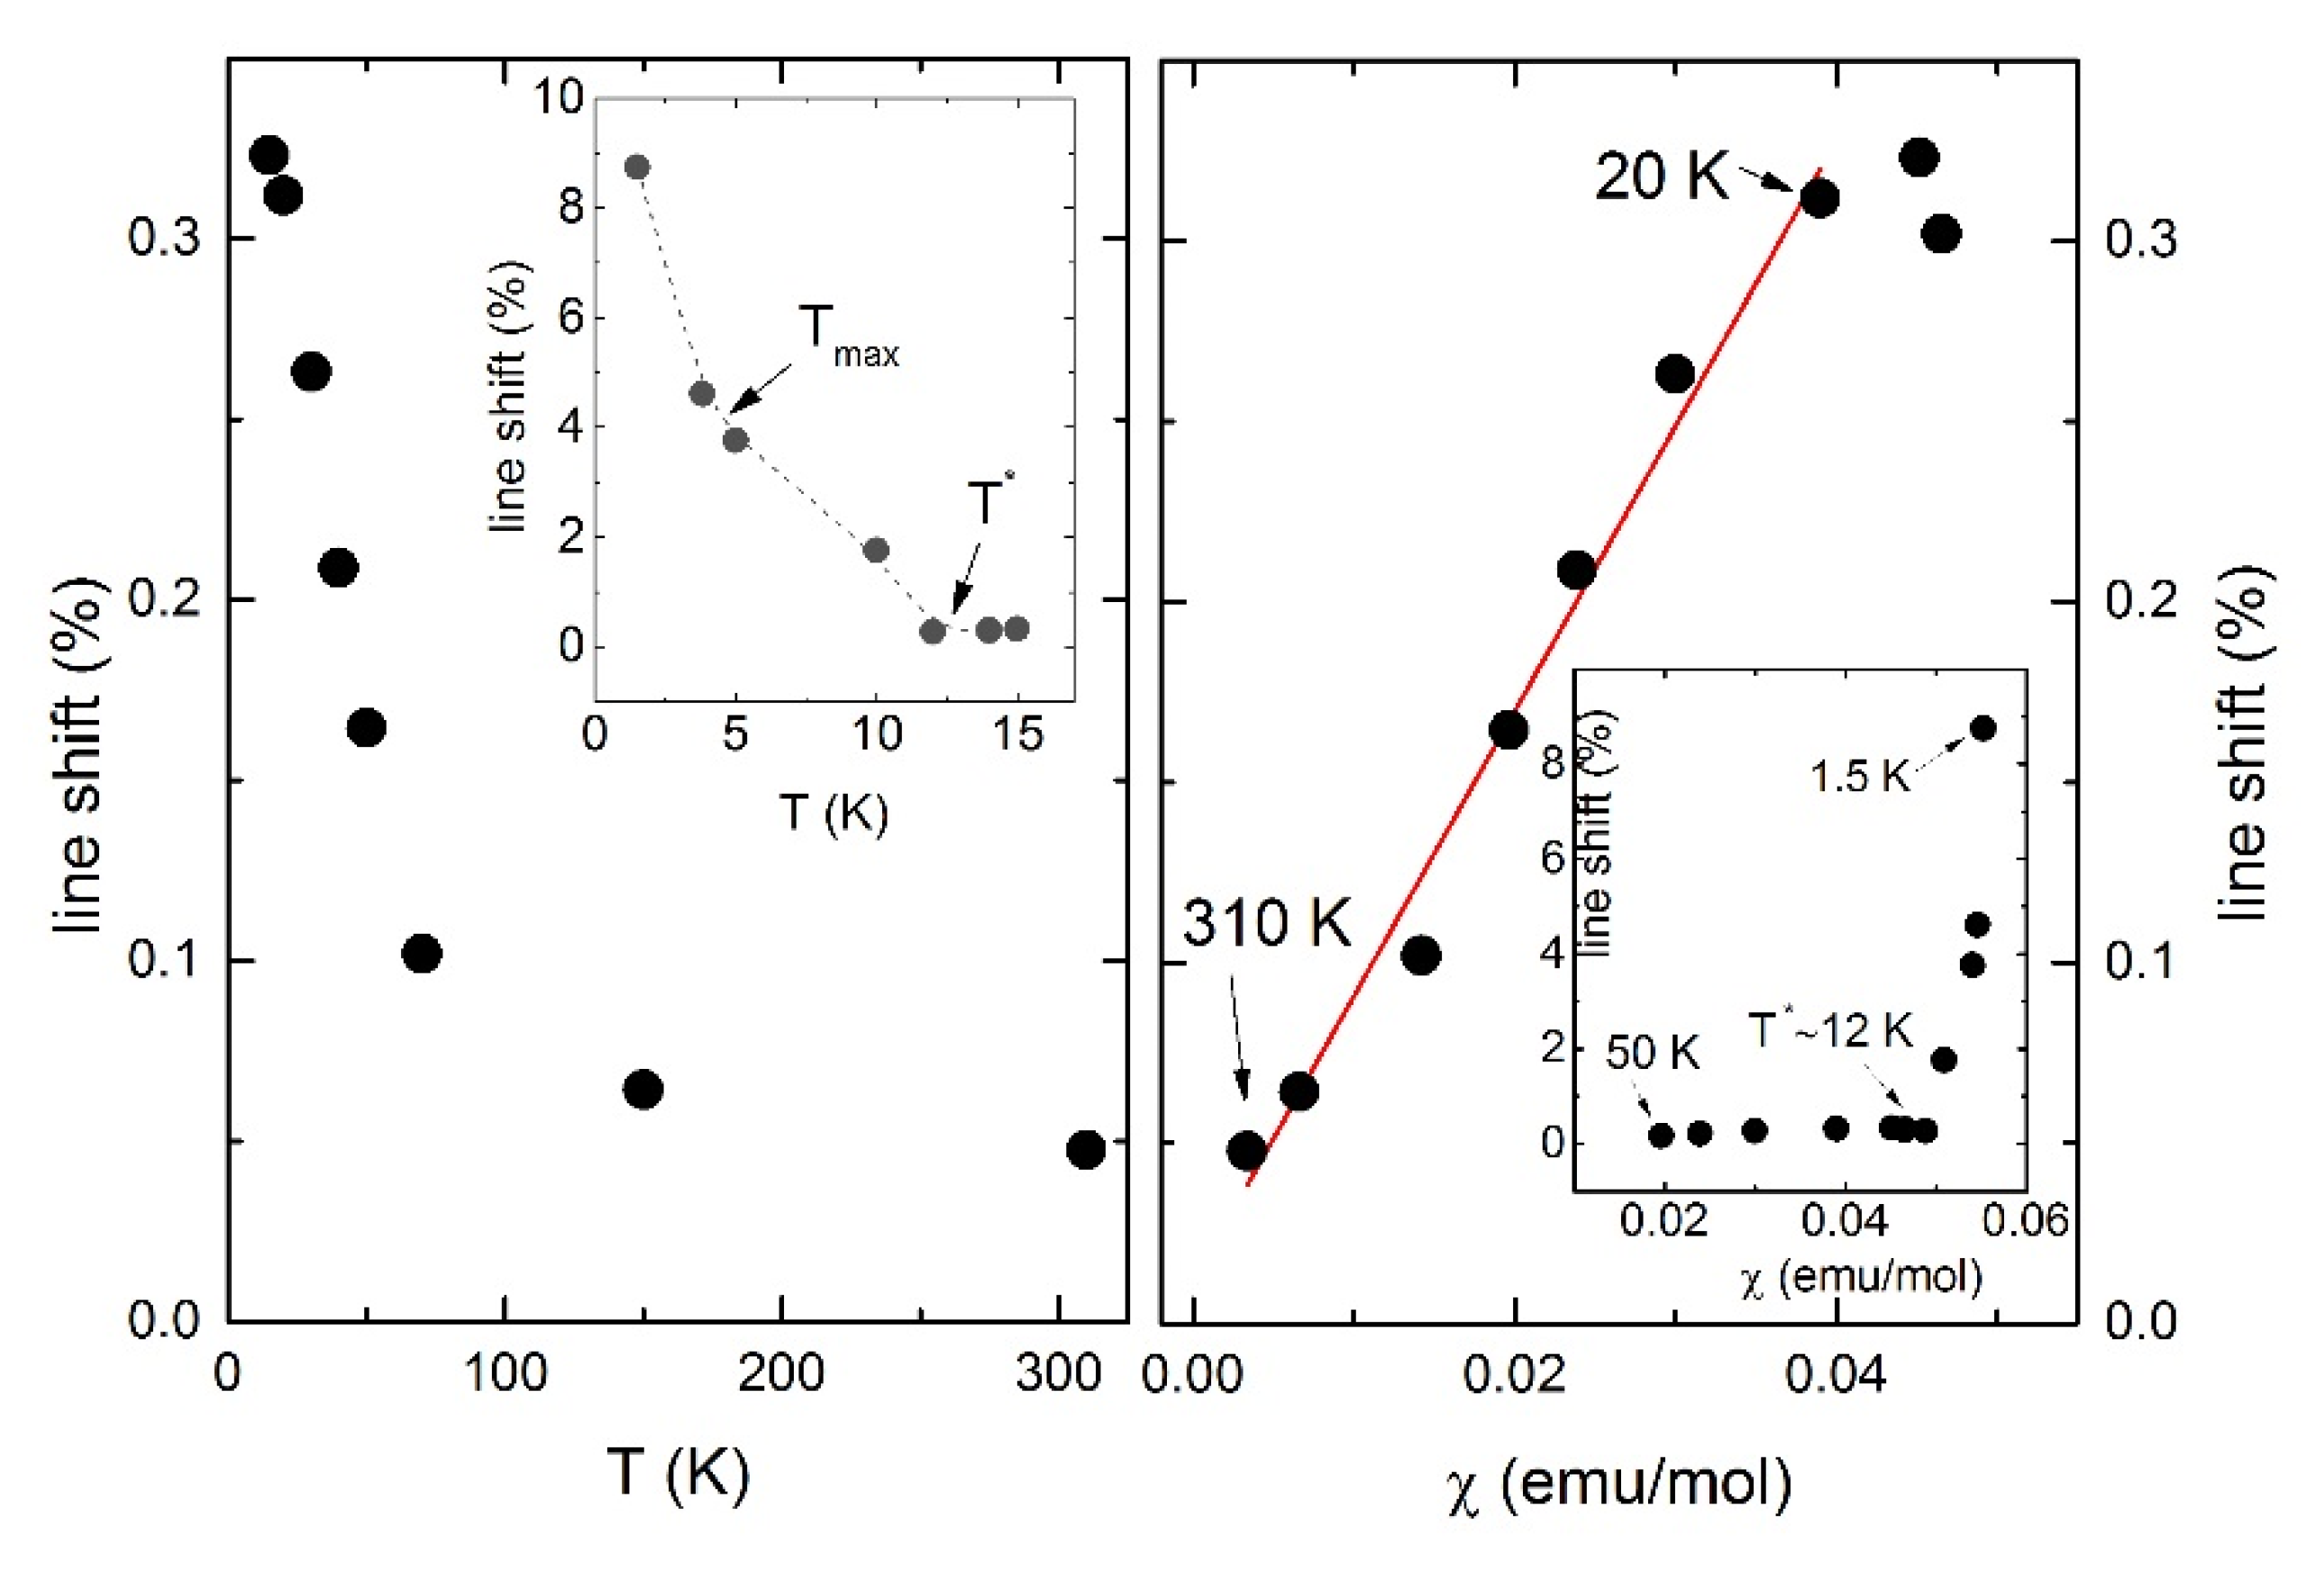
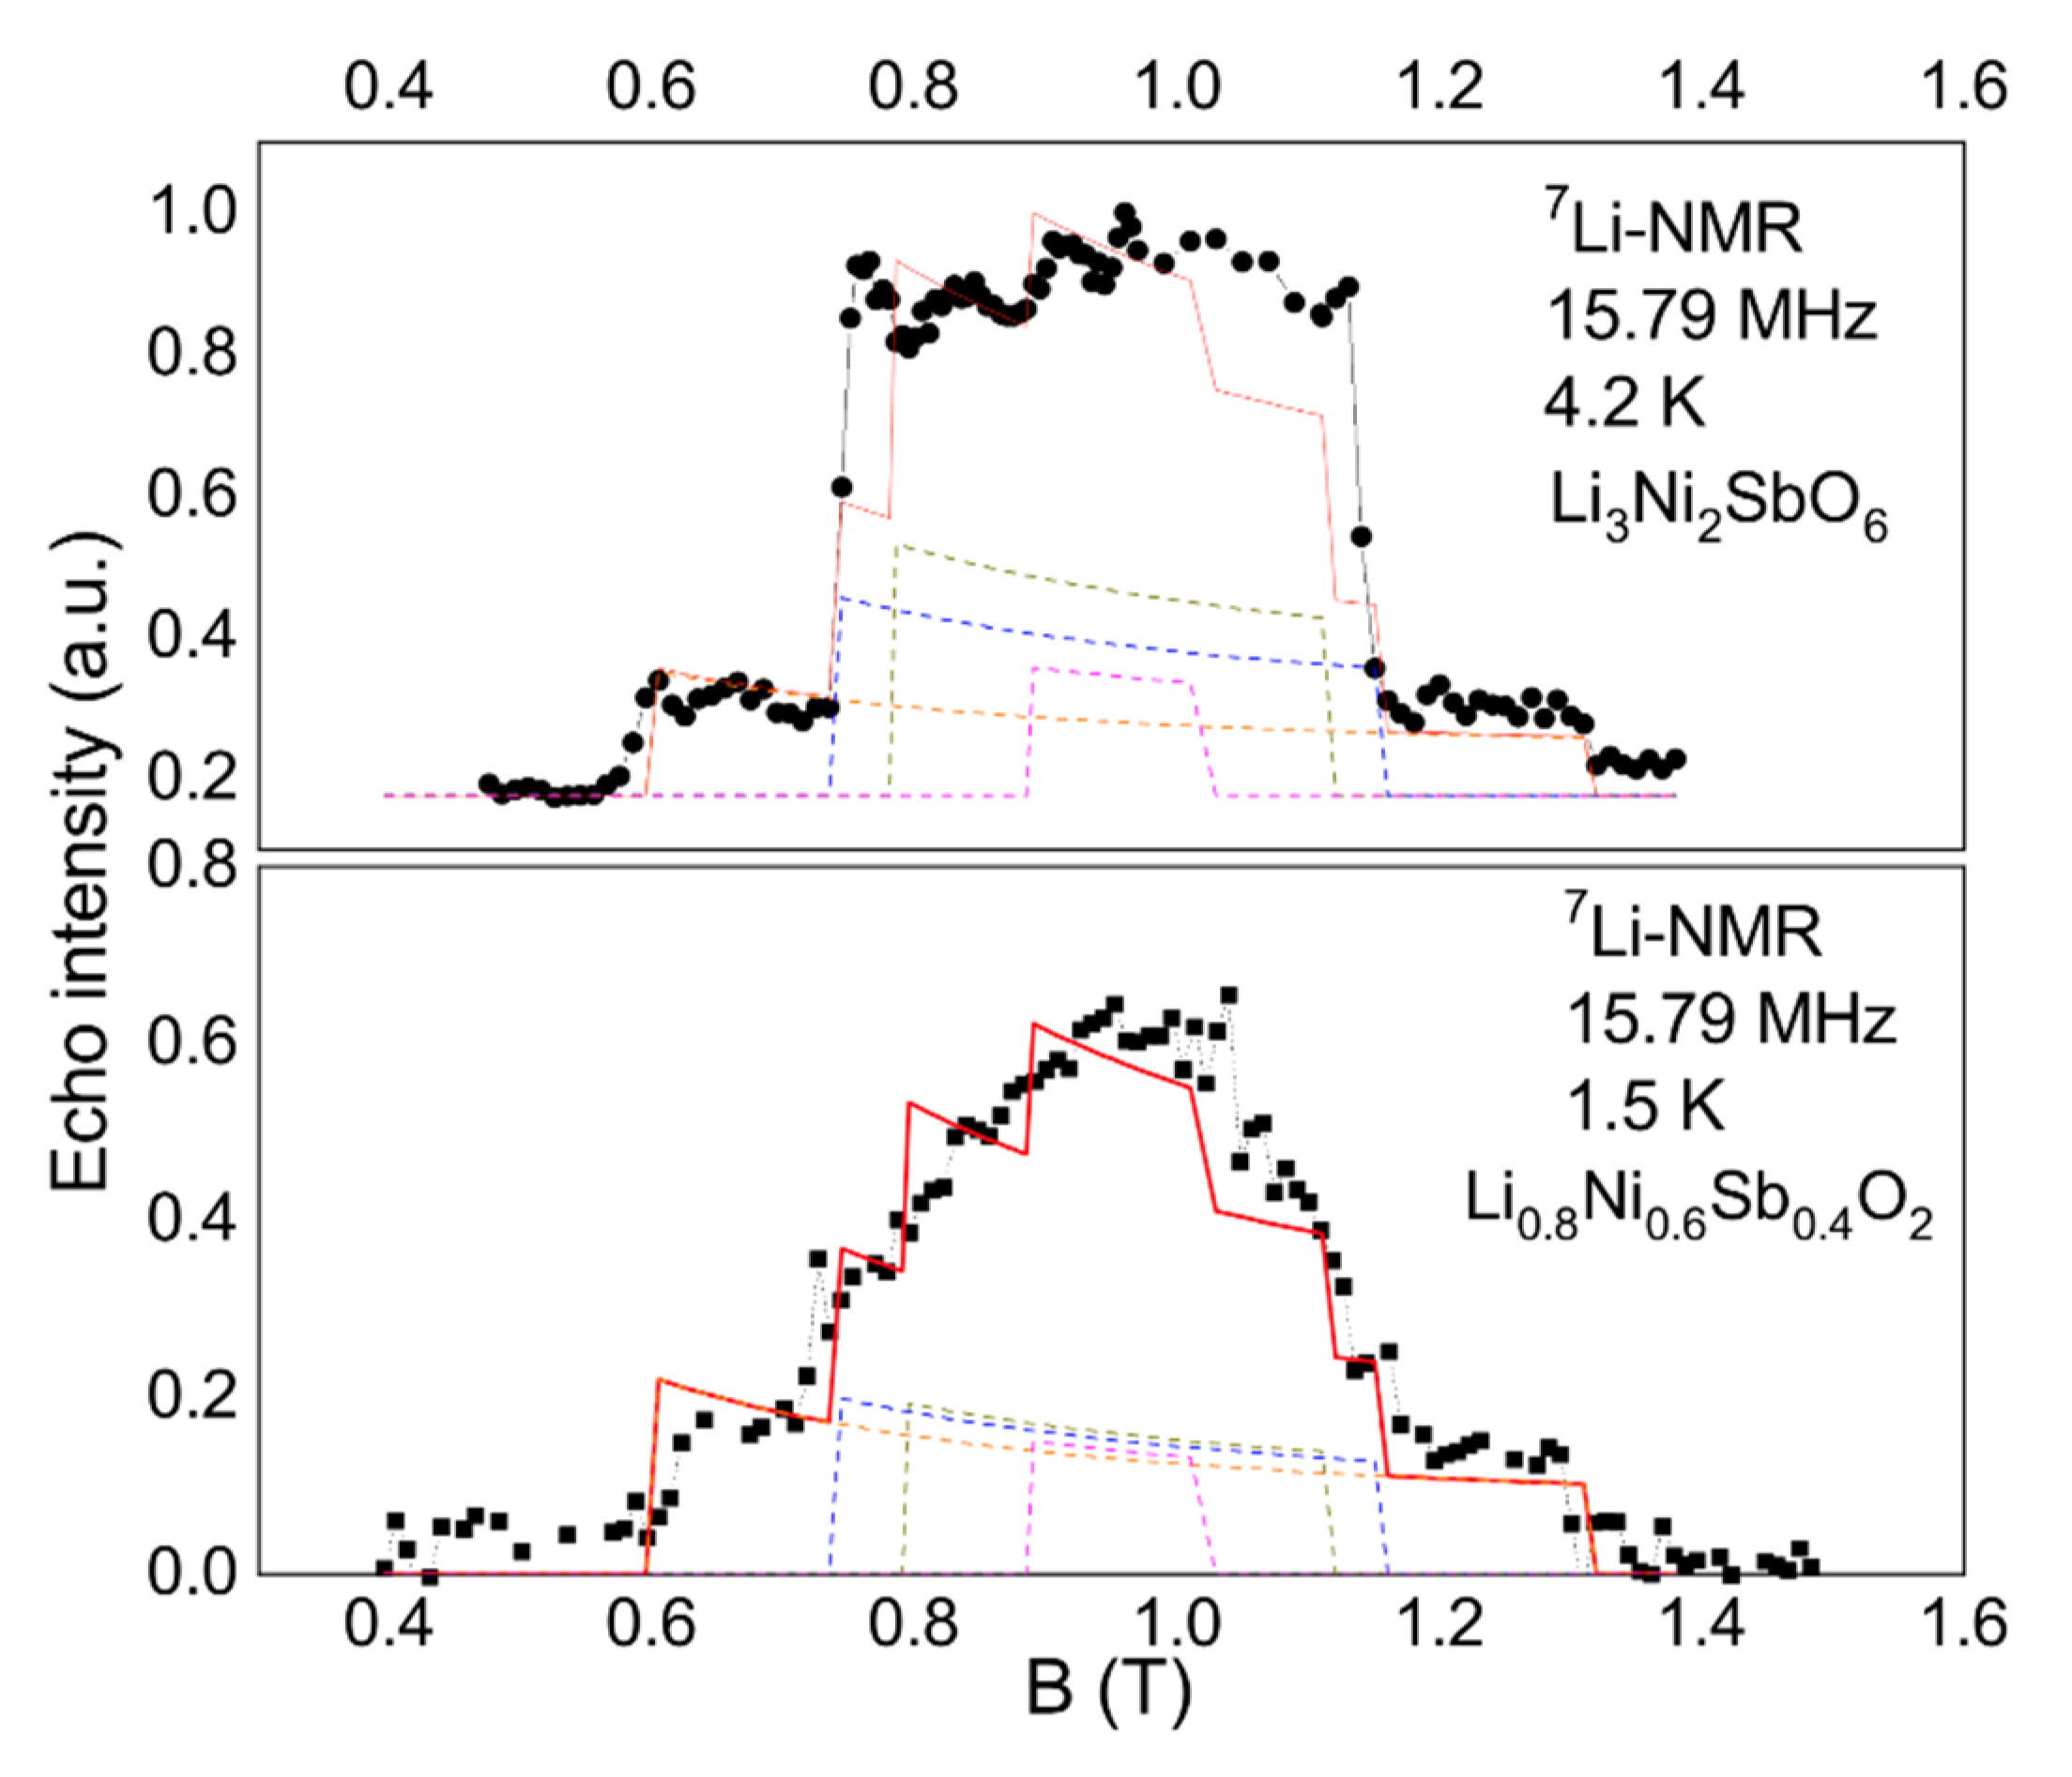
3.4.1. 7Li NMR Spectra

The 7Li NMR studies were carried out in order to obtain information about local properties of the magnetic subsystem of the Li2.4Ni1.8Sb1.2O6 compound. Since the field and frequency dependence of the magnetic properties of spin glasses is strong, a relatively small external magnetic field of B0 = 0.724 T was applied. The results of high-temperature studies are presented in previous work [32], where the lithium mobility was investigated. Here we focus on the measuring of spectral and relaxation characteristics below room temperature.
Figure 7 shows the temperature evolution of the 7Li NMR spectra. Despite the fact that lithium has a nuclear spin I = 3/2 and possesses quadrupole moment, the quadrupole satellites are not observed in the powder-averaged NMR line even at sufficiently high temperatures; therefore, the quadrupole splitting is less than the inhomogeneous linewidth. With decreasing temperature, the line gradually broadens, retaining the Gaussian-like shape, and the shape becomes more complex only at the lowest temperature.
The temperature dependence of the full width at half maximum of peak is plotted in Figure 8. The linewidth ω is determined by the distribution of local magnetic fields and can be written as ω = ω0 + ω(T), where width on very high temperature limit ω0 = 0.67 mT. At T > 25 K the T-dependent part of the linewidth ω(T) follows a static bulk susceptibility and can be approximated by the Curie-Weiss law with Θ = −4.72 ± 0.06 K (solid line in Figure 8). Below 12 K, the linewidth sharply increases, indicating the emergence of an extremely strong distribution of local fields.
The static part of the local susceptibility is represented by the shift of the NMR line K(T) = Ksp(T) + K0, where Ksp is the spin part of the shift, caused by hyperfine interactions between nuclear and electron spins. As is shown in Figure 9, Ksp also follows the bulk of the susceptibility down to 20 K, strongly deviating upward with decreasing temperature. Two peculiarities can be noted in the temperature dependence of the local susceptibility below 20K. These are characterized by a change in the slope below T ≈ 10 K and T ≈ 4 K, and they are also observed in the bulk magnetic susceptibility curve.

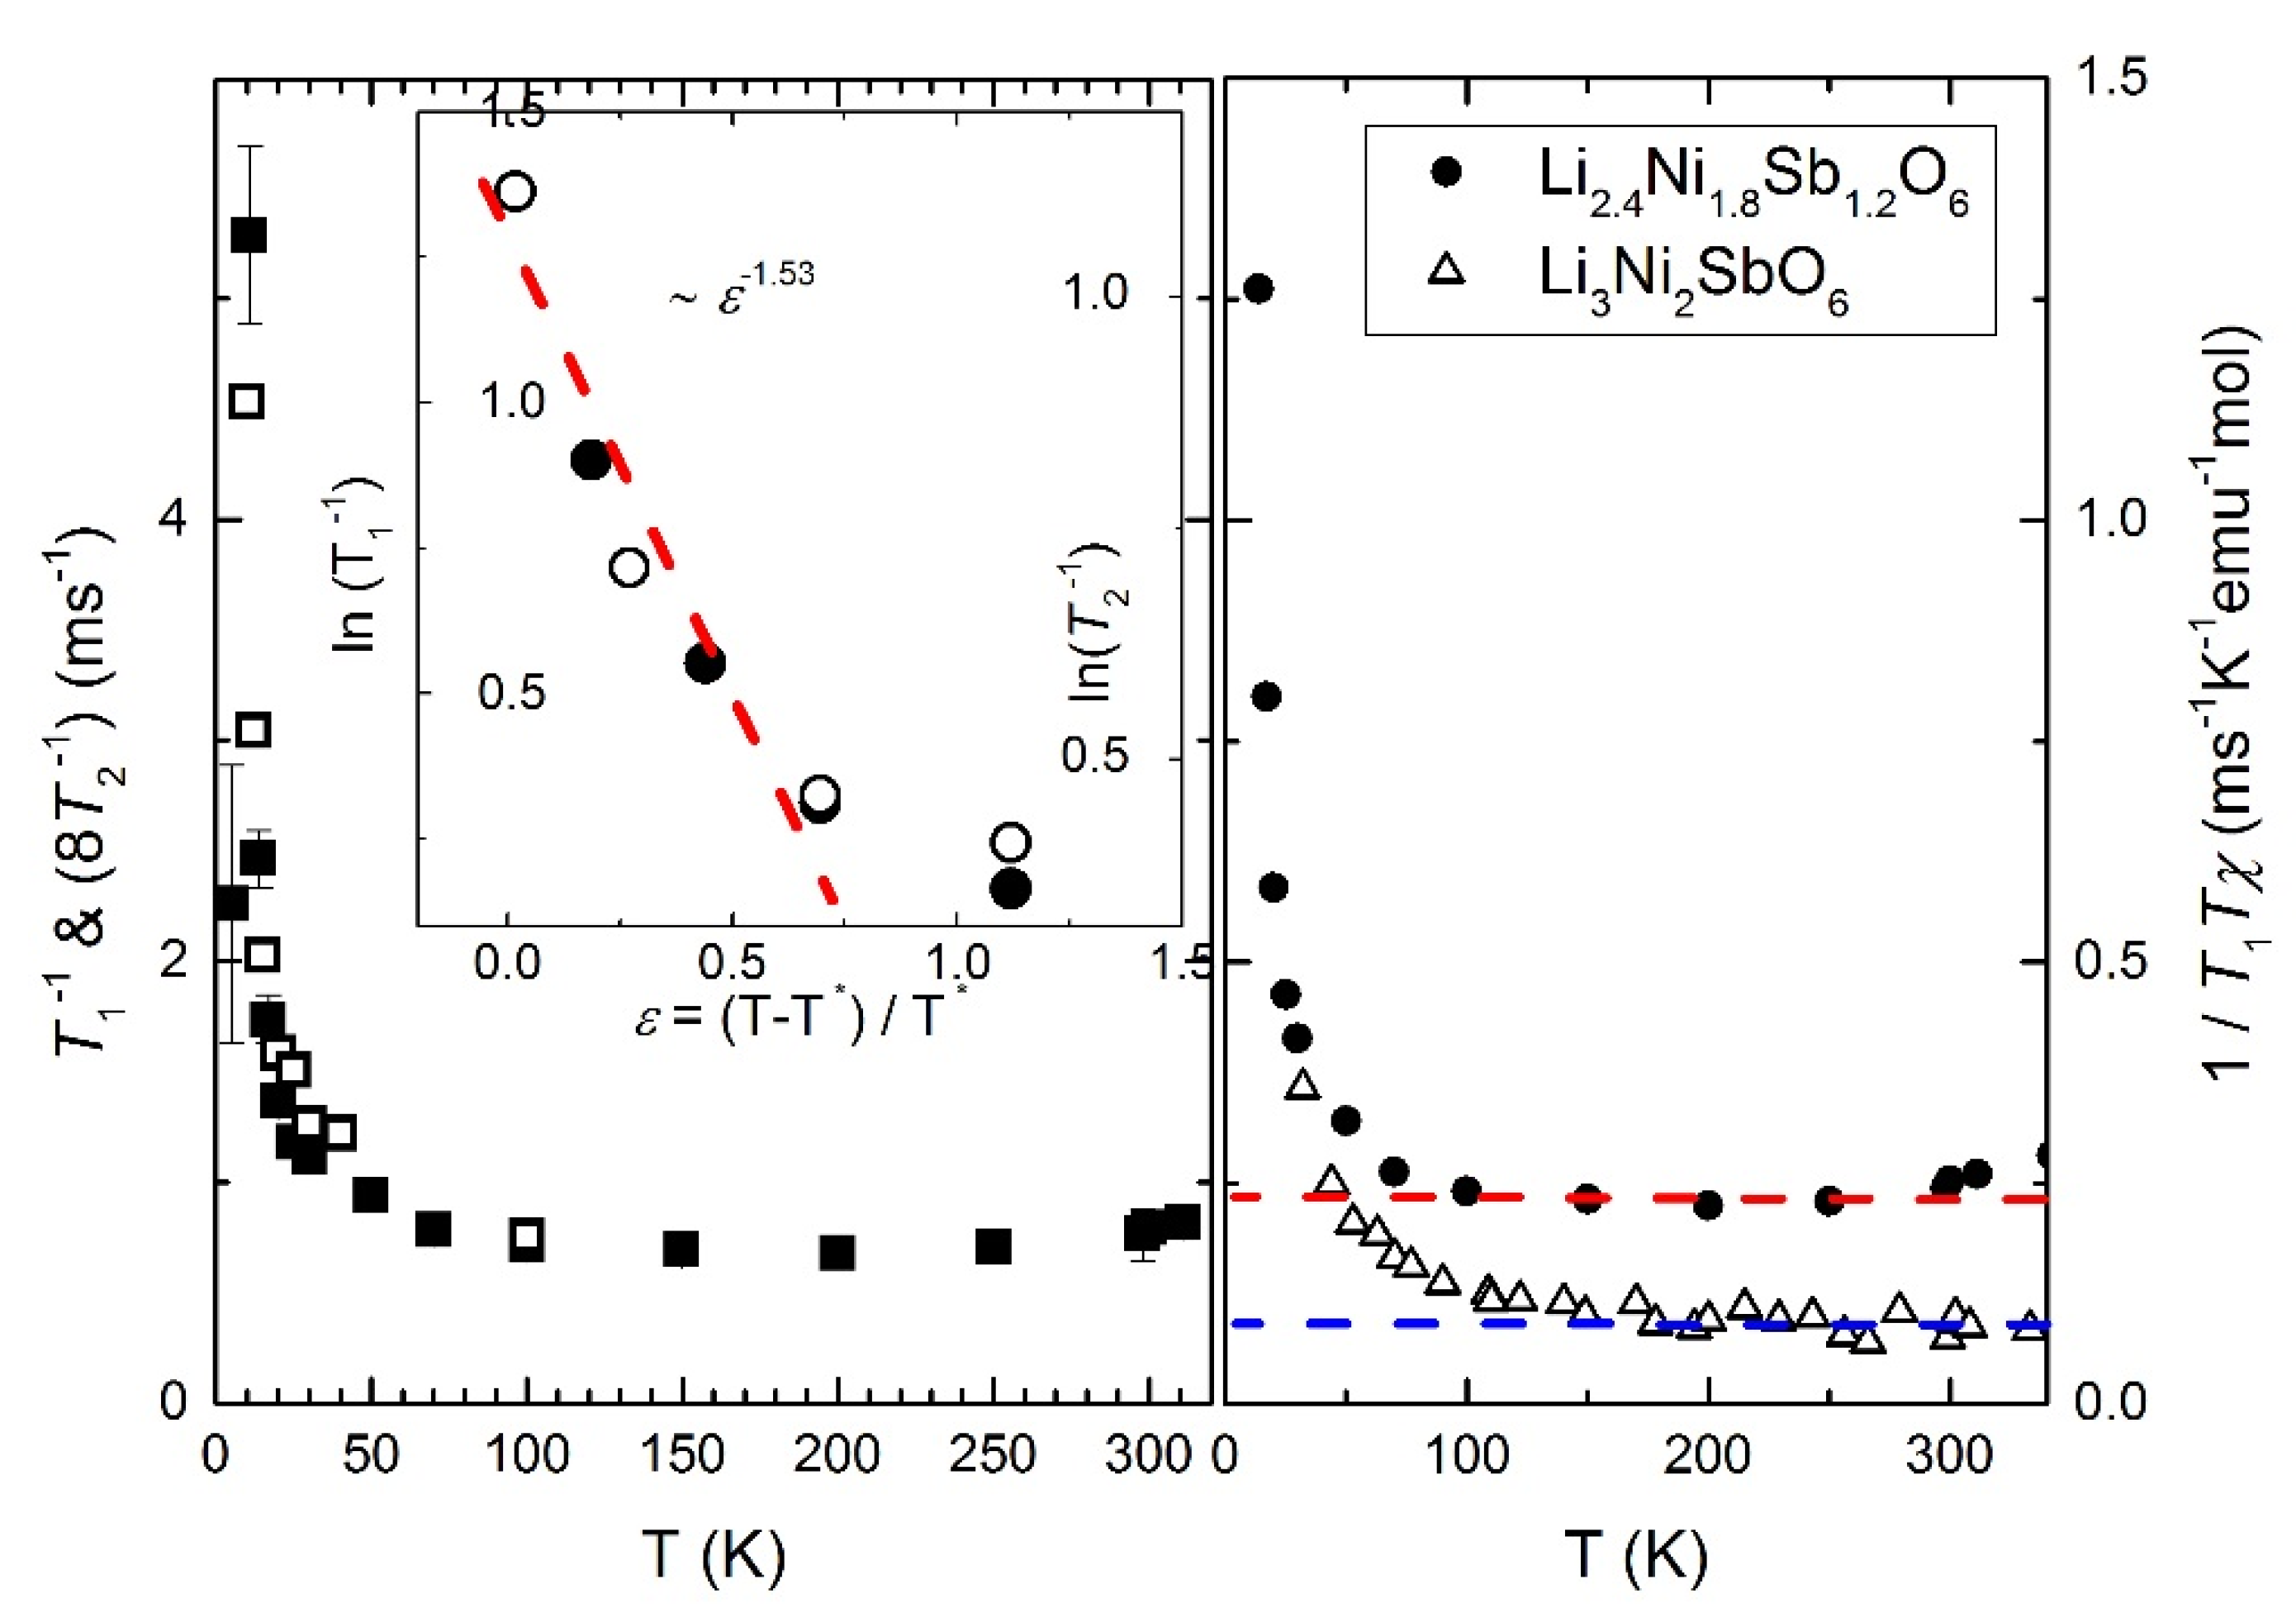
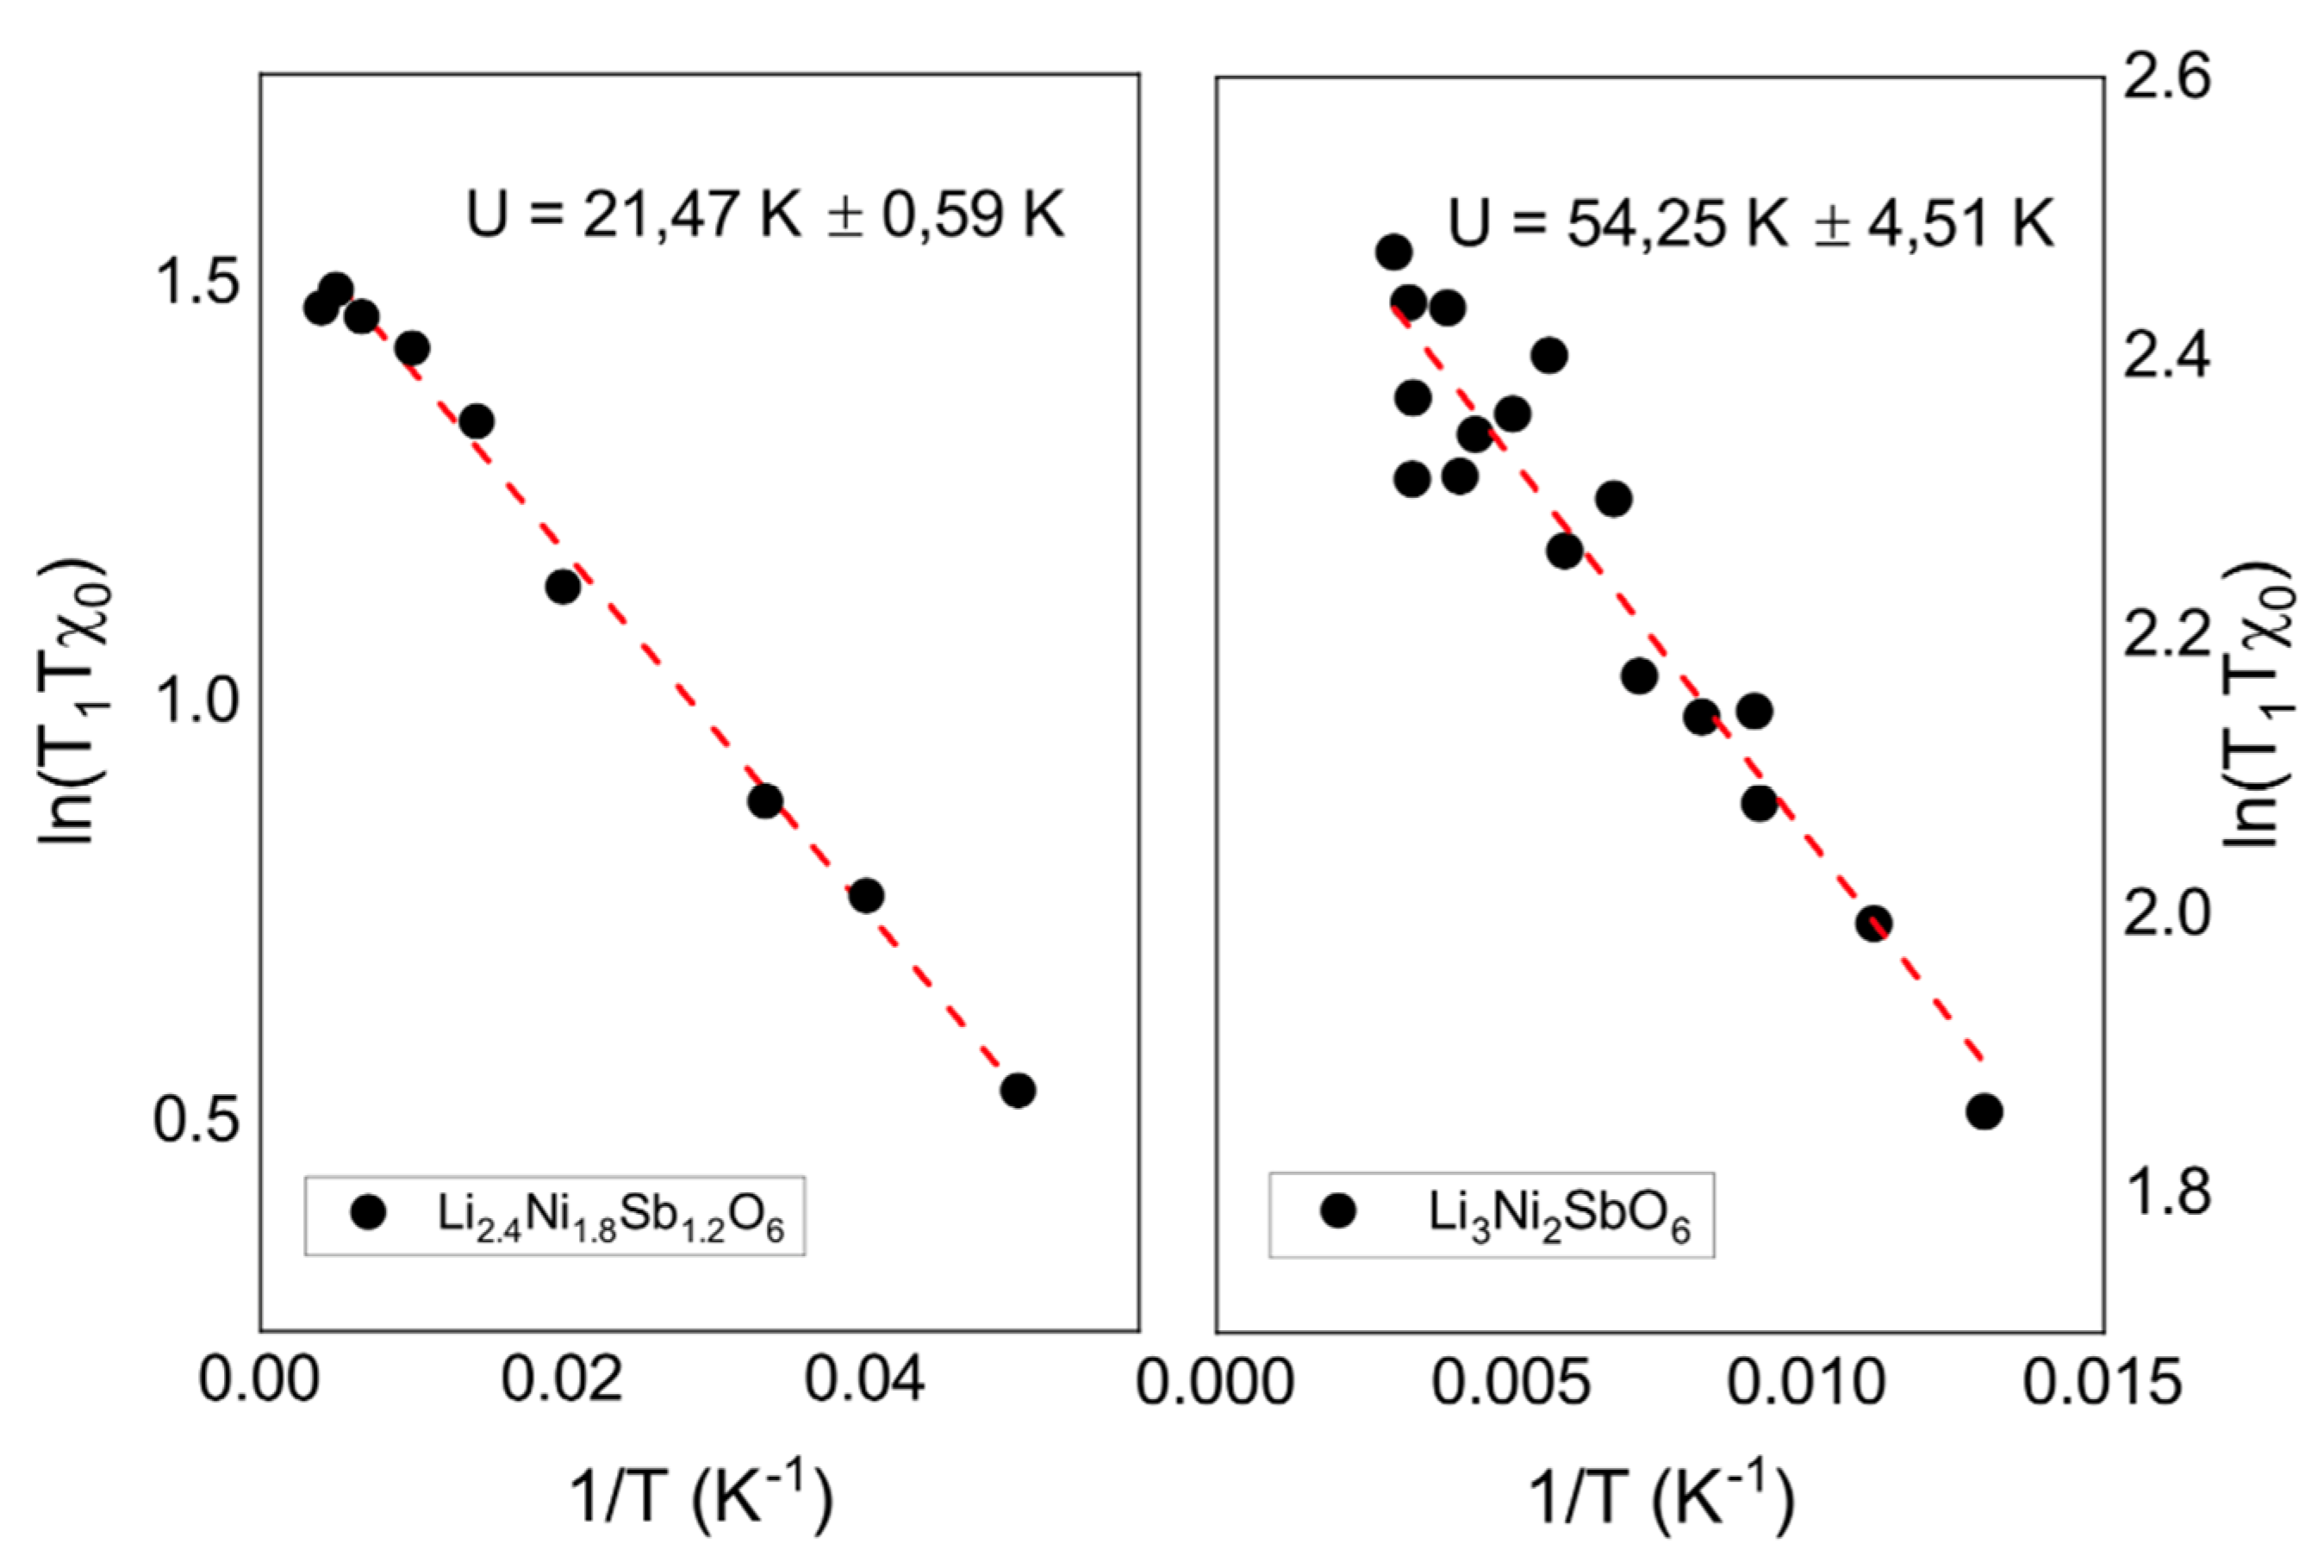
3.4.2. 7Li Nuclear Relaxation Rates T1−1 and T2−1

Dynamic properties of the magnetic subsystem can be accessed by measurements of longitudinal and transverse relaxation rates T1−1 and T2−1. Due to the inability to resolve the quadrupole structure, the T1−1 was obtained by fitting the nuclear magnetization decay by a stretched exponential function. Details and an example of a fit can be found in previous work [32]. The spin-lattice relaxation rate T1−1 is almost temperature-independent at temperature range 70–300 K and increases rapidly below 70K (see Figure 10, below). The stretching parameter b deviates from 1 and approaches a value of 0.7 at the lowest temperatures [32]. The origin of such behavior is a distribution of T1 relaxation times, which directly indicates the inhomogeneity present in the system due to disorder effects.
The transverse relaxation rate T2−1, measured at T < 150 K follows the temperature dependence of longitudinal relaxation T1−1 (see Figure 10, below). Both times become critically small below 15 K, which leads to the wipe-out of NMR signal below 8 K. At these temperatures, due to the technical features of the method (T2−1 is comparable to the duration of the so-called hardware “ringing” of the measuring circuit and the “dead time” of the spectrometer) and physical reasons (the relaxation rate T1−1 becomes comparable with the frequency of magnetic resonance), correct measurement of relaxation rates and NMR spectra is difficult. The wipe-out temperature range is determined to be 4–15 K. Keeping these considerations in mind, one can indicate the observed sharp maximum of the temperature dependence of the relaxation rate in the vicinity of TSG ≈ 8 K.

4. Discussion

The temperature dependencies of the longitudinal T1−1 and transverse T2−1 relaxations of 7Li are shown in Figure 10. Spin-lattice relaxation in a concentrated magnet Li2.4Ni1.8Sb1.2O6 is mainly determined by the interaction of the nuclear spin with the electron spins of magnetic Ni2+ ions. It is almost constant in the middle temperature range, slightly increases at temperatures above 250 K due to the incipient activation motion of lithium ions [32] and sharply increases at low temperatures due to the growth of spin correlations and the slowing down of electronic fluctuations. These processes can be probed by the local dynamic susceptibility χ″ at the position of the nucleus, since:
1 T 1 T q A q 2 χ q , ω L ω L
where A q is the form factor, depending on wavevector q and ω L is the Larmor frequency. From a comparison of the data for stoichiometric and nonstoichiometric compounds, it can be seen that spin correlations in Li2.4Ni1.8Sb1.2O6 begin to develop at temperatures below 70 K, which is much lower than for Li3Ni2SbO6. Moreover, in the middle temperature range, the value of the 1/T1T in the nonstoichiometric compound is larger, despite the fact that the hyperfine interaction constant with doping remains practically unchanged, as was established from measurements of the line shift. Apparently, the spectrum of electronic fluctuations in a sample with a lithium deficiency has a higher density in the low-frequency region, which makes relaxation more efficient.
The energy of the local spin fluctuations was estimated using formalism developed by Takeya et al. [17]. For spin I = 3/2 the relaxation rates T1−1 and T2−1 read as [49]:
1 T 1 γ n 2 h x 2 + h y 2 τ c 1 + ω L 2 τ c 2
1 T 2 γ n 2 5 2 h x 2 + h y 2 τ c 1 + ω L 2 τ c 2 + 1 2 h z 2 τ c
where τ c is a correlation time of fluctuations, h i 2 is a component of the fluctuating field on the nuclear position, γn is a gyromagnetic ratio of the nuclei. Since T1−1 and T2−1 in the region 25 K < T < 150 K have the same temperature dependence (see Figure 10), the fluctuations of the local field are isotropic and ωτc << 1. Then, at temperatures much higher than TSG, one can write:
1 T 1 γ n 2 k B T μ B 2   χ τ c
and the characteristic energy of spin fluctuations
Γ k B = τ c T k B γ n A h f 2 μ B 2   χ T 1 T
In this temperature range, the value of χT1T demonstrates an activation behavior:
χ T 1 T A exp ( U / T ) ,
where U = 21.47 ± 0.59 K corresponds to the local binding energy, i.e., with the magnitude of the spin exchange and the number of bonds (nearest neighbors) in the system of electron spins of nickel (Figure 11). Meanwhile, the value of binding energy in a stoichiometric sample, determined within the temperature range, where the local dynamic susceptibility does not deviate from the bulk static one, is significantly bigger and equal to U = 54.25 ± 4.51 K. Taking into account that the number of neighbors in the honeycomb lattice is three, the value of the exchange interaction is in good agreement with that obtained in thermodynamic studies [27]. Obviously, structural changes associated with the destruction of the hexagonal crystal lattice of Ni2+ ions in a lithium-deficient sample leads to a smaller number and a smaller value of bonds. As a result, electronic correlations are suppressed and the phase transition temperature decreases.
The critical behavior of the system at low temperatures can also be studied via nuclear relaxation processes. For this reason, the relaxation data was analyzed in similar fashion to the ac susceptibility. The temperature dependence of the relaxation rate in the critical regime slightly above Tcrit can be described by formula:
T 1 1 = T 1 1 0 + c ε p
Here, ε = |TTcrit|/Tcrit is reduced temperature, c is a prefactor, Tcrit is a critical temperature and p is a critical exponent (see Figure 10, insert to left panel). The obtained critical exponent value p = 1.67 is close to 2D Ising model (p = 1.5–1.9 [50,51,52]) and drastically different from the value obtained from the ac susceptibility. The obtained Tcrit = 11.7 K, which is close to T*. This gives evidence for the realization of the cluster spin glass in Li2.4Ni1.8Sb1.2O6, where the nuclear magnetic relaxation as a local technique characterizes the intracluster 2D critical spin dynamics, while from the AC susceptibility data we obtain the information about 3D glassy-like freezing of the bulk system. As mentioned above, further decreasing temperature leads to a dramatic increase in nuclear relaxation rates and, as a result, significant loss of NMR signal intensity. This wipe-out of the signal in unusually wide temperature range not only complicates the correct measurement of relaxation rates and spectra, but indicates an extended critical temperature range of 4–15 K, which contains a whole cascade of phase transformations of the magnetic system that freezes according to the cluster spin glass scheme. This is reflected primarily in the nonmonotonic temperature dependence of the static magnetic susceptibility and non-trivial behavior of the specific heat, but it also manifests itself in an unexpected way in local properties, in particular in NMR spectra at very low temperatures.
Below the Tmax = 4 K, the spectrum shifts sharply and its shape changes, ceasing to be strictly Gaussian. Some rectangular components of the spectrum can be distinguished, similar to those observed in the stoichiometric compound Li3Ni2SbO6 [27]. The rectangular structure of the spectrum is specific for regions with 3D antiferromagnetic order, while the width of the trapezoid is determined by the internal field magnitude at the position of the resonating nucleus in the powder sample. The modeling of internal fields carried out in Ref. [27] was based on the dipole model, taking into account the Ni2+ spins of the first coordination sphere of lithium nuclei. Our calculations demonstrated that it is possible to distinguish different types of ordered structures in a honeycomb sample by the number of magnetically nonequivalent lithium positions and the ratio of local fields on them (see Figure 12, upper panel). Moreover, the experimentally obtained ratio of the widths and intensities of the largest rectangular components unambiguously testified in favor of the zigzag structure. Interestingly, the 7Li NMR spectrum of Li2.4Ni1.8Sb1.2O6 obtained at 1.5 K also contains well-resolved rectangular components corresponding to at least two positions of Li with uniform local field corresponding to zig-zag AFM structure. At the same time, the main intensity of the spectrum comes from the central Gaussian-like part and the model does not fit to the experimental line shape there (see Figure 12, bottom panel). This can be interpreted as an emergence of the 3D short-range magnetically ordered clusters at Tmax = 4 K where the interplane exchange can bind the two-dimensional AFM-correlated regions. At the same time, most of the sample contains locally disordered spin configurations forming a spin glass pattern based on a quasi-triangular nickel lattice diluted with antimony ions.
Therefore, based on the results of complex studies, we assume the following scenario of the temperature transformation of the magnetic system of the layered Li2.4Ni1.8Sb1.2O6. With decreasing temperature, the rise of 2D antiferromagnetic correlation length leads to the appearance of AFM-correlated two-dimensional clusters in the regions of nickel-antimony planes with an undisturbed honeycomb structure. It manifests itself in the temperature dependence of the specific heat and static magnetization, as well as in the parameters of the NMR spectrum and the critical behavior of spin lattice relaxation at temperature T* = 12K which is close to TN in a stoichiometric compound. A correlation length of several lattice constants and a rather long correlation time apparently characterizes the spin dynamics in such clusters. At the same time, the spins in the disturbed part of the nickel—antimony planes remain quasi-free and act as a gradually solidifying matrix separating the correlated clusters. 3D spin glass freezing of this matrix occurs at a temperature TSG = 8 K. The growth of interplane correlations due to the interplane exchange interaction Jinterplane << Jintraplane connects 2D clusters in neighboring layers at temperatures below TSG. As a result, three-dimensional clusters with a local static order are formed at Tmax = 4 K whose magnetic structure is close to the zig-zag order of the parent compound. Although in some honeycomb systems with defects, clusters are transformed to long-range magnetic order at low temperatures (see for example, [9]), the ground state of more disordered magnetic system of Li0.8Ni0.6Sb0.4O2 is 3D cluster spin-glass. Despite this, the regions with a sufficiently large structural and magnetic correlation length persist in crystal matrix, leading to the formation of clusters with magnetic order.

5. Conclusions

Lithium-deficient Li0.8Ni0.6Sb0.4O2 crystal structure was refined as truly trigonal (rhombohedral) with disordered Ni/Sb distribution over the same Wyckoff position and 8% Li/Ni inversion. The new superlattice phase is Ni-enriched and Li-deficient (Li3−2yNiy)Ni2SbO6. This intermediate level of the Li-Ni site inversion has led to a number of non-trivial magnetic properties. In the paramagnetic regime, modifications of the lattice parameters cause a change in the balance of the in-plane antiferromagnetic and ferromagnetic exchange integrals and lead to the antiferromagnetic sign of the biggest interaction. The transition into the long-range ordered AFM state is not observed in the Li0.8Ni0.6Sb0.4O2 compound, but a non-trivial cluster spin glass state is realized. It is characterized by a stepwise transformation of the magnetic system at low temperatures as a consequence of the balance between the growth of intra-cluster and inter-cluster correlations. It was found that, with decreasing temperature, the system of two-dimensional slow dynamic spin clusters undergoes the freezing transition. In this static state, the growth of the interplane correlation length promotes the formation of the static short-range ordered regions coexisting with a spin-glass state.

Supplementary Materials

The following are available online at https://www.mdpi.com/article/10.3390/ma14226785/s1, Figure S1: Results of the Rietveld refinement: XRD profile and polyhedral view of the crystal structure of Li0.8Ni0.6Sb0.4O2. Table S1: Crystal structure refinement details. Table S2: Atomic positions. Table S3: Bond lengths and bond angles. References [53,54,55] are cited in the supplementary materials.

Author Contributions

Conceptualization, E.Z. and E.V.; methodology, E.V., A.V. and V.N.; investigation, T.S., M.I., T.V. and I.S.; writing—original draft preparation, E.Z. and E.V.; writing—review and editing, A.V. All authors have read and agreed to the published version of the manuscript.

Funding

This work was supported by grants 14-03-01122 (I.S. and V.N.) and 18-02-00664 (T.S. and M.I.) from the Russian Foundation for Basic Research. E.V. would like to thank financial support from the government assignment for FRC Kazan scientific Center of RAS. T.V. acknowledges the support by Russian Scientific Foundation through grant 19-42-02010: A.V. acknowledges the support of thermodynamic measurements by Megagrant Program of the Government of Russian Federation through the project 075–15–2021-604.

Institutional Review Board Statement

Not applicable.

Informed Consent Statement

Not applicable.

Data Availability Statement

Not applicable.

Conflicts of Interest

The authors declare no conflict of interest.

References

  1. Novoselov, K.S.; Geim, A.K.; Morozov, S.V.; Jiang, D.E.; Zhang, Y.; Dubonos, S.V.; Grigorieva, I.V.; Firsov, A.A. Electric field effect in atomically thin carbon films. Science 2004, 306, 666–669. [Google Scholar] [CrossRef] [PubMed] [Green Version]
  2. Geim, A.K.; Novoselov, K.S. The rise of graphene. Nat. Mater. 2007, 6, 183–191. [Google Scholar] [CrossRef]
  3. Cao, G.; De-Long, L. Frontiers of 4d- and 5d-Transition Metal Oxides; World Scientific: Singapore, 2013. [Google Scholar] [CrossRef] [Green Version]
  4. Witczak-Krempa, W.; Chen, G.; Kim, Y.B.; Balents, L. Correlated quantum phenomena in the strong spin-orbit regime. Annu. Rev. Condens. Matter Phys. 2014, 5, 57–82. [Google Scholar] [CrossRef] [Green Version]
  5. Kitaev, A. Anyons in an exactly solved model and beyond. Ann. Phys. 2006, 321, 2–111. [Google Scholar] [CrossRef] [Green Version]
  6. Liu, H.; Chaloupka, J.; Khaliullin, G. Kitaev spin liquid in 3d transition metal compounds. Phys. Rev. Lett. 2020, 125, 047201. [Google Scholar] [CrossRef]
  7. Berezinskii, V. Destruction of long-range order in one-dimensional and two-dimensional systems having a continuous symmetry group i. classical systems. J. Exp. Theor. Phys. 1971, 32, 493–500. [Google Scholar]
  8. Kosterlitz, J.M.; Thouless, D.J. Ordering, metastability and phase transitions in two-dimensional systems. J. Phys. C Solid State Phys. 1973, 6, 1181–1203. [Google Scholar] [CrossRef]
  9. Iakovleva, M.; Janson, O.; Grafe, H.J.; Dioguardi, A.P.; Maeter, H.; Yeche, N.; Klauss, H.H.; Pascua, G.; Luetkens, H.; Möller, A.; et al. Ground state and low-temperature magnetism of the quasi-two-dimensional honeycomb compound InCu2/3V1/3O3. Phys. Rev. B 2019, 100, 144442. [Google Scholar] [CrossRef] [Green Version]
  10. Li, P.H.; Bishop, R.F.; Farnell, D.J.; Campbell, C.E. Phase diagram of a frustrated Heisenberg antiferromagnet on the honeycomb lattice: The J1-J2-J3 model. Phys. Rev. B 2012, 86, 144404. [Google Scholar] [CrossRef] [Green Version]
  11. Bramwell, S.T.; Holdsworth, P.C. Magnetization and universal subcritical behaviour in two-dimensional XY magnets. J. Phys. Condens. Matter 1993, 5, L53–L59. [Google Scholar] [CrossRef]
  12. Villain, J.; Bidaux, R.; Carton, J.P.; Conte, R. Order as an effect of disorder. J. Phys. Fr. 1980, 41, 1263–1272. [Google Scholar] [CrossRef]
  13. Mydosh, J. Spin Glasses: An Experimental Introduction, 1st ed.; CRC Press: London, UK, 1993. [Google Scholar] [CrossRef]
  14. Hoines, L.; Stubi, R.; Loloee, R.; Cowen, J.A.; Bass, J. How thin a spin glass is still a spin glass? Phys. Rev. Lett. 1991, 66, 1224–1227. [Google Scholar] [CrossRef] [PubMed]
  15. Wen, J.; Yu, S.L.; Li, S.; Yu, W.; Li, J.X. Experimental identification of quantum spin liquids. npj Quantum Mater. 2019, 4, 12. [Google Scholar] [CrossRef] [Green Version]
  16. Zhong, R.; Chung, M.; Kong, T.; Nguyen, L.T.; Lei, S.; Cava, R.J. Field-induced spin-liquid-like state in a magnetic honeycomb lattice. Phys. Rev. B 2018, 98, 220407. [Google Scholar] [CrossRef]
  17. Takeya, H.; Ishida, K.; Kitagawa, K.; Ihara, Y.; Onuma, K.; Maeno, Y.; Nambu, Y.; Nakatsuji, S.; MacLaughlin, D.E.; Koda, A.; et al. Spin dynamics and spin freezing behavior in the two-dimensional antiferromagnet NiGa2S4 revealed by Ga-NMR, NQR and SR measurements. Phys. Rev. B 2008, 77, 054429. [Google Scholar] [CrossRef] [Green Version]
  18. Graham, J.N.; Coak, M.J.; Son, S.; Suard, E.; Park, J.G.; Clark, L.; Wildes, A.R. Local nuclear and magnetic order in the two-dimensional spin glass Mn0.5Fe0.5PS3. Phys. Rev. Mater. 2020, 4, 084401. [Google Scholar] [CrossRef]
  19. Bono, D.; Limot, L.; Mendels, P.; Collin, G.; Blanchard, N. Correlations, spin dynamics, defects: The highly frustrated kagome bilayer. Low Temp. Phys. 2005, 31, 704–721. [Google Scholar] [CrossRef] [Green Version]
  20. Žukovič, A.B.; Borovskiy, M.; Szałowski, K. Spinglass-like ordering in a frustrated j1–j2 ising antiferromagnet on a honeycomb lattice. Acta Phys. Pol. A 2020, 137, 619–621. [Google Scholar] [CrossRef]
  21. Silverstein, H.J.; Fritsch, K.; Flicker, F.; Hallas, A.M.; Gardner, J.S.; Qiu, Y.; Ehlers, G.; Savici, A.T.; Yamani, Z.; Ross, K.A.; et al. Liquidlike correlations in single-crystalline Y2Mo2O7: An unconventional spin glass. Phys. Rev. B 2014, 89, 054433. [Google Scholar] [CrossRef] [Green Version]
  22. Pan, B.; Su, Y.; Ding, F.; Hu, M.; Lv, J. Lattice expansion and melting of spin glass state in the honeycomb antiferromagnet Bi3Mn4O12(NO3). J. Phys. Chem. C 2021, 125, 13641–13648. [Google Scholar] [CrossRef]
  23. Kundu, S.; Dey, T.; Mahajan, A.V.; Büttgen, N. LiZn2V3O8: A new geometrically frustrated cluster spin-glass. J. Phys. Condens. Matter 2019, 32, 115601. [Google Scholar] [CrossRef] [PubMed] [Green Version]
  24. Keren, A.; Mendels, P.; Horvatić, M.; Ferrer, F.; Uemura, Y.J.; Mekata, M.; Asano, T. 69;71Ga NMR in the kagome lattice compound SrCr9−xGa3+xO19. Phys. Rev. B 1998, 57, 10745–10749. [Google Scholar] [CrossRef]
  25. Dioguardi, A.P.; Crocker, J.; Shockley, A.C.; Lin, C.H.; Shirer, K.R.; Nisson, D.M.; Lawson, M.M.; Canfield, P.C.; Bud’ko, S.L.; Ran, S.; et al. Coexistence of cluster spin glass and superconductivity in Ba(Fe1−xCox)2As2 for 0.060 ≤ x ≤ 0.071. Phys. Rev. Lett. 2013, 111, 207201. [Google Scholar] [CrossRef] [Green Version]
  26. Zvereva, E.A.; Evstigneeva, M.A.; Nalbandyan, V.B.; Savelieva, O.A.; Ibragimov, S.A.; Volkova, O.S.; Medvedeva, L.I.; Vasiliev, A.N.; Klingeler, R.; Buechner, B. Monoclinic honeycomb-layered compound Li3Ni2SbO6: Preparation, crystal structure and magnetic properties. Dalton Trans. 2012, 41, 572–580. [Google Scholar] [CrossRef]
  27. Zvereva, E.A.; Stratan, M.I.; Ovchenkov, Y.A.; Nalbandyan, V.B.; Lin, J.Y.; Vavilova, E.L.; Iakovleva, M.F.; Abdel-Hafiez, M.; Silhanek, A.V.; Chen, X.J.; et al. Zigzag antiferromagnetic quantum ground state in monoclinic honeycomb lattice antimonates A3Ni2SbO6 (a = Li; Na). Phys. Rev. B 2015, 92, 144401. [Google Scholar] [CrossRef] [Green Version]
  28. Kurbakov, A.I.; Korshunov, A.N.; Podchezertsev, S.Y.; Malyshev, A.L.; Evstigneeva, M.A.; Damay, F.; Park, J.; Koo, C.; Klingeler, R.; Zvereva, E.A.; et al. Zigzag spin structure in layered honeycomb Li3Ni2SbO6: A combined diffraction and antiferromagnetic resonance study. Phys. Rev. B 2017, 96, 024417. [Google Scholar] [CrossRef]
  29. You, Y.; Kim, S.O.; Manthiram, A. A honeycomb-layered oxide cathode for sodium-ion batteries with suppressed P3–O1 phase transition. Adv. Energy Mater. 2017, 7, 1601698. [Google Scholar] [CrossRef]
  30. Twu, N.; Li, X.; Urban, A.; Balasubramanian, M.; Lee, J.; Liu, L.; Ceder, G. Designing new lithium-excess cathode materials from percolation theory: Nanohighways in LixNi(2−4x)/3Sbx/3O2. Nano Lett. 2015, 15, 596–602. [Google Scholar] [CrossRef] [Green Version]
  31. Xiao, L.; Ding, Z.; Huang, Q.; Chen, C.; Feng, Y.; Liang, C.; Gao, P.; Wei, W. Electronic-structure tuning of honeycomb layered oxide cathodes for superior performance. Acta Mater. 2020, 199, 34–41. [Google Scholar] [CrossRef]
  32. Salikhov, T.; Klysheva, E.; Zvereva, E.; Nalbandyan, V.; Shukaev, I.; Medvedev, B.; Vavilova, E. Lithium diffusion in a new cathode material Li0.8[Ni0.6Sb0.4]O2 studied by 7Li NMR. Magn. Reson. Solids 2016, 18, 16207. [Google Scholar]
  33. Vavilova, E.; Nishimoto, S.; Salikhov, T.; Vasilchikova, T.; Nalbandyan, V.; Vasiliev, A.; Zvereva, E. Spin dynamics in the alternating chain system Li3Cu2SbO6 with defects probed by nuclear magnetic resonance technique. Phys. Rev. B 2021, 103, 094415. [Google Scholar] [CrossRef]
  34. Powder Diffraction File; Entry 00-57-861; International Centre for Diffraction Data: Newtown Square, PA, USA, 2007.
  35. Koo, C.; Zvereva, E.A.; Shukaev, I.L.; Richter, M.; Stratan, M.I.; Vasiliev, A.N.; Nalbandyan, V.B.; Klingeler, R. Static and dynamic magnetic response of fragmented haldane-like spin chains in layered Li3Cu2SbO6. J. Phys. Soc. Jpn. 2016, 85, 084702. [Google Scholar] [CrossRef] [Green Version]
  36. Körner, S.; Weber, A.; Hemberger, J.; Scheidt, E.W.; Stewart, G.R. UCu4Pd: A disordered antiferromagnetic compound. J. Low Temp. Phys. 2000, 121, 105–113. [Google Scholar] [CrossRef]
  37. Luo, Q.; Shen, J. Reentrant spin glass ordering in an Fe-based bulk metallic glass. J. Appl. Phys. 2015, 117, 053909. [Google Scholar] [CrossRef]
  38. Mulder, C.A.; van Duyneveldt, A.J.; Mydosh, J.A. Susceptibility of the CuMn spin-glass: Frequency and field dependences. Phys. Rev. B 1981, 23, 1384–1396. [Google Scholar] [CrossRef]
  39. Vijayanandhini, K.; Simon, C.; Pralong, V.; Caignaert, V.; Raveau, B. Spin glass to cluster glass transition in geometrically frustrated CaBaFe4−xLixO7 ferrimagnets. Phys. Rev. B 2009, 79, 224407. [Google Scholar] [CrossRef]
  40. Li, D.X.; Nimori, S.; Yamamura, T.; Shiokawa, Y. AC susceptibility studies of the spin freezing behavior in U2CuSi3. J. Appl. Phys. 2008, 103, 07B715. [Google Scholar] [CrossRef]
  41. Mukherjee, S.; Ranganathan, R.; Anilkumar, P.S.; Joy, P.A. Static and dynamic response of cluster glass in La0.5Sr0.5CoO3. Phys. Rev. B 1996, 54, 9267–9274. [Google Scholar] [CrossRef]
  42. Gunnarsson, K.; Svedlindh, P.; Nordblad, P.; Lundgren, L.; Aruga, H.; Ito, A. Dynamics of an Ising spin-glass in the vicinity of the spin-glass temperature. Phys. Rev. Lett. 1988, 61, 754–757. [Google Scholar] [CrossRef] [PubMed]
  43. Chakrabarty, T.; Mahajan, A.V.; Kundu, S. Cluster spin glass behavior in geometrically frustrated Zn3V3O8. J. Phys. Condens. Matter 2014, 26. [Google Scholar] [CrossRef] [PubMed] [Green Version]
  44. Losee, D.B.; McElearney, J.N.; Shankle, G.E.; Carlin, R.L.; Cresswell, P.J.; Robinson, W.T. An anisotropic low-dimensional ising system, [(CH3)3NH]CoCl3 · 2H2O: Its structure and canted antiferromagnetic behaviour. Phys. Rev. B 1973, 8, 2185–2199. [Google Scholar] [CrossRef]
  45. Tari, A. The Specific Heat of Matter at Low Temperatures; Imperial College Press: London, UK, 2003. [Google Scholar]
  46. Greedan, J.E.; Raju, N.P.; Maignan, A.; Simon, C.; Pedersen, J.S.; Niraimathi, A.M.; Gmelin, E.; Subramanian, M.A. Frustrated pyrochlore oxides, Y2Mn2O7, Ho2Mn2O7, and Yb2Mn2O7: Bulk magnetism and magnetic microstructure. Phys. Rev. B 1996, 54, 7189–7200. [Google Scholar] [CrossRef]
  47. Binder, K.; Young, A.P. Spin glasses: Experimental facts, theoretical concepts, and open questions. Rev. Mod. Phys. 1986, 58, 801–976. [Google Scholar] [CrossRef]
  48. Brodale, G.; Fisher, R.; Fogle, W.; Phillips, N.; van Curen, J. The effect of spin-glass ordering on the specific heat of CuMn. J. Magn. Magn. Mater. 1983, 31–34, 1331–1333. [Google Scholar] [CrossRef]
  49. Slichter, C.P. Principles of Magnetic Resonance; Springer: Berlin/Heidelberg, Germany, 1990. [Google Scholar] [CrossRef]
  50. Onsager, L. Crystal statistics. I. A Two-Dimensional Model with an Order-Disorder Transition. Phys. Rev. 1944, 65, 117–149. [Google Scholar] [CrossRef]
  51. Pelissetto, A.; Vicari, E. Critical phenomena and renormalization-group theory. Phys. Rep. 2002, 368, 549–727. [Google Scholar] [CrossRef] [Green Version]
  52. Zvereva, E.A.; Raganyan, G.V.; Vasilchikova, T.M.; Nalbandyan, V.B.; Gafurov, D.A.; Vavilova, E.L.; Zakharov, K.V.; Koo, H.J.; Pomjakushin, V.Y.; Susloparova, A.E.; et al. Hidden magnetic order in the triangular-lattice magnet Li2MnTeO6. Phys. Rev. B 2020, 102, 094433. [Google Scholar] [CrossRef]
  53. Larson, A.C.; Von Dreele, R.B. General Structure Analysis System (GSAS); Los Alamos National Laboratory Report LAUR86-748; Los Alamos National Laboratory: Los Alamos, NM, USA, 2004. [Google Scholar]
  54. Toby, B.H. EXPGUI, a graphical user interface for GSAS. J. Appl. Cryst. 2001, 34, 210–213. [Google Scholar] [CrossRef] [Green Version]
  55. Shannon, R.D. Revised Effective Ionic Radii and Systematic Studies of Interatomic Distances in Halides and Chalcogenides. Acta Crystallogr. 1976, 32, 751–767. [Google Scholar] [CrossRef]
Figure 1. (Left) Comparison of low-angle parts of XRD patterns where most intensive foreign and superlattice reflections are observed. (a) Li3Ni2SbO6 [26]; (b) Li0.8Ni0.6Sb0.4O2 or “Li2.4Ni1.8Sb1.2O6”; (c) Same after 0.5 h at 1270 K; (d) Li2.6Ni2.2SbO6. Filled triangles (▼), superlattice reflections due to Ni/Sb ordering; asterisks (*), reflections from LiSbO3; arrows (↓), reflections from NiO (only found in a). (Right) Top view on the magnetic plane of Li3Ni2SbO6. The little light-blue circles are oxygen. Nickel ions are in the center of the green oxygen octahedra, antimony ions are in the yellow ones. The dark blue line marks the honeycomb motif in the magnetic structure of the plane.
Materials 14 06785 g001
Figure 2. (Left) Static susceptibility of Li2.4Ni1.8Sb1.2O6 as a function of the temperature: field cooled (solid black circles) and zero field cooled (open blue circles) at external field of 0.7 T. Curie-Weiss fit is shown by red dashed curve. (Right) derivative of the low temperature part of zero field cooling static susceptibility.
Materials 14 06785 g002
Figure 3. Temperature dependence of the real part of ac susceptibility, measured at different frequency with zero external dc magnetic field (main panel). Bottom inset shows temperature dependence of the imaginary part χ″ of ac susceptibility.
Materials 14 06785 g003
Figure 4. (Left) The fit of the shift of Tf to the critical scaling and (Right) to the Vogel-Fulcher law.
Materials 14 06785 g004
Figure 5. The temperature dependencies of specific heat Cp(T) in zero magnetic field for Li2.4Ni1.8Sb1.2O6 (open symbols) in comparison with undoped Li3Ni2SbO6 (triangle symbols) and its isostructural non-magnetic analogue Li3Zn2SbO6 (filled symbols). The solid line represents the lattice contribution of the specific heat. Inset: the magnetic specific heat Cm(T) (open circles) and the magnetic entropy Sm(T) (open squares).
Materials 14 06785 g005
Figure 6. The temperature dependencies of specific heat Cp/T(T) under various magnetic fields. The inset represents the temperature dependence of parameter B (see in text).
Materials 14 06785 g006
Figure 7. 7Li NMR spectra at selected temperatures obtained at field of 0.724 T. Note that the scale on (Right) is enlarged compared to the (Left) one.
Materials 14 06785 g007
Figure 8. (Left) The temperature dependence of 7Li NMR linewidth ω(T). Inset presents the low-temperature part of the ω(T) dependence. (Right) Inverse linewidth vs. temperature (see text for details).
Materials 14 06785 g008
Figure 9. (Left) Temperature dependence of 7Li NMR line shift. Inset: the low-temperature part of the K(T), line is a guide for eye. (Right) local spin susceptibility versus bulk magnetic susceptibility. Inset shows low-temperature region.
Materials 14 06785 g009
Figure 10. (Left) Temperature dependence of the 7Li spin-lattice relaxation rate T1−1 (solid squares) and transverse relaxation rate T2−1 (open squares) for Li2.4Ni1.8Sb1.2O6 at B = 0.724T. The inset shows a log-log plot of relaxation rate against the reduced temperature ε = |TTcrit |/Tcrit (Tcrit = 11.7 K). The dashed line represents fit with the critical exponent according to Equation (9). (Right) 1/(T1) as a function of temperature for stoichiometric (open triangles) and lithium-deficient (solid circles) samples. Dashed lines show constant level for Li2.4Ni1.8Sb1.2O6 (red) and Li3Ni2SbO6 (blue).
Materials 14 06785 g010
Figure 11. The ln(χT1T) curve as a function of inverse temperature for (Left) lithium deficient and (Right) stoichiometric samples. Red dashed lines are fits according to Equation (8).
Materials 14 06785 g011
Figure 12. (Upper) The 7Li spectrum for Li3Ni2SbO6 at 4.2 K and (Bottom) for Li2.4Ni1.8Sb1.2O6 at 1.5 K obtained at frequency of 15.79 MHz. The red line is the result of dipole-dipole calculations; dashed lines represent the calculated contribution of different magnetically nonequivalent 7Li positions in frame of the powder averaging of the zig-zag model.
Materials 14 06785 g012
Table 1. Crystal lattice parameters of Li3Ni2SbO6 and Li0.8Ni0.6Sb0.4O2.
CompositionHexagonal Setting (R-3m)Monoclinic Setting (C2/m)
a, Åc, Åa, Åb, Åc, Åβ, °
Li3Ni2SbO6
“LiNi0.67Sb0.33O2
PseudocellTrue supercell
2.989714.55755.18288.96785.1578109.69
Li0.8Ni0.6Sb0.4O2
“Li2.4Ni1.8Sb1.2O6
True cellSupposed supercell
3.002714.61035.20089.00805.1695109.59
Table 2. Parameters obtained from the data in Figure 4 fitted with the critical scaling approach and Vogel-Fulcher law.
ParameterCritical ScalingVogel-Fulcher
τ0[s]s(3.49 ± 0.61) × 10−11(1.92 ± 0.23) × 10−11
EA/kB [K]-36.3 ± 1.1
TSG and T0 [K]8.97.9
8.13 ± 0.33-
Publisher’s Note: MDPI stays neutral with regard to jurisdictional claims in published maps and institutional affiliations.

