
Comparative Life Cycle Assessment of Asphalt Mixtures Using Composite Admixtures of Lignin and Glass Fibers


Abstract
:1. Introduction
2. Objective and Methodology
2.1. Goal and Scope Definitions
2.1.1. Purpose of the Study
2.1.2. Functional Unit (FU)
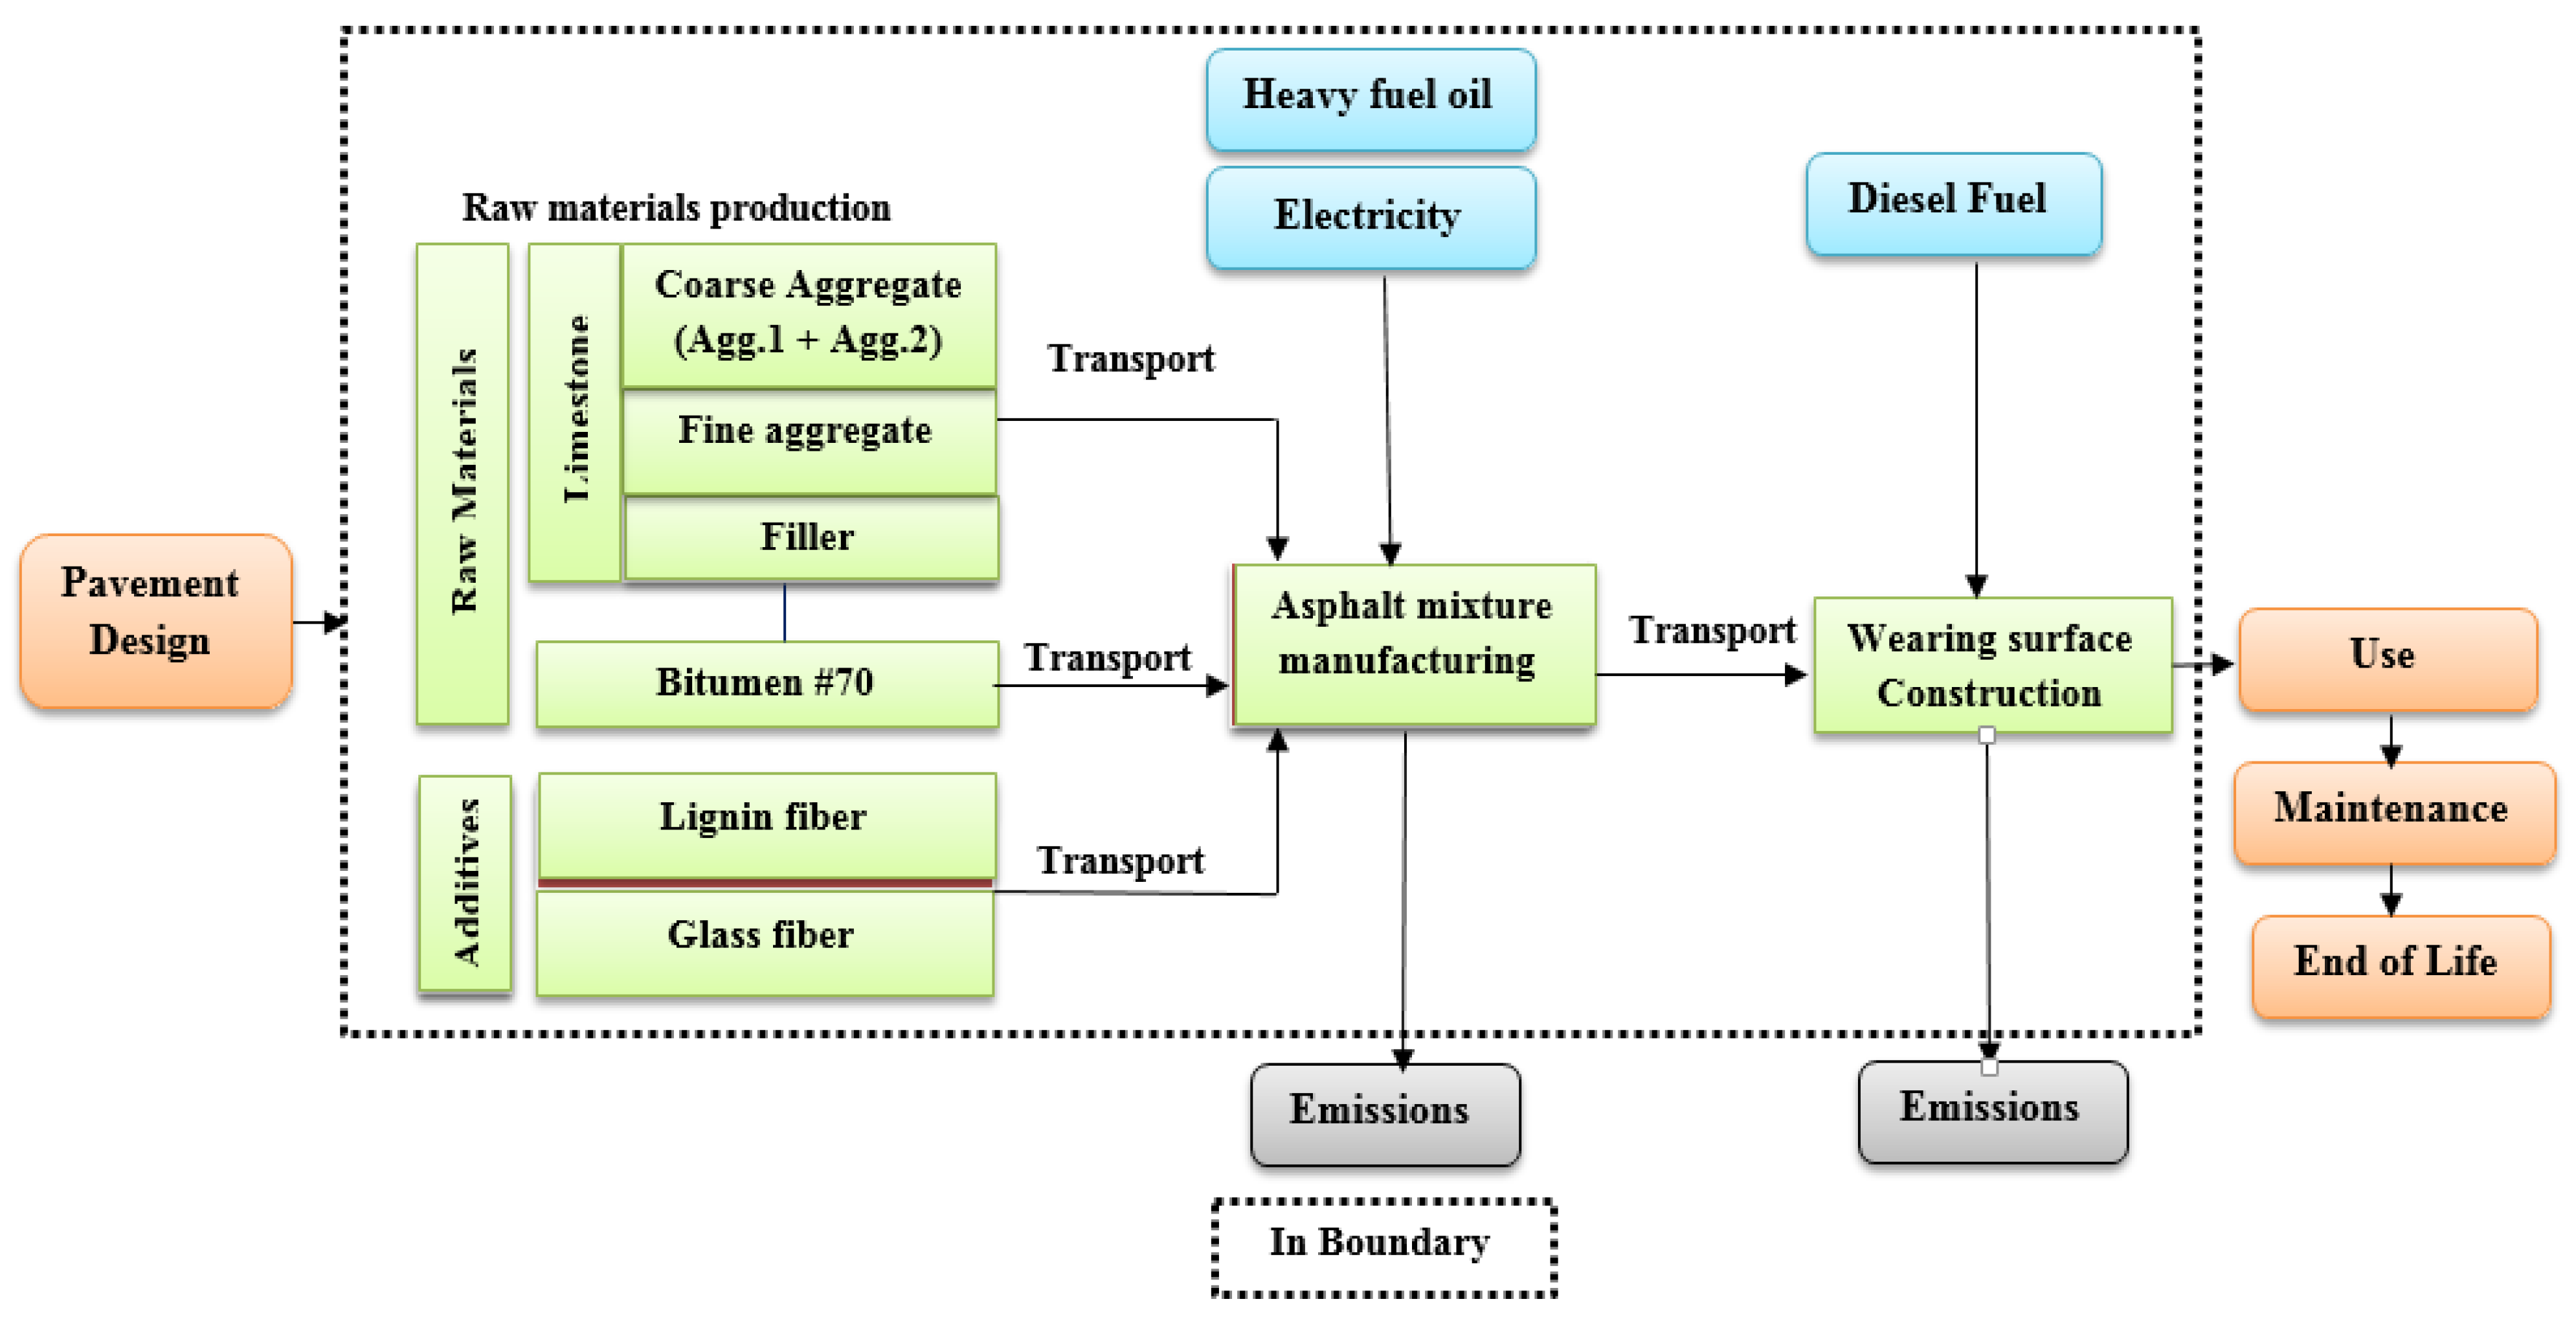
2.1.3. System Description and Boundaries
- Raw materials production: The extraction of raw materials is considered the beginning step on the life cycle of the pavement. Essentially, the asphalt mixtures contain natural aggregates with different sizes, filler, asphalt binder (bitumen), and additives (lignin and glass fibers).
- Asphalt mixture manufacturing: All component materials of asphalt mixtures are first moved to the asphalt plant; after that, the aggregate is screened and dried, the asphalt is heated, and finally all components are mixed.
- Transportation: This phase includes the transportation of materials to the asphalt mixing plant after the process of raw material extraction. In addition, it includes the transportation of the mixtures to the pavement construction site after the process of asphalt mixtures manufacturing, as it is delivered to the construction site by the highway.
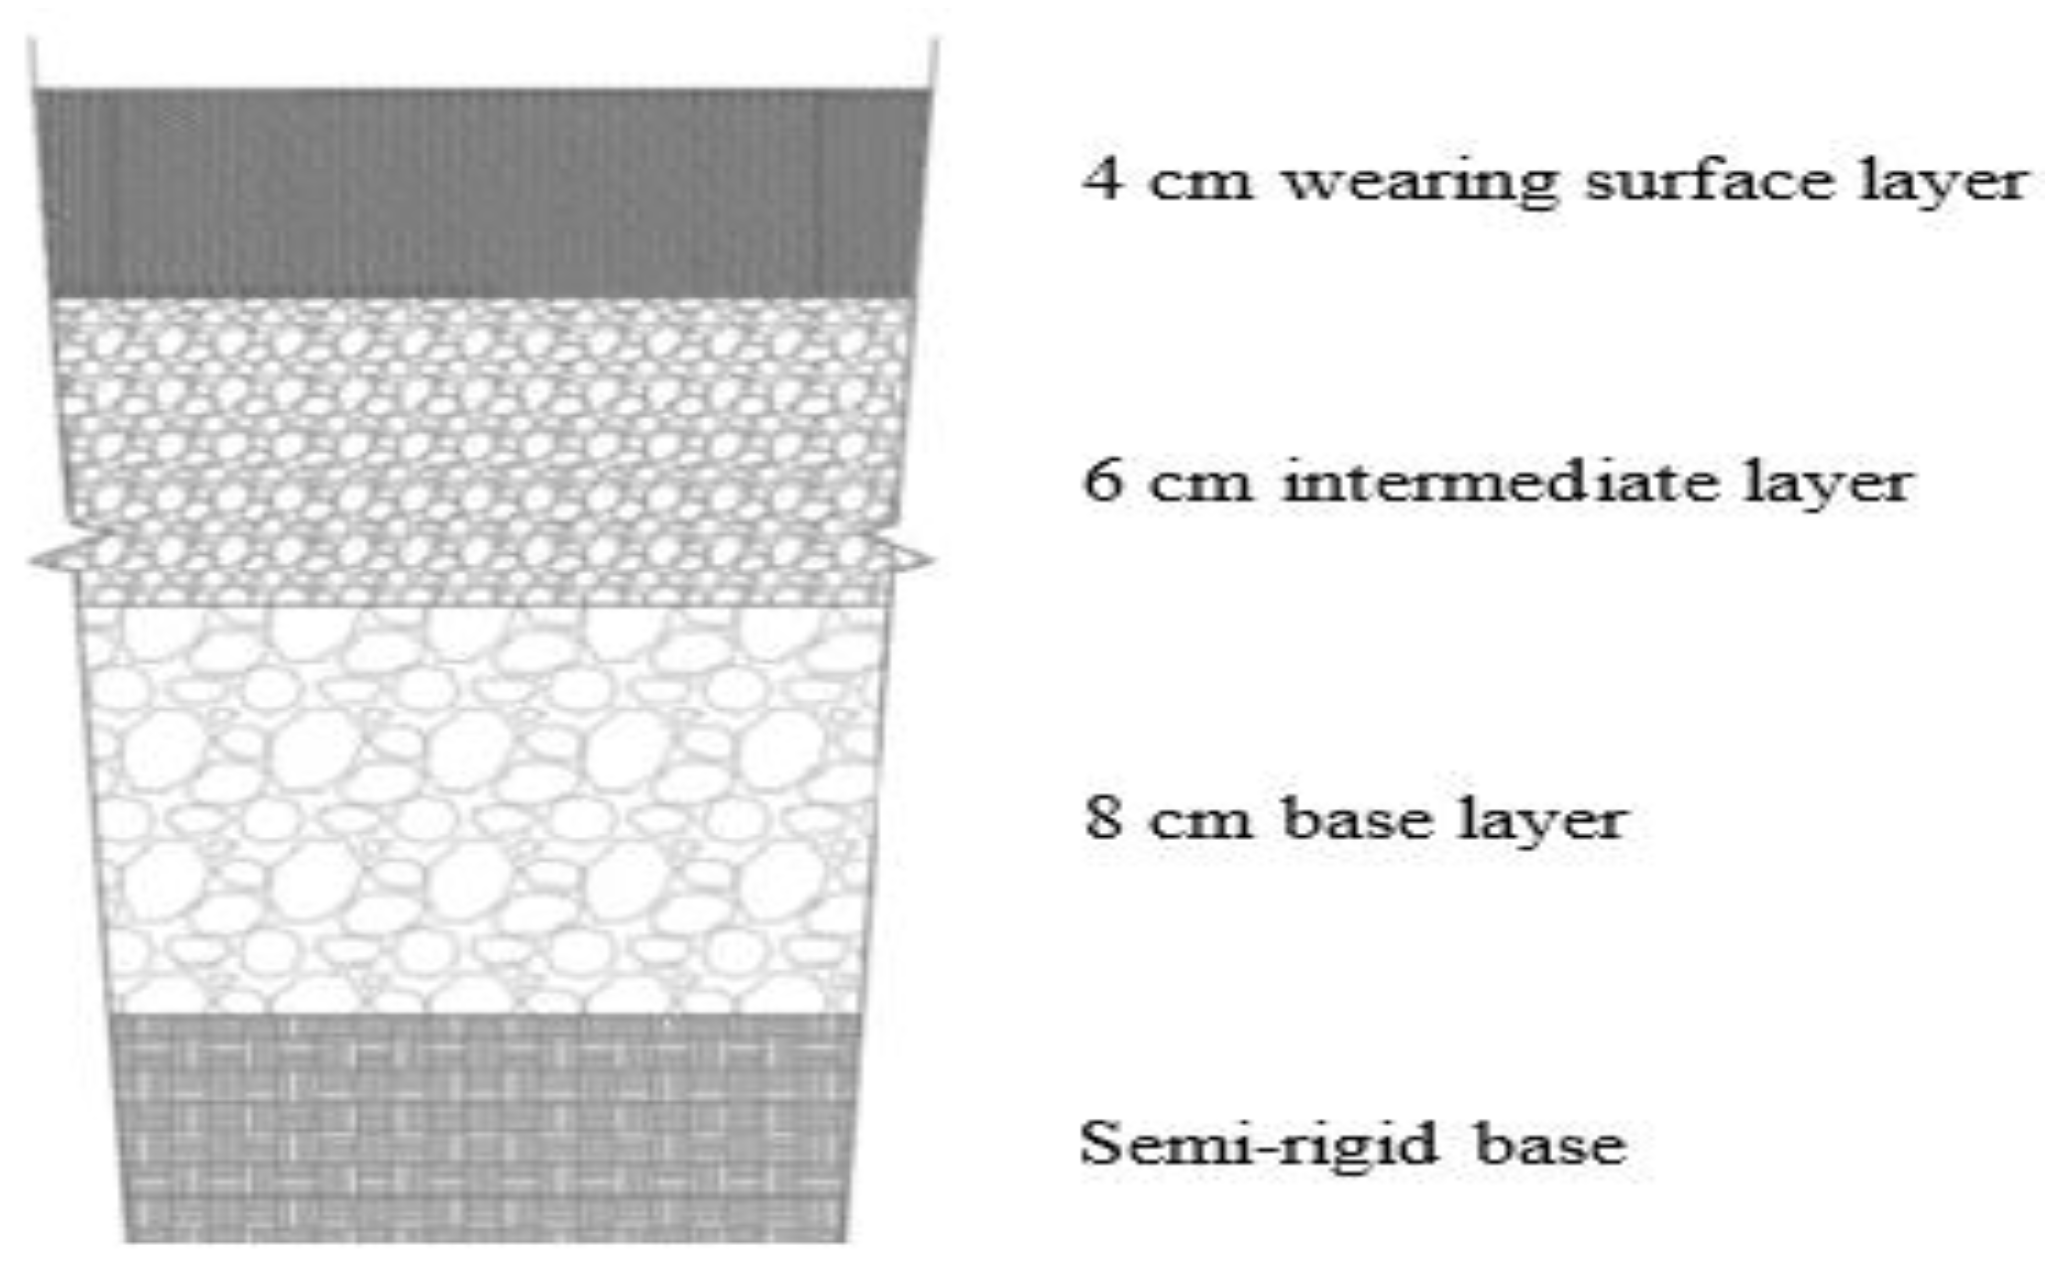
- Pavement construction: The construction of road pavement includes many processes, namely: clearing of the site, excavation, compaction of subgrade layer, and construction of the sub base layer, base layer, and wearing surface layer. The similar activities in the compared alternatives can be removed in LCA studies, so only the construction of the wearing surface layer process is considered in this study. The structure of the pavement shown in Figure 1 are compared among four asphalt mixtures with similar geometry but with different wearing surface layers. Each wearing surface layer for each asphalt mixture used different types of additive and different quantities of mixtures components.
2.1.4. Data Sources and Quality
2.1.5. Assumptions and Limitations
- The environmental impacts resulting from material loading onto the truck were neglected.
- The environmental impacts resulting from phases of pavement design, use, and end-of-life were not included in the system boundaries of this study, as the similar activities in the compared alternatives can be removed in LCA studies [24].
- The environmental impacts related to the transportation stage were considered for only the one-way trip of materials transportation to the asphalt mixing plant and asphalt mixtures transportation to the pavement construction site, whereas the return trips of empty trucks were ignored.
- The environmental impacts resulting from only the asphalt mixture manufacturing were considered, whereas the asphalt plant construction, including machinery and electric installation, were ignored.
3. Life Cycle Inventory (LCI)
3.1. Raw Materials Production Stage
3.2. Asphalt Mixtures Manufacturing Stage
3.3. Transportation Stage
3.4. Wearing Surface Construction Stage
3.5. Mass Balances for Different Asphalt Mixtures
4. Life Cycle Impact Assessment (LCIA)
4.1. Selection of LCIA Methodology and Impact Categories
4.2. Classification (Assignment of LCI Results)
4.3. Characterization (Calculation of Category Indicator Results)
4.4. Normalization
4.5. Weighting/Grouping
5. Results and Discussion
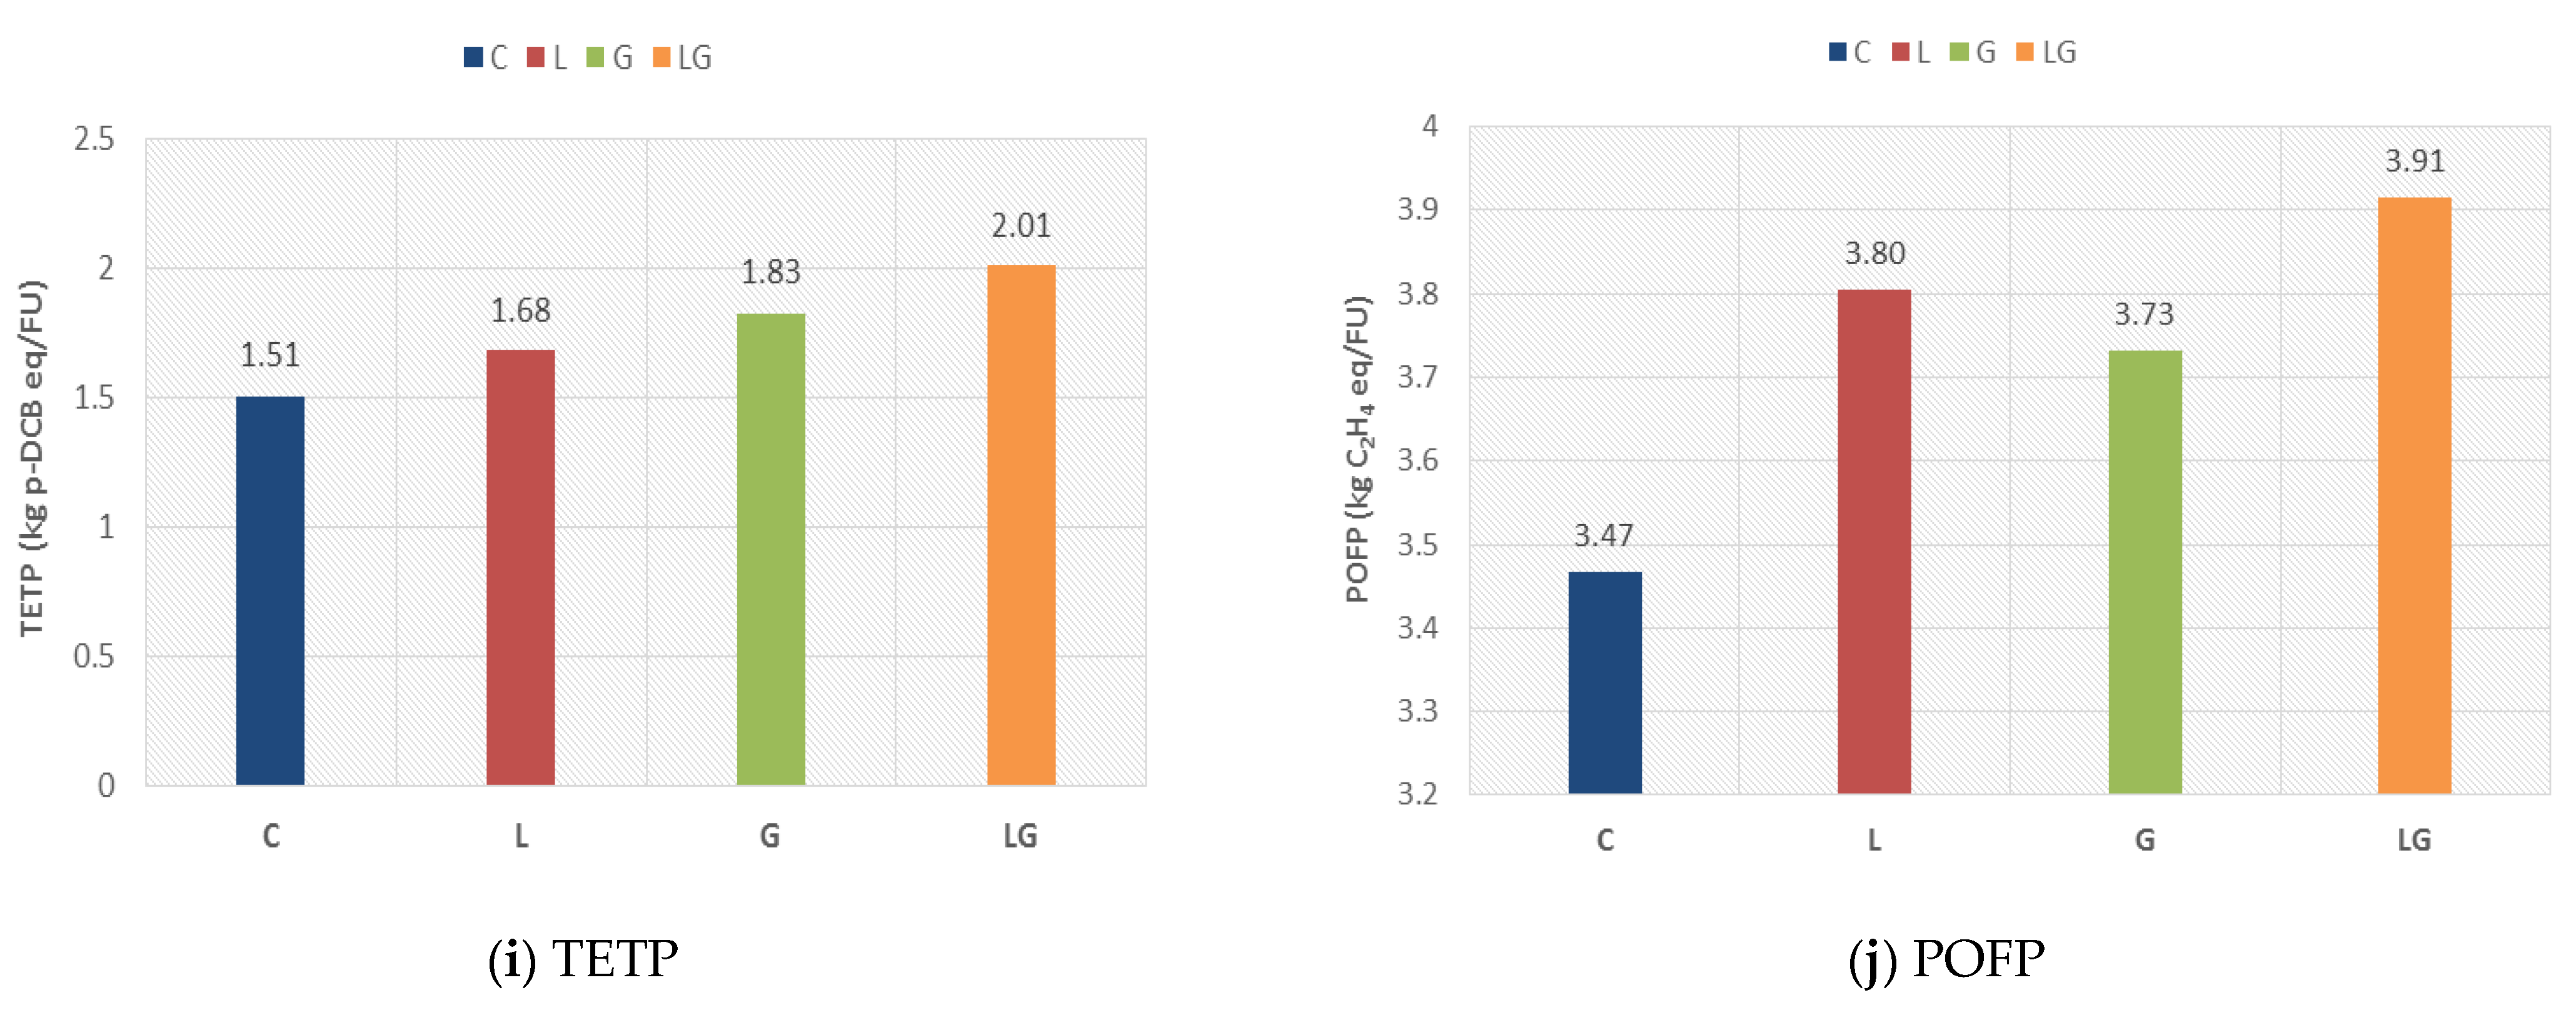
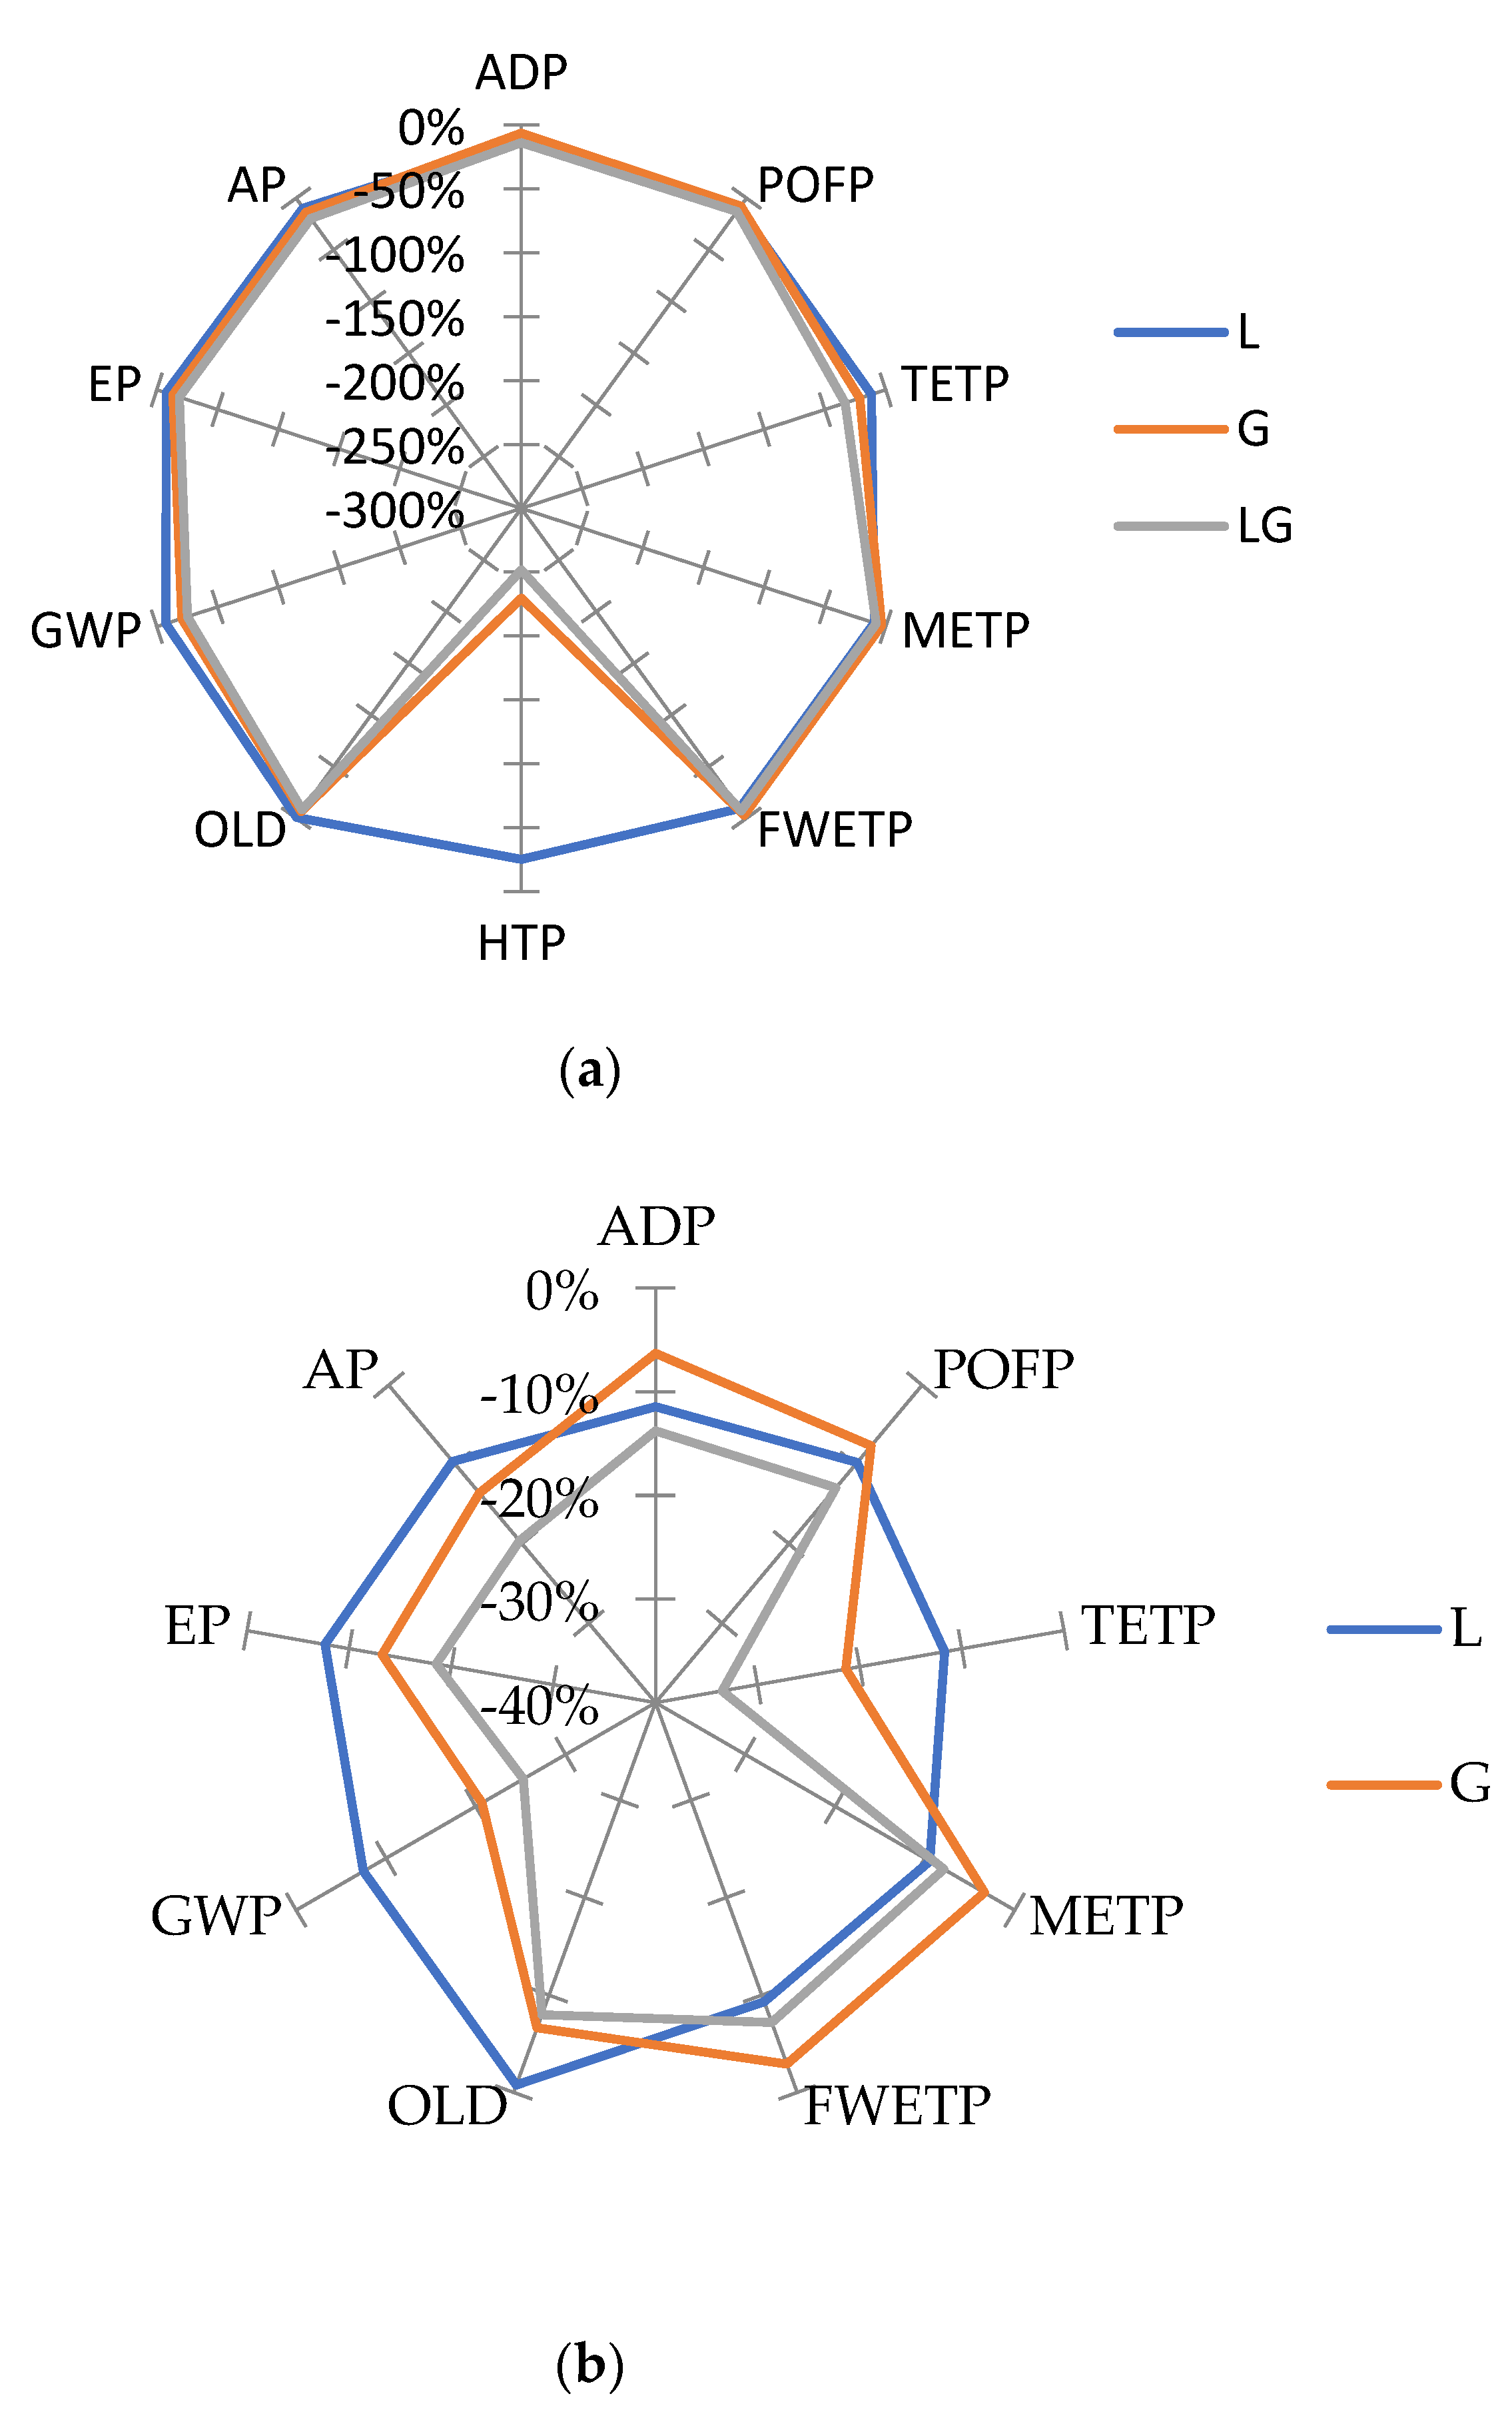
5.1. Comparison of the Characterization Results
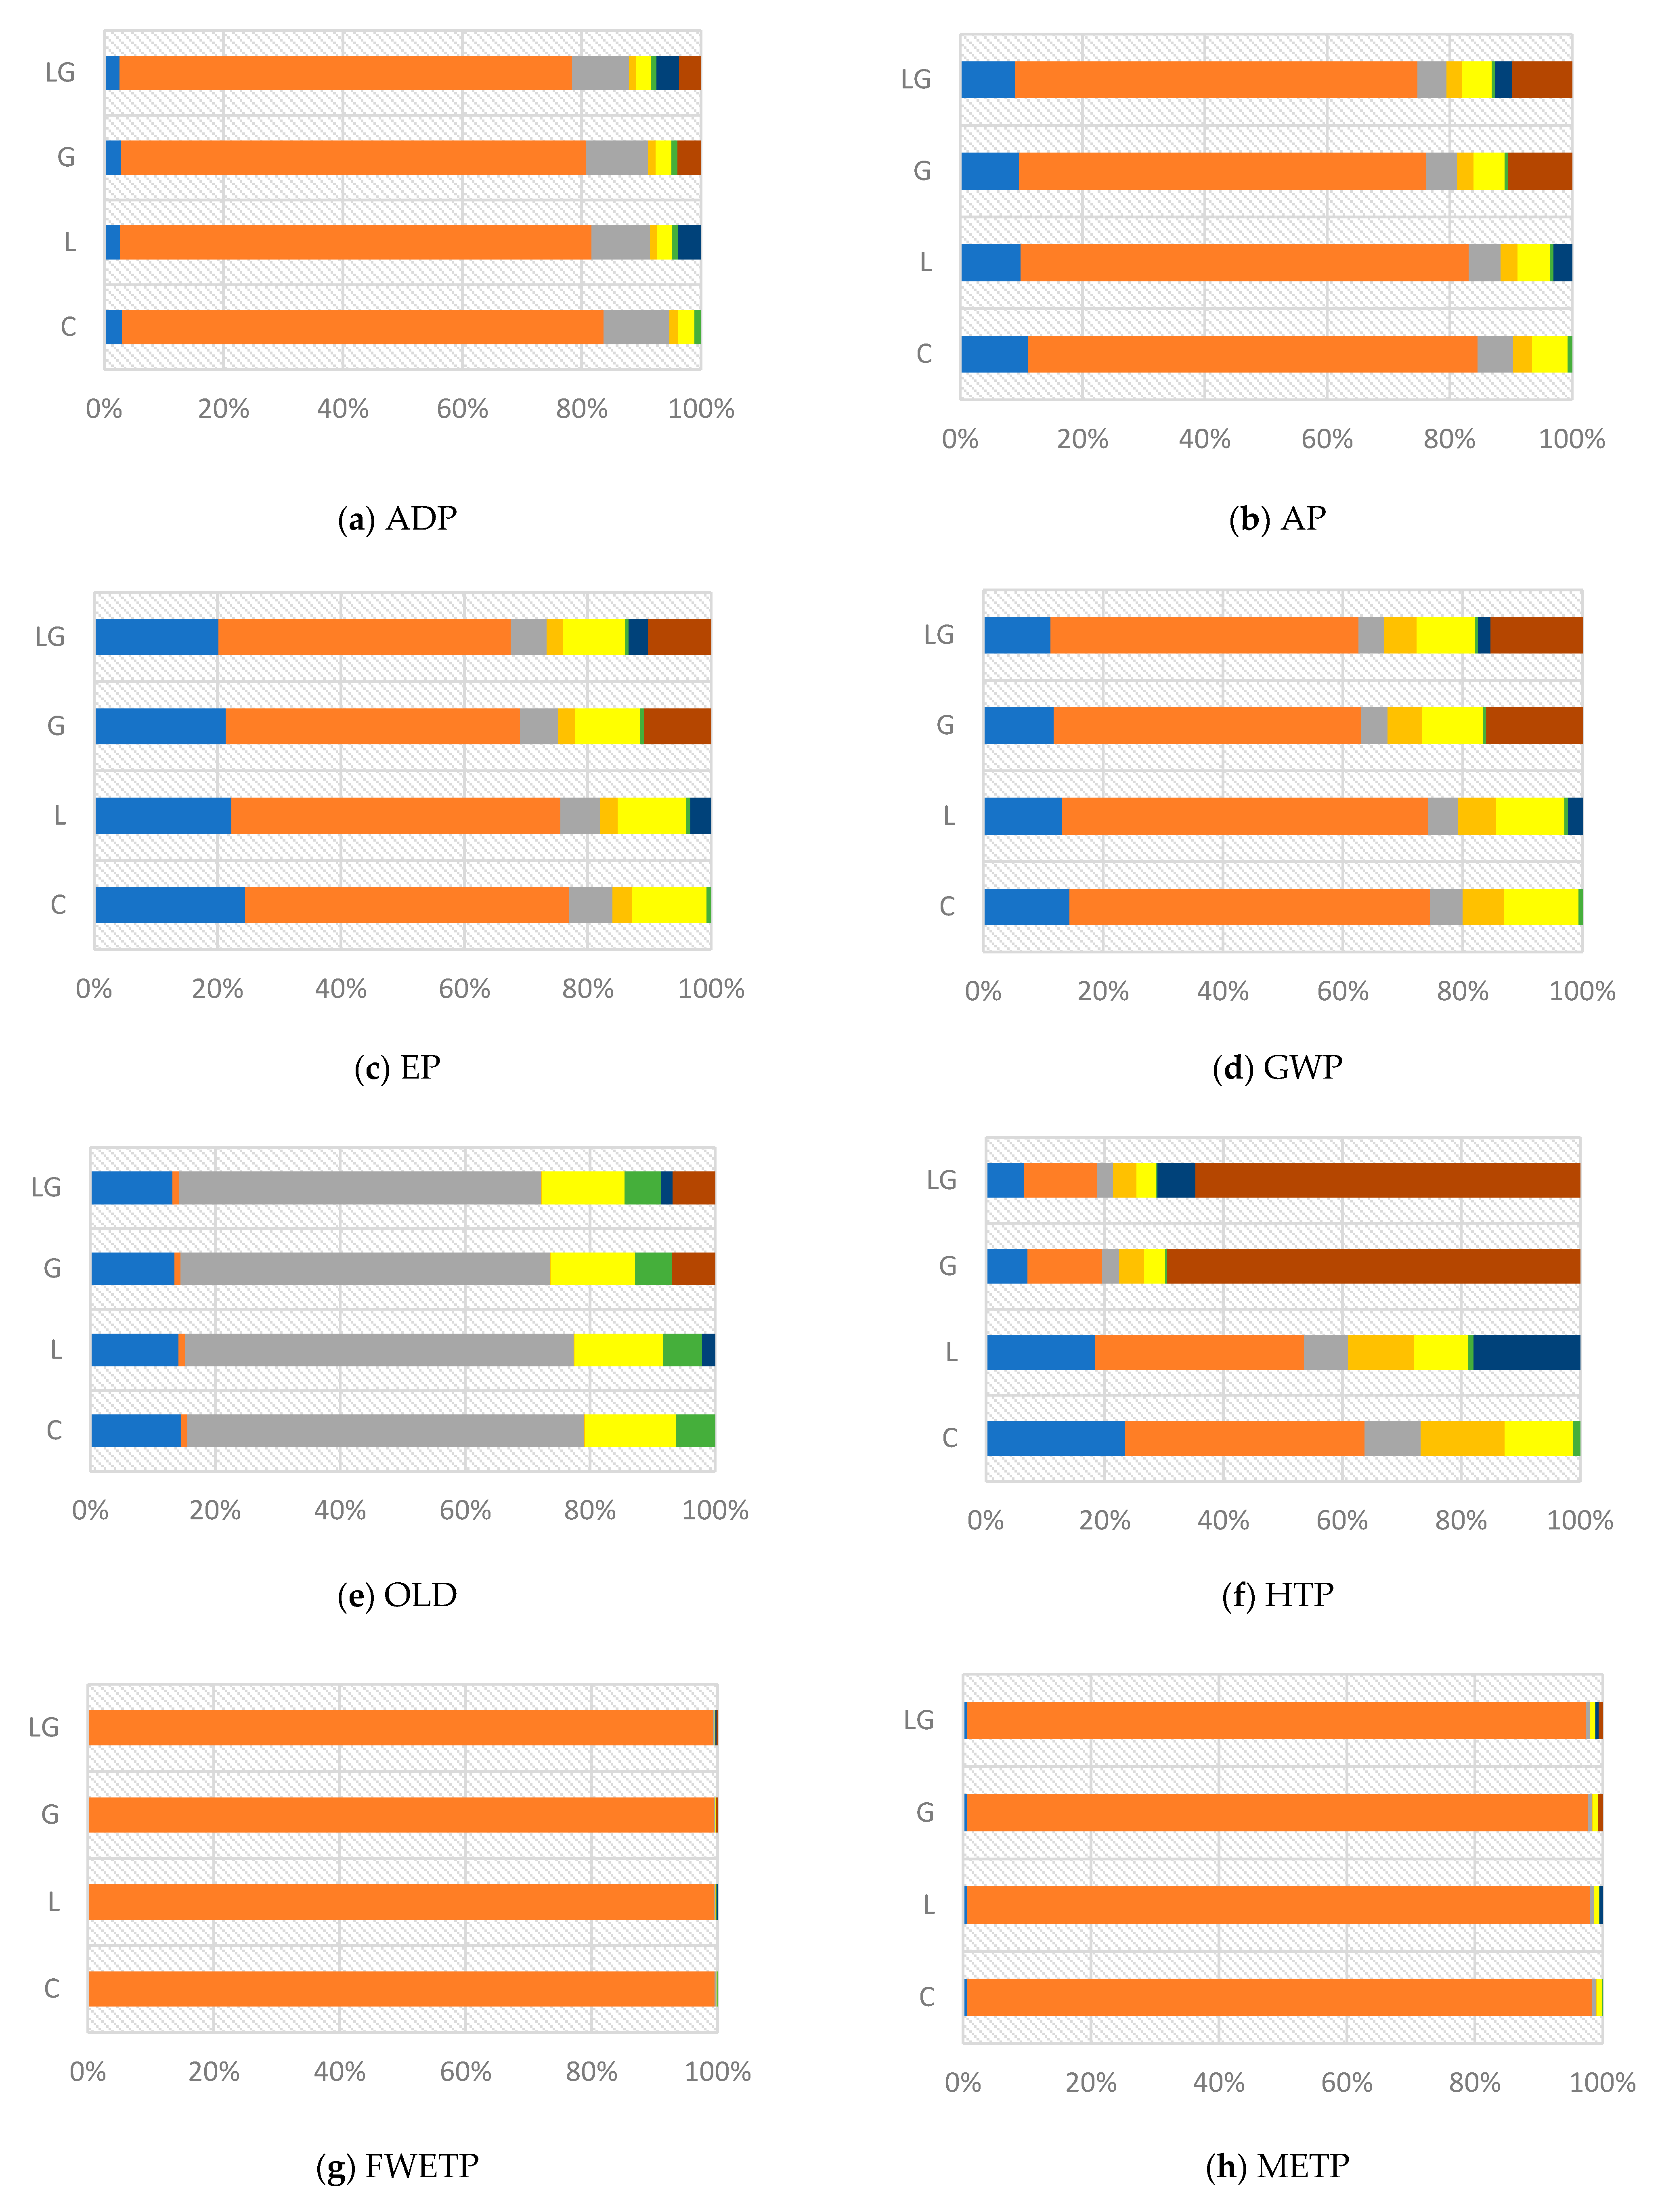
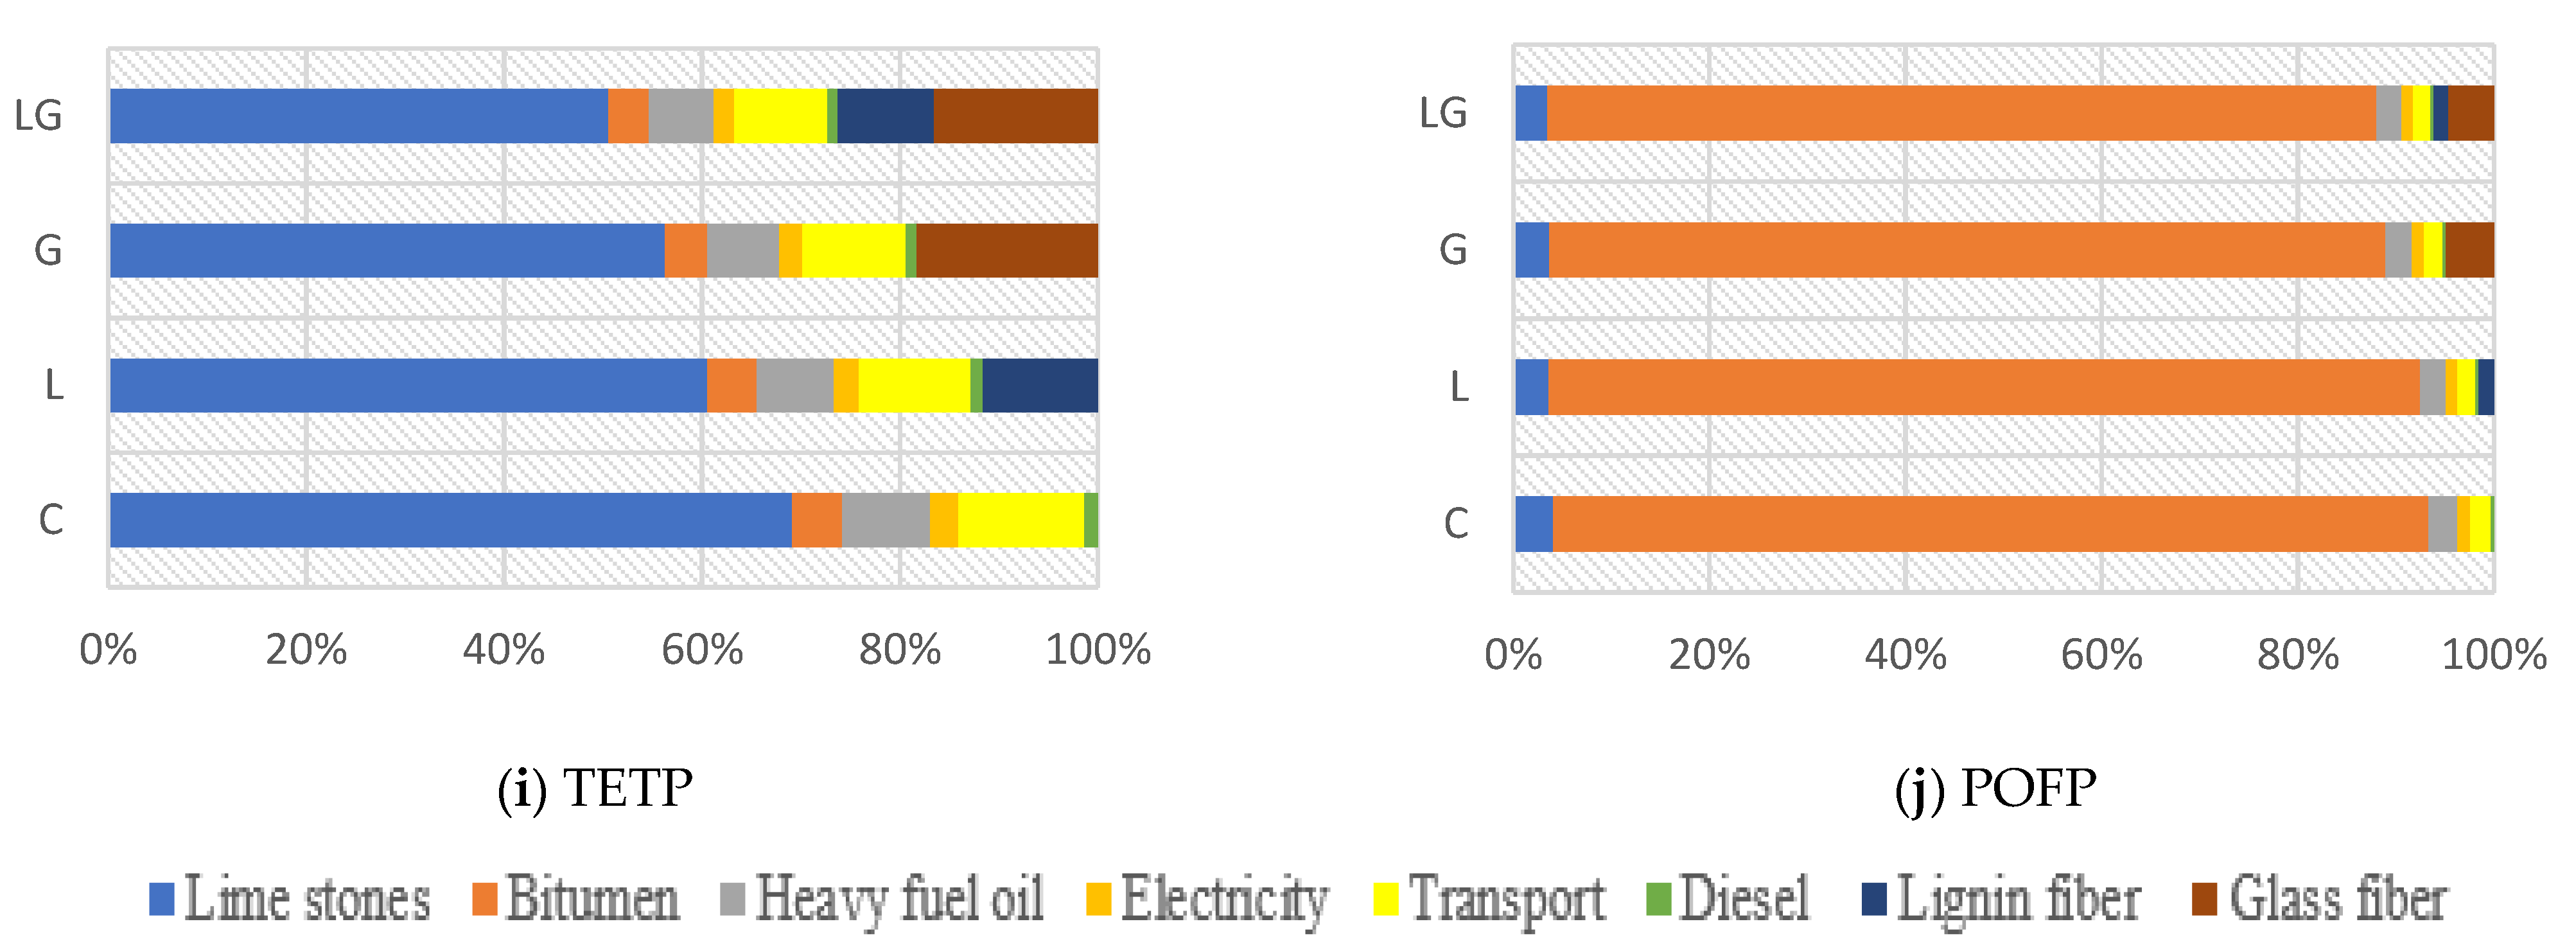
5.2. Process Contribution Analysis
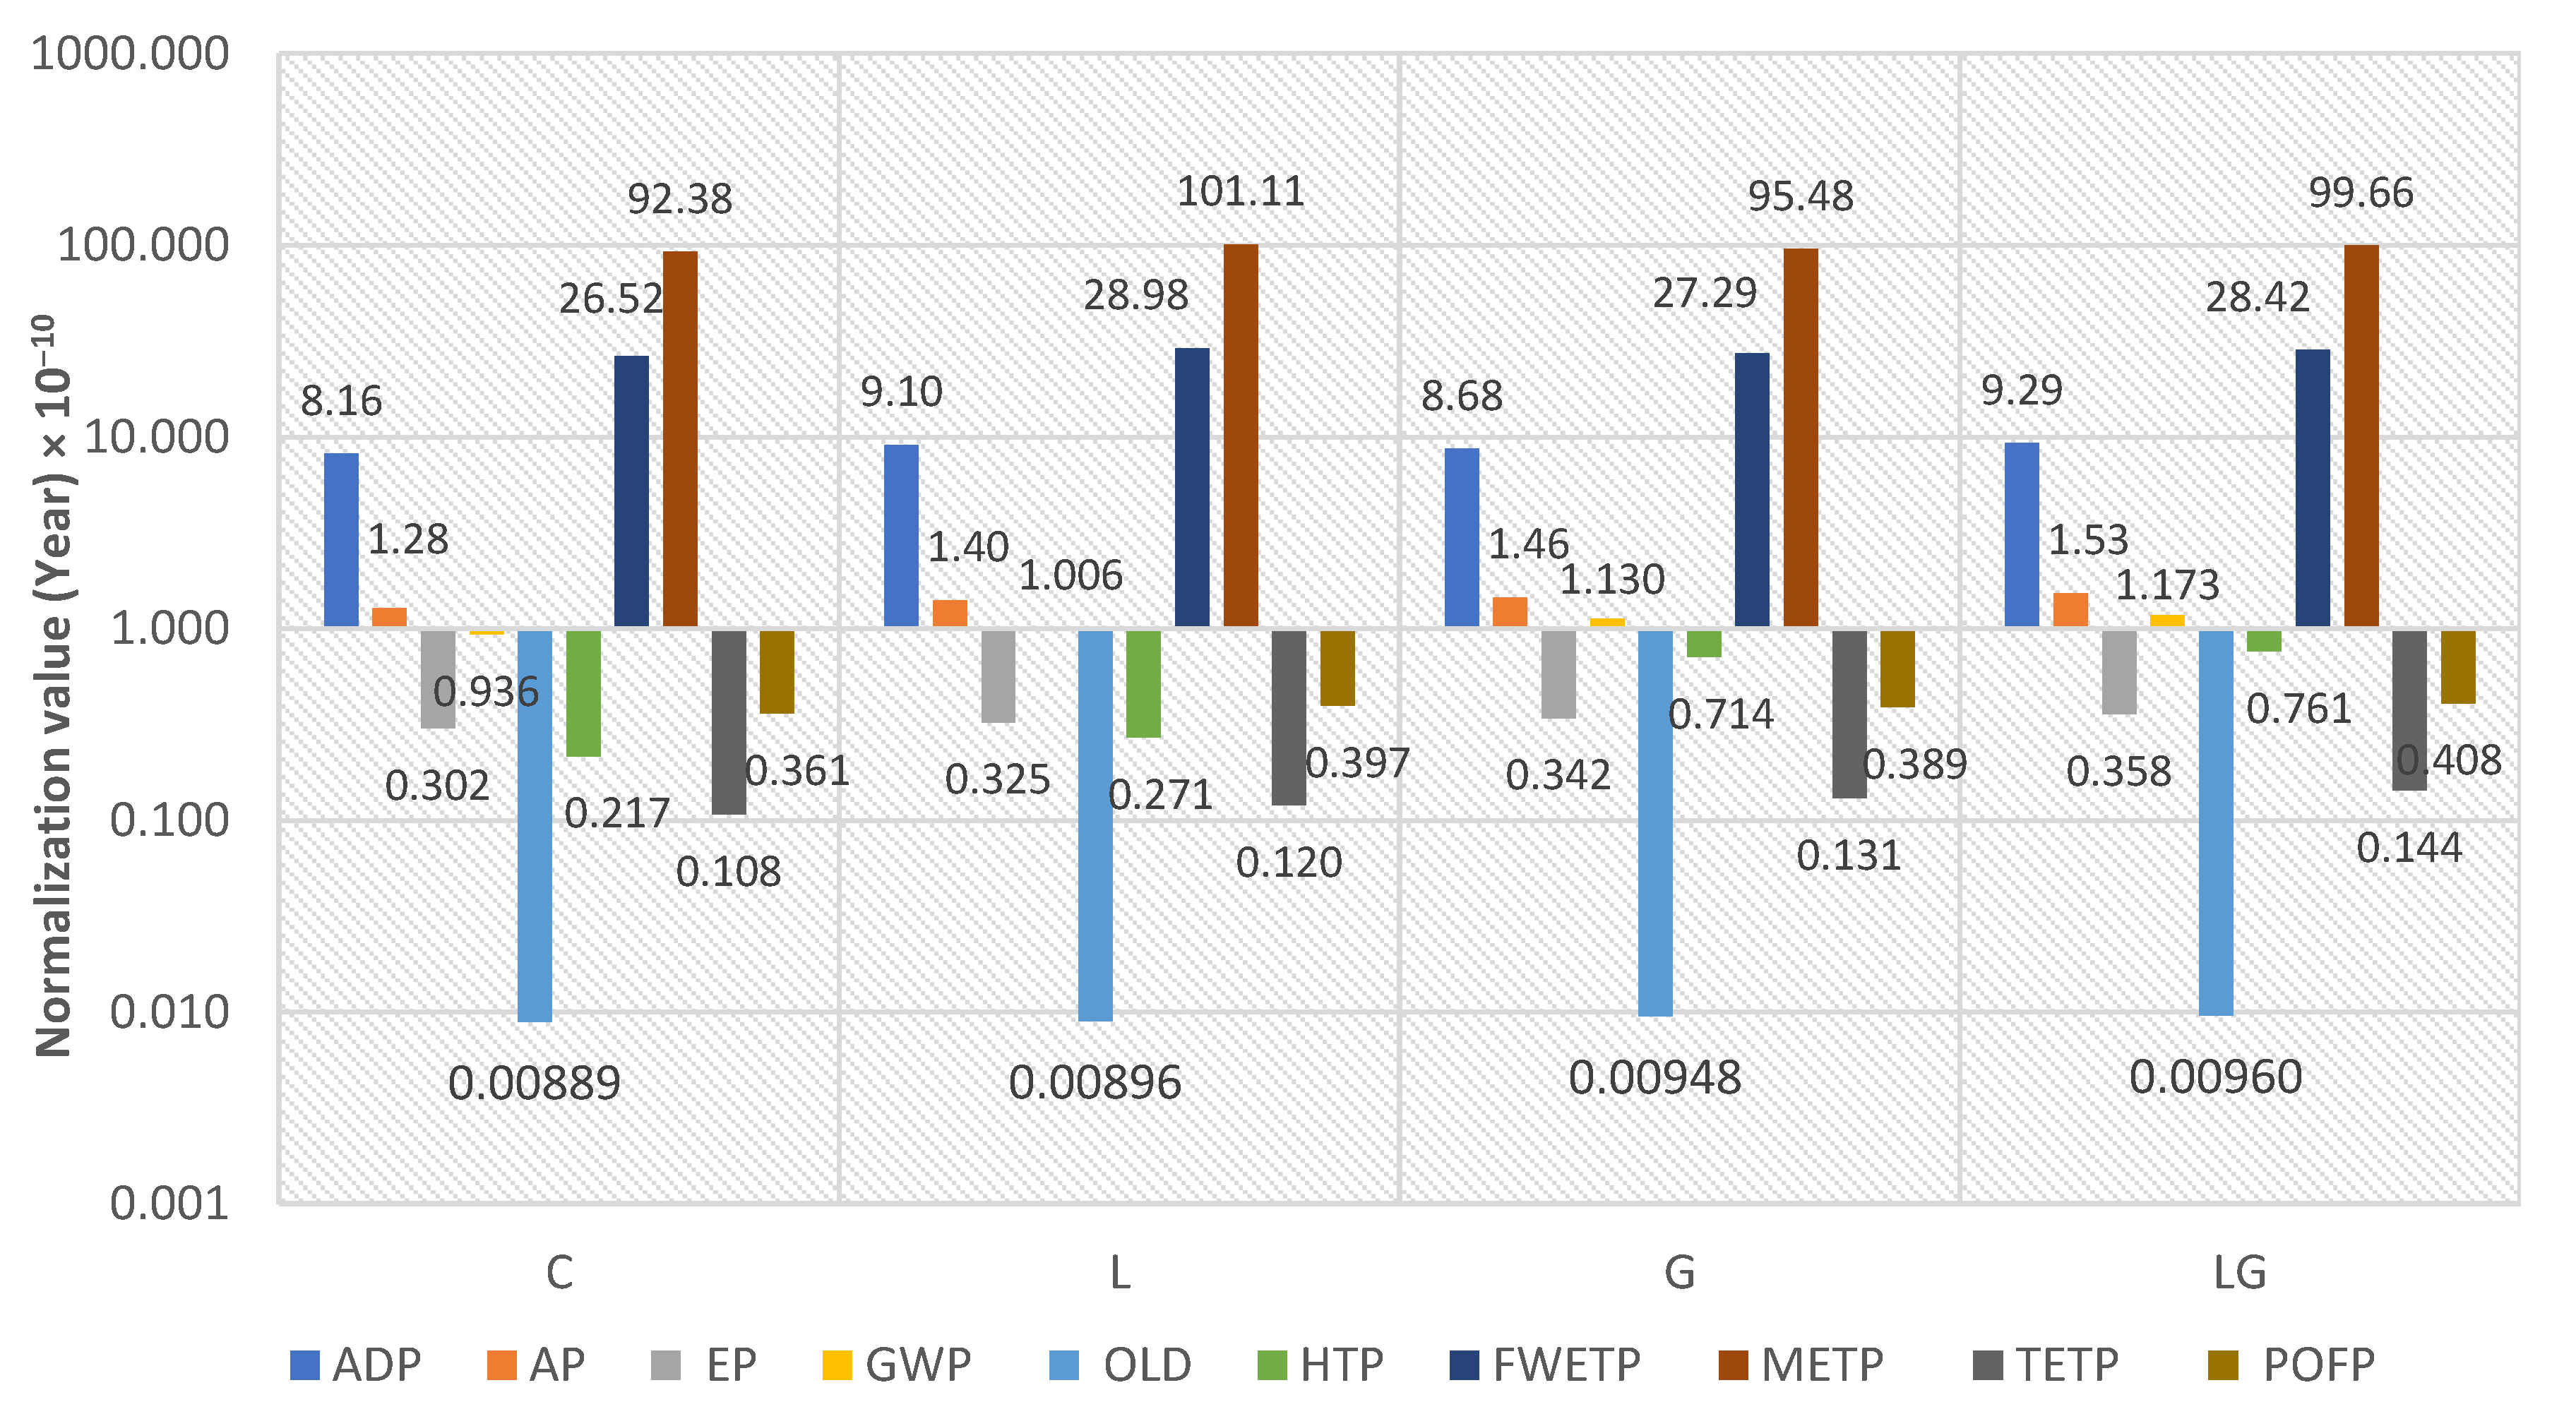
5.3. Computation of Normalized Score
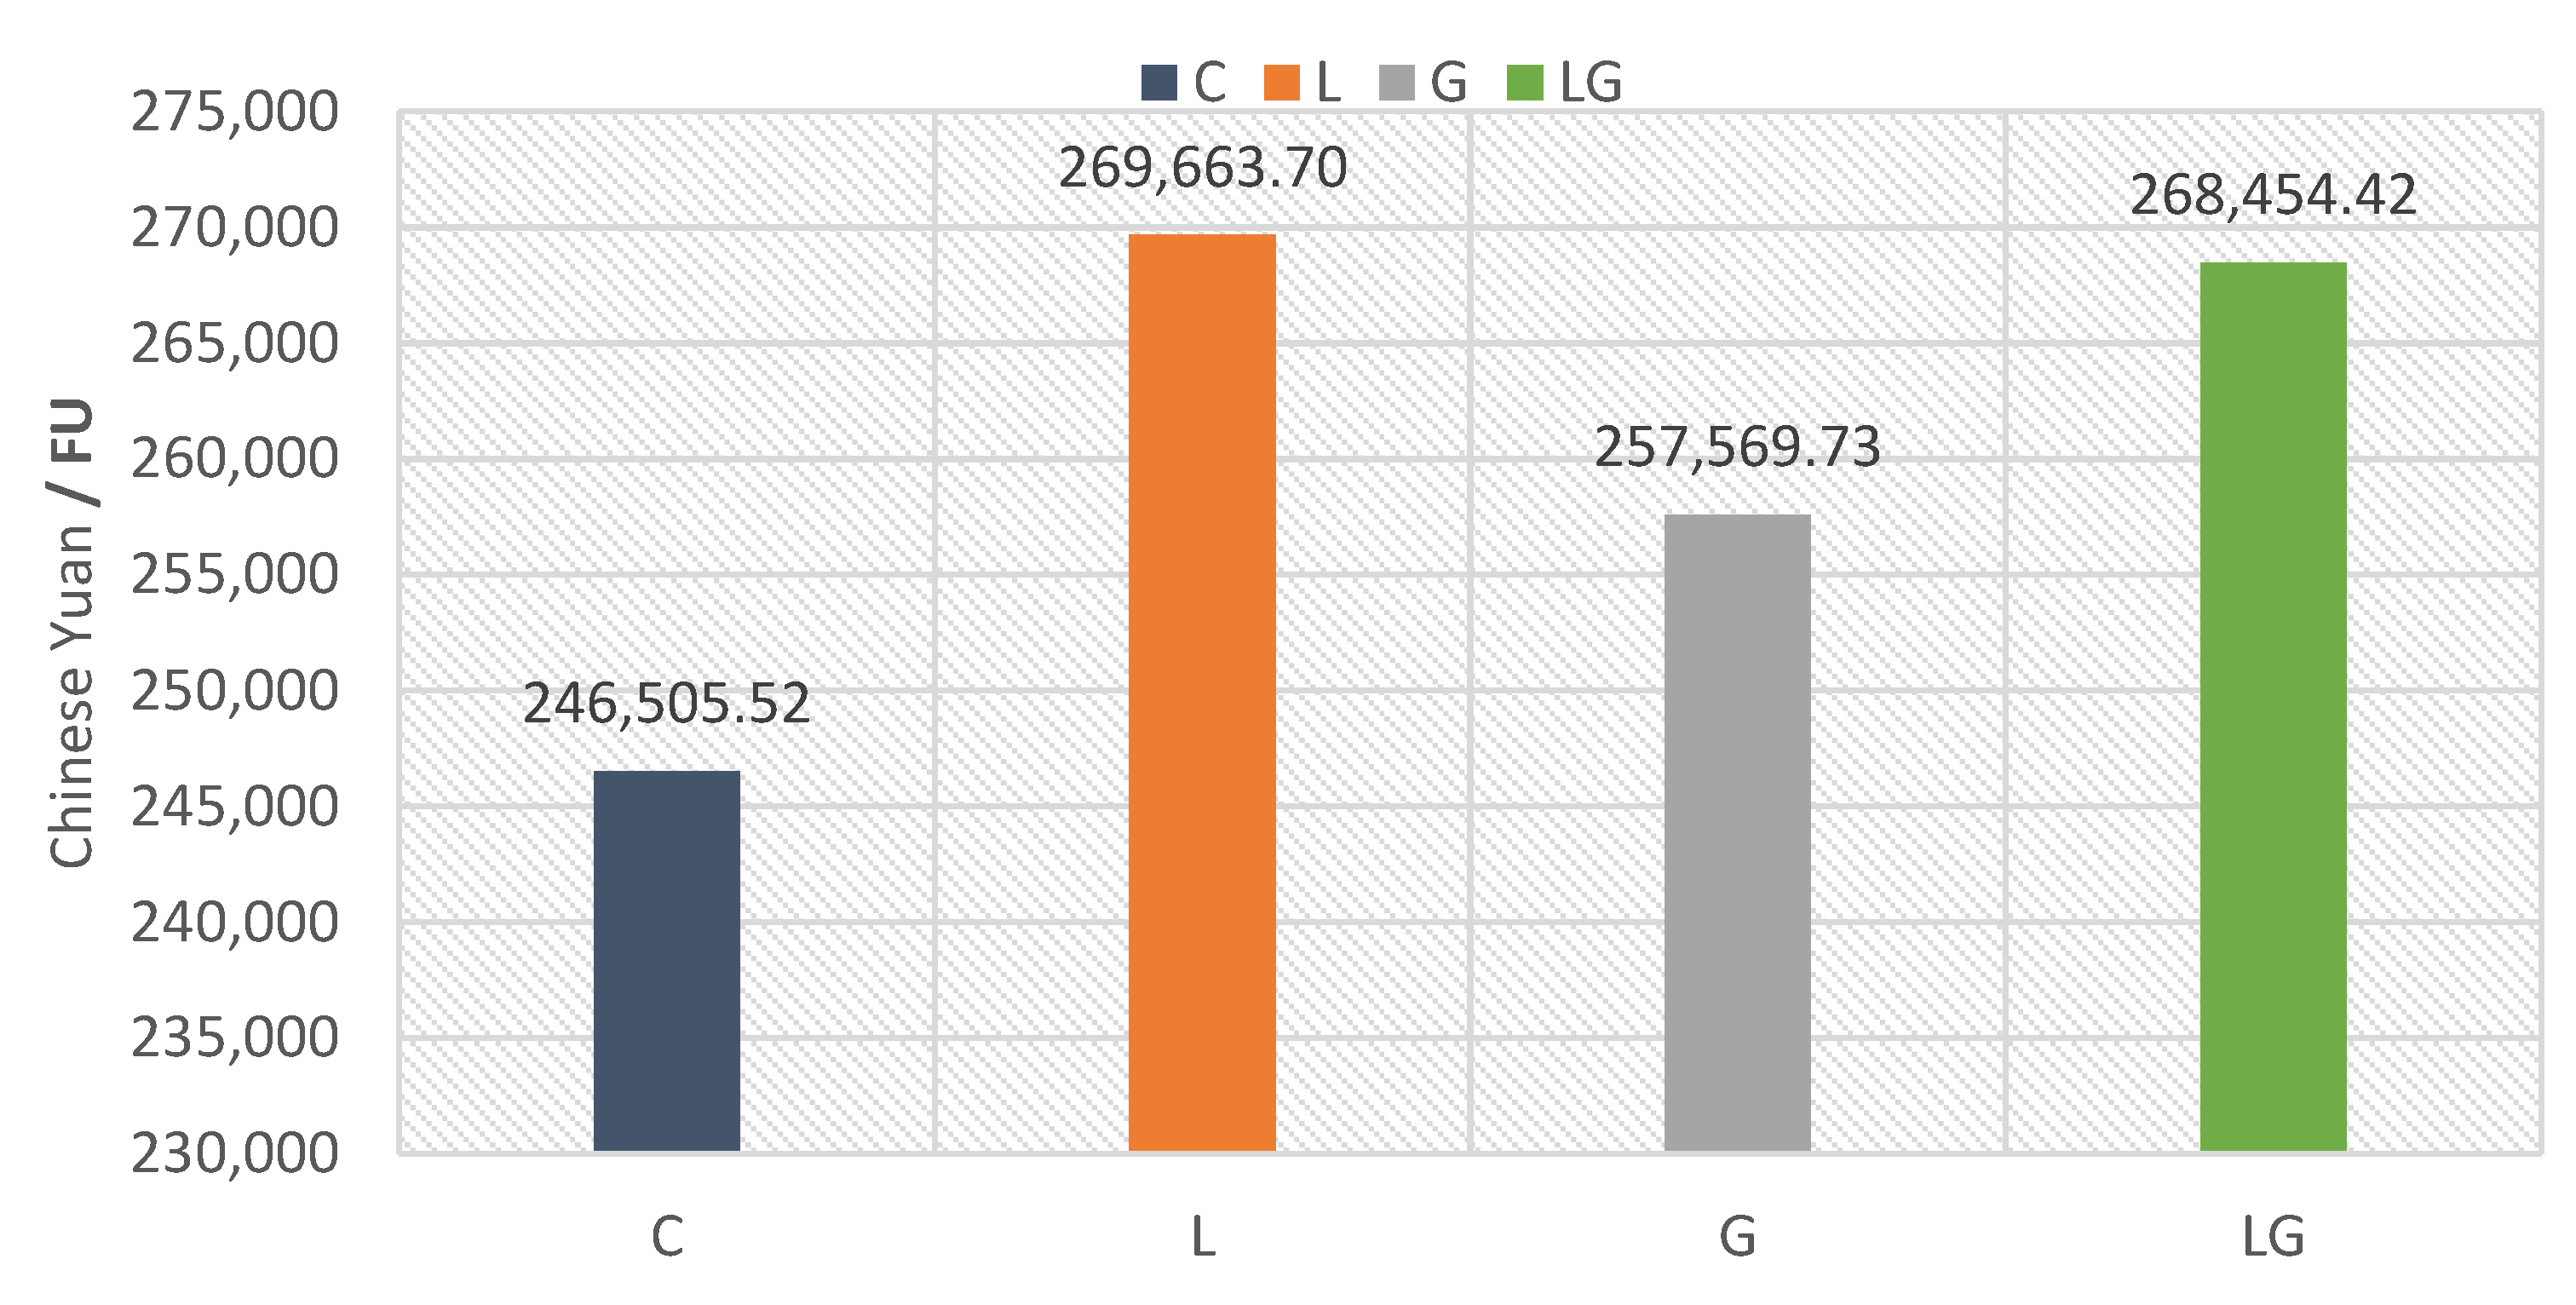
5.4. Weighting and Grouping
6. Conclusions
- All studied asphalt mixtures do not offer any improvement in all impact categories.
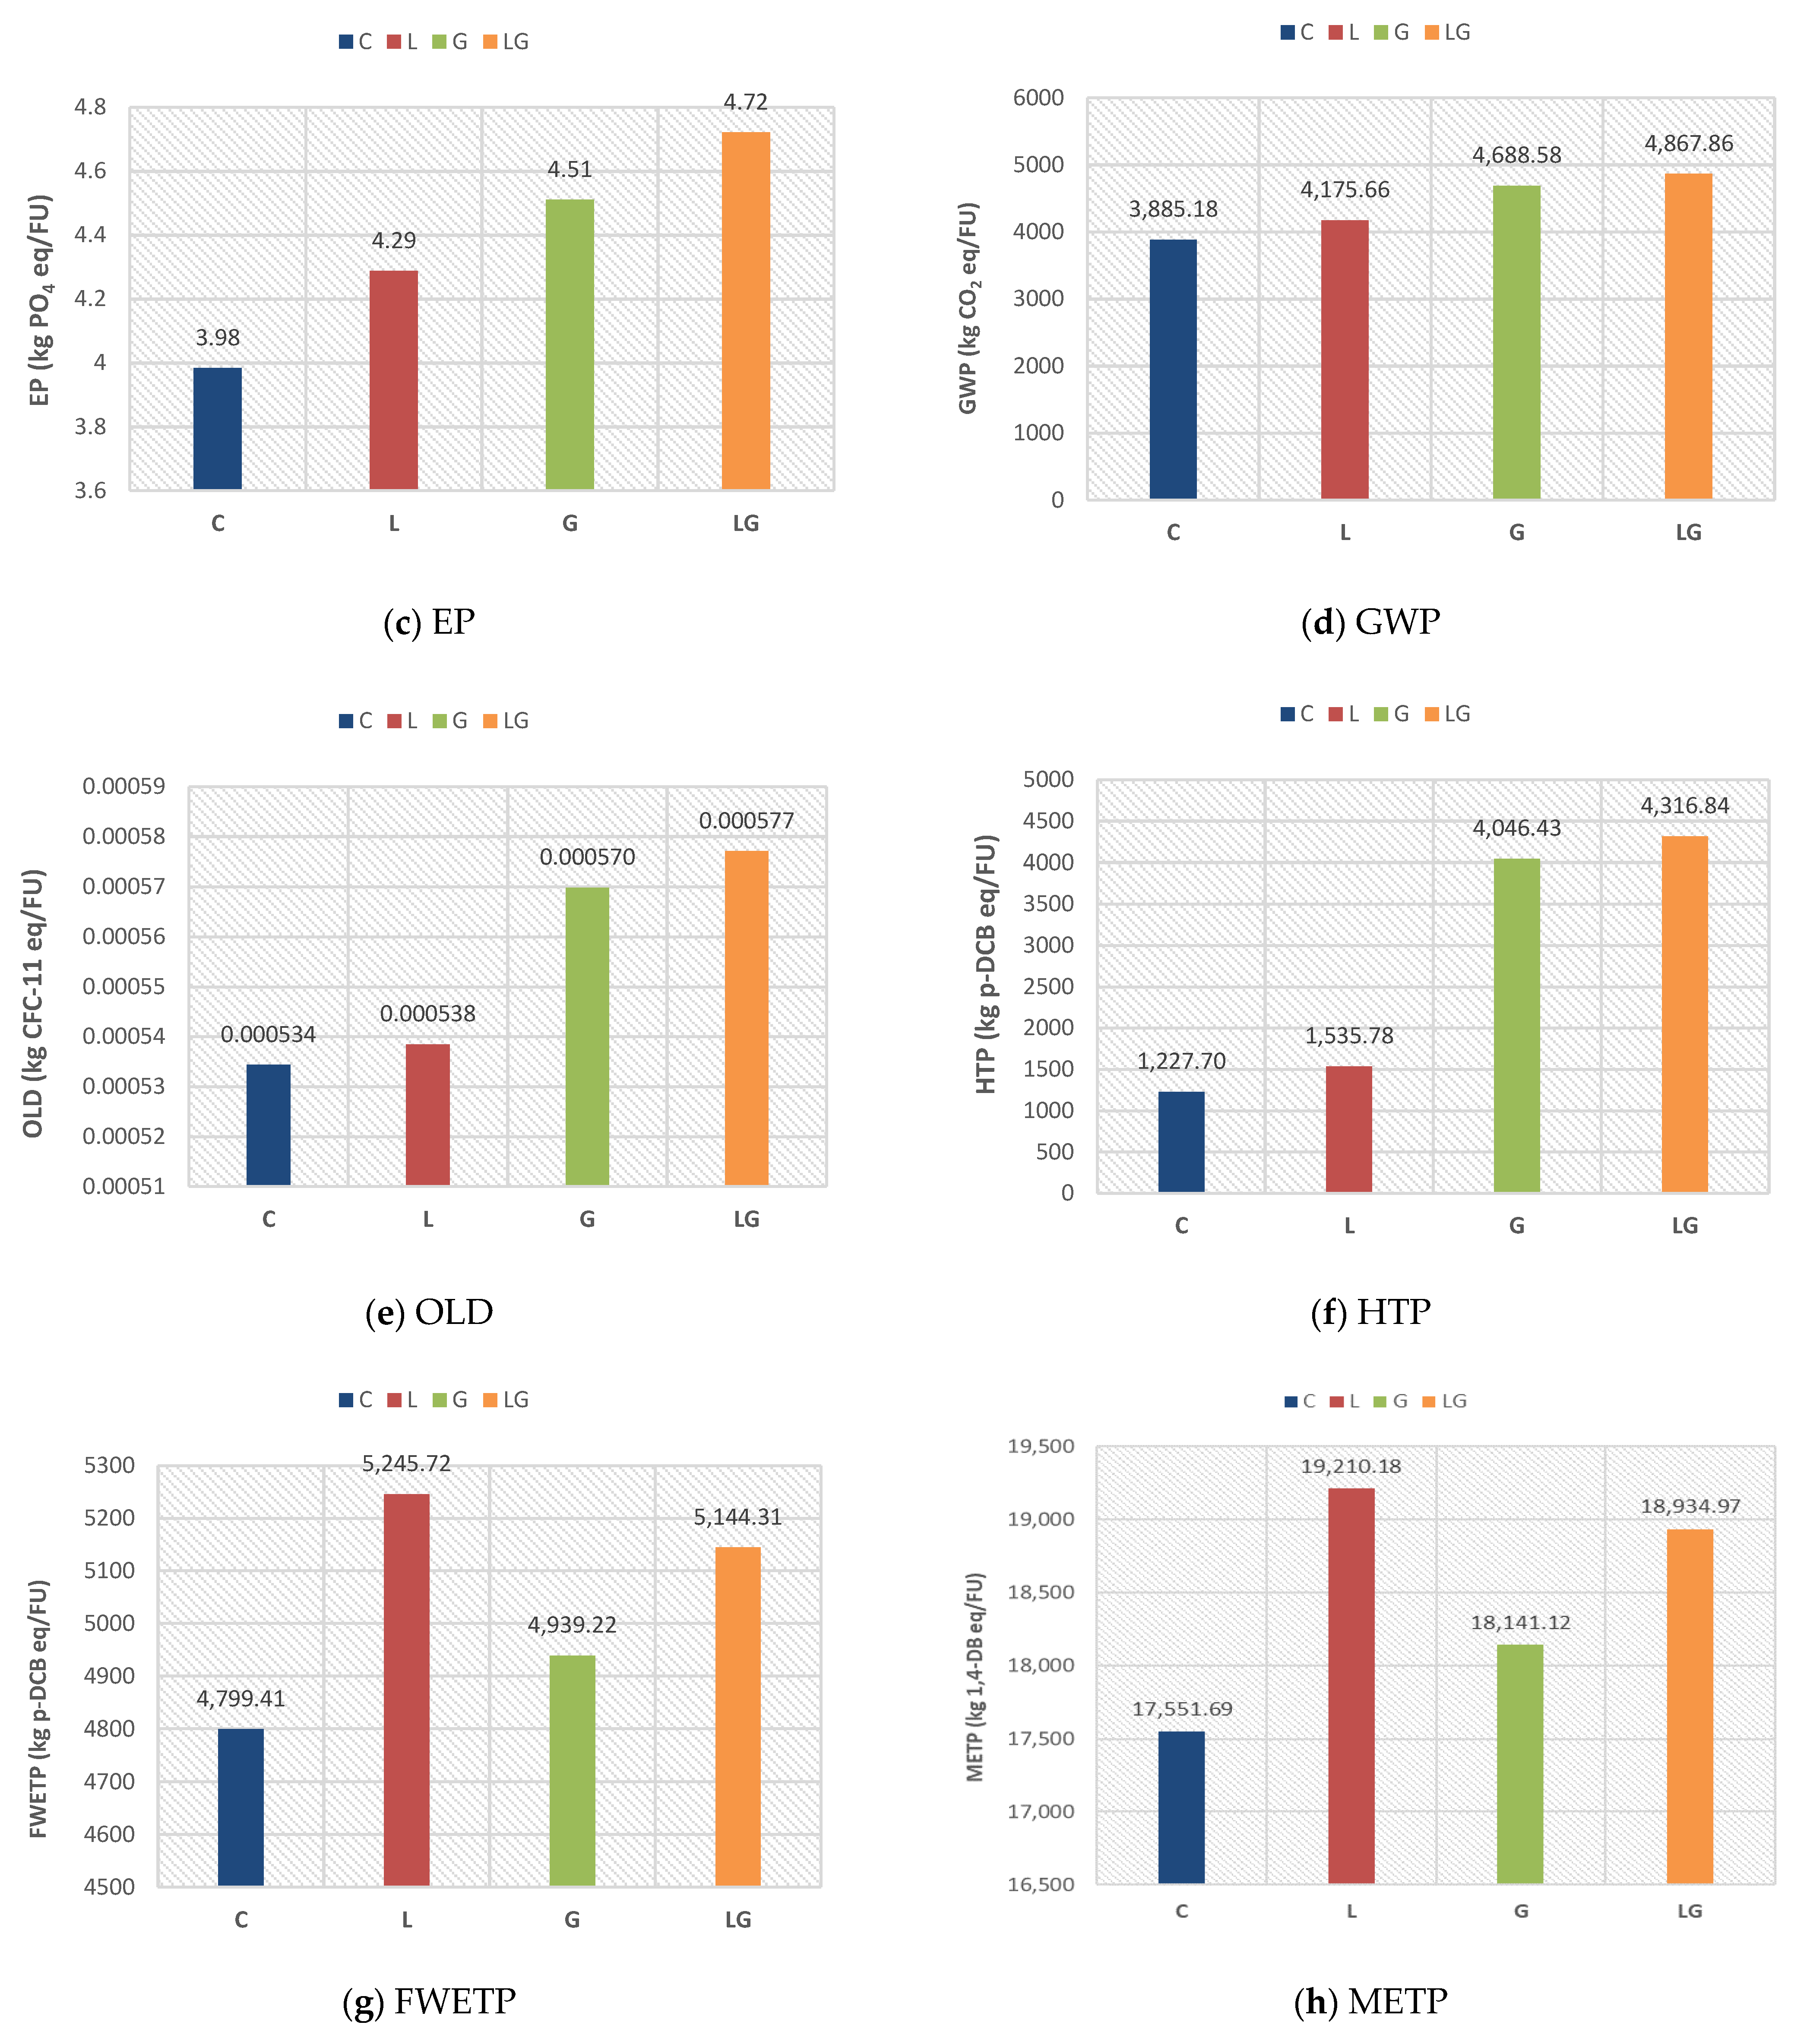
- The three modified asphalt mixtures have a slight negative effect in all impact categories with a minimal difference from the control asphalt mixture, except for the HTP impact category in glass modified asphalt mixture and composite mixture, followed by the TETP impact in the composite mixture.
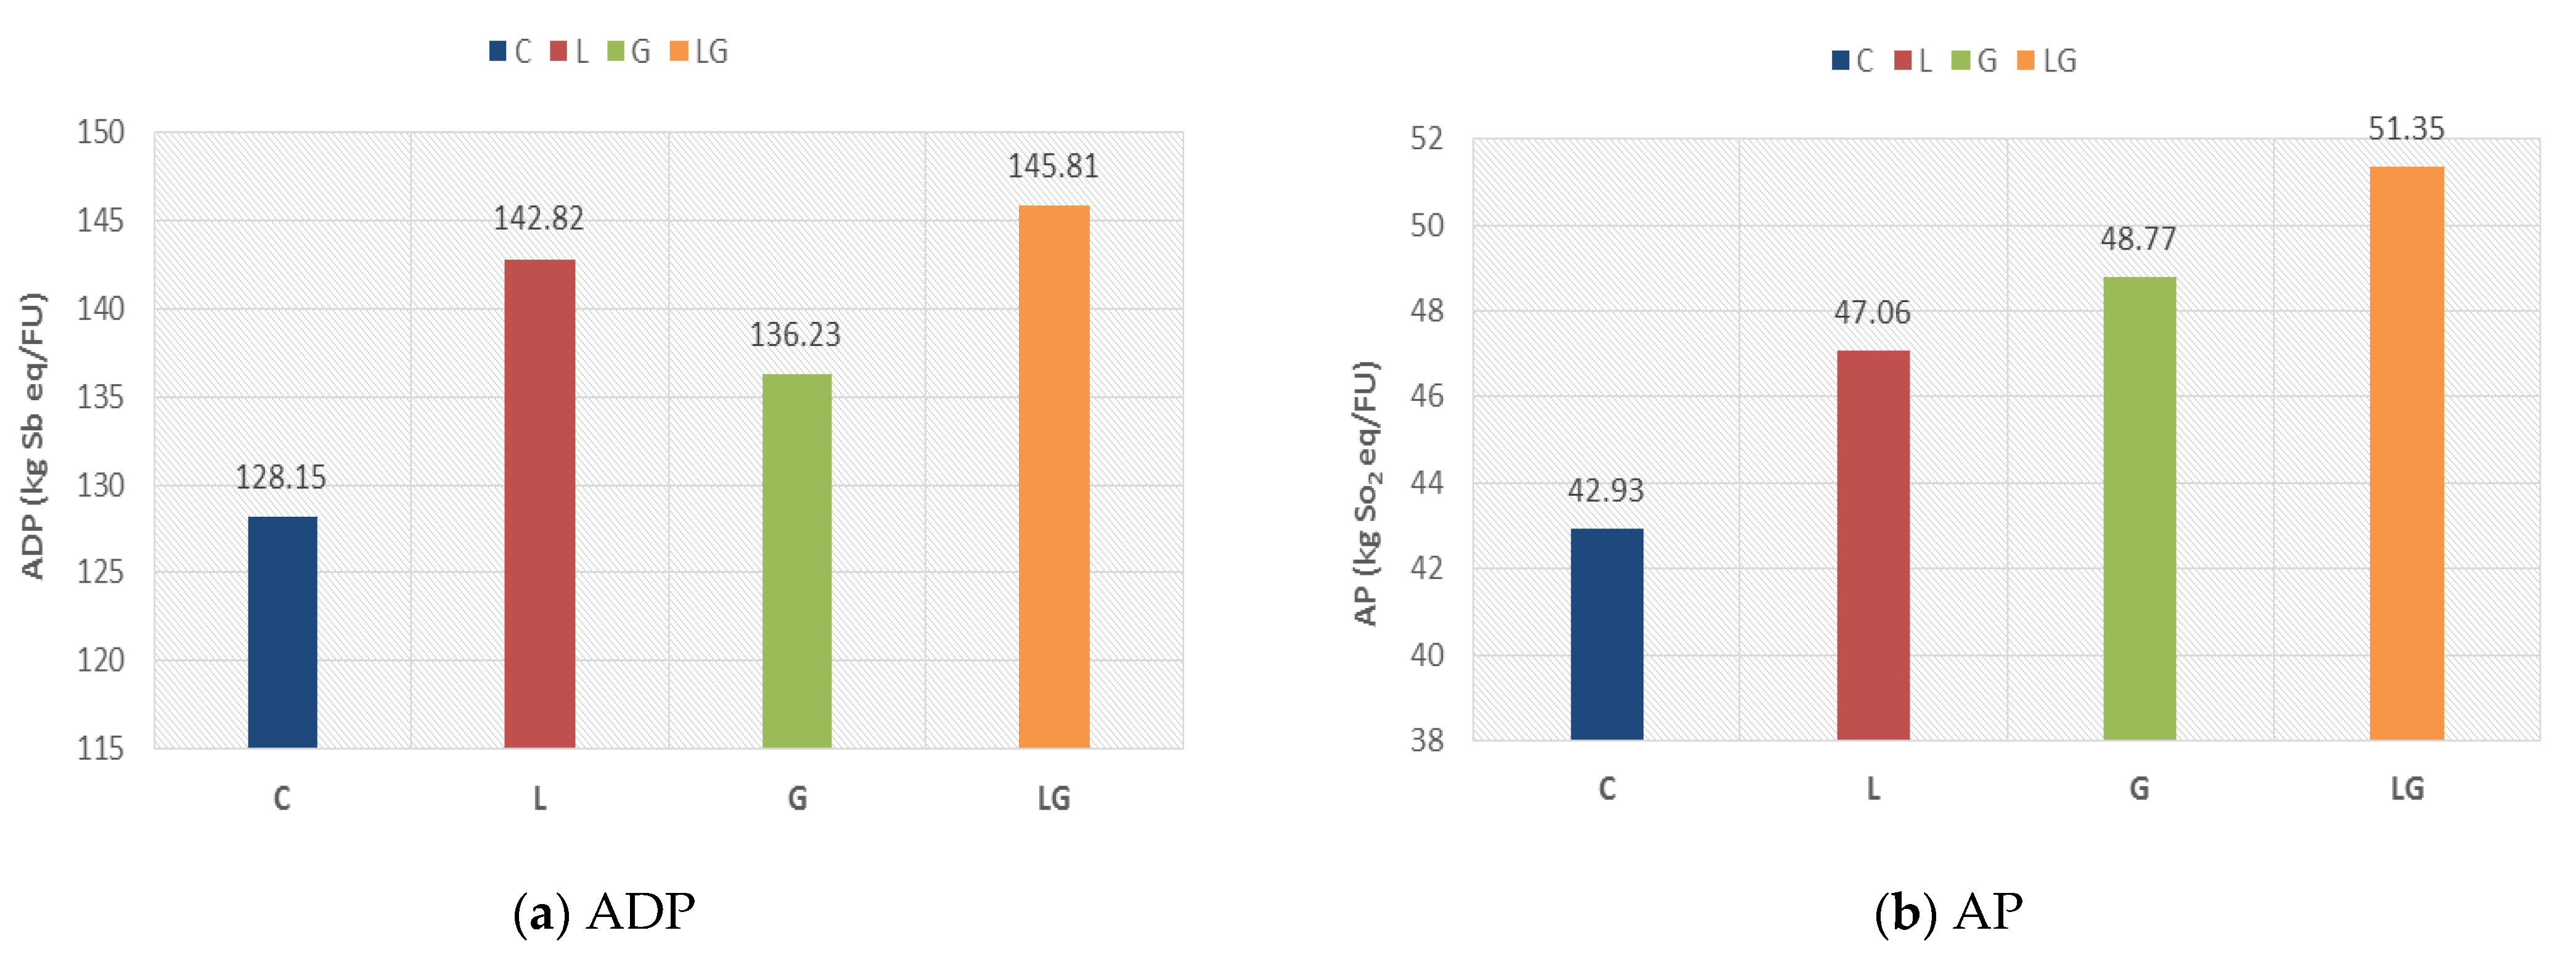
- The composite mixture has the highest negative effect in all categories except in the METP and FWETP category, where the lignin modified asphalt mixture has the highest negative effect in these two categories, but the latter has the best environmental impacts on most of the other impact categories.
- The different asphalt mixtures have the smallest negative impact on OLD. Likewise, all modified mixtures have a low negative effect in other impact categories.
- The compared mixtures can be arranged as lignin modified mixture > glass modified mixture > composite mixture, based on their overall environmental impacts concerning those associated with the control asphalt mixture from the characterization results.
- The bitumen production process has the highest contribution for the impact categories ADP, AP, EP, GWP, FWETP, METP, and POFP. Moreover, the asphalt mixture manufacturing process has the highest contribution to the impact category OLD. In addition, the glass fiber production process has the highest contribution to the impact category HTP. Finally, the aggregate extraction process has the highest contribution to the impact category TETP.
- The studied asphalt mixtures can be arranged based on the weighting of their environmental impacts as a lignin modified mixture > composite mixture > glass modified mixture > control mixture.
- In summary, the negative effect caused by the composite asphalt mixtures and other modified mixtures is minimal related to their overall environmental impacts. Thus, the composite asphalt mixture can be used based on its overall enhanced performance advantages for the bituminous mixes.
Author Contributions
Funding
Institutional Review Board Statement
Informed Consent Statement
Data Availability Statement
Acknowledgments
Conflicts of Interest
References
- Saghafi, M.D.; Teshnizi, Z.S.H. Recycling value of building materials in building assessment systems. Energy Build. 2011, 43, 3181–3188. [Google Scholar] [CrossRef]
- Koroneos, C.; Dompros, A. Environmental assessment of brick production in Greece. Build. Environ. 2007, 42, 2114–2123. [Google Scholar] [CrossRef]
- Keoleian, G.A.; Kendall, A.; Dettling, J.E.; Smith, V.M.; Chandler, R.F.; Lepech, M.D.; Li, V. Life Cycle Modeling of Concrete Bridge Design: Comparison of Engineered Cementitious Composite Link Slabs and Conventional Steel Expansion Joints. J. Infrastruct. Syst. 2005, 11, 51–60. [Google Scholar] [CrossRef]
- Araújo, J.P.C.; Oliveira, J.; Silva, H. The importance of the use phase on the LCA of environmentally friendly solutions for asphalt road pavements. Transp. Res. Part. D Transp. Environ. 2014, 32, 97–110. [Google Scholar] [CrossRef] [Green Version]
- Chen, L.; Liu, M.; Huang, J. GB/T 24040-2008 environmental management-life cycle assessment-principles and framework national standard understanding. Stand. Sci. 2009, 2. [Google Scholar]
- Klöpffer, W. The role of SETAC in the development of LCA. Int. J. Life Cycle Assess. 2006, 11, 116–122. [Google Scholar] [CrossRef]
- Butt, A.A.; Birgisson, B.; Kringos, N. Considering the benefits of asphalt modification using a new technical life cycle assessment framework. J. Civ. Eng. Manag. 2015, 22, 597–607. [Google Scholar] [CrossRef]
- Pérez-Martínez, P.J. Energy consumption and emissions from the road transport in spain: A conceptual approach. Transport 2012, 27, 383–396. [Google Scholar] [CrossRef]
- Shang, C.; Zhang, Z.; Li, X. Research on energy consumption and emission of life cycle of expressway. J. Highw. Transp. Res. Dev. 2010, 8, 149–154. [Google Scholar]
- Noshadravan, A.; Wildnauer, M.; Gregory, J.; Kirchain, R. Comparative pavement life cycle assessment with parameter uncertainty. Transp. Res. Part. D Transp. Environ. 2013, 25, 131–138. [Google Scholar] [CrossRef]
- Turk, J.; Cotič, Z.; Mladenovič, A.; Šajna, A. Environmental evaluation of green concretes versus conventional concrete by means of LCA. Waste Manag. 2015, 45, 194–205. [Google Scholar] [CrossRef]
- Rosado, L.P.; Vitale, P.; Penteado, C.S.G.; Arena, U. Life cycle assessment of natural and mixed recycled aggregate production in Brazil. J. Clean. Prod. 2017, 151, 634–642. [Google Scholar] [CrossRef]
- Santos, J.; Bressi, S.; Cerezo, V.; Presti, D.L. SUP&R DSS: A sustainability-based decision support system for road pavements. J. Clean. Prod. 2018, 206, 524–540. [Google Scholar] [CrossRef] [Green Version]
- Vega-Araujo, D.; Martinez-Arguelles, G.; Santos, J. Comparative life cycle assessment of warm mix asphalt with recycled concrete aggregates: A Colombian case study. Procedia CIRP 2020, 90, 285–290. [Google Scholar] [CrossRef]
- Ma, H.; Zhang, Z.; Zhao, X.; Wu, S.A. Comparative Life Cycle Assessment (LCA) of Warm Mix Asphalt (WMA) and Hot Mix Asphalt (HMA) Pavement: A Case Study in China. Adv. Civ. Eng. 2019, 2019, 1–12. [Google Scholar] [CrossRef]
- Santos, J.; Cerezo, V.; Soudani, K.; Bressi, S. A Comparative Life Cycle Assessment of Hot Mixes Asphalt Containing Bituminous Binder Modified with Waste and Virgin Polymers. Procedia CIRP 2018, 69, 194–199. [Google Scholar] [CrossRef]
- Sackey, S.; Lee, D.-E.; Kim, B.-S. Life Cycle Assessment for the Production Phase of Nano-Silica-Modified Asphalt Mixtures. Appl. Sci. 2019, 9, 1315. [Google Scholar] [CrossRef] [Green Version]
- Vega, A.D.; Santos, J.; Martinez-Arguelles, G. Life cycle assessment of hot mix asphalt with recycled concrete aggregates for road pavements construction. Int. J. Pavement Eng. 2020, 1–14. [Google Scholar]
- Mankelow, J.; Oyo-Ita, D.; Birkin, M. Assessing the Carbon Footprint of Transporting Primary Aggregates; Natural Environment Research Council: Swindon, UK, 2010. [Google Scholar]
- Khater, A.; Luo, D.; Abdelsalam, M.; Yue, Y.; Hou, Y.; Ghazy, M. Laboratory Evaluation of Asphalt Mixture Performance Using Composite Admixtures of Lignin and Glass Fibers. Appl. Sci. 2021, 11, 364. [Google Scholar] [CrossRef]
- Shen, J.; Li, F.; Chen, J. Technical Specification for Construction of Highway Asphalt Pavements (JTG F40–2004); China Communication Press: Beijing, China, 2005. [Google Scholar]
- Lundin, M.; Bengtsson, M.; Molander, S. Life Cycle Assessment of Wastewater Systems: Influence of System Boundaries and Scale on Calculated Environmental Loads. Environ. Sci. Technol. 1999, 34, 180–186. [Google Scholar] [CrossRef]
- Sonesson, U.; Dalemo, M.; Björklund, A.; Mingarini, K.; Frostell, B.; Jönsson, H.; Nybrant, T.; Sundqvist, J.; Thyselius, L. ORWARE–A simulation model for organic waste handling systems. Part 2: Case study and simulation results. Resour. Conserv. Recycl. 1997, 21, 39–54. [Google Scholar] [CrossRef]
- Tillman, A.-M.; Ekvall, T.; Baumann, H.; Rydberg, T. Choice of system boundaries in life cycle assessment. J. Clean. Prod. 1994, 2, 21–29. [Google Scholar] [CrossRef] [Green Version]
- Steubing, B.; Wernet, G.; Reinhard, J.; Bauer, C.; Moreno-Ruiz, E. The ecoinvent database version 3 (part II): Analyzing LCA results and comparison to version 2. Int. J. Life Cycle Assess. 2016, 21, 1269–1281. [Google Scholar] [CrossRef] [Green Version]
- Remy, C. Life Cycle Assessment of Conventional and Source Separation Systems for Urban Wastewater Management; Technische Universität Berlin: Berlin, Germany, 2010. [Google Scholar]
- de Koning, R.H.A.; Korenromp, T.L.R. Improvement of LCA Characterization Factors and LCA Practice for Metals; TNO-Report, R 2004/347; Institute of Environmental Sciences, Leiden University: Leiden, The Netherlands, 2004. [Google Scholar]
- Lippiatt, B.C. Building for Environmental and Economic Sustainability: Technical Manual and User Guide; National Institute of Standards and Technology: Gaithersburg, MD, USA, 2000.
- Frischknecht, R.; Jungbluth, N.; Althaus, H.; Bauer, C.; Doka, G.; Dones, R.; Hischier, R.; Hellweg, S.; Humbert, S.; Köllner, T. Implementation of Life Cycle Impact Assessment Methods. Data v2. 0 (2007); Ecoinvent Report No. 3. 2007; Ecoinvent Centre: Bern, Switzerland, 2007. [Google Scholar]
- Finnveden, G. A Critical Review of Operational Valuation/Weighting Methods for Life Cycle Assessment. AFB—Report; Swedish Environmental Protection Agency: Stockholm, Sweden, 1999; Volume 253.
- Johansson, J. A Monetary Valuation Weighting Method for Life Cycle Assessment Based on Environmental Taxes and Fees; Department of Systems Ecology, Stockholm University: Stockholm, Sweden, 1999. [Google Scholar]
- Eldh, P.; Johansson, J. Weighting in LCA Based on Ecotaxes—Development of a Mid-point Method and Experiences from Case Studies. Int. J. Life Cycle Assess. 2006, 11, 81–88. [Google Scholar] [CrossRef]


| Asphalt Mixture Type | Marshall Immersion Test Results | Freeze-Thaw Splitting Test Results | Low Temperature Cracking Test Tesults | |||||
|---|---|---|---|---|---|---|---|---|
| MS1 (kN) | MS2 (kN) | MSR (%) | RT1 (MPa) | RT2 (MPa) | TSR (%) | Bending Stress (MPa) | Bending Strain (µε) | |
| C | 10.89 | 9.29 | 85.3 | 0.684 | 0.544 | 79.51 | 8.20 | 2086.10 |
| L | 10.57 | 9.52 | 90.0 | 0.729 | 0.602 | 82.58 | 9.77 | 2601.66 |
| G | 10.16 | 9.67 | 95.1 | 0.747 | 0.649 | 86.82 | 9.70 | 2484.40 |
| LG | 10.80 | 10.67 | 98.8 | 0.765 | 0.675 | 88.22 | 10.37 | 3104.60 |
| Equipment Model | Installation Power (kW) | Rated Capacity (ton/h) | Capacity of Mixer (kg) | Fuel Consumption (kg/t) | Fuel Type |
|---|---|---|---|---|---|
| SAP100 | 232 | 100 | 1300 | ≤6.5 | Heavy oil |
| Type of Material | From | To | One-Way Trip Distance (km) |
|---|---|---|---|
| Aggregates (Limestone) | Extraction and processing sites | Asphalt plant | 30 |
| Filler (Limestone) | Asphalt plant | 30 | |
| Bitumen | Asphalt plant | 80 | |
| Lignin fiber | Asphalt plant | 100 | |
| Glass fiber | Asphalt plant | 100 | |
| Asphalt mixture | Asphalt plant | Construction site | 50 |
| Machine | Energy Consumption (L/1000 m2) | Fuel Type |
|---|---|---|
| Heavy vibratory roller | 20 | Diesel |
| Finisher | 40 | Diesel |
| Process | Item | Amount | Unit | Database Process | |||
|---|---|---|---|---|---|---|---|
| C | L | G | LG | ||||
| Raw material production | Coarse aggregate 1 | 24.52 | 24.00 | 24.23 | 23.94 | ton | Limestone, crushed, washed {RoW}|production|APOS, S |
| Coarse aggregate 2 | 33.35 | 32.64 | 32.95 | 32.56 | ton | ||
| Fine aggregate | 35.31 | 34.56 | 34.89 | 34.47 | ton | ||
| Filler | 4.90 | 4.80 | 4.85 | 4.79 | ton | ||
| Bitumen | 4.35 | 4.75 | 4.47 | 4.65 | ton | Bitumen, at refinery/kg/US | |
| Lignin fiber | - | 0.303 | - | 0.303 | ton | Lignin fibre, inclusive blowing in {RoW}|production|APOS, S | |
| Glass fiber | - | - | 0.305 | 0.303 | ton | Glass fibre {RoW}| production | APOS, S | |
| Asphalt mixture manufacturing | Heavy fuel oil | 665.86 | 656.83 | 660.92 | 656.57 | kg | Heavy fuel oil {RoW}|heavy fuel oil production, petroleum refinery operation|APOS, S |
| Asphalt mixture manufacturing | Electricity | 237.66 | 234.44 | 235.90 | 234.34 | kWh | Electricity, medium voltage, aluminium industry {CN}|electricity voltage transformation from high to medium voltage, aluminium industry|APOS, S |
| Wearing surface construction | Diesel fuel | 59.5 | 59.5 | 59.5 | 59.5 | kg | Diesel {RoW}|diesel production, petroleum refinery operation|APOS, S |
| Impact category | Units | LCIA Method |
|---|---|---|
| Abiotic depletion (ADP) | kg Sb eq | CML 2001 |
| Acidification (AP) | kg SO2 eq | CML 2001 |
| Eutrophication (EP) | kg PO4 eq | CML 2001 |
| Global warming (GWP) | kg CO2 eq | CML 2001 |
| Ozone depletion (OLD) | kg CFC-11 eq | CML 2001 |
| Human toxicity (HTP) | kg p-DCB | CML 2001 |
| Freshwater aquatic ecotoxicity (FWETP) | kg p-DCB | CML 2001 |
| Marine aquatic ecotoxicity (METP) | kg p-DCB | CML 2001 |
| Terrestrial ecotoxicity (TETP) | kg p-DCB | CML 2001 |
| Photochemical oxidation (POFP) | kg C2H4 eq | CML 2001 |
| Impact Category | Reference Unit | Normalization Factor (RC) |
|---|---|---|
| Abiotic depletion (ADP) | kg Sb eq/year | 1.57 × 10¹¹ |
| Acidification (AP) | kg SO2 eq/year | 3.35 × 10¹¹ |
| Eutrophication (EP) | kg PO4 eq/year | 1.32 × 10¹¹ |
| Global warming (GWP) | kg CO2 eq/year | 4.15 × 10¹³ |
| Ozone depletion (OLD) | kg CFC-11 eq/year | 6.01 × 10⁸ |
| Human toxicity (HTP) | kg p-DCB/year | 5.67 × 10¹³ |
| Freshwater aquatic ecotoxicity (FWETP) | kg p-DCB/year | 1.81 × 10¹² |
| Marine aquatic ecotoxicity (METP) | kg p-DCB/year | 1.9 × 10¹² |
| Terrestrial ecotoxicity (TETP) | kg p-DCB/year | 1.4 × 10¹¹ |
| Photochemical oxidation (POFP) | kg C2H4 eq/year | 9.59 × 10¹⁰ |
| Impact Category | Reference Unit | Weight of Reference |
|---|---|---|
| Abiotic depletion (ADP) | kg Sb eq | 0.745 Euro/kg |
| Acidification (AP) | kg SO2 eq | 1.5 Euro/kg |
| Eutrophication (EP) | kg PO4 eq | 2.85 Euro/kg |
| Global warming (GWP) | kg CO2 eq | 0.063 Euro/kg |
| Ozone depletion (OLD) | kg CFC-11 eq | 120 Euro/kg |
| Human toxicity (HTP) | kg p-DCB | 0.15 Euro/kg |
| Freshwater aquatic ecotoxicity (FWETP) | kg p-DCB | 6.09 Euro/kg |
| Marine aquatic ecotoxicity (METP) | kg p-DCB | 0.0606 Euro/kg |
| Terrestrial ecotoxicity (TETP) | kg p-DCB | 17.6 Euro/kg |
| Photochemical oxidation (POFP) | kg C2H4 eq | 48 Euro/kg |
| Impact Category | Reference Unit | Impact Result | |||
|---|---|---|---|---|---|
| C | L | G | LG | ||
| ADP | kg Sb eq/FU | 128.15 | 142.82 | 136.23 | 145.81 |
| AP | kg SO2 eq/FU | 42.93 | 47.06 | 48.77 | 51.35 |
| EP | kg PO4 eq/FU | 3.98 | 4.29 | 4.51 | 4.72 |
| GWP | kg CO2 eq/FU | 3885.18 | 4175.66 | 4688.58 | 4867.86 |
| OLD | kg CFC-11 eq/FU | 0.000534 | 0.000538 | 0.00057 | 0.000577 |
| HTP | kg p-DCB/FU | 1227.70 | 1535.78 | 4046.43 | 4316.84 |
| FWETP | kg p-DCB/FU | 4799.41 | 5245.72 | 4939.22 | 5144.31 |
| METP | kg p-DCB/FU | 17,551.69 | 19,210.18 | 18,141.12 | 18,934.97 |
| TETP | kg p-DCB/FU | 1.51 | 1.68 | 1.83 | 2.01 |
| POFP | kg C2H4 eq/FU | 3.47 | 3.80 | 3.73 | 3.91 |
Publisher’s Note: MDPI stays neutral with regard to jurisdictional claims in published maps and institutional affiliations. |
© 2021 by the authors. Licensee MDPI, Basel, Switzerland. This article is an open access article distributed under the terms and conditions of the Creative Commons Attribution (CC BY) license (https://creativecommons.org/licenses/by/4.0/).
Share and Cite
Khater, A.; Luo, D.; Abdelsalam, M.; Ma, J.; Ghazy, M. Comparative Life Cycle Assessment of Asphalt Mixtures Using Composite Admixtures of Lignin and Glass Fibers. Materials 2021, 14, 6589. https://doi.org/10.3390/ma14216589
Khater A, Luo D, Abdelsalam M, Ma J, Ghazy M. Comparative Life Cycle Assessment of Asphalt Mixtures Using Composite Admixtures of Lignin and Glass Fibers. Materials. 2021; 14(21):6589. https://doi.org/10.3390/ma14216589
Chicago/Turabian StyleKhater, Ahmed, Dong Luo, Moustafa Abdelsalam, Jianxun Ma, and Mohamed Ghazy. 2021. "Comparative Life Cycle Assessment of Asphalt Mixtures Using Composite Admixtures of Lignin and Glass Fibers" Materials 14, no. 21: 6589. https://doi.org/10.3390/ma14216589