
Peculiar Porous Aluminum Oxide Films Produced via Electrochemical Anodizing in Malonic Acid Solution with Arsenazo-I Additive

 , ,
, ,  and
and 
Abstract
:1. Introduction
2. Materials and Methods
2.1. Film Preparation
2.2. Characterization and Measurements
2.3. Data Operation
- ChemWindow (Bio-Rad Laboratories Inc., Sadtler Division, Grand Junction, CO, USA);
- Stanford Graphics Version 3.0 (Visual Numerics Inc., Houston, TX, USA);
- OriginPro 2018 (OriginLab Corporation, Northampton, MA, USA); and
- Microsoft Office Excel 2019 (Microsoft Corporation, Redmond, WA, USA).
3. Results and Discussion
3.1. Anodizing Behavior
3.2. Current Efficiency
3.3. Efficiency from
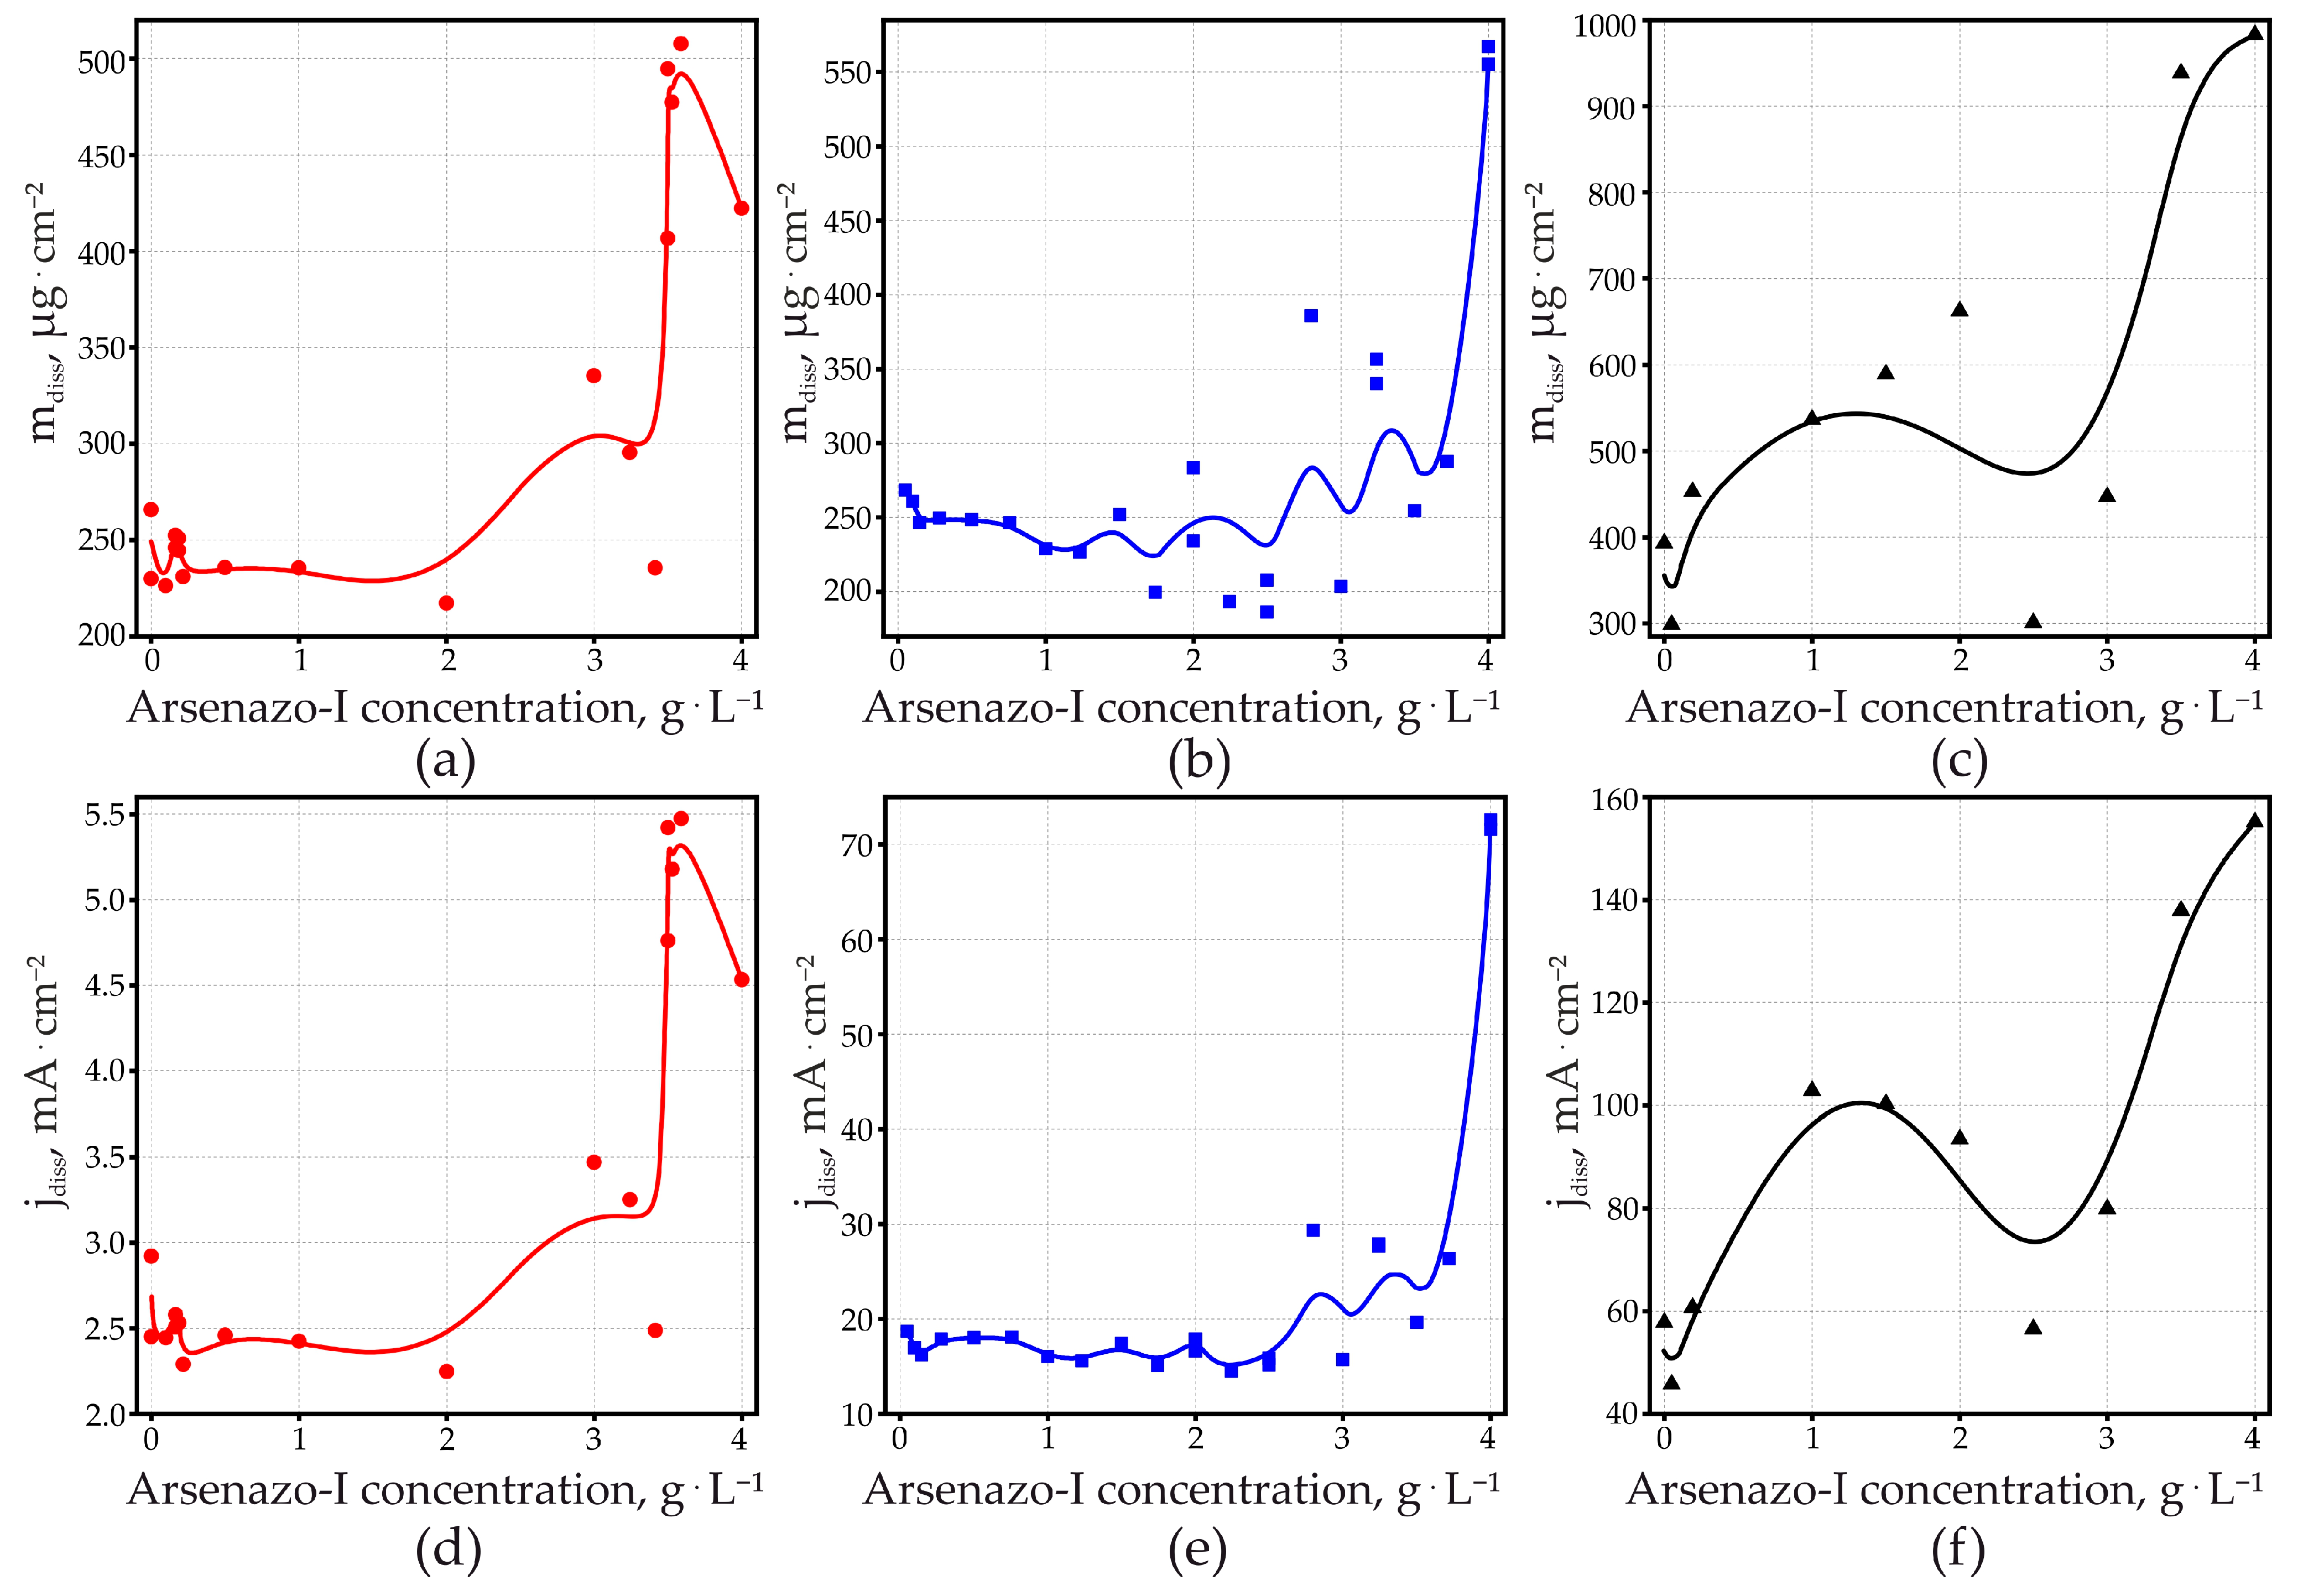
3.4. Efficiency from Dissolved Aluminum
3.5. Volume Expansion Factor
3.6. Film Structure
3.6.1. Fourier Transform Infrared Spectroscopy
3.6.2. X-ray Photoelectron Spectroscopy
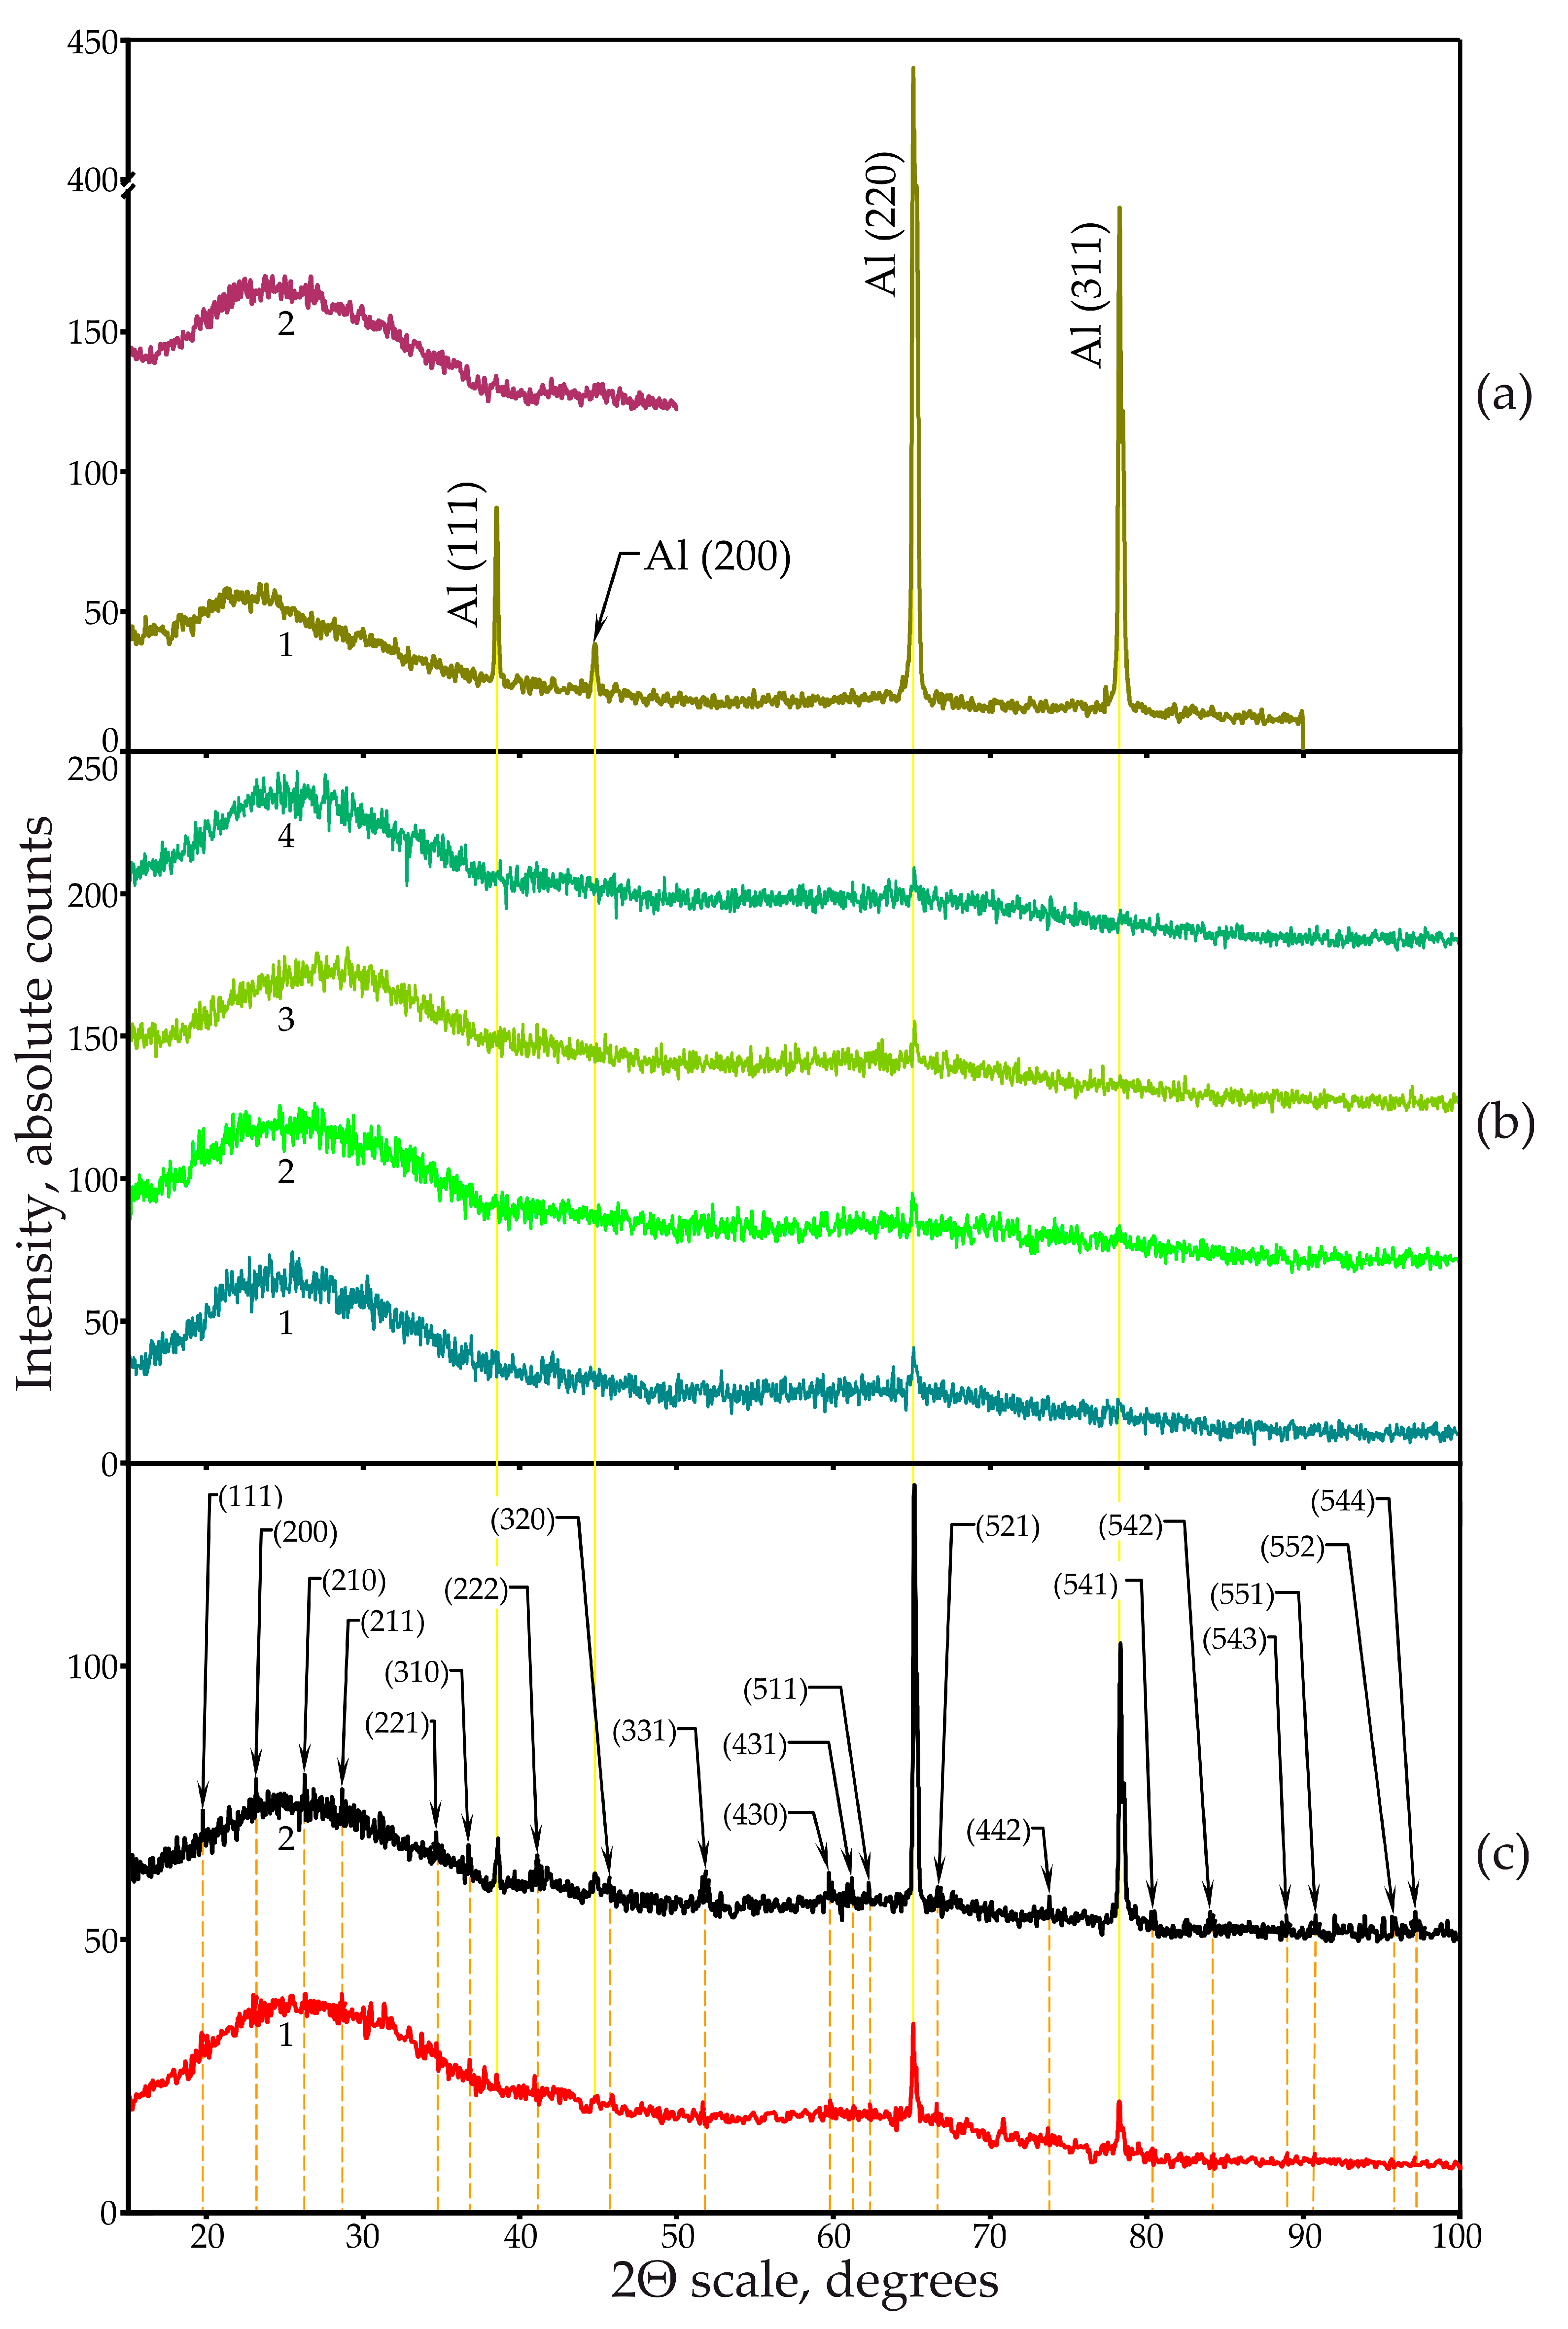
3.6.3. X-ray Diffractometry
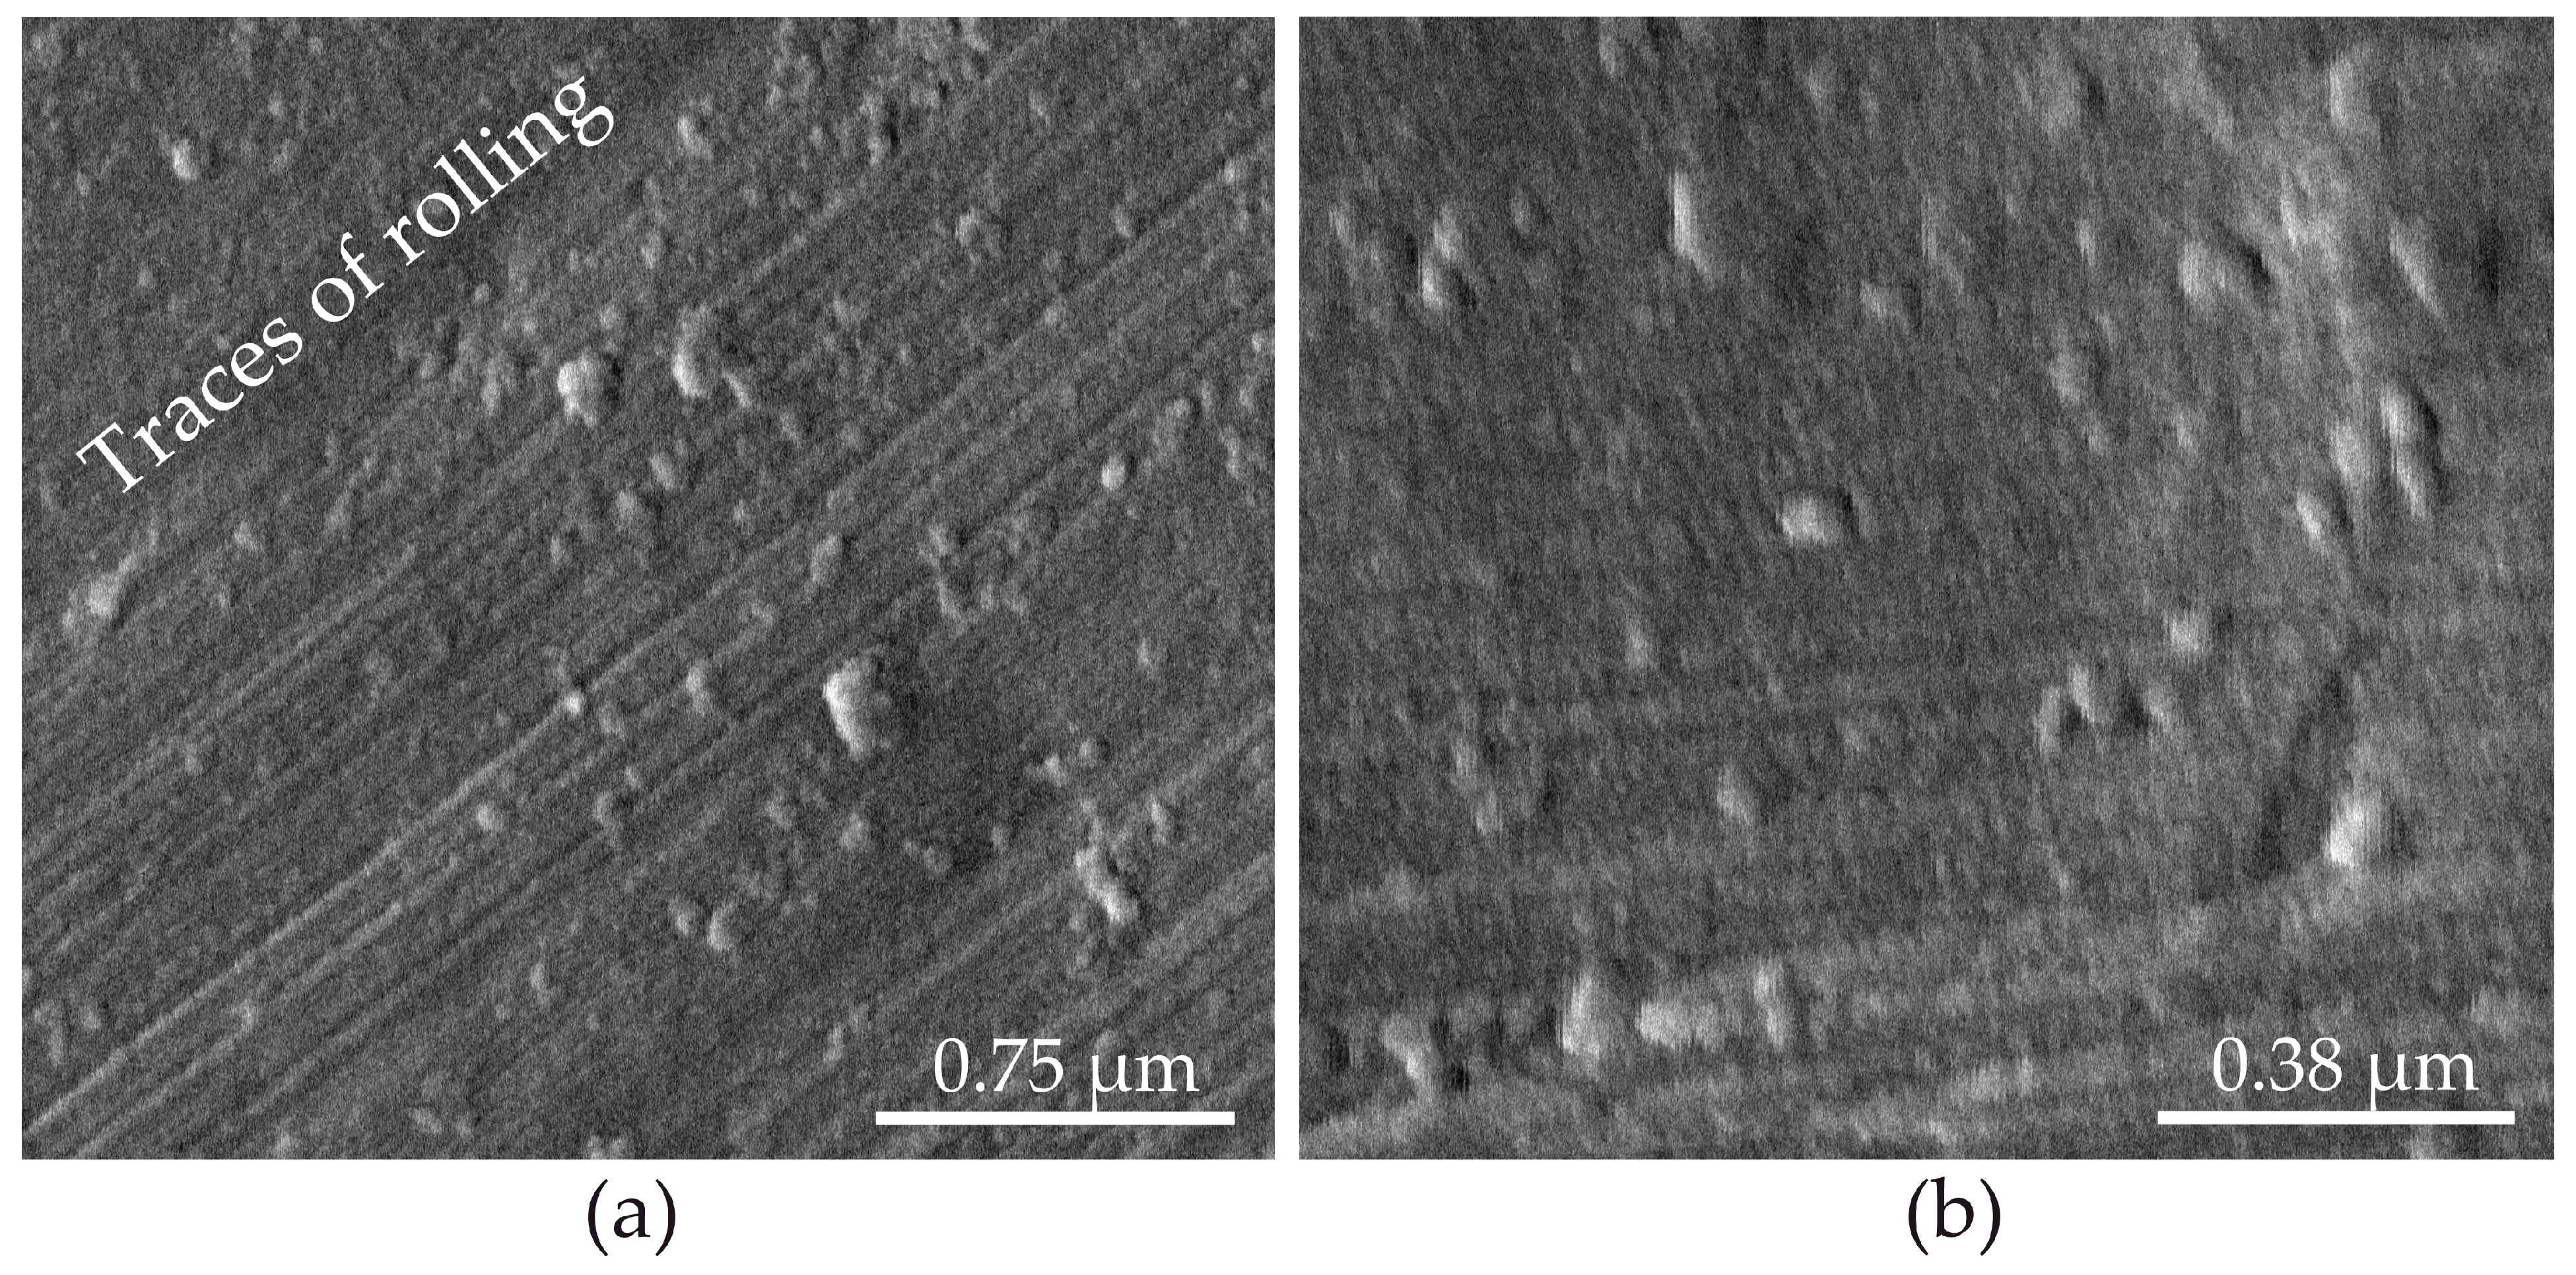
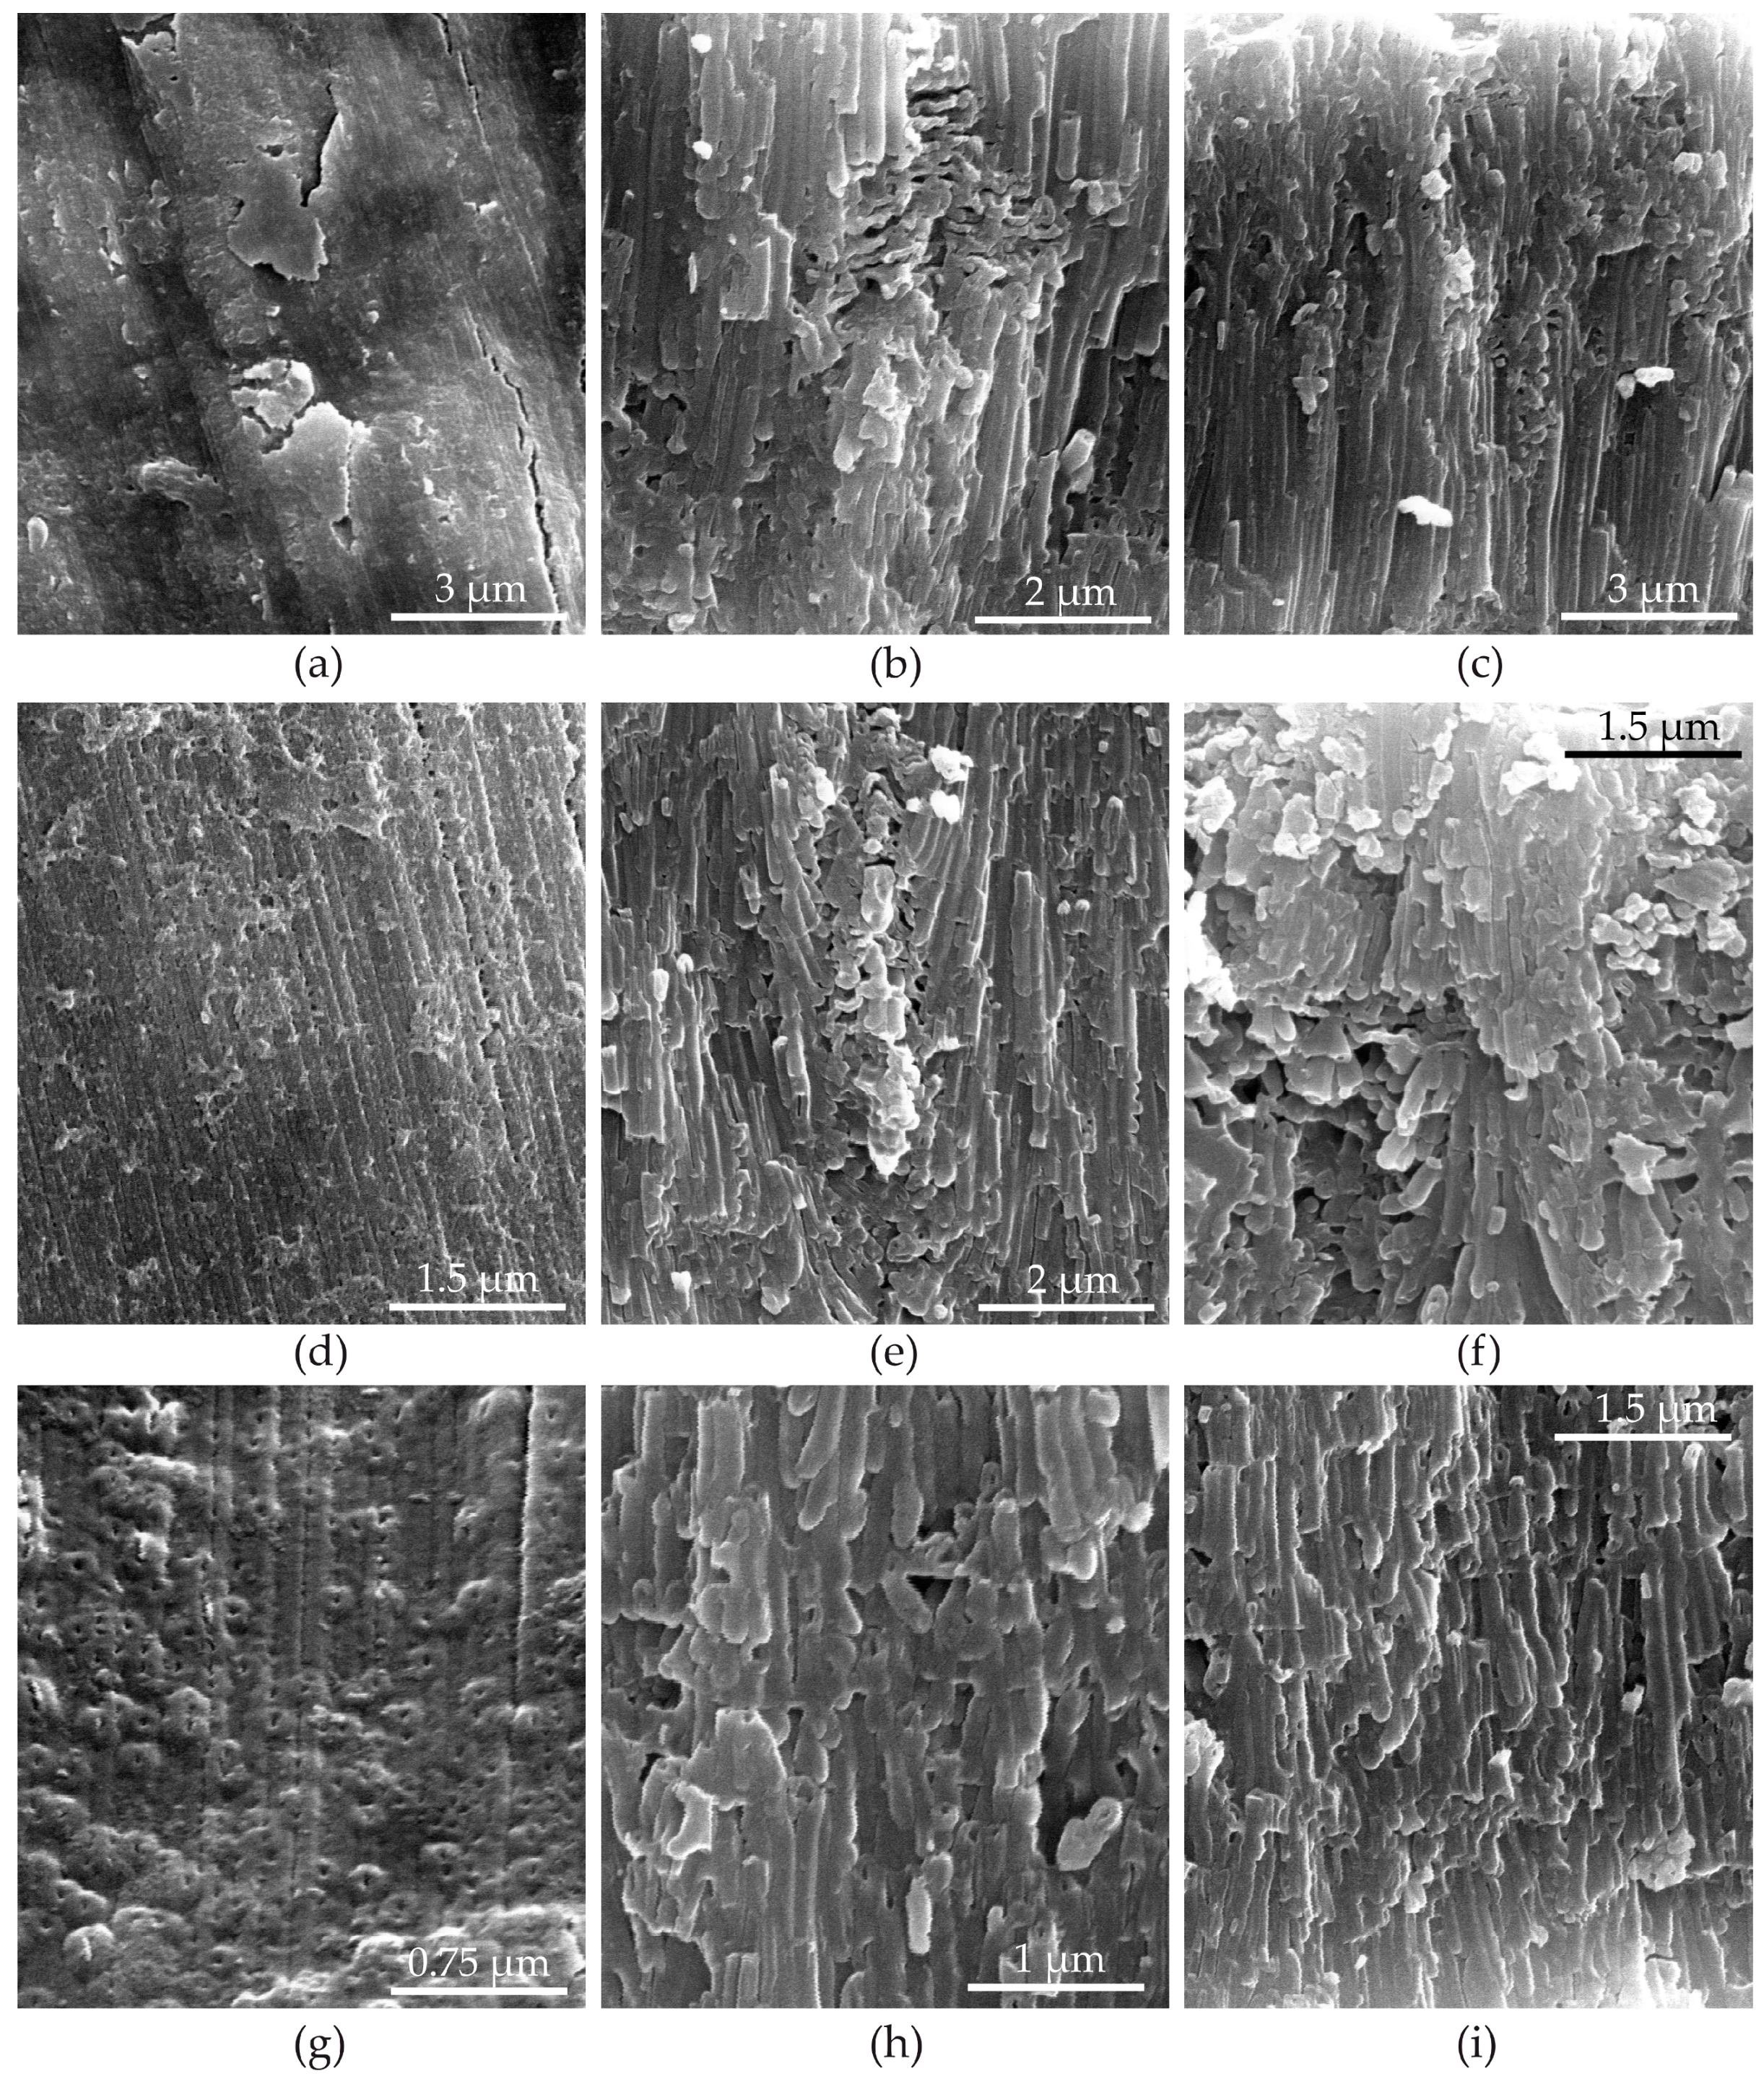
3.7. Film Morphology
4. Conclusions
- The addition of arsenazo-I to MA has considerable influence on the anodizing behavior of pure aluminum. In detail, this means an influence on the dissolution current density and, consequently, on the efficiency of PAOF formation, conductivity, the volume expansion factor, composition, structure, and morphology. Generally, the influence of arsenazo-I increased with increasing concentration and with increasing current density.
- The data on the current efficiency ηF allowed us to make a conclusion on the amount of residual aluminum in the PAOF. A significant excess in some cases of the current efficiency ηF relative to unity is due to the presence of a large number of islands of non-anodized aluminum.
- Acceleration of metal dissolution with increasing arsenazo concentration agrees with the complexation of Al3+ by arsenazo-I. However, the observed stronger influence at higher current densities reveals the superposition of other effects caused by arsenazo-I.
- FTIR-spectra and XPS measurements indicate lower coordinated aluminum and thus less dense oxide due to the increasing number of hydroxyl groups with increasing arsenazo-I concentration as well as an increasing quantity of carbon components in the PAOF. As a consequence, the volume expansion factor increases with increasing arsenazo-I concentration.
- The higher number of defects caused by these structural changes leads to a higher ionic conductivity of the PAOF, which results in a reduced anodizing voltage when compared with anodizing in an arsenazo-free solution.
- XPS and XRD measurements indicate that at a low anodizing current density (15 mA·cm−2), the incorporation of arsenic occurs, presumably, in the composition of complex compounds of arsenazo-I with aluminum, and at a high current density due to the formation of an inorganic compound with the formula Na1,5Al2(OH)4,5(AsO4)3·7H2O, and the arsenic for the formation of this compound was formed as a result of the destruction of arsenazo-I molecules at a high anodic current density (200 mA·cm−2).
- The reduced anodizing voltage and, consequently, the reduced electric field is most likely the reason for the absence of the self-adjusting mechanism, a PAOF formation mechanism observed in pure MA, where the self-adjustment of the active surface area leads to PAOF formation conditions that remain constant over a certain range of applied current densities. An increased degree of self-ordering and a current-independent volume expansion factor were morphological characteristics, observed under these growth conditions. The addition of arsenazo-I leads to the loss of these properties: PAOFs are less ordered and the growth factor changes as a function of anodizing current density, indicating that the self-adjusting mechanism is no longer operative. This agrees with former observations that higher electric fields favor self-ordering of the PAOF [107,108].
- The incorporation of organic components from the electrolyte might also lower the dielectric constant of the PAOF. It is generally accepted that a lower dielectric constant means a higher dielectric strength (i.e., a higher breakdown voltage). This also agrees with the absence of the self-adjusting mechanism, which represents a kind of non-destructive breakdown mechanism. However, other dielectric breakdown events, destructive and more similar with sparking in barrier films, were observed. Self-ordering of the PAOF is totally lost under these conditions.
Supplementary Materials
Author Contributions
Funding
Institutional Review Board Statement
Informed Consent Statement
Data Availability Statement
Acknowledgments
Conflicts of Interest
References
- Lin, Y.; Wu, G.S.; Yuan, X.Y.; Xie, T.; Zhang, L.D. Fabrication and optical properties of TiO2 nanowire arrays made by sol gel electrophoresis deposition into anodic alumina membranes. J. Phys. Condens. Matter 2003, 15, 2917–2922. [Google Scholar] [CrossRef]
- Hnida, K.; Mech, J.; Sulka, G. Template-assisted electrodeposition of indium–antimony nanowire—Comparison of electrochemical methods. Appl. Surf. Sci. 2013, 287, 252–256. [Google Scholar] [CrossRef]
- Mukhurov, N.I.; Gasenkova, I.V.; Zhang, H.; Yu, G. A universal basic for creating microsensory devices those are sensitive to changing environmental conditions. J. Phys. Conf. Ser. 2019, 1347, 012042. [Google Scholar] [CrossRef]
- Ermolaev, G.; Kushnir, S.E.; Sapoletova, N.A.; Napolskii, K.S. Titania photonic crystals with precise photonic band gap position via anodizing with voltage versus optical path length modulation. Nanomaterials 2019, 9, 651. [Google Scholar] [CrossRef] [Green Version]
- Fu, F.; Cha, G.; Denisov, N.; Chen, Y.; Zhang, Y.; Schmuki, P. Water annealing of TiO2 nanotubes for photocatalysis revisited. ChemElectroChem 2020, 7, 2792–2796. [Google Scholar] [CrossRef]
- Pligovka, A.; Poznyak, A.; Norek, M. Optical properties of porous alumina assisted niobia nanostructured films-designing 2-D photonic crystals based on hexagonally arranged nanocolumns. Micromachines 2021, 12, 589. [Google Scholar] [CrossRef] [PubMed]
- Domagalski, J.; Xifre-Perez, E.; Marsal, L. Recent advances in nanoporous anodic alumina: Principles, engineering, and applications. Nanomaterials 2021, 11, 430. [Google Scholar] [CrossRef] [PubMed]
- Pligovka, A. Reflectant photonic crystals produced via porous-alumina-assisted-anodizing of Al/Nb and Al/Ta systems. Surf. Rev. Lett. 2021, 28, 2150055. [Google Scholar] [CrossRef]
- Gorokh, G.G.; Pligovka, A.N.; Lozovenko, A.A. Columnar niobium oxide nanostructures: Mechanism of formation, microstructure, and electrophysical properties. Tech. Phys. 2019, 64, 1657–1665. [Google Scholar] [CrossRef]
- Pligovka, A.; Hoha, A.; Turavets, U.; Poznyak, A.; Zakharau, Y. Formation features, morphology and optical properties of nanostructures via anodizing Al/Nb on Si and glass. Mater. Today Proc. 2021, 37, A8–A15. [Google Scholar] [CrossRef]
- Pligovka, A.; Lazavenka, A.; Gorokh, G. Anodic niobia column-like 3-D nanostructures for semiconductor devices. IEEE Trans. Nanotechnol. 2019, 18, 790–797. [Google Scholar] [CrossRef]
- Tajima, S. Anodic oxidation of aluminum. In Advances in Corrosion Science and Technology; Springer USA: Boston, MA, USA, 1970; pp. 229–362. [Google Scholar] [CrossRef]
- Itoh, N.; Kato, K.; Tsuji, T.; Hongo, M. Preparation of a tubular anodic aluminum oxide membrane. J. Membr. Sci. 1996, 117, 189–196. [Google Scholar] [CrossRef]
- Zahariev, A.; Girginov, A. Formation of complex anodic films on porous alumina matrices. Bull. Mater. Sci. 2003, 26, 349–353. [Google Scholar] [CrossRef]
- Mukherjee, N.; Paulose, M.; Varghese, O.K.; Mor, G.K.; Grimes, C.A. Fabrication of nanoporous tungsten oxide by galvanostatic anodization. J. Mater. Res. 2003, 18, 2296–2299. [Google Scholar] [CrossRef]
- Stefanovich, G.B.; Pergament, A.L.; Velichko, A.A.; Stefanovich, L.A. Anodic oxidation of vanadium and properties of vanadium oxide films. J. Phys. Condens. Matter 2004, 16, 4013–4024. [Google Scholar] [CrossRef]
- Sieber, I.V.; Schmuki, P. Porous tantalum oxide prepared by electrochemical anodic oxidation. J. Electrochem. Soc. 2005, 152, C639–C644. [Google Scholar] [CrossRef]
- Tsuchiya, H.; Schmuki, P. Self-organized high aspect ratio porous hafnium oxide prepared by electrochemical anodization. Electrochem. Commun. 2005, 7, 49–52. [Google Scholar] [CrossRef]
- Tsuchiya, H.; Macak, J.M.; Sieber, I.; Schmuki, P. Self-organized high-aspect-ratio nanoporous zirconium oxides prepared by electrochemical anodization. Small 2005, 1, 722–725. [Google Scholar] [CrossRef] [PubMed]
- Sulka, G.D. Highly ordered anodic porous alumina formation by self-organized anodizing. In Nanostructured Materials in Electrochemistry; Wiley-VCH: Weinheim, Germany, 2008; Volume 1, pp. 1–116. [Google Scholar] [CrossRef]
- Belwalkar, A.; Grasing, E.; Van Geertruyden, W.; Huang, Z.; Misiolek, W. Effect of processing parameters on pore structure and thickness of anodic aluminum oxide (AAO) tubular membranes. J. Membr. Sci. 2008, 319, 192–198. [Google Scholar] [CrossRef] [Green Version]
- Han, S.C.; Doh, J.M.; Yoon, J.K.; Kim, G.H.; Byun, J.Y.; Han, S.H.; Hong, K.T.; Kwun, S.I. Highly ordered self-organized TiO2 nanotube arrays prepared by a multi-step anodic oxidation process. Met. Mater. Int. 2009, 15, 493–499. [Google Scholar] [CrossRef]
- Lazarouk, S.K.; Sasinovich, D.A.; Borisenko, V.E.; Muravski, A.; Chigrinov, V.; Kwok, H.S. Tubular alumina formed by anodization in the meniscal region. J. Appl. Phys. 2010, 107, 033527. [Google Scholar] [CrossRef] [Green Version]
- Roy, P.; Berger, S.; Schmuki, P. TiO2-nanoröhren: Synthese und anwendungen. Angew. Chem. 2011, 123, 2956–2995. [Google Scholar] [CrossRef]
- Smith, Y.R.; Ray, R.S.; Carlson, K.; Sarma, B.; Misra, M. Self-ordered titanium dioxide nanotube arrays: Anodic synthesis and their photo/electro-catalytic applications. Materials 2013, 6, 2892–2957. [Google Scholar] [CrossRef] [PubMed]
- Lee, W.; Park, S.-J. Porous anodic aluminum oxide: Anodization and templated synthesis of functional nanostructures. Chem. Rev. 2014, 114, 7487–7556. [Google Scholar] [CrossRef] [PubMed]
- Minagar, S.; Berndt, C.C.; Wen, C. Fabrication and characterization of nanoporous niobia, and nanotubular tantala, titania and zirconia via anodization. J. Funct. Biomater. 2015, 6, 153–170. [Google Scholar] [CrossRef] [PubMed] [Green Version]
- Verma, N.; Jindal, J.; Singh, K.C.; Mittal, A. Anodic oxide nanostructures: Theories of anodic nanostructure self-organization. In Advanced Coating Materials; Wiley: Hoboken, NJ, USA, 2018; pp. 235–254. [Google Scholar] [CrossRef]
- Sadykov, A.; Kushnir, S.; Sapoletova, N.; Ivanov, V.; Napolskii, K. Anodic titania photonic crystals with high reflectance within photonic band gap via pore shape engineering. Scr. Mater. 2020, 178, 13–17. [Google Scholar] [CrossRef]
- Altomare, M.; Cha, G.; Schmuki, P. Anodic nanoporous niobium oxide layers grown in pure molten ortho-phosphoric acid. Electrochim. Acta 2020, 344, 136158. [Google Scholar] [CrossRef]
- Brzózka, A.; Brudzisz, A.; Rajska, D.; Bogusz, J.; Palowska, R.; Wójcikiewicz, D.; Sulka, G.D. Recent trends in synthesis of nanoporous anodic aluminum oxides. In Nanostructured Anodic Metal Oxides; Elsevier: Amsterdam, The Netherlands, 2020; pp. 35–88. [Google Scholar] [CrossRef]
- Yakovleva, N.M.; Shulga, A.M.; Stepanova, K.V.; Kokatev, A.N.; Rudnev, V.S.; Lukiyanchuk, I.V.; Kuryavyi, V.G. Микрoкoнусные анoднo-oксидные пленки на спеченных пoрoшках ниoбия. Condens. Matter Interphases 2020, 22, 124–134. [Google Scholar] [CrossRef]
- Stepanova, K.V.; Shulga, A.M.; Yakovleva, N.M.; Kokatev, A.N. Crystalline microcone coatings on titanium sponge. Trans. Kola Sci. Cetnre 2020, 11, 185–189. [Google Scholar] [CrossRef]
- Santos, J.; Araújo, P.; Pissolitto, Y.; Lopes, P.; Simon, A.; Sikora, M.; Trivinho-Strixino, F. The use of anodic oxides in practical and sustainable devices for energy conversion and storage. Materials 2021, 14, 383. [Google Scholar] [CrossRef]
- Behzadi, F.; Moradi, M.; Karimi-Alavijeh, H.; Gharavi, A. The effect of anodization voltage and surface morphology on the capacitance properties of Al-Al2O3-Al nanocapacitors. Vacuum 2014, 99, 204–210. [Google Scholar] [CrossRef]
- Zhou, F.; Baron-Wiechec, A.; Garcia-Vergara, S.; Curioni, M.; Habazaki, H.; Skeldon, P.; Thompson, G. Effects of current density and electrolyte temperature on the volume expansion factor of anodic alumina formed in oxalic acid. Electrochim. Acta 2012, 59, 186–195. [Google Scholar] [CrossRef]
- Akhmetov, N.S. Inorganic Chemistry; University Press of the Pacific: Honolulu, HI, USA, 2001. [Google Scholar]
- Lurie, J. Handbook of Analytical Chemistry; Mir Publishers: Moscow, Russia, 1975. [Google Scholar]
- Valota, A.; LeClere, D.; Skeldon, P.; Curioni, M.; Hashimoto, T.; Berger, S.; Kunze, J.; Schmuki, P.; Thompson, G. Influence of water content on nanotubular anodic titania formed in fluoride/glycerol electrolytes. Electrochim. Acta 2009, 54, 4321–4327. [Google Scholar] [CrossRef]
- Sheasby, P.G.; Pinner, R. The Surface Treatment and Finishing of Aluminium and Its Alloys, 6th ed.; ASM International: Materials Park, OH, USA, 2001; ISBN1 0-904477-21-5. ISBN2 0-904477-22-3. [Google Scholar]
- Pligovka, A.N.; Luferov, A.N.; Nosik, R.F.; Mozalev, A.M. Dielectric characteristics of thin film capacitors based on anodized Al/Ta layers. In Proceedings of the 20th International Crimean Conference Microwave & Telecommunication Technology, Sevastopol, Ukraine, 13–17 September 2010; pp. 880–881. [Google Scholar] [CrossRef]
- Brzozka, A.; Brudzisz, A.; Hnida-Gut, K.; Sulka, G.D. Chemical and structural modifications of nanoporous alumina and its optical properties. Superconductivity 2015, 220, 219–288. [Google Scholar] [CrossRef]
- Santos, A. Nanoporous anodic alumina photonic crystals: Fundamentals, developments and perspectives. J. Mater. Chem. C 2017, 5, 5581–5599. [Google Scholar] [CrossRef]
- Gorokh, G.G.; Taratyn, I.A.; Pligovka, A.N.; Lazavenka, A.A.; Zakhlebayeva, A.I. Autoelectronic cathodes based on arrays of niobium-oxide columnar nanostructures for field emission displays. Dokl. BGUIR 2019, 125, 51–58. [Google Scholar] [CrossRef]
- Yakovleva, N.; Anicai, L.; Yakovlev, A.; Dima, L.; Khanina, E.; Buda, M.; Chupakhina, E. Structural study of anodic films formed on aluminum in nitric acid electrolyte. Thin Solid Films 2002, 416, 16–23. [Google Scholar] [CrossRef]
- Yakovleva, N.M.; Anicai, L.; Yakovlev, A.N.; Dima, L.; Khanina, E.Y.; Chupakhina, E.A. Structure and properties of anodic aluminum oxide films produced in HNO3 solutions. Inorg. Mater. 2003, 39, 50–56. [Google Scholar] [CrossRef]
- Kleschenko, I.V.; Rezvanova, M.O.; Poznyak, A.A. Peculiarity of aluminium anodization in sulphosalicylic acid solutions. In Proceedings of the 2006 16th International Crimean Microwave and Telecommunication Technology, Sevastopol, Ukraine, 11–15 September 2006; Volume 2, pp. 675–676. [Google Scholar] [CrossRef]
- Golovataya, S.V.; Mozalev, A.M.; Poznyak, A.A. Peculiarity of aluminium anodization in malonic acid solution. In Proceedings of the 2006 16th International Crimean Microwave and Telecommunication Technology, Sevastopol, Ukraine, 11–15 September 2006; Volume 2, pp. 606–607. [Google Scholar] [CrossRef]
- Patra, N.; Salerno, M.; Losso, R.; Cingolani, R. Use of unconventional organic acids as anodization electrolytes for fabrication of porous alumina. In Proceedings of the 2009 9th IEEE Conference on Nanotechnology, Genoa, Italy, 26–30 July 2009; pp. 567–570. [Google Scholar]
- Nakajima, D.; Kikuchi, T.; Natsui, S.; Suzuki, R.O. Growth behavior of anodic oxide formed by aluminum anodizing in glutaric and its derivative acid electrolytes. Appl. Surf. Sci. 2014, 321, 364–370. [Google Scholar] [CrossRef] [Green Version]
- Knörnschild, G.; Poznyak, A.; Karoza, A.; Mozalev, A. Effect of the anodization conditions on the growth and volume expansion of porous alumina films in malonic acid electrolyte. Surf. Coat. Technol. 2015, 275, 17–25. [Google Scholar] [CrossRef]
- Gordeeva, E.O.; Roslyakov, I.V.; Napolskii, K.S. Aluminium anodizing in selenic acid: Electrochemical behaviour, porous structure, and ordering regimes. Electrochim. Acta 2019, 307, 13–19. [Google Scholar] [CrossRef]
- Huang, H.; Qiu, J.; Wei, X.; Sakai, E.; Jiang, G.; Wu, H.; Komiyama, T. Ultra-fast fabrication of porous alumina film with excellent wear and corrosion resistance via hard anodizing in etidronic acid. Surf. Coat. Technol. 2020, 393, 125767. [Google Scholar] [CrossRef]
- Thompson, G. Porous anodic alumina: Fabrication, characterization and applications. Thin Solid Films 1997, 297, 192–201. [Google Scholar] [CrossRef]
- Baron-Wiechec, A.; Ganem, J.J.; Garcia-Vergara, S.J.; Skeldon, P.; Thompson, G.E.; Vickridge, I.C. 18O Tracer Study of porous film growth on aluminum in phosphoric acid. J. Electrochem. Soc. 2010, 157, C399. [Google Scholar] [CrossRef]
- Oh, J.; Thompson, C.V. The role of electric field in pore formation during aluminum anodization. Electrochim. Acta 2011, 56, 4044–4051. [Google Scholar] [CrossRef]
- Garcia-Vergara, S.; Skeldon, P.; Thompson, G.; Habakaki, H. Tracer studies of anodic films formed on aluminium in malonic and oxalic acids. Appl. Surf. Sci. 2007, 254, 1534–1542. [Google Scholar] [CrossRef]
- Keller, F.; Hunter, M.S.; Robinson, D.L. Structural features of oxide coatings on aluminum. J. Electrochem. Soc. 1953, 100, 411–419. [Google Scholar] [CrossRef]
- Masuda, H.; Fukuda, K. Ordered metal nanohole arrays made by a two-step replication of honeycomb structures of anodic alumina. Science 1995, 268, 1466–1468. [Google Scholar] [CrossRef] [PubMed]
- Solovei, D.V.; Mozalev, A.M.; Gorokh, G.G. Formation of high ordered matrixes of anodic alumina with necessary thickness and morphology. Dokl. BGUIR 2008, 6, 65–72. [Google Scholar]
- Mozalev, A.; Smith, A.; Borodin, S.; Plihauka, A.; Hassel, A.; Sakairi, M.; Takahashi, H. Growth of multioxide planar film with the nanoscale inner structure via anodizing Al/Ta layers on Si. Electrochim. Acta 2009, 54, 935–945. [Google Scholar] [CrossRef]
- Nielsch, K.; Choi, J.; Schwirn, K.; Wehrspohn, A.R.B.; Gösele, U. Self-ordering regimes of porous alumina: The 10 porosity rule. Nano Lett. 2002, 2, 677–680. [Google Scholar] [CrossRef]
- Ono, S.; Saito, M.; Asoh, H. Self-ordering of anodic porous alumina formed in organic acid electrolytes. Electrochim. Acta 2005, 51, 827–833. [Google Scholar] [CrossRef]
- Akiya, S.; Kikuchi, T.; Natsui, S.; Suzuki, R.O. Optimum exploration for the self-ordering of anodic porous alumina formed via selenic acid anodizing. J. Electrochem. Soc. 2015, 162, E244–E250. [Google Scholar] [CrossRef] [Green Version]
- Sadykov, A.; Kushnir, S.; Roslyakov, I.; Baranchikov, A.; Napolskii, K. Selenic acid anodizing of aluminium for preparation of 1D photonic crystals. Electrochem. Commun. 2019, 100, 104–107. [Google Scholar] [CrossRef]
- Li, A.-P.; Müller, F.; Birner, A.; Nielsch, K.; Gösele, U. Hexagonal pore arrays with a 50–420 nm interpore distance formed by self-organization in anodic alumina. J. Appl. Phys. 1998, 84, 6023–6026. [Google Scholar] [CrossRef] [Green Version]
- Huang, X.; Su, W.; Sun, L.; Liu, J.; Sasinovich, D.A.; Kupreeva, O.V.; Tsirkunov, D.A.; Rabatuev, G.G.; Lazarouk, S.K. Effect of anodic voltage on parameters of porous alumina formed in sulfuric acid electrolytes. Mater. Phys. Mech. 2019, 41, 62–68. [Google Scholar] [CrossRef]
- Bocchetta, P.; Sunseri, C.; Chiavarotti, G.; Di Quarto, F. Microporous alumina membranes electrochemically grown. Electrochim. Acta 2003, 48, 3175–3183. [Google Scholar] [CrossRef]
- Zaraska, L.; Sulka, G.; Jaskuła, M. Properties of nanostructures obtained by anodization of aluminum in phosphoric acid at moderate potentials. J. Phys. Conf. Ser. 2009, 146, 012020. [Google Scholar] [CrossRef] [Green Version]
- Surganov, V.; Gorokh, G. Anodic oxide cellular structure formation on aluminum films in tartaric acid electrolyte. Mater. Lett. 1993, 17, 121–124. [Google Scholar] [CrossRef]
- Kikuchi, T.; Yamamoto, T.; Suzuki, R.O. Growth behavior of anodic porous alumina formed in malic acid solution. Appl. Surf. Sci. 2013, 284, 907–913. [Google Scholar] [CrossRef] [Green Version]
- Saito, M.; Muto, H.; Asoh, H.; Ono, S. Self-Ordering Behavior of Anodic Porous Alumina Formed in Malonic Acid Solution. In Proceedings of the 204th Meeting of The Electrochemical Society, Co-Sponsored in Part by the Electronics Division of the American Ceramic Society, Orlando, FL, USA, 12–16 October 2003; Available online: https://www.electrochem.org/dl/ma/204/pdfs/0030.PDF (accessed on 28 February 2021).
- Saito, M.; Muto, H.; Asoh, H.; Ono, S. Study on self-ordering mechanism of anodic porous alumina formed in malonic acid solution. J. Surf. Finish. Soc. Jpn. 2004, 55, 937–942. [Google Scholar] [CrossRef]
- Lee, W.; Nielsch, K.; Gösele, U. Self-ordering behavior of nanoporous anodic aluminum oxide (AAO) in malonic acid anodization. Nanotechnology 2007, 18, 475713. [Google Scholar] [CrossRef] [Green Version]
- Norek, M.; Dopierała, M.; Stępniowski, W. Ethanol influence on arrangement and geometrical parameters of aluminum concaves prepared in a modified hard anodization for fabrication of highly ordered nanoporous alumina. J. Electroanal. Chem. 2015, 750, 79–88. [Google Scholar] [CrossRef]
- Martín, J.; Manzano, C.V.; Caballero-Calero, O.; Martín-González, M. High-aspect-ratio and highly ordered 15-nm porous alumina templates. ACS Appl. Mater. Interfaces 2012, 5, 72–79. [Google Scholar] [CrossRef]
- Chen, W.; Wu, J.-S.; Xia, X.-H. Porous anodic alumina with continuously manipulated pore/cell size. ACS Nano 2008, 2, 959–965. [Google Scholar] [CrossRef]
- Norek, M.; Stępniowski, W.J.; Siemiaszko, D. Effect of ethylene glycol on morphology of anodic alumina prepared in hard anodization. J. Electroanal. Chem. 2016, 762, 20–28. [Google Scholar] [CrossRef]
- Tajima, S.; Baba, N.; Shimura, F.M. Einfluss von Anionen und Inhibitoren auf die primären wachstumsvorgänge der anodischen oxidschichten auf aluminium. Electrochim. Acta 1967, 12, 955-IN2. [Google Scholar] [CrossRef]
- Wood, G.C.; Skeldon, P.; Thompson, G.E.; Shimizu, K. A Model for the incorporation of electrolyte species into anodic alumina. J. Electrochem. Soc. 1996, 143, 74–83. [Google Scholar] [CrossRef]
- Mozalev, A.; Poznyak, A.; Mozaleva, I.; Hassel, A. The voltage-time behaviour for porous anodizing of aluminium in a fluoride-containing oxalic acid electrolyte. Electrochem. Commun. 2001, 3, 299–305. [Google Scholar] [CrossRef]
- Poznyak, A.; Pligovka, A.; Laryn, T.; Salerno, M. Porous alumina films fabricated by reduced temperature sulfuric acid anodizing: Morphology, composition and volumetric growth. Materials 2021, 14, 767. [Google Scholar] [CrossRef]
- Diggle, J.W.; Downie, T.C.; Goulding, C.W. Anodic oxide films on aluminum. Chem. Rev. 1969, 69, 365–405. [Google Scholar] [CrossRef]
- Stępniowski, W.J.; Norek, M.; Michalska-Domańska, M.; Nowak-Stepniowska, A.; Bombalska, A.; Włodarski, M.; Bojar, Z. Incorporation of copper chelate ions into anodic alumina walls. Mater. Lett. 2013, 106, 242–245. [Google Scholar] [CrossRef]
- Пoзняк, А.; Knörnschild, G.; Плигoвка, А.; Ларин, Т. Анoдный oксид алюминия, сфoрмирoванный в вoдных раствoрах хелатных кoмплексных сoединений цинка и кoбальта. Журнал Техническoй Физики 2021, 91, 1479. [Google Scholar] [CrossRef]
- Surganov, V.F.; Mozalev, A.M.; Mozaleva, I.I. Rate of electrochemical aluminum anodizing and volume growth of anode oxide in orthophosphoric acid solutions. Russ. J. Appl. Chem. 1997, 70, 254–259. [Google Scholar]
- Surganov, V.F.; Poznyak, A.A. Dissolution of anodic aluminum oxide in the initial stage of anodic oxidation in aqueous solutions of tartaric and sulfosalicylic acids. Russ. J. Appl. Chem. 1998, 71, 253–256. [Google Scholar]
- Mozalev, A.; Mozaleva, I.; Sakairi, M.; Takahashi, H. Anodic film growth on Al layers and Ta-Al metal bilayers in citric acid electrolytes. Electrochim. Acta 2005, 50, 5065–5075. [Google Scholar] [CrossRef]
- Lednický, T.; Mozalev, A. Optimization of self-organized growth of nanoporous anodic alumina templates for capacitor application. Proceeding of the Nanocon 2015: 7th International Conference on Nanomaterials—Research & Application, Brno, Chech Republic, 14–16 October 2015; pp. 265–269. [Google Scholar]
- Cingi, M.B.; Bigoli, F.; Leporati, E.; Pellinghelli, M.A. Spectrophotometric study of the reactions of proton and copper (II) with arsenazo I in aqueous solution. J. Chem. Soc. Dalton Trans. 1982, 1965–1970. [Google Scholar] [CrossRef]
- Dorogi, P.; Santarius, U.; Neumann, E. Arsenazo I and tetramethylmurexide as optical calcium indicators. Anal. Biochem. 1982, 124, 27–36. [Google Scholar] [CrossRef] [Green Version]
- El-Sweify, F.H.; Zakaria, N. Studies on the sorption behavior of Arsenazo-I, U(VI) and Th(IV) species from aqueous solutions of Arsenazo-I on different types of ion exchangers. J. Radioanal. Nucl. Chem. 1996, 209, 51–63. [Google Scholar] [CrossRef]
- Hosten, E.; Rohwer, H.E. Complexation reactions of uranyl with arsenazo III. Anal. Chim. Acta 1997, 355, 95–100. [Google Scholar] [CrossRef]
- Kaczmarek, M.; Meinrath, G.; Lis, S.; Kufelnicki, A. the interaction of arsenazo III with Nd(III)—A chemometric and metrological analysis. J. Solut. Chem. 2008, 37, 933–946. [Google Scholar] [CrossRef]
- Golovataya, S.V.; Zubarevich, O.I.; Knörnschild, G.; Muravitskaya, E.V.; Poznyak, A.A. Highly doped nanostrcturized template of anodic alumina. In Proceedings of the 2008 18th International Crimean Conference—Microwave & Telecommunication Technology, Sevastopol, Ukraine, 8–12 September 2008; pp. 581–583. [Google Scholar] [CrossRef]
- Poznyak, A.A.; Knoernshild, G.; Karoza, A.G. Influence of complex additive on structure and IR properties of porous anodic alumina. In Proceedings of the 21st International Crimean Conference “Microwave & Telecommunication Technology”, Sevastopol, Ukraine, 12–16 September 2011; pp. 723–724. [Google Scholar]
- Thompson, G.E.; Wood, G.C. Anodic films on aluminium. In Treatise on Materials Science and Technology; Elsevier: Amsterdam, The Netherlands, 1983; Volume 23, pp. 205–329. [Google Scholar] [CrossRef]
- Páez, M.; Foong, T.; Ni, C.; Thompson, G.; Shimizu, K.; Habazaki, H.; Skeldon, P.; Wood, G. Barrier-type anodic film formation on an Al-3.5 wt% Cu alloy. Corros. Sci. 1996, 38, 59–72. [Google Scholar] [CrossRef]
- Páez, M.; Zagal, J.; Bustos, O.; Aguirre, M.; Skeldon, P.; Thompson, G. Effect of benzotriazole on the efficiency of anodizing of Al–Cu alloys. Electrochim. Acta 1997, 42, 3453–3459. [Google Scholar] [CrossRef]
- Vrublevsky, I.; Parkoun, V.; Schreckenbach, J.; Marx, G. Effect of the current density on the volume expansion of the deposited thin films of aluminum during porous oxide formation. Appl. Surf. Sci. 2003, 220, 51–59. [Google Scholar] [CrossRef]
- Vrublevsky, I.; Parkoun, V.; Sokol, V.; Schreckenbach, J.; Marx, G. The study of the volume expansion of aluminum during porous oxide formation at galvanostatic regime. Appl. Surf. Sci. 2004, 222, 215–225. [Google Scholar] [CrossRef]
- Harkness, A.C.; Young, L. High resistance anodic oxide films on aluminium. Can. J. Chem. 1966, 44, 2409–2413. [Google Scholar] [CrossRef] [Green Version]
- Skeldon, P.; Shimizu, K.; Thompson, G.E.; Wood, G.C. Barrier-Type anodic films on aluminium in aqueous borate solutions: 1—Film density and stopping power of anodic alumina films for alpha particles. Surf. Interface Anal. 1983, 5, 247–251. [Google Scholar] [CrossRef]
- XPS Spectra. Available online: www.casaxps.com/help_manual/manual_updates/xps_spectra.pdf (accessed on 19 June 2021).
- Benolt, R. XPS, AES, UPS and ESCA, laSurface.com. Available online: http://www.lasurface.com/database/index.php (accessed on 19 June 2021).
- ICDD—International Centre for Diffraction Data. Available online: https://www.icdd.com/ (accessed on 15 December 2020).
- Ono, S.; Saito, M.; Asoh, H. Self-ordering of anodic porous alumina induced by local current concentration: Burning. Electrochem. Solid State Lett. 2004, 7, B21–B24. [Google Scholar] [CrossRef]
- Ono, S.; Saito, M.; Ishiguro, M.; Asoh, H. Controlling factor of self-ordering of anodic porous alumina. J. Electrochem. Soc. 2004, 151, B473–B478. [Google Scholar] [CrossRef]
- Barbosa, D.P.; Knörnschild, G. Anodization of Mg-alloy AZ91 in NaOH solutions. Surf. Coat. Technol. 2009, 203, 1629–1636. [Google Scholar] [CrossRef]


Publisher’s Note: MDPI stays neutral with regard to jurisdictional claims in published maps and institutional affiliations. |
© 2021 by the authors. Licensee MDPI, Basel, Switzerland. This article is an open access article distributed under the terms and conditions of the Creative Commons Attribution (CC BY) license (https://creativecommons.org/licenses/by/4.0/).
Share and Cite
Poznyak, A.; Knörnschild, G.; Karoza, A.; Norek, M.; Pligovka, A. Peculiar Porous Aluminum Oxide Films Produced via Electrochemical Anodizing in Malonic Acid Solution with Arsenazo-I Additive. Materials 2021, 14, 5118. https://doi.org/10.3390/ma14175118
Poznyak A, Knörnschild G, Karoza A, Norek M, Pligovka A. Peculiar Porous Aluminum Oxide Films Produced via Electrochemical Anodizing in Malonic Acid Solution with Arsenazo-I Additive. Materials. 2021; 14(17):5118. https://doi.org/10.3390/ma14175118
Chicago/Turabian StylePoznyak, Alexander, Gerhard Knörnschild, Anatoly Karoza, Małgorzata Norek, and Andrei Pligovka. 2021. "Peculiar Porous Aluminum Oxide Films Produced via Electrochemical Anodizing in Malonic Acid Solution with Arsenazo-I Additive" Materials 14, no. 17: 5118. https://doi.org/10.3390/ma14175118