Article

Enhanced Electron Heat Conduction in TaS3 1D Metal Wire

1
Department of Energy Science, Sungkyunkwan University, Suwon 16419, Korea
2
Department of Smart Fab. Technology, Sungkyunkwan University, Suwon 16419, Korea
3
Center for Integrated Nanostructure Physics, Institute for Basic Science, Sungkyunkwan University, Suwon 16419, Korea
4
Institute of Advanced Composite Materials, Korea Institute of Science and Technology, Chudong-ro, Bongdong-eub, Seoul 55324, Korea
5
Reality Devices Research Division, Electronics and Telecommunications Research Institute, Daejeon 34129, Korea
*
Authors to whom correspondence should be addressed.
Materials 2021, 14(16), 4477; https://doi.org/10.3390/ma14164477
Submission received: 19 July 2021 / Revised: 5 August 2021 / Accepted: 6 August 2021 / Published: 10 August 2021
(This article belongs to the Topic Multiple Application for Novel and Advanced Materials)

Abstract

:
The 1D wire TaS3 exhibits metallic behavior at room temperature but changes into a semiconductor below the Peierls transition temperature (Tp), near 210 K. Using the 3ω method, we measured the thermal conductivity κ of TaS3 as a function of temperature. Electrons dominate the heat conduction of a metal. The Wiedemann–Franz law states that the thermal conductivity κ of a metal is proportional to the electrical conductivity σ with a proportional coefficient of L0, known as the Lorenz number—that is, κ = σ L o T . Our characterization of the thermal conductivity of metallic TaS3 reveals that, at a given temperature T, the thermal conductivity κ is much higher than the value estimated in the Wiedemann–Franz (W-F) law. The thermal conductivity of metallic TaS3 was approximately 12 times larger than predicted by W-F law, implying L = 12 L 0 . This result implies the possibility of an existing heat conduction path that the Sommerfeld theory cannot account for.

1. Introduction

Transition metal trichalcogenide compounds, including NbSe3 and TaS3, constitute one-dimensional (1D) wires and are metals at room temperature. The first Brillouin zone (BZ) is half-filled, resulting in the first Brillouin zone size quadruple that of the Fermi vector κ F [1,2]. However, their structure is unstable. As temperature decreases, the first Brillouin zone of the 1D wire shrinks to a size comparable to 2 κ F . The recrystallization at low temperature, referred to as the Peierls transition, characterizes the gap opening at the Fermi level. In addition, the transition contributes to the periodic modulation of electron density with new crystalline regularity, known as the charge density wave (CDW) [3]. The movement of an electron in a 1D system is strongly correlated with that of other electrons. Any impurity in the 1D system strongly influences the transport behavior so that electrons are isolated by the impurity potential, which is absent from the 2D and 3D crystals [4,5]. The 1D electronic system is a platform for studying superconductivity, metal-insulator transition, strongly correlated phenomena, and new devices [6,7,8,9,10].
In addition to charge transport, the heat transport properties of 1D wires showing CDW are of great interest. Nesting the Fermi vector in the first BZ enhances the interaction between electrons and phonons. Lattice vibrations with large momentum, q = 2 κ F , scatter the electrons at the Fermi level. Since electrons (rather than phonons) dominate heat conduction in metals, the carrier relaxation mechanism is important for understanding the heat flow of metallic CDW systems. Recently, in TaS2 (a 2D CDW material), the heat conduction between 200 K and 300 K has been significantly suppressed, originating from the strong electron–phonon coupling [11]. Contrary to this, in fresnoite (Ba2TiSi2O8) showing incommensurate CDW (ICDW) material, the quasi-particle of the CDW-phonon produces enhanced heat conduction because of the enhanced group velocity of acoustic phonon [12]. We cannot explain the above-mentioned abnormal heat transport effects from the single viewpoint of an electron or phonon heat conduction because the contribution, role, and detailed mechanism behind CDW in heat conduction in 1D CDW materials are not well understood.
The Wiedemann–Franz (W–F) law assesses the correlation between heat and charge conduction by the electrons in the metal. The electron in this law is assumed to be non-interacting and expected to move in a single band, which is not true all the time, although many metals follow the law well [13]. The electron in the metal has interactions with various entities, including phonons, defects, substrates, and charged impurities. In addition, the Fermi level lies over a few different bands possessing different densities of states and band curvature or effective mass. When these parameters are brought into consideration, the W–F law may fail.
For instance, electrons moving in a 1D structure, exhibiting strong electron-electron interactions, are expected to result in a large L [14]. The collective motion of electron and hole plasmons in nondegenerate monolayer graphene violates W-F law with approximately 25 L/L0 [15]. In 3D bulk materials, multiband transports of both electron and hole carriers in a narrow bandgap semiconductor attribute L to far exceed L0 when the position of the Fermi level inside a bandgap and band curvature is well-optimized.
In this study, we address the behavior of the thermal conductivity of TaS3 1D nanowires above room temperature. The Peierls transition temperature of TaS3 is approximately 210 K. Above this temperature, TaS3 is a metal. Thus, the heat conduction is dominated by electrons rather than phonons. Our thermal conductivity measurement using the 3ω method addresses the fact that the heat transport of TaS3 at room temperature does not obey the W–F law, which assessing the transport of heat and electrical current by electron diffusion across the temperature gradient. The thermal conductivity κ of the metal is expressed as:
κ = σ L 0 T
where σ is the electrical conductivity and L0 is the Lorenz number. In our experiment, the Lorenz number grew as large as 12 times ( L ~ 12 L 0 ). We expected that such a large Lorenz number could result from the strong phonon coupling of the CDW.

2. Materials and Methods
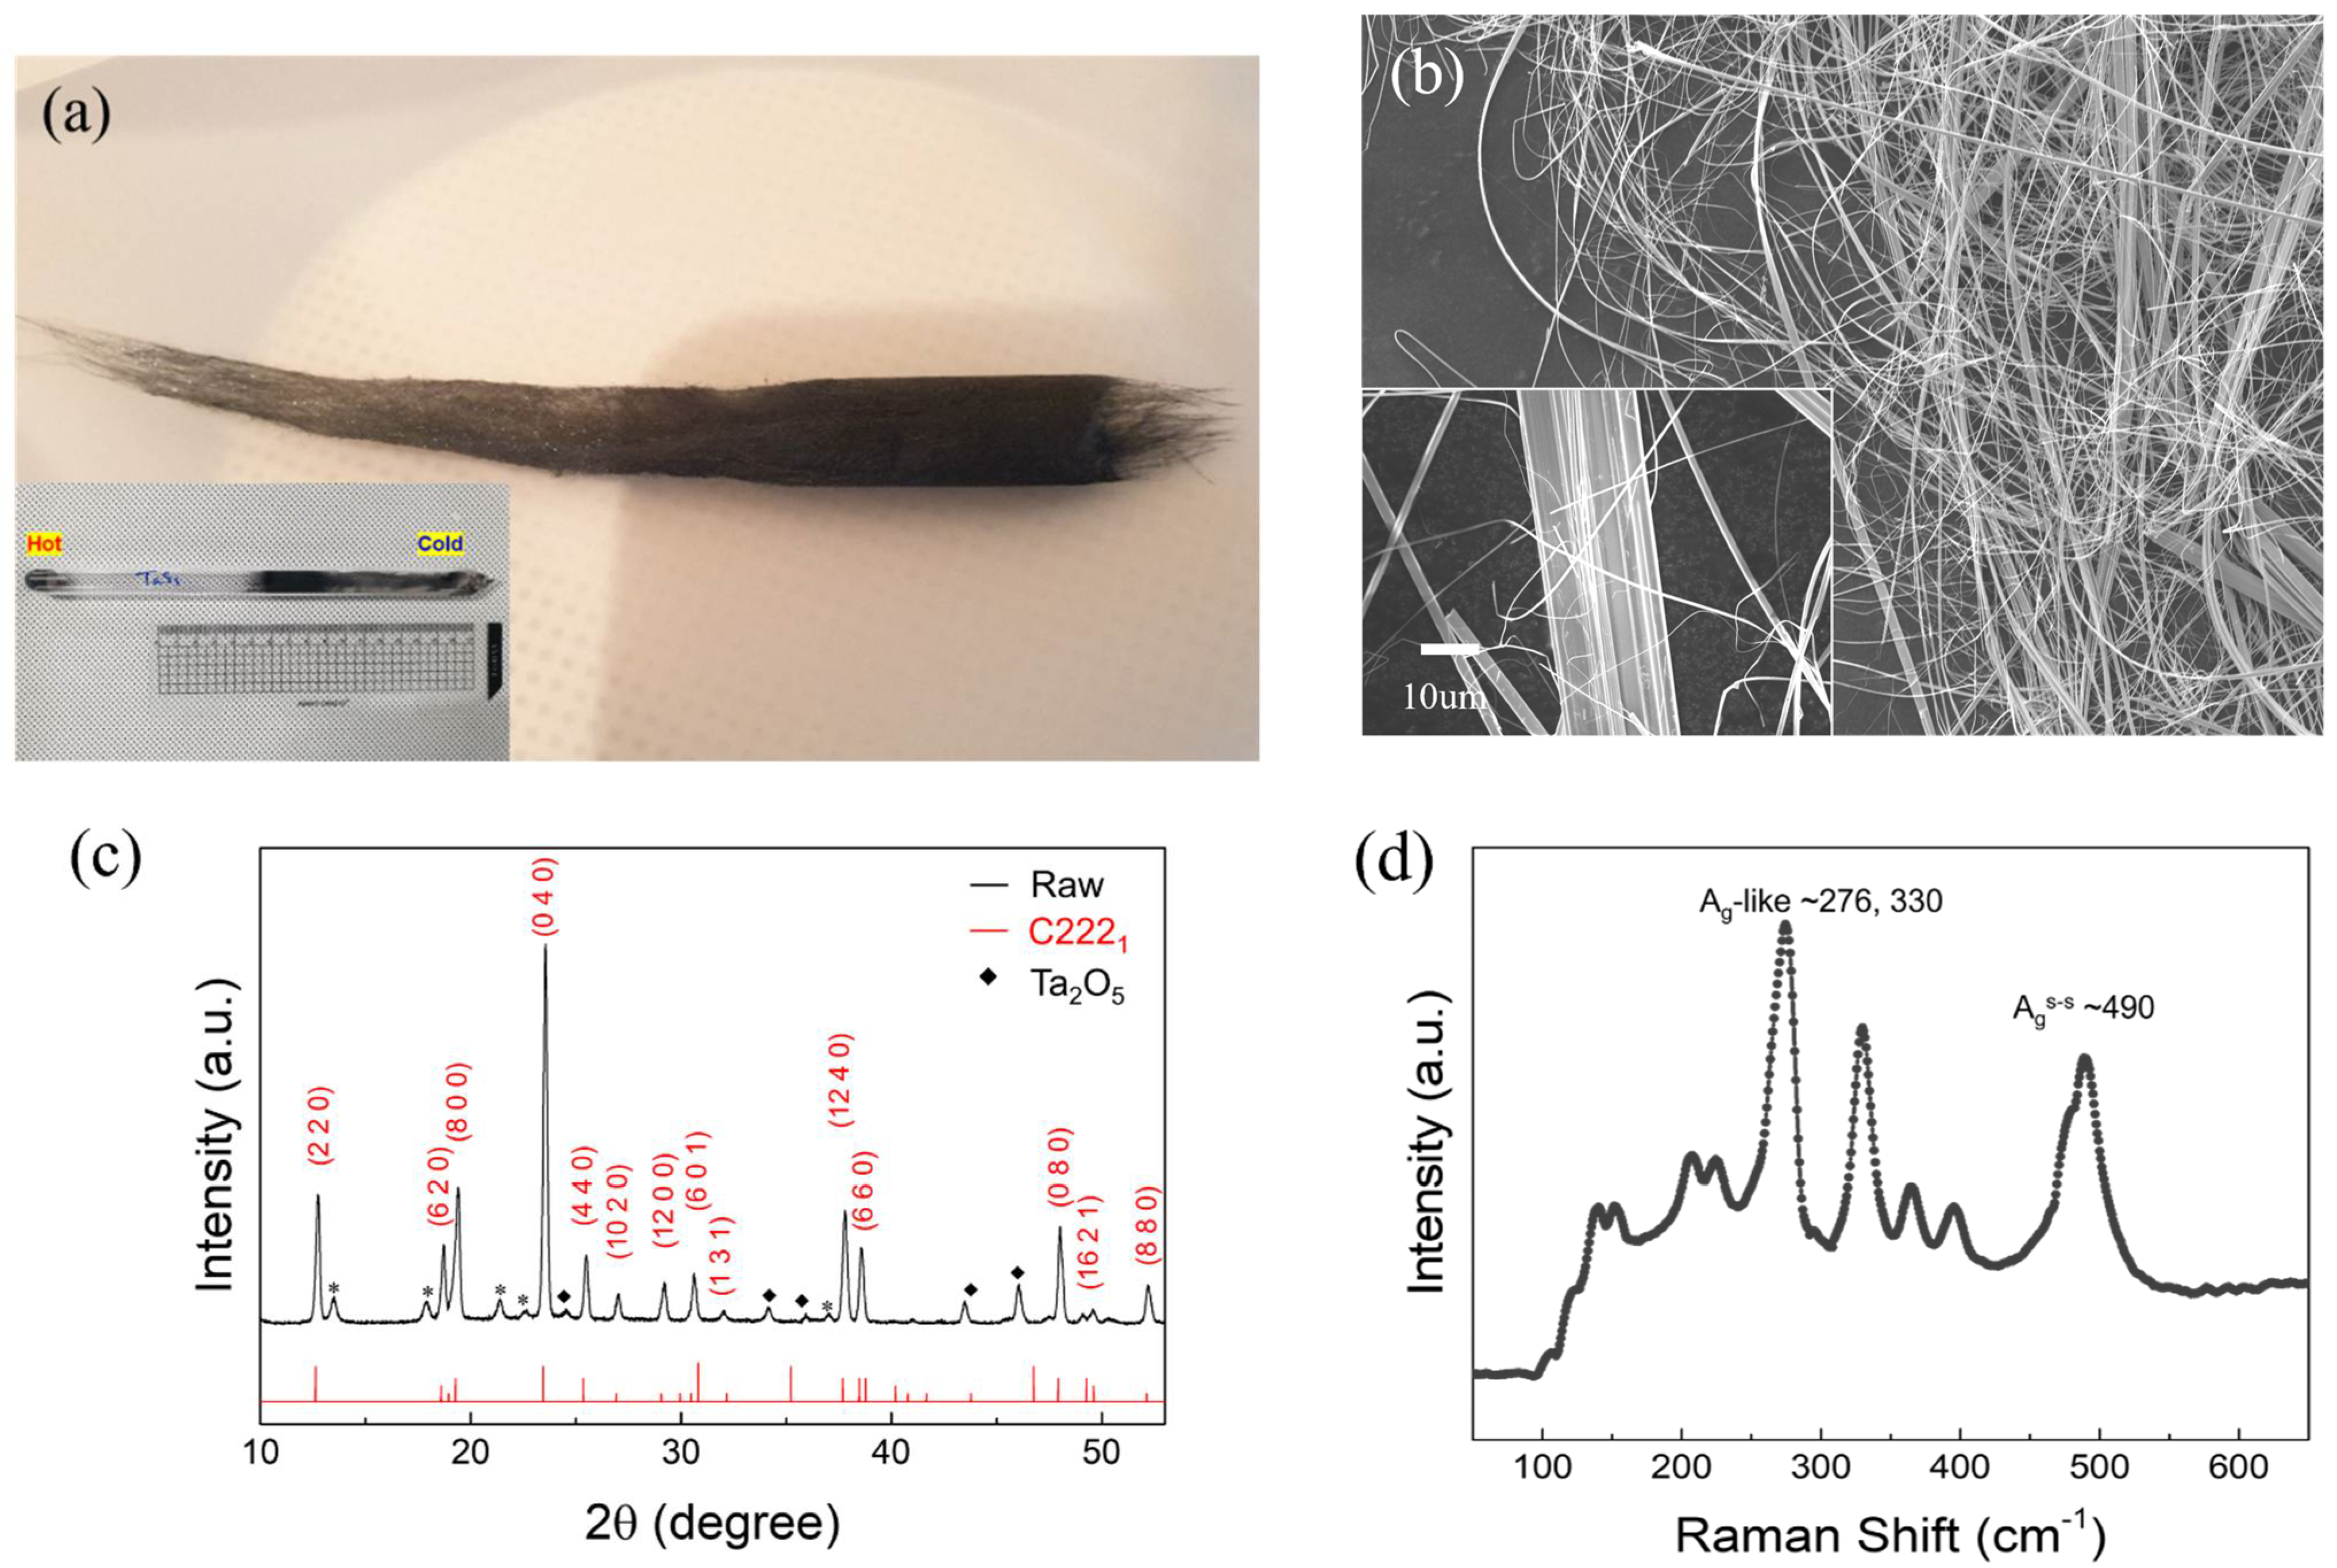
2.1. TaS3 Growth

Bulk TaS3 fiber bundles were grown using the chemical vapor transport method (CVT) [16,17]. We filled a quartz ampoule with tantalum and sulfur powder, a growth precursor, iodine, and a transport agent for synthesis. The Ta and S were weighed carefully to 1:3 in atomic ratio and introduced in the quartz container. We then placed the ampoule inside a two-zone furnace to induce thermal gradient: hot zone (700 °C) and cold zone (500 °C). Figure 1a’s inset shows the ampoule used in the experiment. The synthesis of TaS3 fibers lasted for seven days, after which we cooled down the furnace to room temperature for 24 h. Differential heating of our growth conditions contributed to TaS3 in different sample geometries. In the cold zone, TaS3 grew into fibers, as shown in Figure 1a, with the length of the bulk fiber bundle extending to 10 cm. After breaking the ampoule, we used a small amount of TaS3 for further analysis. A scanning electron micrograph in Figure 1b exhibits that the bundle in Figure 1a comprises much narrower bundles of numerous nanowires. Their width was found to vary from a few hundred nm to a few 10 µm as shown in the inset of Figure 1b.

2.2. X-ray Diffraction and Raman Spectroscopy

We studied the crystallography of TaS3 using an X-ray diffractometer (SmartLab, Rigaku, Japan), which emits Cu Kα radiation (wavelength of X-ray: 1.54059 Å). Since our sample consists of numerous nanowires, we used the Bragg–Brentano mode, which is useful for powder. The X-ray diffraction (XRD) pattern in Figure 1c presents the various crystal planes, which stem from the many nanowires exposed to the incidental X-rays at different crystal directions. The crystal structure of TaS3 is orthorhombic with the space group C2221, which is supported with reference peaks (red line). The planes of Ta2O5 are also observed (diamond). Some unknown peaks are indicated with asterisks.
The Raman peaks of TaS3 have a strong angle dependence between the E-field direction of the incident laser and the crystal c-axis of TaS3; this is responsible for the preferential absorption along the wire [17]. The three prominent peaks of Ag-like peaks (~276 and ~330 cm−1) and an Ags-s peak (~498 cm−1) with the lower energy side at 276 cm−1 and 490 cm−1 originating from the o-TaS3 phase in Figure 1d are clearly detected, in good agreement with the previous observation [17].

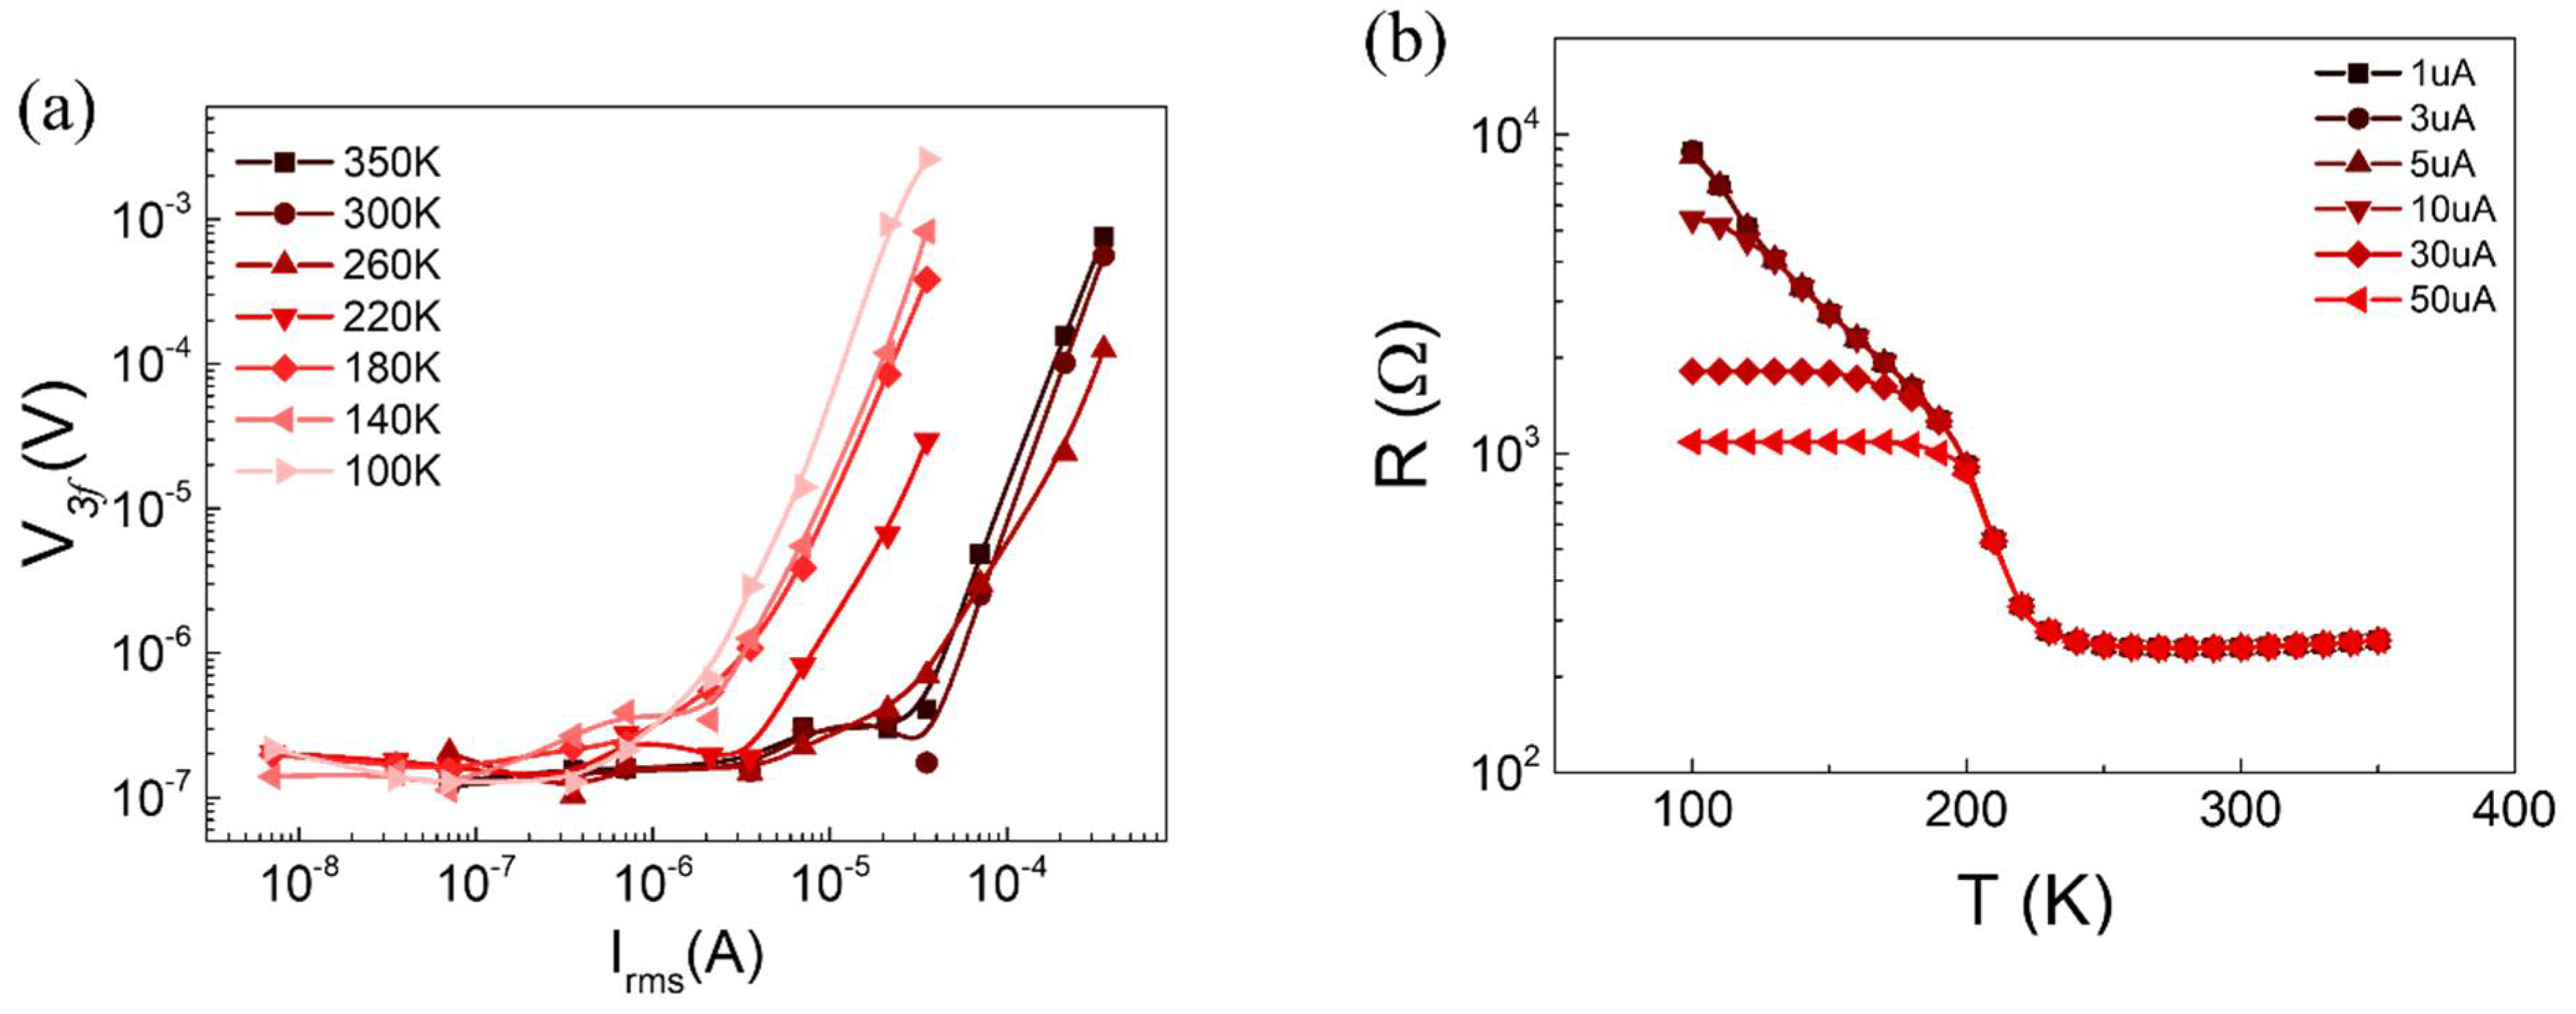
2.3. Electrical and Thermal Characterizations of a Bundle of TaS3

We performed electrical and thermal conductivity measurements on colinear sample geometry, on which we used Ag epoxy on a single bundle of TaS3 to make four contact points. The diameter of the bundle ranges from 15 µm. We softly landed a TaS3 bundle on equally spaced small Ag epoxy droplets, which separated the bundle from the sapphire substrate. After connecting the electrical wires, we cured the droplets at 90 °C for 1 h under ambient conditions. We then loaded the substrate into a closed-cycle refrigerator (CCR) (Janis Research Company, Lake Shore, Woburn, MA, USA) to measure the electrical and thermal characteristics. We used the outer two electrodes for the current supply and two inner electrodes for voltage probing. We measured the resistance–temperature characteristics of TaS3 by using 6221 DC and AC current sources (Keithley Instruments, Cleveland, OH, USA) and an SR860 lock-in amplifier (Stanford Research, Sunnyvale, CA, USA).
We studied the thermal properties of TaS3 using the 3ω method [18]. In this method, AC current Io(f) at the frequency f = ω / 2 π is applied up to a level that provokes the Joule heating of our samples. We confirmed the degree of heating of TaS3 by checking the voltage at a frequency of 3f, V 3 f . Then, the voltage generated at 3f because of the Joule heating, and can be expressed as:
V 3 f ~ 2 I o 3 R R l π 4 κ A ( 1 + 4 π f γ ) 2
where I0 is the AC current applied for heating, R is the slope of the R–T curve, l is the length, f is the frequency of the applied AC current, γ is the thermal wavelength, and A is the cross-sectional area of the TaS3 bundle. At the low-frequency limit, V 3 f is simply expressed as:
V 3 f ~ 2 I o 3 R R l π 4 κ A
From V 3 f , the thermal conductivity κ can be obtained [19].
To measure the thermoelectric power (TEP), we used dry transfer to deposit a single bundle of TaS3 on a SiO2/Si (300 nm/500 µm) substrate and patterned electrodes by using e-beam lithography for heating and temperature sensing [20]. We applied a DC current to a serpentine electrode, which causes Joule heating and develops a temperature gradient along the sample. We used a four-terminal method to measure the temperature difference along the sample. Next, we probed the TEP developed over TaS3. We used 6221 DC and AC current sources, a 2182 nanovoltmeter, and a 7001 switch system for the characterization [21].

3. Results and Discussions

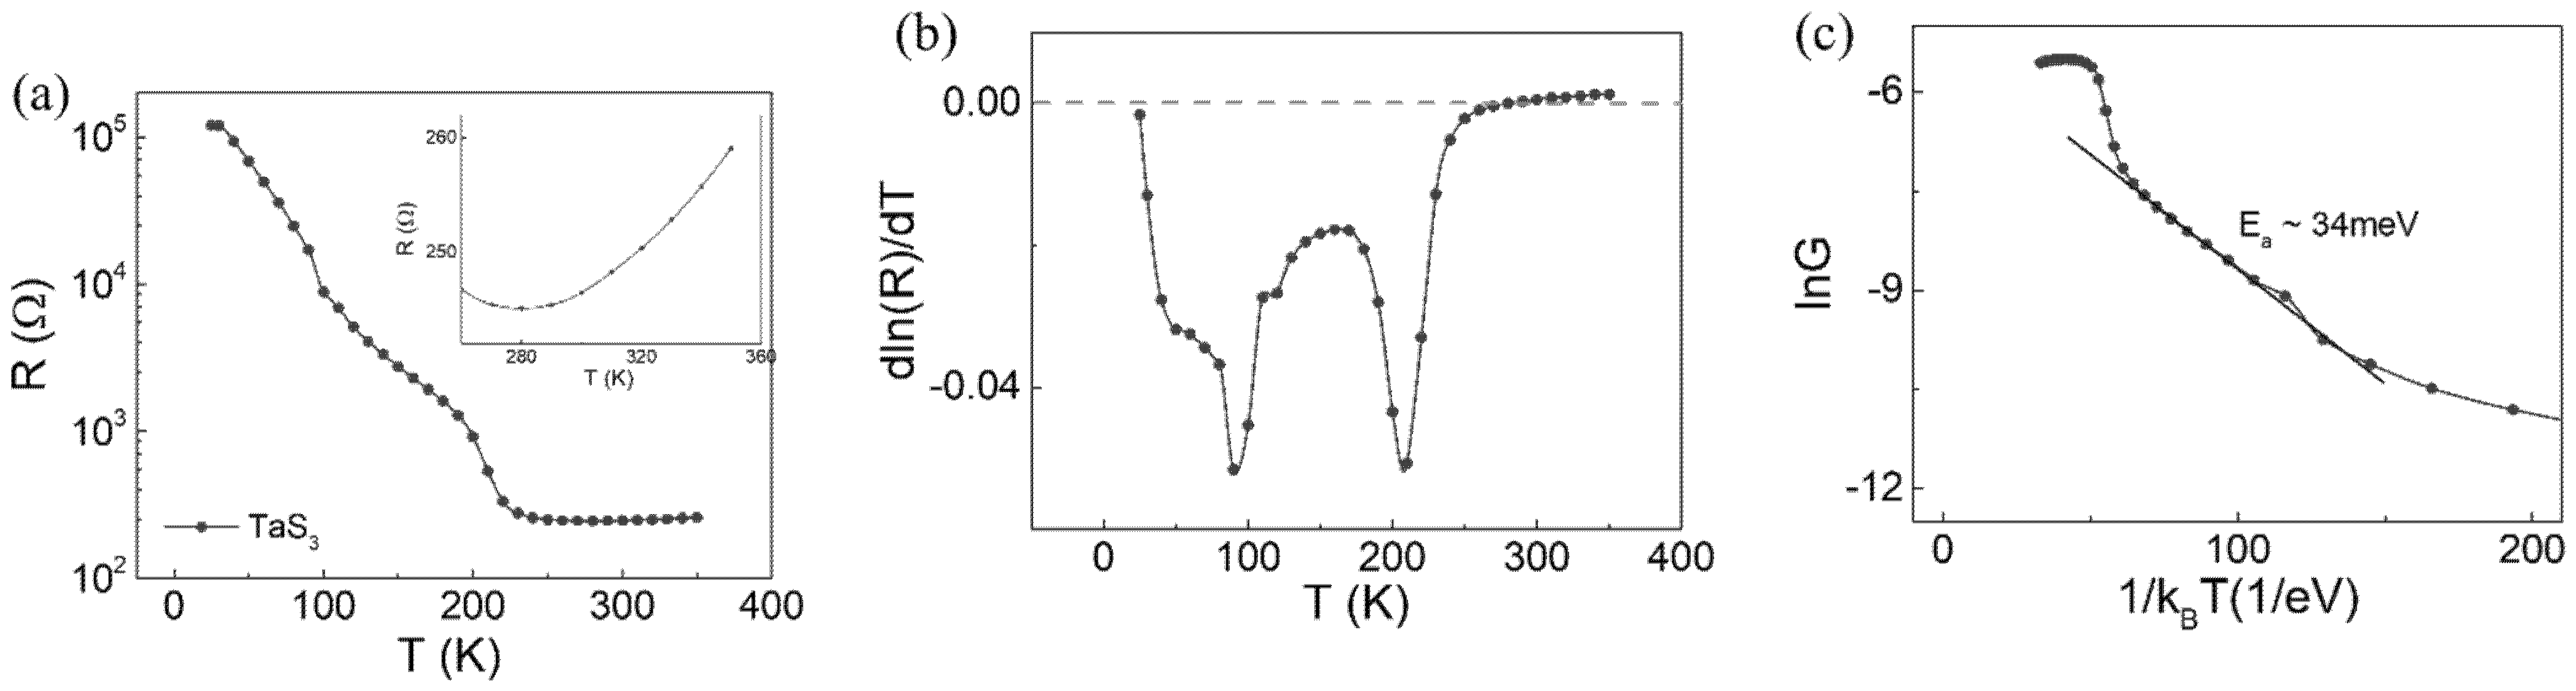
3.1. Resistance–Temperature Dependence

As shown in Figure 2a, the resistance–temperature (R–T) curve of a bundle of TaS3 exhibits a separate slope at approximately 220 K; rapid exponential decay of resistance with multiple slopes occurs in the temperature range of 50–220 K. Such a negative slope in the R–T curve indicates a semiconductor. Then, when the temperature is above 220 K, the inset of Figure 2a shows an up-turn in the R–T curve. The inset shows a positive slope in the temperature range of 280–350 K, which is a signature of the metal. The incremental rate of the R–T curve is referred to as the temperature coefficient of resistance (TCR), approximately T C R = 5 × 10 3 / K at room temperature. Electron scattering from optical phonons above room temperature caused the increase in resistance with temperature. The optical phonons such as the Ag-like mode at 276 cm−1 in Figure 1d are expected to be highly populated and scatter the electron above the transition temperature.
To manifest the resistance variation at temperatures below 220 K, we used a derivative of resistance with respect to temperature, as shown in Figure 2b. A sharp dip in the d R d T T plot indicates the metal-insulator transition (MIT) of TaS3 occurring at 210 K. This characteristic temperature is called the Peierls transition temperature Tp. Before the Peierls transition, the electron density is homogeneous. When the transition occurs, the atomic spacing goes into a modulation. The electrons redistribute themselves with a certain periodicity. Hence, CDW emerges. The CDW of TaS3 has been analyzed using various methods at a temperature below Tp, including X-ray diffraction, electron diffraction, and scanning tunneling microscopy. The low-temperature characterization of CDW reports the existence of incommensurate and commensurate CDW depending on the temperature range [22,23,24,25]. Between Tp and 100K, an incommensurate CDW with the wave vector of q c = ( 0.252   ±   0.002 ) c is observed. Below 100 K, the incommensurate CDW turns into commensurate CDW with the wave vector of q c = ( 0.250   ±   0.002 ) c . Here, c is the axial direction of TaS3. [22]. The wavelength along the axial direction is about 13 Å, whereas the b-axis is nearly 120 Å.
After the transition, the first Brillouin zone size becomes twice the Fermi wave vector; this alludes to the existence of the Fermi surface at the first Brillouin zone edge, which can net q vector connecting the parallel Fermi surface. The atomic restructuring accompanies an energy bandgap at the Fermi level. Although the energy gap varies depending on the temperature, the Arrhenius plot for the conductance G,
G ~ e E g κ B T
indicates that the bandgap becomes Eg ~ 34 meV in Figure 2c, comparable to a previous result of 67 meV [26]. κ B is the Boltzmann constant. For this reason, the resistance increases with decreasing temperature. At lower temperature, the thermal excitation of carriers into the conduction band reduces.
A stiff increase in the resistance below 210 K activated Joule heating under the current used for the resistance measurement of metal TaS3. Therefore, we confirmed Joule heating at each temperature by measuring the V3f voltage, as shown in Figure 3a [18,19]. Depending on the amount of current applied and the sample temperature, the degree of Joule heating varied. For example, applying 10 µA to the sample did not contribute to heating for temperatures down to 260 K, as shown in Figure 3a. However, at temperatures lower than 260 K, noticeable heating occurred, as evidenced by V3f. As expected from Figure 3a, the R–T curve exhibits different slopes depending on the amount of current in Figure 3b. The larger the current, the earlier the R–T saturation is found below Tp. After regulating the current at 1 µA, the electric field dependence on the resistance of TaS3 observed in previous studies was absent in our case [27,28].
The thermal conductivity κ of a bundle of TaS3 as a function of temperature is shown in Figure 4a. The R–T curve in Figure 2a shows that, with temperatures between 50 and 200 K, TaS3 is a semiconductor. For semiconductors, lattice vibrations are the dominant heat carriers. In the log ( κ )–log(T) plot in Figure 4a, the heat conductivity of our samples is characterized by the peak appearing at approximately 80 K. The Debye temperature (DT) of TaS3 is lower than 130 K [29]. At temperatures well below DT, an increase in temperature promotes the heat capacity Cv of the lattice, C ν ~ T 3 , for bulk materials, whereas the phonon mean free path is constant. Thus, the cube dependence on the thermal conductivity of the lattice κ p on T3 is expected when T << DT. In contrast to this expectation for our TaS3 bundle, Figure 4a shows that the red line—our fit-to-log ( κ )–log(Tβ) plot at a temperature below 70 K—reveals an exponent, β ~ 0.98. This result implies that our TaS3 bundle is likely a 1D heat conductor. Although individual TaS3 nanowires are expected to be physically entangled in a bundle for heat conduction, β ~ 0.98 supports the expectation that nanowire-to-nanowire interaction should be quite low. At T >> DT, the heat capacity saturates, and the phonon mean free path λ p is inversely proportional to the temperature, λ p   ~   1 / T . The thermal conductivity of the phonon, κ p , decreased with increasing temperature. As predicted, the blue line—our fit-to-the-curve plot in Figure 4a—shows an exponent β ~ −0.92 in the temperature range from peak temperature to 150 K, implying that the behavior of phonon-driven heat conduction is well-presented.
However, above Tp, the thermal transport behavior deviates significantly from the 1/T behavior. Specifically, it fluctuated significantly around Tp. The extraction of κ from Equation (3) requires the slope of the R–T curve, as shown in Figure 2a. In this temperature range, estimating κ is difficult because of the extremely low slope of R-T curve at the transition between the semiconductor and metal. The dependence of κ on the temperature becomes proportional when the temperature increases above 280 K. Figure 2a indicates that TaS3 is a metal above 280 K. In metals, heat is carried by electrons. The thermal conductivity of an electron is described as:
κ e = 1 3 C ν ν F λ
where C ν is the heat capacity, ν F is the Fermi velocity, and λ is the mean free path of the electron [30]. The electron heat capacity is proportional to T, as in C ν ~ T . λ is inversely proportional to T, as in λ ~ 1 / T , because of the increasing phonon scattering. Since EF changes negligibly within a narrow temperature range between 300 K and 350 K, we assumed the overall trend of κ 3 f to be constant. In contrast to this general assumption, κ 3 f in this temperature range shows a proportional increase in the temperature, as shown in Figure 4b.
When heat conduction occurs in the metal wire, the electrons diffusing from the hot to cold region transport the heat current as well as the charge current, whose relation is expressed in Equation (1). In the equation, L0 is further expressed as:
L o = π 2 3 ( κ B q ) 2 = 2.44 × 10 8   W Ω K 2
where q is the electrical charge. With this relation, we can evaluate the thermal conductivity from the electrical conductivity σ. The electron thermal conductivity based on the Wiedemann–Franz law,   κ e W F , in Figure 4b scales with temperature. However, Figure 4b shows a large discrepancy between κ e W F and κ 3 f .
In certain cases, a different mechanism incorporates electron scattering for heat and charge conduction. For instance, at very low (high) temperatures, impurities (optical phonons) solely hinder both charge and heat conduction by electrons. In this case, L approaches the theoretical value, L0. However, at moderate temperatures, the optical phonon and impurity scattering may contribute differently to heat and charge transport, respectively. The relaxation time approximation (RTA) model differentiates the scattering events of thermally and electrically excited electrons. Therefore, L o = π 2 3 ( κ B q ) 2 commonly loses its validity in such cases. In the RTA model, the ratio is further expressed as:
κ σ = τ κ τ σ L o T
where τ κ and τ σ are the scattering times for heat and charge transport [31]. Since measuring τ κ and τ σ is difficult, Snyder et al. proposed an empirical law [32] that enables us to estimate the Lorenz number by measuring the thermoelectric power (TEP), expressed as:
L = 1.5 + e x p ( | S | 116 )
This expression holds for a single parabolic band and acoustic phonon scattering. Here, S is the Seebeck coefficient.
We scrutinized the TEP (S) of TaS3 to estimate L for the metallic one. The lower-left inset in Figure 4c shows the device, with TaS3 located inside a circle between the electrodes. Below 210 K, the TEP increases with decreasing temperature. The Mott relation, S ~ 1 / G , can explain the increase in TEP at low temperatures, with G as the electrical conductance [33]. The TEP near room temperature ranges around 10 µV/K, indicating the hole as a majority carrier, and remains almost unchanged down to 250 K, as shown in the upper-right inset of Figure 4c. This attribute causes an empirical L to remain almost constant in the temperature range between 250 K and 320 K, as shown in Figure 4d. We observed LTEP from the TEP measurement: L T E P = 2.42 × 10 8   W Ω K 2 , which is only a small percentage lower than L0. When T < 250 K, the LTEP decreased significantly. At low temperatures, TaS3 opens a small bandgap. In nondegenerate narrow-gap semiconductors, carriers from both the conduction and valence bands participate in the heat conduction. Both holes and electrons diffuse in the same direction against the temperature gradient. In the case of the multiband transport without interband interactions, the total L varies depending on the position of the Fermi level inside the bandgap, E F κ B T , and the band curvature. Thus, it is expressed as a linear combination of L from each band, which is weighted by the partial electrical conductance. In other words,
L = i G i L i i G i
G i indicates the conductance of the ith band. Hence, L varies widely [34]. In the inset of Figure 4d, LTEP converges to L T E P = 1.5 × 10 8   W Ω K 2 as the temperature decreases.

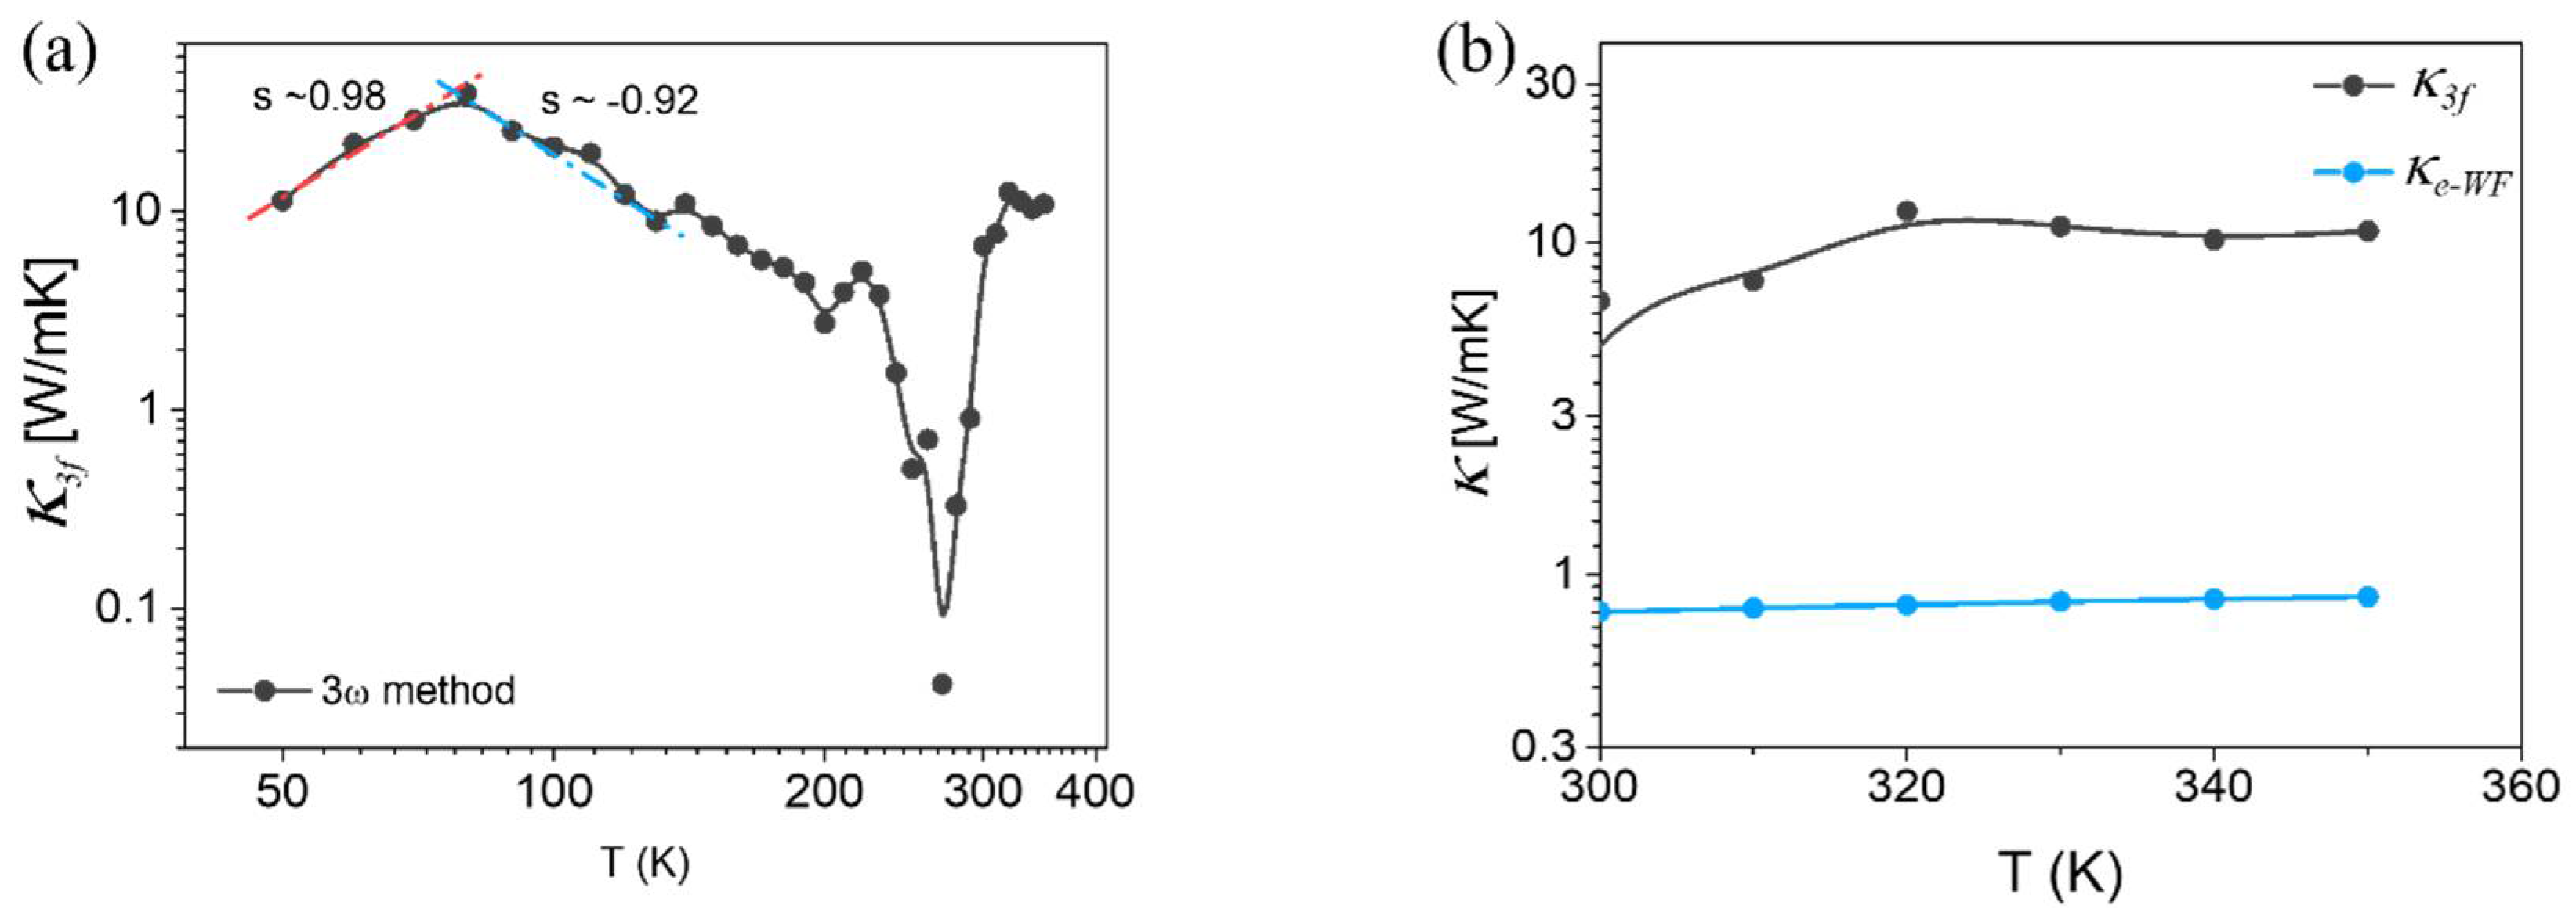
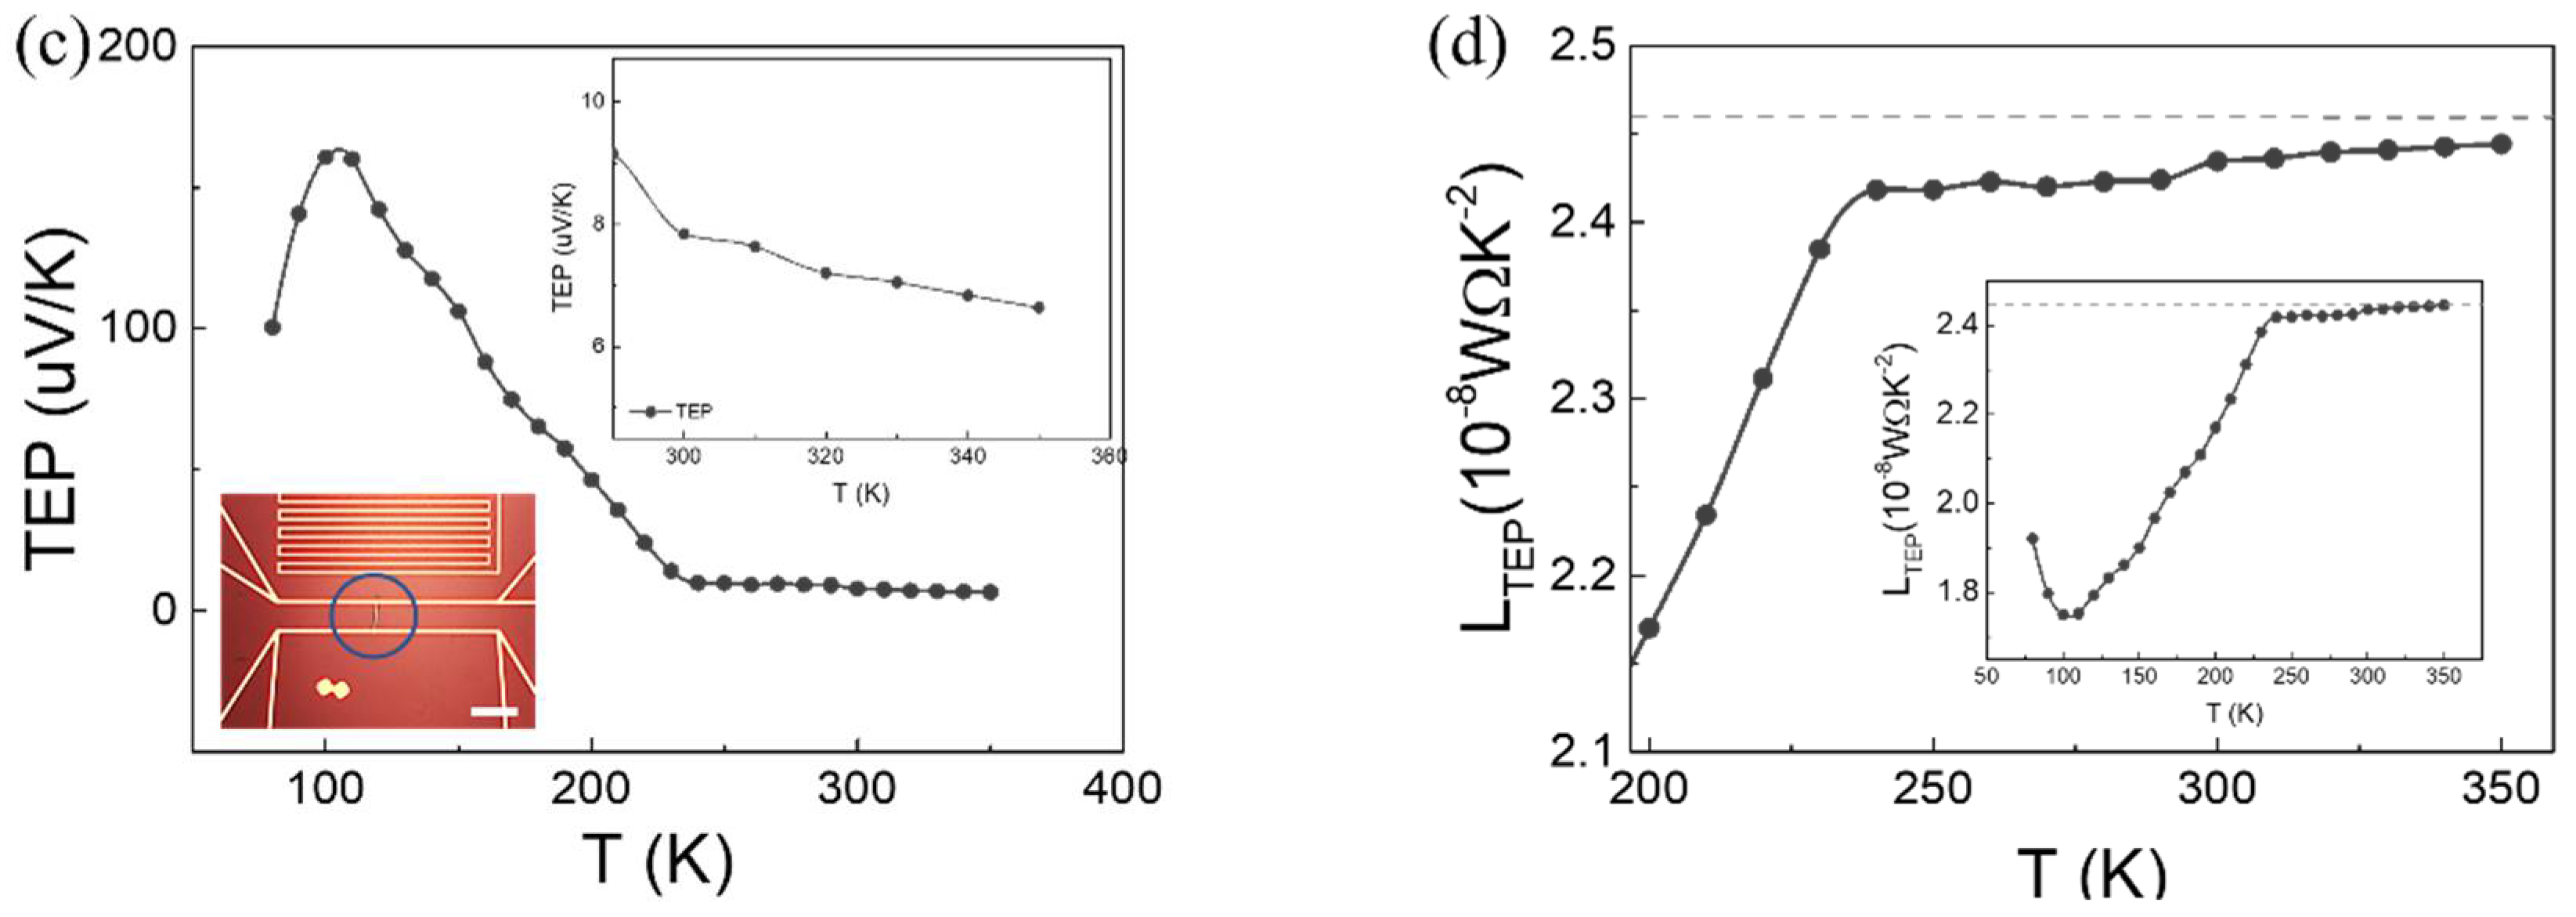
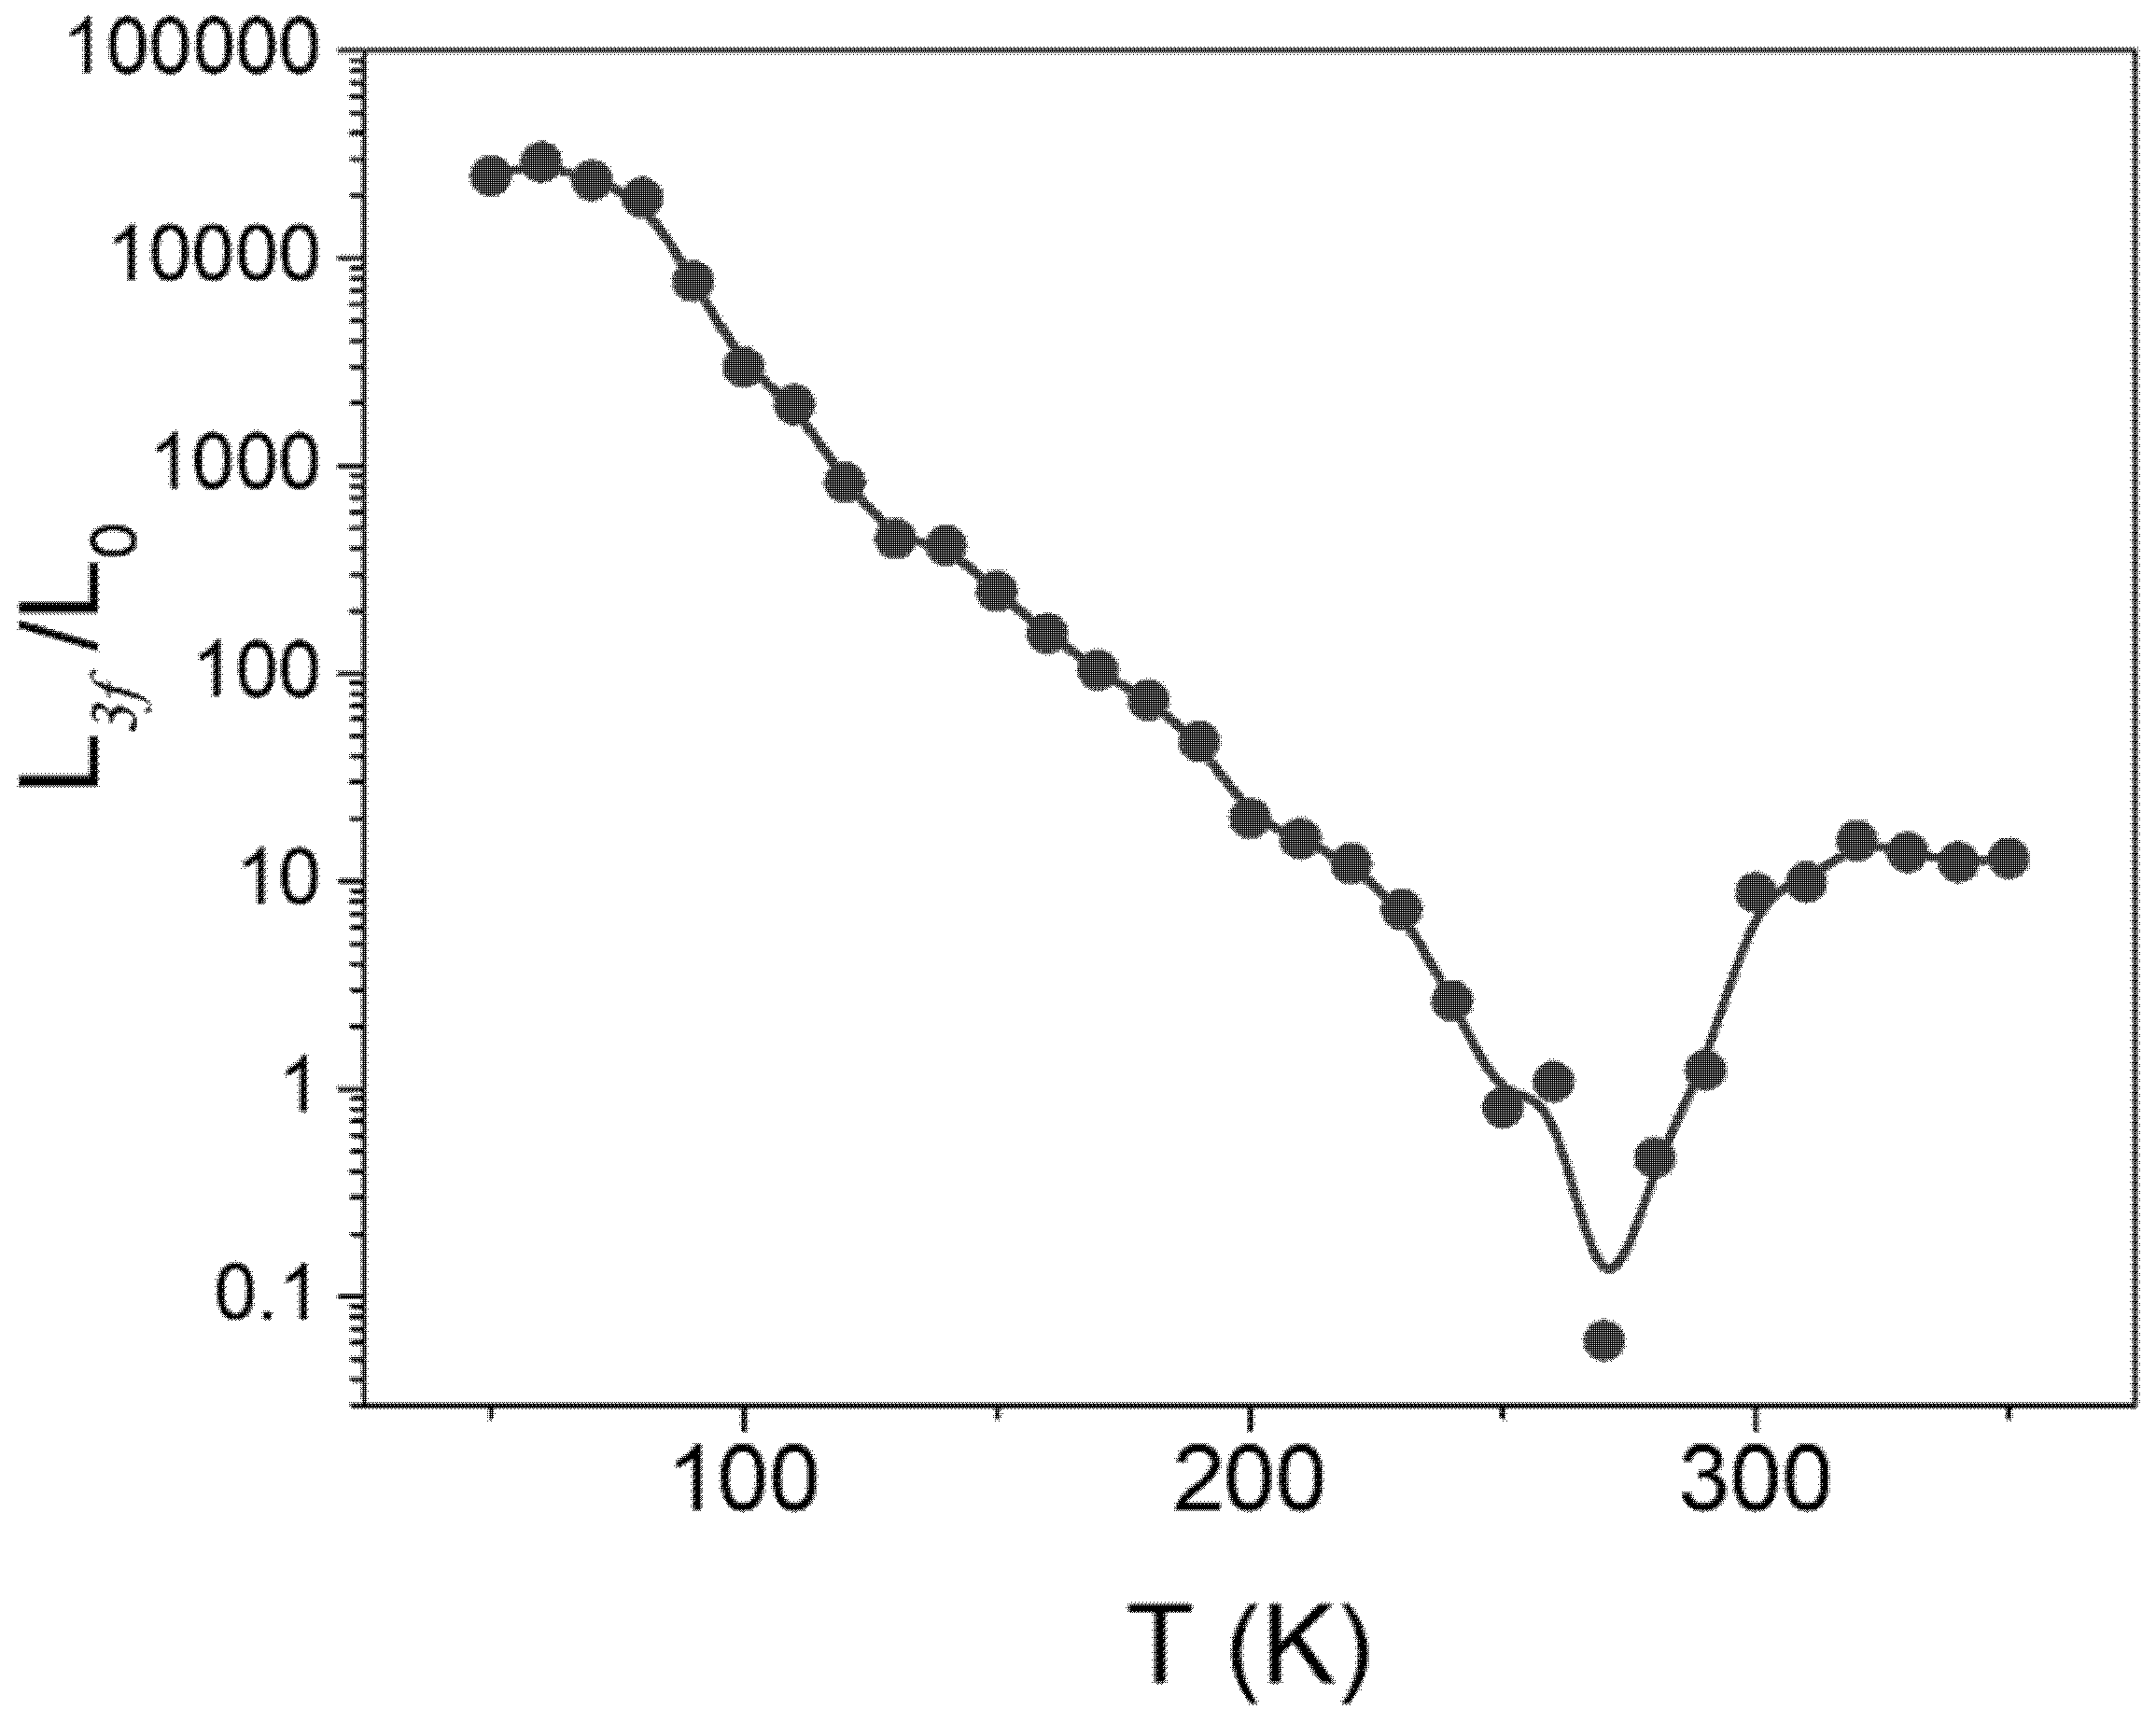
3.2. Characterization of Temperature-Dependent Lorenz Number

Since our 3ω method allows us to characterize thermal and electrical conductivity simultaneously as a function of temperature, we could also extract L3f and classify the electronic and phononic heat conduction. As stated above, this approach may not hold at temperatures below Tp because TaS3 is a semiconductor. This ratio is expected to provide a qualitative understanding of heat conduction by electrons only above room temperature. Figure 5 shows the ratio of L3f to L0, L3f/L0 obtained from the 3ω method. The curve of L3f/L0 below 200 K, at which TaS3 is a gapped semiconductor, changes remarkably. In addition, the ratio grows much larger than the unity, ranging from 10 to 10,000. In our measurements, the thermal conductivity in this temperature range results from lattice vibrations with a large value of L3f/L0, far above unity, as shown in Figure 5. In contrast to the low-temperature behavior, the curve of L3f/L0 above 300 K does not change remarkably. The metallic TaS3 maintains a ratio much larger than unity, approximately, L 3 f / L 0 = 12 and gradually increases with temperature. The material properties of TaS3 above and below Tp are compared in Table 1.
Our results contrast with previous studies from the perspective that most Wiedemann–Franz law violations show that L3f/L0 is slightly smaller than unity [35]. In addition, they observed violations at low temperatures [15]. Specifically, a large L3f/L0 exceeding 1000 is theoretically predicted for 1D metal wires exhibiting Luttinger liquid behavior [9,14]. TaS3 is a 1D metal near room temperature, as shown in Figure 1a. However, the Luttinger liquid behavior from TaS3 is expected to prevail below 100 K [5,36]. Therefore, the large violation of the Wiedemann–Franz law does not stem from the 1D electronic nature.
The collective heat transport of quasiparticles can explain another possibility for the breakdown of the Wiedemann–Franz law. Coupled lattice vibrations with charge density waves, referred to as phasons, are identified as another pathway for heat conduction in addition to electrons and phonons, respectively [8,12,37]. L3f/L0 in Figure 4a,b, indicate that the conventional heat carriers, phonons, and electrons in metal TaS3 provide only marginal contributions. CDW-phonon coupling is expected to dominate the thermal transport. Thus, the thermal conductivity should be expressed as κ t o t a l κ C D W p h . The CDW manifests itself strongly at low temperatures. However, when the temperature surpasses the transition temperature, the periodicity of CDW becomes weak. For instance, from an STM study conducted at room temperature, a weak sign of CDW was observed [25]. Furthermore, above Tp, the possibility of forming a pseudogap was proposed. For this reason, in our temperature range, we propose that the CDW is vivid and participating in heat conduction above Tp.

4. Conclusions

The flow of heat and charge in 1D structure contains exciting and exotic sciences compared with their bulk counterparts. For instance, the charge transport in a 1D wire exhibits a much stronger interaction, referred to as the Luttinger liquid. As a result, the charge and spin propagate independently. The thermal property in 1D, in the case of carbon nanotubes (CNTs), displays dimensional dependence. TaS3 is a 1D metal wire above Tp, which shows unprecedented heat transfer properties, as stated in this paper. In order to achieve significant advancement in the understanding of heat conduction in 1D electronic systems, more scrutiny is needed of the interaction between CDW and lattice vibrations, the alteration of the phonon band and dispersion, and the contribution of the quasiparticle to heat conduction.

Author Contributions

Conceptualization, validation, and supervision, S.C.L. and J.T.L.; methodology, H.Y. and J.B.; software, D.X.D. and S.K.; investigation, B.-w.A. and W.S.; resources, K.K.K. and J.K.; data curation, H.Y. and S.P.; writing—original draft preparation, H.Y. and S.C.L.; writing—review and editing, H.Y. and S.C.L. All authors have read and agreed to the published version of the manuscript.

Funding

This research was funded by the National Research Foundation (NRF) of the Republic of Korea, grant number NRF-2021R1A2C1011578 and the Ministry of Trade, Industry and Energy (MOTIE) in Korea, grant number 20013422.

Institutional Review Board Statement

Not applicable.

Informed Consent Statement

Not applicable.

Data Availability Statement

The data presented in the article will be shared on request by the corresponding author.

Conflicts of Interest

The authors declare no conflict of interest.

Nomenclature

SymbolDescriptionUnit
κ F Fermi wave vector1/m
q Momentum vector kg · m / s
ΣElectrical conductivityS/m
ωAngular frequencyrad/s
κ Thermal conductivity W mK
κ e Electron thermal conductivity W mK
κ p Phonon thermal conductivity W mK
κ 3 f 3 f thermal conductivity W mK
κ C D W p h CDW-phonon coupled thermal conductivity W mK
κ e W F Thermal conductivity from σ and Wiedemann–Franz law W mK
κ t o t a l Total thermal conductivity W mK
L 0 Theoretical Lorenz number 10 8   W K 2
L T E P Lorenz number from TEP 10 8   W K 2
L 3 f Lorenz number from 3 f 10 8   W K 2
f FrequencyHz
I 0 AC current (RMS)A
V 3 f 3f voltageV
RElectrical resistance
R′Slope from resistance-temperature curve K
ACross-sectional aream2
l Sample lengthm
γ Thermal wavelengthm
TTemperatureK
TpPeierls transition temperatureK
κ B Boltzmann constanteV/K
GElectrical conductanceS
D T Debye temperatureK
λ p Phonon mean free pathm
λ Electron mean free pathm
C v Specific heat capacityJ/g/K
v F Fermi velocitym/s
q Elementary electric chargeC
τ κ Scattering time of heat transports
τ σ Scattering time of charge transports
S Thermoelectric power μ V K
E F Fermi level energyeV

References

  1. Chaussy, J.; Haen, P.; Lasjaunias, J.C.; Monceau, P.; Waysand, G.; Waintal, A.; Meerschaut, A.; Molinie, P.; Rouxel, J. Phase transitions in NbSe3. Solid State Commun. 1976, 20, 759–763. [Google Scholar] [CrossRef]
  2. Sambongi, T.; Tsutsumi, K.; Shiozaki, Y.; Yamamoto, M.; Yamaya, K.; Abe, Y. Peierls transition in TaS3. Solid State Commun. 1977, 22, 729–731. [Google Scholar] [CrossRef]
  3. Rossnagel, K. On the origin of charge-density waves in select layered transition-metal dichalcogenides. J. Phys. Condens. Matter 2011, 23, 213001. [Google Scholar] [CrossRef]
  4. Kane, C.L.; Fisher, M.P.A. Thermal transport in a Luttinger liquid. Phys. Rev. Lett. 1996, 76, 3192. [Google Scholar] [CrossRef] [PubMed] [Green Version]
  5. Artemenko, S.N. Impurity-induced stabilization of Luttinger liquid in quasi-one-dimensional conductors. J. Exp. Theor. Phys. Lett. 2004, 79, 277–281. [Google Scholar] [CrossRef] [Green Version]
  6. Monteverde, M.; Lorenzana, J.; Monceau, P.; Nunez-Regueiro, M. Quantum critical point and superconducting dome in the pressure phase diagram of o-TaS 3. Phys. Rev. B 2013, 88, 180504. [Google Scholar] [CrossRef] [Green Version]
  7. Artyukhov, V.I.; Liu, M.; Yakobson, B.I. Mechanically induced metal–insulator transition in carbyne. Nano Lett. 2014, 14, 4224–4229. [Google Scholar] [CrossRef] [Green Version]
  8. Sugai, S.; Takayanagi, Y.; Hayamizu, N. Phason and amplitudon in the charge-density-wave phase of one-dimensional charge stripes in La2−xSrxCuO4. Phys. Rev. Lett. 2006, 96, 137003. [Google Scholar] [CrossRef] [PubMed]
  9. Garg, A.; Rasch, D.; Shimshoni, E.; Rosch, A. Large violation of the Wiedemann-Franz law in Luttinger liquids. Phys. Rev. Lett. 2009, 103, 096402. [Google Scholar] [CrossRef]
  10. Liu, G.; Debnath, B.; Pope, T.R.; Salguero, T.T.; Lake, R.K.; Balandin, A.A. A charge-density-wave oscillator based on an integrated tantalum disulfide–boron nitride–graphene device operating at room temperature. Nat. Nanotechnol. 2016, 11, 845–850. [Google Scholar] [CrossRef] [PubMed]
  11. Liu, H.; Yang, C.; Wei, B.; Jin, L.; Alatas, A.; Said, A.; Tongay, S.; Yang, F.; Javey, A.; Hong, J. Anomalously Suppressed Thermal Conduction by Electron-Phonon Coupling in Charge-Density-Wave Tantalum Disulfide. Adv. Sci. 2020, 7, 1902071. [Google Scholar] [CrossRef] [PubMed] [Green Version]
  12. Manley, M.E.; Stonaha, P.J.; Abernathy, D.L.; Chi, S.; Sahul, R.; Hermann, R.P.; Budai, J.D. Supersonic propagation of lattice energy by phasons in fresnoite. Nat. Commun. 2018, 9, 1–8. [Google Scholar] [CrossRef]
  13. Kittel, C.; McEuen, P.; McEuen, P. Introduction to Solid State Physics; Wiley: New York, NY, USA, 1996; Volume 8, p. 157. [Google Scholar]
  14. Wakeham, N.; Bangura, A.F.; Xu, X.; Mercure, J.-F.; Greenblatt, M.; Hussey, N.E. Gross violation of the Wiedemann–Franz law in a quasi-one-dimensional conductor. Nat. Commun. 2011, 2, 1–6. [Google Scholar] [CrossRef] [PubMed]
  15. Crossno, J.; Shi, J.K.; Wang, K.; Liu, X.; Harzheim, A.; Lucas, A.; Sachdev, S.; Kim, P.; Taniguchi, T.; Watanabe, K. Observation of the Dirac fluid and the breakdown of the Wiedemann-Franz law in graphene. Science 2016, 351, 1058–1061. [Google Scholar] [CrossRef] [PubMed] [Green Version]
  16. Ubaldini, A.; Giannini, E. Improved chemical vapor transport growth of transition metal dichalcogenides. J. Cryst. Growth 2014, 401, 878–882. [Google Scholar] [CrossRef] [Green Version]
  17. Wu, K.; Chen, B.; Cai, H.; Blei, M.; Bennett, J.; Yang, S.; Wright, D.; Shen, Y.; Tongay, S. Unusual Pressure Response of Vibrational Modes in Anisotropic TaS3. J. Phys. Chem. C 2017, 121, 28187–28193. [Google Scholar] [CrossRef]
  18. Lu, L.; Yi, W.; Zhang, D.J.R. 3ω method for specific heat and thermal conductivity measurements. Rev. Sci. Inst. 2001, 72, 2996–3003. [Google Scholar] [CrossRef] [Green Version]
  19. Yi, H.; Kim, J.Y.; Gul, H.Z.; Kang, S.; Kim, G.; Sim, E.; Ji, H.; Kim, J.; Choi, Y.C.; Kim, W.S. Wiedemann-Franz law of Cu-coated carbon fiber. Carbon 2020, 162, 339–345. [Google Scholar] [CrossRef]
  20. Zuev, Y.M.; Chang, W.; Kim, P. Thermoelectric and magnetothermoelectric transport measurements of graphene. Phys. Rev. Lett. 2009, 102, 096807. [Google Scholar] [CrossRef] [Green Version]
  21. Ghimire, M.K.; Gul, H.Z.; Yi, H.; Dang, D.X.; Sakong, W.K.; Van Luan, N.; Ji, H.J.; Lim, S.C. Graphene-CdSe quantum dot hybrid as a platform for the control of carrier temperature. FlatChem 2017, 6, 77–82. [Google Scholar] [CrossRef]
  22. Wang, Z.Z.; Salva, H.; Monceau, P.; Renard, M.; Roucau, C.; Ayroles, R.; Levy, F.; Guemas, L.; Meerschaut, A. Incommensurate-commensurate transition in TaS3. J. Phys. Lett. 1983, 44, 311–319. [Google Scholar] [CrossRef] [Green Version]
  23. Inagaki, K.; Tsubota, M.; Ichimura, K.; Tanda, S.; Yamamoto, K.; Hanasaki, N.; Nogami, Y.; Ikeda, N.; Ito, T.; Toyokawa, H. Synchrotron X-ray study of charge density waves in o-TaS3. J. Phys. 2009, 150, 042068. [Google Scholar] [CrossRef]
  24. Roucau, C. New results obtained by electron diffraction on the one-dimensional conductors TaS3 and NbS3. J. Phys. Colloq. 1983, 44, C3-1725. [Google Scholar] [CrossRef]
  25. Gammie, G.; Hubacek, J.S.; Skala, S.L.; Brockenbrough, R.T.; Tucker, J.R.; Lyding, J.W. Scanning tunneling microscopy of the charge-density wave in orthorhombic TaS 3. Phys. Rev. B 1989, 40, 11965. [Google Scholar] [CrossRef] [PubMed]
  26. Nasretdinova, V.F.; Zaitsev-Zotov, S.V. Electric-field-dependent energy structure of quasi-one-dimensional conductor p-TaS 3. JETP Lett. 2009, 89, 514–518. [Google Scholar] [CrossRef]
  27. Maeda, A.; Naito, M.; Tanaka, S. Nonlinear conductivity and broad band noise of monoclinic TaS3. J. Phys. Soc. Jpn. 1985, 54, 1912–1922. [Google Scholar] [CrossRef]
  28. Itkis, M.E.; Nad, F.Y.; Monceau, P. Nonlinear conductivity of quasi-one-dimensional TaS3 at low temperatures. J. Phys. Condens. Matter 1990, 2, 8327. [Google Scholar] [CrossRef]
  29. Starešinić, D.; Kiš, A.; Biljaković, K.; Emerling, B.; Brill, J.W.; Souletie, J.; Berger, H.; Lévy, F. Specific heats of the charge density wave compounds o-TaS and (TaSe) I. Eur. Phys. J. B Condens. Matter Complex Syst. 2002, 29, 71–77. [Google Scholar] [CrossRef]
  30. Yang, L.; Tao, Y.; Liu, J.; Liu, C.; Zhang, Q.; Akter, M.; Zhao, Y.; Xu, T.T.; Xu, Y.; Mao, Z. Distinct signatures of electron–phonon coupling observed in the lattice thermal conductivity of NbSe3 nanowires. Nano Lett. 2018, 19, 415–421. [Google Scholar] [CrossRef]
  31. Singleton, J. Band Theory and Electronic Properties of Solids; Oxford University Press: Oxford, UK, 2001; Volume 2. [Google Scholar]
  32. Kim, H.-S.; Gibbs, Z.M.; Tang, Y.; Wang, H.; Snyder, G.J. Characterization of Lorenz number with Seebeck coefficient measurement. APL Mater. 2015, 3, 041506. [Google Scholar] [CrossRef] [Green Version]
  33. Jonson, M.; Mahan, G.D. Mott’s formula for the thermopower and the Wiedemann-Franz law. Phys. Rev. B 1980, 21, 4223. [Google Scholar] [CrossRef]
  34. Thesberg, M.; Kosina, H.; Neophytou, N. On the Lorenz number of multiband materials. Phys. Rev. B 2017, 95, 125206. [Google Scholar] [CrossRef] [Green Version]
  35. Lee, S.; Hippalgaonkar, K.; Yang, F.; Hong, J.; Ko, C.; Suh, J.; Liu, K.; Wang, K.; Urban, J.J.; Zhang, X. Anomalously low electronic thermal conductivity in metallic vanadium dioxide. Science 2017, 355, 371–374. [Google Scholar] [CrossRef] [Green Version]
  36. Zaitsev-Zotov, S.V.; Pokrovskii, V.Y.; Monceau, P. Transition to 1D conduction with decreasing thickness of the crystals of TaS 3 and NbSe 3 quasi-1D conductors. J. Exp. Theor. Phys. Lett. 2001, 73, 25–27. [Google Scholar] [CrossRef]
  37. Smontara, A.; Biljaković, K.; Artemenko, S.; Lévy, F.; Berger, H. Phason contribution to the thermal conductivity of CDW systems. Synth. Met. 1993, 56, 2647–2652. [Google Scholar] [CrossRef]
Figure 1. (a) Optical image of TaS3 grown using chemical vapor transport (CVT); inset shows actual ampoule used for the synthesis of TaS3. (b) Secondary electron micrograph; inset shows zoom-in image of one of the TaS3 bundles. (c) X-ray diffraction, and (d) Raman spectroscopy of TaS3.
Materials 14 04477 g001
Figure 2. (a) Resistance–temperature curve, with an inset zoom-in chart of temperature range between 260 K and 350 K. (b) d l n ( R ) / d T vs .   T plot, (c) ln ( G ) vs .   1 / κ B T plot of TaS3 measured using four-point probe method.
Materials 14 04477 g002
Figure 3. (a) V3f-Irms curves as a function of temperature. (b) Resistance–temperature curves as a function of input current Irms.
Materials 14 04477 g003
Figure 4. (a) Thermal conductivity vs. temperature curve measured using 3ω method. (b) Thermal conductivity of TaS3 from 3ω method ( κ 3 f ) and electronic thermal conductivity of TaS3 from Wiedemann–Franz law ( κ e W F ). (c) Thermoelectric power as a function of temperature. Lower-left and upper-right insets show device image and zoom-in plot, respectively. Scale bar measures 20 µm. (d) Lorenz number obtained from TEP (LTEP) between 200 K and 350 K. Inset is LTEP from 80 K to 350 K.
Materials 14 04477 g004aMaterials 14 04477 g004b
Figure 5. L 3 f / L 0 vs. T in temperature range between 50 K and 350 K.
Materials 14 04477 g005
Table 1. Whole measurement results from single TaS3 fiber.
R
[Ω]
TCR
[×10−3/K]
κ 3 f
[ W / m K ]
κ e W F
[ W / m K ]
TEP
[ μ V / K ]
L 3 f / L 0
Metallic phase
(300 K)
246.375.536.680.867.848.80
CDW phase
(100 K)
8859.47−57.7621.067.16 × 10−3160.852991.68
Publisher’s Note: MDPI stays neutral with regard to jurisdictional claims in published maps and institutional affiliations.

