
Optimization of Mechanical Properties of Cr3C2-Ni20Cr/Graphite Cold Sprayed Coatings

 ,
,
Abstract
:1. Introduction
2. Experimental Details
2.1. Sample Preparation and Characterization
2.2. Taguchi Experiment
- (a).
- for “the larger, the better” features (e.g., Cr3C2 and graphite content in the coatings, hardness)S/N = −10log [(1/n) Σ(1/yi2)]
- (b).
- for “the smaller, the better” features (e.g., the coefficient of friction)where: yi—the tested output factor, n—number of measurements per experiment.S/N = −10log [(1/n) Σ(yi2)]
3. Results and Discussion
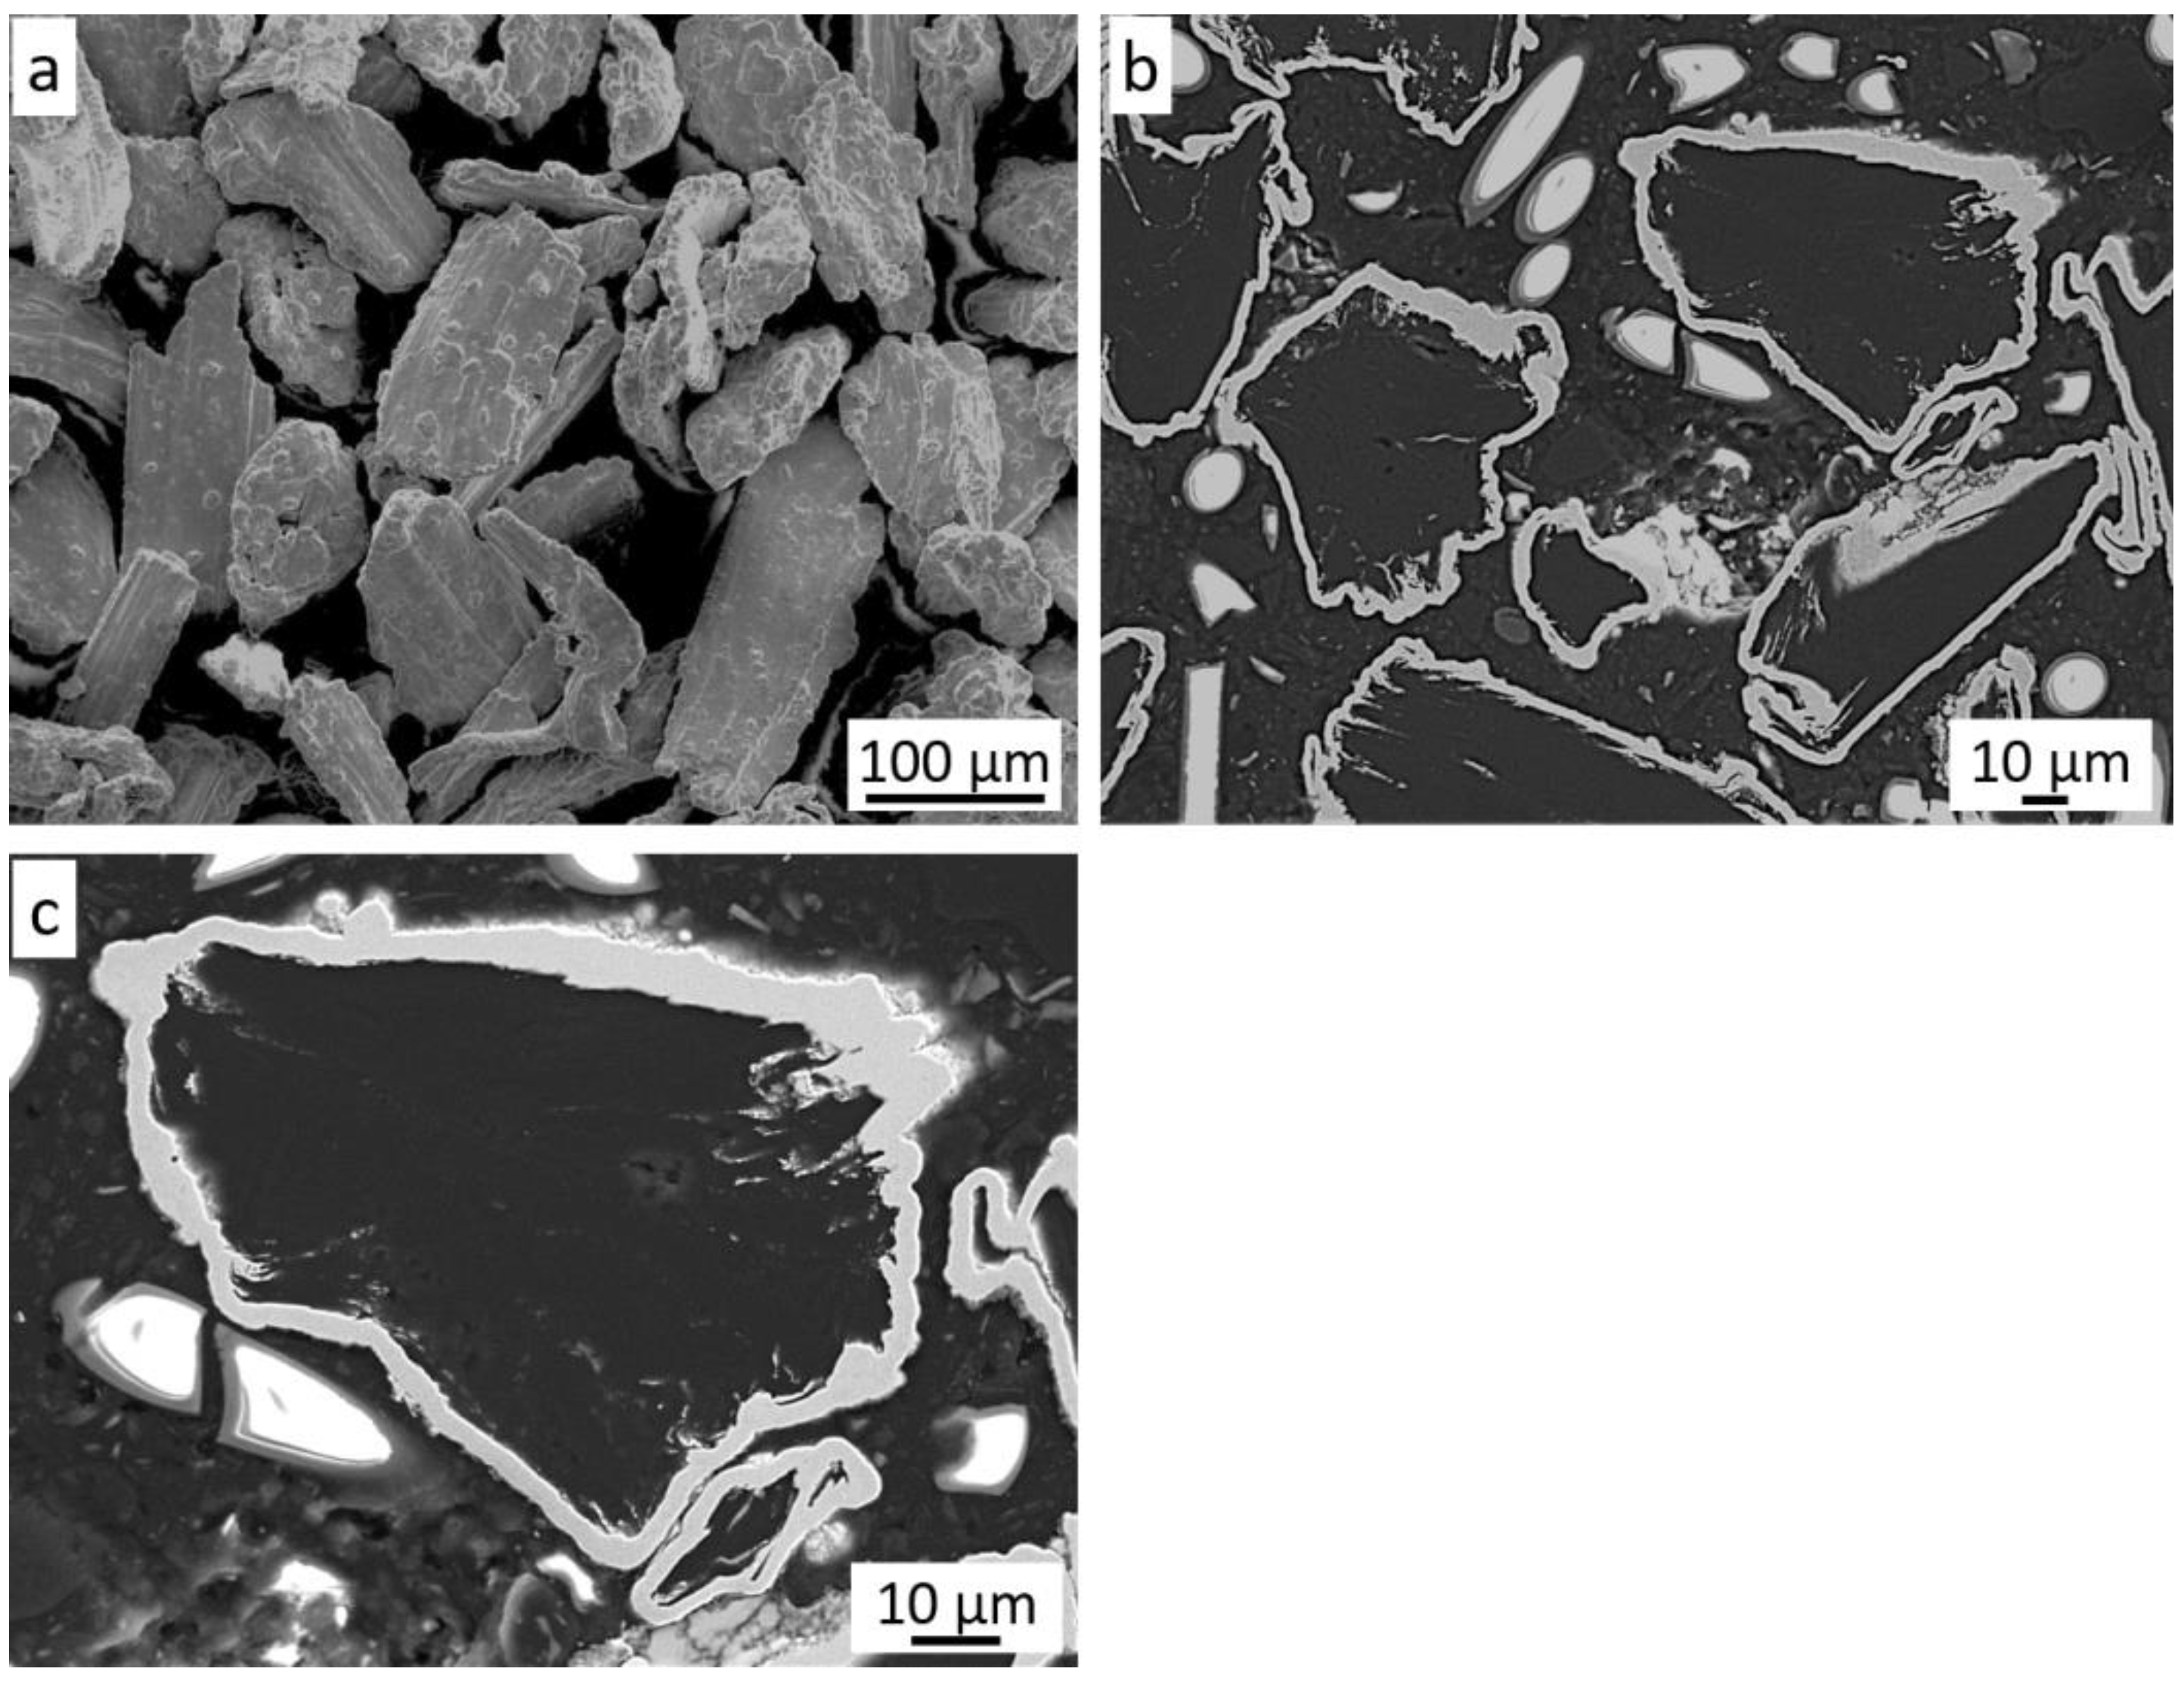
3.1. Powder Characterization
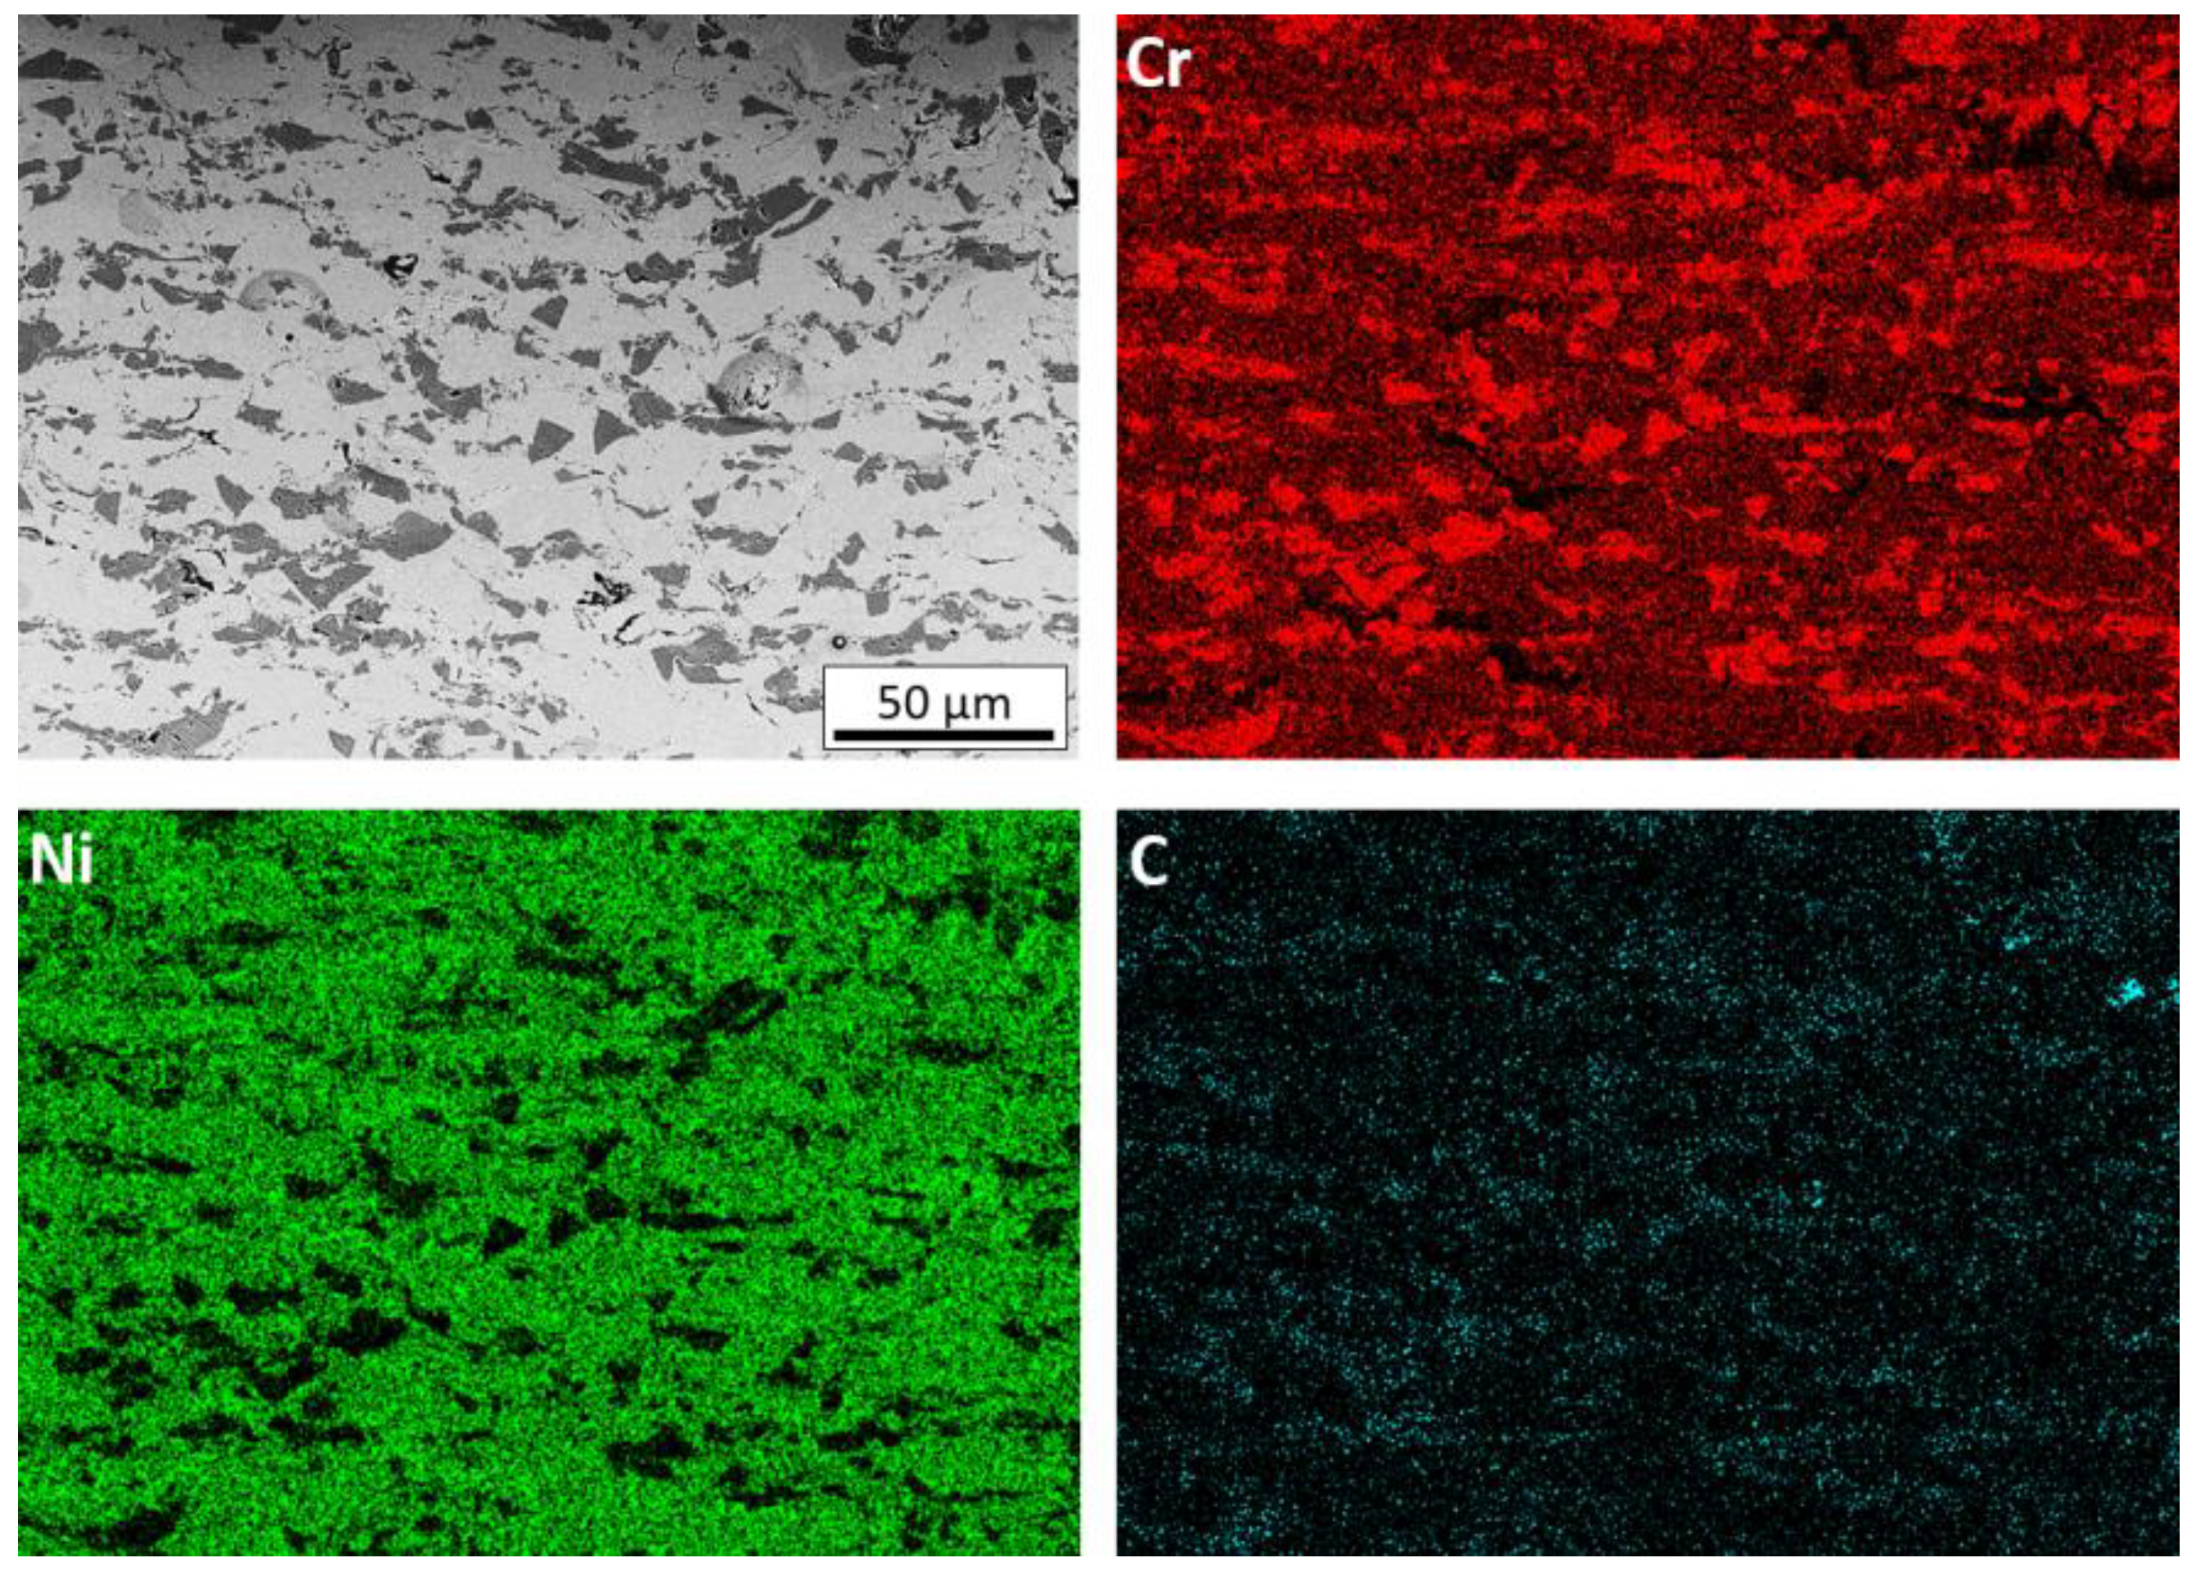
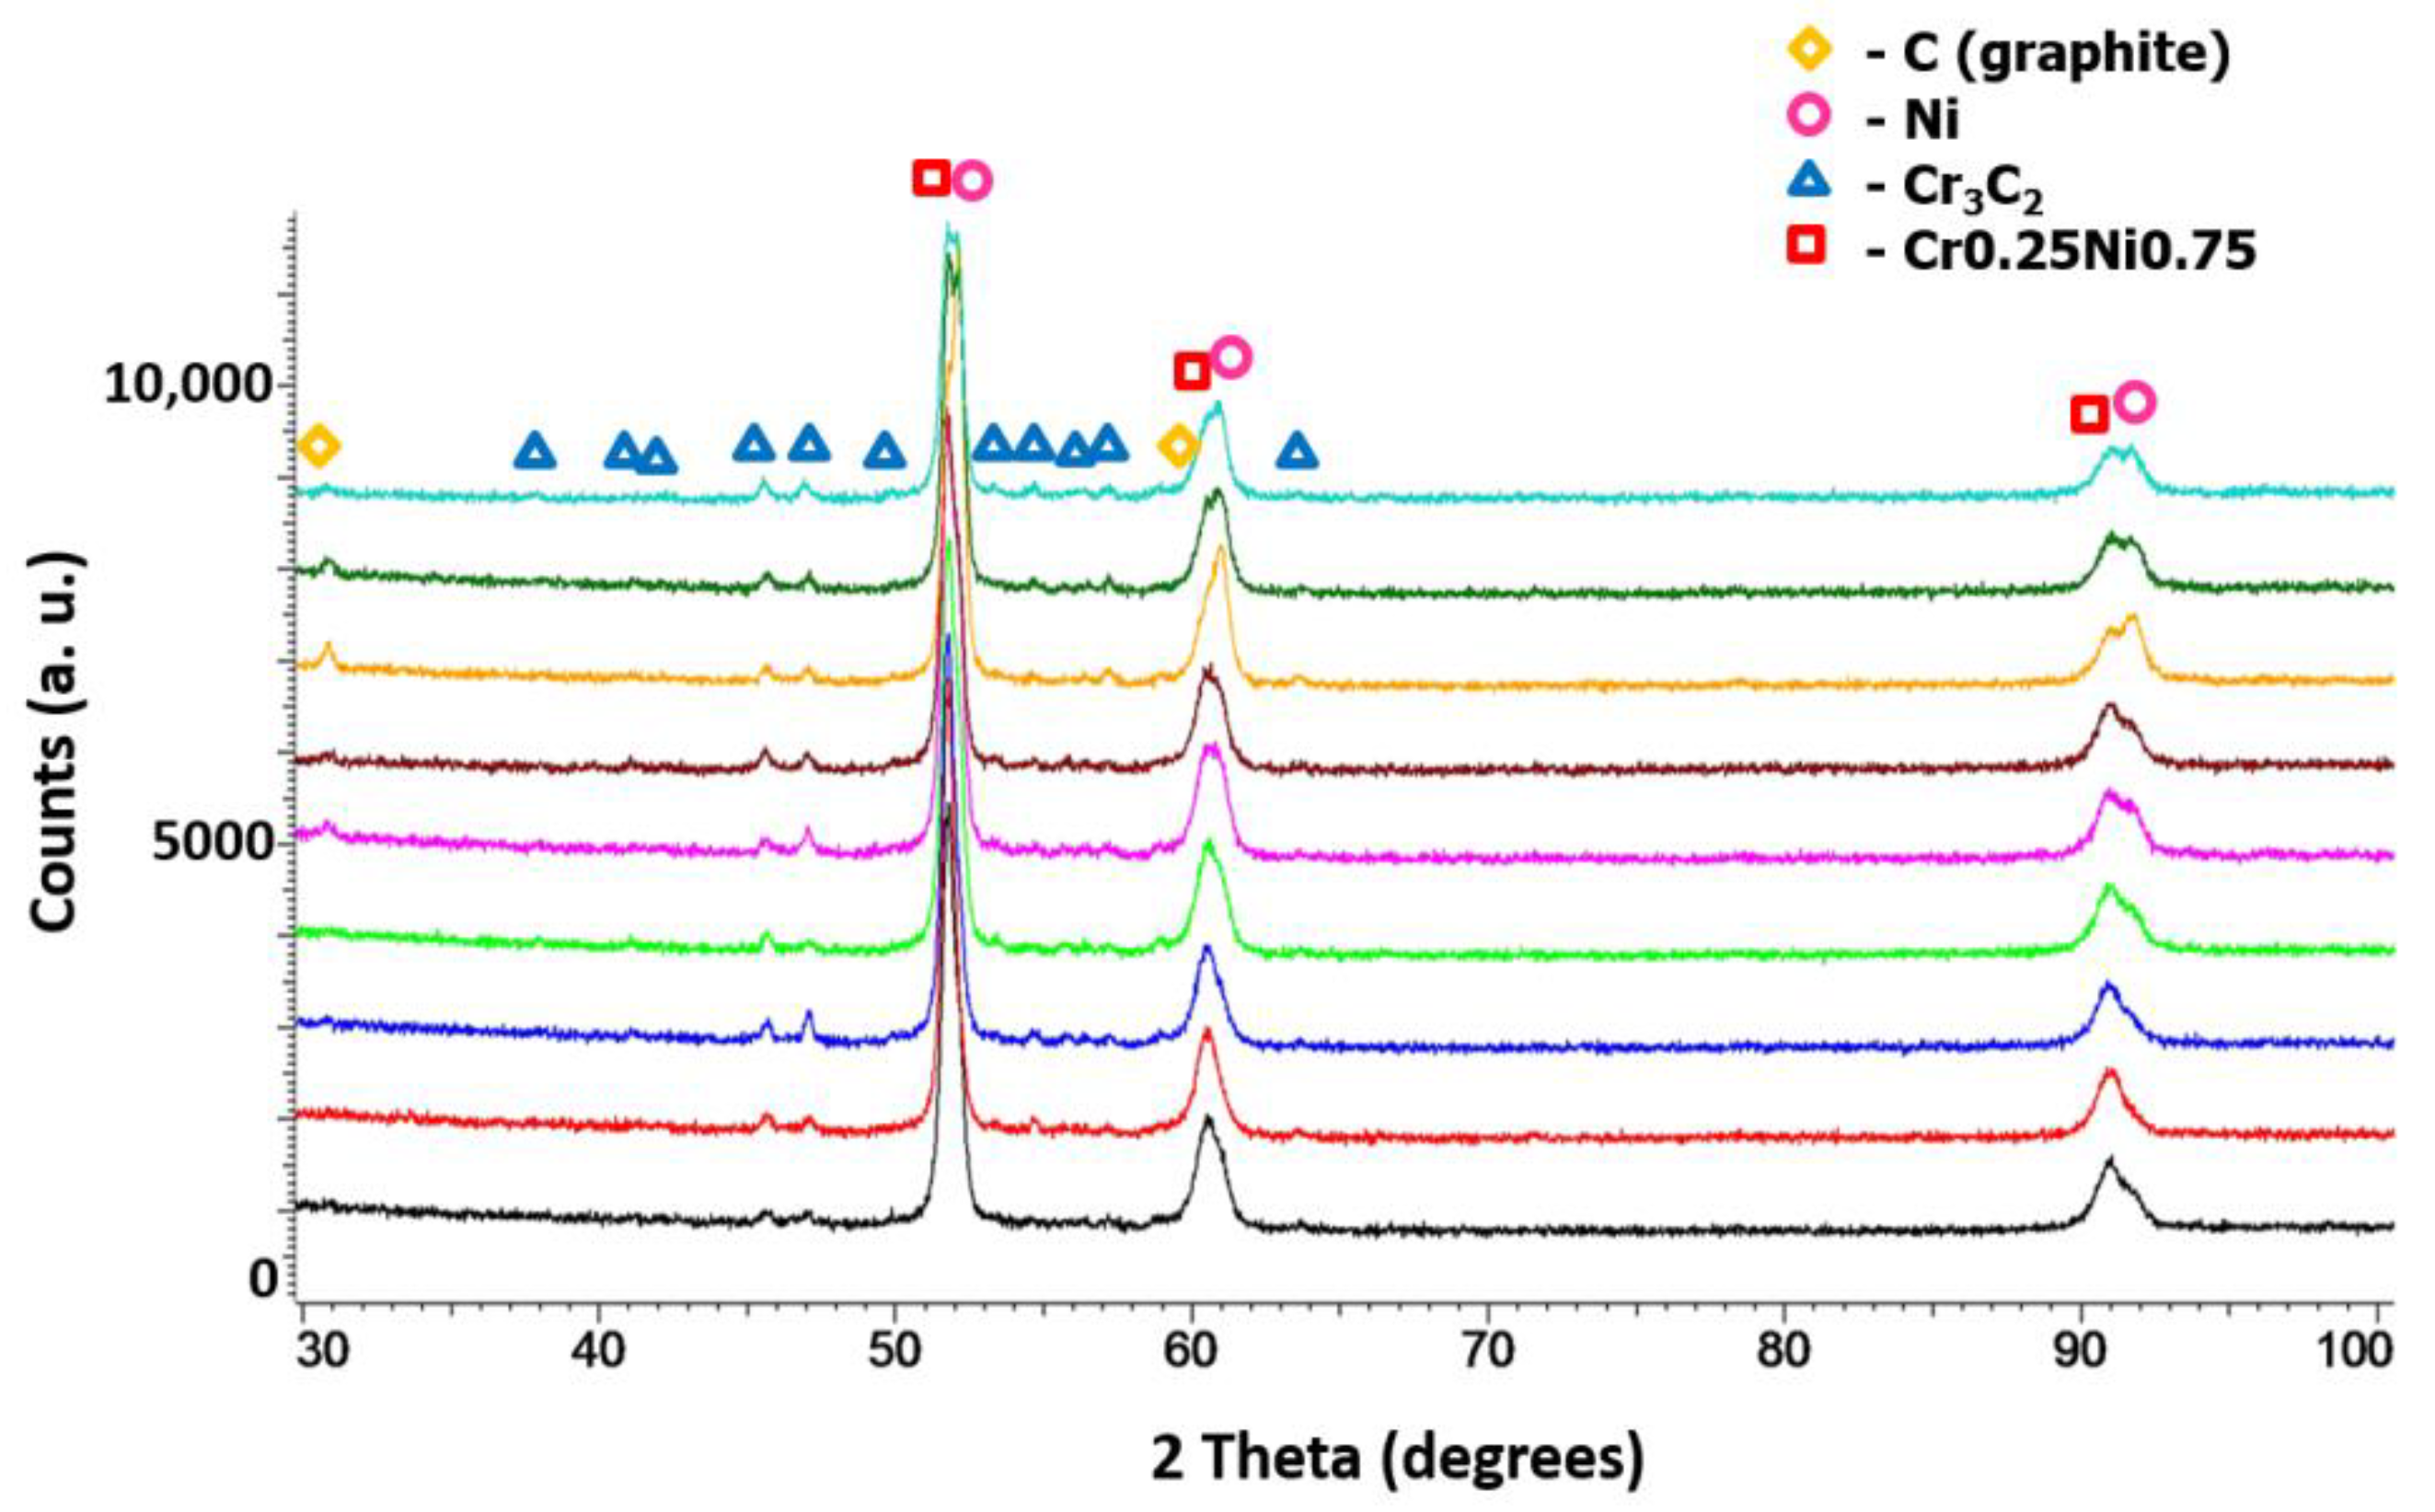
3.2. Characterization of Cold-Sprayed Coatings
3.3. Analysis of the Taguchi Experiment for Cr3C2 Content in the Coatings
3.4. Analysis of the Taguchi Experiment for Graphite Content in the Coatings
3.5. Analysis of the Taguchi Experiment for Hardness of Cr3C2-25(Ni20Cr)/Ni-25 Graphite Coatings
3.6. Analysis of the Taguchi Experiment for the Friction Coefficient of the Coatings
3.7. Verification Experiment
4. Conclusions
- The analysis of the microstructure of the coatings showed that graphite deposits in the high-pressure cold-spraying process, and it remains a component of the deposit and fills all the voids in it. Its content in the deposit is most significantly influenced by the graphite content in the sprayed blend. The highest graphite content in the coating, 5.89 vol.%, was obtained for the content of 15 wt.% Ni-graphite powder in the composite powder.
- Helium process gas has the highest impact on the Cr3C2 content in the coating and its use allowed for 29.22 ± 0.71 vol.% chromium carbide in the composite deposit.
- The graphite content in the sprayed mixture at the lowest level significantly influences the hardness of the coating. With the graphite content 1.21 ± 0.22 vol.% in the deposit, hardness reaches the highest value of 492.2 ± 41.9 HV0.3.
- The graphite content in the sprayed blend at a medium level—10.5 vol.%, the shortest spraying distance—39 mm, and a mixture of nitrogen—15.5 vol.% and helium—84.5 vol.% as the process gas have the greatest impact on the coefficient of friction. The cold-sprayed coating with the optimum averaged values of parameters revealed the highest hardness of 524.4 ± 42.68 HV0.3 and the lowest coefficient of friction of 0.488 ± 0.032.
Author Contributions
Funding
Institutional Review Board Statement
Informed Consent Statement
Data Availability Statement
Conflicts of Interest
References
- Pawlowski, L. The Science and Engineering of Thermal Spray Coatings, 2nd ed.; Wiley: Hoboken, NJ, USA, 2008. [Google Scholar]
- Fauchais, P.L.; Heberlein, J.V.R.; Boulos, M.I. Thermal Spray Fundamentals; Springer: Berlin/Heidelberg, Germany, 2014. [Google Scholar]
- Góral, A.; Litynska-Dobrzynska, L.; Zórawski, W.; Berent, K.; Wojewoda-Budka, J. Microstructure of Al2O3-13TiO2 Coatings Deposited from Nanoparticles by Plasma Spraying. Arch. Metall. Mater. 2013, 58, 335–339. [Google Scholar] [CrossRef]
- Papyrin, A. Cold Spraying; Elsevier Ltd.: Amsterdam, The Netherlands, 2007. [Google Scholar]
- Assadi, H.; Kreye, H.; Gärtner, F.; Klassen, T. Cold spraying—A materials perspective. Acta Mater. 2016, 116, 382–407. [Google Scholar] [CrossRef] [Green Version]
- Raoelison, R.N.; Verdy, C.; Liao, H. Cold gas dynamic spray additive manufacturing today: Deposit possibilities, technological solutions and viable applications. Mater. Des. 2017, 133, 266–287. [Google Scholar] [CrossRef]
- Zhang, Y.; Epshteyn, Y.; Chromik, R.R. Dry sliding wear behaviour of cold-sprayed Cu-MoS2 and Cu-MoS2-WC composite coatings: The influence of WC. Tribol. Int. 2018, 123, 296–306. [Google Scholar] [CrossRef]
- Cao, J.; Huang, H.; Li, S.; Wu, X.; Yin, Z.; Abbas, Z. Tribological and mechanical behaviors of engine bearing with CuSn10 layer and h-BN/graphite coating prepared by spraying under different temperatures. Tribol. Int. 2020, 152, 106445. [Google Scholar] [CrossRef]
- Chen, J.; Song, H.; Liu, G.; Ma, B.; An, Y.; Jia, L. Cold Spraying: A New Alternative Preparation Method for Nickel-Based High-Temperature Solid-Lubrication Coating. J. Therm. Spray Technol. 2020, 29, 1892–1901. [Google Scholar] [CrossRef]
- Tang, J.; Liu, K.; Yang, Q.; Wang, Y.; Zhang, P.; Zhao, L.; Fu, Q.; Han, Z.; Bai, Y. The influence of size and distribution of graphite on the friction and wear behavior of Ni–graphite coatings. Surf. Coat. Technol. 2014, 252, 48–55. [Google Scholar] [CrossRef]
- Marcinauskas, L.; Mathew, J.S.; Milieška, M.; Thanigachalam, B.; Kupec, A.; Česnavičius, R.; Kėželis, R.; Kalin, M. Microstructure and tribological properties of plasma sprayed alumina and alumina-graphite coatings. Surf. Coat. Technol. 2018, 350, 401–409. [Google Scholar] [CrossRef]
- Chen, Z.; Li, H.; Ren, L.; Li, Y.; Liu, C. Effect of Tungsten Carbide Addition on the Wear Resistance of Flame-Sprayed Self-Lubricating Ni-Graphite Coatings. J. Mater. Eng. Perform. 2020, 29, 1156–1164. [Google Scholar] [CrossRef]
- Zhang, X.-F.; Zhang, X.-L.; Wang, A.-H.; Huang, Z.-W. Microstructure and properties of HVOF sprayed Ni-based submicron WS2/CaF2 self-lubricating composite coating. Trans. Nonferrous Met. Soc. China 2009, 19, 85–92. [Google Scholar] [CrossRef]
- Grigoriev, S.; Okunkova, A.; Sova, A.; Bertrand, P.; Smurov, I. Cold spraying: From process fundamentals towards advanced applications. Surf. Coat. Technol. 2015, 268, 77–84. [Google Scholar] [CrossRef]
- Chen, W.; Yu, Y.; Ma, J.; Zhu, S.; Liu, W.; Yang, J. Low-Pressure Cold Spraying of Copper–Graphite Solid Lubricating Coatings on Aluminum Alloy 7075-T651. J. Therm. Spray Technol. 2019, 28, 1688–1698. [Google Scholar] [CrossRef]
- Huang, C.; Li, W.; Xie, Y.; Planche, M.-P.; Liao, H.; Montavon, G. Effect of Substrate Type on Deposition Behavior and Wear Performance of Ni-Coated Graphite/Al Composite Coatings Deposited by Cold Spraying. J. Mater. Sci. Technol. 2017, 33, 338–346. [Google Scholar] [CrossRef]
- Huang, C.; Li, W.; Planche, M.-P.; Liao, H.; Montavon, G. In-Situ formation of Ni-Al intermetallics-coated graphite/Al composite in a cold-sprayed coating and its high temperature tribological behaviors. J. Mater. Sci. Technol. 2017, 33, 507–515. [Google Scholar] [CrossRef]
- Pierlot, C.; Pawlowski, L.; Bigan, M.; Chagnon, P. Design of experiments in thermal spraying: A review. Surf. Coat. Technol. 2008, 202, 4483–4490. [Google Scholar] [CrossRef]
- Taguchi, G.; Chowdhury, S.; Wu, Y. Taguchi’s Quality Engineering Handbook; Wiley: Hoboken, NJ, USA, 2004. [Google Scholar]
- Chohan, J.S.; Kumar, R.; Singh, T.H.B.; Singh, S.; Sharma, S.; Singh, J.; Mia, M.; Pimenov, D.Y.; Chattopadhyaya, S.; Dwivedi, S.P.; et al. Taguchi S/N and TOPSIS Based Optimization of Fused Deposition Modelling and Vapor Finishing Process for Manufacturing of ABS Plastic Parts. Materials 2020, 13, 5176. [Google Scholar] [CrossRef] [PubMed]
- Raza, Z.A.; Anwar, F. Fabrication of chitosan nanoparticles and multi-response optimization in their application on cotton fabric by using a Taguchi approach. Nano Struct. Nano Objects 2017, 10, 80–90. [Google Scholar] [CrossRef]
- Winnicki, M.; Małachowska, A.; Ambroziak, A. Taguchi optimization of the thickness of a coating deposited by LPCS. Arch. Civ. Mech. Eng. 2014, 14, 561–568. [Google Scholar] [CrossRef]
- Sienicki, J.; Zórawski, W.; Dworak, A.; Koruba, P.; Jurewicz, P.; Reiner, J. Cold spraying and laser cladding as an alternative to electroplating processes. Aircr. Eng. Aerosp. Technol. 2019, 91, 205–215. [Google Scholar] [CrossRef]
- Goyal, T.; Walia, R.S.; Sidhu, T.S. Taguchi and utility based concept for determining optimal process parameters of cold sprayed coatings for multiple responses. Int. J. Interact. Des. Manuf. 2017, 11, 761–769. [Google Scholar] [CrossRef]
- Żórawski, W.; Skrzypek, S.; Trpčevska, J. Tribological properties of hypersonically sprayed carbide coatings. FME Trans. 2008, 36, 81–86. [Google Scholar]
- Da Cunha, C.A.; Correa, O.V.; Sayeg, I.J.; Ramanathan, L.V. High Temperature Erosion-oxidation Resistance of Thermally Sprayed Nanostructured Cr3C2-25(Ni-20Cr) Coatings. Mater. Res. 2017, 20, 994–1002. [Google Scholar] [CrossRef] [Green Version]
- Vashishtha, N.; Khatirkar, R.; Sapate, S. Tribological behaviour of HVOF sprayed WC-12Co, WC-10Co-4Cr and Cr3C2−25NiCr coatings. Tribol. Int. 2017, 105, 55–68. [Google Scholar] [CrossRef]
- Wolfe, D.E.; Eden, T.J.; Potter, J.K.; Jaroh, A.P. Investigation and Characterization of Cr3C2-Based Wear-Resistant Coatings Applied by the Cold Spray Process. J. Therm. Spray Technol. 2006, 15, 400–412. [Google Scholar] [CrossRef]
- Fernandez, R.; Jodoin, B. Effect of Particle Morphology on Cold Spray Deposition of Chromium Carbide-Nickel Chromium Cermet Powders. J. Therm. Spray Technol. 2017, 26, 1356–1380. [Google Scholar] [CrossRef]
- Góral, A.; Żórawski, W.; Makrenek, M. The effect of the standoff distance on the microstructure and mechanical properties of cold sprayed Cr3C2-25(Ni20Cr) coatings. Surf. Coat. Technol. 2019, 361, 9–18. [Google Scholar] [CrossRef]
- Trelka, A.; Żórawski, W.; Góral, A. Microstructure and Property Modification of Cold Sprayed Coatings Using Different Grain Sizes of Cr3C2-25(Ni20Cr) Composite Powder. Stroj. Vestn. J. Mech. Eng. 2020, 66, 494–504. [Google Scholar] [CrossRef]
- Chen, W.; Yu, Y.; Cheng, J.; Wang, S.; Zhu, S.; Liu, W.; Yang, J. Microstructure, Mechanical Properties and Dry Sliding Wear Behavior of Cu-Al2O3-Graphite Solid-Lubricating Coatings Deposited by Low-Pressure Cold Spraying. J. Therm. Spray Technol. 2018, 27, 1652–1663. [Google Scholar] [CrossRef]
- Ling, H.; Mai, Y.; Li, S.; Zhang, L.; Liu, C.; Jie, X. Microstructure and improved tribological performance of graphite/copper-zinc composite coatings fabricated by low pressure cold spraying. Surf. Coat. Technol. 2019, 364, 256–264. [Google Scholar] [CrossRef]
- Pattison, J.; Celotto, S.; Khan, A.; O’Neill, W. Standoff distance and bow shock phenomena in the Cold Spray process. Surf. Coat. Technol. 2008, 202, 1443–1454. [Google Scholar] [CrossRef]
- Sova, A.; Maestracci, R.; Jeandin, M.; Bertrand, P.; Smurov, I. Kinetics of composite coating formation process in cold spray: Modelling and experimental validation. Surf. Coat. Technol. 2017, 318, 309–314. [Google Scholar] [CrossRef]
- Rokni, M.R.; Nutt, S.R.; Widener, C.A.; Champagne, V.K.; Hrabe, R.H. Review of Relationship Between Particle Deformation, Coating Microstructure, and Properties in High-Pressure Cold Spray. J. Therm. Spray Technol. 2017, 26, 1308–1355. [Google Scholar] [CrossRef]
- Stepien, A.; Leśniak, M.; Sitarz, M. A Sustainable Autoclaved Material Made of Glass Sand. Buildings 2019, 9, 232. [Google Scholar] [CrossRef] [Green Version]
- Sova, A.; Kosarev, V.F.; Papyrin, A.; Smurov, I. Effect of Ceramic Particle Velocity on Cold Spray Deposition of Metal-Ceramic Coatings. J. Therm. Spray Technol. 2010, 20, 285–291. [Google Scholar] [CrossRef]
- He, L.; Hassani, M. A Review of the Mechanical and Tribological Behavior of Cold Spray Metal Matrix Composites. J. Therm. Spray Technol. 2020, 29, 1–44. [Google Scholar] [CrossRef]
- Zhang, Y.; Chromik, R.R. Tribology of Self-Lubricating Metal Matrix Composites. In Self-Lubricating Composites; Springer: Berlin/Heidelberg, Germany, 2018; pp. 33–73. [Google Scholar]


| Level | Tested Parameter | |||
|---|---|---|---|---|
| Ni-Graphite Powder in the Blend, wt.% (A) | Gas Composition (B) | Spraying Distance, mm (C) | Traverse Speed of the Gun, mm/s (D) | |
| 1 | 5 | N2 | 20 | 200 |
| 2 | 10 | N2 + He | 30 | 300 |
| 3 | 15 | He | 40 | 400 |
| Experiment | A | B | C | D |
|---|---|---|---|---|
| 1 | 1 | 1 | 1 | 1 |
| 2 | 1 | 2 | 2 | 2 |
| 3 | 1 | 3 | 3 | 3 |
| 4 | 2 | 1 | 2 | 3 |
| 5 | 2 | 2 | 3 | 1 |
| 6 | 2 | 3 | 1 | 2 |
| 7 | 3 | 1 | 3 | 2 |
| 8 | 3 | 2 | 1 | 3 |
| 9 | 3 | 3 | 2 | 1 |
| Experiment No. | Cr3C2, vol.% | S/N for Cr3C2 |
|---|---|---|
| 1 | 22.83 ± 0.58 | 27.171 |
| 2 | 24.99 ± 0.57 | 27.956 |
| 3 | 29.22 ± 0.71 | 29.314 |
| 4 | 23.36 ± 0.59 | 27.371 |
| 5 | 24.54 ± 0.75 | 27.796 |
| 6 | 27.93 ± 0.53 | 28.920 |
| 7 | 23.37 ± 1.12 | 27.373 |
| 8 | 25.22 ± 1.73 | 28.372 |
| 9 | 27.96 ± 1.58 | 28.930 |
| Parameter | Mean S/N Ratio | |||
|---|---|---|---|---|
| Level 1 | Level 2 | Level 3 | ΔM | |
| A | 28.15 | 28.03 | 28.23 | 0.20 |
| B | 27.31 | 28.04 | 29.05 | 1.74 |
| C | 28.15 | 28.09 | 28.16 | 0.08 |
| D | 27.97 | 28.08 | 28.35 | 0.39 |
| Parameter | SS | DOF | V | F-Ratio | P, % |
|---|---|---|---|---|---|
| A | 0.0585 | 2 | 0.0293 | 5.5686 | 1.2 |
| B | 4.6292 | 2 | 2.3146 | 440.2972 | 93.8 |
| C | 0.0105 | 2 | 0.0053 | 7.8535 | 0.2 |
| D | 0.2361 | 2 | 0.1181 | 22.4590 | 4.8 |
| Error | 0.0105 | 2 | |||
| Total | 4.9448 | 10 |
| Experiment No. | Graphite, vol.% | S/N for Graphite |
|---|---|---|
| 1 | 1.10 ± 0.31 | 0.796 |
| 2 | 1.21 ± 0.22 | 1.662 |
| 3 | 1.36 ± 0.29 | 2.696 |
| 4 | 2.25 ± 0.57 | 7.039 |
| 5 | 3.25 ± 0.57 | 10.226 |
| 6 | 1.64 ± 0.78 | 4.302 |
| 7 | 5.84 ± 1.69 | 15.308 |
| 8 | 5.22 ± 2.23 | 14.358 |
| 9 | 5.89 ± 0.88 | 15.408 |
| Parameter | Mean S/N Ratio | |||
|---|---|---|---|---|
| Level 1 | Level 2 | Level 3 | ΔM | |
| A | 1.72 | 7.19 | 15.03 | 13.31 |
| B | 7.71 | 8.75 | 7.47 | 1.28 |
| C | 6.49 | 8.04 | 9.41 | 2.93 |
| D | 8.03 | 7.09 | 8.03 | 0.94 |
| Parameter | SS | DOF | V | F-Ratio | P, % |
|---|---|---|---|---|---|
| A | 268.3977 | 2 | 134.1989 | 20.88649 | 93.0 |
| B | 2.7704 | 2 | 1.3852 | 0.21559 | 1.0 |
| C | 12.8503 | 2 | 6.4252 | 0.29576 | 4.5 |
| D | 4.4462 | 2 | 2.2231 | 0.34600 | 1.5 |
| Error | 12.8503 | 2 | 6.4252 | ||
| Total | 301.3149 | 10 |
| Experiment No. | HV0.3 | S/N for HV0.3 |
|---|---|---|
| 1 | 477.4 ± 42.1 | 53.013 |
| 2 | 492.2 ± 41.9 | 53.842 |
| 3 | 477.6 ± 16.0 | 53.581 |
| 4 | 428.2 ± 33.3 | 52.632 |
| 5 | 440.0 ± 28.8 | 52.869 |
| 6 | 489.8 ± 37.0 | 53.800 |
| 7 | 334.4 ± 31.7 | 50.485 |
| 8 | 362.8 ± 43.3 | 51.193 |
| 9 | 356.8 ± 85.7 | 51.048 |
| Parameter | Mean S/N Ratio | |||
|---|---|---|---|---|
| Level 1 | Level 2 | Level 3 | ΔM | |
| A | 53.48 | 53.10 | 50.91 | 2.57 |
| B | 52.04 | 52.64 | 52.81 | 0.77 |
| C | 52.67 | 52.51 | 52.31 | 0.36 |
| D | 52.31 | 52.71 | 52.47 | 0.40 |
| Parameter | SS | DOF | V | F-Ratio | P, % |
|---|---|---|---|---|---|
| A | 11.5534 | 2 | 5.7767 | 60.13098 | 89.2 |
| B | 0.9667 | 2 | 0.4834 | 5.03112 | 7.5 |
| C | 0.1921 | 2 | 0.0961 | 1.13495 | 1.5 |
| D | 0.2422 | 2 | 0.1211 | 1.26034 | 1.9 |
| Error | 0.1921 | 2 | |||
| Total | 13.1465 | 10 |
| Experiment No. | Coefficient of Friction | S/N for Coefficient of Friction |
|---|---|---|
| 1 | 0.506 ± 0.006 | 5.917 |
| 2 | 0.502 ± 0.019 | 5.987 |
| 3 | 0.513 ± 0.004 | 5.798 |
| 4 | 0.582 ± 0.072 | 4.702 |
| 5 | 0.585 ± 0.039 | 4.657 |
| 6 | 0.499 ± 0.052 | 6.038 |
| 7 | 0.556 ± 0.016 | 5.099 |
| 8 | 0.509 ± 0.008 | 5.866 |
| 9 | 0.506 ± 0.005 | 5.917 |
| Parameter | Mean S/N Ratio | |||
|---|---|---|---|---|
| Level 1 | Level 2 | Level 3 | ΔM | |
| A | 5.90 | 5.13 | 5.63 | 0.77 |
| B | 5.24 | 5.50 | 5.92 | 0.68 |
| C | 5.94 | 5.53 | 5.18 | 0.76 |
| D | 5.50 | 5.71 | 5.45 | 0.25 |
| Parameter | SS | DOF | V | F-Ratio | P, % |
|---|---|---|---|---|---|
| A | 11.5534 | 2 | 5.7767 | 60.13098 | 89.2 |
| B | 0.9667 | 2 | 0.4834 | 5.03112 | 7.5 |
| C | 0.1921 | 2 | 0.0961 | 1.13495 | 1.5 |
| D | 0.2422 | 2 | 0.1211 | 1.26034 | 1.9 |
| Error | 0.1921 | 2 | |||
| Total | 13.1465 | 10 |
Publisher’s Note: MDPI stays neutral with regard to jurisdictional claims in published maps and institutional affiliations. |
© 2021 by the authors. Licensee MDPI, Basel, Switzerland. This article is an open access article distributed under the terms and conditions of the Creative Commons Attribution (CC BY) license (https://creativecommons.org/licenses/by/4.0/).
Share and Cite
Żórawski, W.; Góral, A.; Makrenek, M.; Soboń, D.; Trelka, A.; Bara, M. Optimization of Mechanical Properties of Cr3C2-Ni20Cr/Graphite Cold Sprayed Coatings. Materials 2021, 14, 3458. https://doi.org/10.3390/ma14133458
Żórawski W, Góral A, Makrenek M, Soboń D, Trelka A, Bara M. Optimization of Mechanical Properties of Cr3C2-Ni20Cr/Graphite Cold Sprayed Coatings. Materials. 2021; 14(13):3458. https://doi.org/10.3390/ma14133458
Chicago/Turabian StyleŻórawski, Wojciech, Anna Góral, Medard Makrenek, Dominika Soboń, Anna Trelka, and Marek Bara. 2021. "Optimization of Mechanical Properties of Cr3C2-Ni20Cr/Graphite Cold Sprayed Coatings" Materials 14, no. 13: 3458. https://doi.org/10.3390/ma14133458