
Properties and Hydration Mechanism of Soda Residue-Activated Ground Granulated Blast Furnace Slag Cementitious Materials


Abstract
:1. Introduction
2. Materials and Methods
2.1. Materials
2.2. Preparation of Specimens
2.3. Testing and Characterization
2.3.1. Chemical Compositions
2.3.2. Density, Water Absorption and Porosity
2.3.3. Compressive and Flexural Strength
2.3.4. Phase Evolution
2.3.5. Dissolution of Chloride Ion
3. Results and Discussion
3.1. Physical Properties of the Pastes
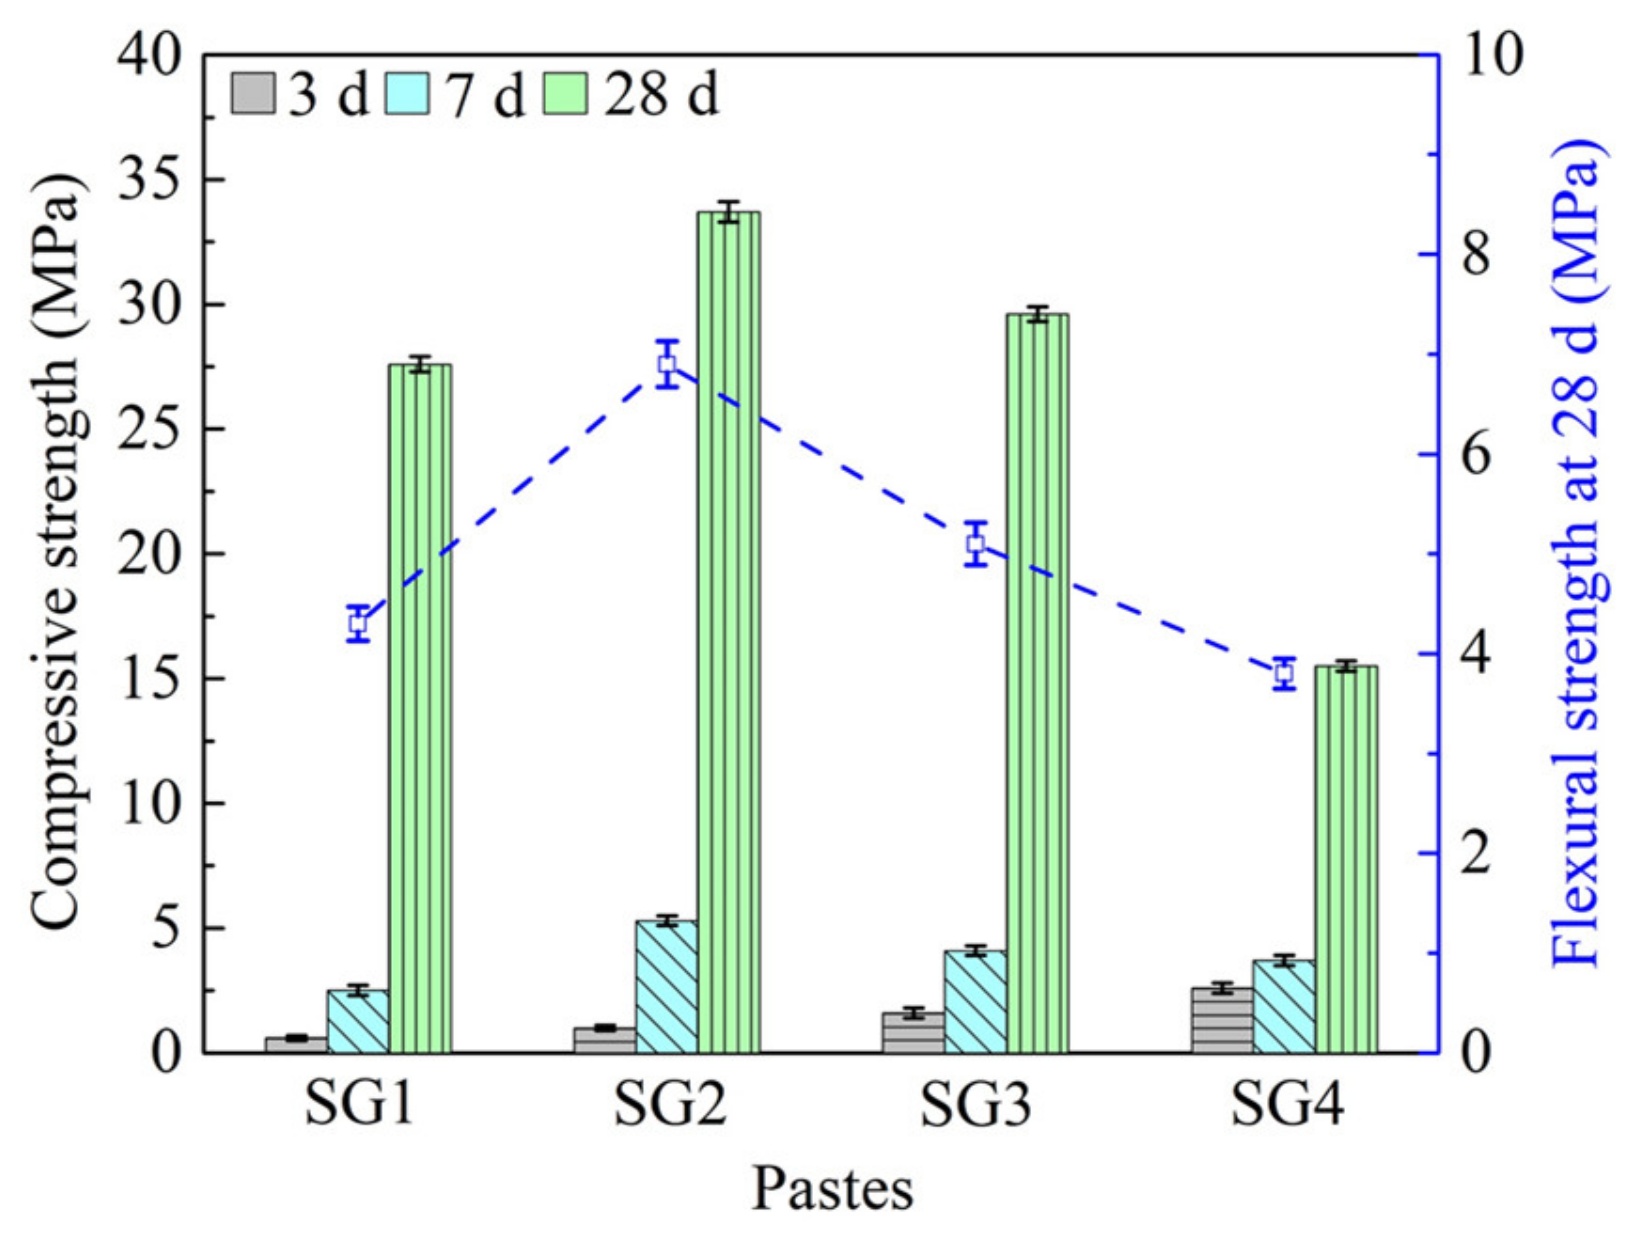
3.2. Mechanical Properties of the Pastes
3.3. Characterization of Hydration Products
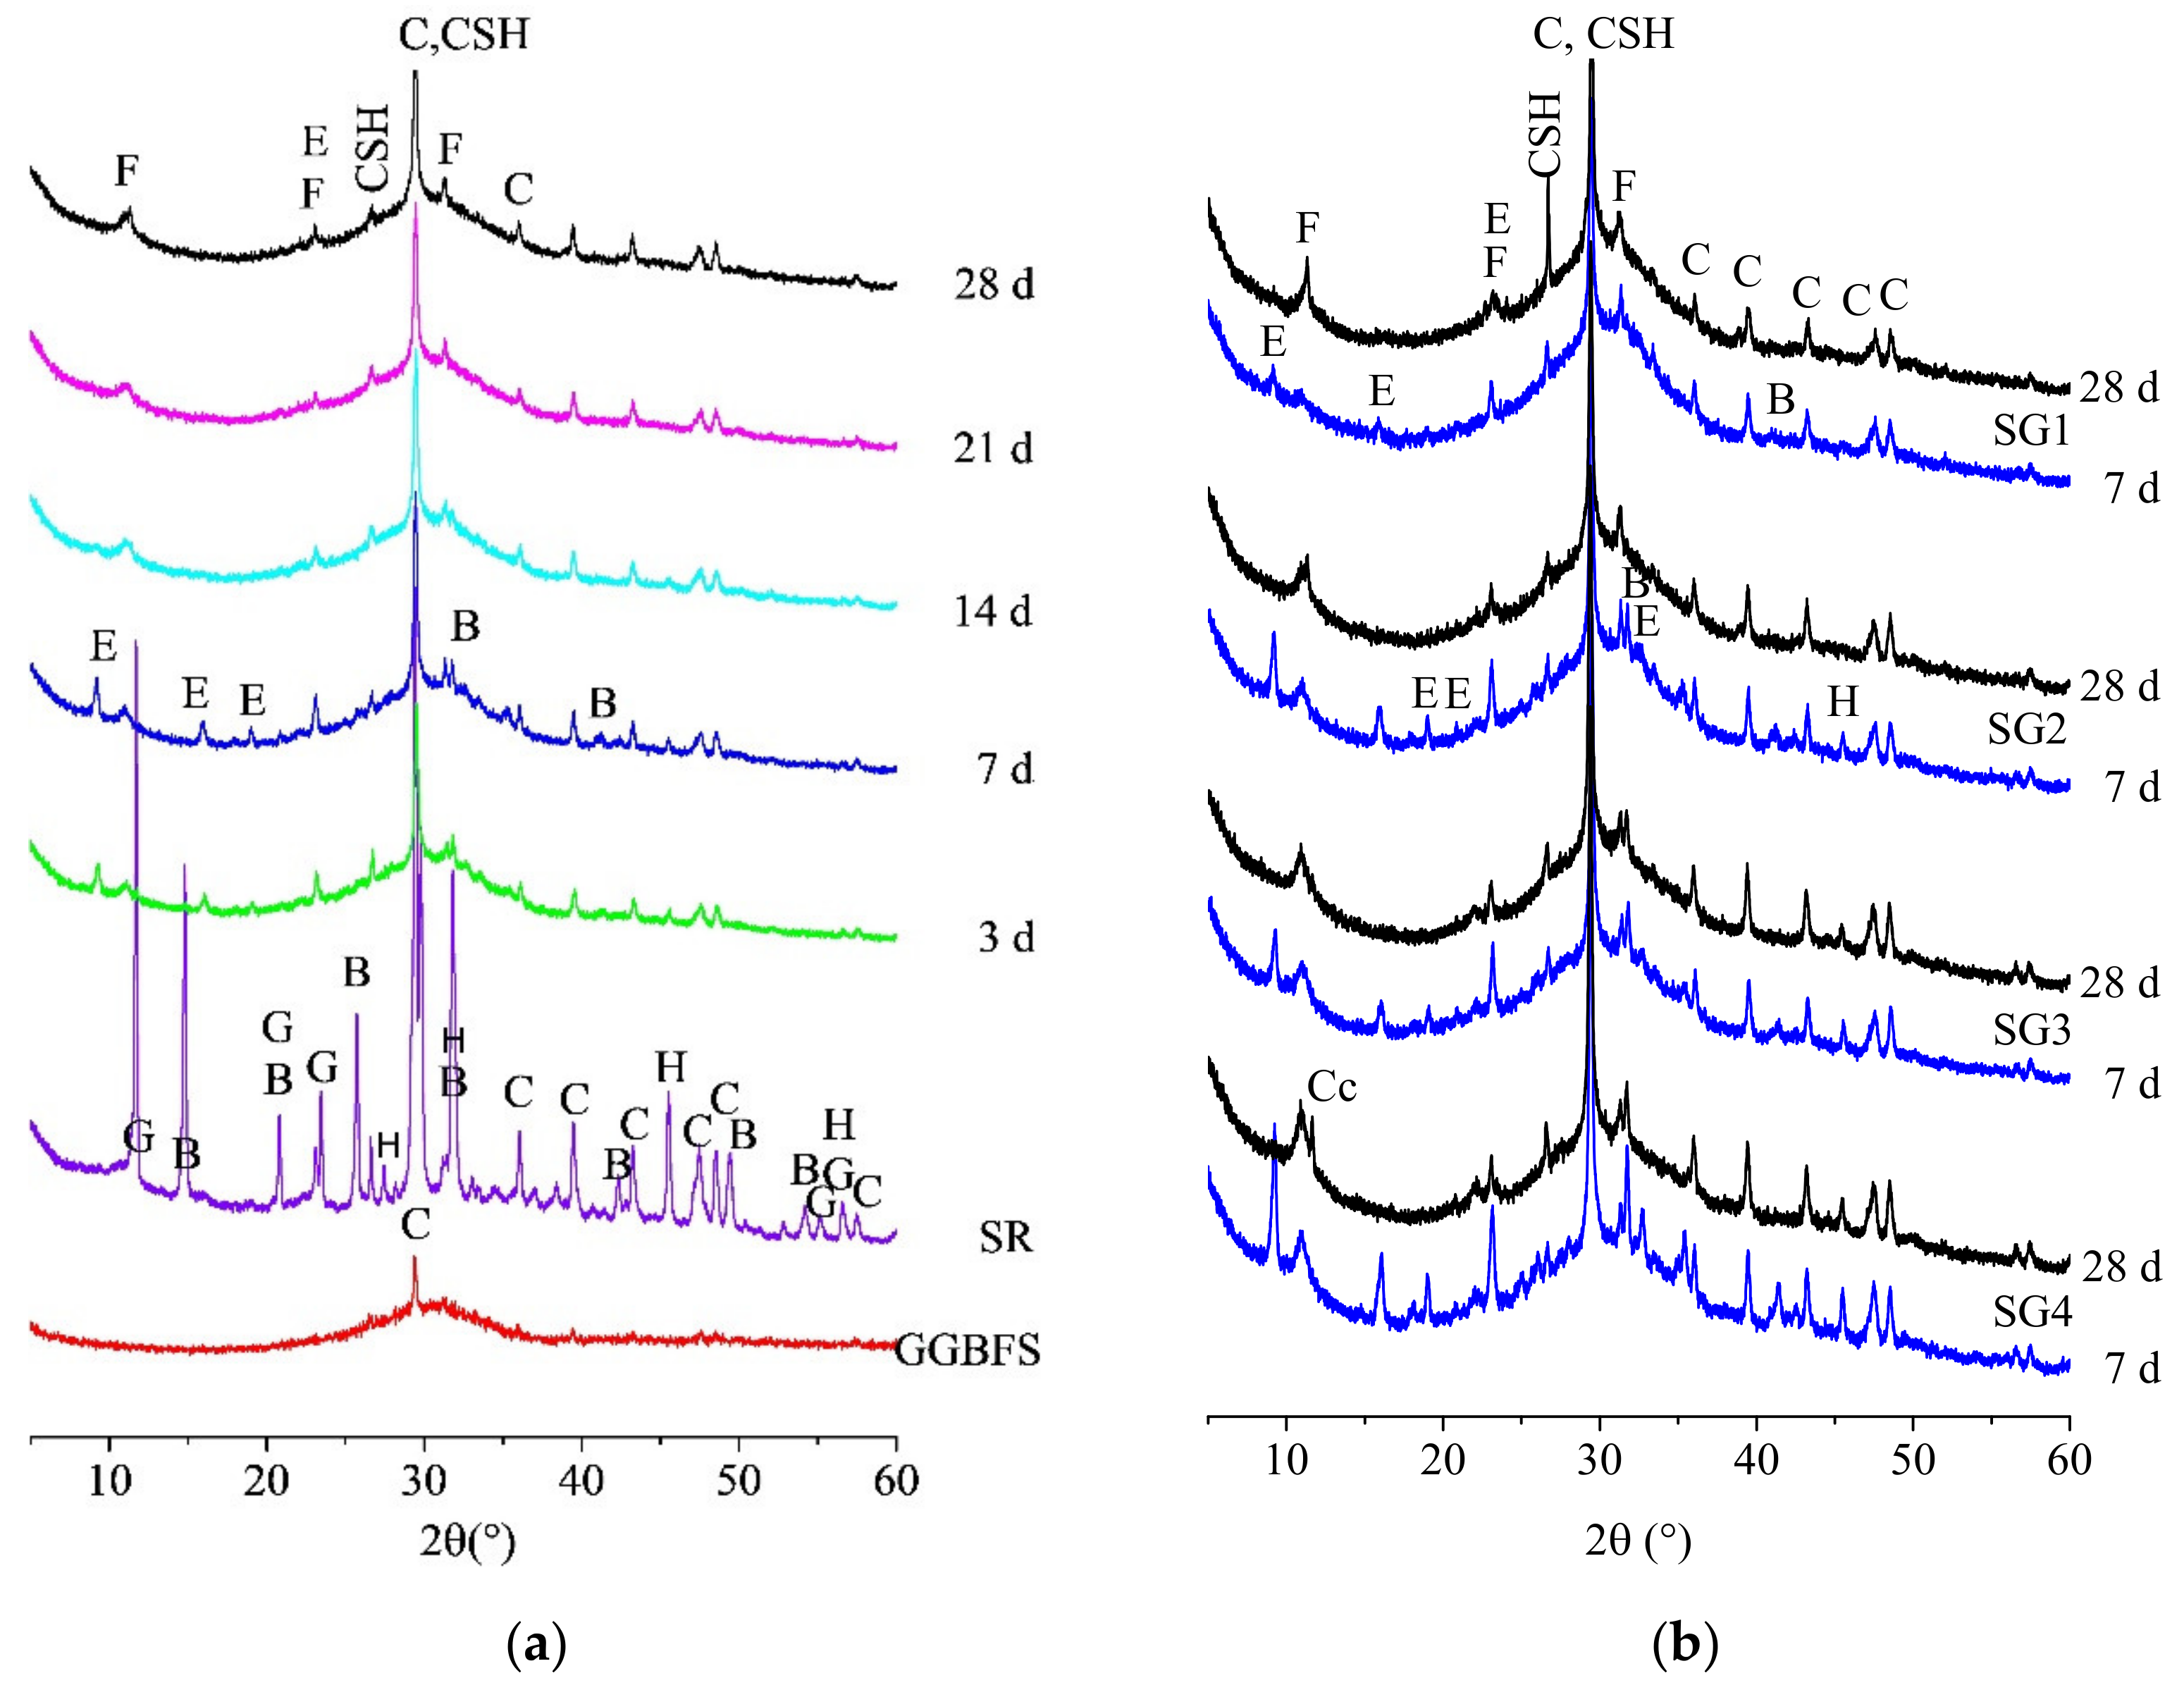
3.3.1. XRD Patterns
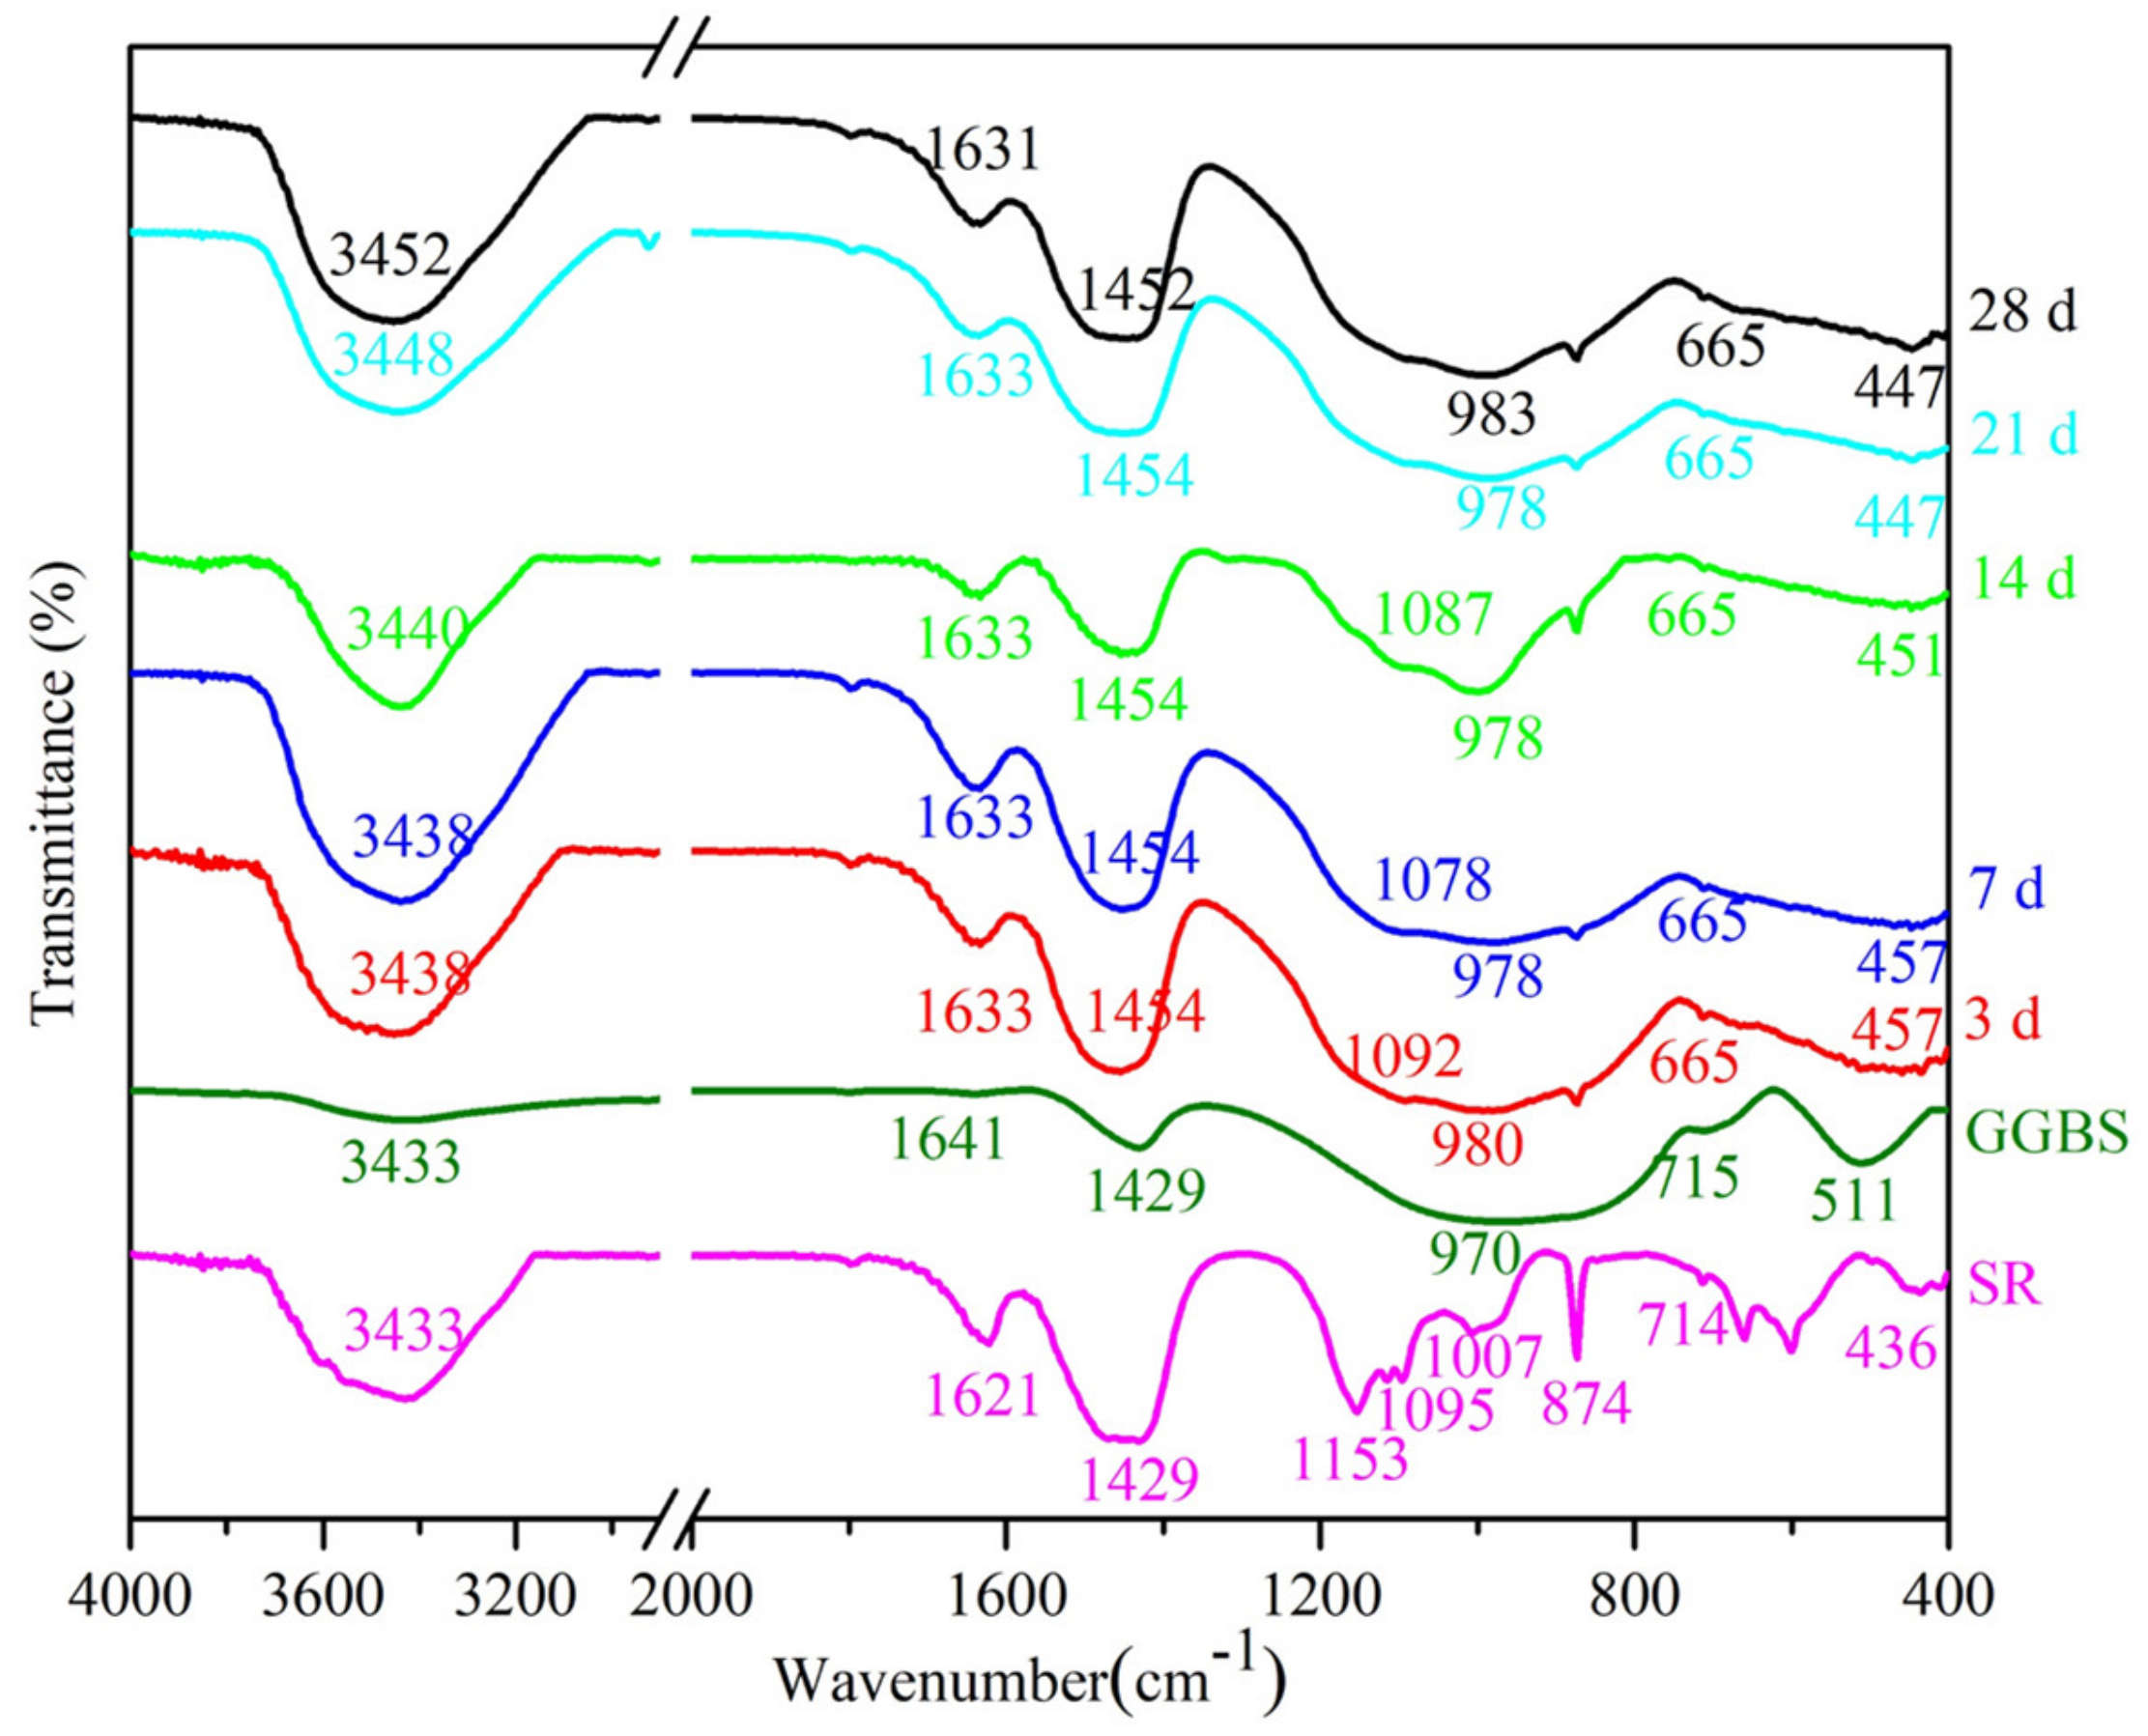
3.3.2. FTIR Spectra
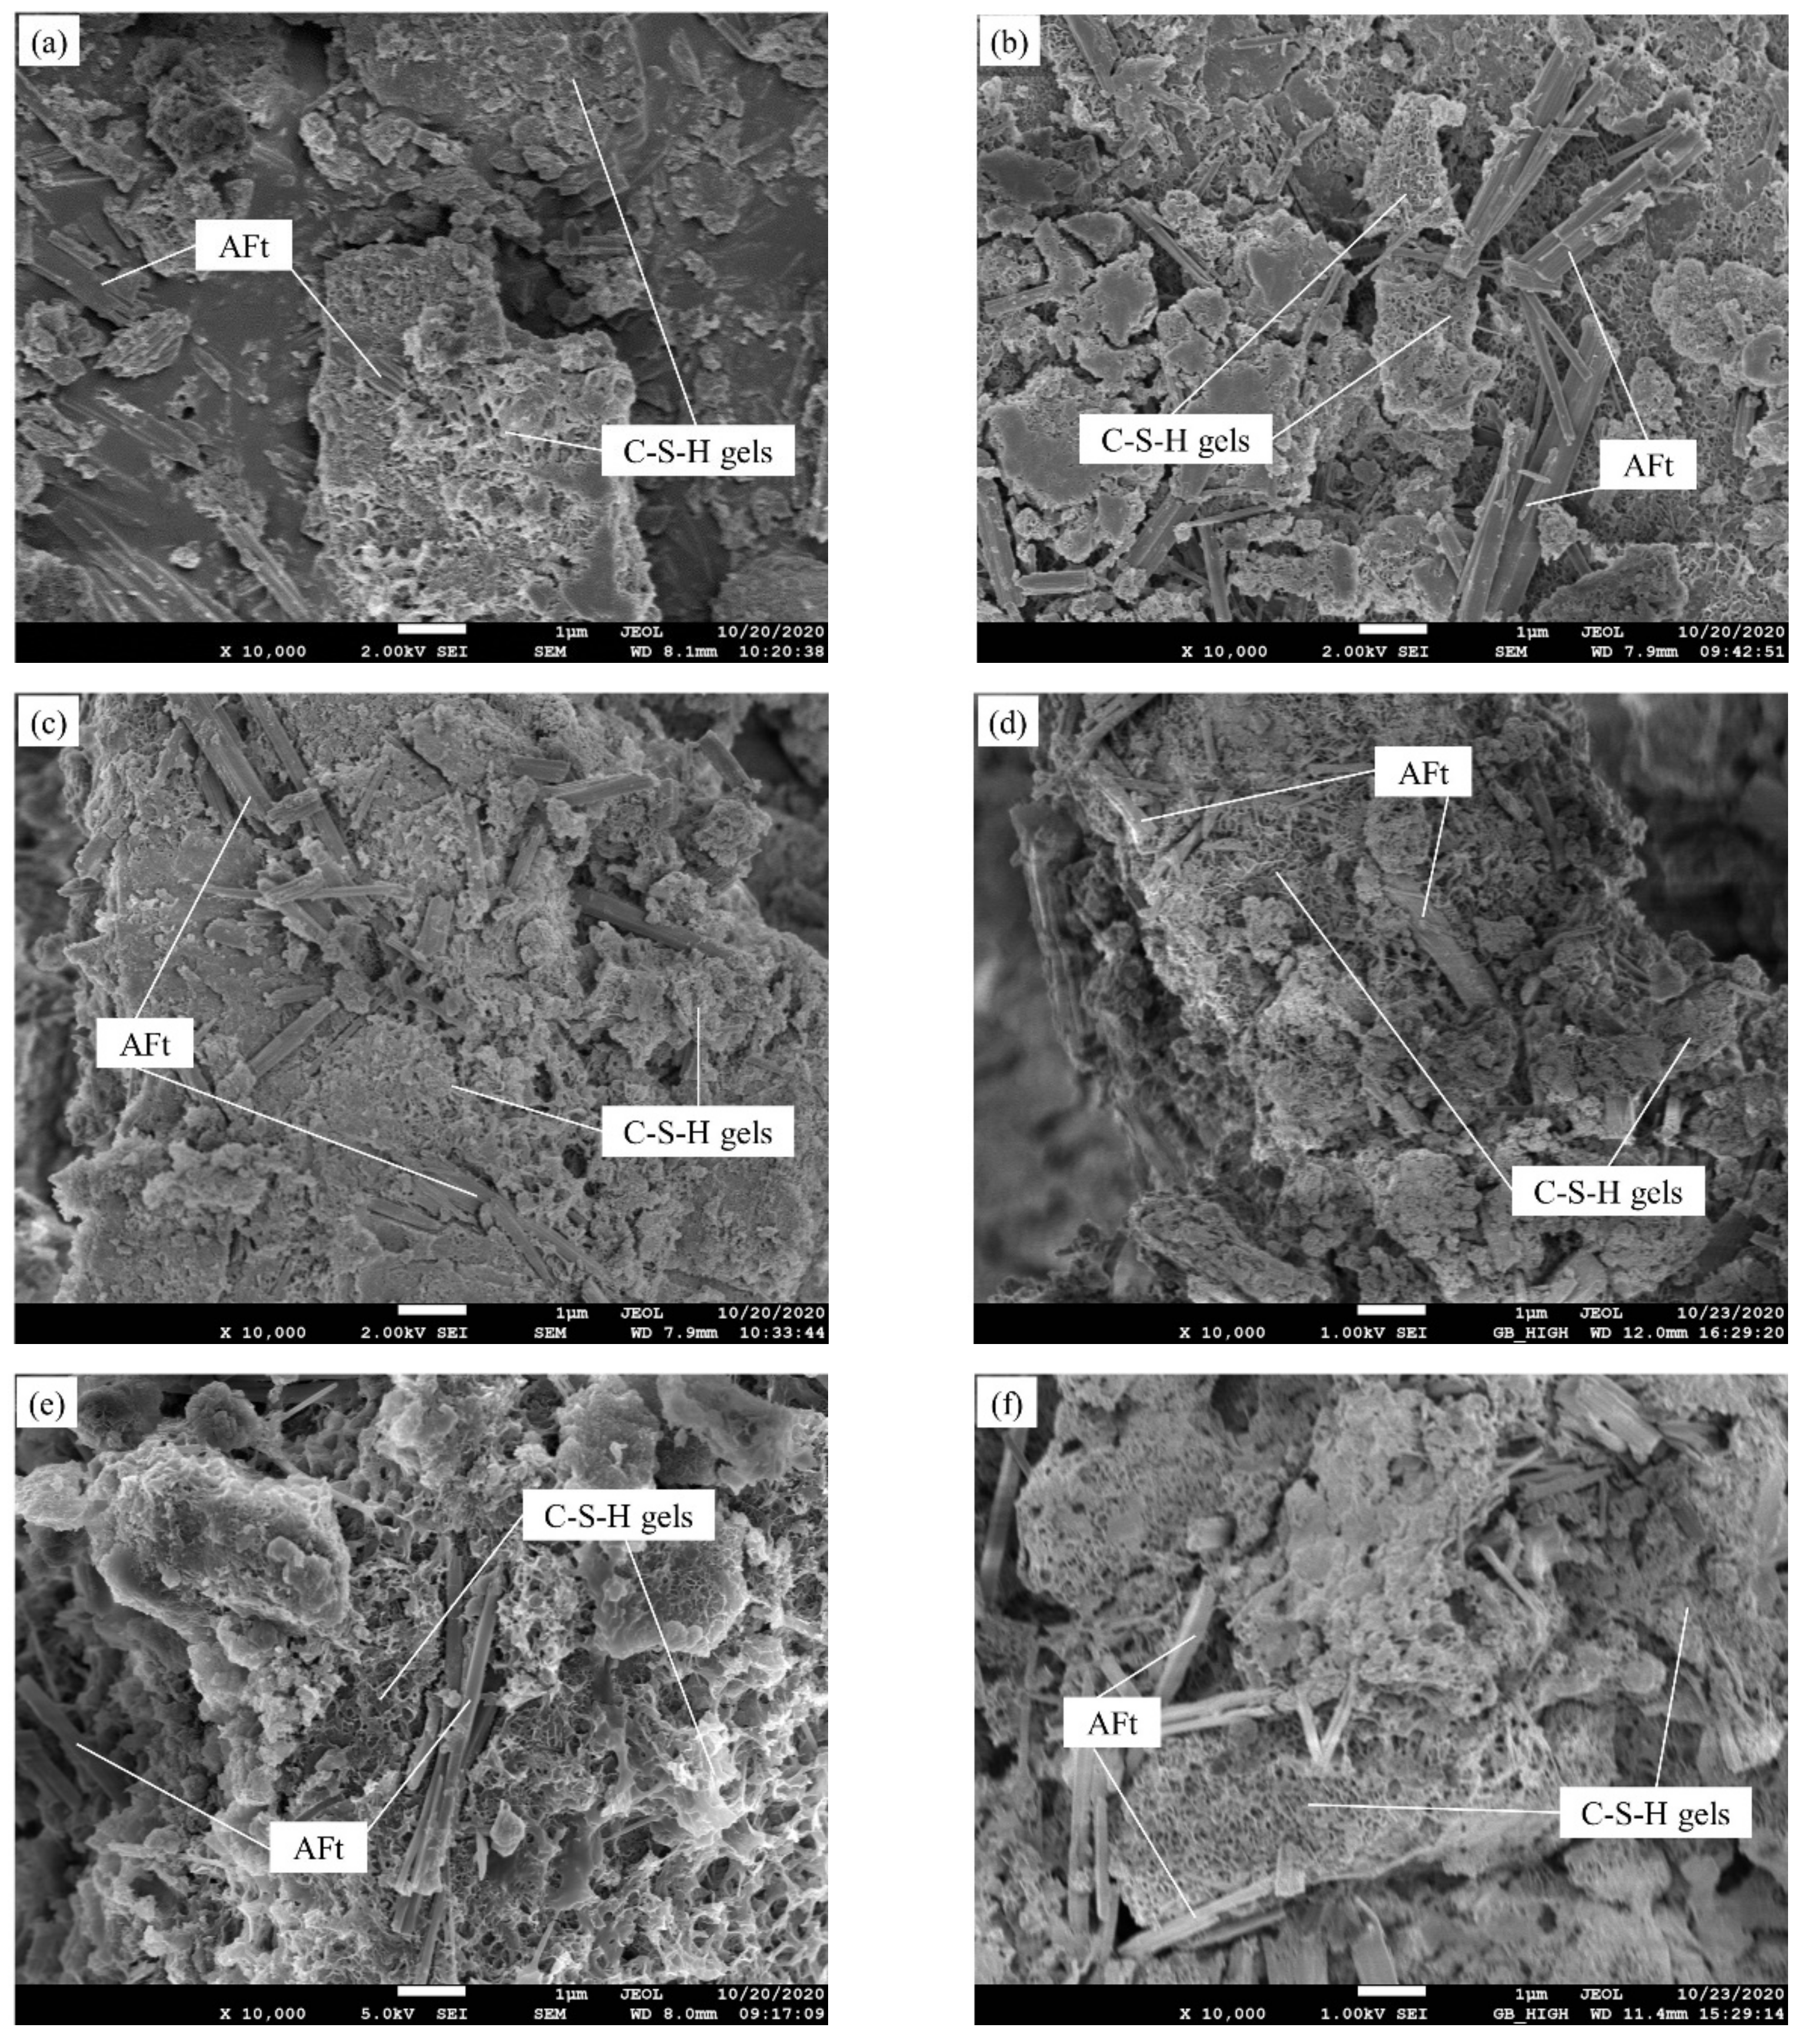
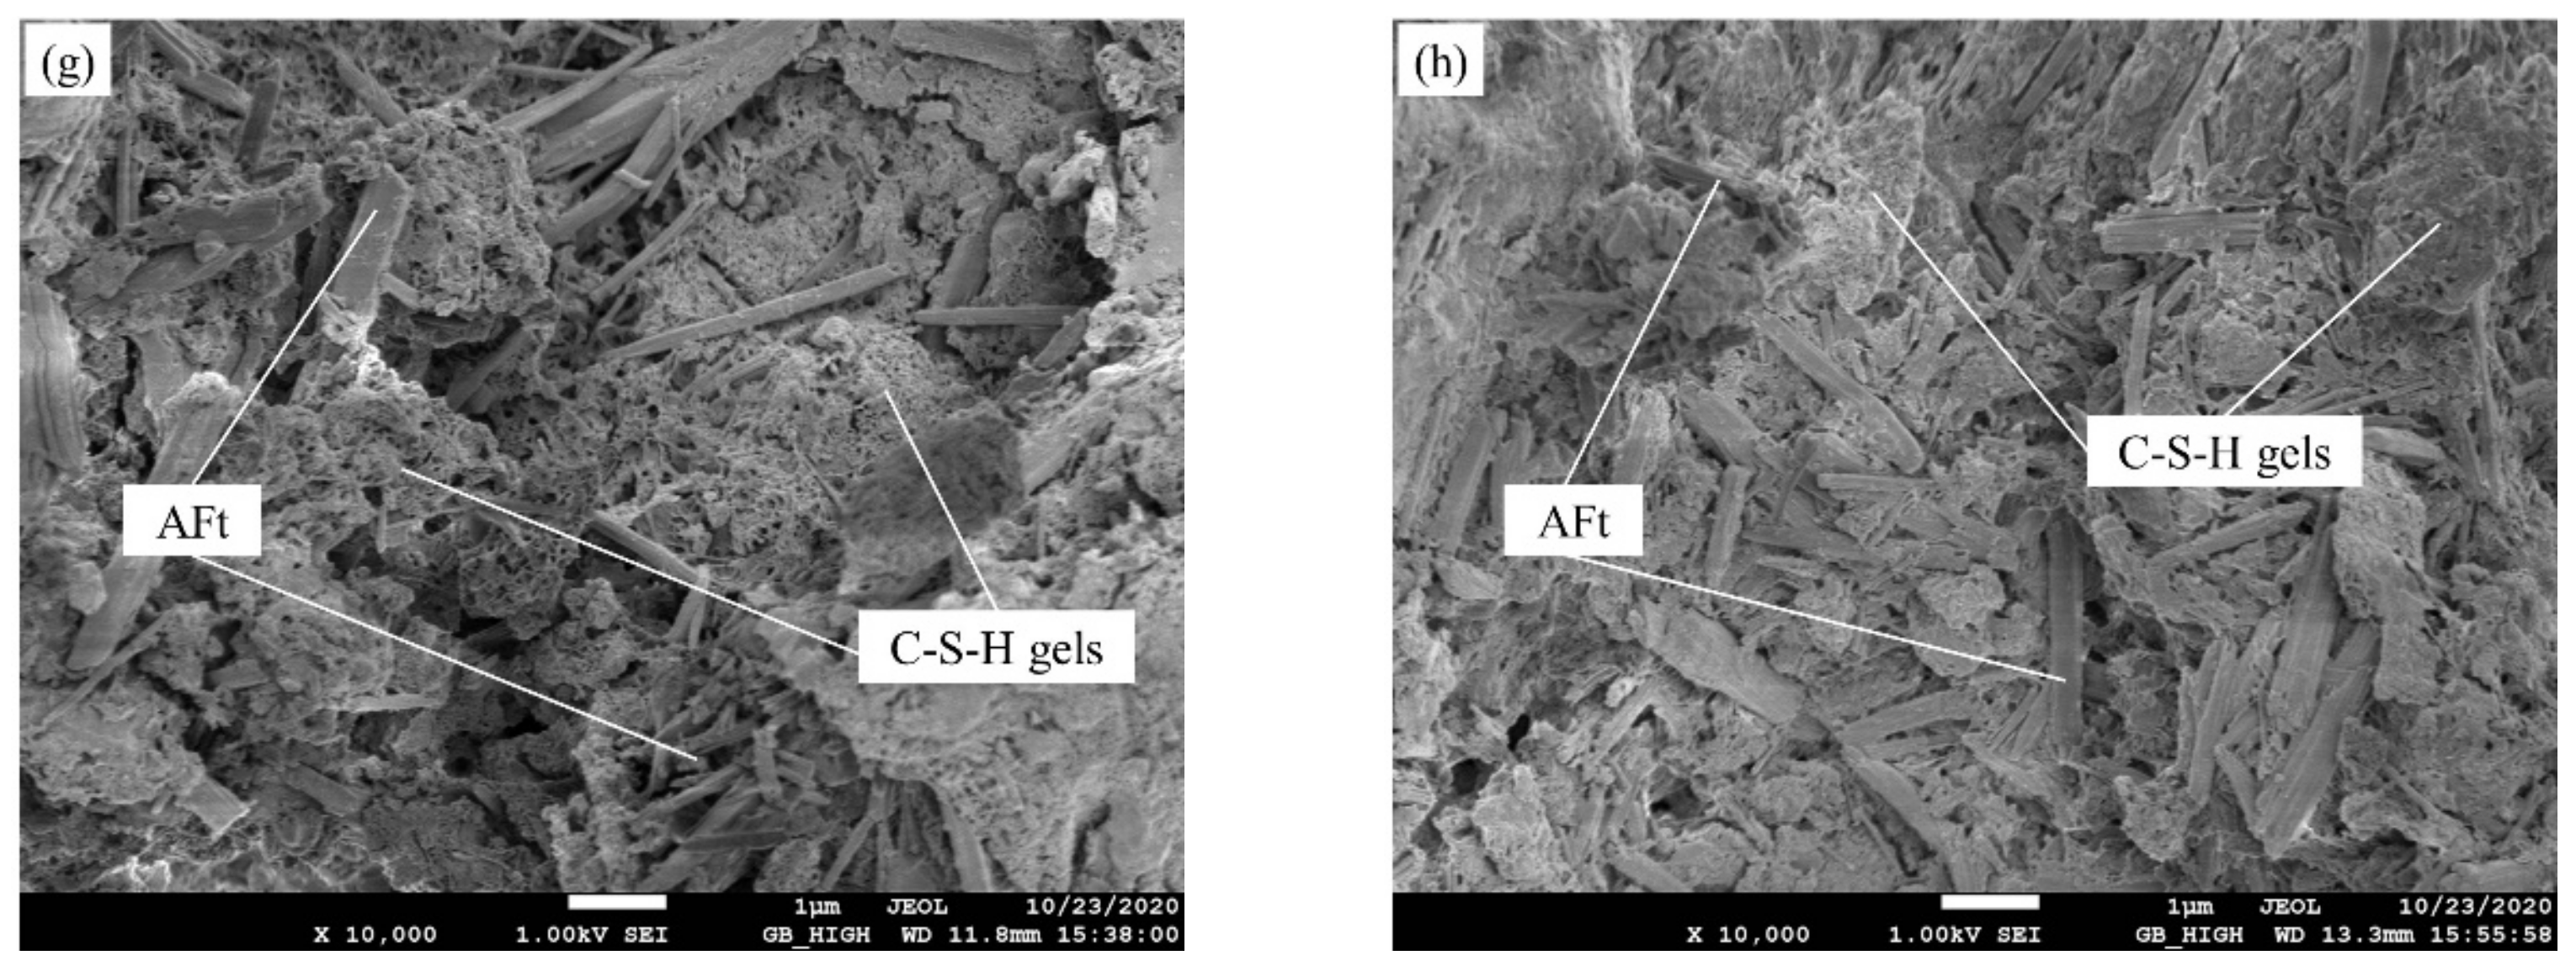
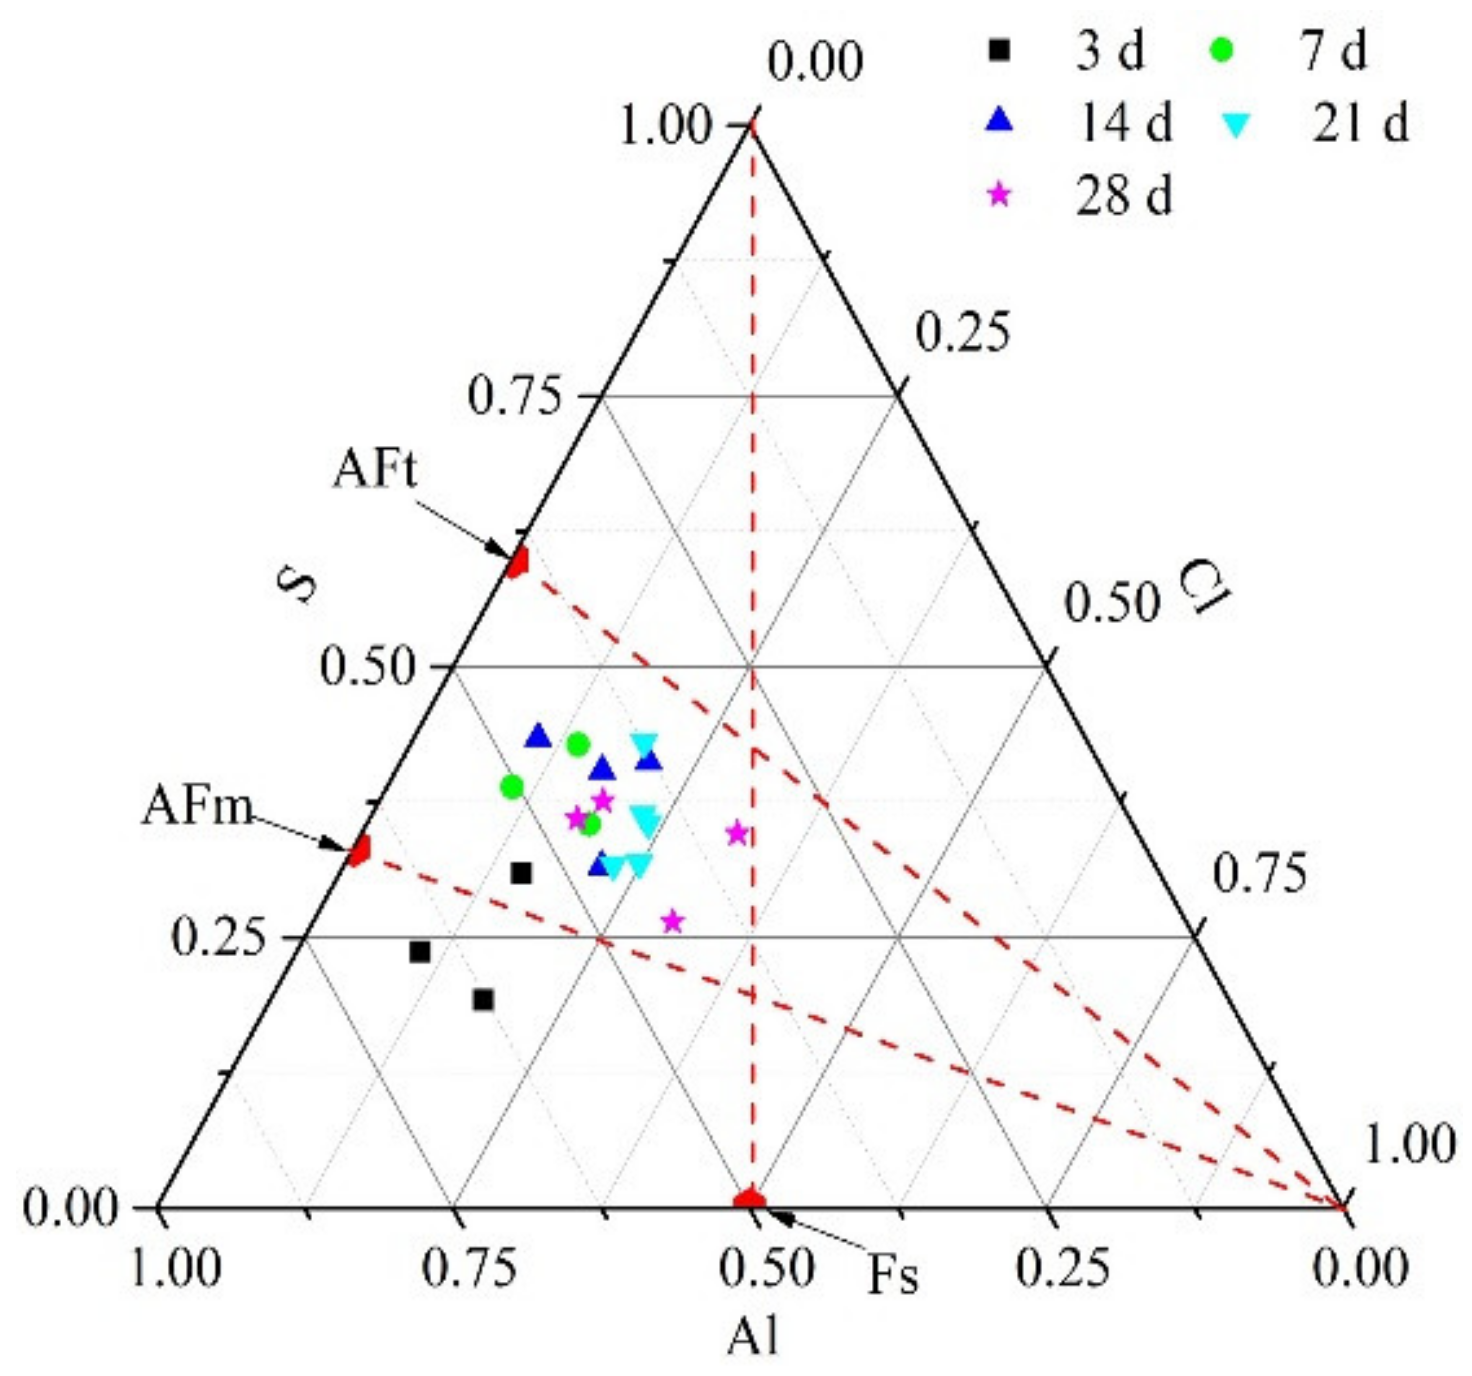
3.3.3. SEM-EDS Analyses
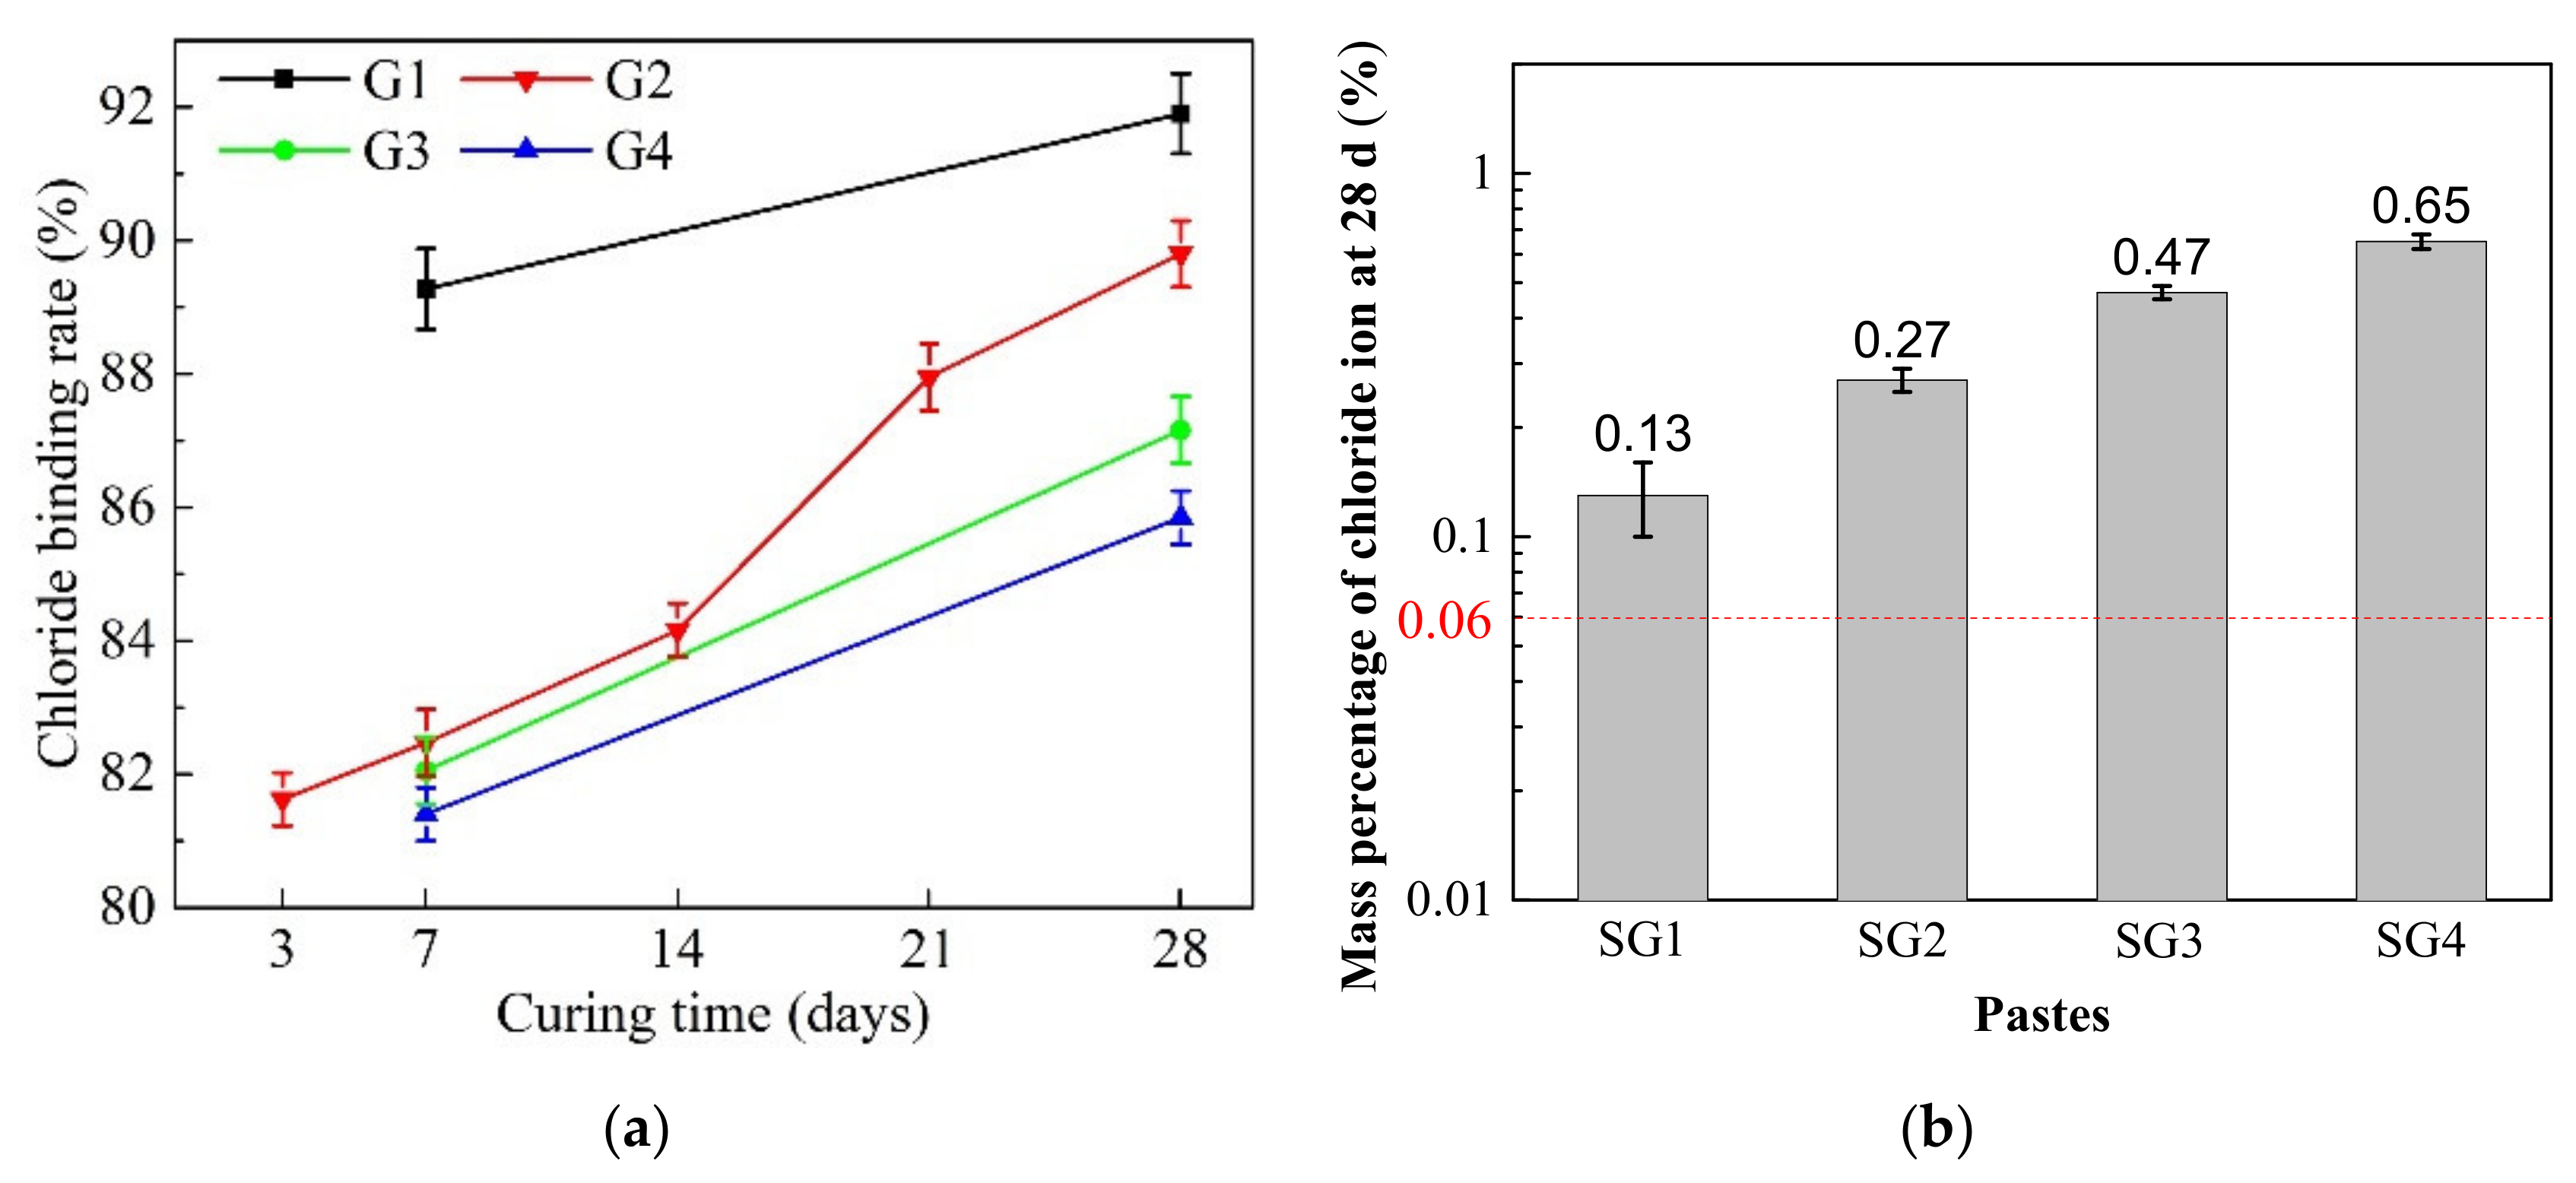
3.4. Chloride Binding of the Pastes
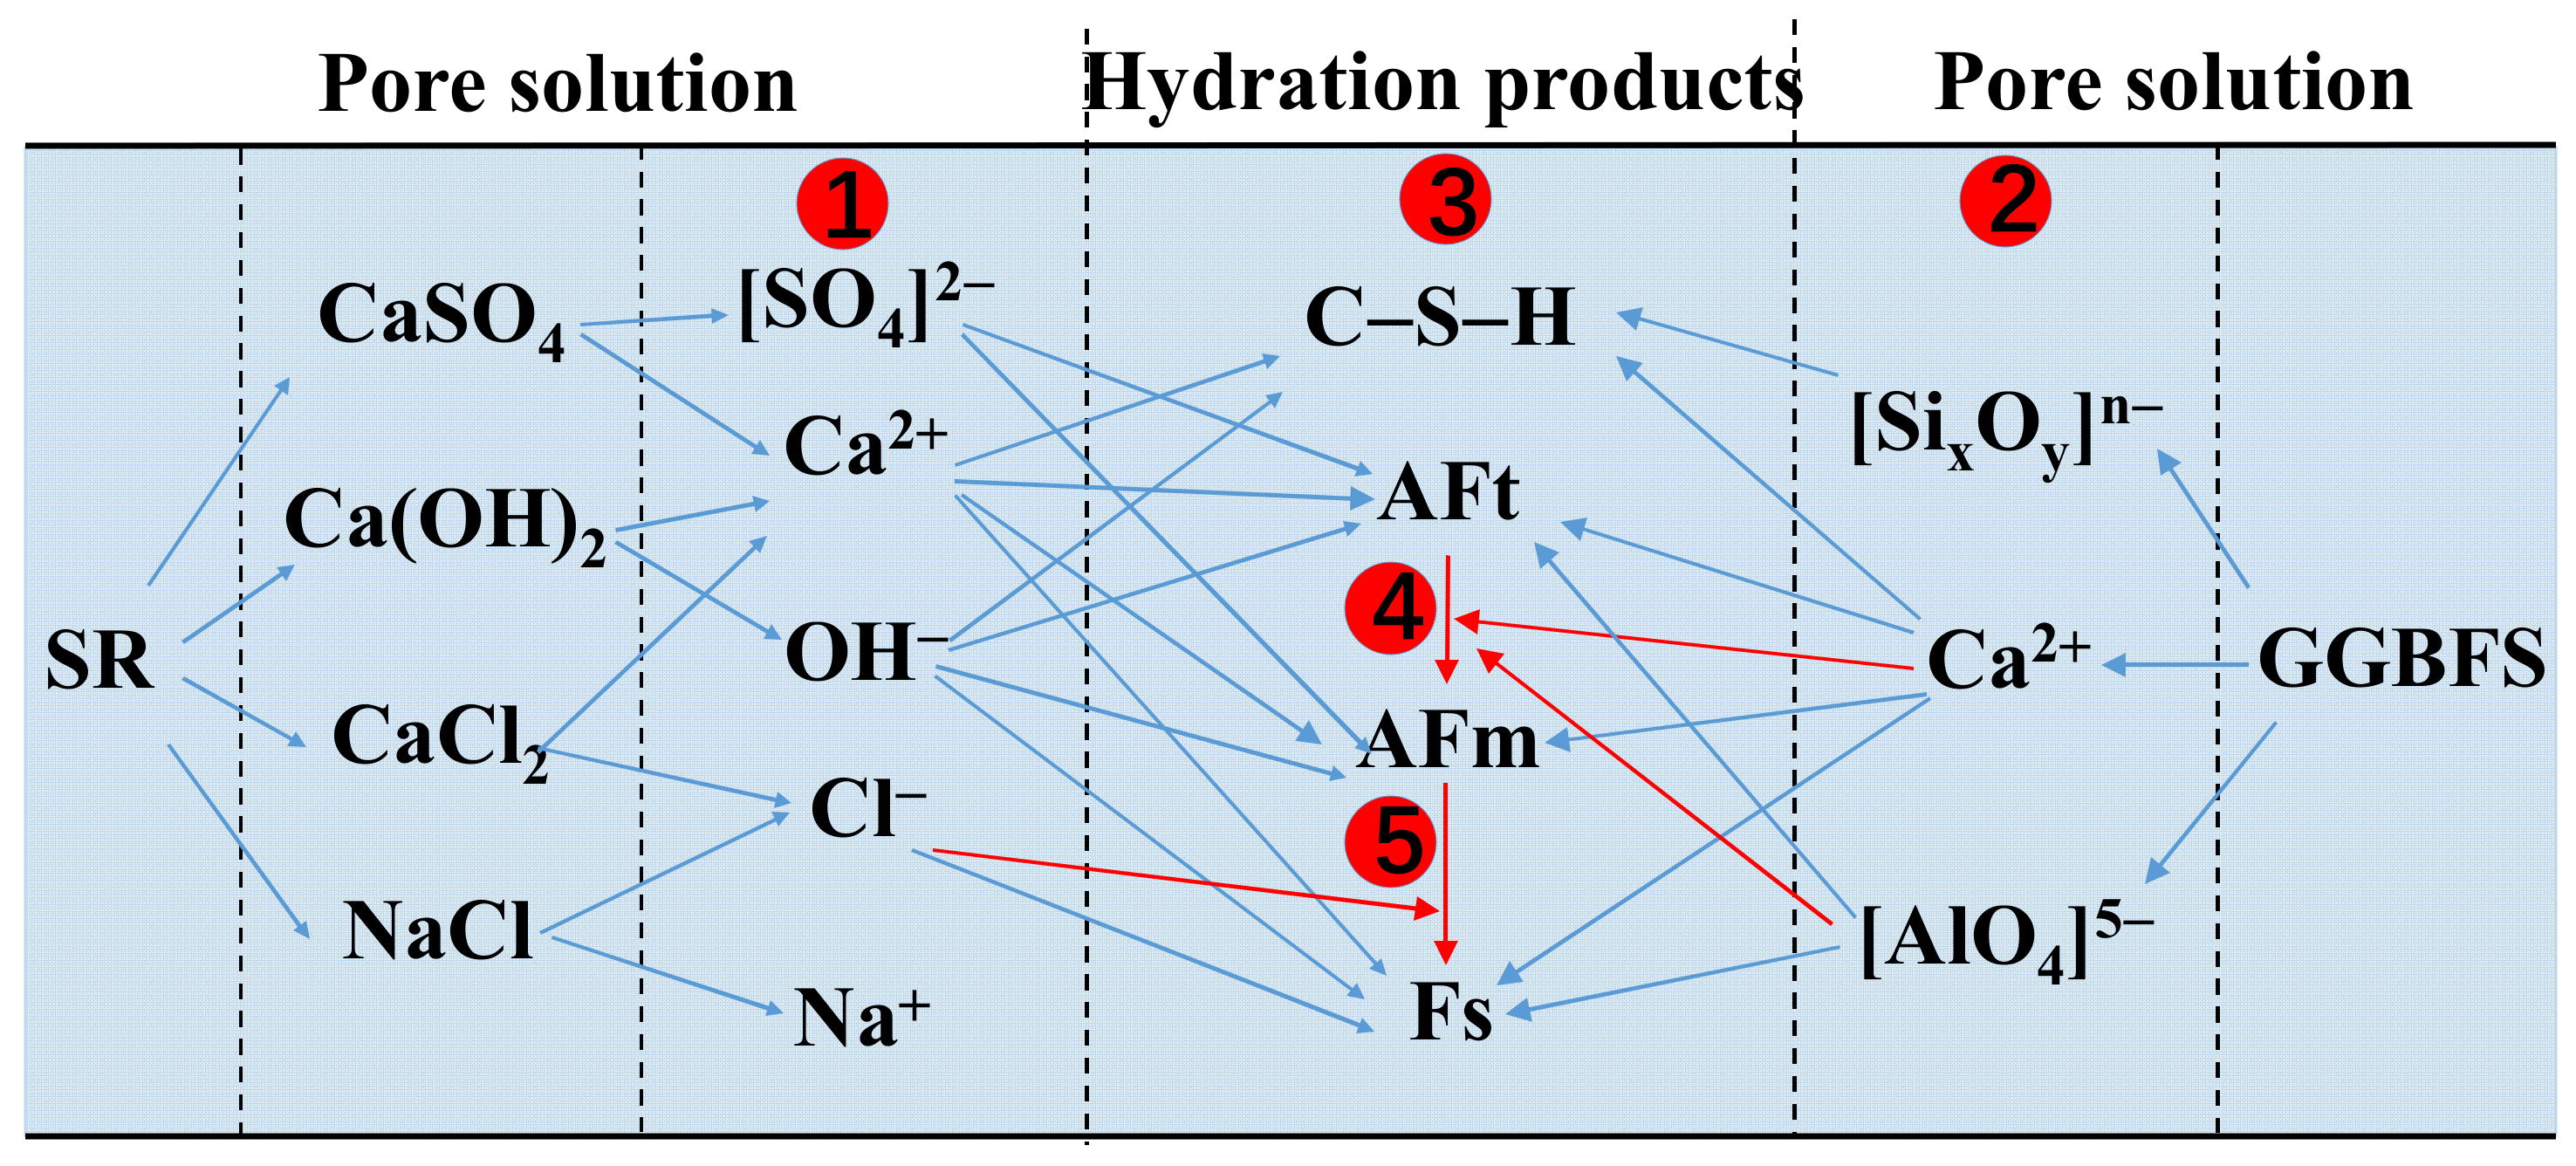
3.5. Hydration Mechanism
4. Conclusions
- (1)
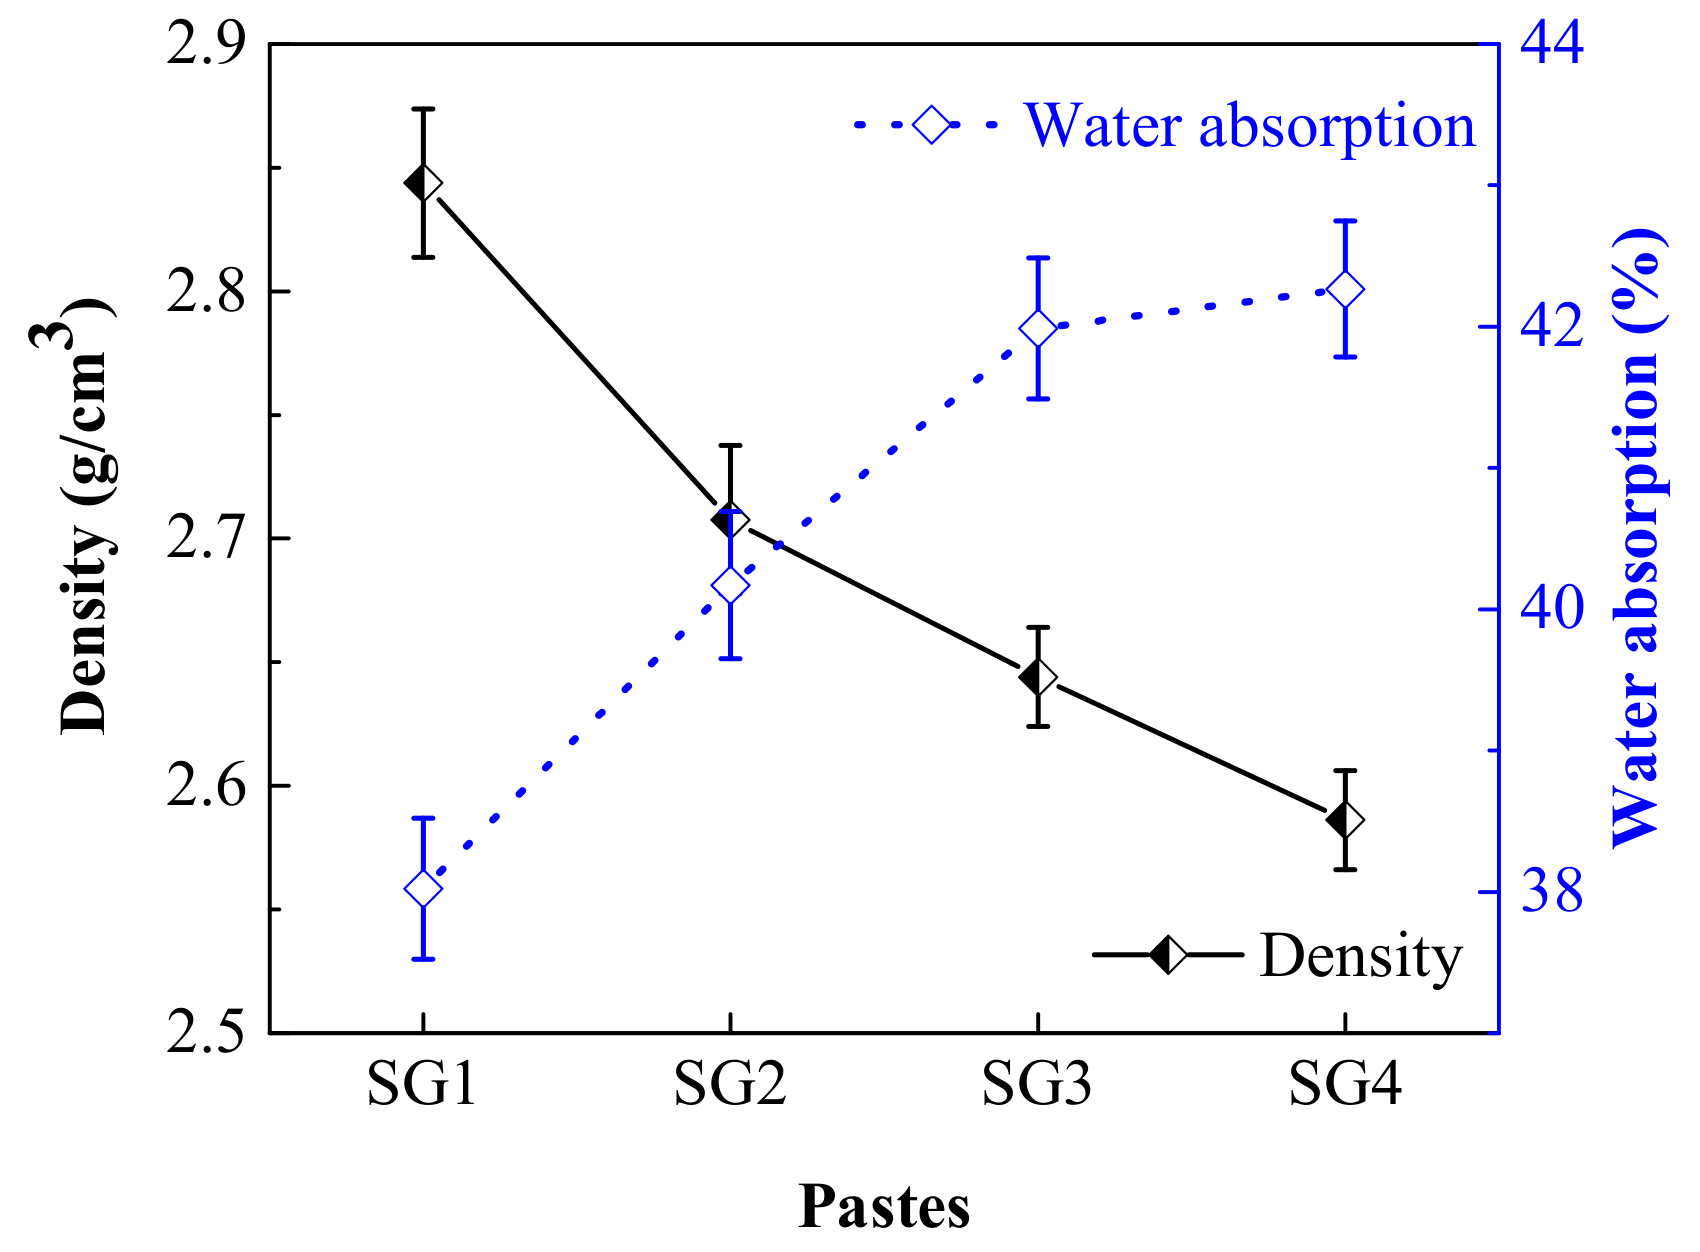
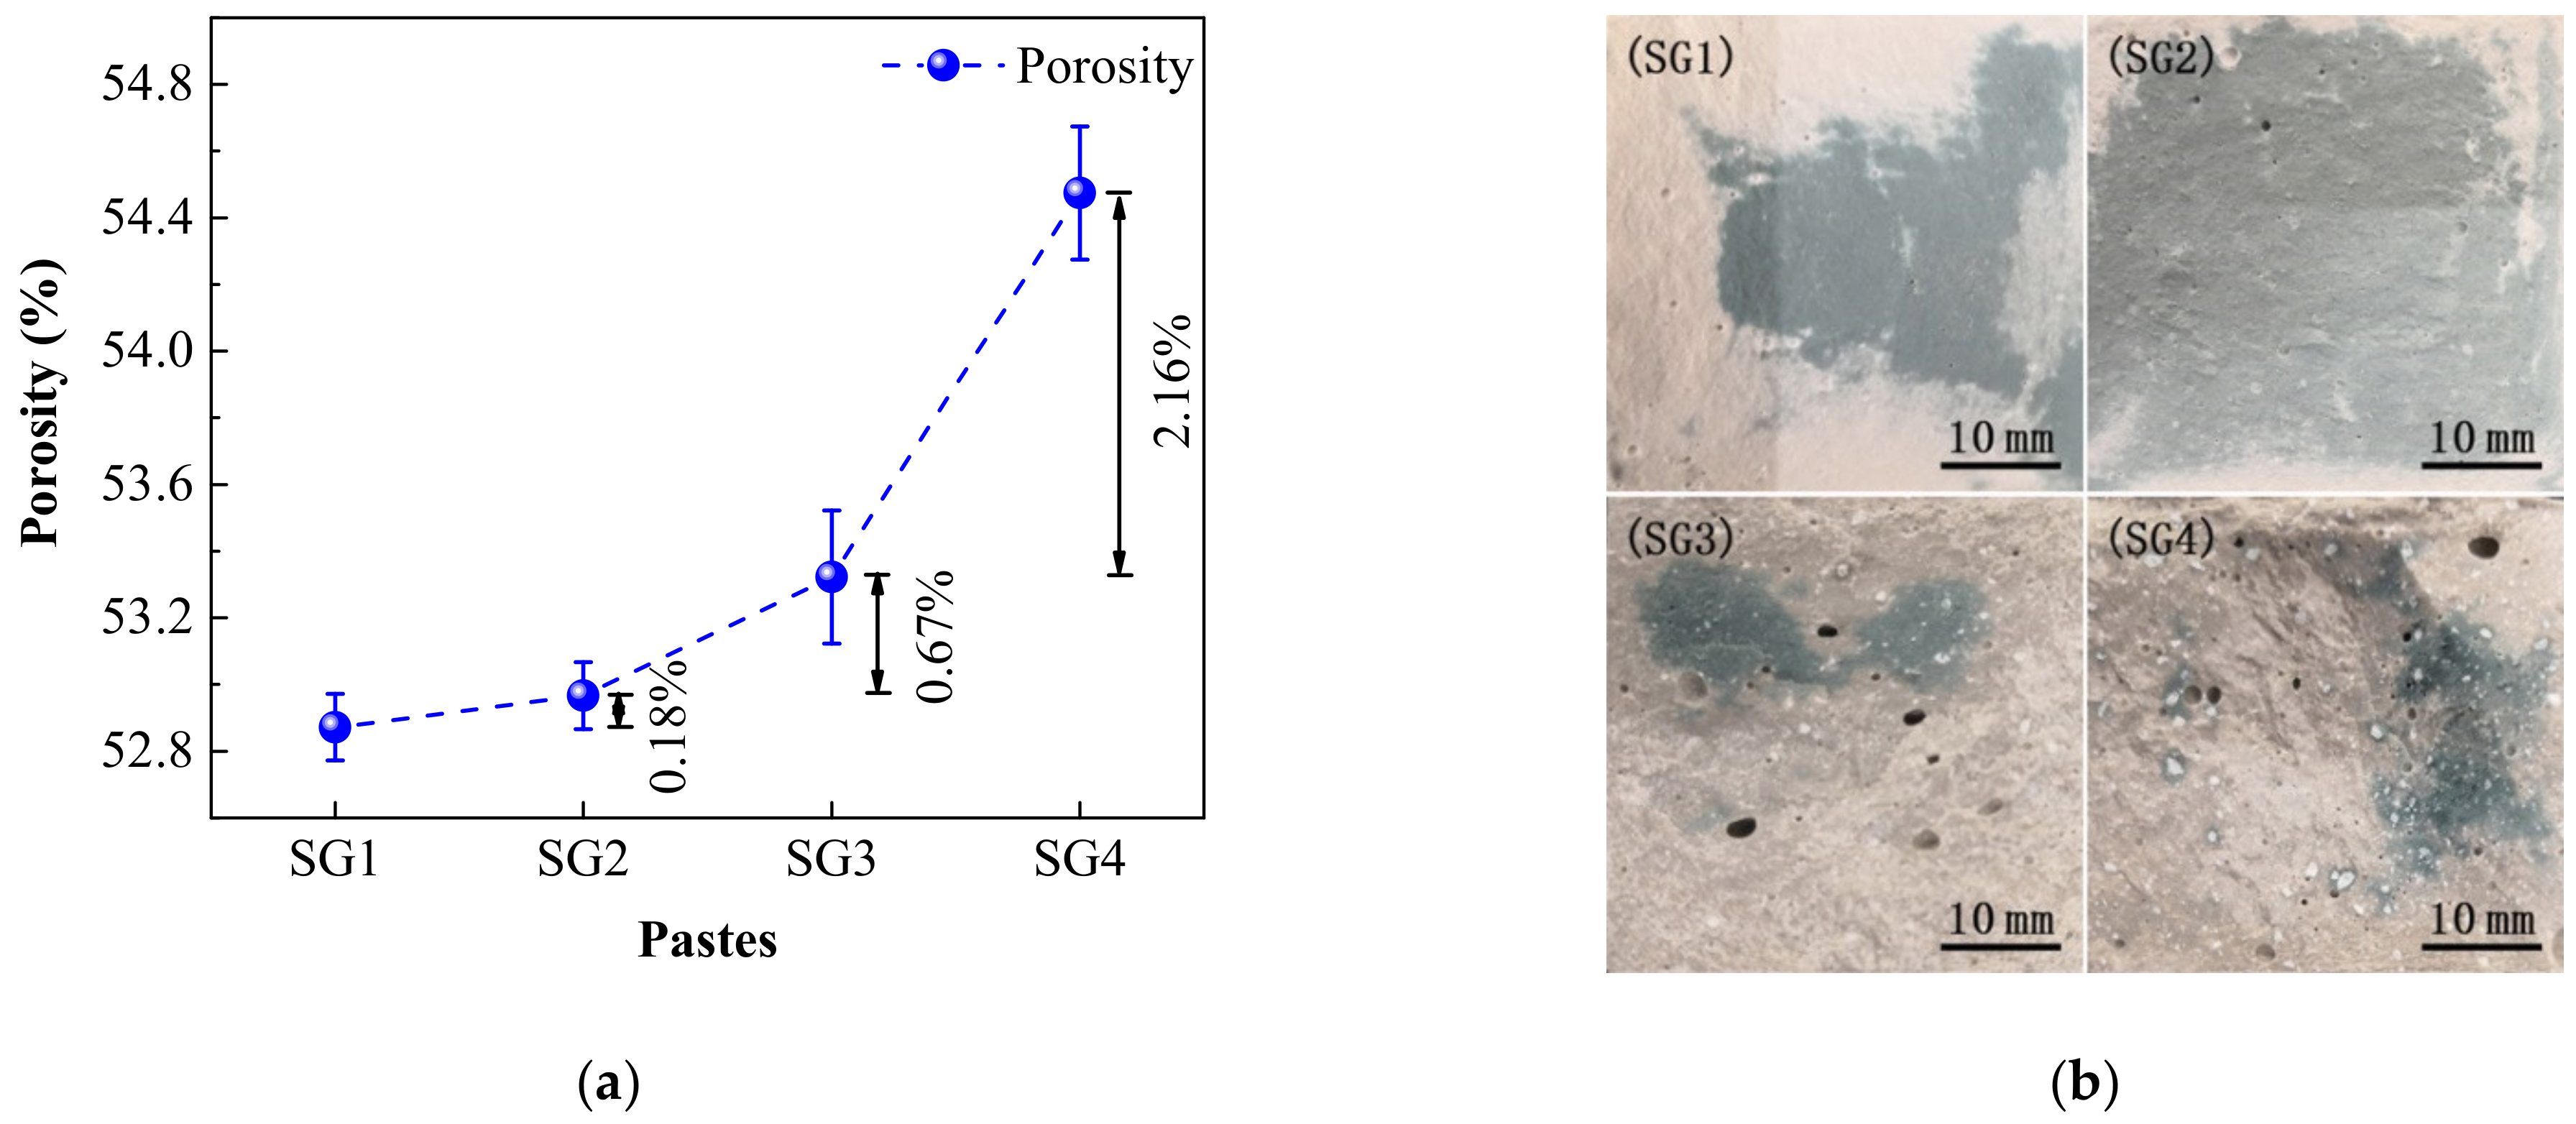
- The addition of SR was good to reduce the density of the SR-activated GGBFS pastes, whereas it increased water absorption and porosity. 24–32% SR addition led to uneven mixing of SR and GGBFS.
- (2)
- The proper proportion of SR in the SR-activated GGBFS pastes was 16%. The higher the SR addition was, the lower the strength of the pastes was. The maximum compressive strength (34.1 MPa) and flexural strength (6.9 MPa) occurred when the proportion of SR addition was 16% at 28 d.
- (3)
- The main hydration products of the SR-activated GGBFS pastes were C-S-H gels, AFt, and Fs. The amount of AFt in the pastes varied with the amount of SR addition and curing time.
- (4)
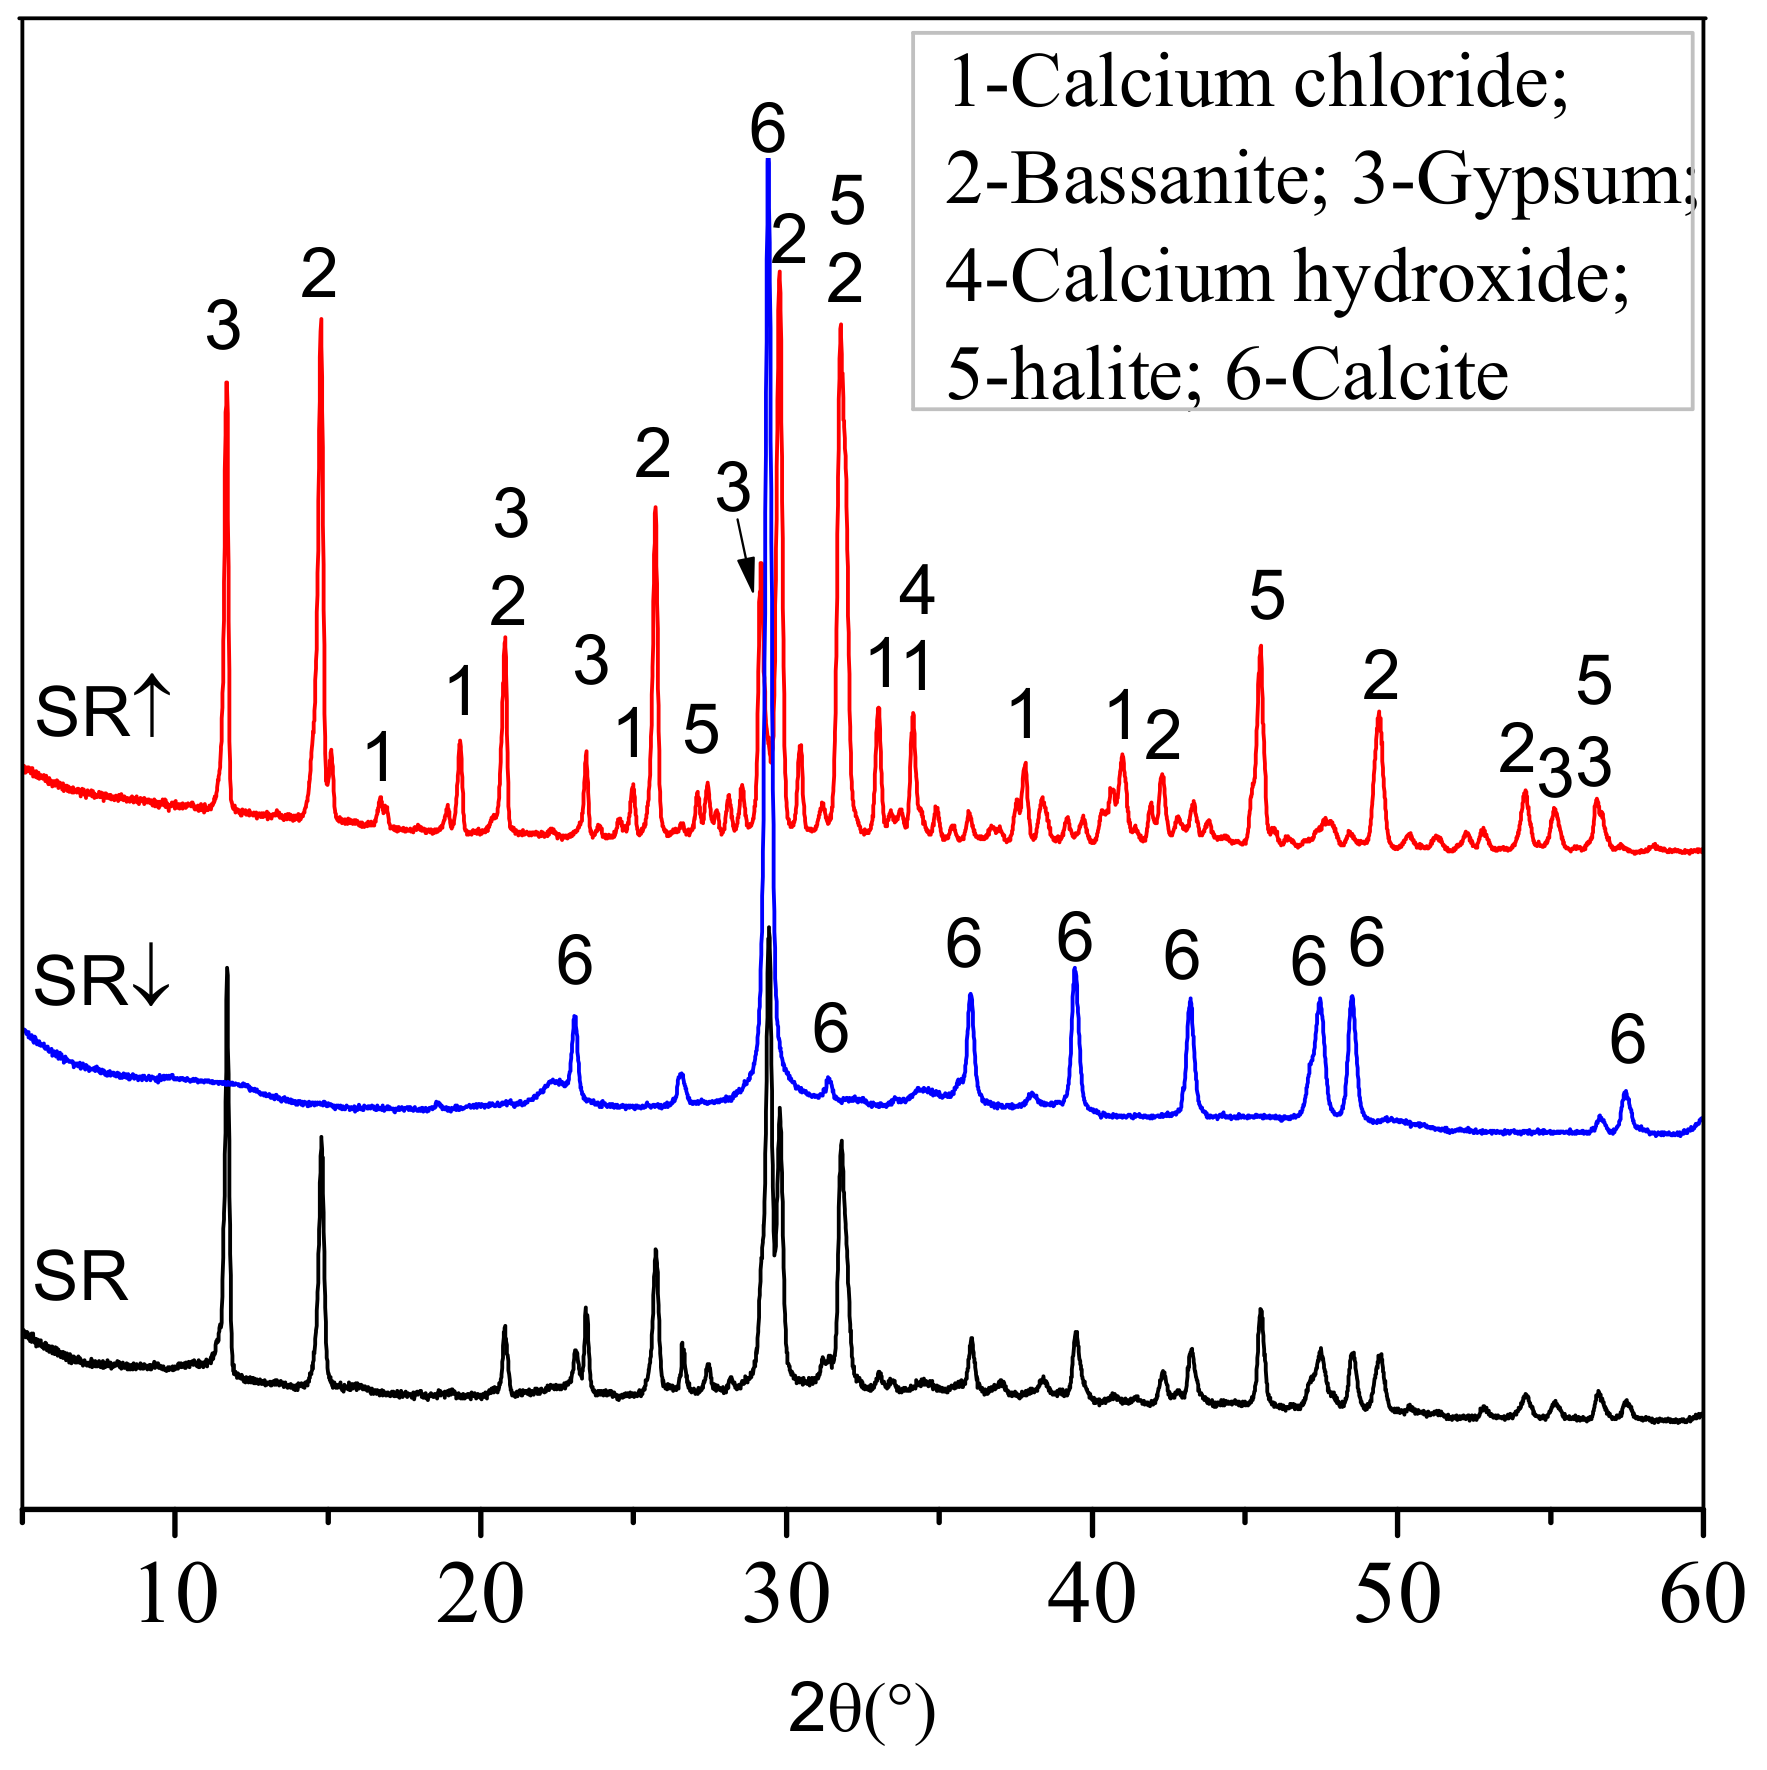
- SR contains CaCl2, NaCl, Ca(OH)2, and CaSO4, and can act as an alkaline activator in the SR-activated GGBFS pastes. GGBFS has a high capacity for binding chloride ion in SR. With the SR addition increasing from 8% to 32%, chloride binding rate of the pastes decreased from 91.90% to 89.80% at 28 d.
- (5)
- The percentage of free chloride ion in SR-activated GGBFS pastes is much higher than the requirements of the specification (blow 0.06%), and has the possibility of corroding steel. Therefore, SR activated GGBFS cementitious materials can be used to replace cement in the field of civil engineering without reinforcement.
Author Contributions
Funding
Institutional Review Board Statement
Informed Consent Statement
Data Availability Statement
Conflicts of Interest
References
- Li, X. Tian Jin Jian Chang Jian Zha tu De Gong Cheng li Yong Yan Jiu; China Ocean Press: Beijing, China, 2013; pp. 1–5. (In Chinese) [Google Scholar]
- Solvay Process. Available online: https://www.chemeurope.com/en/encyclopedia/Solvay_process.html (accessed on 1 March 2021).
- Gur, N.; Aktas, Y. Utilization of soda ash plant solid wastes in manufacture of cement. Elixir Cem. Con. Com. 2012, 47, 8866–8873. [Google Scholar]
- Obrenović, M.Č.; Iličković, Z. Utilization of soda ash plant solid wastes in production of geopolymers. Int. J. Eng. Innov. Res. 2017, 6, 273–277. [Google Scholar]
- Lin, Y.; Xu, D. Effect of soda residue addition and its chemical composition on physical properties and hydration products of soda residue-activated slag cementitious materials. Materials 2020, 13, 1789. [Google Scholar] [CrossRef] [PubMed] [Green Version]
- Ma, J.; Yan, N. Mechanical characteristics of soda residue soil incorporating different admixture: Reuse of soda residue. Sustainability 2020, 12, 5852. [Google Scholar] [CrossRef]
- Wang, Q.; Li, J. Characterization of the mechanical properties and microcosmic mechanism of Portland cement prepared with soda residue. Constr. Build. Mater. 2020, 241, 117994. [Google Scholar] [CrossRef]
- Mikhailova, E.; Panasenko, V. Calcium carbonate synthesis with prescribed properties based on liquid waste of soda production. Odes’kyi Politech. Universytet. Pratsi 2016, 2, 81–85. [Google Scholar] [CrossRef] [Green Version]
- Liu, J.; Zha, F. Strength and microstructure characteristics of cement-soda residue solidified/stabilized zinc contaminated soil subjected to freezing–thawing cycles. Cold Reg. Sci. Technol. 2020, 172, 102992. [Google Scholar] [CrossRef]
- He, J.; Li, Z. Durability of soft soil treated with soda residue and ground granulated blast furnace slag in a soaking environment. J. Mater. Civ. Eng. 2020, 32, 06019018. [Google Scholar] [CrossRef]
- He, J.; Wang, X. Shear strength of stabilized clay treated with soda residue and ground granulated blast furnace slag. J. Mater. Civ. Eng. 2019, 31, 06018029. [Google Scholar] [CrossRef]
- Uçal, G.O.; Mahyar, M. Hydration of alinite cement produced from soda waste sludge. Constr. Build. Mater. 2018, 164, 178–184. [Google Scholar] [CrossRef]
- Zhao, X.; Liu, C. Physical and mechanical properties and micro characteristics of fly ash-based geopolymers incorporating soda residue. Cem. Concr. Compos. 2019, 98, 125–136. [Google Scholar] [CrossRef]
- Zhao, X.; Liu, C. Synthesis and characterization of fly ash geopolymer paste for goaf backfill: Reuse of soda residue. J. Clean. Prod. 2020, 260, 121045. [Google Scholar] [CrossRef]
- Wang, Z.; Lyu, X. Preparation of Ca–Si–Al–Mg porous ceramics by Co-operation of Ca&Mg-contained soda residue and altered rock gold tailings. J. Clean. Prod. 2020, 262, 121345. [Google Scholar]
- Zhao, X.; Liu, C. Investigation into the effect of calcium on the existence form of geopolymerized gel product of fly ash based geopolymers. Cem. Concr. Compos. 2019, 103, 279–292. [Google Scholar] [CrossRef]
- Sanjuán, M.Á.; Argiz, C. Carbon dioxide uptake in the roadmap 2050 of the Spanish cement industry. Energies 2020, 13, 3452. [Google Scholar] [CrossRef]
- Habert, G. Assessing the environmental impact of conventional and ‘green’ cement production. In Eco-Efficient Construction and Building Materials; Woohead Publishing: Sawston, UK, 2014; pp. 199–238. [Google Scholar]
- Yang, Y.B.; Pu, Y. Experimental study on the performance of concrete using soda residue as mineral admixture. Concrete 2017, 9, 80–83. (In Chinese) [Google Scholar]
- Adesanya, E.; Ohenoja, K. Alternative alkali-activator from steel-making waste for one-part alkali-activated slag. J. Clean. Prod. 2020, 274, 123020. [Google Scholar] [CrossRef]
- Wang, S.D.; Scrivener, K.L. Hydration products of alkali activated slag cement. Cem. Concr. Res. 1995, 25, 561–571. [Google Scholar] [CrossRef]
- Li, W.; Yi, Y. Use of carbide slag from acetylene industry for activation of ground granulated blast-furnace slag. Constr. Build. Mater. 2020, 238, 117713. [Google Scholar] [CrossRef]
- Zhang, J.; Tan, H. Compressive strength and hydration process of ground granulated blast furnace slag-waste gypsum system managed by wet grinding. Constr. Build. Mater. 2019, 228, 116777. [Google Scholar] [CrossRef]
- Sanjuán, M.Á.; Estévez, E. Effect of curing time on granulated blast-furnace slag cement mortars carbonation. Cem. Concr. Compos. 2018, 90, 257–265. [Google Scholar] [CrossRef]
- Gruyaert, E.; Heede, P.V.D. Carbonation of slag concrete: Effect of the cement replacement level and curing on the carbonation coefficient—Effect of carbonation on the pore structure. Cem. Concr. Compos. 2013, 35, 39–48. [Google Scholar] [CrossRef]
- Fernández-Jiménez, A.; Palomo, J.G. Alkali-activated slag mortars: Mechanical strength behaviour. Cem. Concr. Res. 1999, 29, 1313–1321. [Google Scholar] [CrossRef]
- Kwon, Y.-H.; Kang, S.-H. Enhancement of Material Properties of Lime-Activated Slag Mortar from Intensified Pozzolanic Reaction and Pore Filling Effect. Sustainability 2018, 10, 4290. [Google Scholar] [CrossRef] [Green Version]
- Provis, J.L.; Palomo, A. Advances in understanding alkali-activated materials. Cem. Concr. Res. 2015, 78, 110–125. [Google Scholar] [CrossRef]
- Iyoda, T.; Asaga, K. On the hydration process of the slag–anhydrite–lime system: A discussion on the stoichiometry of hydrates and the development of strength. Adv. Cem. Res. 2015, 27, 610–618. [Google Scholar] [CrossRef]
- Yum, W.S.; Jeong, Y. Effects of CaCl2 on hydration and properties of lime (CaO)-activated slag/fly ash binder. Cem. Concr. Compos. 2017, 84, 111–123. [Google Scholar] [CrossRef]
- Yang, K.-H.; Cho, A.-R. Hydration products and strength development of calcium hydroxide-based alkali-activated slag mortars. Constr. Build. Mater. 2012, 29, 410–419. [Google Scholar] [CrossRef]
- Kim, M.S.; Jun, Y. Use of CaO as an activator for producing a price-competitive non-cement structural binder using ground granulated blast furnace slag. Cem. Concr. Res. 2013, 54, 208–214. [Google Scholar] [CrossRef]
- Shi, C.; Day, R.L. Pozzolanic reaction in the presence of chemical activators: Part II—Reaction products and mechanism. Cem. Concr. Res. 2000, 30, 607–613. [Google Scholar] [CrossRef]
- Li, H.; Farzadnia, N. The role of seawater in interaction of slag and silica fume with cement in low water-to-binder ratio pastes at the early age of hydration. Constr. Build. Mater. 2018, 185, 508–518. [Google Scholar] [CrossRef]
- Maes, M.; De Belie, N. Influence of chlorides on magnesium sulphate attack for mortars with Portland cement and slag based binders. Constr. Build. Mater. 2017, 155, 630–642. [Google Scholar] [CrossRef]
- Yuan, Q.; Shi, C. Chloride binding of cement-based materials subjected to external chloride environment—A review. Constr. Build. Mater. 2009, 23, 1–13. [Google Scholar] [CrossRef]
- Zhu, Q.; Jiang, L. Effect of chloride salt type on chloride binding behavior of concrete. Constr. Build. Mater. 2012, 37, 512–517. [Google Scholar] [CrossRef]
- Suryavanshi, A.K.; Scantlebury, J.D. The binding of chloride ions by sulphate resistant portland cement. Cem. Concr. Res. 1995, 25, 581–592. [Google Scholar] [CrossRef]
- Guerrero, A.; Goni, S. Effect of temperature on the durability of class C fly ash belite cement in simulated radioactive liquid waste: Synergy of chloride and sulphate ions. J. Hazard. Mater. 2009, 165, 903–908. [Google Scholar] [CrossRef] [PubMed] [Green Version]
- Weerdt, K.D.; Orsáková, D. The impact of sulphate and magnesium on chloride binding in Portland cement paste. Cem. Concr. Res. 2014, 65, 30–40. [Google Scholar] [CrossRef]
- Zang, W.; Guo, L. The interaction between chloride ion and sulfate ion doped in cement paste. Mater. Rep. 2019, 33, 1317–1321. [Google Scholar]
- Method of Testing Cements–Determination of Strength; GB/T 17671-1999; General Administration of Quality Supervision, Inspection and Quarantine of the People’s Republic of China: Beijing, China, 1999. (In Chinese)
- Guo, W.Y.; Zheng, M.R. Research on the proportion of inorganic binder stabilize materials with soda residue. Key Eng. Mater. 2015, 629–630, 481–486. [Google Scholar] [CrossRef]
- ASTM International. Standard Test Methods for Apparent Porosity, Water Absorption, Apparent Specific Gravity, and Bulk Density of Burned Refractory Brick and Shapes by Boiling Water; ASTM C20-2000(2005); ASTM International: West Conshohocken, PA, USA, 2010. [Google Scholar]
- Methods for Testing Uniformity of Concrete Admixture; GB/T 8077-2012; General Administration of Quality Supervision, Inspection and Quarantine of the People’s Republic of China: Beijing, China, 2013. (In Chinese)
- Huang, G.; Ji, Y. Improving strength of calcinated coal gangue geopolymer mortars via increasing calcium content. Constr. Build. Mater. 2018, 166, 760–768. [Google Scholar] [CrossRef]
- Qiao, C.; Suraneni, P. Chloride binding of cement pastes with fly ash exposed to CaCl2 solutions at 5 and 23 °C. Cem. Concr. Compos. 2019, 97, 43–53. [Google Scholar] [CrossRef]
- Wang, J.; Liu, E. Multiscale investigations on hydration mechanisms in seawater OPC paste. Constr. Build. Mater. 2018, 191, 891–903. [Google Scholar] [CrossRef]
- Zhang, J.; Li, S. Investigation the synergistic effects in quaternary binder containing red mud, blast furnace slag, steel slag and flue gas desulfurization gypsum based on artificial neural networks. J. Clean. Prod. 2020, 273, 122972. [Google Scholar] [CrossRef]
- Xu, D.; Ni, W. Preparation of clinker-free concrete by using soda residue composite cementitious material. J. Harbin Inst. Technol. 2020, 52, 151–160. (In Chinese) [Google Scholar]
- Krystek, M.; Pakulski, D. High-performance graphene-based cementitious composites. Adv. Sci. 2019, 6, 1801195. [Google Scholar] [CrossRef] [Green Version]
- Hanna, R.A.; Barrie, P.J. Solid state 29 Si and 27 Al NMR and FTIR study of cement pastes containing industrial wastes and organics. Cem. Concr. Res. 1995, 25, 1435–1444. [Google Scholar] [CrossRef]
- Luoa, R.; Caib, Y. Study of chloride binding and diffusion in GGBS concrete. Cem. Concr. Res. 2003, 33, 1–7. [Google Scholar] [CrossRef]
- Birnin-Yauri, U.A.; Glasser, F.P. Friedel’s salt, Ca2Al(OH)6(Cl,OH)⋅2H2O: Its solid solutions and their role in chloride binding. Cem. Concr. Res. 1998, 28, 1713–1723. [Google Scholar] [CrossRef]
- Ipavec, A.; Vuk, T. Chloride binding into hydrated blended cements: The influence of limestone and alkalinity. Cem. Concr. Res. 2013, 48, 74–85. [Google Scholar] [CrossRef]
- Dhir, R.K.; El-Mohr, M.A.K. Chloride binding in GGBS concrete. Cem. Concr. Res. 1996, 26, 1767–1773. [Google Scholar] [CrossRef]
- Common Portland Cement; GB 175-2007; General Administration of Quality Supervision, Inspection and Quarantine of the People’s Republic of China: Beijing, China, 2007. (In Chinese)
- Dong, X.; Wen, N. Ammonia-soda residue and metallurgical slags from iron and steel industries as cementitious materials for clinker-Free concretes. J. Clean. Prod. 2021, 307, 127262. [Google Scholar]


| Components | SR | Components | GGBFS |
|---|---|---|---|
| CaCO3 | 39.6 | CaO | 41.4 |
| CaCl2 | 13.4 | SiO2 | 28.1 |
| Ca(OH)2 | 11.2 | Al2O3 | 14.8 |
| CaSO4 | 9.8 | MgO | 9.5 |
| MgO | 7.0 | Fe2O3 | 1.4 |
| SiO2 | 6.5 | TiO2 | 1.1 |
| NaCl | 6.0 | Na2O | 0.6 |
| Al2O3 | 2.0 | K2O | 0.6 |
| Others | 4.5 | Others | 2.5 |
| Physical Properties | SR | - | GGBFS |
| Color | grayish | - | white |
| BET surface area (m2/g) | 409 | - | 450 |
| Specific gravity | 2.25 | - | 2.87 |
Publisher’s Note: MDPI stays neutral with regard to jurisdictional claims in published maps and institutional affiliations. |
© 2021 by the authors. Licensee MDPI, Basel, Switzerland. This article is an open access article distributed under the terms and conditions of the Creative Commons Attribution (CC BY) license (https://creativecommons.org/licenses/by/4.0/).
Share and Cite
Lin, Y.; Xu, D.; Zhao, X. Properties and Hydration Mechanism of Soda Residue-Activated Ground Granulated Blast Furnace Slag Cementitious Materials. Materials 2021, 14, 2883. https://doi.org/10.3390/ma14112883
Lin Y, Xu D, Zhao X. Properties and Hydration Mechanism of Soda Residue-Activated Ground Granulated Blast Furnace Slag Cementitious Materials. Materials. 2021; 14(11):2883. https://doi.org/10.3390/ma14112883
Chicago/Turabian StyleLin, Yonghui, Dongqiang Xu, and Xianhui Zhao. 2021. "Properties and Hydration Mechanism of Soda Residue-Activated Ground Granulated Blast Furnace Slag Cementitious Materials" Materials 14, no. 11: 2883. https://doi.org/10.3390/ma14112883