X-ray Computed Tomography for the Development of Ballistic Composite

 , , , and
Abstract
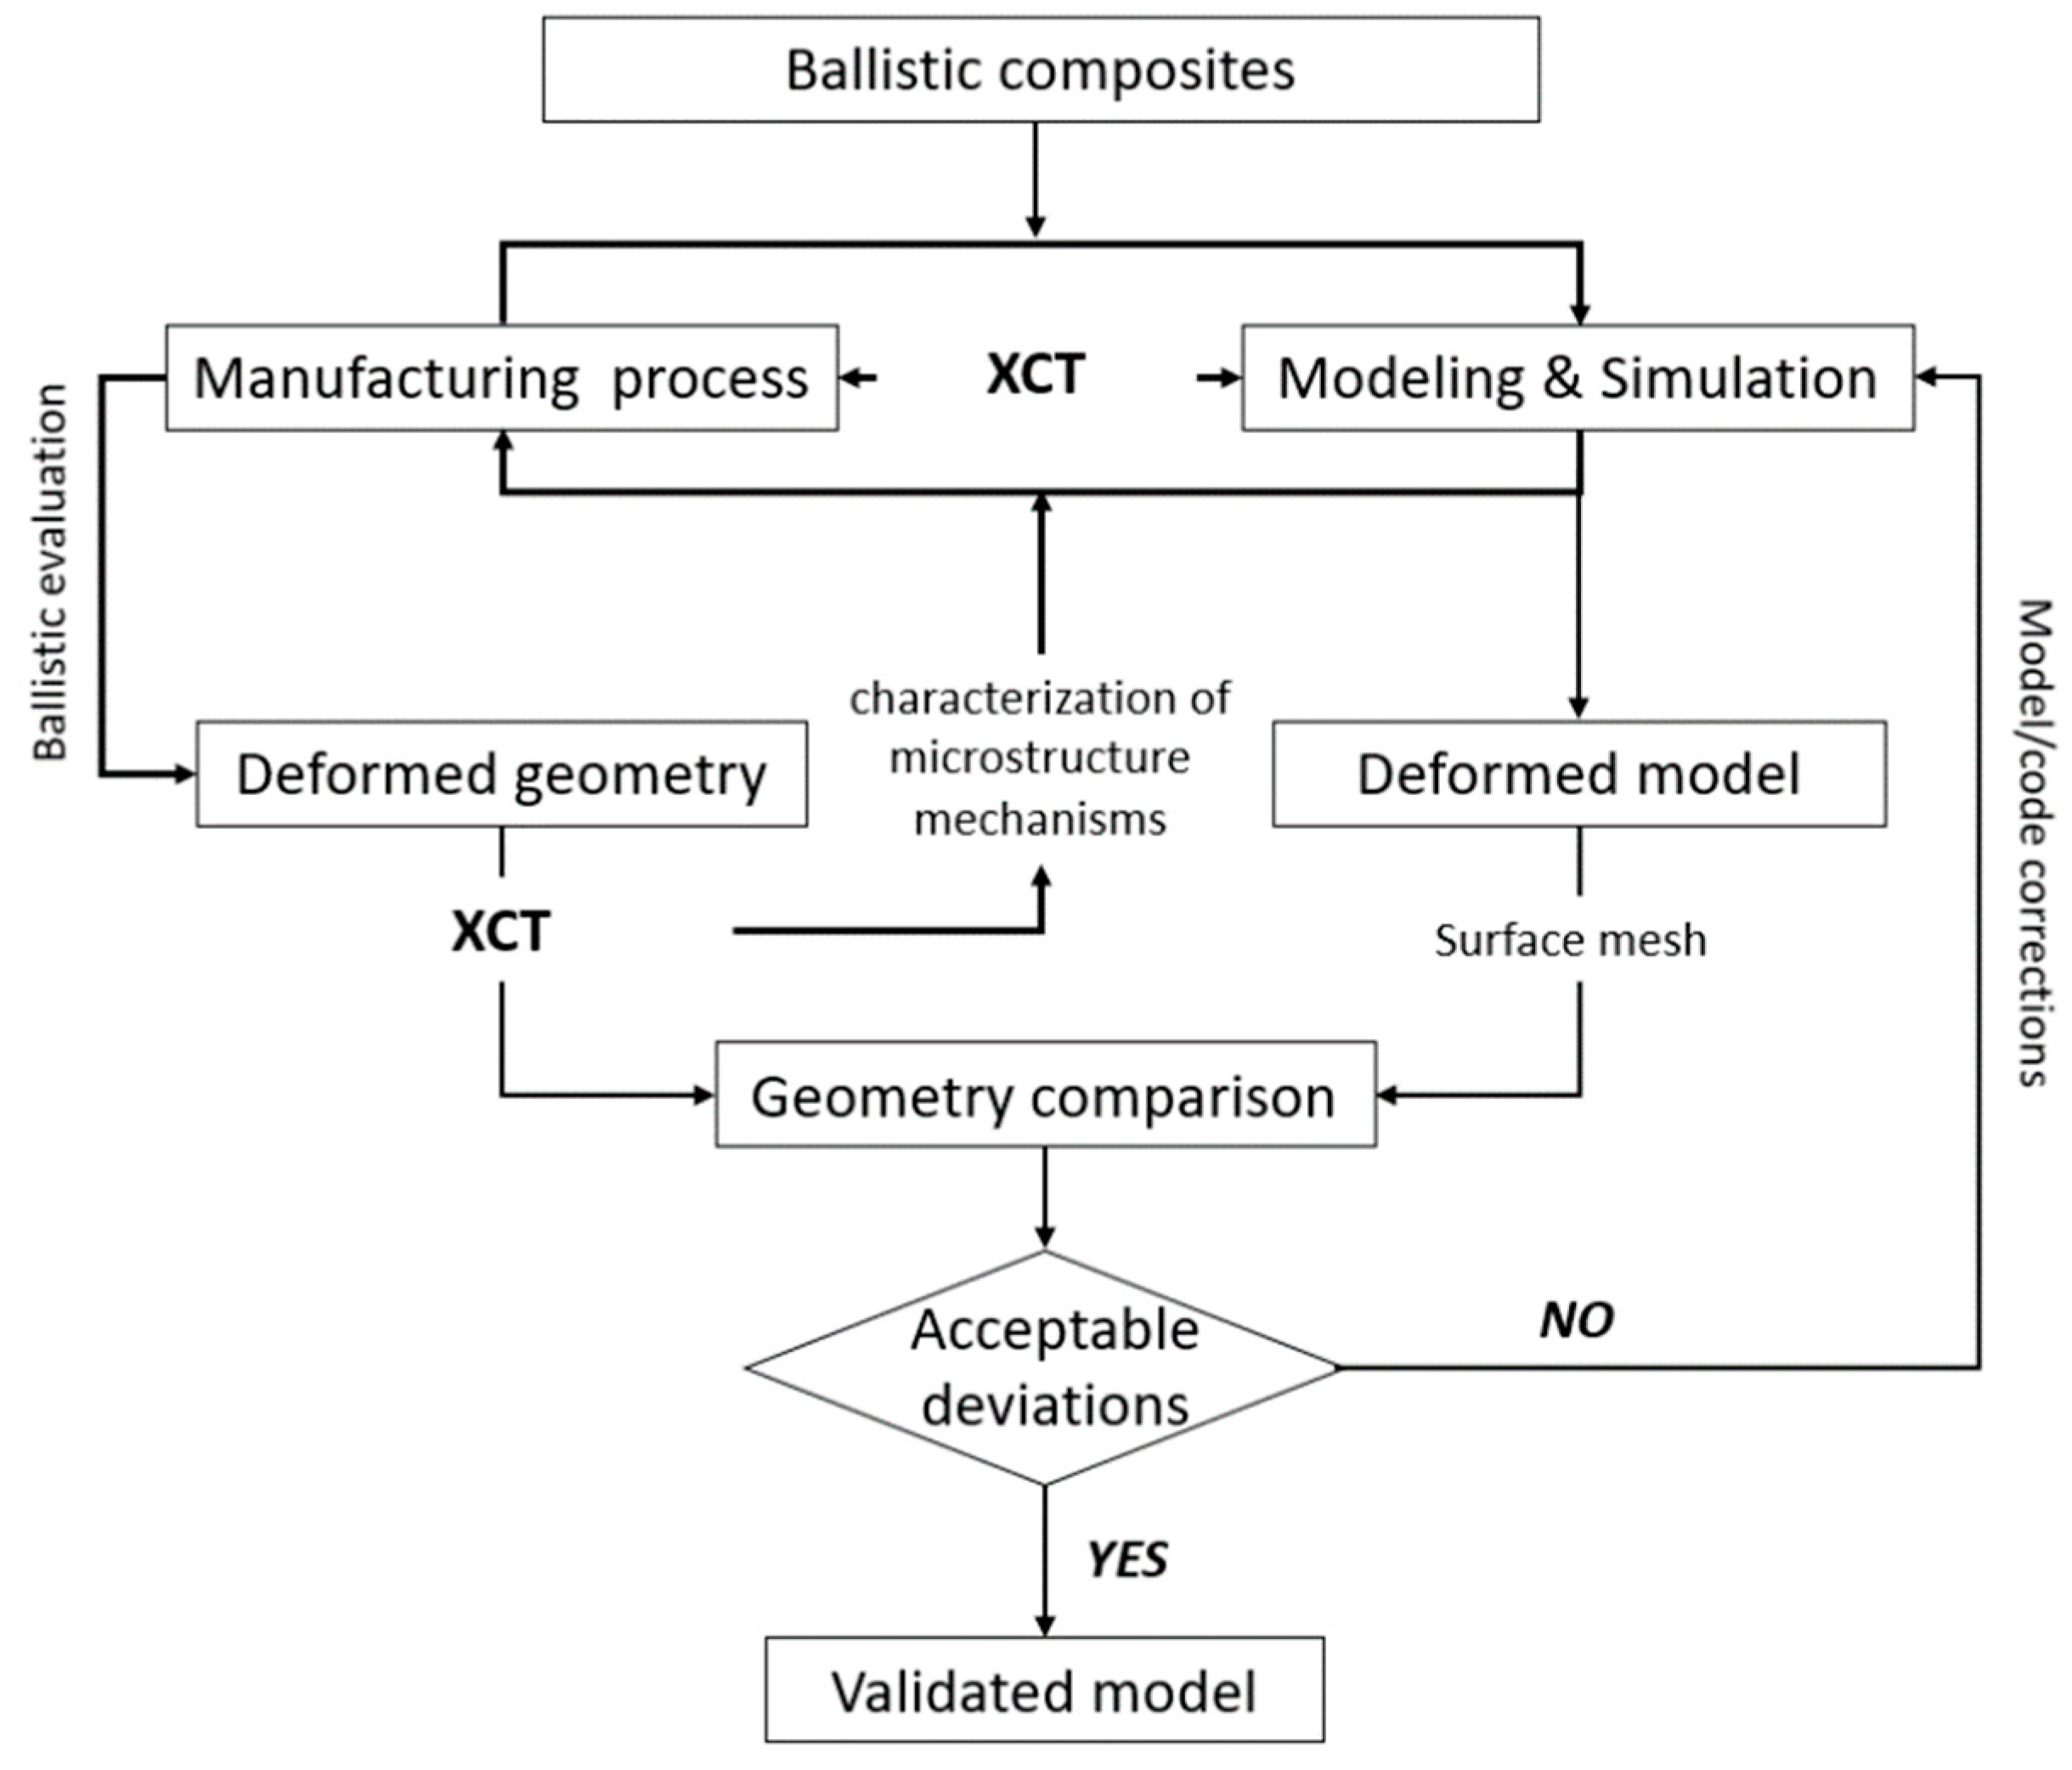
:1. Introduction
2. Materials and Methods
2.1. Sample Preparation
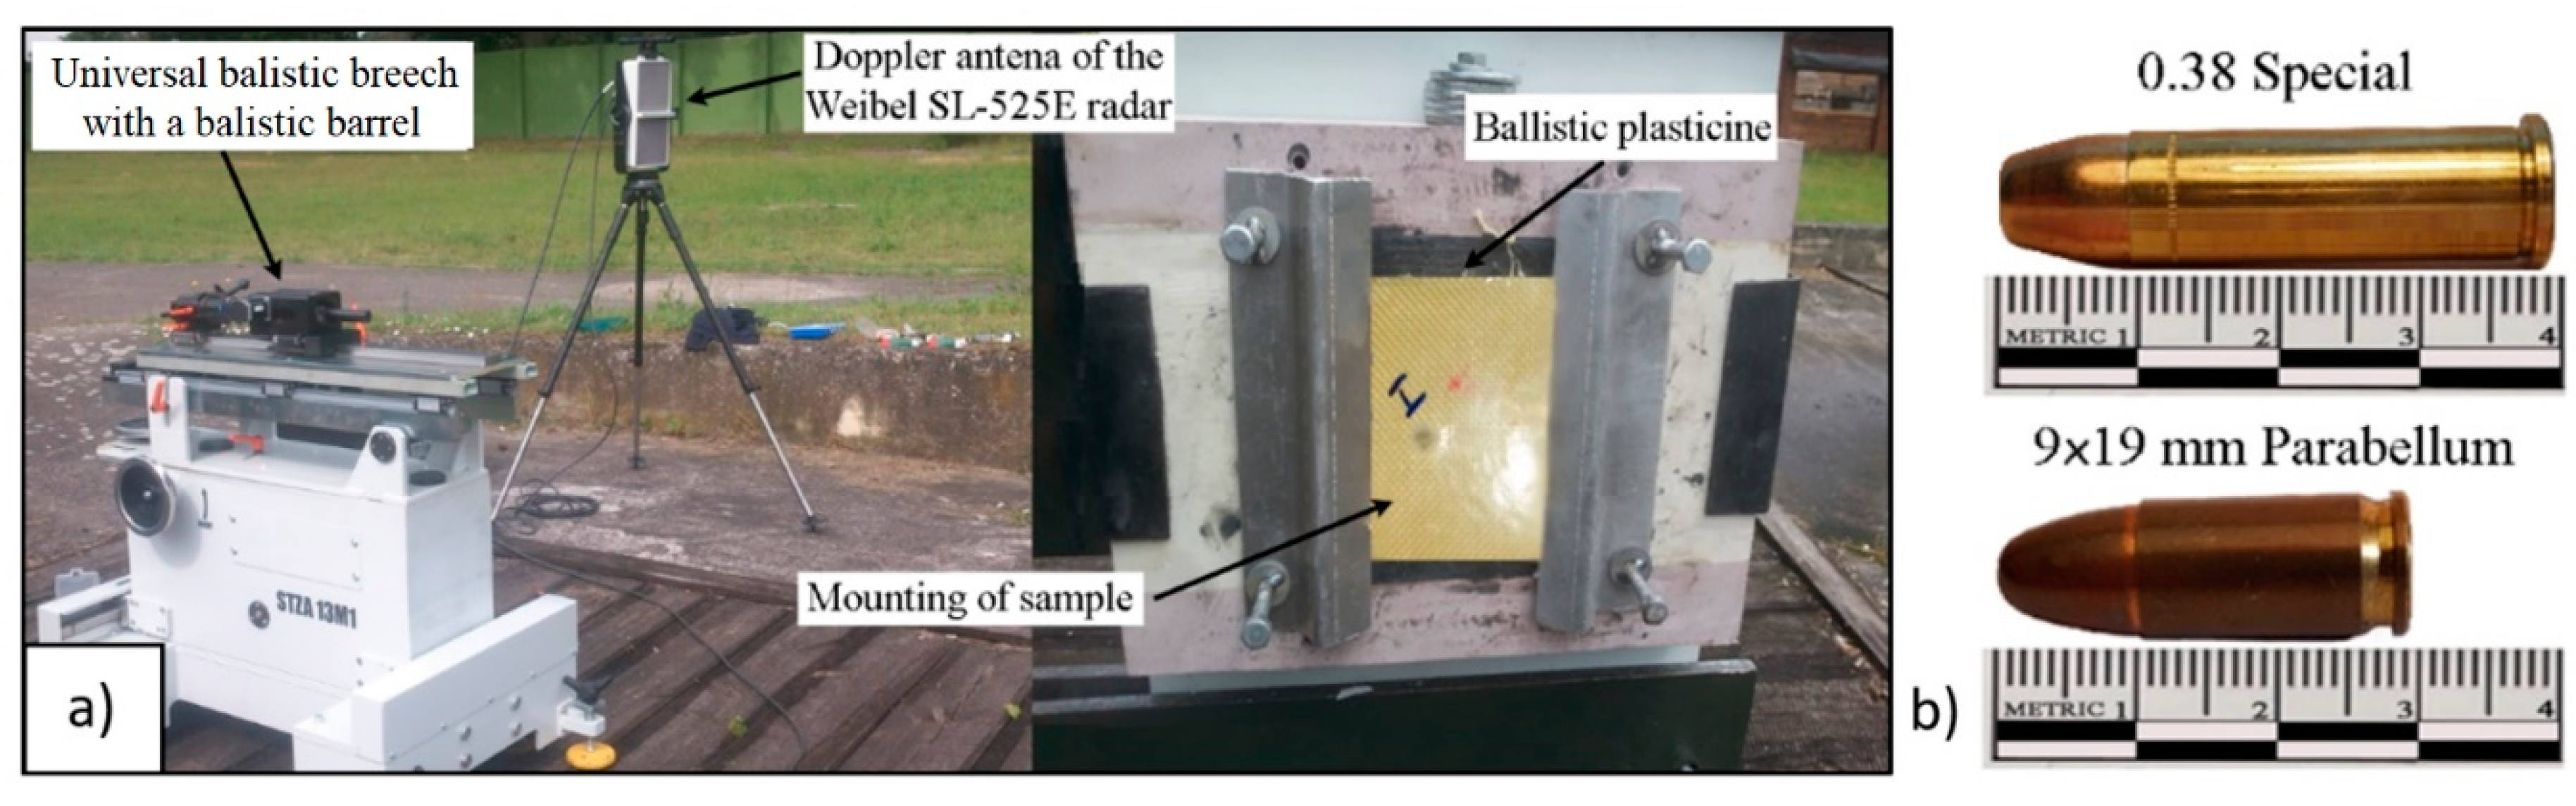
2.2. Ballistic Tests
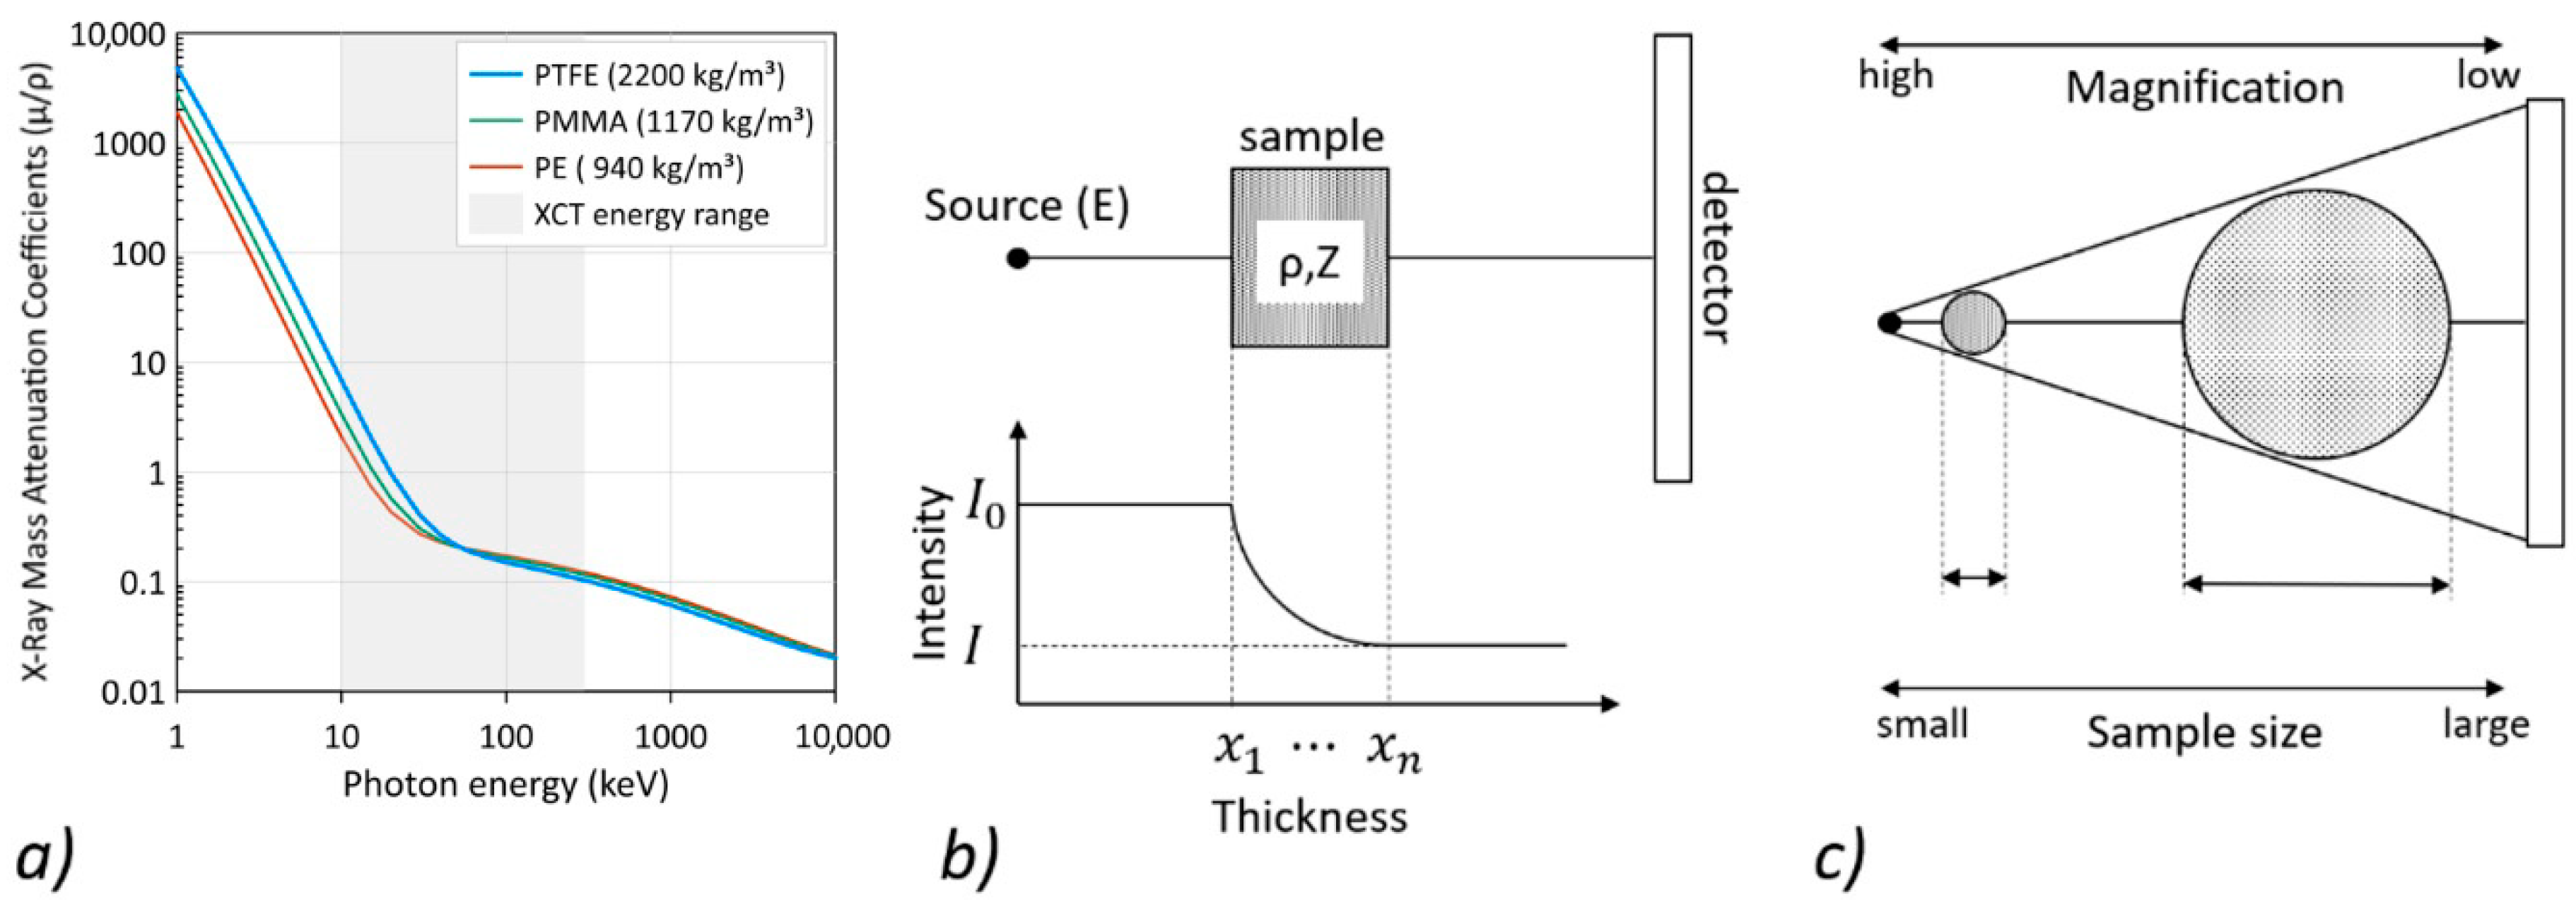
2.3. X-ray Computed Tomography
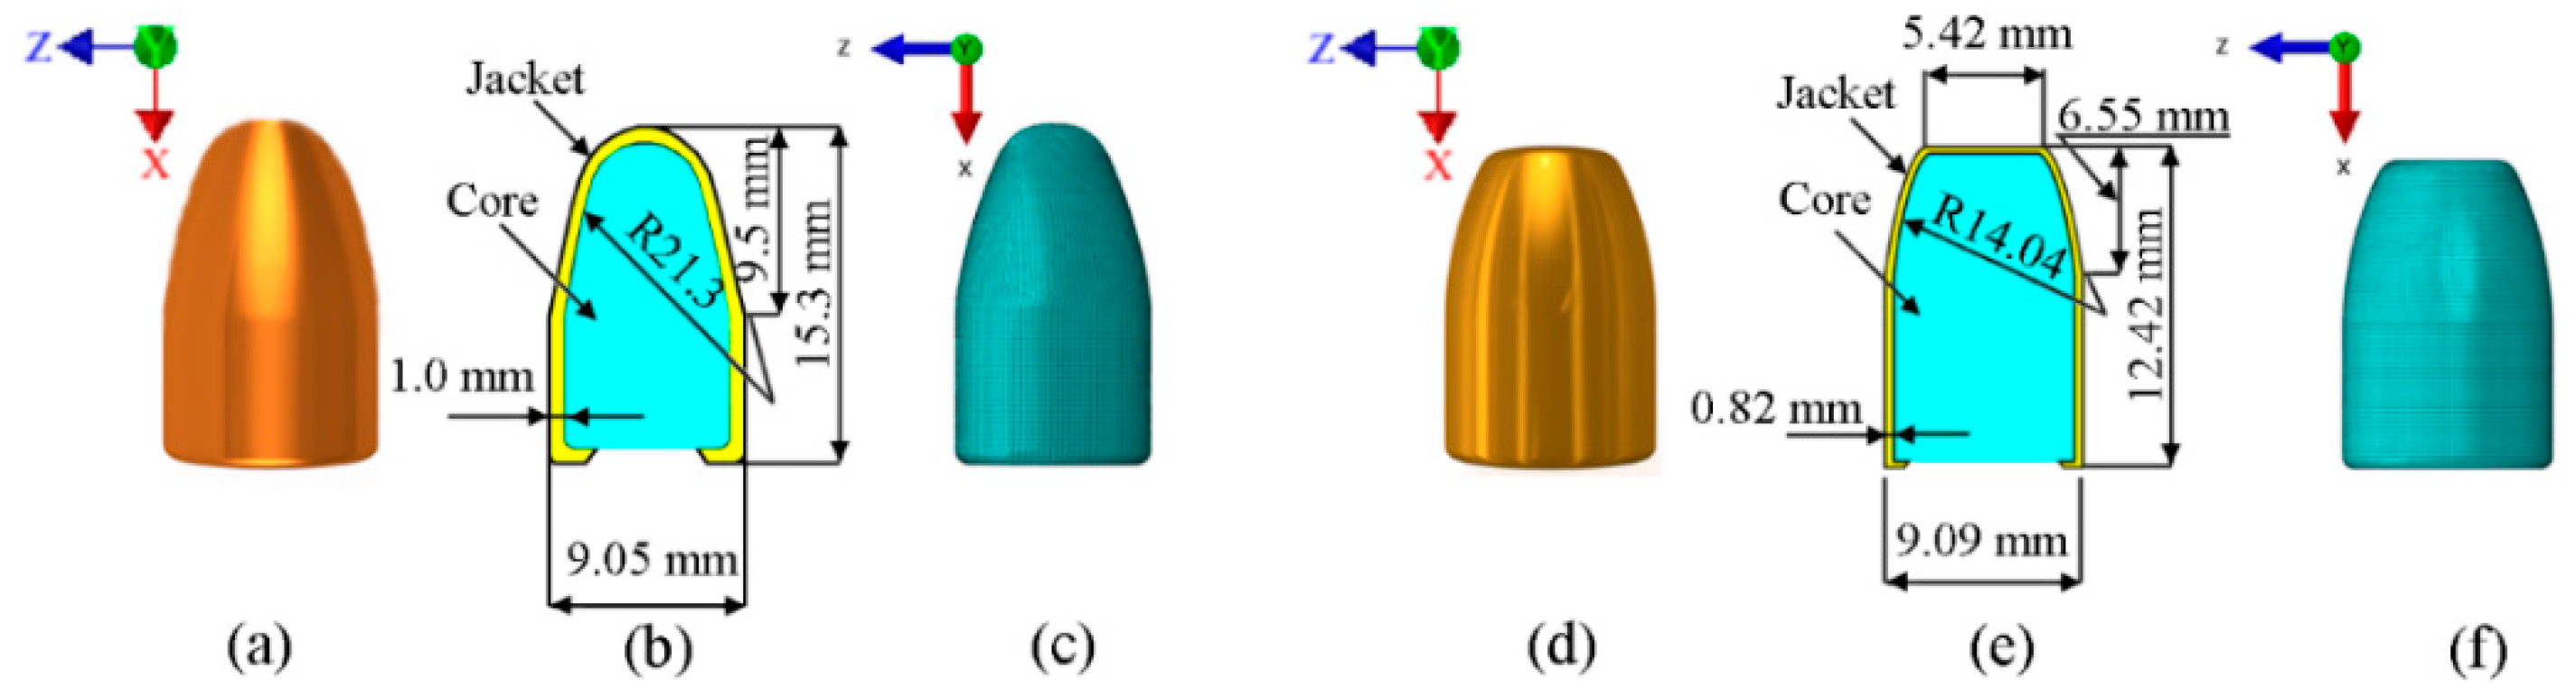
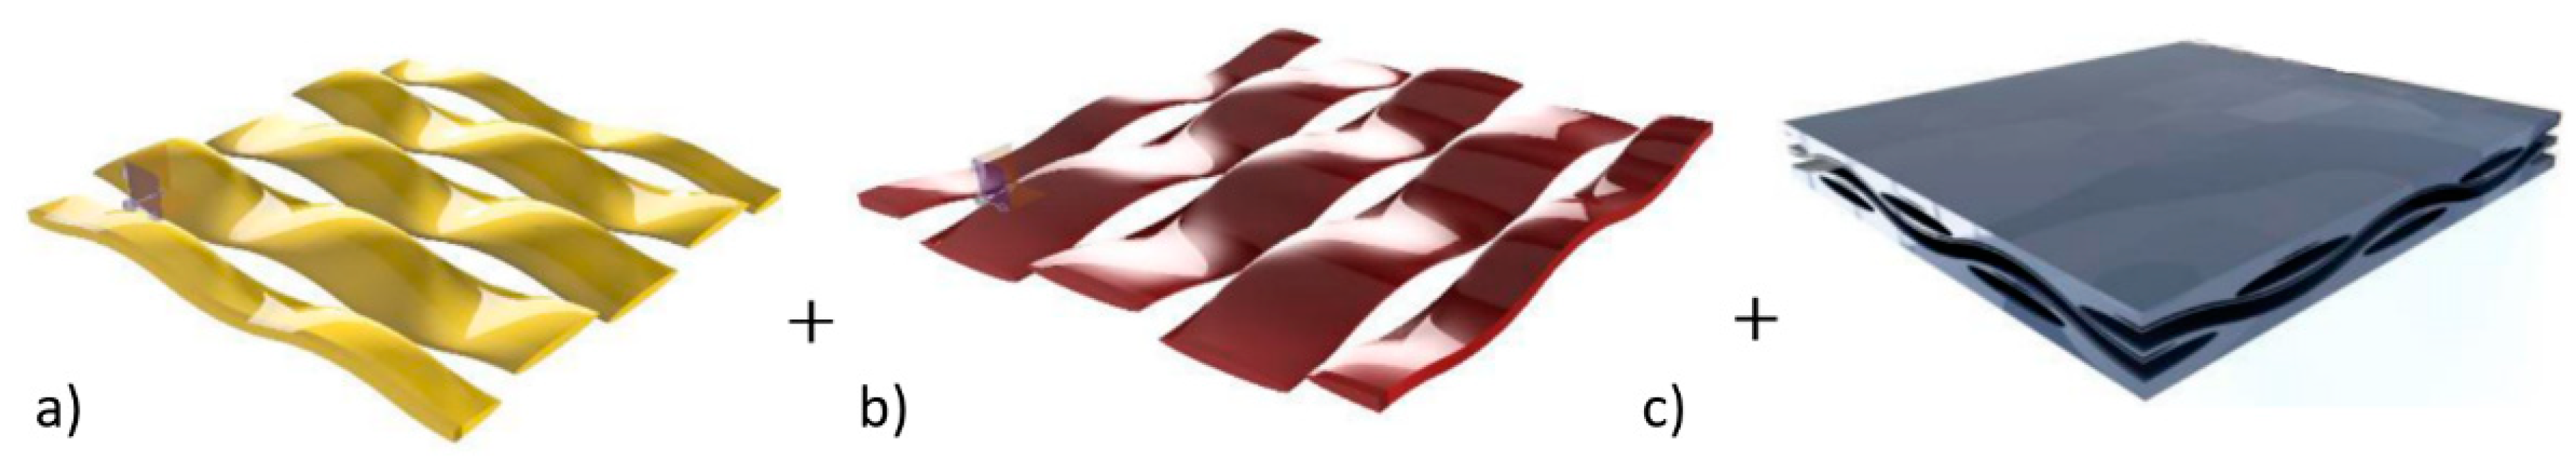
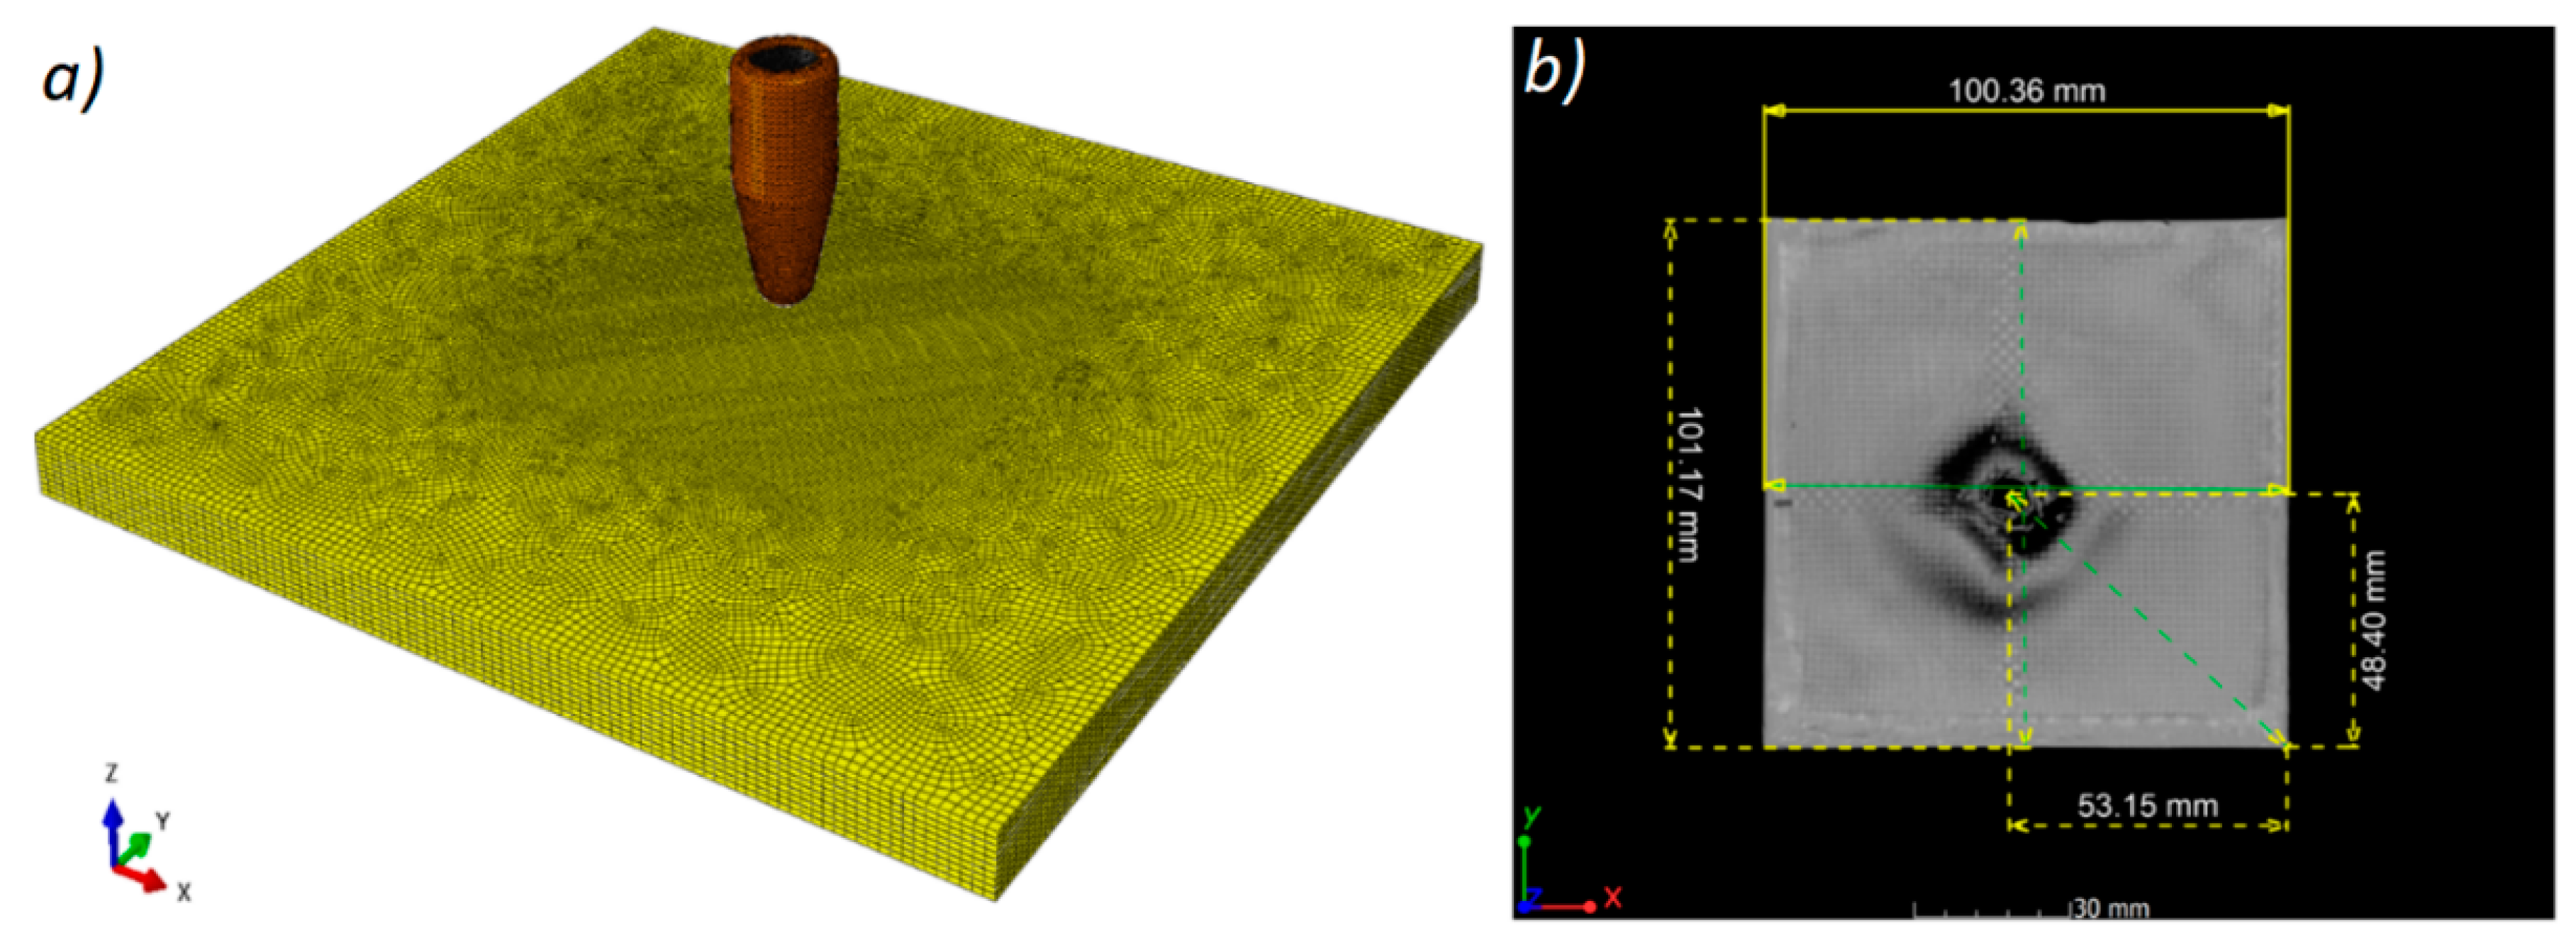
2.4. Numerical Simulation
3. Results
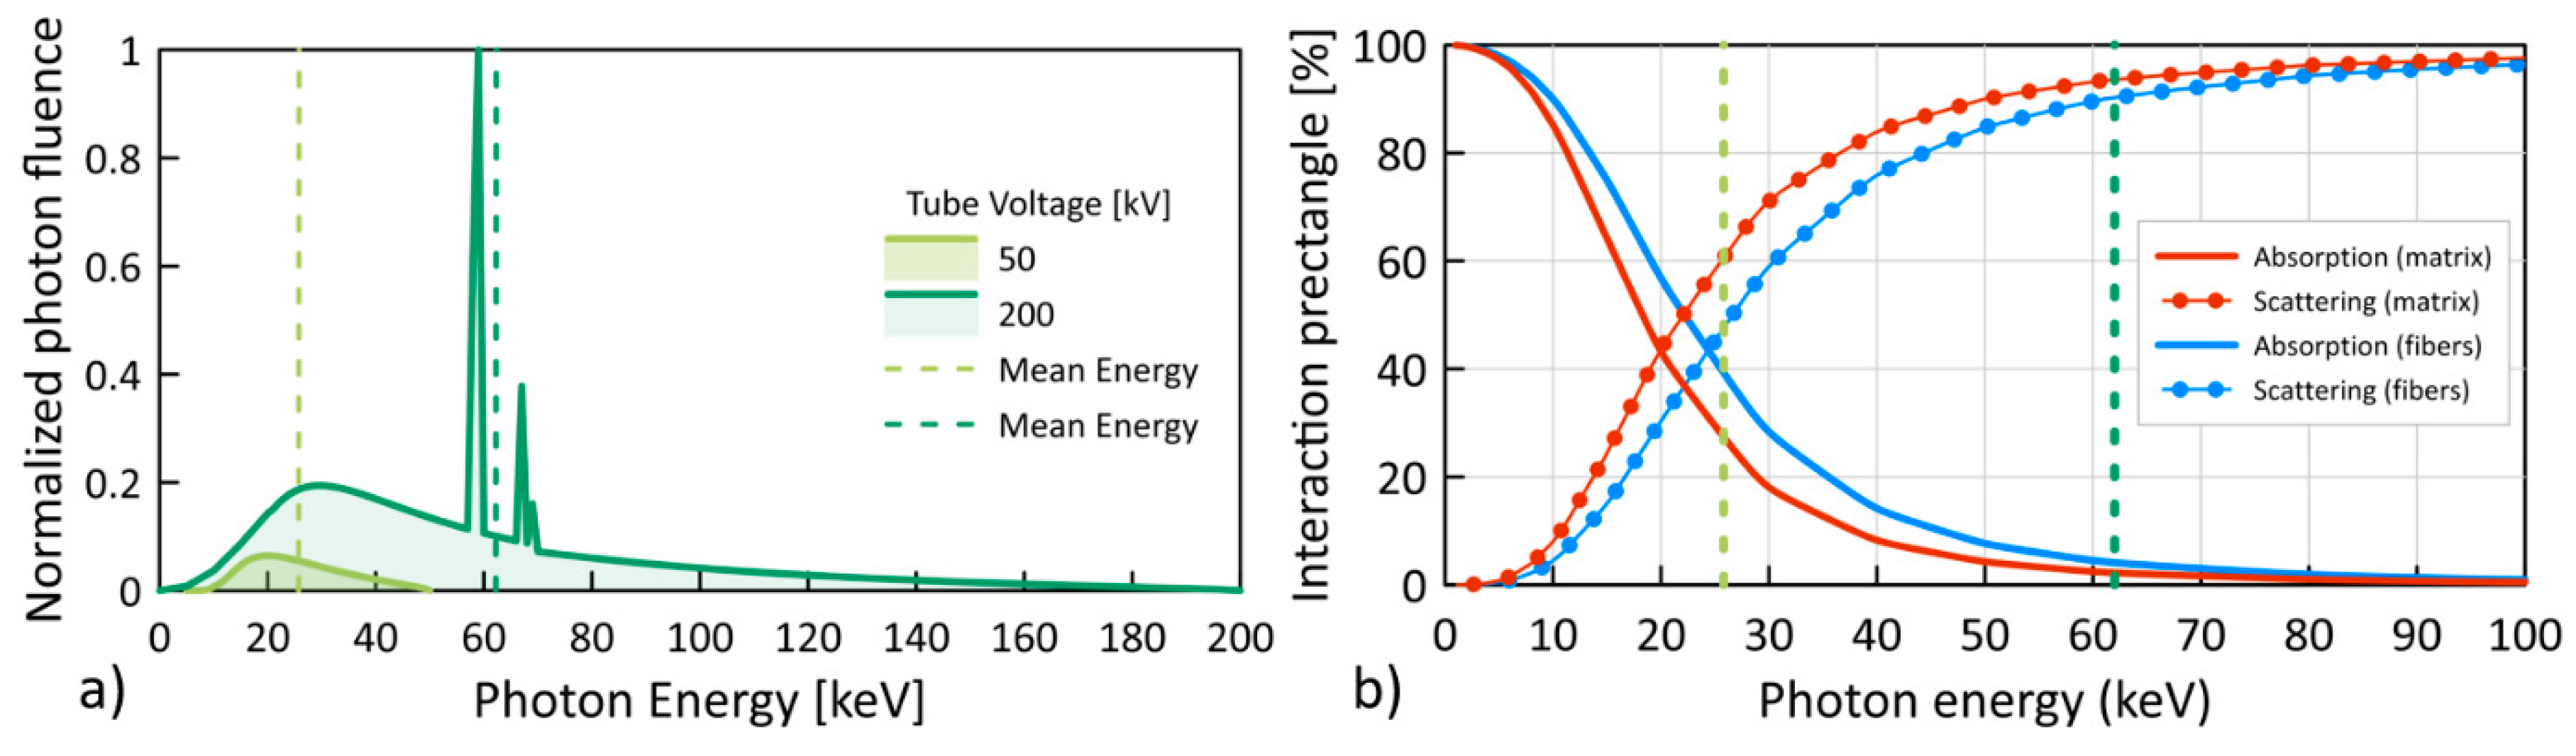
3.1. Energy-Dependent XCT Contrast
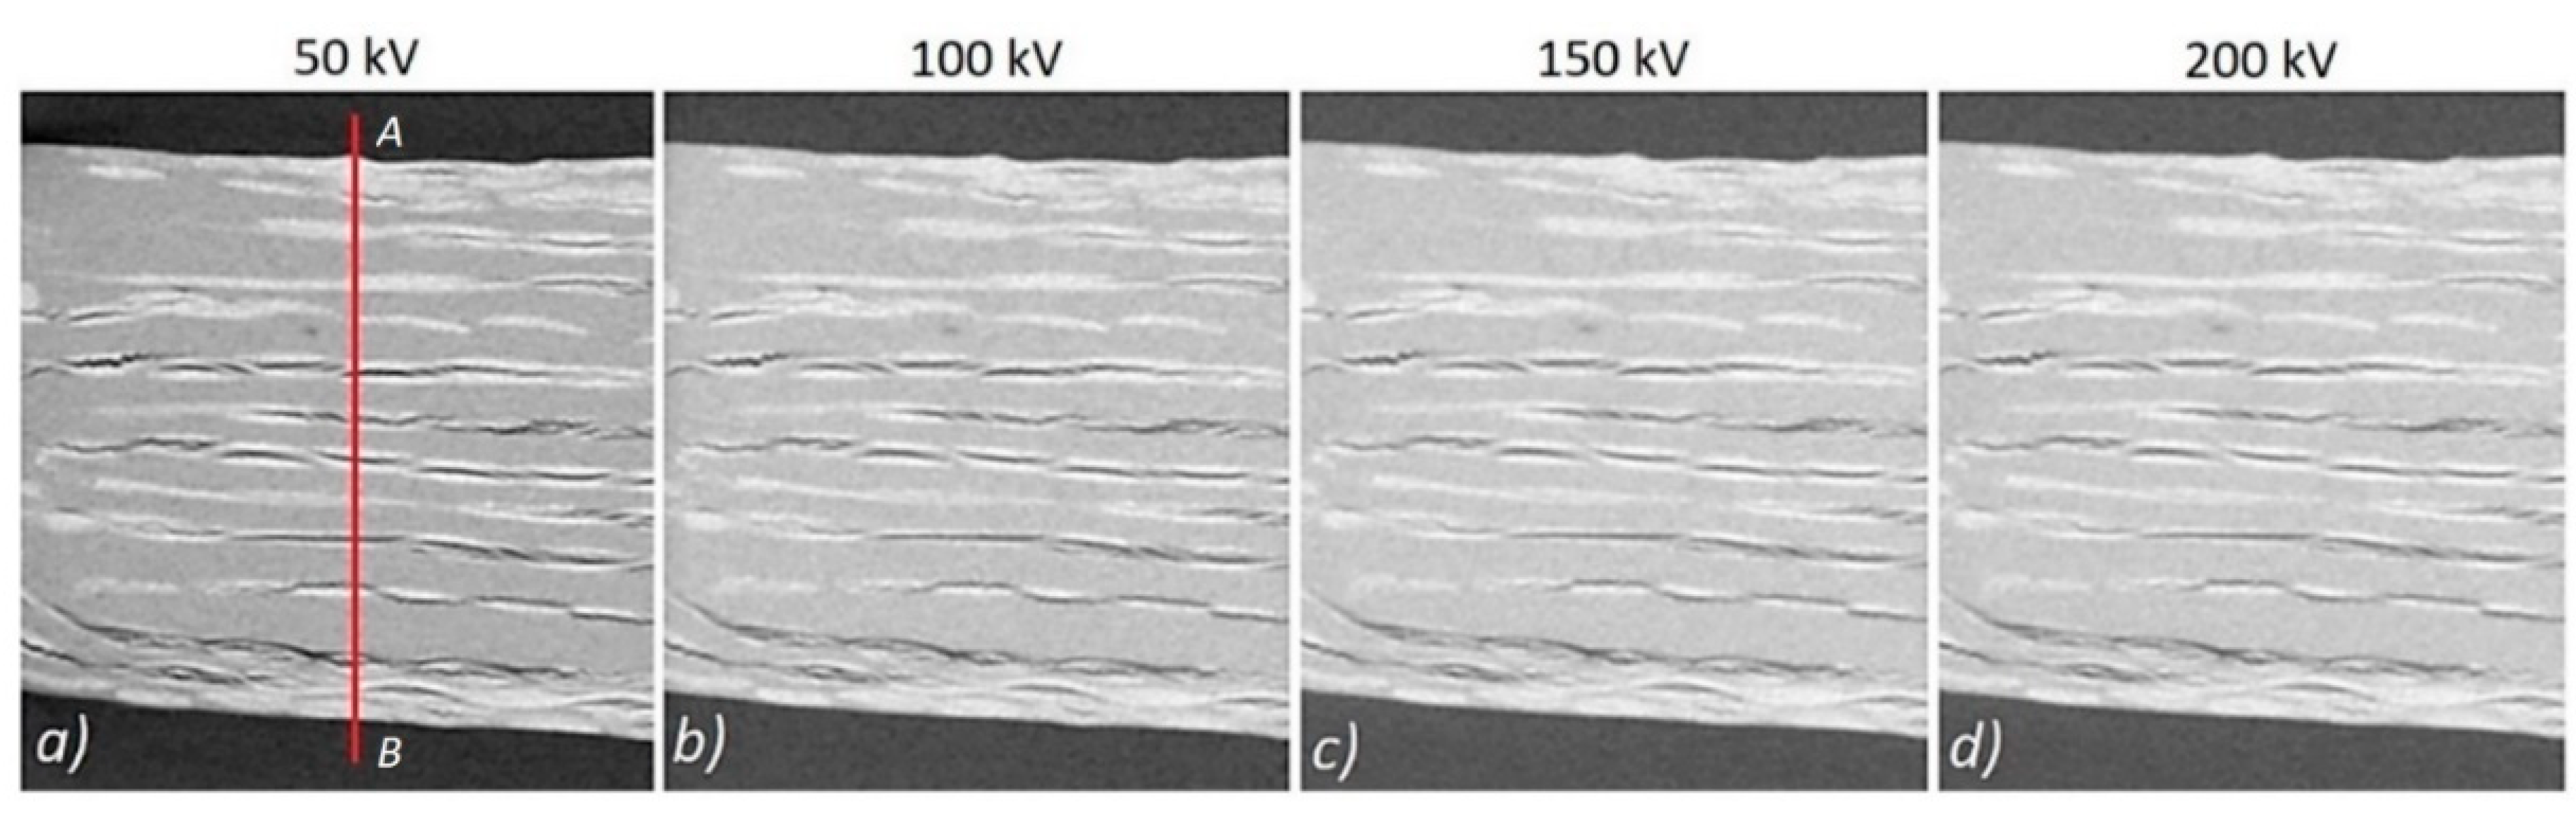
3.2. XCT Analysis of PMCs in Mesoscale
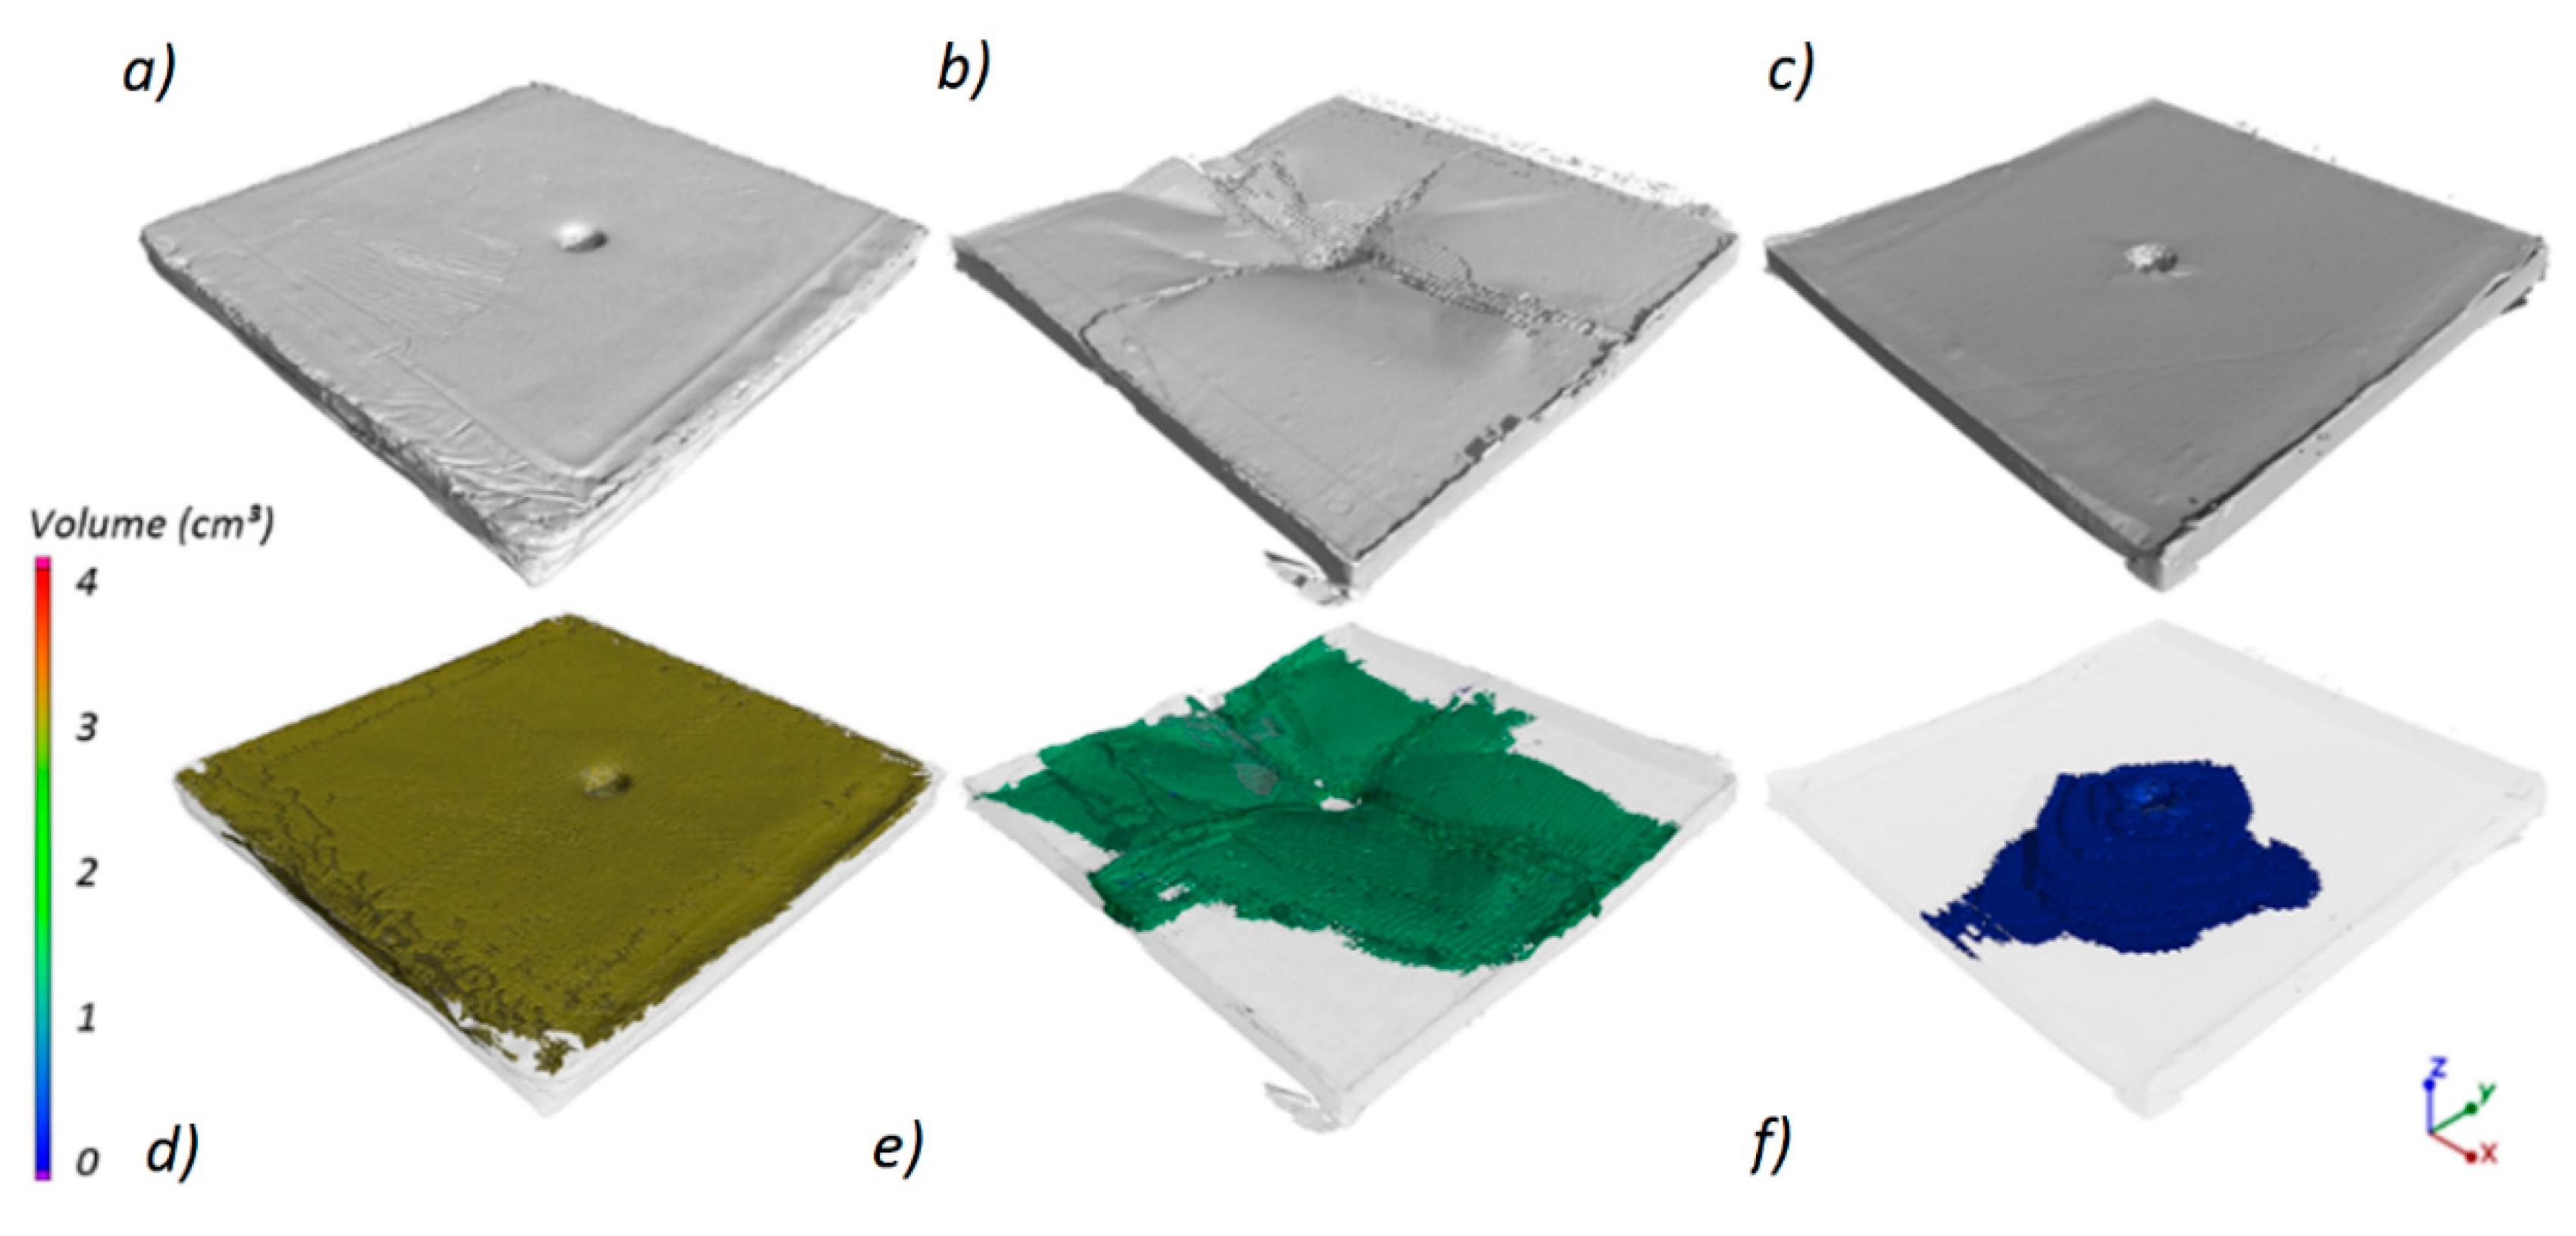
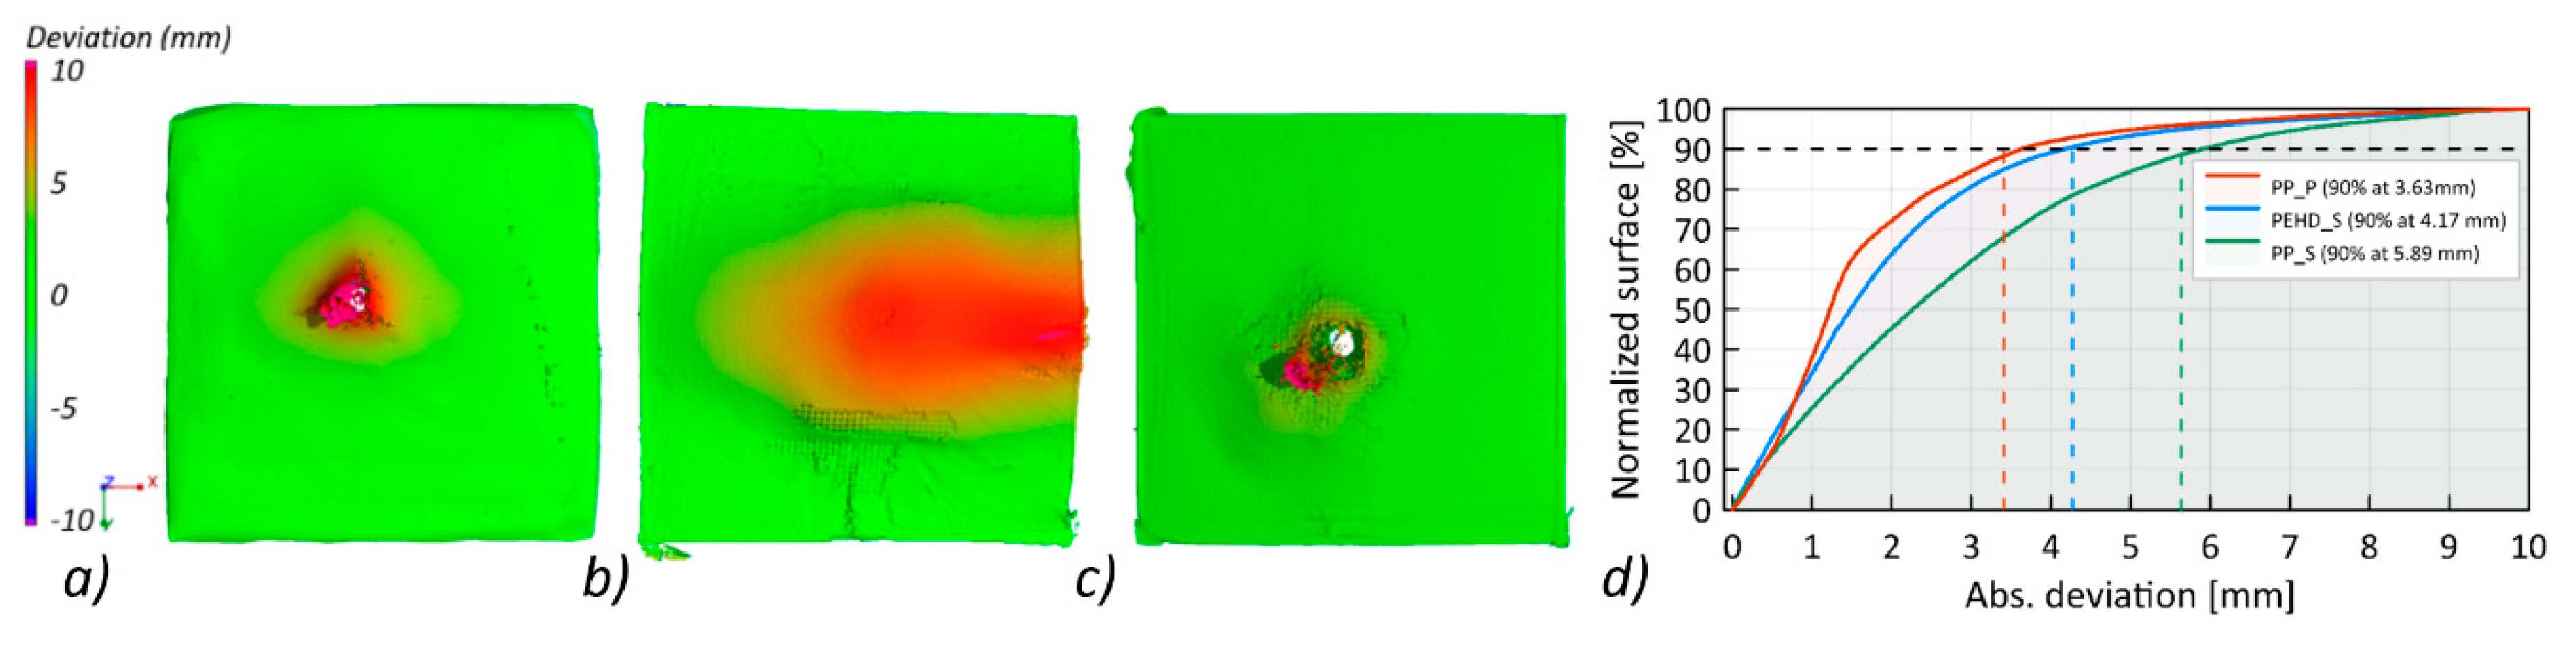
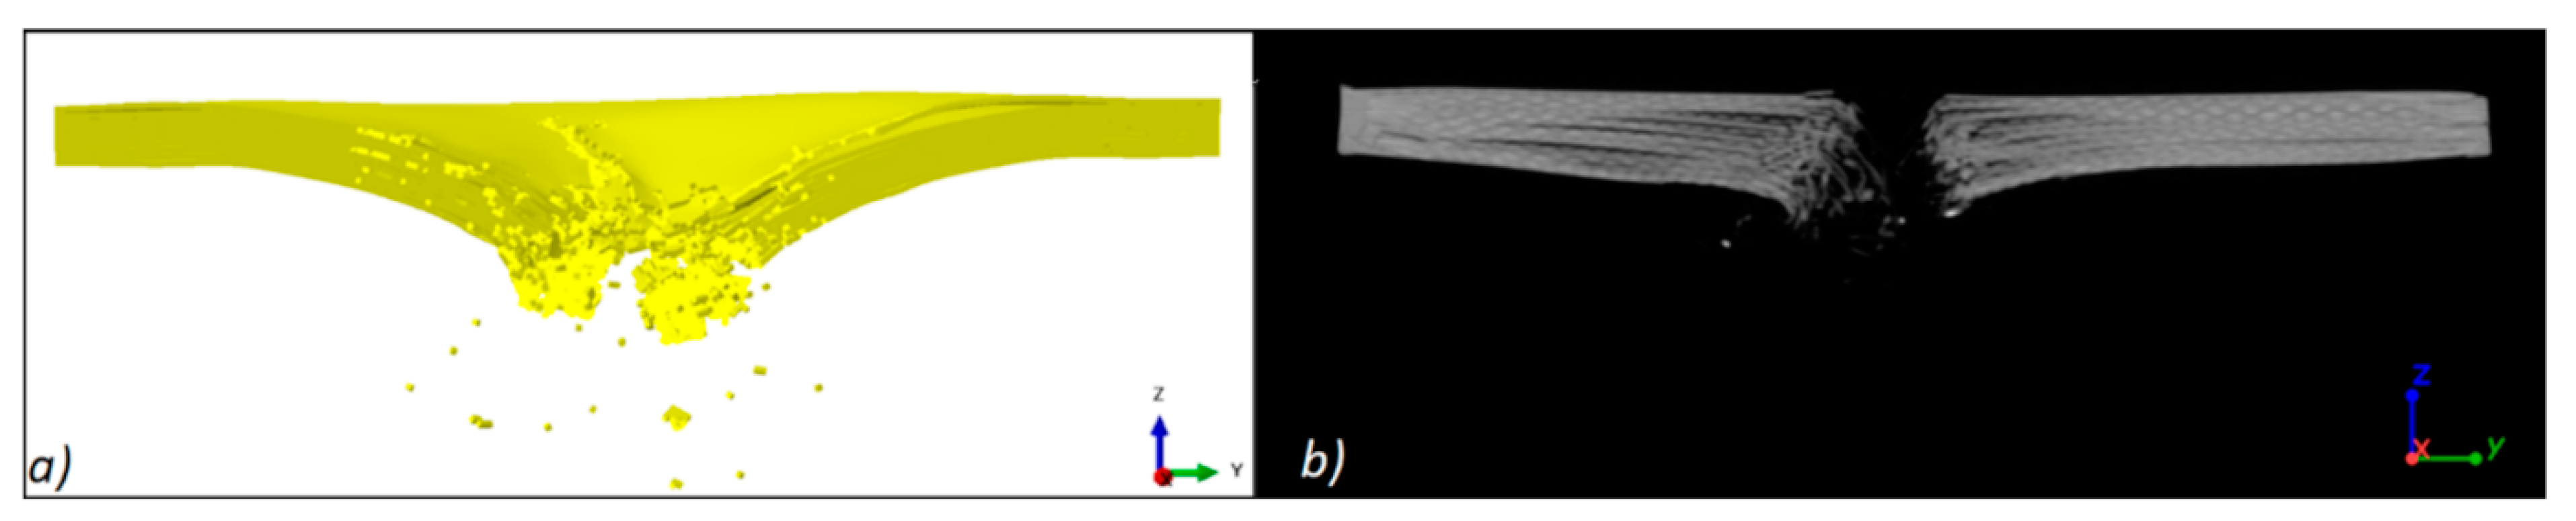
3.3. Ballistic Tests-XCT Evaluation of Panel Damage
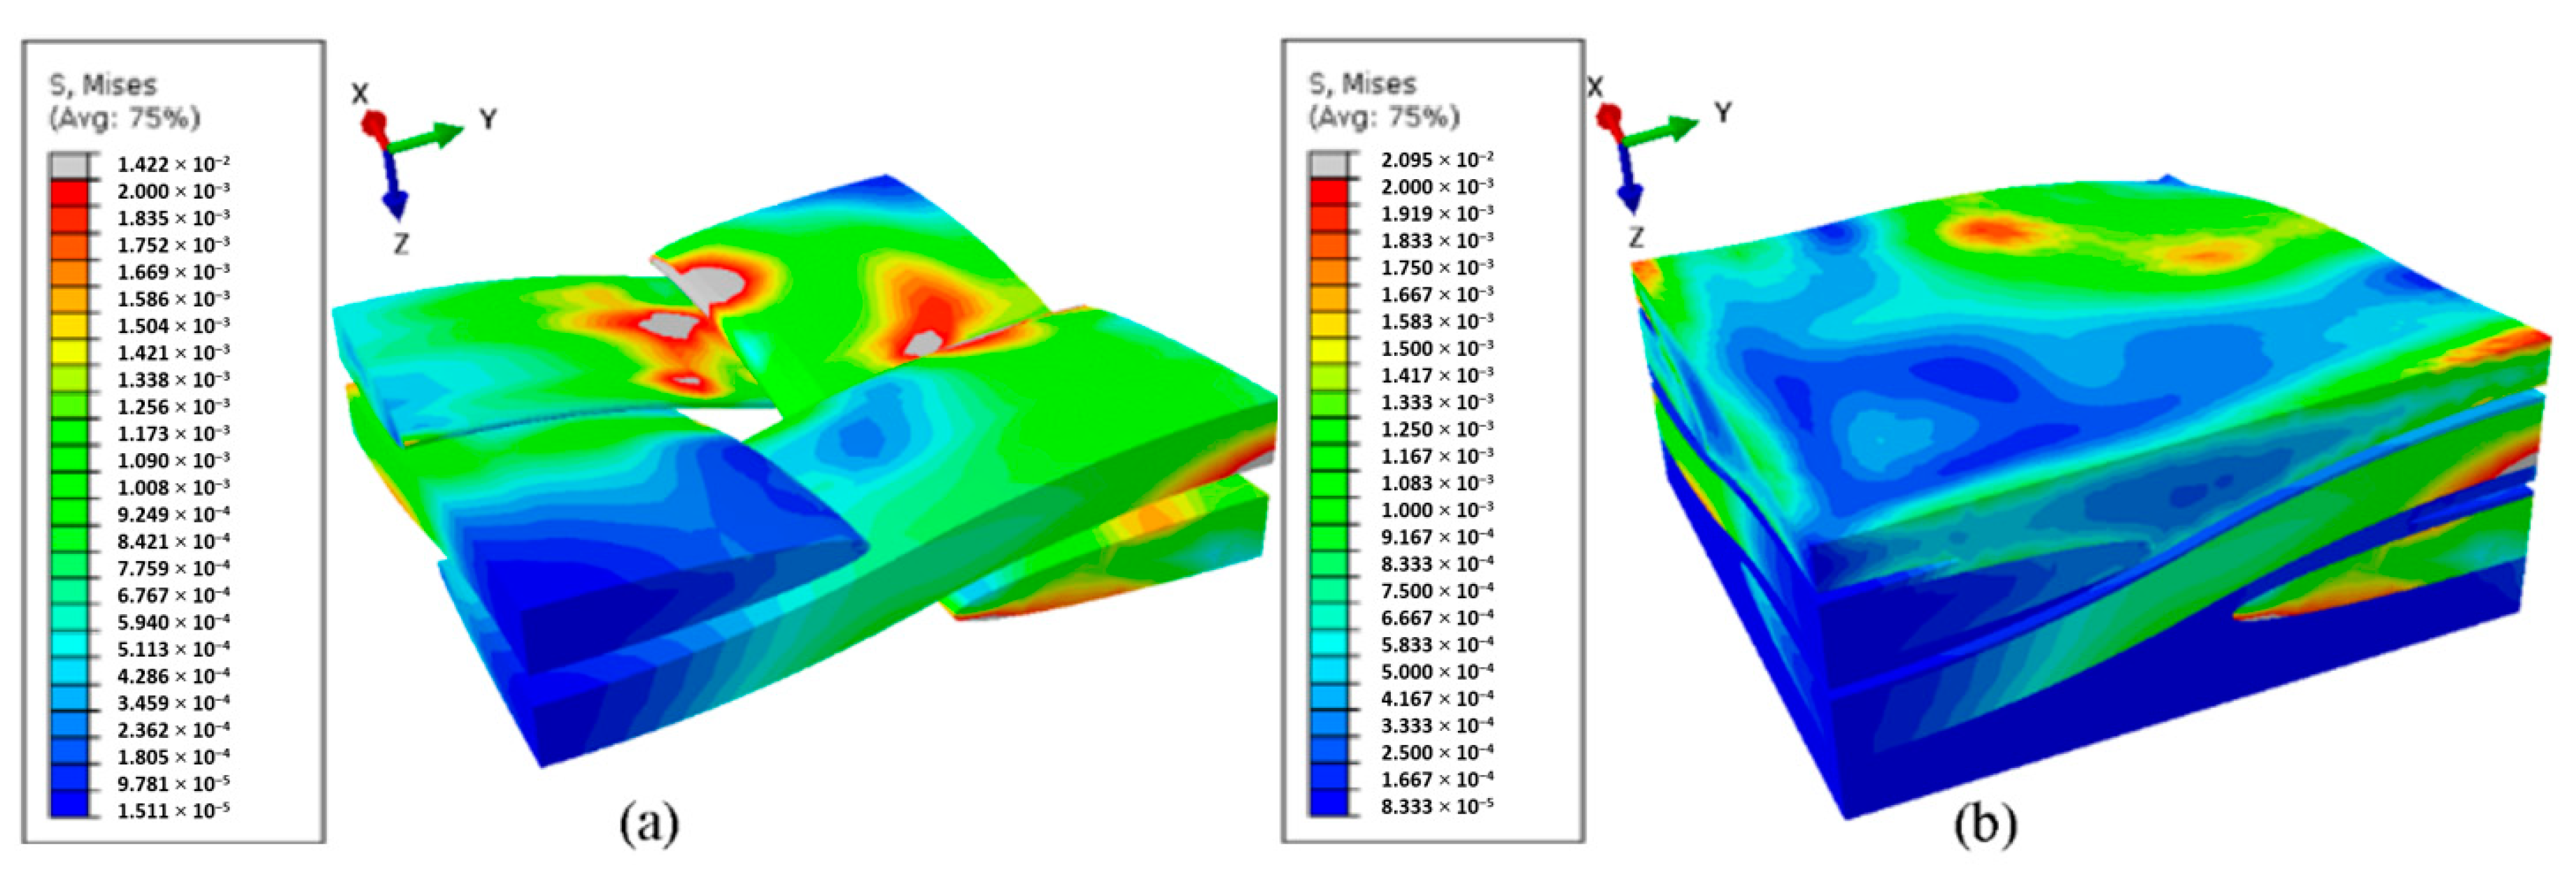
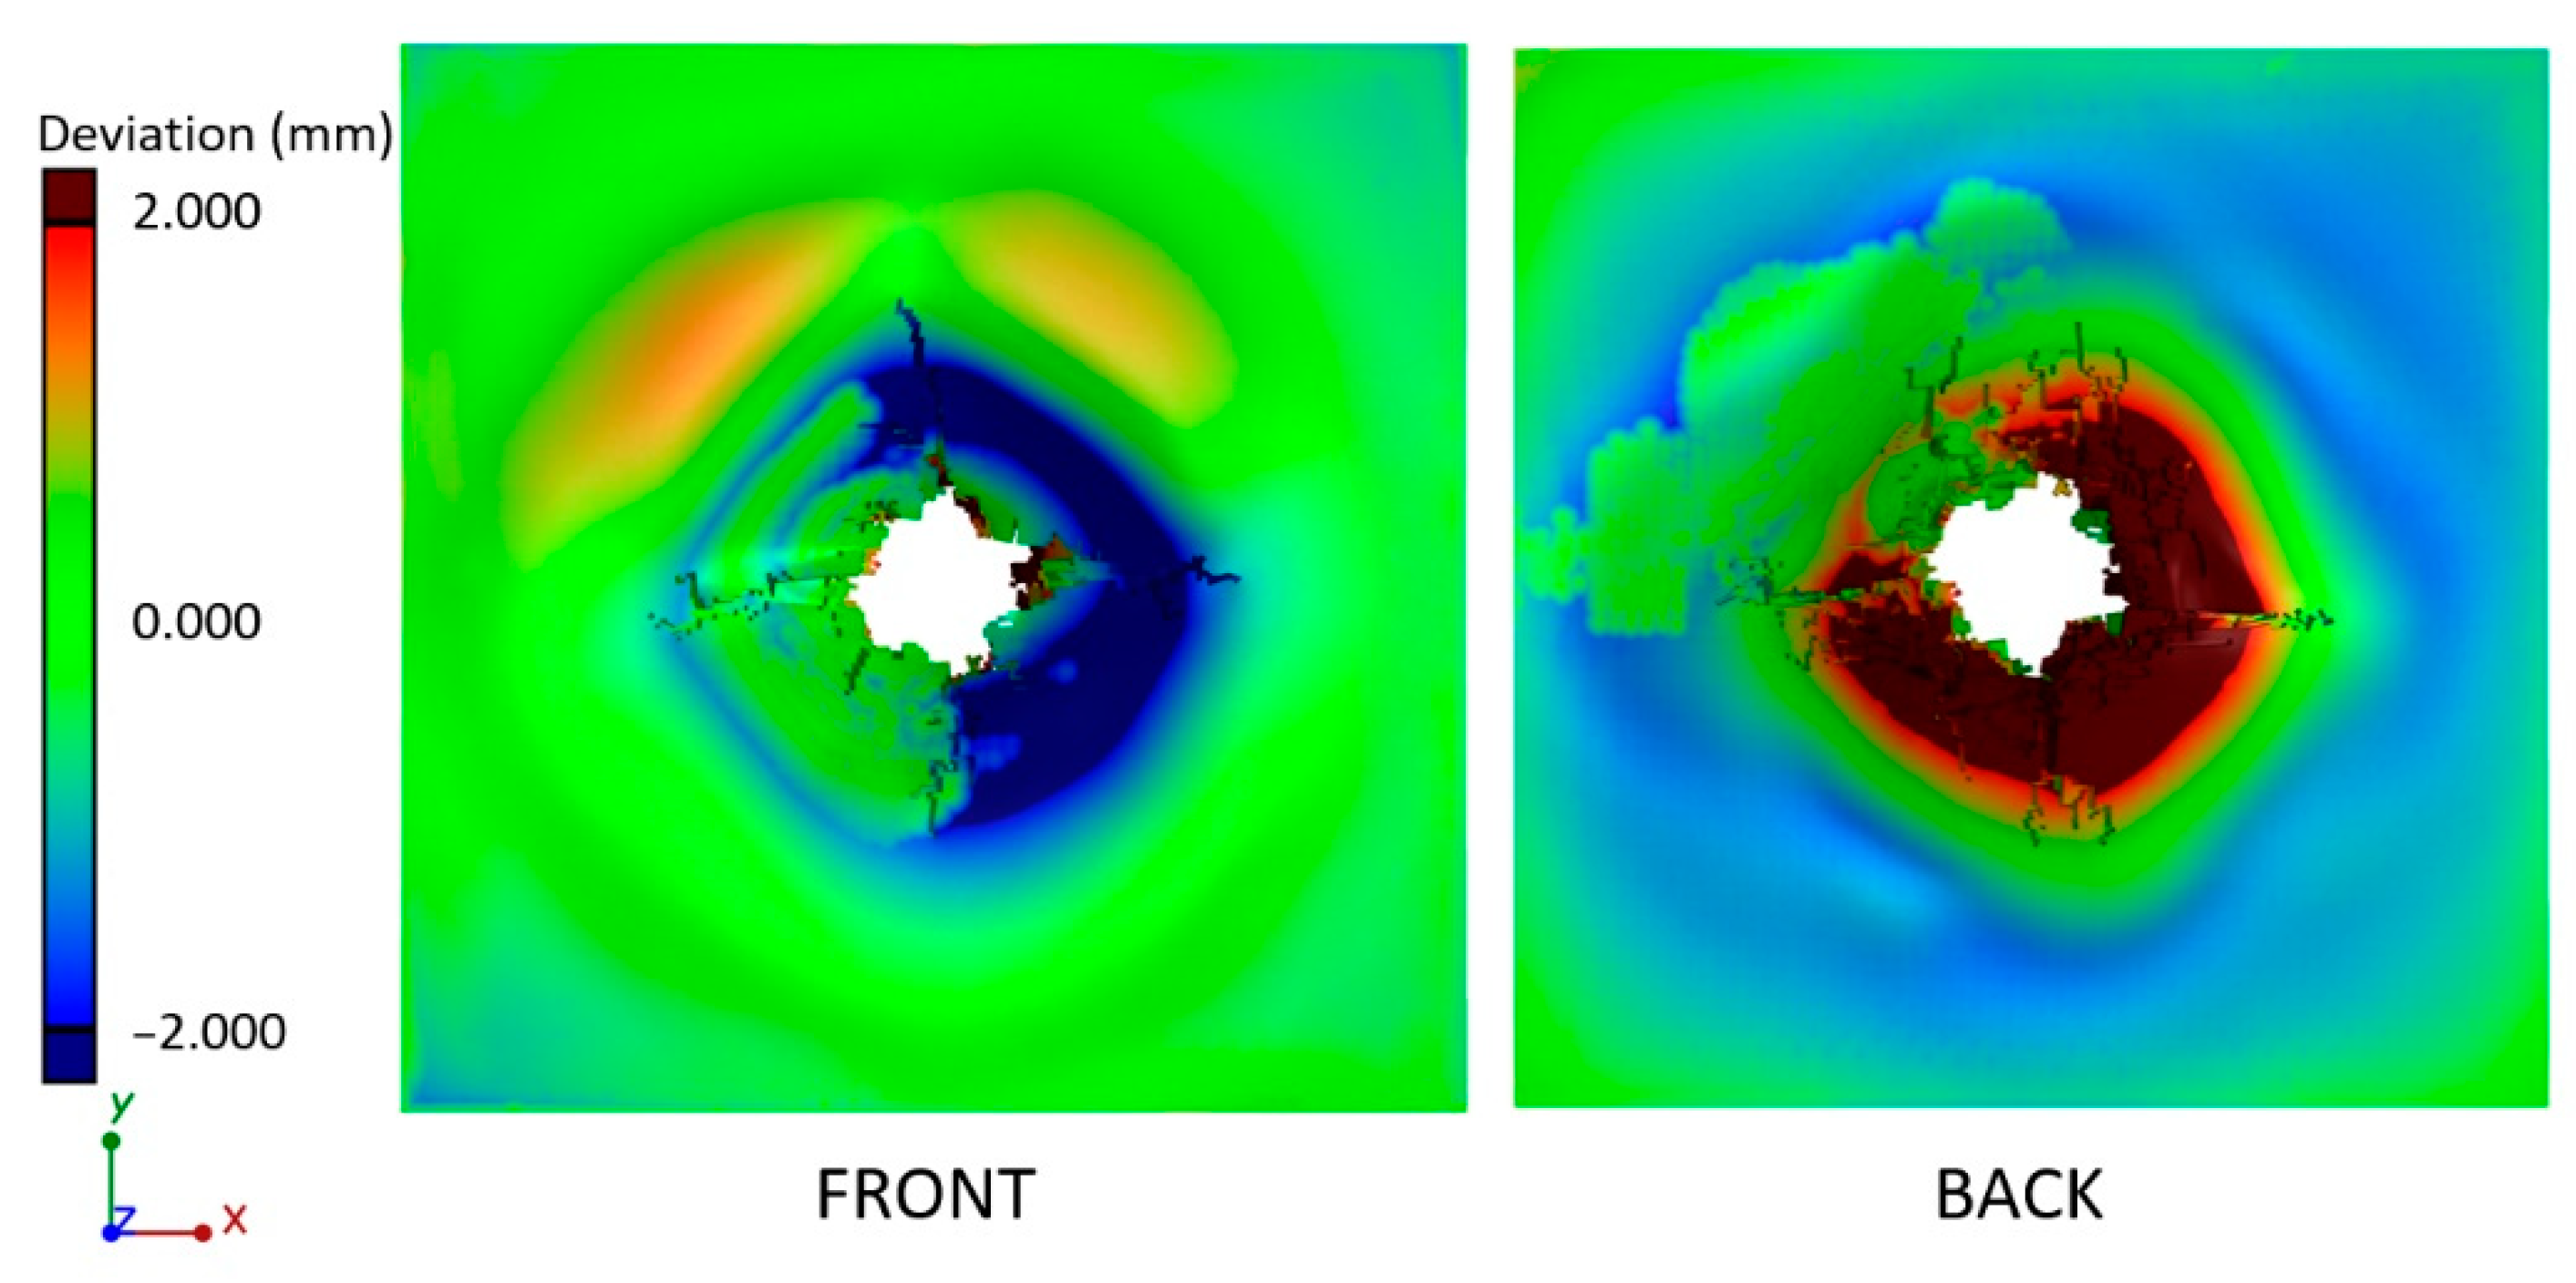
3.4. FEA Results and XCT Verification
4. Discussion
5. Conclusions
- -
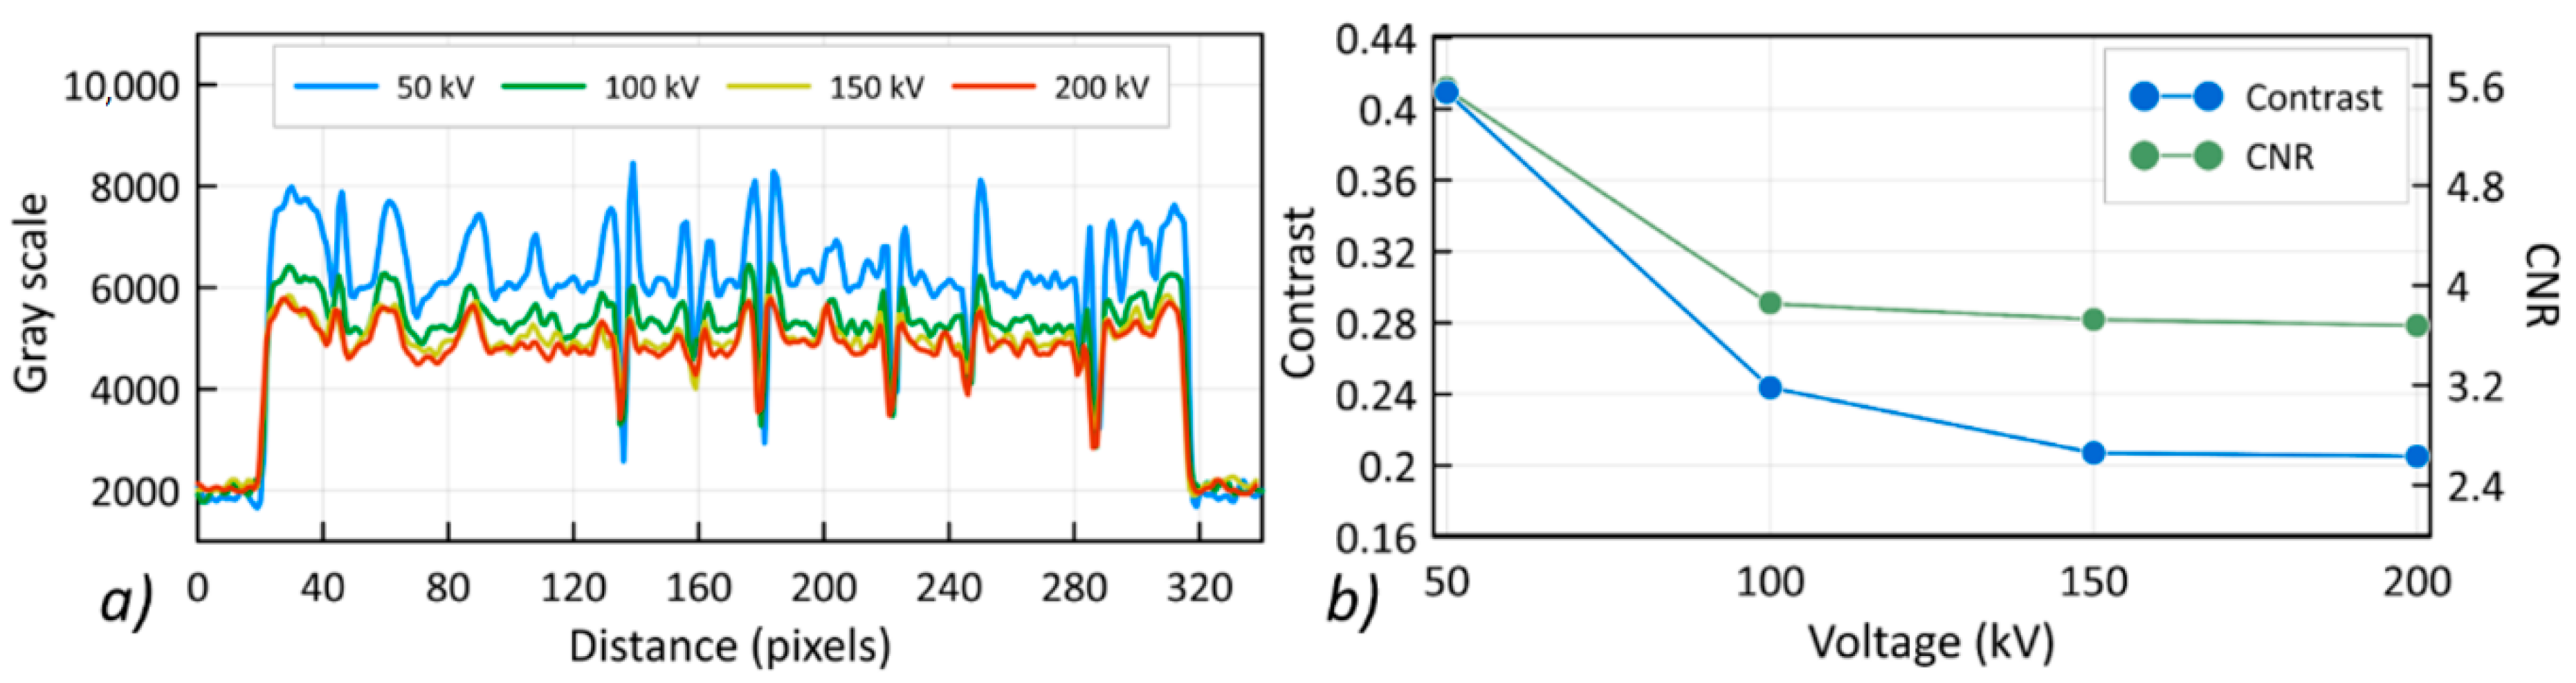
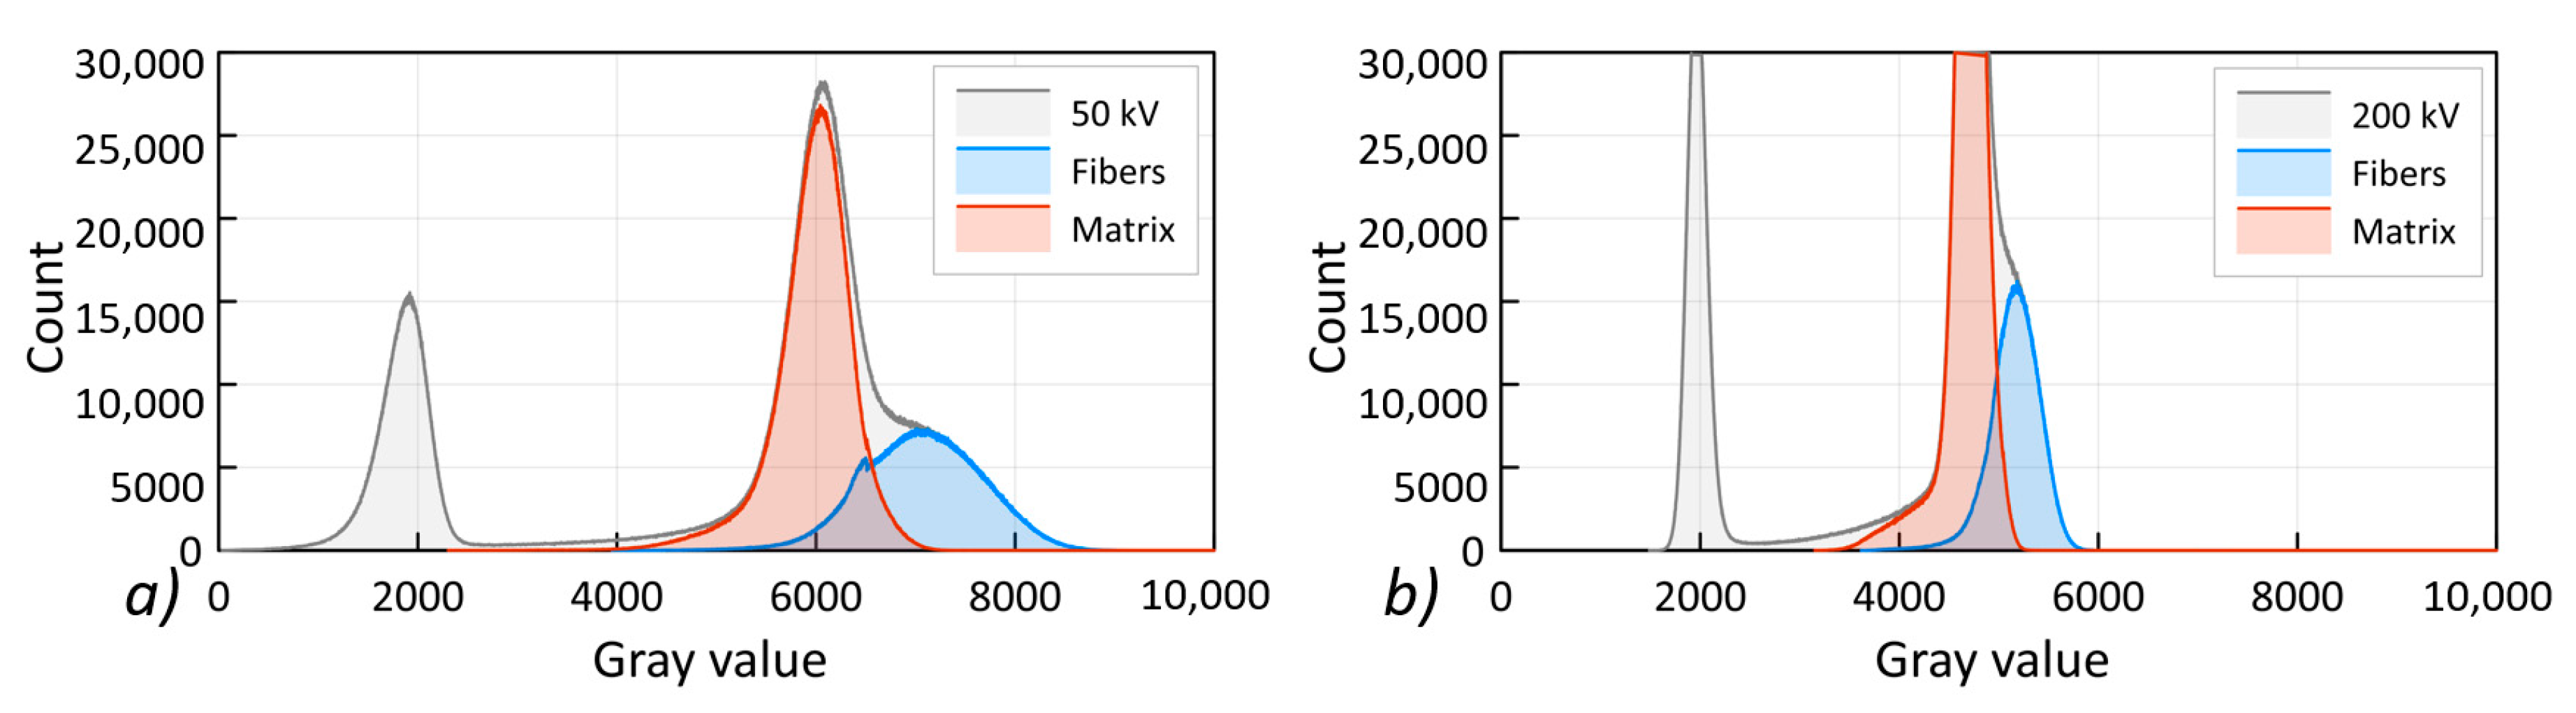
- The use of lower values of the X-ray tube accelerating voltages allows for a greater contrast in the XCT reconstruction of PMC structures to be obtained. A decrease in contrast of around 50% was recorded for the reconstruction with voltage at the level of 200 kV when compared to the reconstruction with 50 kV. This is due to the greater contribution of the photoelectric effect in the XCT image formation and better differentiation of the composition of the material.
- -
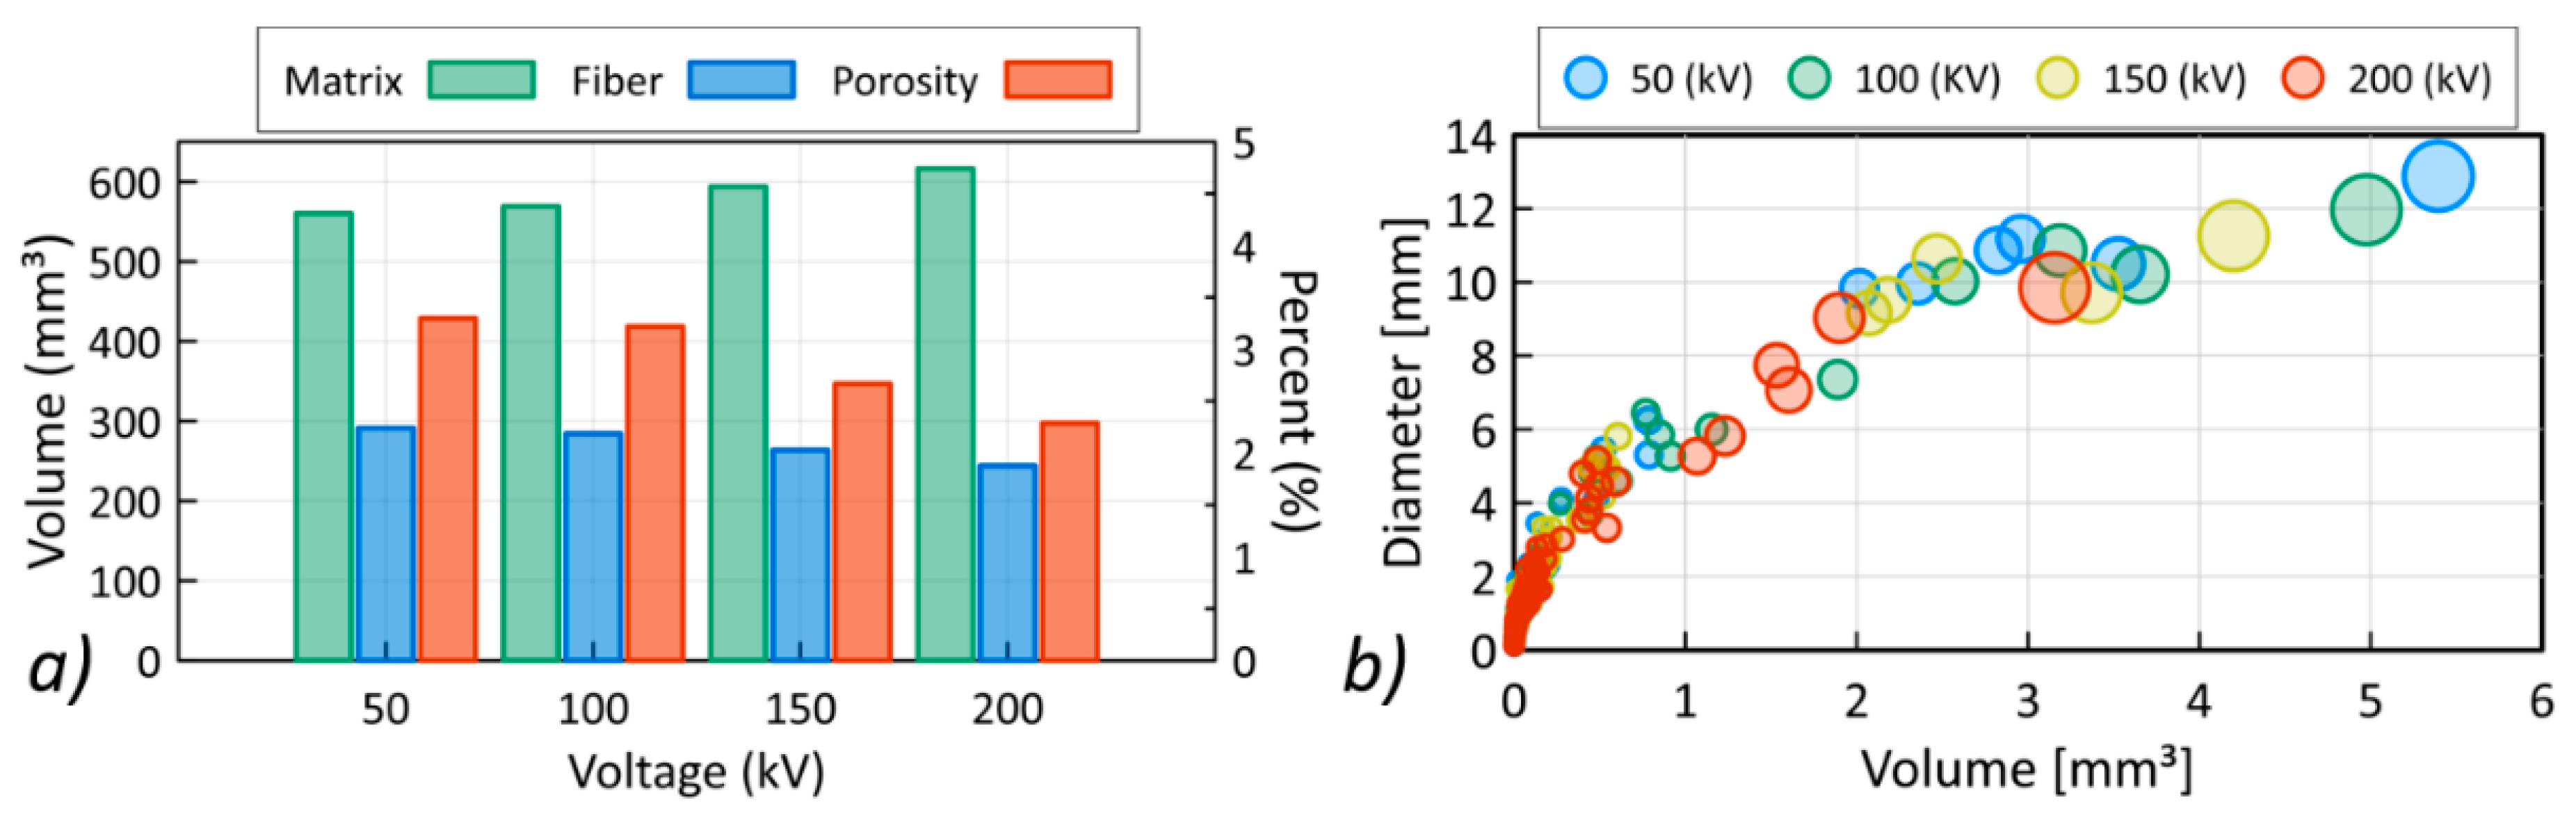
- Reducing the reconstruction contrast of the PP composite resulted in a decrease in the registered aramid fibers’ volume by 16.15%, while the porosity value decreased by over 1%. At the same time, the volume of the matrix increased by 9.98%. This indicates that better accuracy of the XCT reconstruction is achieved when scanning composites with a lower X-ray tube acceleration voltage.
- -
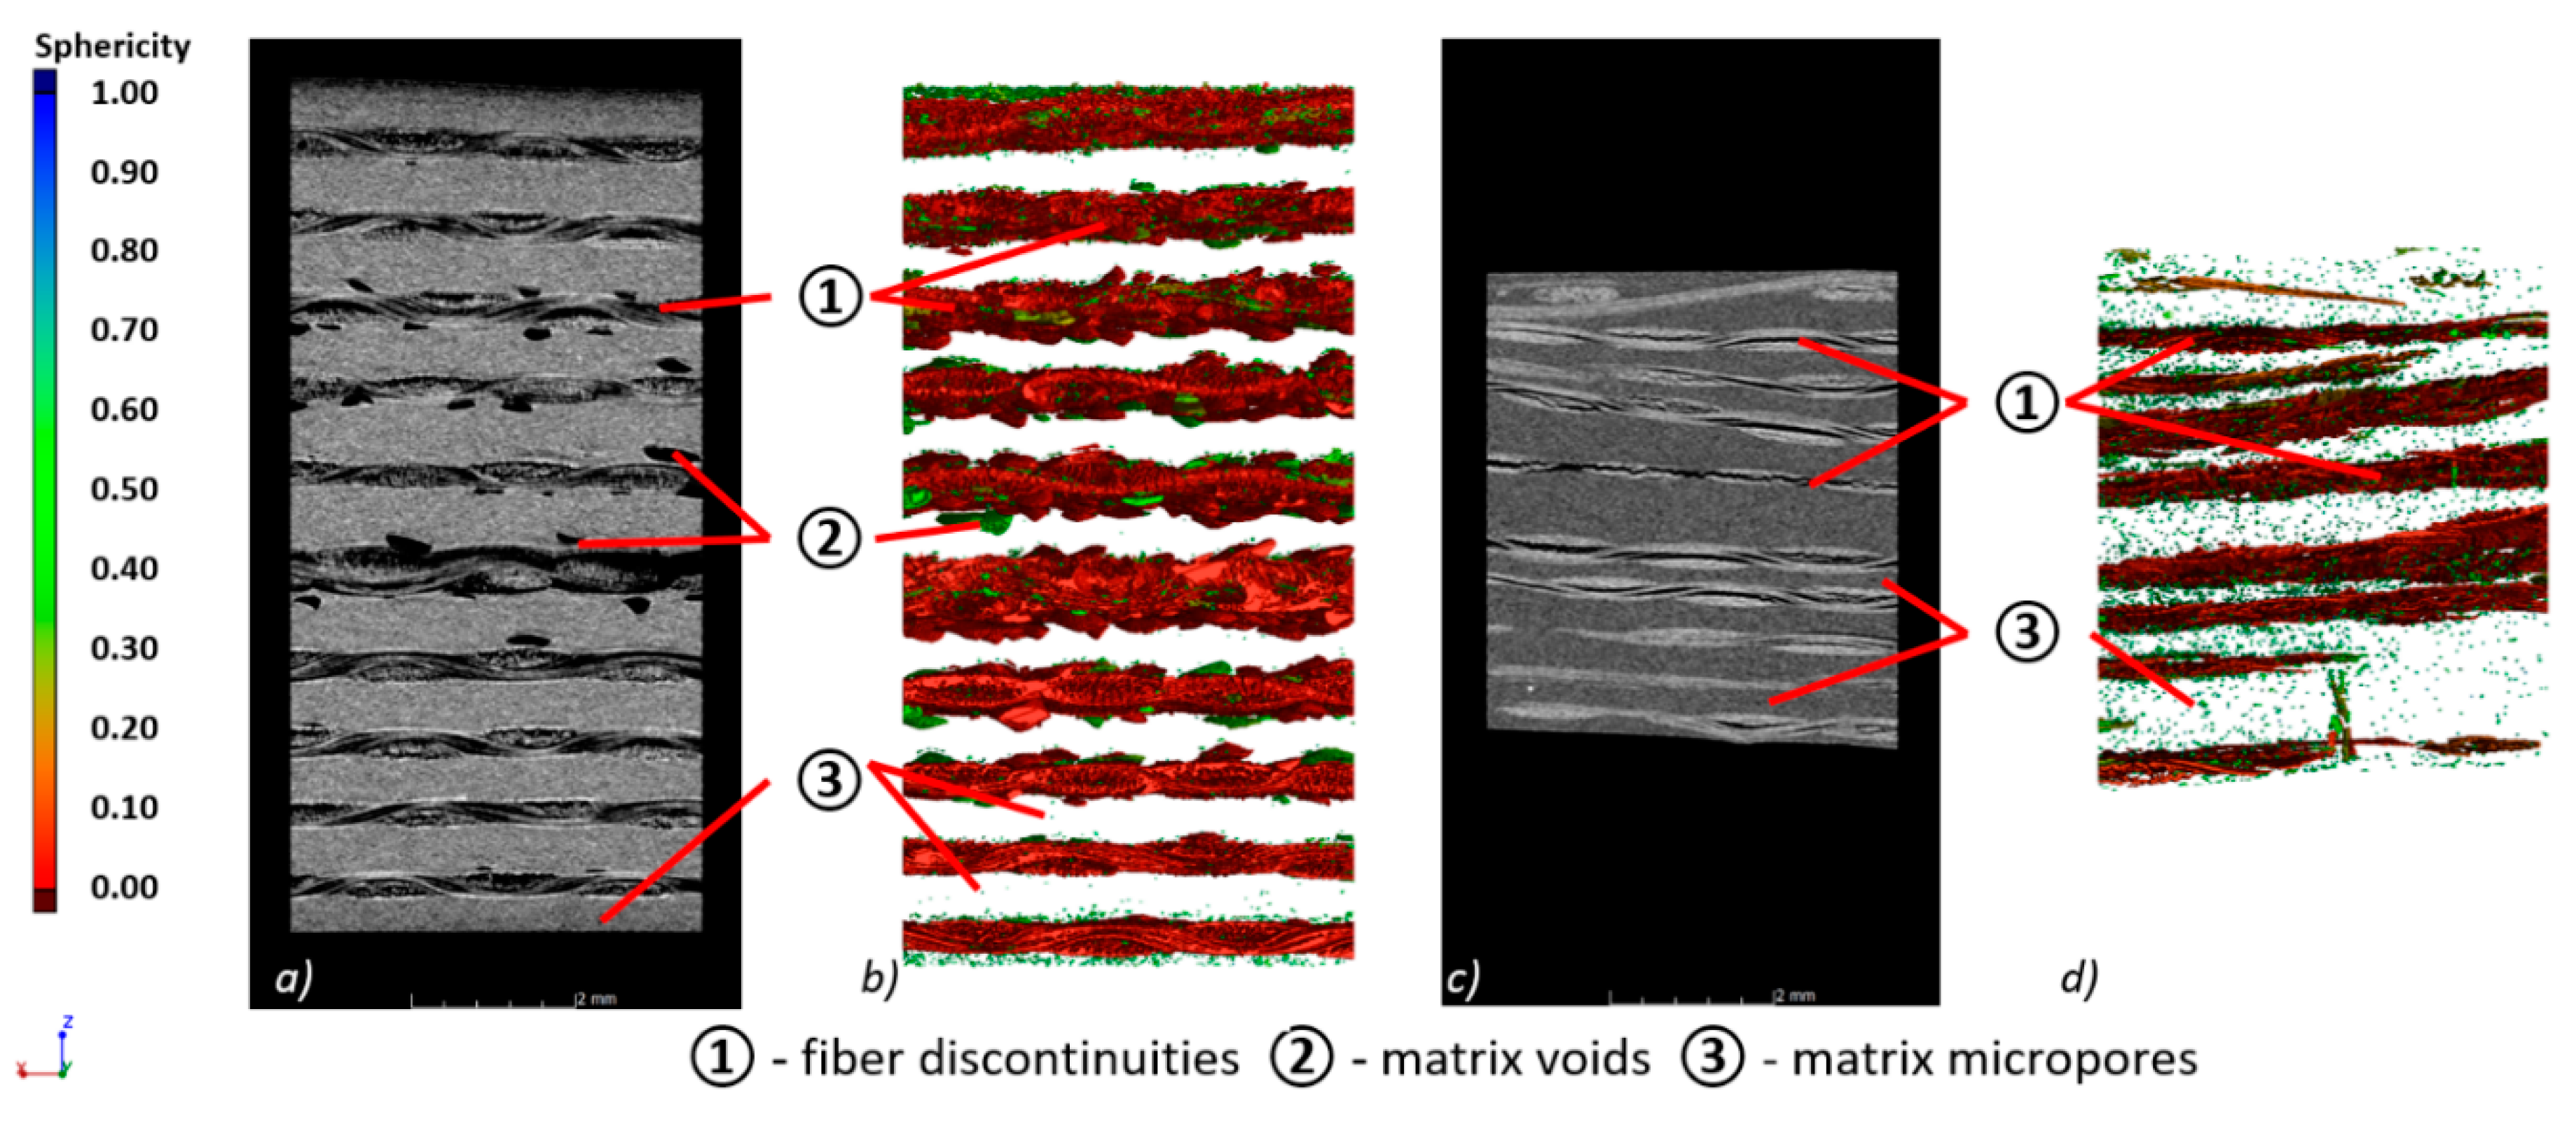
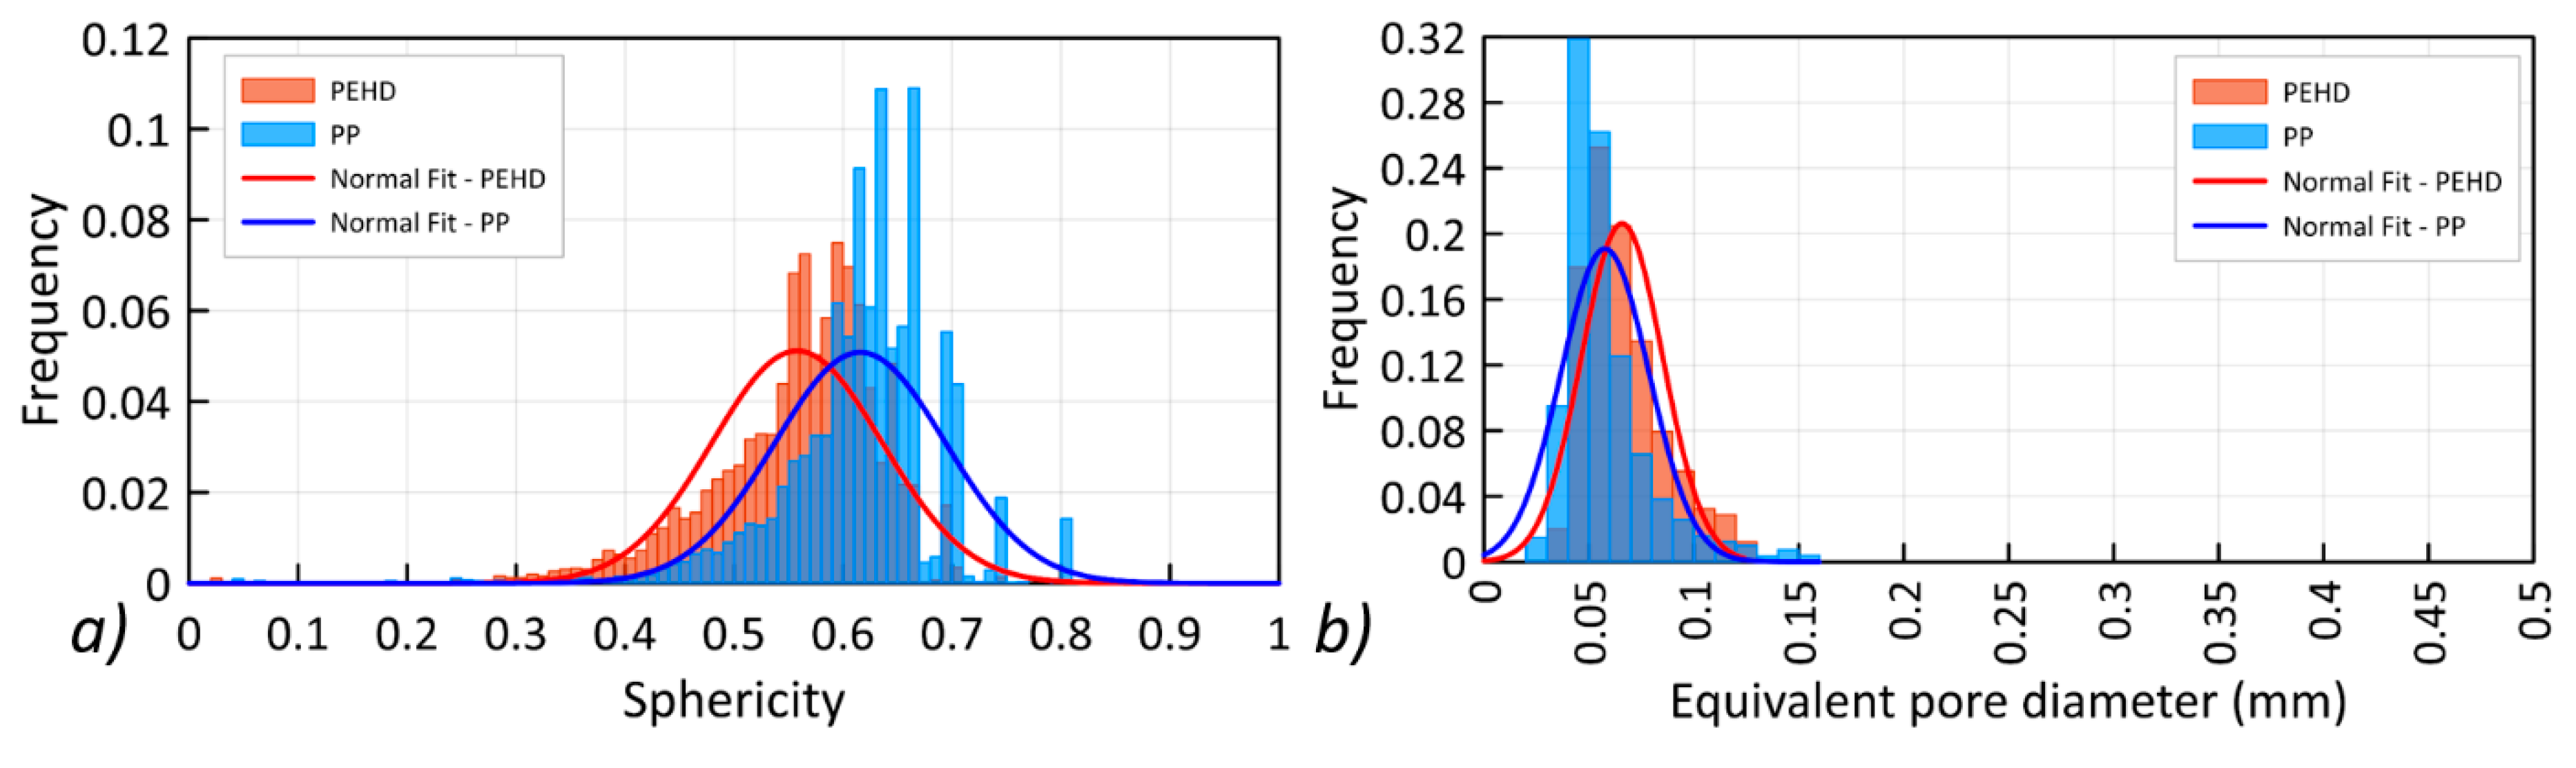
- Characterization of composites carried out in the mesoscale showed a greater number of defects and delamination recorded for the PEHD sample when compared to the PP sample. For the PEHD sample, a lower sphericity of pores was recorded with higher diameters and a higher level of delamination.
- -
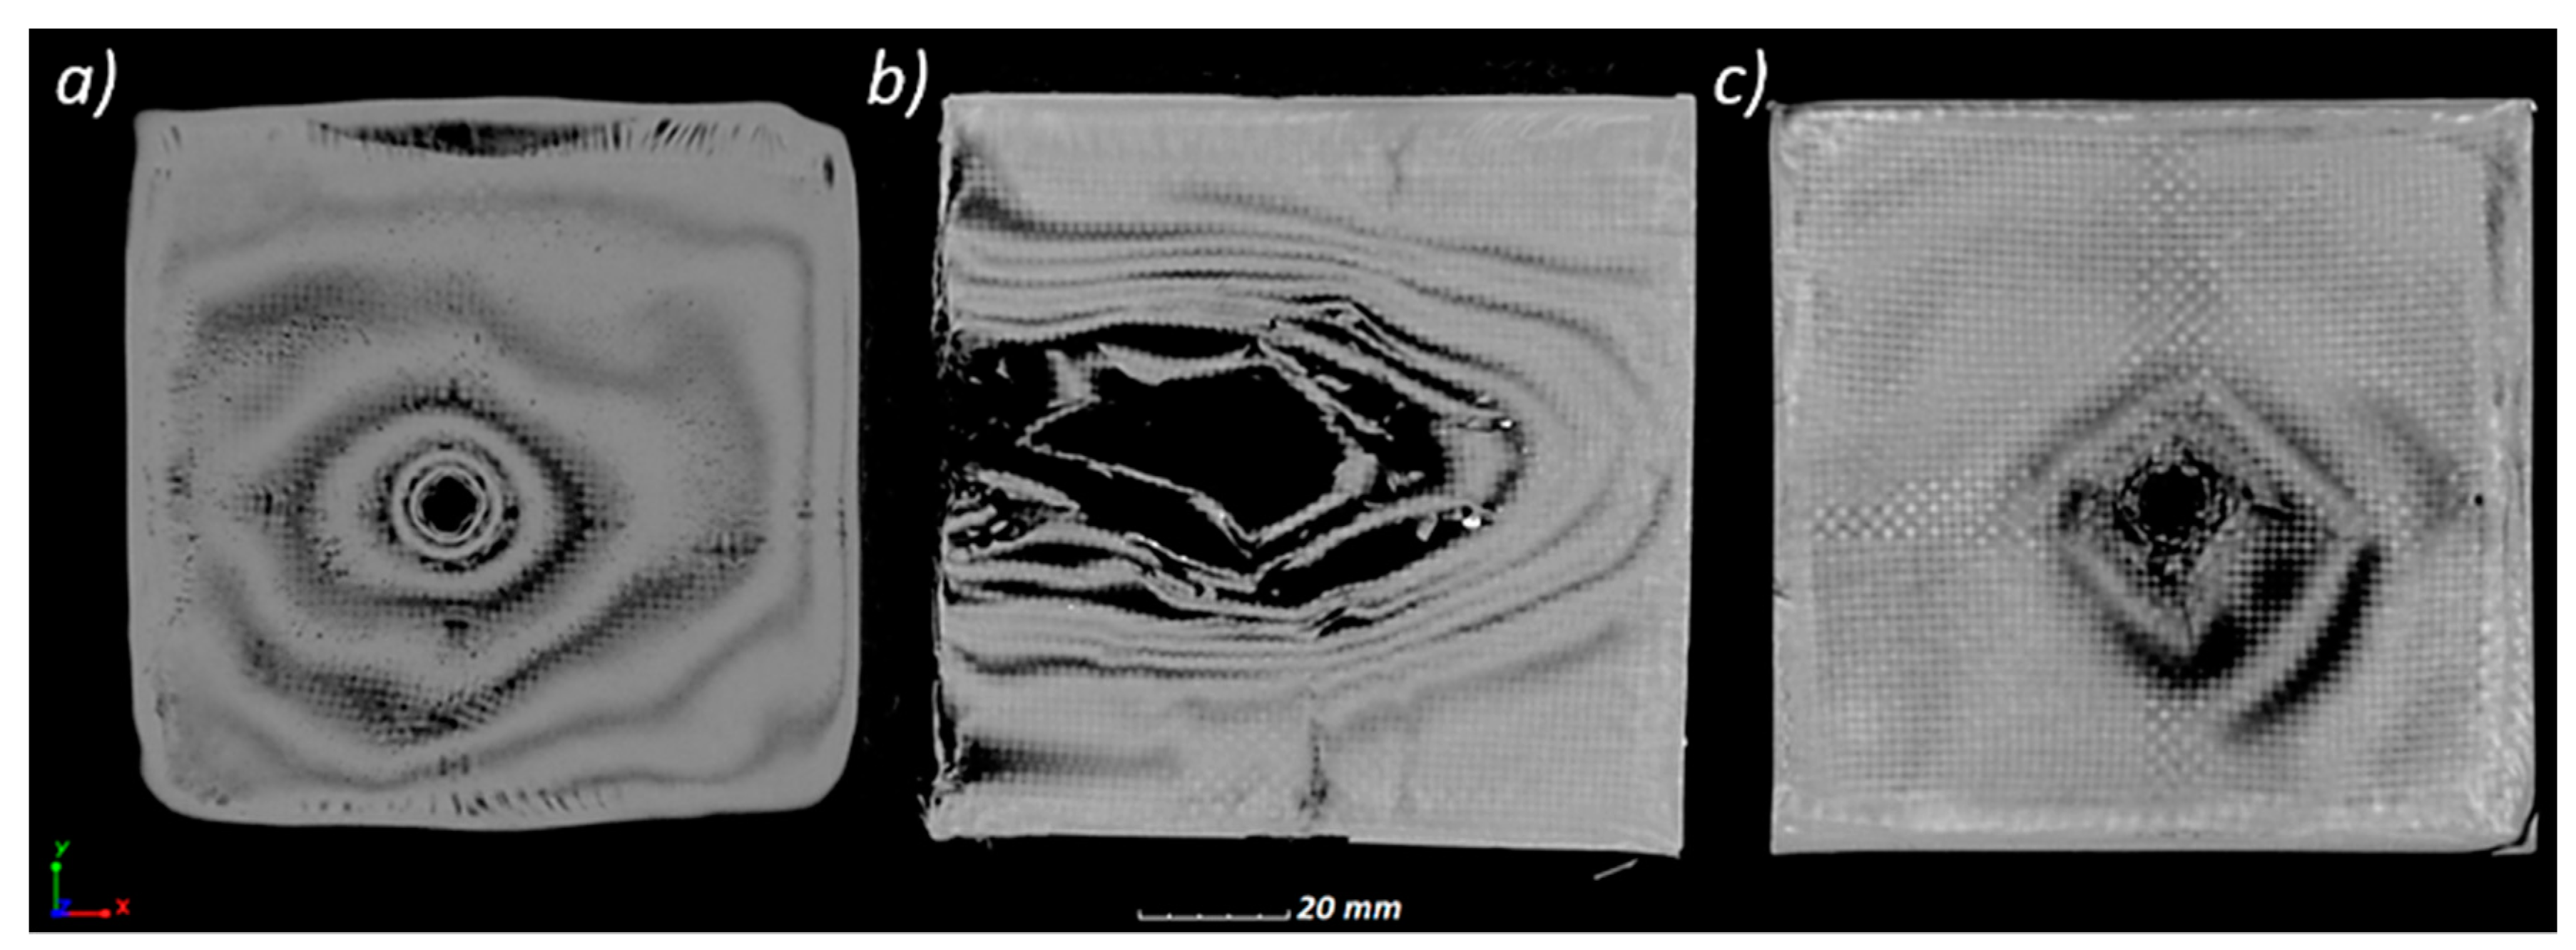
- The PP panel was characterized by better ballistic resistance than the PEHD panel, stopping the “0.38 Special” projectile with the energy of 392 J. The PP panel was penetrated by a “9 mm × 19 mm Parabellum” projectile with an energy of 548 J.
- -
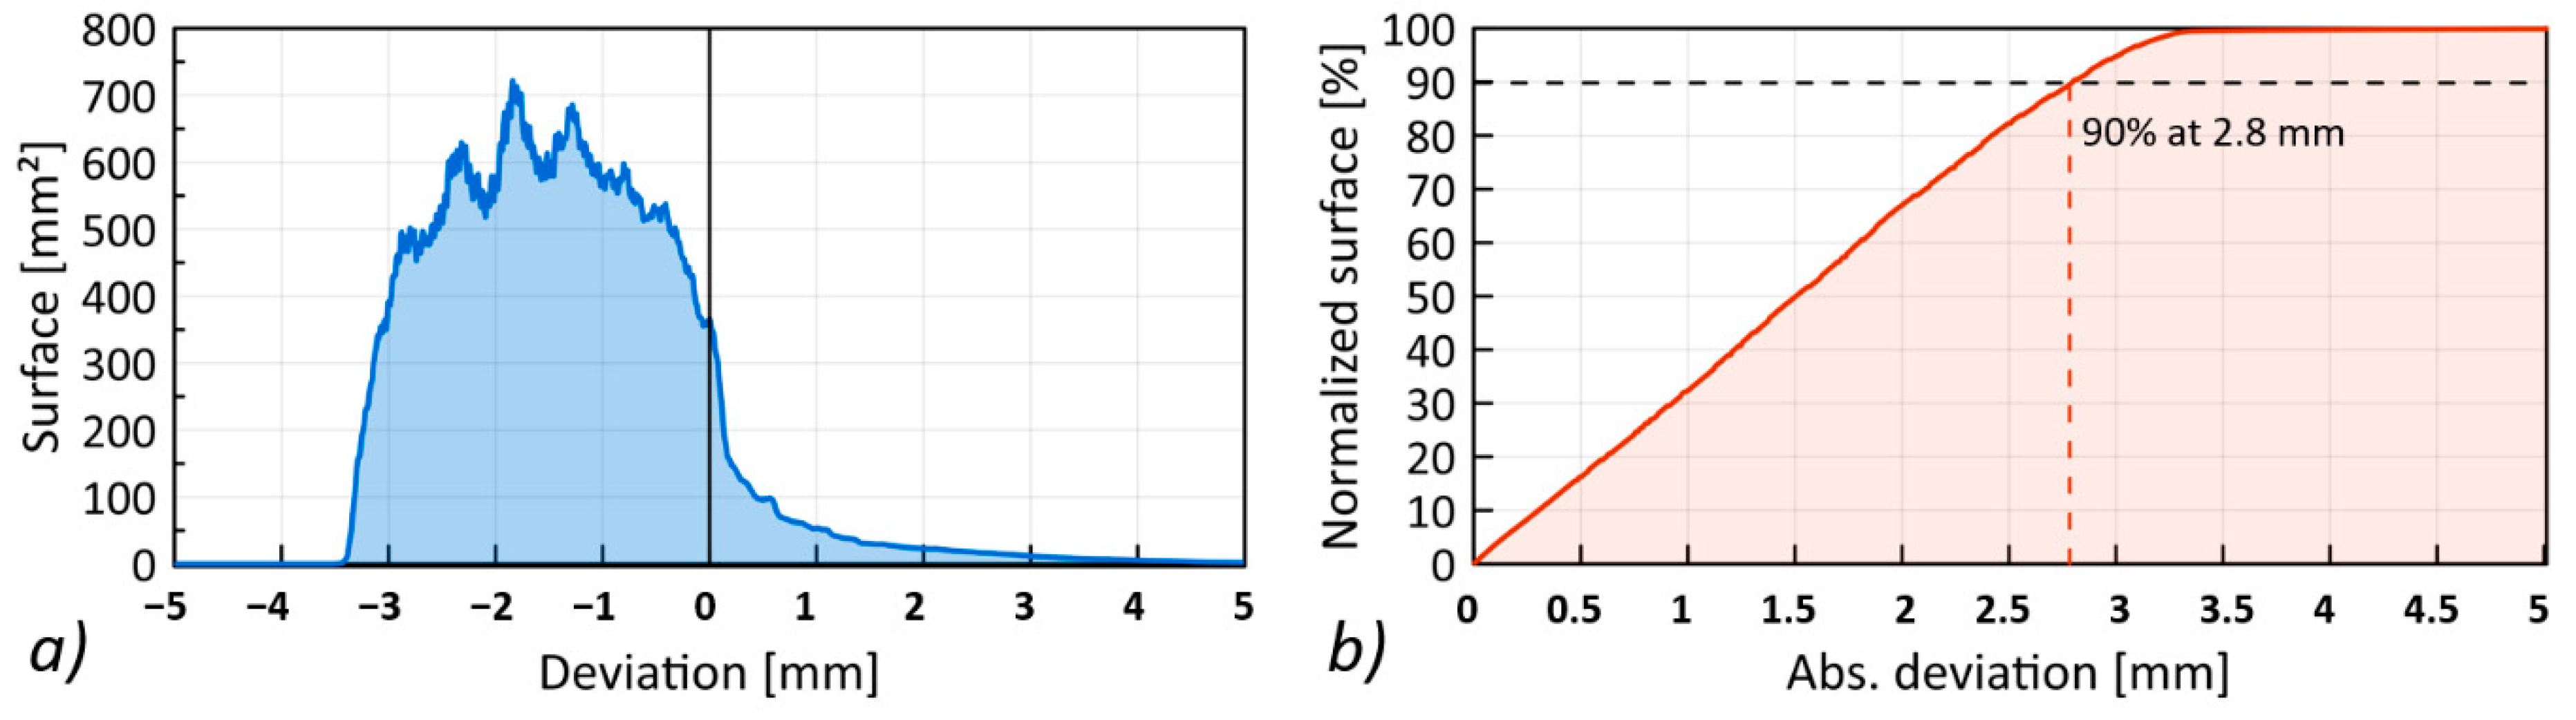
- The quantitative XCT comparison of the panel deformation after the ballistic test and FEA simulation showed that 90% of the deviations of the compared surfaces are within a distance of 2.8 mm. The deviations and differences obtained in the performed numerical analysis result from the adopted simulation method. Therefore, the aim of further research will be to optimize numerical methods in order to reduce geometry deviations between the results of the simulation and the experiment.
Author Contributions
Funding
Acknowledgments
Conflicts of Interest
References
- Cork, C.R.; Foster, P.W. The ballistic performance of narrow fabrics. Int. J. Impact Eng. 2007, 34, 495–508. [Google Scholar] [CrossRef]
- Kedzierski, P.; Gieleta, R.; Morka, A.; Niezgoda, T.; Surma, Z. Experimental study of hybrid soft ballistic structures. Compos. Struct. 2016, 153, 204–211. [Google Scholar] [CrossRef]
- Gopinath, G.; Zheng, J.Q.; Batra, R.C. Effect of matrix on ballistic performance of soft body armor. Compos. Struct. 2012, 94, 2690–2696. [Google Scholar] [CrossRef]
- Gellert, E.P.; Cimpoeru, S.J.; Woodward, R.L. Study of the effect of target thickness on the ballistic perforation of glass-fibre-reinforced plastic composites. Int. J. Impact Eng. 2000, 24, 445–456. [Google Scholar] [CrossRef]
- Caprino, G.; Lopresto, V.; Santoro, D. Ballistic impact behaviour of stitched graphite/epoxy laminates. Compos. Sci. Technol. 2007, 67, 325–335. [Google Scholar] [CrossRef]
- Nunes, L.M.; Paciornik, S.; d’Almeida, J.R.M. Evaluation of the damaged area of glass-fiber-reinforced epoxy-matrix composite materials submitted to ballistic impacts. Compos. Sci. Technol. 2004, 64, 945–954. [Google Scholar] [CrossRef]
- Boccaccini, A.R.; Atiq, S.; Boccaccini, D.N.; Dlouhy, I.; Kaya, C. Fracture behaviour of mullite fibre reinforced-mullite matrix composites under quasi-static and ballistic impact loading. Compos. Sci. Technol. 2005, 65, 325–333. [Google Scholar] [CrossRef]
- Cheeseman, B.A.; Bogetti, T.A. Ballistic impact into fabric and compliant composite laminates. Compos. Struct. 2003, 61, 161–173. [Google Scholar] [CrossRef]
- Pandya, K.S.; Dharmane, L.; Pothnis, J.R.; Ravikumar, G.; Naik, N.K. Stress wave attenuation in composites during ballistic impact. Polym. Test. 2012, 31, 261–266. [Google Scholar] [CrossRef]
- García-Castillo, S.K.; Sánchez-Sáez, S.; Barbero, E. Nondimensional analysis of ballistic impact on thin woven laminate plates. Int. J. Impact Eng. 2012, 39, 8–15. [Google Scholar] [CrossRef] [Green Version]
- Wen, H.M.; Reddy, T.Y.; Reid, S.R. Deformation and failure of clamped beams under low speed impact loading. Int. J. Impact Eng. 1995, 16, 435–454. [Google Scholar] [CrossRef]
- Bocian, M.; Jamroziak, K.; Kulisiewicz, M. The identification of nonlinear damping of the selected components of MDOF complex vibratory systems. Proc. Int. Conf. Struct. Dyn. EURODYN 2014, 2014, 3365–3372. [Google Scholar]
- Skoptsov, K.A.; Sheshenin, S.V.; Galatenko, V.V.; Malakho, A.P.; Shornikova, O.N.; Avdeev, V.V.; Sadovnichy, V.A. Particle Simulation for Predicting Effective Properties of Short Fiber Reinforced Composites. Int. J. Appl. Mech. 2016, 8, 1–18. [Google Scholar] [CrossRef] [Green Version]
- Zhao, Y.P. Suggestion of a new dimensionless number for dynamic plastic response of beams and plates. Arch. Appl. Mech. 1998, 68, 524–538. [Google Scholar] [CrossRef]
- Sheikh, A.H.; Bull, P.H.; Kepler, J.A. Behaviour of multiple composite plates subjected to ballistic impact. Compos. Sci. Technol. 2009, 69, 704–710. [Google Scholar] [CrossRef] [Green Version]
- Hirai, Y.; Hamada, H.; Kim, J.K. Impact response of woven glass-fabric composites—I. Effect of fibre surface treatment. Compos. Sci. Technol. 1998, 58, 91–104. [Google Scholar] [CrossRef]
- Sabet, A.R.; Beheshty, M.H.; Rahimi, H. Experimental study of sharp-tipped projectile perforation of gfrp plates containing sand filler under high velocity impact and quasi-static loadings. Polym. Compos. 2009, 30, 1497–1509. [Google Scholar] [CrossRef]
- Turner, P.; Liu, T.; Zeng, X.; Brown, K. Three-dimensional woven carbon fibre polymer composite beams and plates under ballistic impact. Compos. Struct. 2018, 185, 483–495. [Google Scholar] [CrossRef]
- Yang, Y.; Chen, X. Study of energy absorption and failure modes of constituent layers in body armour panels. Compos. Part B Eng. 2016, 98, 250–259. [Google Scholar] [CrossRef]
- Kulkarni, S.G.; Gao, X.L.; Horner, S.E.; Zheng, J.Q.; David, N.V. Ballistic helmets—Their design, materials, and performance against traumatic brain injury. Compos. Struct. 2013, 101, 313–331. [Google Scholar] [CrossRef] [Green Version]
- Tham, C.Y.; Tan, V.B.C.; Lee, H.P. Ballistic impact of a KEVLAR® helmet: Experiment and simulations. Int. J. Impact Eng. 2008, 35, 304–318. [Google Scholar] [CrossRef]
- Gower, H.L.; Cronin, D.S.; Plumtree, A. Ballistic impact response of laminated composite panels. Int. J. Impact Eng. 2008, 35, 1000–1008. [Google Scholar] [CrossRef]
- Awoukeng-Goumtcha, A.; Taddei, L.; Tostain, F.; Roth, S. Investigations of impact biomechanics for penetrating ballistic cases. Biomed. Mater. Eng. 2014, 24, 2331–2339. [Google Scholar] [CrossRef] [PubMed] [Green Version]
- Iremonger, M.J.; Went, A.C. Ballistic impact of fibre composite armours by fragment-simulating projectiles. Compos. Part A Appl. Sci. Manuf. 1996, 27, 575–581. [Google Scholar] [CrossRef]
- Garcea, S.C.; Wang, Y.; Withers, P.J. X-ray computed tomography of polymer composites. Compos. Sci. Technol. 2018, 156, 305–319. [Google Scholar] [CrossRef]
- Schilling, P.J.; Karedla, B.P.R.; Tatiparthi, A.K.; Verges, M.A.; Herrington, P.D. X-ray computed microtomography of internal damage in fiber reinforced polymer matrix composites. Compos. Sci. Technol. 2005, 65, 2071–2078. [Google Scholar] [CrossRef]
- ElAgamy, N.; Laliberté, J.; Gaidies, F. Quantitative analysis of fatigue cracks in laminated carbon fibre-reinforced polymer composites using micro-computed tomography. J. Compos. Mater. 2016, 50, 2523–2540. [Google Scholar] [CrossRef]
- Böhm, R.; Stiller, J.; Behnisch, T.; Zscheyge, M.; Protz, R.; Radloff, S.; Gude, M.; Hufenbach, W. A quantitative comparison of the capabilities of in situ computed tomography and conventional computed tomography for damage analysis of composites. Compos. Sci. Technol. 2015, 110, 62–68. [Google Scholar] [CrossRef]
- Sket, F.; Enfedaque, A.; López, C.D.; González, C.; Molina-Aldareguía, J.; Lorca, J.L. X-ray computed tomography analysis of damage evolution in open hole carbon fiber-reinforced laminates subjected to in-plane shear. Compos. Sci. Technol. 2016, 133, 40–50. [Google Scholar] [CrossRef]
- Caty, O.; Ibarroule, P.; Herbreteau, M.; Rebillat, F.; Maire, E.; Vignoles, G.L. Application of X-ray computed micro-tomography to the study of damage and oxidation kinetics of thermostructural composites. Nucl. Instrum. Methods Phys. Res. Sect. B Beam Interact. Mater. Atoms 2014, 324, 113–117. [Google Scholar] [CrossRef]
- Yu, B.; Bradley, R.S.; Soutis, C.; Withers, P.J. A comparison of different approaches for imaging cracks in composites by X-ray microtomography. Philos. Trans. R. Soc. A Math. Phys. Eng. Sci. 2016, 374. [Google Scholar] [CrossRef] [PubMed]
- Mukhopadhyay, S.; Jones, M.I.; Hallett, S.R. Tensile failure of laminates containing an embedded wrinkle; numerical and experimental study. Compos. Part A Appl. Sci. Manuf. 2015, 77, 219–228. [Google Scholar] [CrossRef]
- Palka, N.; Panowicz, R.; Chalimoniuk, M.; Beigang, R. Non-destructive evaluation of puncture region in polyethylene composite by terahertz and X-ray radiation. Compos. Part B Eng. 2016, 92, 315–325. [Google Scholar] [CrossRef]
- Penumadu, D.; Kim, F.; Bunn, J. Damage of Composite Materials Subjected to Projectile Penetration Using High Resolution X-ray Micro Computed Tomography. Exp. Mech. 2016, 56, 607–616. [Google Scholar] [CrossRef]
- Desplentere, F.; Lomov, S.V.; Woerdeman, D.L.; Verpoest, I.; Wevers, M.; Bogdanovich, A. Micro-CT characterization of variability in 3D textile architecture. Compos. Sci. Technol. 2005, 65, 1920–1930. [Google Scholar] [CrossRef]
- Berger, M.J.O.K.; Hubbell, J.H.; Seltzer, S.M.; Chang, J.; Coursey, J.S.; Sukumar, R.; Zucker, D.S. XCOM: Photon Cross Sections Database, NIST Standard Reference Database 8 (XGAM). 2013. Available online: http://www.nist.gov/srd/nist82.cfm (accessed on 25 November 2020).
- Sarapata, A.; Willner, M.; Walter, M.; Duttenhofer, T.; Kaiser, K.; Meyer, P.; Braun, C.; Fingerle, A.; Noël, P.B.; Pfeiffer, F.; et al. Quantitative imaging using high-energy X-ray phase-contrast CT with a 70 kVp polychromatic X-ray spectrum. Opt. Express 2015, 23, 523. [Google Scholar] [CrossRef] [PubMed] [Green Version]
- Hsieh, J. Computer Tomography. Principles, Design, Artifacts and Recent Advances, 2nd ed.; Spie Press: Washington, DC, USA, 2009. [Google Scholar]
- Naouar, N.; Vidal-Sallé, E.; Schneider, J.; Maire, E.; Boisse, P. Meso-scale FE analyses of textile composite reinforcement deformation based on X-ray computed tomography. Compos. Struct. 2014, 116, 165–176. [Google Scholar] [CrossRef]
- Sharma, R.; Mahajan, P.; Mittal, R.K. Fiber bundle push-out test and image-based finite element simulation for 3D carbon/carbon composites. Carbon N. Y. 2012, 50, 2717–2725. [Google Scholar] [CrossRef]
- Léonard, F.; Stein, J.; Soutis, C.; Withers, P.J. The quantification of impact damage distribution in composite laminates by analysis of X-ray computed tomograms. Compos. Sci. Technol. 2017, 152, 139–148. [Google Scholar] [CrossRef]
- Li, Y.; Sun, B.; Gu, B. Impact shear damage characterizations of 3D braided composite with X-ray micro-computed tomography and numerical methodologies. Compos. Struct. 2017, 176, 43–54. [Google Scholar] [CrossRef]
- Thomas, E.L. Opportunities in Protection Materials Science and Technology for Future Army Applications. In Advances in Ceramic Armor VIII; The National Academies Press: Washington, DC, USA, 2012. [Google Scholar]
- Pach, J.; Pyka, D.; Jamroziak, K.; Mayer, P. The experimental and numerical analysis of the ballistic resistance of polymer composites. Compos. Part B Eng. 2017, 113, 24–30. [Google Scholar] [CrossRef]
- Mazurkiewicz, Ł.; Małachowski, J.; Baranowski, P. Optimization of protective panel for critical supporting elements. Compos. Struct. 2015, 134, 493–505. [Google Scholar] [CrossRef]
- Mackiewicz, A.; Pyka, D.; Pach, J.; Jamroziak, K. Comparison of Numerical Modelling Methods of Innovative Materials for Ballistic Shields. In Advanced Materials for Defense; Fangueiro, R., Rana, S., Eds.; Springer: Cham, Switzerland, 2020; Volume 4, p. 2020. [Google Scholar]
- Mazurkiewicz, Ł.; Małachowski, J.; Damaziak, K.; Baranowski, P.; Gotowicki, P. Identification of layers distribution in the composite coupon using finite element method and three point bending test. Acta Mech. Autom. 2013, 7, 160–165. [Google Scholar] [CrossRef] [Green Version]
- Del Rosso, S.; Iannucci, L.; Curtis, P.T. On the ballistic impact response of microbraid reinforced polymer composites. Compos. Struct. 2016, 137, 70–84. [Google Scholar] [CrossRef] [Green Version]
- Ben-Dor, G.; Dubinsky, A.; Elperin, T. Applied High-Speed Plate Penetration Dynamics; Springer: Amsterdam, The Netherlands, 2006; Volume 132. [Google Scholar]
- Parsons, E.M.; Weerasooriya, T.; Sarva, S.; Socrate, S. Impact of woven fabric: Experiments and mesostructure-based continuum-level simulations. J. Mech. Phys. Solids 2010, 58, 1995–2021. [Google Scholar] [CrossRef] [Green Version]
- Hiller, J.; Maisl, M.; Reindl, L.M. Physical characterization and performance evaluation of an X-ray micro-computed tomography system for dimensional metrology applications. Meas. Sci. Technol. 2012, 23. [Google Scholar] [CrossRef]
- Poludniowski, G.; Landry, G.; Deblois, F.; Evans, P.M.; Verhaegen, F. SpekCalc: A program to calculate photon spectra from tungsten anode x-ray tubes. Phys. Med. Biol. 2009, 54. [Google Scholar] [CrossRef] [Green Version]
- Sławski, S.; Szymiczek, M.; Kaczmarczyk, J.; Domin, J.; Duda, S. Experimental and numerical investigation of striker shape influence on the destruction image in multilayered composite after low velocity impact. Appl. Sci. 2020, 10, 288. [Google Scholar] [CrossRef] [Green Version]


| Matrix | Layers | Thickness [mm] | Mass [g] |
|---|---|---|---|
| PEHD | 10 | 9.0 | 77 |
| PP | 6.1 | 57 |
| Type of Projectile | Caliber | Velocity [m/s] | Mass [g] | Energy [J] | Test Type |
|---|---|---|---|---|---|
| Special S&B | 0.38 | 280 ± 4 | 10 | 392.0 | PEHD_S |
| PP_S | |||||
| Parabellum MESCO | 9 × 19 | 370 ± 8 | 8 | 547.6 | PP_P |
| Material | E | ν | ρ | A | B | n | C | D1 | D2 | D3 |
|---|---|---|---|---|---|---|---|---|---|---|
| [GPa] | [-] | [kg/m3] | [MPa] | [MPa] | [-] | [s−1] | [-] | [-] | [-] | |
| Aramid fibers | 71.0 | 0.36 | 1444 | 2450 | 2500 | 0.1 | 1.0 | 1.4 | 0.28 | 0.10 |
| Polypropylene (PP) | 1.5 | 0.45 | 900 | 26 | 10 | 0.15 | 0.1 | 0.068 | 5.382 | −2.534 |
| Polyethylene (PEHD) | 0.7 | 0.46 | 960 | 40 | 25 | 0.18 | 0.1 | 0.068 | 5.382 | −2.534 |
| Projectile | E | ν | ρ | A | B | n | C |
|---|---|---|---|---|---|---|---|
| [GPa] | [-] | [kg/m3] | [MPa] | [MPa] | [-] | [s−1] | |
| Core: Lead (alloy of PB1 and antimony) | 1.3 | 0.42 | 11300 | 35 | 46 | 0.48 | 0.01 |
| Jacket: Brass alloy (M90 PN-92/H-87025) | 130 | 0.375 | 8940.9 | 112 | 505 | 0.42 | 0.01 |
| No. | Voltage | Current | Power | Mean Spectrum Energy | No Projections | Time | Voxel Size |
|---|---|---|---|---|---|---|---|
| (kV) | (µA) | (W) | (keV) | (-) | (s) | (µm) | |
| 1 | 50 | 450 | 22.5 | 25.8 | 950 | 2 | 30.00 |
| 2 | 100 | 225 | 22.5 | 39.7 | |||
| 3 | 150 | 150 | 22.5 | 51.6 | |||
| 4 | 200 | 112 | 22.4 | 62.3 |
Publisher’s Note: MDPI stays neutral with regard to jurisdictional claims in published maps and institutional affiliations. |
© 2020 by the authors. Licensee MDPI, Basel, Switzerland. This article is an open access article distributed under the terms and conditions of the Creative Commons Attribution (CC BY) license (http://creativecommons.org/licenses/by/4.0/).
Share and Cite
Ziółkowski, G.; Pach, J.; Pyka, D.; Kurzynowski, T.; Jamroziak, K. X-ray Computed Tomography for the Development of Ballistic Composite. Materials 2020, 13, 5566. https://doi.org/10.3390/ma13235566
Ziółkowski G, Pach J, Pyka D, Kurzynowski T, Jamroziak K. X-ray Computed Tomography for the Development of Ballistic Composite. Materials. 2020; 13(23):5566. https://doi.org/10.3390/ma13235566
Chicago/Turabian StyleZiółkowski, Grzegorz, Joanna Pach, Dariusz Pyka, Tomasz Kurzynowski, and Krzysztof Jamroziak. 2020. "X-ray Computed Tomography for the Development of Ballistic Composite" Materials 13, no. 23: 5566. https://doi.org/10.3390/ma13235566