Bio-Inspired Toughening of Composites in 3D-Printing


Abstract
:1. Introduction
2. Materials and Methods
2.1. Hybrid 3D-Printing System
2.2. Material Composition and Preparation
2.3. Sample Preparation
2.4. Testing Procedure
3. Results
3.1. Impact Strength Tests
3.2. Bending Tests
3.3. Dynamic-Mechanical Analysis
3.4. Imaging Analysis
4. Discussion
Author Contributions
Funding
Conflicts of Interest
References
- Ritchie, R. The Conflicts between Strength and Toughness. Nat. Mater. 2011, 10, 817–822. [Google Scholar] [CrossRef] [PubMed]
- Munch, E.; Launey, M.E.; Alsem, D.H.; Saiz, E.; Tomsia, A.P.; Ritchie, R. Tough, Bio-Inspired Hybrid Materials. Science 2008, 322, 1516–1520. [Google Scholar] [CrossRef] [PubMed] [Green Version]
- Launey, M.E.; Ritchie, R. On the Fracture Toughness of Advanced Materials. Adv. Mater. 2009, 21, 2103–2110. [Google Scholar] [CrossRef]
- Luz, G.M.; Mano, J.F. Mineralized Structures in Nature: Examples and Inspirations for the Design of New Composite Materials and Biomaterials. Compos. Sci. Technol. 2010, 70, 1777–1788. [Google Scholar] [CrossRef] [Green Version]
- Fratzl, P. A Composite Matter of Alignment. Science 2012, 335, 177. [Google Scholar] [CrossRef]
- Eder, M.; Amini, S.; Fratzl, P. Biological Composites—Complex Structures for Functional Diversity. Science 2018, 362, 543–547. [Google Scholar] [CrossRef] [Green Version]
- Dunlop, J.W.C.; Fratzl, P. Multilevel Architectures in Natural Materials. Scr. Mater. 2013, 68, 8–12. [Google Scholar] [CrossRef]
- Bertoldi, K.; Bigoni, D.; Drugan, W.J. Nacre: An Orthotropic and Bimodular Elastic Material. Compos. Sci. Technol. 2008, 68, 1363–1375. [Google Scholar] [CrossRef] [Green Version]
- Flores-Johnson, E.A.; Shen, L.; Guiamatsia, I.; Nguyen, G.D. A Numerical Study of Bioinspired Nacre-like Composite Plates under Blast Loading. Compos. Struct. 2015, 126, 329–336. [Google Scholar] [CrossRef]
- Aizenberg, J.; Weaver, J.C.; Thanawala, M.S.; Sundar, V.; Morse, D.E.; Fratzl, P. Skeleton of Euplectella Sp.: Structural Hierarchy from the Nanoscale to the Macroscale. Science. [CrossRef] [Green Version]
- Woesz, A.; Weaver, J.C.; Kazanci, M.; Dauphin, Y.; Aizenberg, J.; Morse, D.E.; Fratzl, P. Micromechanical Properties of Biological Silica in Skeletons of Deep-Sea Sponges. J. Mater. Res. 2006, 21, 2068–2078. [Google Scholar] [CrossRef] [Green Version]
- Mayer, G. New Classes of Tough Composite Materials—Lessons from Natural Rigid Biological Systems. Mater. Sci. Eng. 2006, 26, 1261–1268. [Google Scholar] [CrossRef]
- Fratzl, P.; Weinkamer, R. Nature’s Hierarchical Materials. Prog. Mater. Sci. 2007, 55, 1263–1334. [Google Scholar] [CrossRef] [Green Version]
- Zhang, N.; Yang, S.; Xiong, L.; Hong, Y.; Chen, Y. Nanoscale Toughening Mechanism of Nacre Tablet. J. Mech. Behav. Biomed. Mater. 2016, 53, 200–209. [Google Scholar] [CrossRef] [Green Version]
- Gopalan, H.; Chokshi, A.H. The Mechanical Behavior of Nacre across Length Scales. J. Mech. Behav. Biomed. Mater. 2018, 78, 96–107. [Google Scholar] [CrossRef]
- Jingru, S.; Cuncai, F.; Hansong, M.; Lihong, L.; Yueguang, W. Crack Deflection Occurs by Constrained Microcracking in Nacre. Acta Mech. Sin. 2018, 34, 143–150. [Google Scholar]
- Mirkhalaf, M.; Barthelat, F. Nacre-like Materials Using a Simple Doctor Blading Technique: Fabrication, Testing and Modeling. J. Mech. Behav. Biomed. Mater. 2016, 56, 23–33. [Google Scholar] [CrossRef]
- Chuanjin, H.; Qunfeng, C. Learning from Nacre: Constructing Polymer Nanocomposites. Compos. Sci. Technol. 2017, 150, 141–166. [Google Scholar]
- Kakisawa, H.; Sumitomo, T. The Toughening Mechanism of Nacre and Structural Materials Inspired by Nacre. Sci. Technol. Adv. Mater. 2011, 12, 1–14. [Google Scholar] [CrossRef]
- Yao, H.; Song, Z.; Xu, Z.; Gao, H. Cracks Fail to Intensify Stress in Nacreous Composites. Compos. Sci. Technol. 2013, 81, 24–29. [Google Scholar] [CrossRef]
- Weaver, J.C.; Aizenberg, J.; Fanter, G.E.; Kisailus, D.; Woesz, A.; Allen, P.; Fields, K.; Porter, M.J.; Zok, F.W.; Hansma, P.K.; et al. Hierarchical Assembly of the Siliceous Skeletal Lattice of the Hexactinellid Sponge Euplectella Aspergillum. J. Struct. Biol. 2007, 158, 93–106. [Google Scholar] [CrossRef] [PubMed]
- Walter, S.L.; Flinn, B.D.; Mayer, G. Mechanisms of Toughening of a Natural Rigid Composite. Mater. Sci. Eng. 2007, 27, 570–574. [Google Scholar] [CrossRef]
- Dunlop, J.W.C.; Weinkamer, R.; Fratzl, P. Artful Interfaces within Biological Materials. Mater. Today 2011, 14, 70–78. [Google Scholar] [CrossRef]
- Kolednik, O.; Predan, J.; Fischer, F.D. Cracks in Inhomogeneous Materials: Comprehensive Assessment Using the Configurational Forces Concept. Eng. Fract. Mech. 2010, 77, 2698–2711. [Google Scholar] [CrossRef]
- Sistaninia, M.; Kolednik, O. Effect of a Single Soft Interlayer on the Crack Driving Force. Eng. Fract. Mech. 2014, 130, 21–41. [Google Scholar] [CrossRef]
- Fratzl, P.; Gupta, H.S.; Fischer, F.D.; Kolednik, O. Hindered Crack Propagation in Materials with Periodically Varying Young’s Modulus—Lessons from Biological Materials. Adv. Mater. 2007, 19, 2657–2661. [Google Scholar] [CrossRef]
- Wiener, J.; Arbeiter, F.; Tiwan, A.; Kolednik, O.; Pinter, G. Bioinspired Toughness Improvement through Soft Interlayers in Mineral Reinforced Polypropylene. Mech. Mater. 2020, 140, 1–13. [Google Scholar] [CrossRef]
- Simha, N.K.; Fischer, F.D.; Kolednik, O.; Predan, J. Crack Tip Shielding or Anti-Shielding Due to Smooth and Discontinuous Material Inhomogeneities. Int. J. Fract. 2005, 135, 73–93. [Google Scholar] [CrossRef]
- Kolednik, O.; Predan, J.; Fischer, F.D.; Fratzl, P. Bioinspired Design Criteria for Damage-Resistant Materials with Periodically Varying Microstructure. Adv. Funct. Mater. 2011, 21, 3634–3641. [Google Scholar] [CrossRef]
- Kolednik, O.; Predan, J.; Fischer, F.D.; Fratzl, P. Improvements of Strength and Fracture Resistance by Spatial Material Property Variations. Acta Mater. 2014, 68, 279–294. [Google Scholar] [CrossRef]
- Razi, H.; Predan, J.; Fischer, F.D.; Kolednik, O.; Fratzl, P. Damage Tolerance of Lamellar Bone. Bone 2020, 130, 1–7. [Google Scholar] [CrossRef] [PubMed]
- Ligon-Auer, S.C.; Schwentenwein, M.; Gorsche, C.; Stampfl, J.; Liska, R. Toughening of Photo-Curable Polymer Networks: A Review. Polym. Chem. 2016, 7, 257–286. [Google Scholar] [CrossRef]
- Gorsche, C.; Seidler, K.; Knaack, P.; Dorfinger, P.; Koch, T.; Stampfl, J.; Moszner, N.; Liska, R. Rapid Formation of Regulated Methacrylate Networks Yielding Tough Materials for Lithographybased 3D Printing. Polym. Chem. 2016, 7, 2009–2014. [Google Scholar] [CrossRef] [Green Version]
- Tumblestone, J.; Shirvanyants, D.; Ermoshkin, N.; Janusziewicz, R.; Johnson, A.; Kelly, D.; Chen, K.; Pinschmidt, R.; Rolland, J.; Ermoshkin, A.; et al. Continuous Liquid Interface Production of 3D Objects. Science 2015, 347, 1349–1352. [Google Scholar] [CrossRef] [PubMed]
- Velasco-Hogan, A.; Xu, J.; Marc, M.A. Additive Manufacturing as a Method to Design and Optimize Bioinspired Structures. Adv. Mater. 2018, 30, 1800940. [Google Scholar] [CrossRef]
- Yang, Y.; Li, Y.; Chu, M.; Sun, H.; Jin, J.; Yu, K.; Wang, Q.; Zhou, Q.; Chen, Y. Electrically Assisted 3D Printing of Nacre-Inspired Structures with Self-Sensing Capability. Sci. Adv. 2019, 5. [Google Scholar] [CrossRef] [Green Version]
- Ragosta, G.; Abbate, M.; Musto, P.; Scarinzi, G.; Mascia, L. Epoxy-Silica Particulate Nanocomposites: Chemical Interactions, Reinforcement and Fracture Toughness. Polymer 2005, 46, 10506–10516. [Google Scholar] [CrossRef]
- Russel, B.; Chartoff, R. The Influence of Cure Conditions on the Morphology and Phase Distribution in a Rubber-Modified Epoxy Resin Using Scanning Electron Microscopy and Atomic Force Microscopy. Polymer 2005, 46, 785–798. [Google Scholar] [CrossRef]
- Naguib, M.; Grassini, S.; Sangermano, M. Core/Shell PBA/PMMA-PGMA Nanoparticles to Enhance the Impact Resistance of UV-Cured Epoxy Systems. Macromol. Mater. Eng 2013, 298, 106–112. [Google Scholar] [CrossRef]
- Duran, H.; Meng, S.; Kim, N.; Hu, J.; Kyu, T.; Natarajan, L.; Tondiglia, V.; Bunning, T. Kinetics of Photopolymerization-Induced Phase Separation and Morphology Development in Mixtures of a Nematic Liquid Crystal and Multifunctional Acrylate. Polymer 2008, 49, 534–545. [Google Scholar] [CrossRef]
- Karalekas, D.; Aggelopoulos, A. Study of Shrinkage Strains in a Stereolithography Cured Acrylic Photopolymer Resin. J. Mater. Process. Technol. 2003, 136, 146–150. [Google Scholar] [CrossRef]
- Studart, A. Additive Manufacturing of Biologically Inspired Materials. Chem. Soc. Rev 2016, 45, 359–376. [Google Scholar] [CrossRef] [PubMed]
- Hu, Q.; Sun, X.-Z.; Parmenter, C.D.J.; Fay, M.W.; Smith, E.F.; Rance, G.A.; Zhang, Y.H.; Liu, Y.; Irvine, D.; Tuck, C.; et al. Additive Manufacture of Complex 3D Au-Containing Nanocomposites by Simultaneous Two-Photon Polymerisation and Photoreduction. Sci. Rep. 2017, 7, 1–7. [Google Scholar] [CrossRef] [PubMed] [Green Version]
- Eckel, Z.C.; Zhou, C.; Martin, J.; Jacobsen, A.; Carter, W.; Schaedler, T. Additive Manufacturing of Polymer-Derived Ceramics. Science 2016, 351, 58–62. [Google Scholar] [CrossRef] [PubMed] [Green Version]
- Campbell, I.; Bourell, D.; Gibson, I. Additive Manufacturing: Rapid Prototyping Comes of Age. Rapid Prototyp. J. 2012, 18, 255–258. [Google Scholar] [CrossRef] [Green Version]
- Zian, J.; Lifeng, W. 3D Printing of Biomimetic Composites with Improved Fracture Toughness. Acta Mater. 2019, 173, 61–73. [Google Scholar]
- Zian, J.; Yang, Y.; Shaoyu, H.; Lifeng, W. Biomimetic Architected Materials with Improved Dynamic Performance. J. Mech. Phys. Solids 2019, 125, 178–197. [Google Scholar]
- Wang, X.; Jiang, M.; Zhou, Z.; Gou, J.; Hui, D. 3D Printing of Polymer Matrix Composites: A Review and Prospective. Compos. Part B 2017, 110, 442–558. [Google Scholar] [CrossRef]
- Tiwari, A.; Wiener, J.; Arbeiter, F.; Pinter, G.; Kolednik, O. Application of the Material Inhomogeneity Effect for the Improvement of Fracture Toughness of a Brittle Polymer. Eng. Fract. Mech. 2020, 224, 1–16. [Google Scholar] [CrossRef]
- Zanchetta, E.; Cattaldo, M.; Franchin, G.; Schwentenwein, M.; Homa, J.; Brusatin, G.; Colombo, P. Stereolithography of SiOC Ceramic Microcomponents. Adv. Mater. 2016, 28, 370–376. [Google Scholar] [CrossRef]
- Baumgartner, S. Development of a 3D-Printing Process for Colored Dental Ceramics and Selective Modification of Polymers. Ph.D. Thesis, TU Wien, Vienna, Austria, December 2018. [Google Scholar]
- Baumgartner, S. Digital Materials: A Hybrid 3d-Printing System. In Proceedings of the Vienna Young Scientists Symposium (VSS), Vienna, Austria, 7–8 June 2018; pp. 78–79. [Google Scholar]
- Steyrer, B.; Neubauer, P.; Liska, R.; Stampfl, J. Visible Light Photoinitiator for 3D-Printing of Tough Methacrylate Resins. Materials 2017, 10, 1445. [Google Scholar] [CrossRef] [PubMed] [Green Version]
- Brostow, W.; Lobland, H.E.H. Brittleness of Materials: Implications for Composites and a Relationto Impact Strength. J. Mater. Sci. 2010, 45, 242–250. [Google Scholar] [CrossRef]
- Polymer Service Merseburg. Available online: https://wiki.polymerservice-merseburg.de/index.php/Schlagbiegeversuch (accessed on 4 June 2020).
- Swetly, T.; Stampfl, J.; Kempf, G.; Hucke, R.-M.; Willing, M.; Warkentin, M. Bioinspired Engineering Polymers by Voxel-Based 3D-Printing. BioNanoMaterials 2016, 145–157. [Google Scholar] [CrossRef]
- Xu, X.; Gupta, N. Determining Elastic Modulus from Dynamic Mechanical Analysis Data: Reduction in Experiments Using Adaptive Surrogate Modeling Based Transform. Polymer 2018, 157, 166–171. [Google Scholar] [CrossRef]


| Resin | Ink | ||
|---|---|---|---|
| Component | Content | Component | Content |
| Propoxylated trimethylolpropane triacrylate (Arkema, Colombes, France) | 8.72 wt. % (20.30 vol. %) | Cyanoacrylate (Abcr, Karlsruhe, Germany) | 90.69 wt. % (96.89 vol. %) |
| Urethane dimethacrylate (Merck, Darmstadt, Germany) | 7.80 wt. % (13.71 vol. %) | Poly(propylene glycol) diacrylate (Merck, Darmstadt, Germany) | 6.11 wt. % (1.91 vol. %) |
| Poly(propylene glycol) (Merck, Darmstadt, Germany) | 10.52 wt. % (16.18 vol. %) | Rhodamine B (Merck, Darmstadt, Germany) | 0.12 wt. % (0.25 vol. %) |
| Polymeric dispersant (Lubrizol, Wickliffe, OH, USA) | 0.91 wt. % (1.49 vol. %) | Phenylbis (2,4,6-trimethylbenzoyl)-phosphine oxide (BAPO) (Merck, Darmstadt, Germany) | 3.08 wt. % (0.95 vol. %) |
| Silica (Merck, Darmstadt, Germany) | 0.36 wt. % (3.73 vol. %) | ||
| 2,2-Dihydroxy-4,4-dimethoxybenzophenone (TCI, Tokyo, Japan) | 0.01 wt. % (0.03 vol. %) | ||
| (2,4,6-trimethylbenzoyl)-phenylethoxyphosphine oxide (TPO-L) (Lambson, Wetherby, UK) | 0.04 wt. % (0.07 vol. %) | ||
| β-Tricalcium phosphate (Merck, Darmstadt, Germany) | 71.64 wt. % (44.48 vol. %) | ||
| Group | Composition | Manufacturing System |
|---|---|---|
| A | Resin | DLP |
| B | Resin and ink (blended) | DLP |
| C | Resin and ink (hybrid structure) | DLP and inkjet system |
| Group | Sample | Length [mm] | Width [mm] | Height [mm] | Layers DLP | Layer Thickness DLP [µm] | Layers Inkjet | Layer Thickness Inkjet [µm] |
|---|---|---|---|---|---|---|---|---|
| A | Dynstat | 15 | 10 | 4 | 160 | 25 | 0 | 0 |
| A | Bending | 40 | 25 | 2 | 80 | 25 | 0 | 0 |
| A | DMA | 25 | 4 | 2 | 80 | 25 | 0 | 0 |
| B | Dynstat | 15 | 10 | 4 | 160 | 25 | 0 | 0 |
| B | Bending | 40 | 25 | 2 | 80 | 25 | 0 | 0 |
| B | DMA | 25 | 4 | 2 | 80 | 25 | 0 | 0 |
| C | Dynstat | 15 | 10 | 4 | 160 | 18 | 160 | 7 |
| C | Bending | 40 | 25 | 2 | 80 | 18 | 80 | 7 |
| C | DMA | 25 | 4 | 2 | 80 | 18 | 80 | 7 |
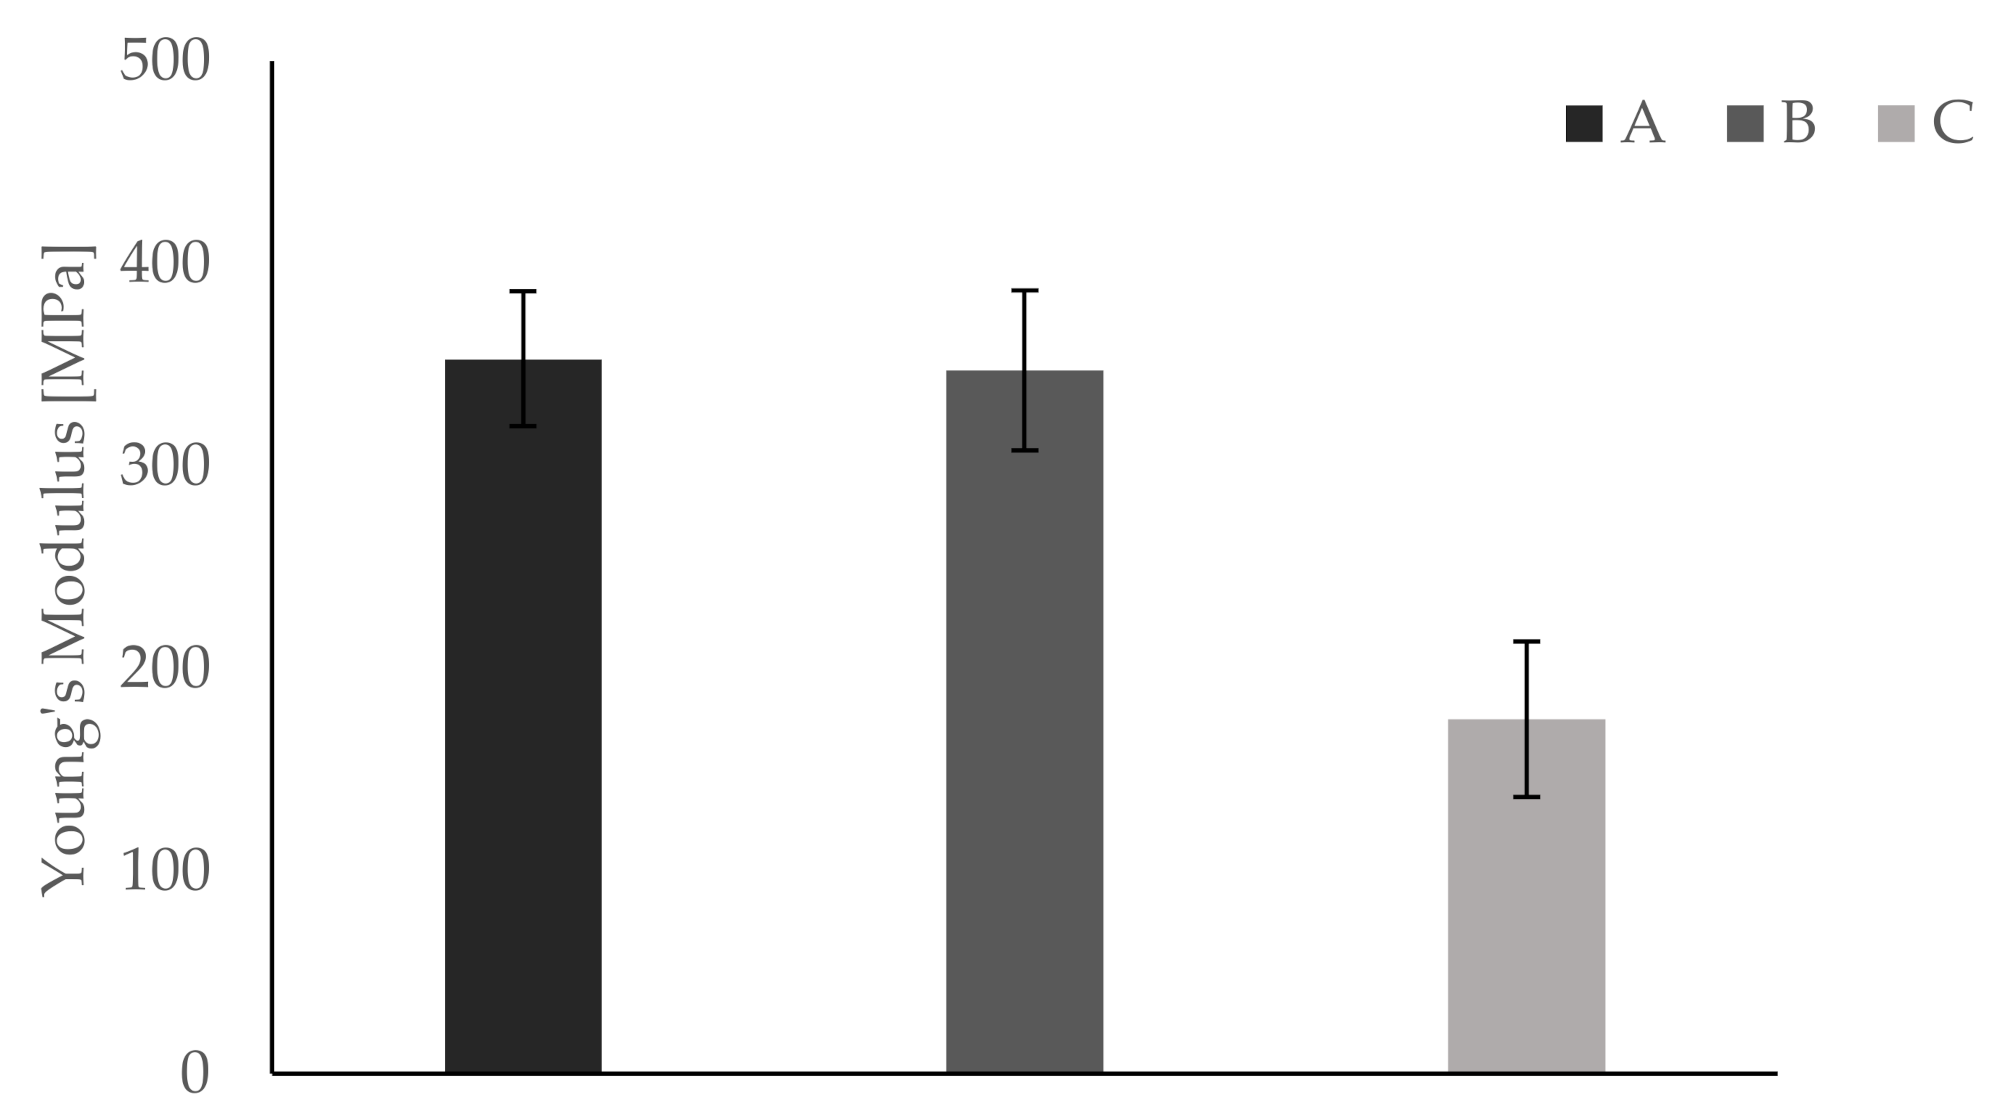
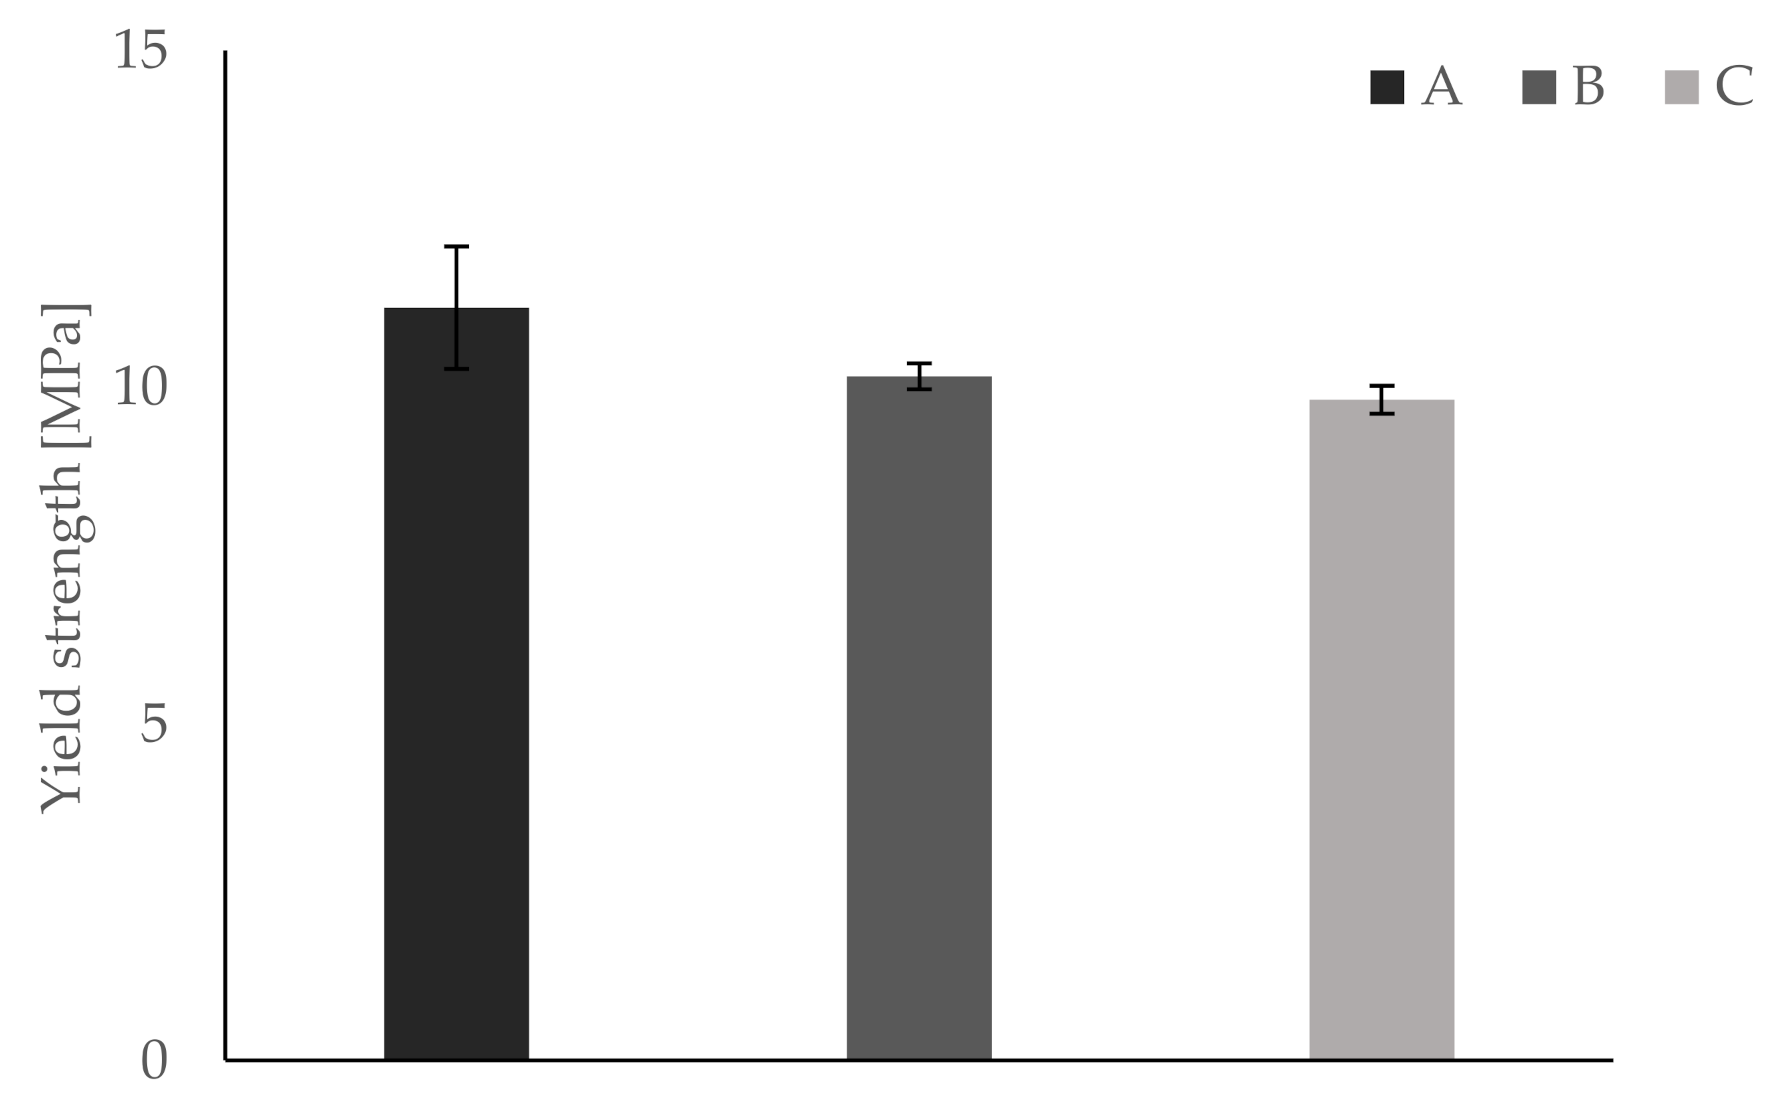
| Parameter | Group A | Group B | Group C |
|---|---|---|---|
| Young’s modulus [MPa] | 353. 00 ± 33.91 | 347.25 ± 39.48 | 175.00 ± 38.41 |
| Yield strength [MPa] | 11.18 ± 0.91 | 10.16 ± 0.19 | 9.81 ± 0.21 |
| Elongation at break [%] | 3.32 ± 0.24 | 3.10 ± 0.24 | 4.05 ± 0.45 |
Publisher’s Note: MDPI stays neutral with regard to jurisdictional claims in published maps and institutional affiliations. |
© 2020 by the authors. Licensee MDPI, Basel, Switzerland. This article is an open access article distributed under the terms and conditions of the Creative Commons Attribution (CC BY) license (http://creativecommons.org/licenses/by/4.0/).
Share and Cite
Stögerer, J.; Baumgartner, S.; Hochwallner, A.; Stampfl, J. Bio-Inspired Toughening of Composites in 3D-Printing. Materials 2020, 13, 4714. https://doi.org/10.3390/ma13214714
Stögerer J, Baumgartner S, Hochwallner A, Stampfl J. Bio-Inspired Toughening of Composites in 3D-Printing. Materials. 2020; 13(21):4714. https://doi.org/10.3390/ma13214714
Chicago/Turabian StyleStögerer, Johannes, Sonja Baumgartner, Alexander Hochwallner, and Jürgen Stampfl. 2020. "Bio-Inspired Toughening of Composites in 3D-Printing" Materials 13, no. 21: 4714. https://doi.org/10.3390/ma13214714