Flexural and Shear Tests on Reinforced Concrete Bridge Deck Slab Segments with a Textile-Reinforced Concrete Strengthening Layer


Abstract
:1. Introduction
2. Concept of the Strengthening Layer
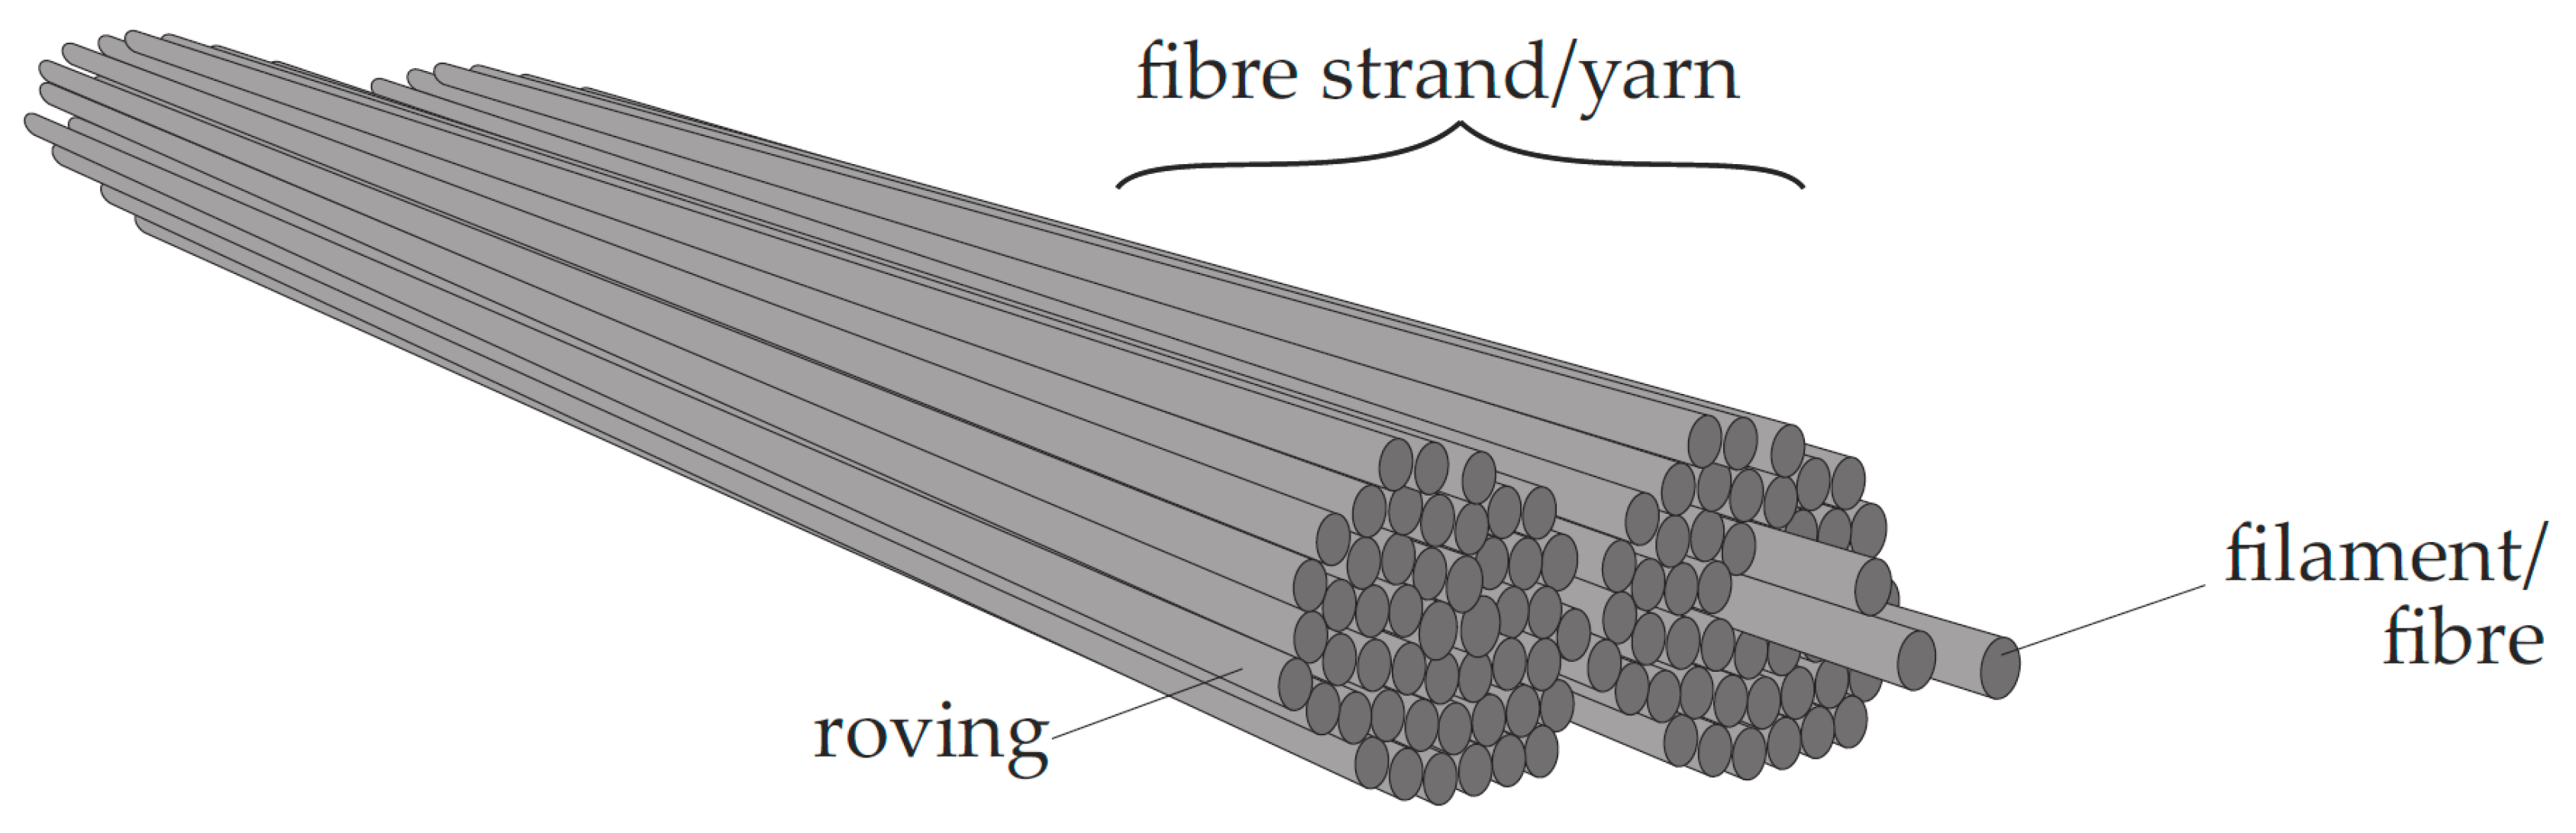
2.1. Textile-Reinforced Concrete
2.2. Characteristics of SMART-DECK
2.2.1. Intended Functions and Main Questions
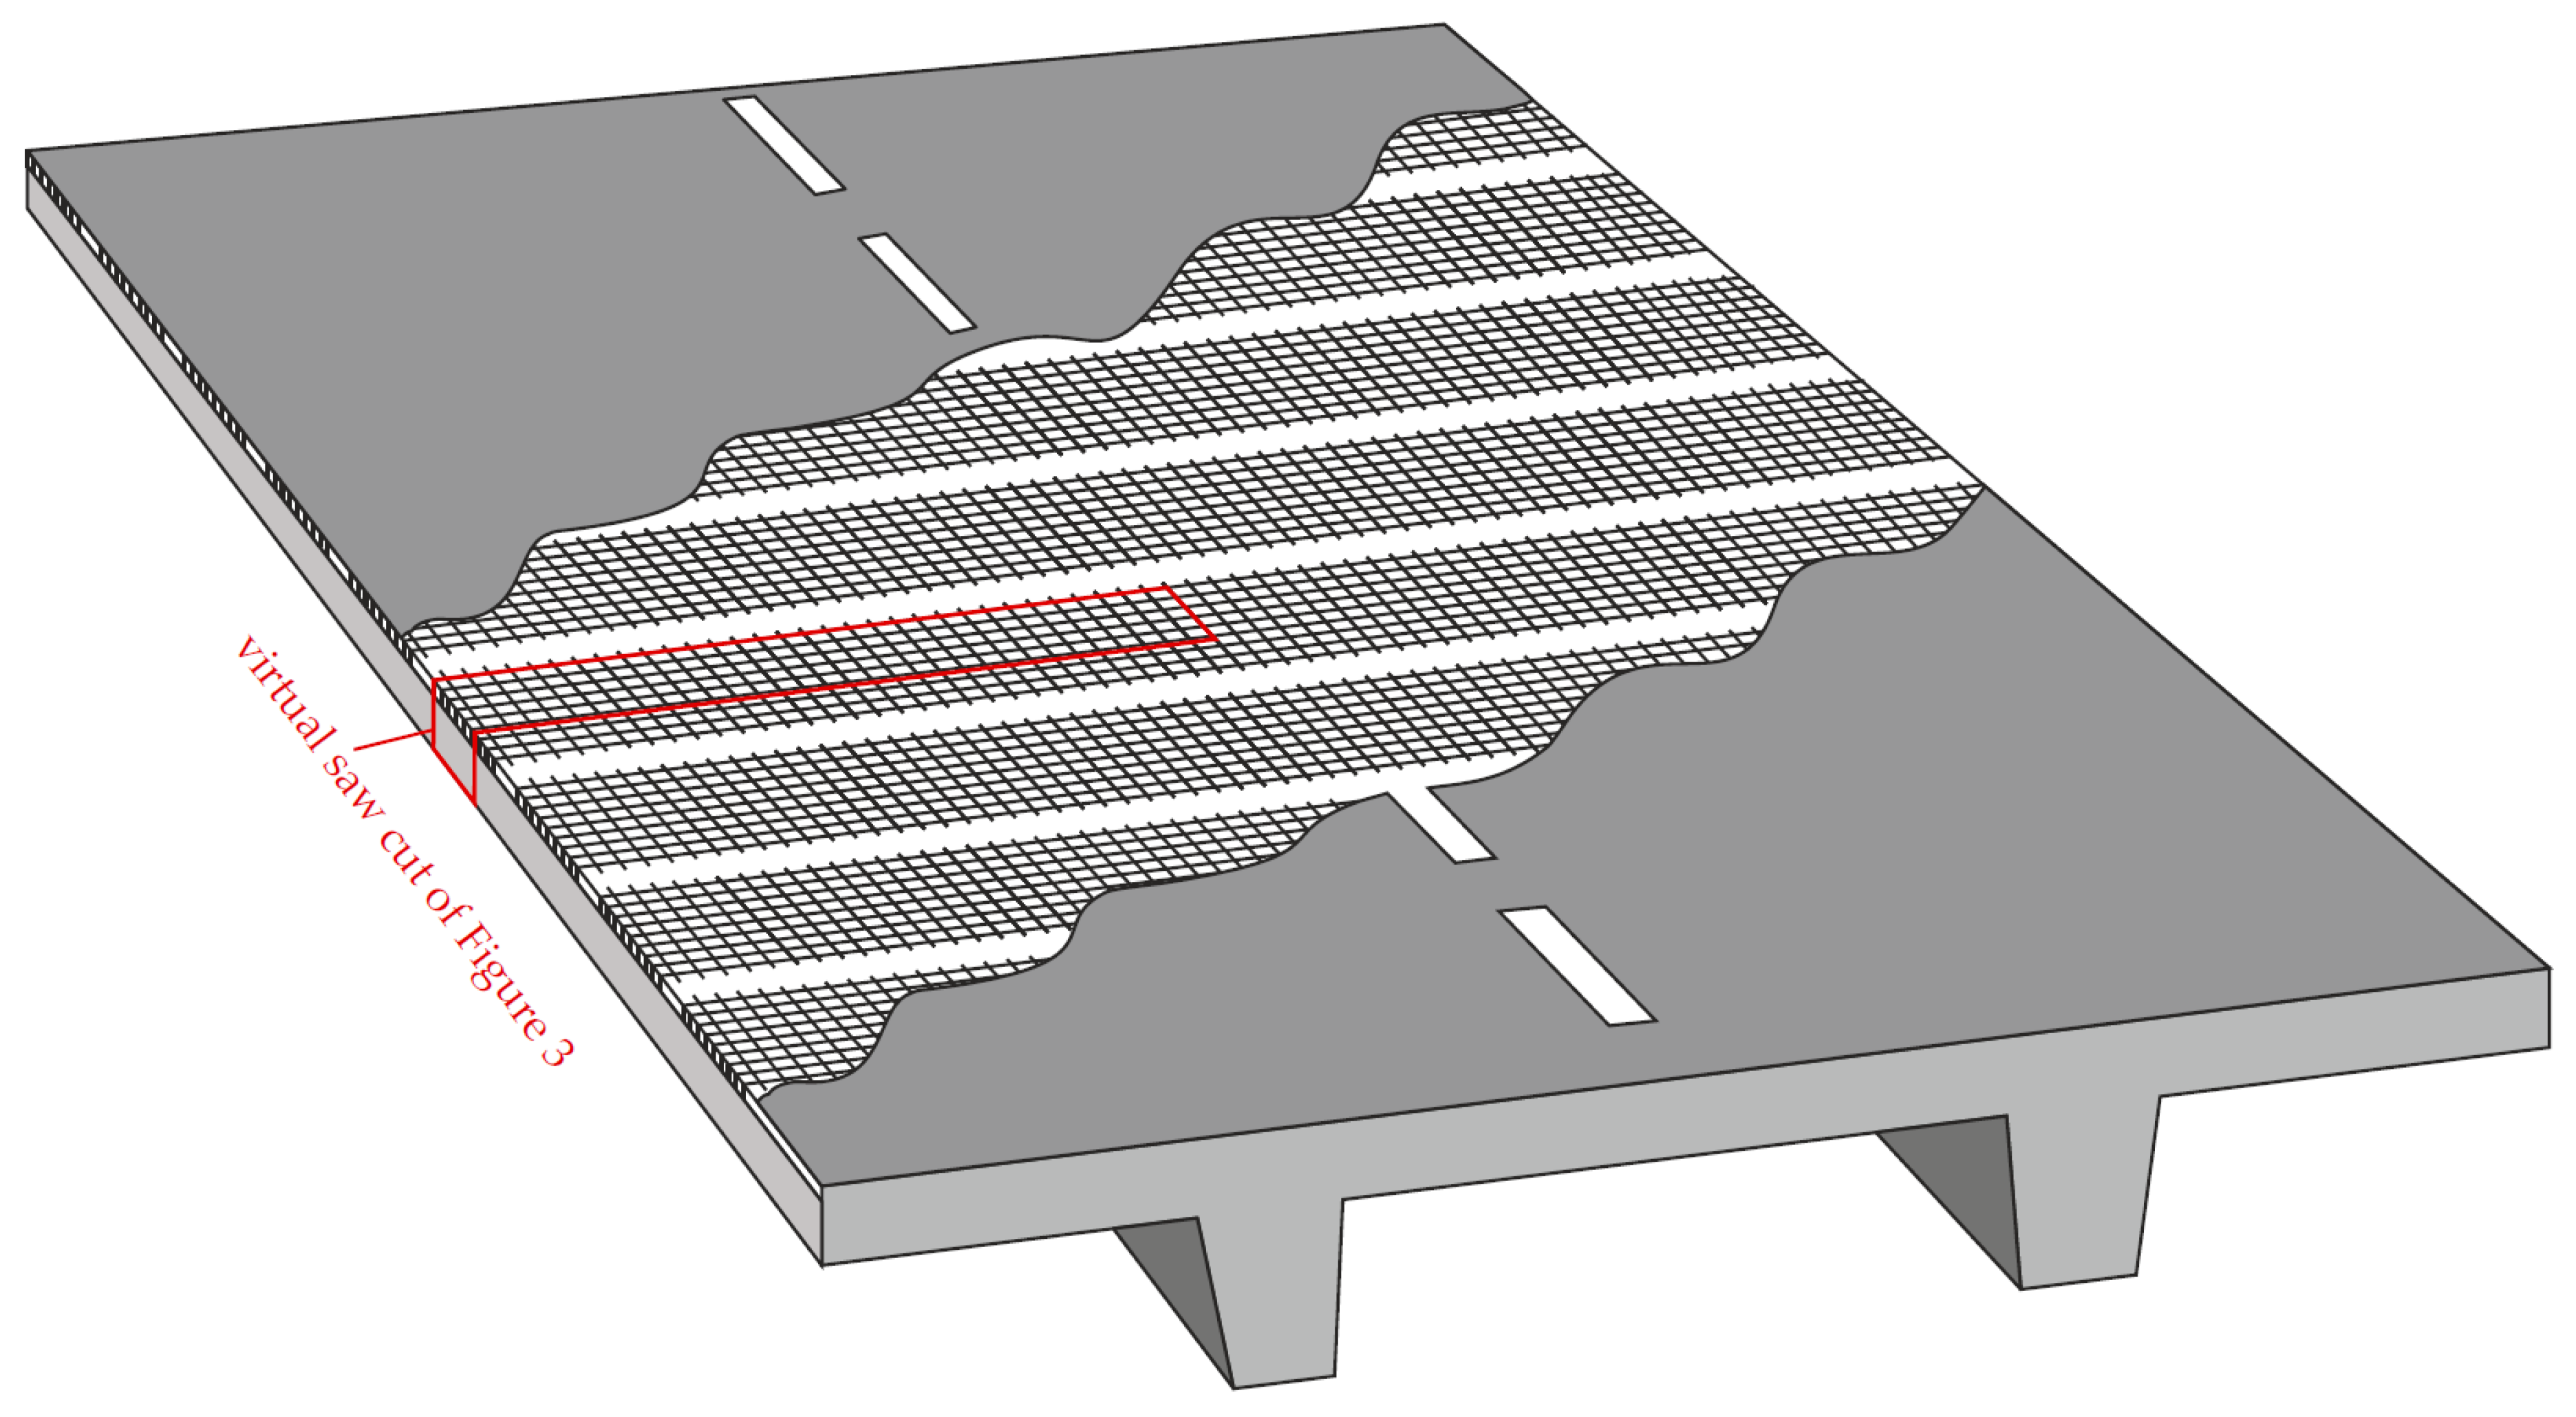
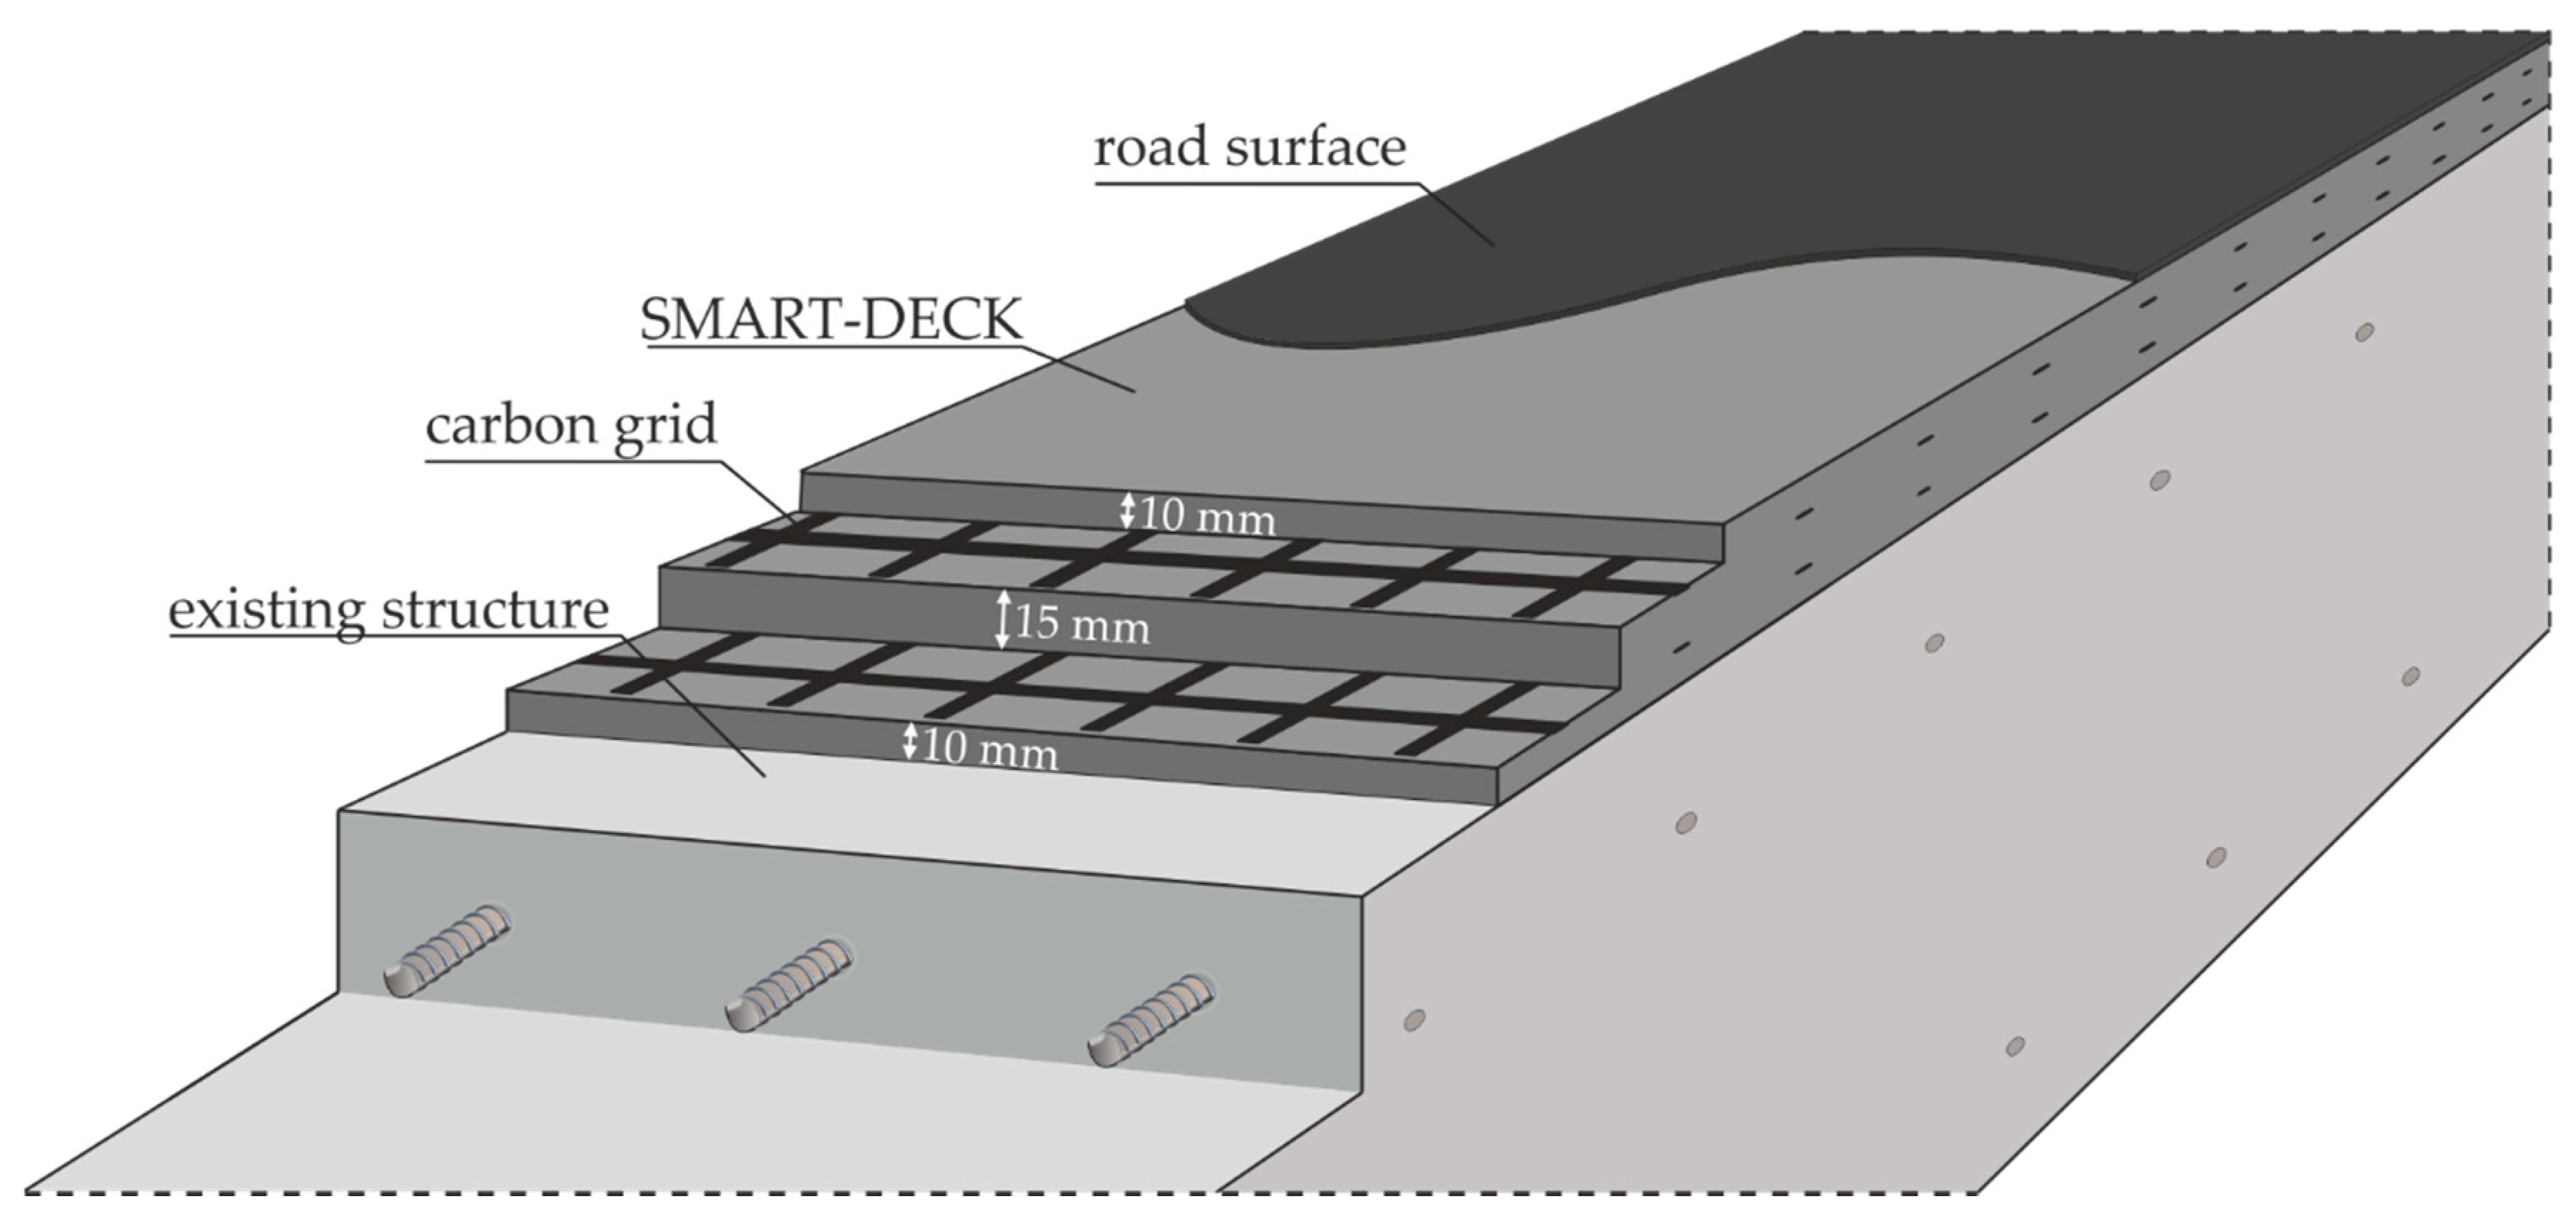
2.2.2. Layout
2.3. Previous Investigations
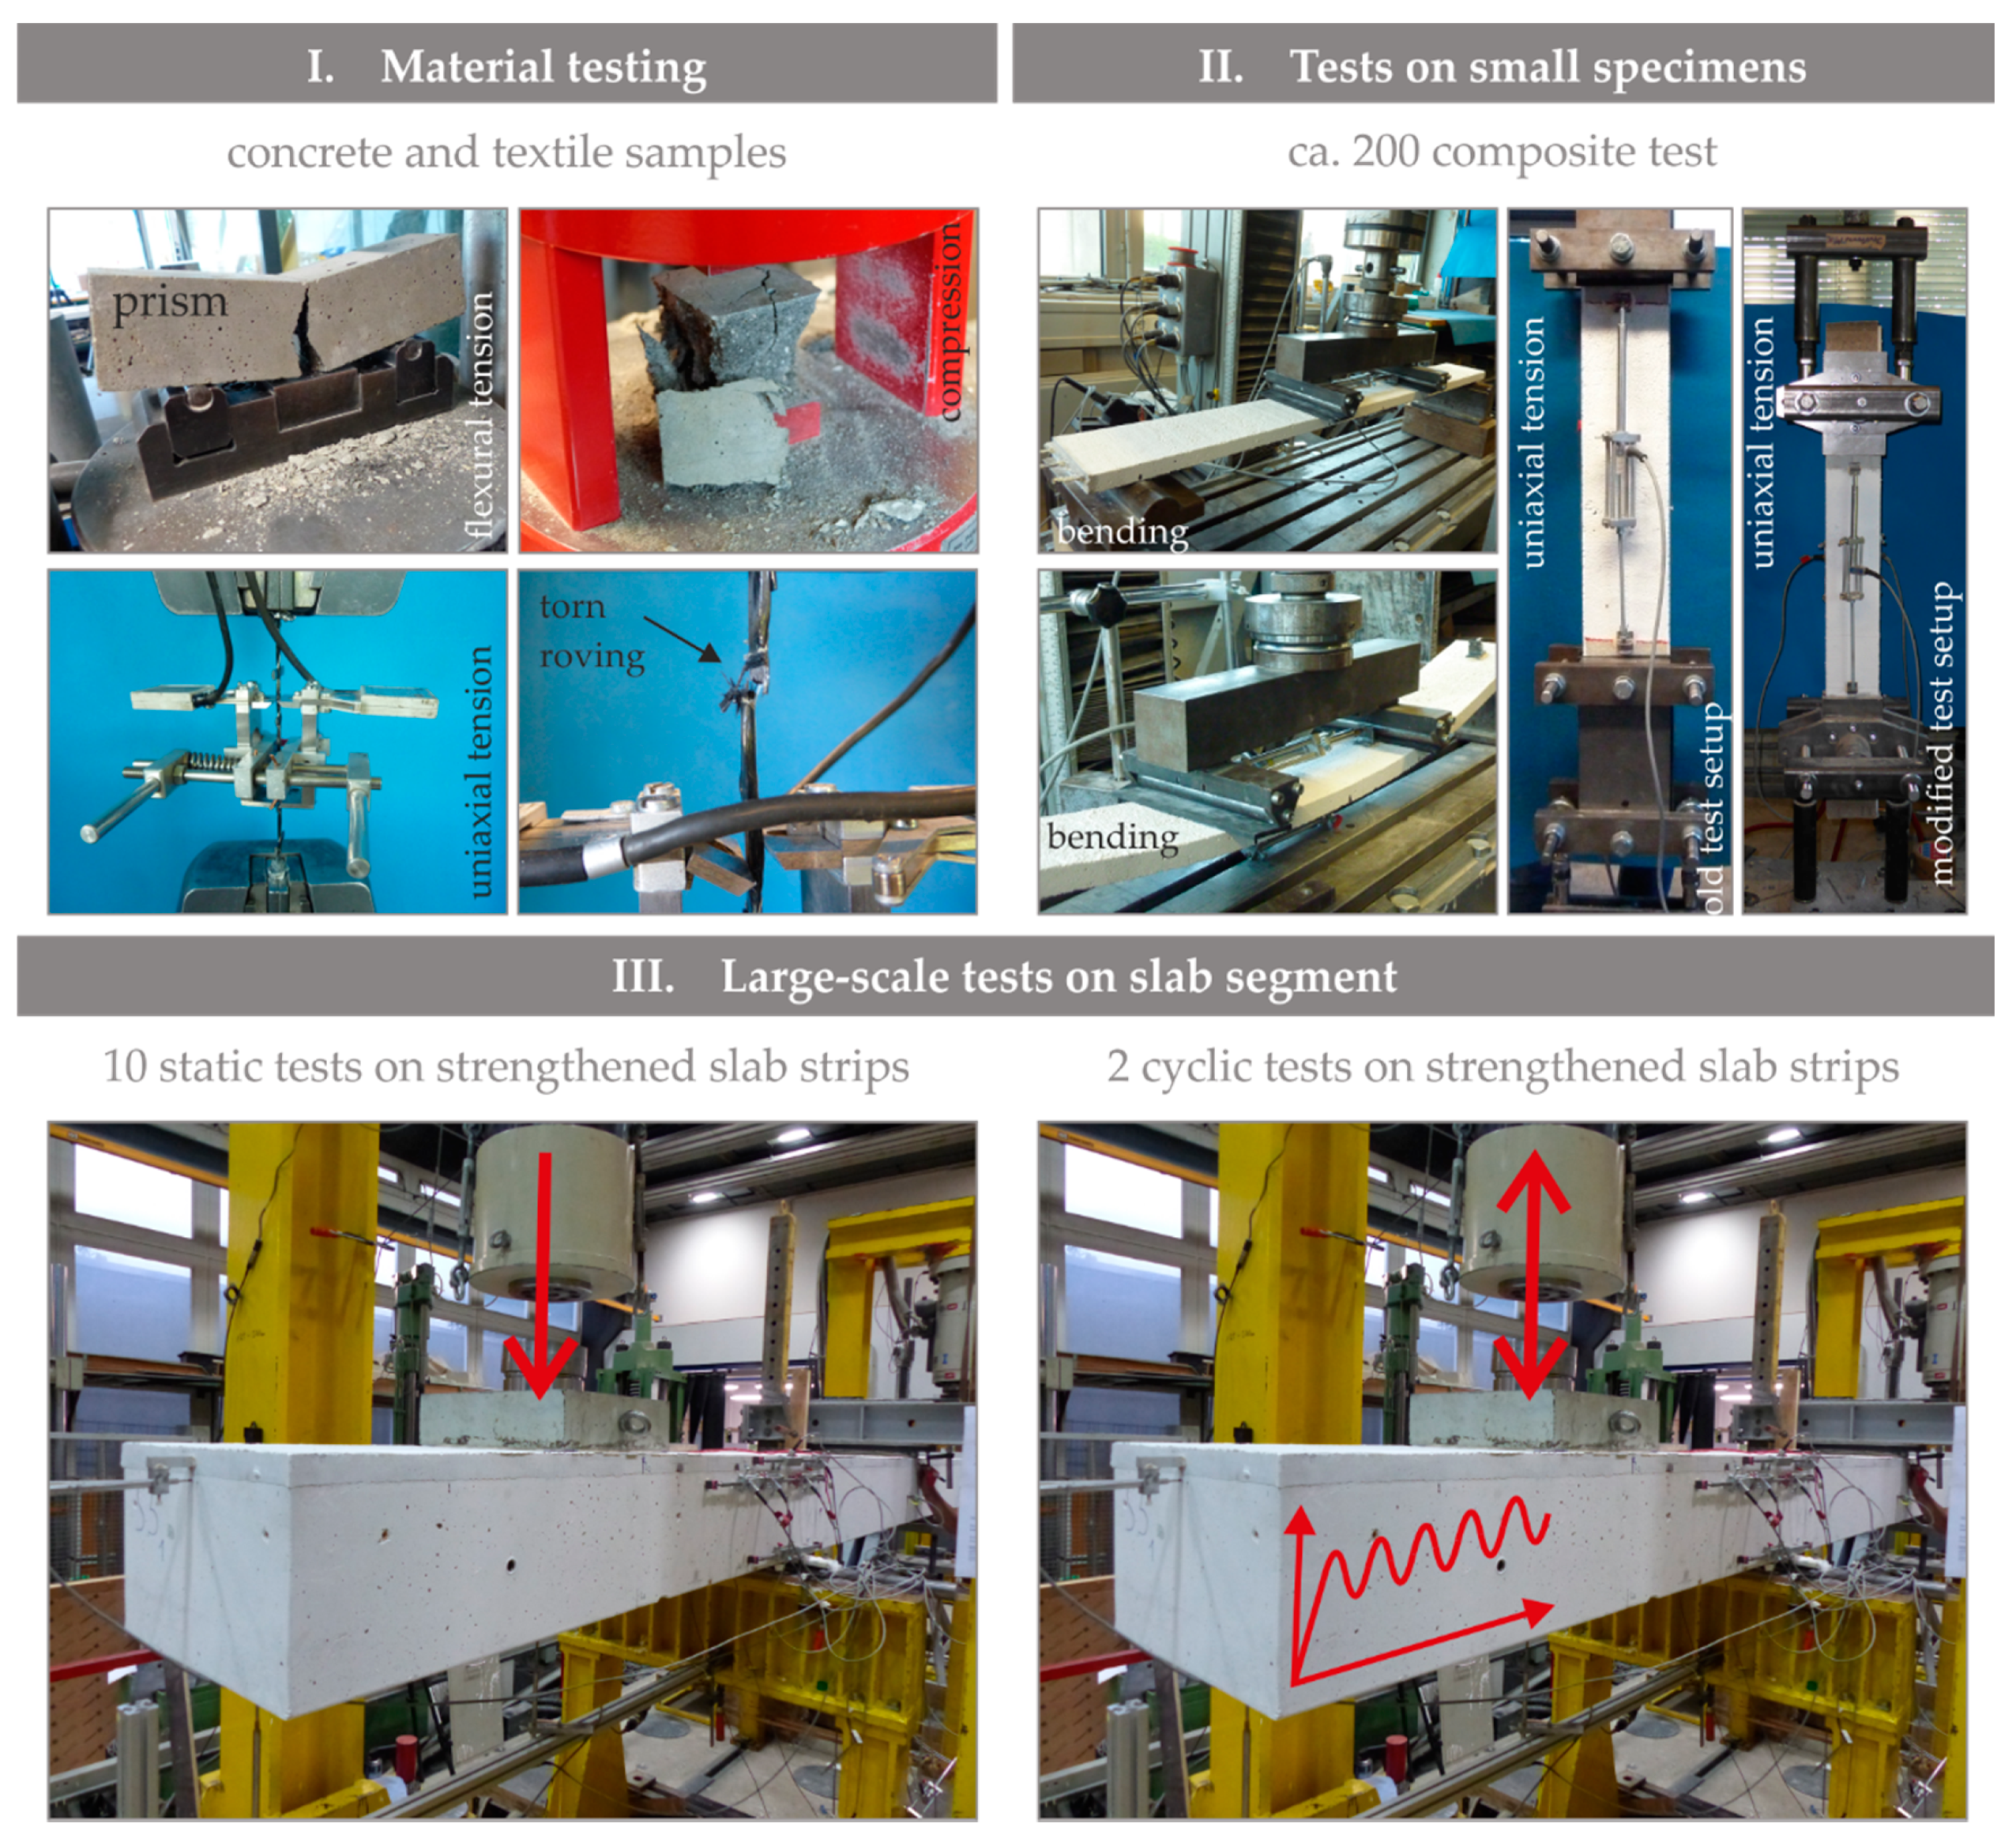
3. Experimental Programme and Results of Small-Scale Tests
3.1. General
- X: test type (B: Bending, T: Tensile)
- Y: applied mortar (consecutive number from the material notation)
- Z: applied textile (consecutive number from the material notation)
3.2. Uniaxial Tensile Tests on Individual Fibre Strands
3.3. Small-Scale Tests on the Composite
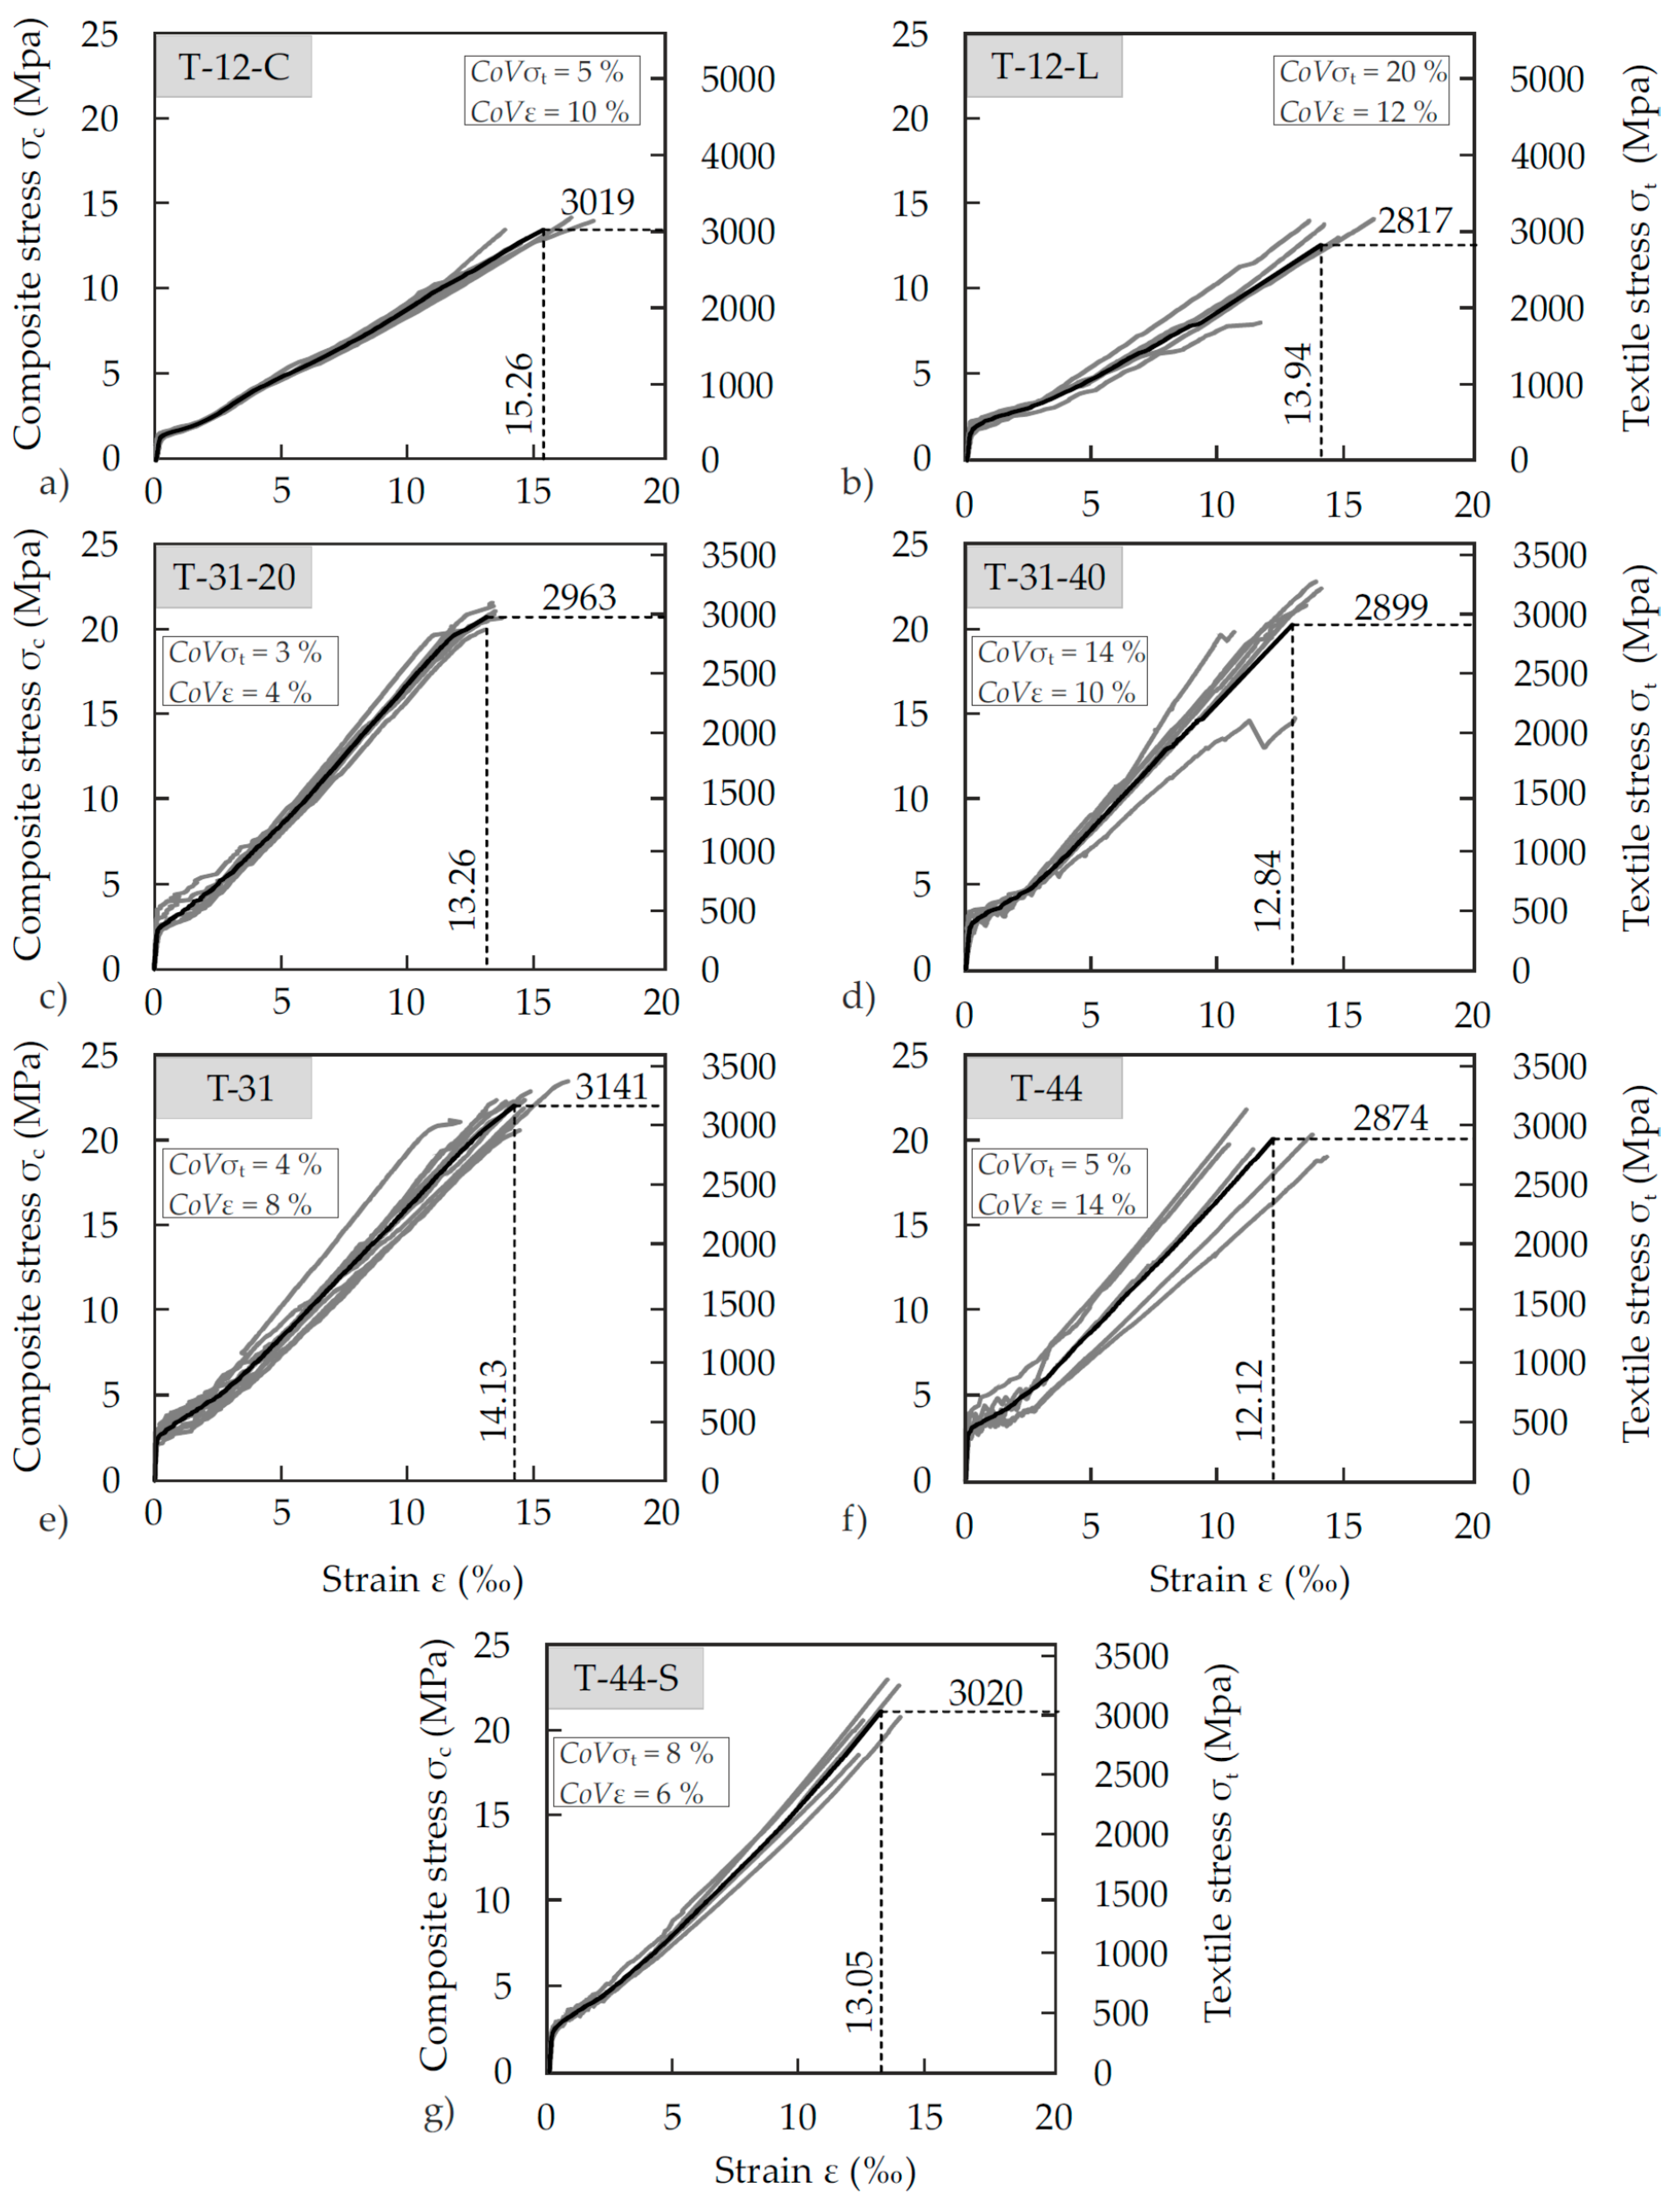
- Series 2: number of textile layers → two layers were tested as in the actual strengthening layer (indication 40 mm depth) or one layer as in the description above (indication 20).
- Series 3: water-to-cement ratio of the mortar.
4. Large-Scale Tests
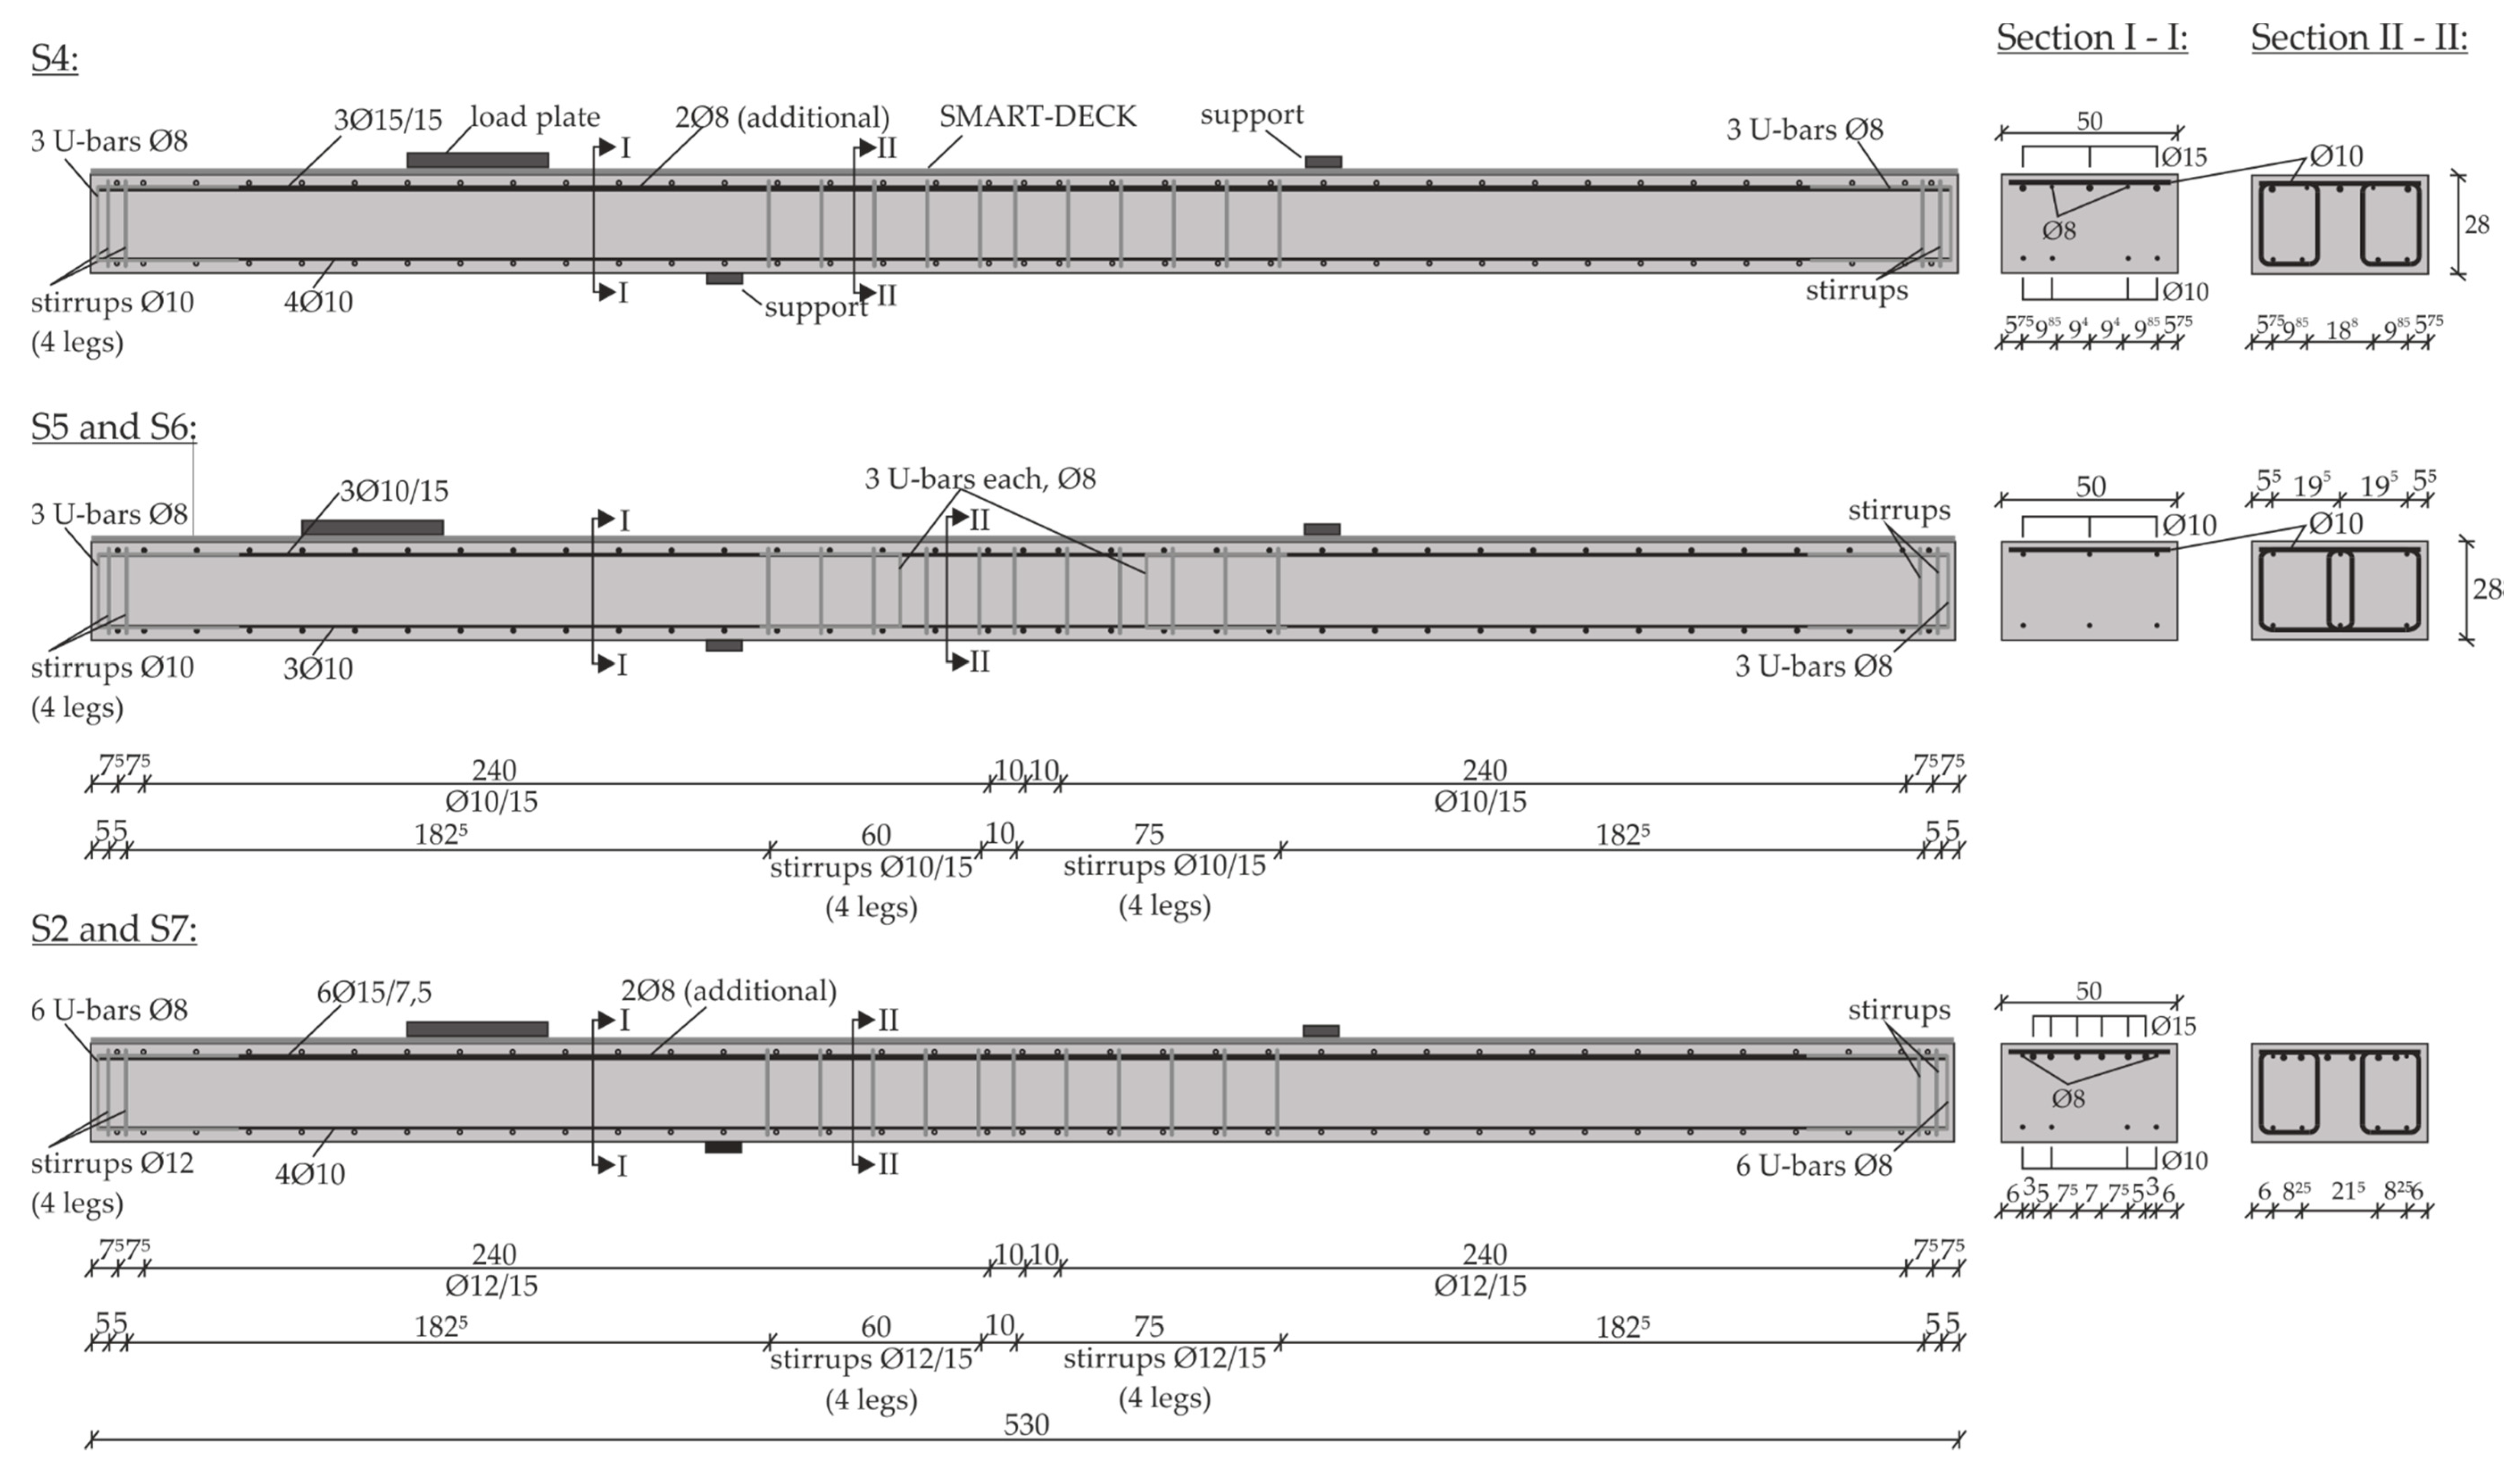
4.1. Design and Materials
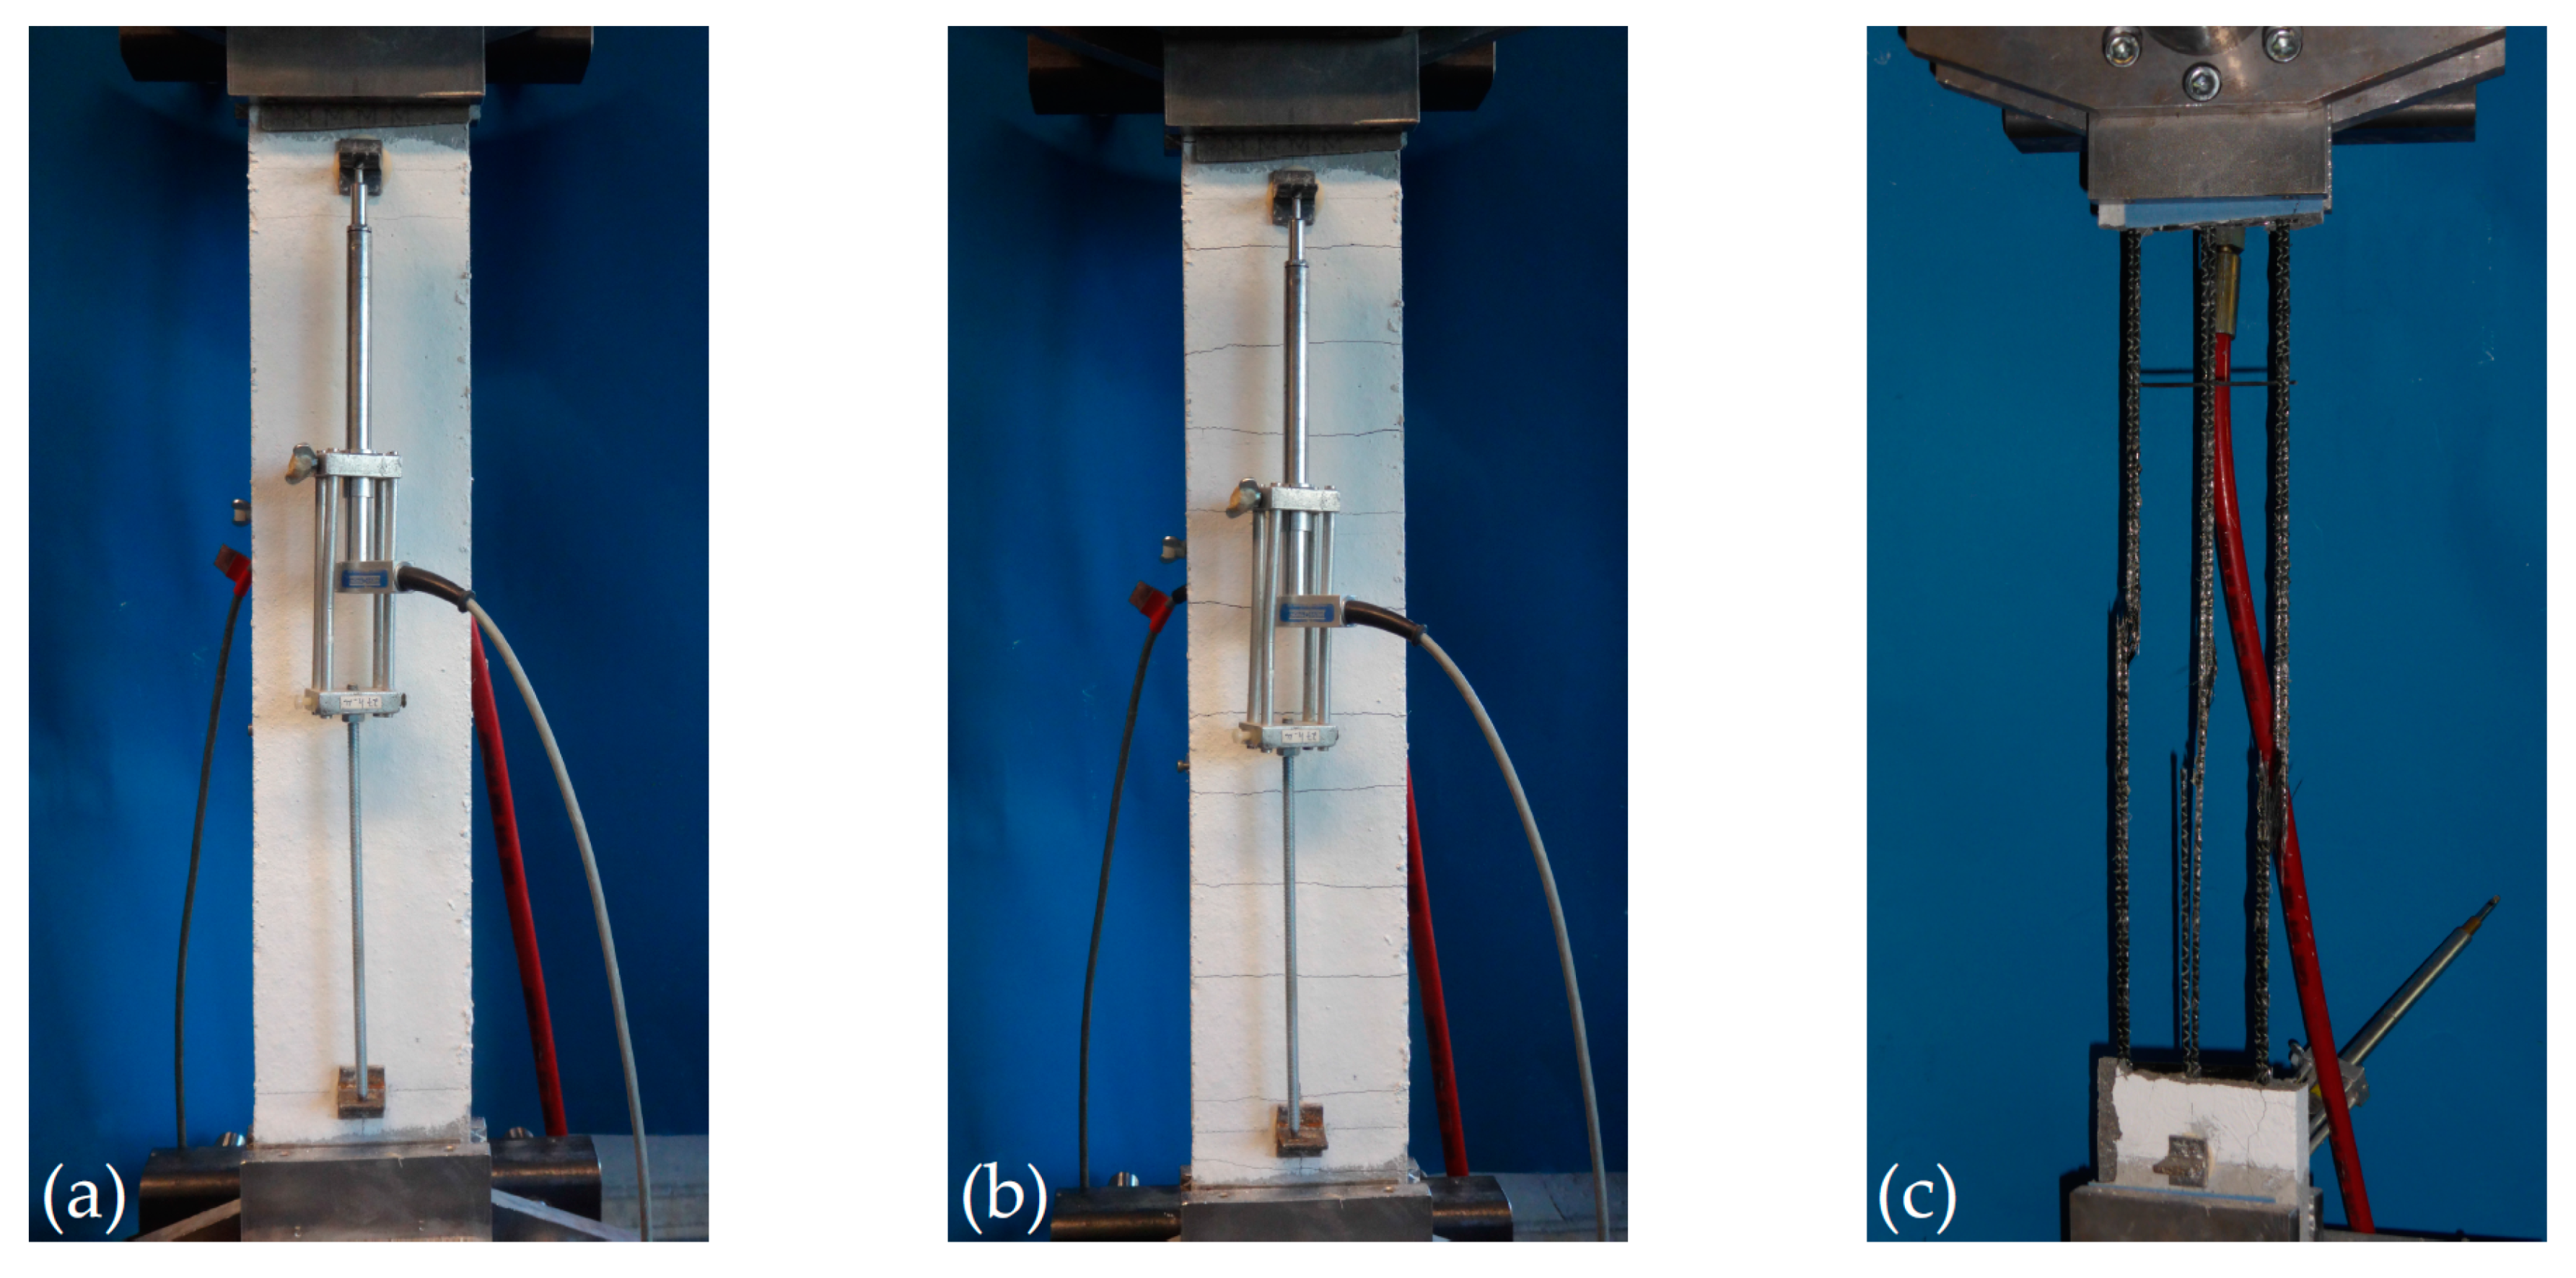
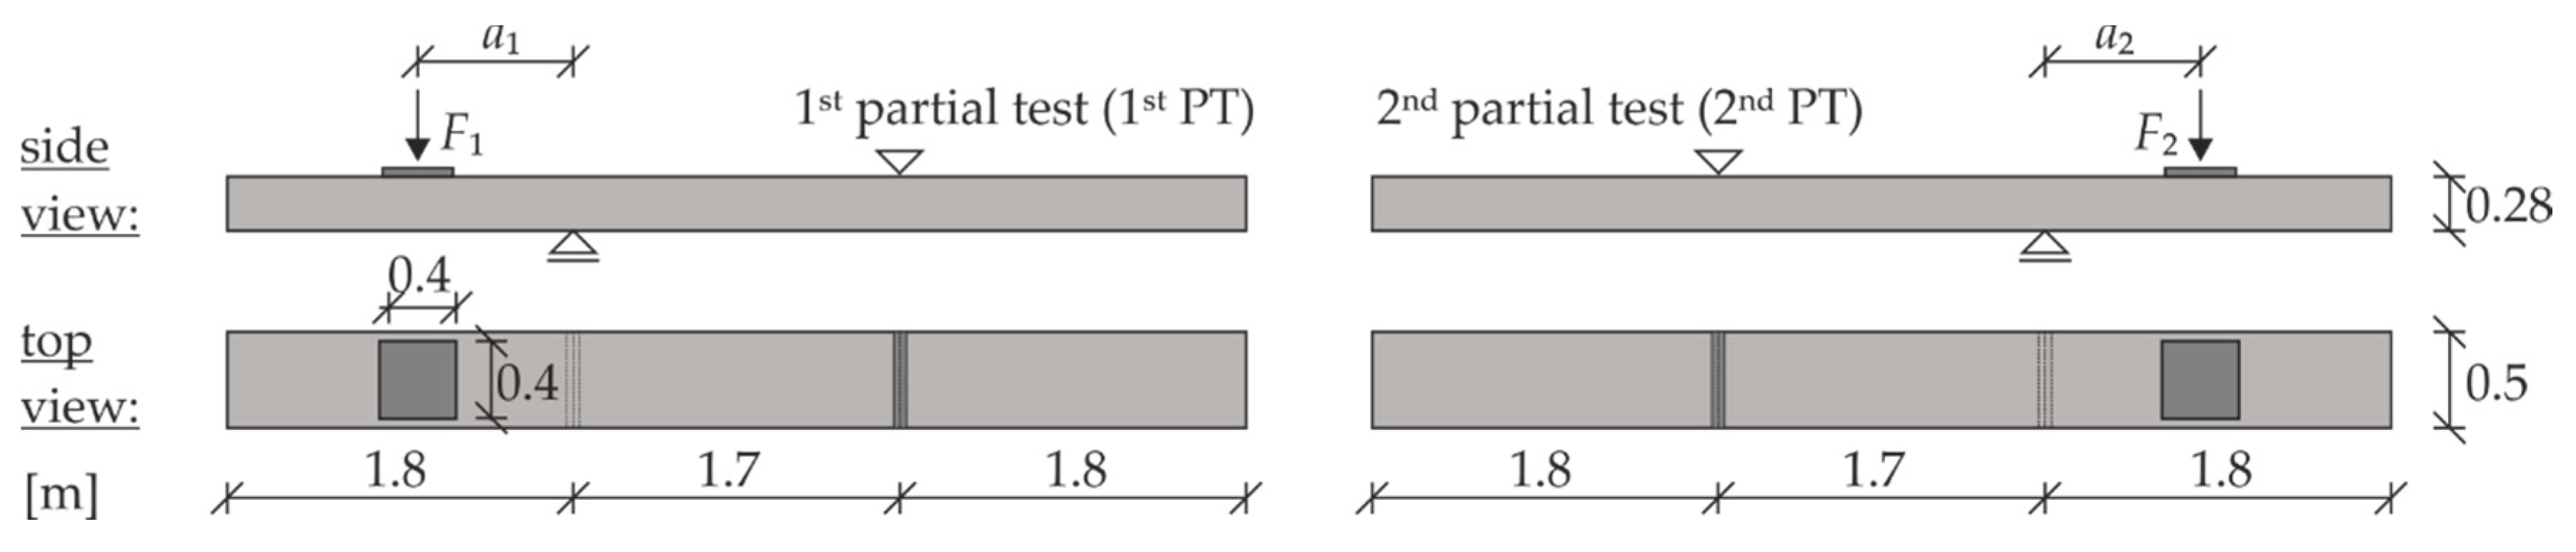
4.2. Test Setup
4.3. Results of Tests with Static Loading
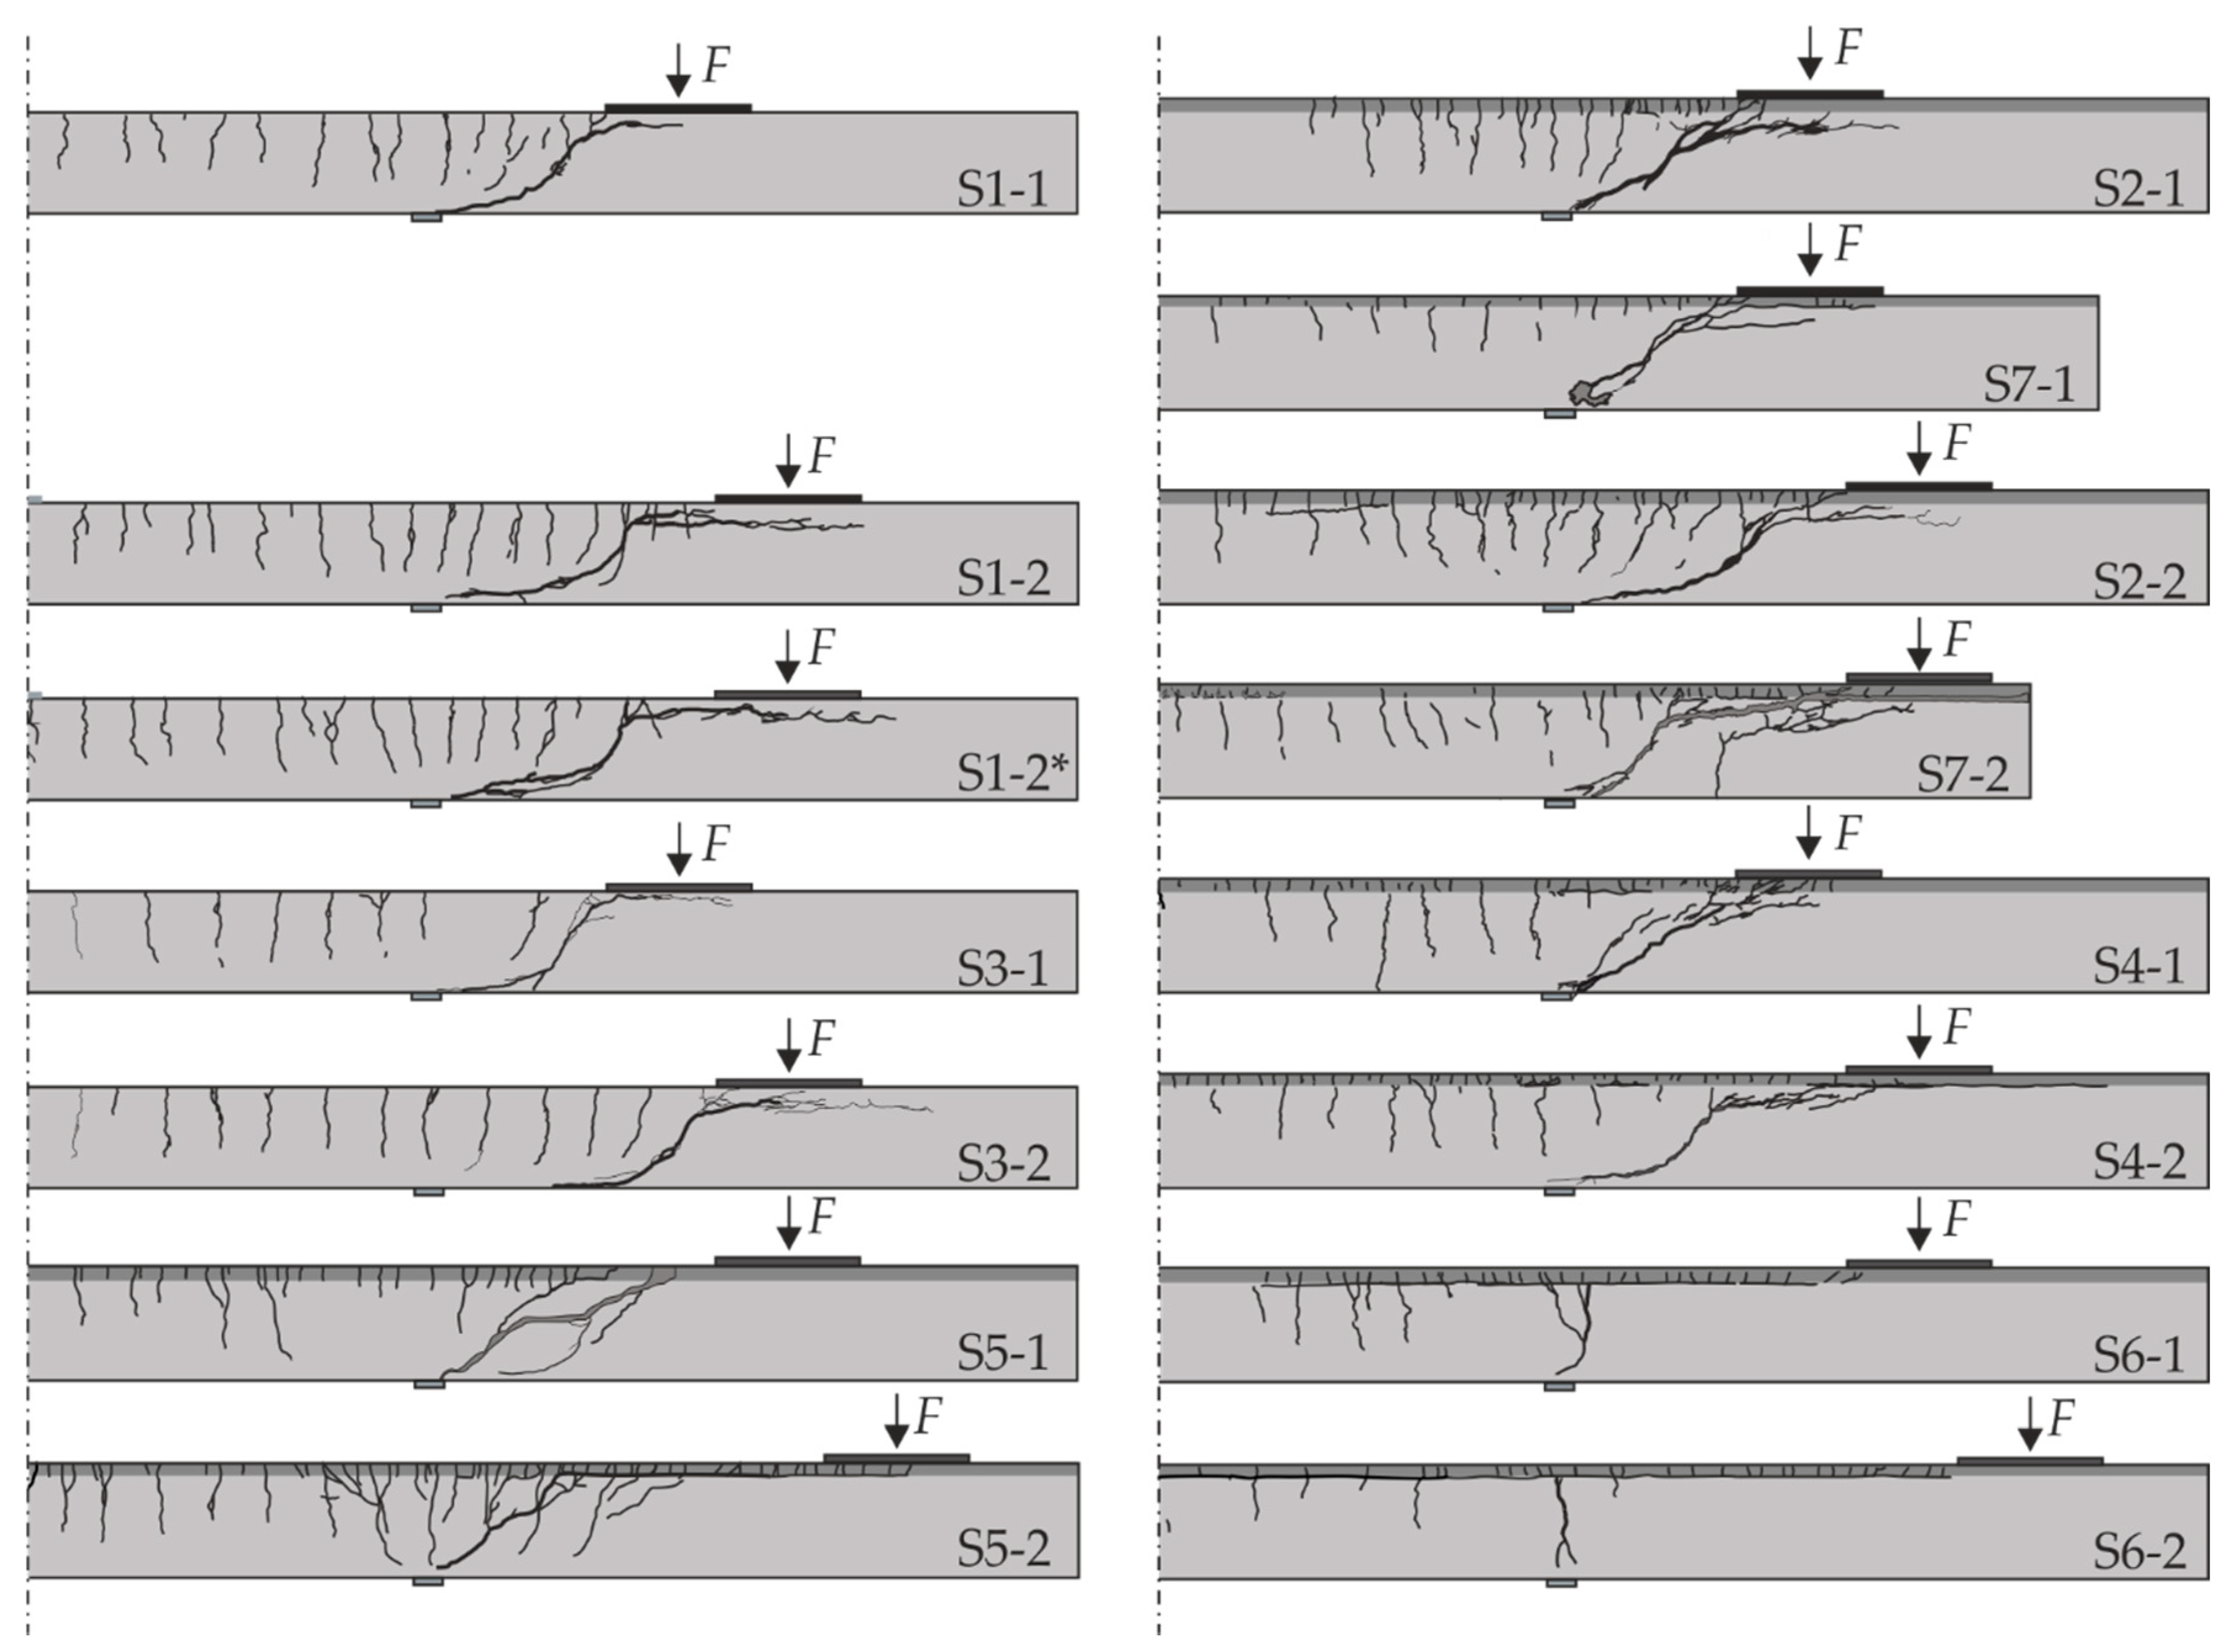
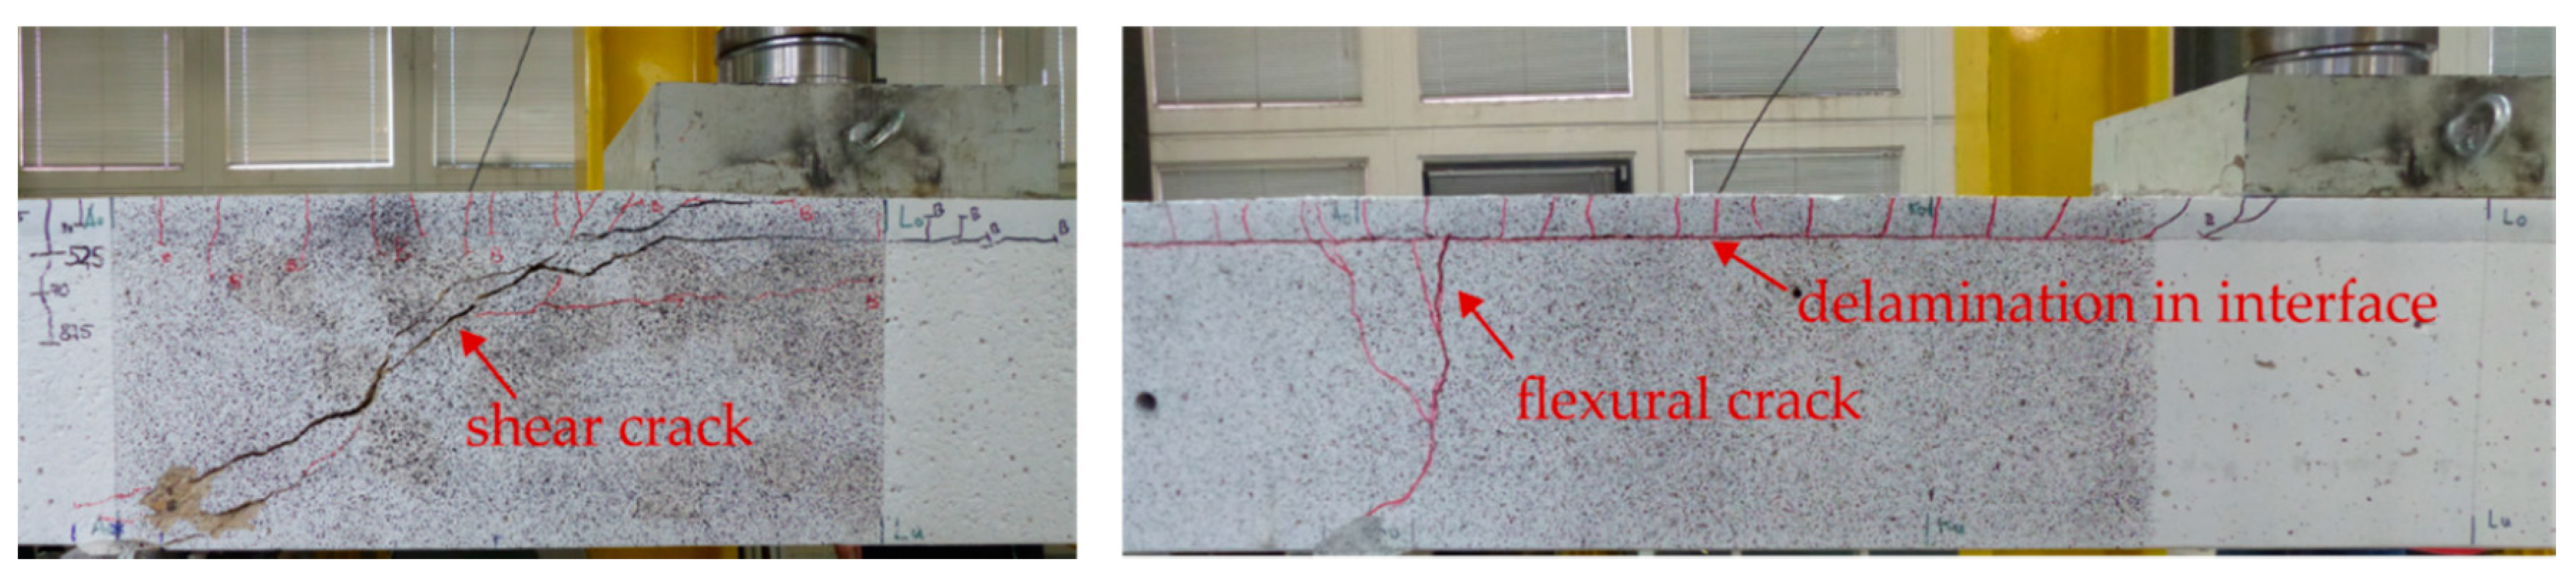
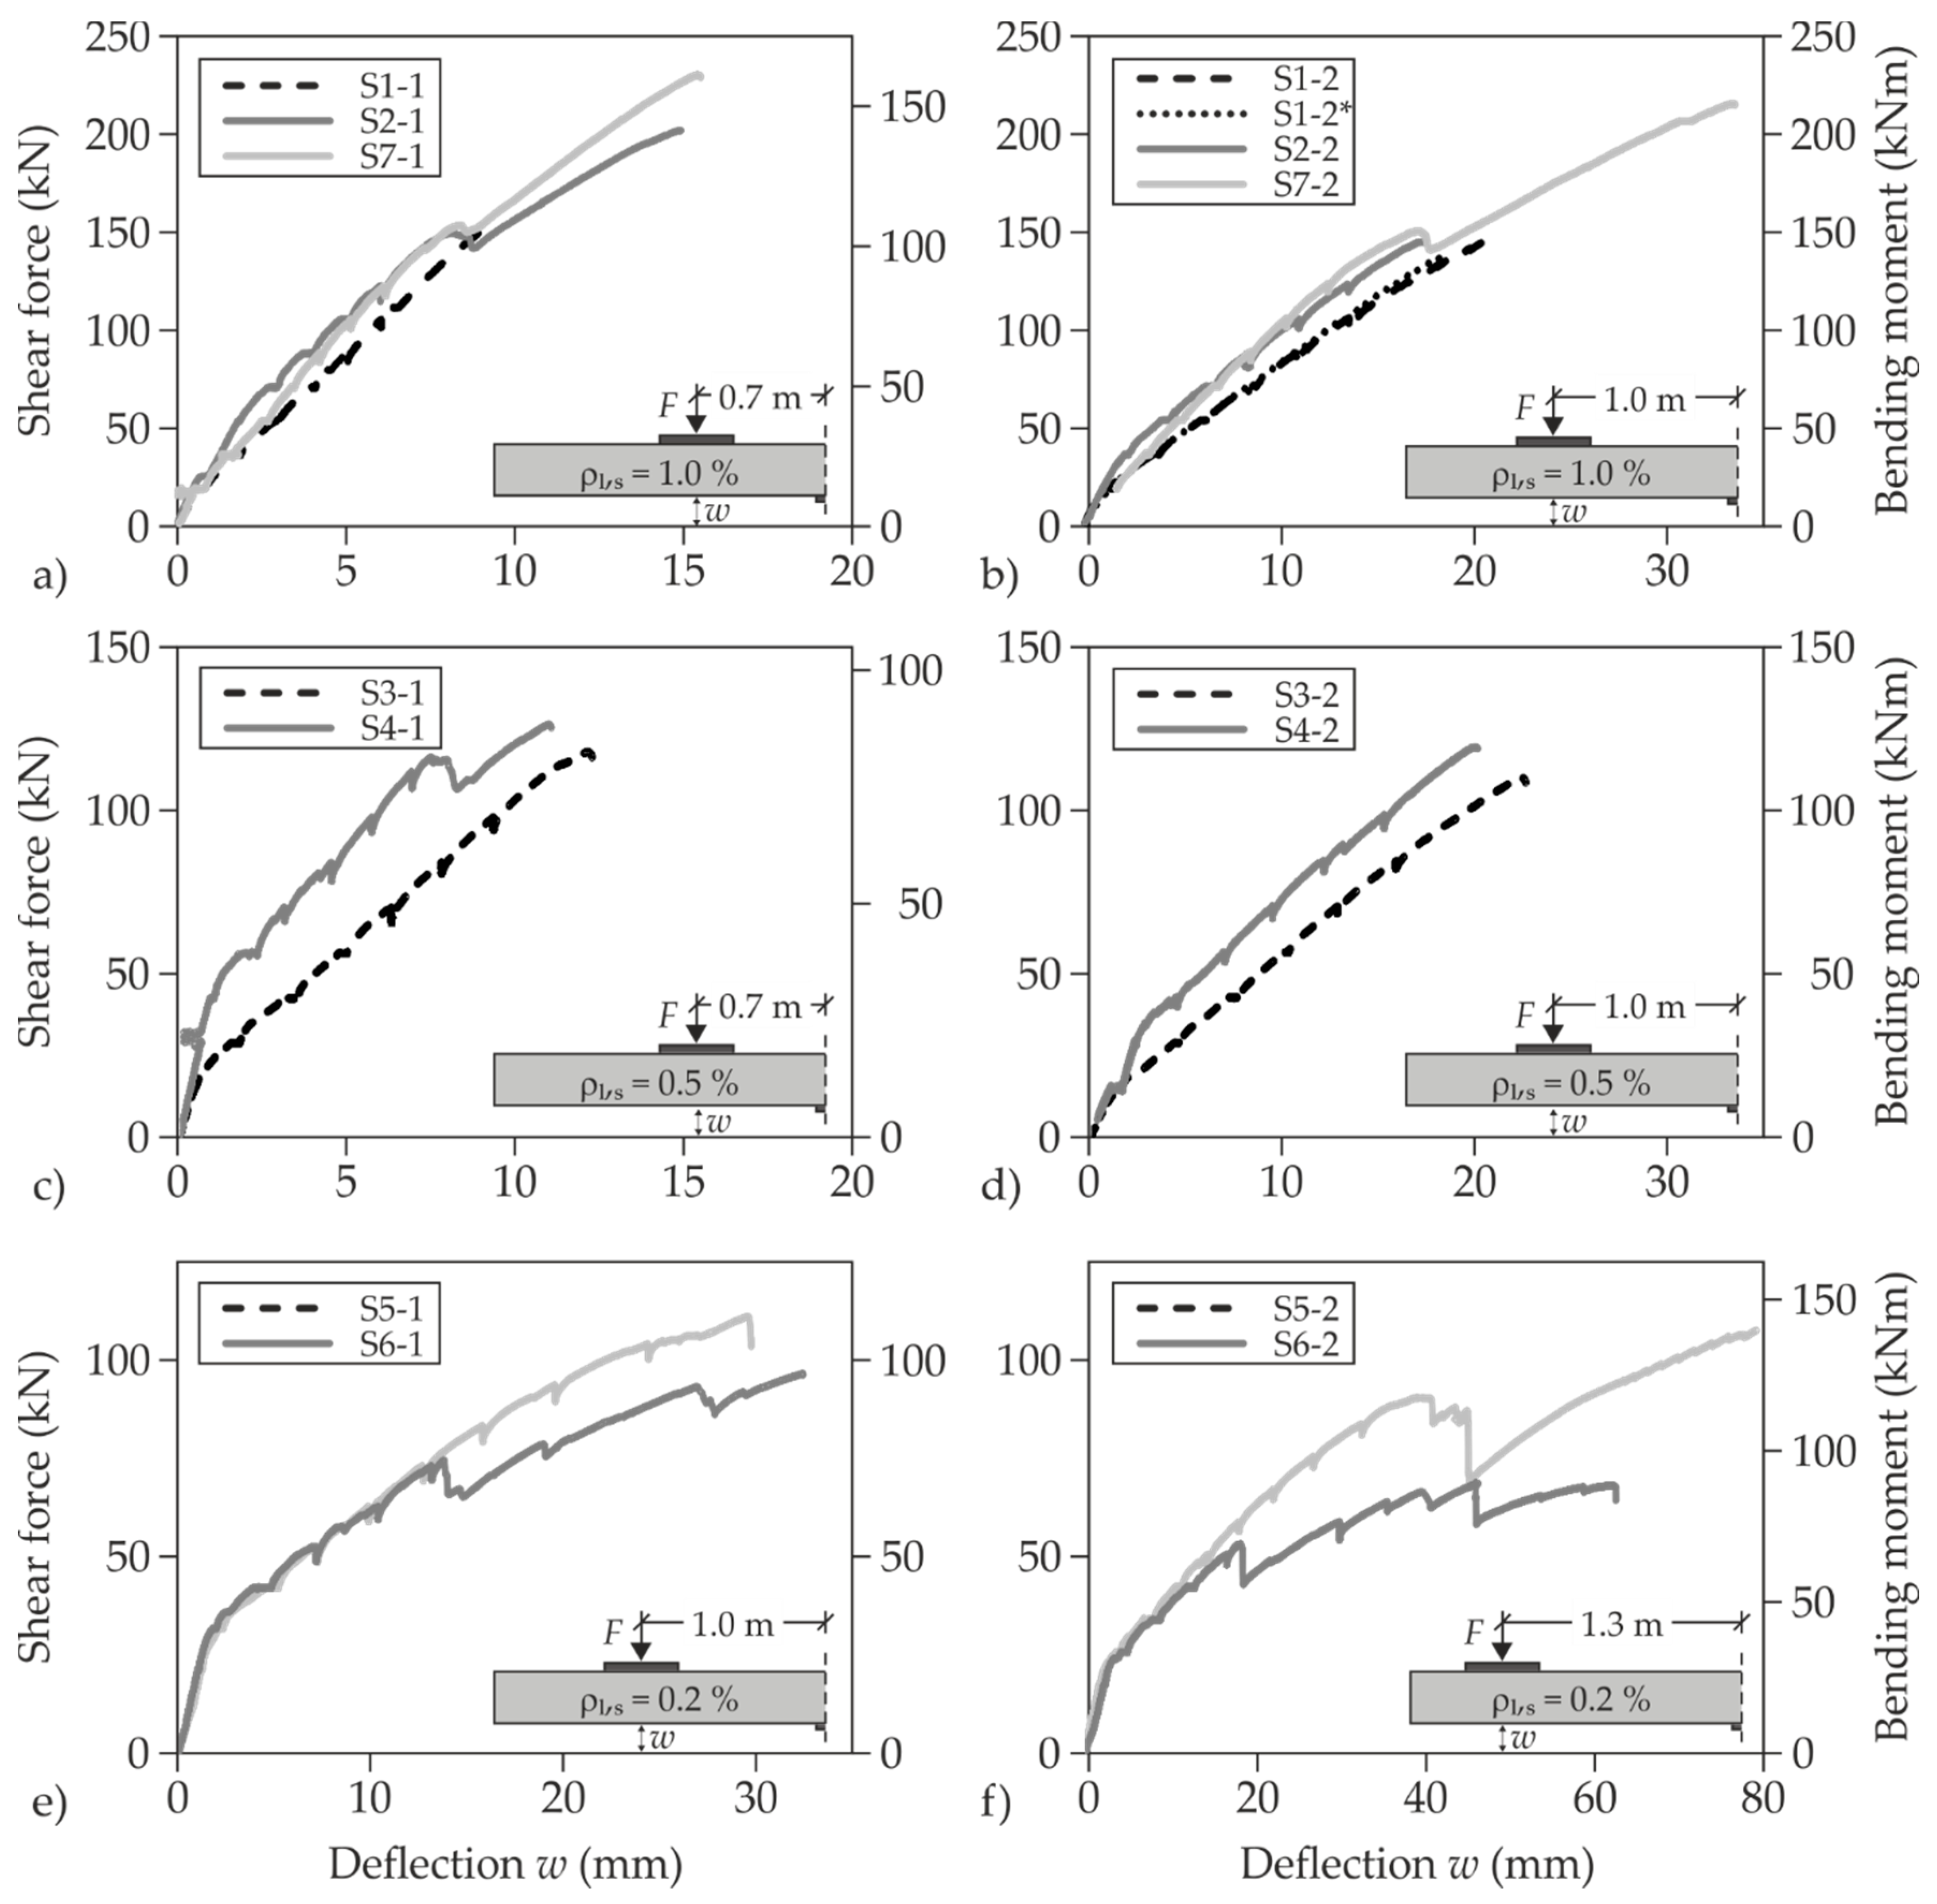
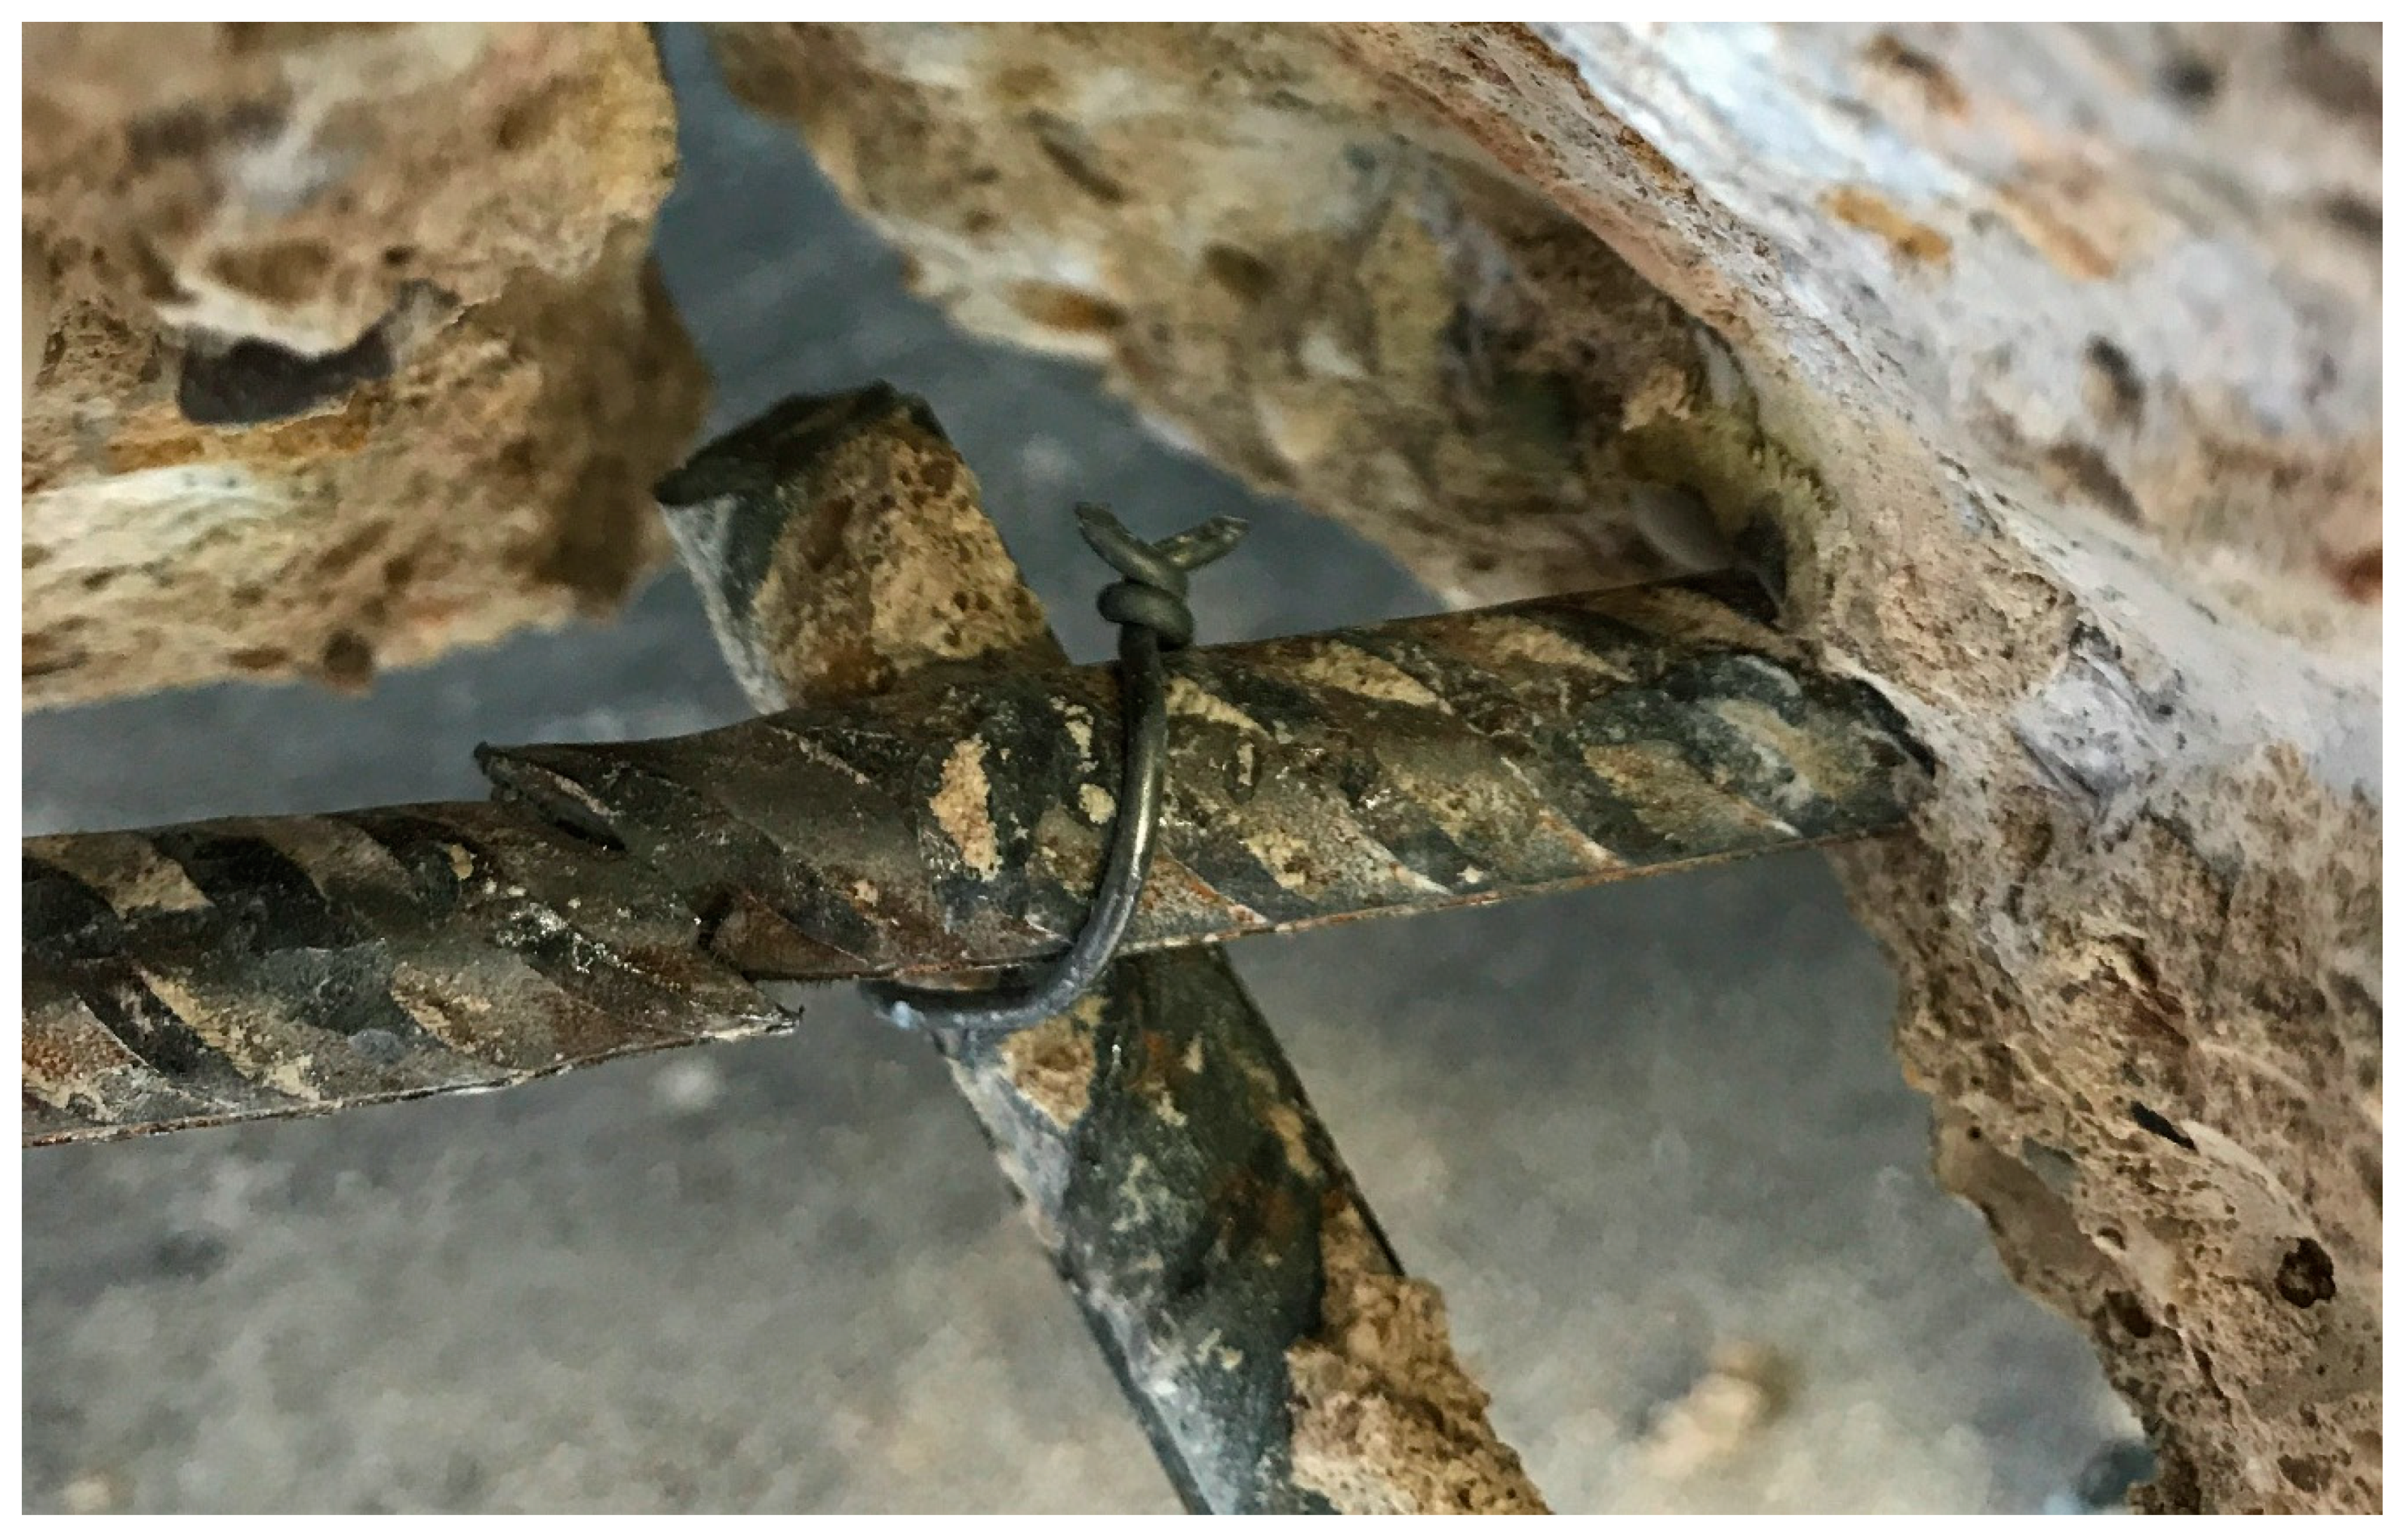
4.3.1. Cracking
4.3.2. Load-Bearing Behaviour
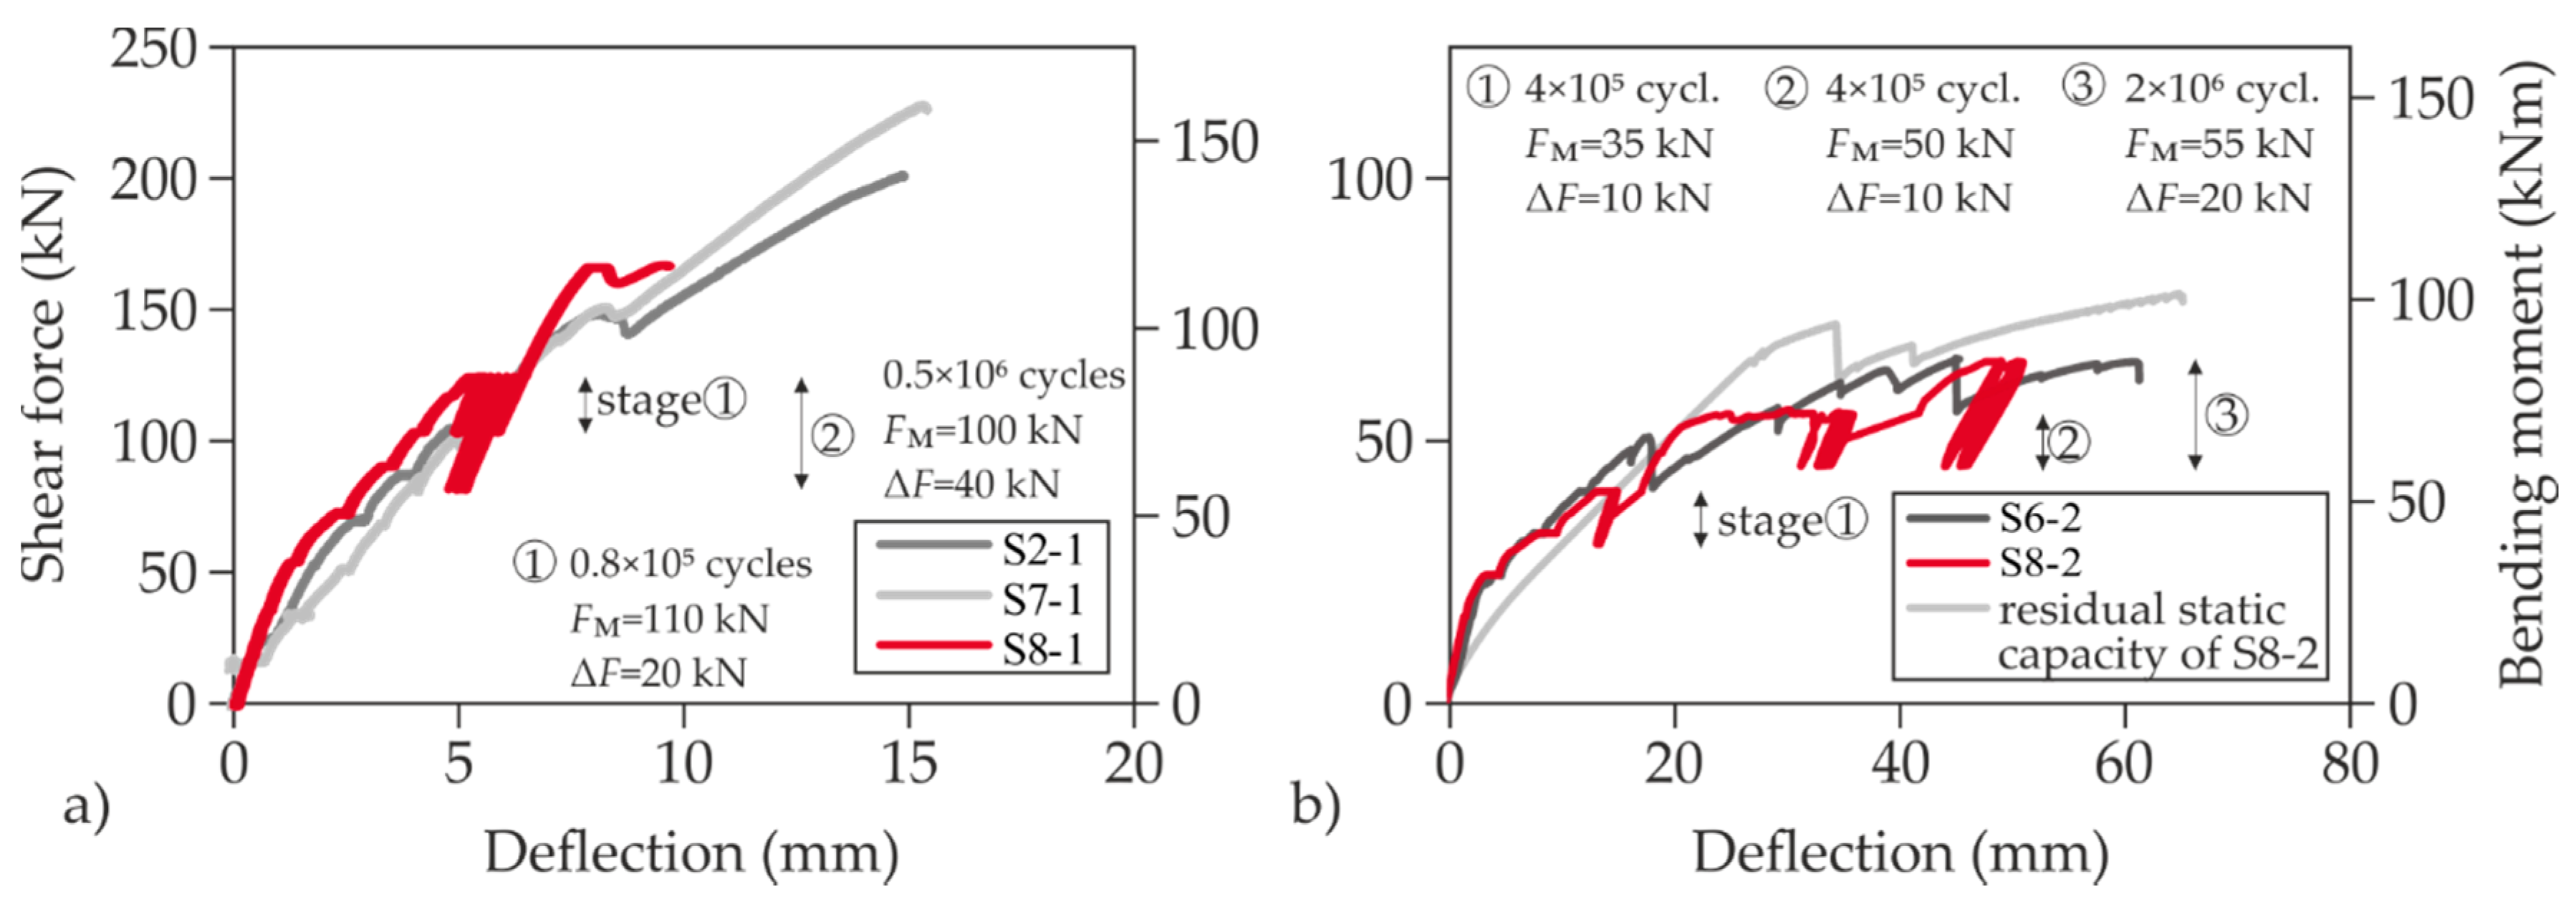
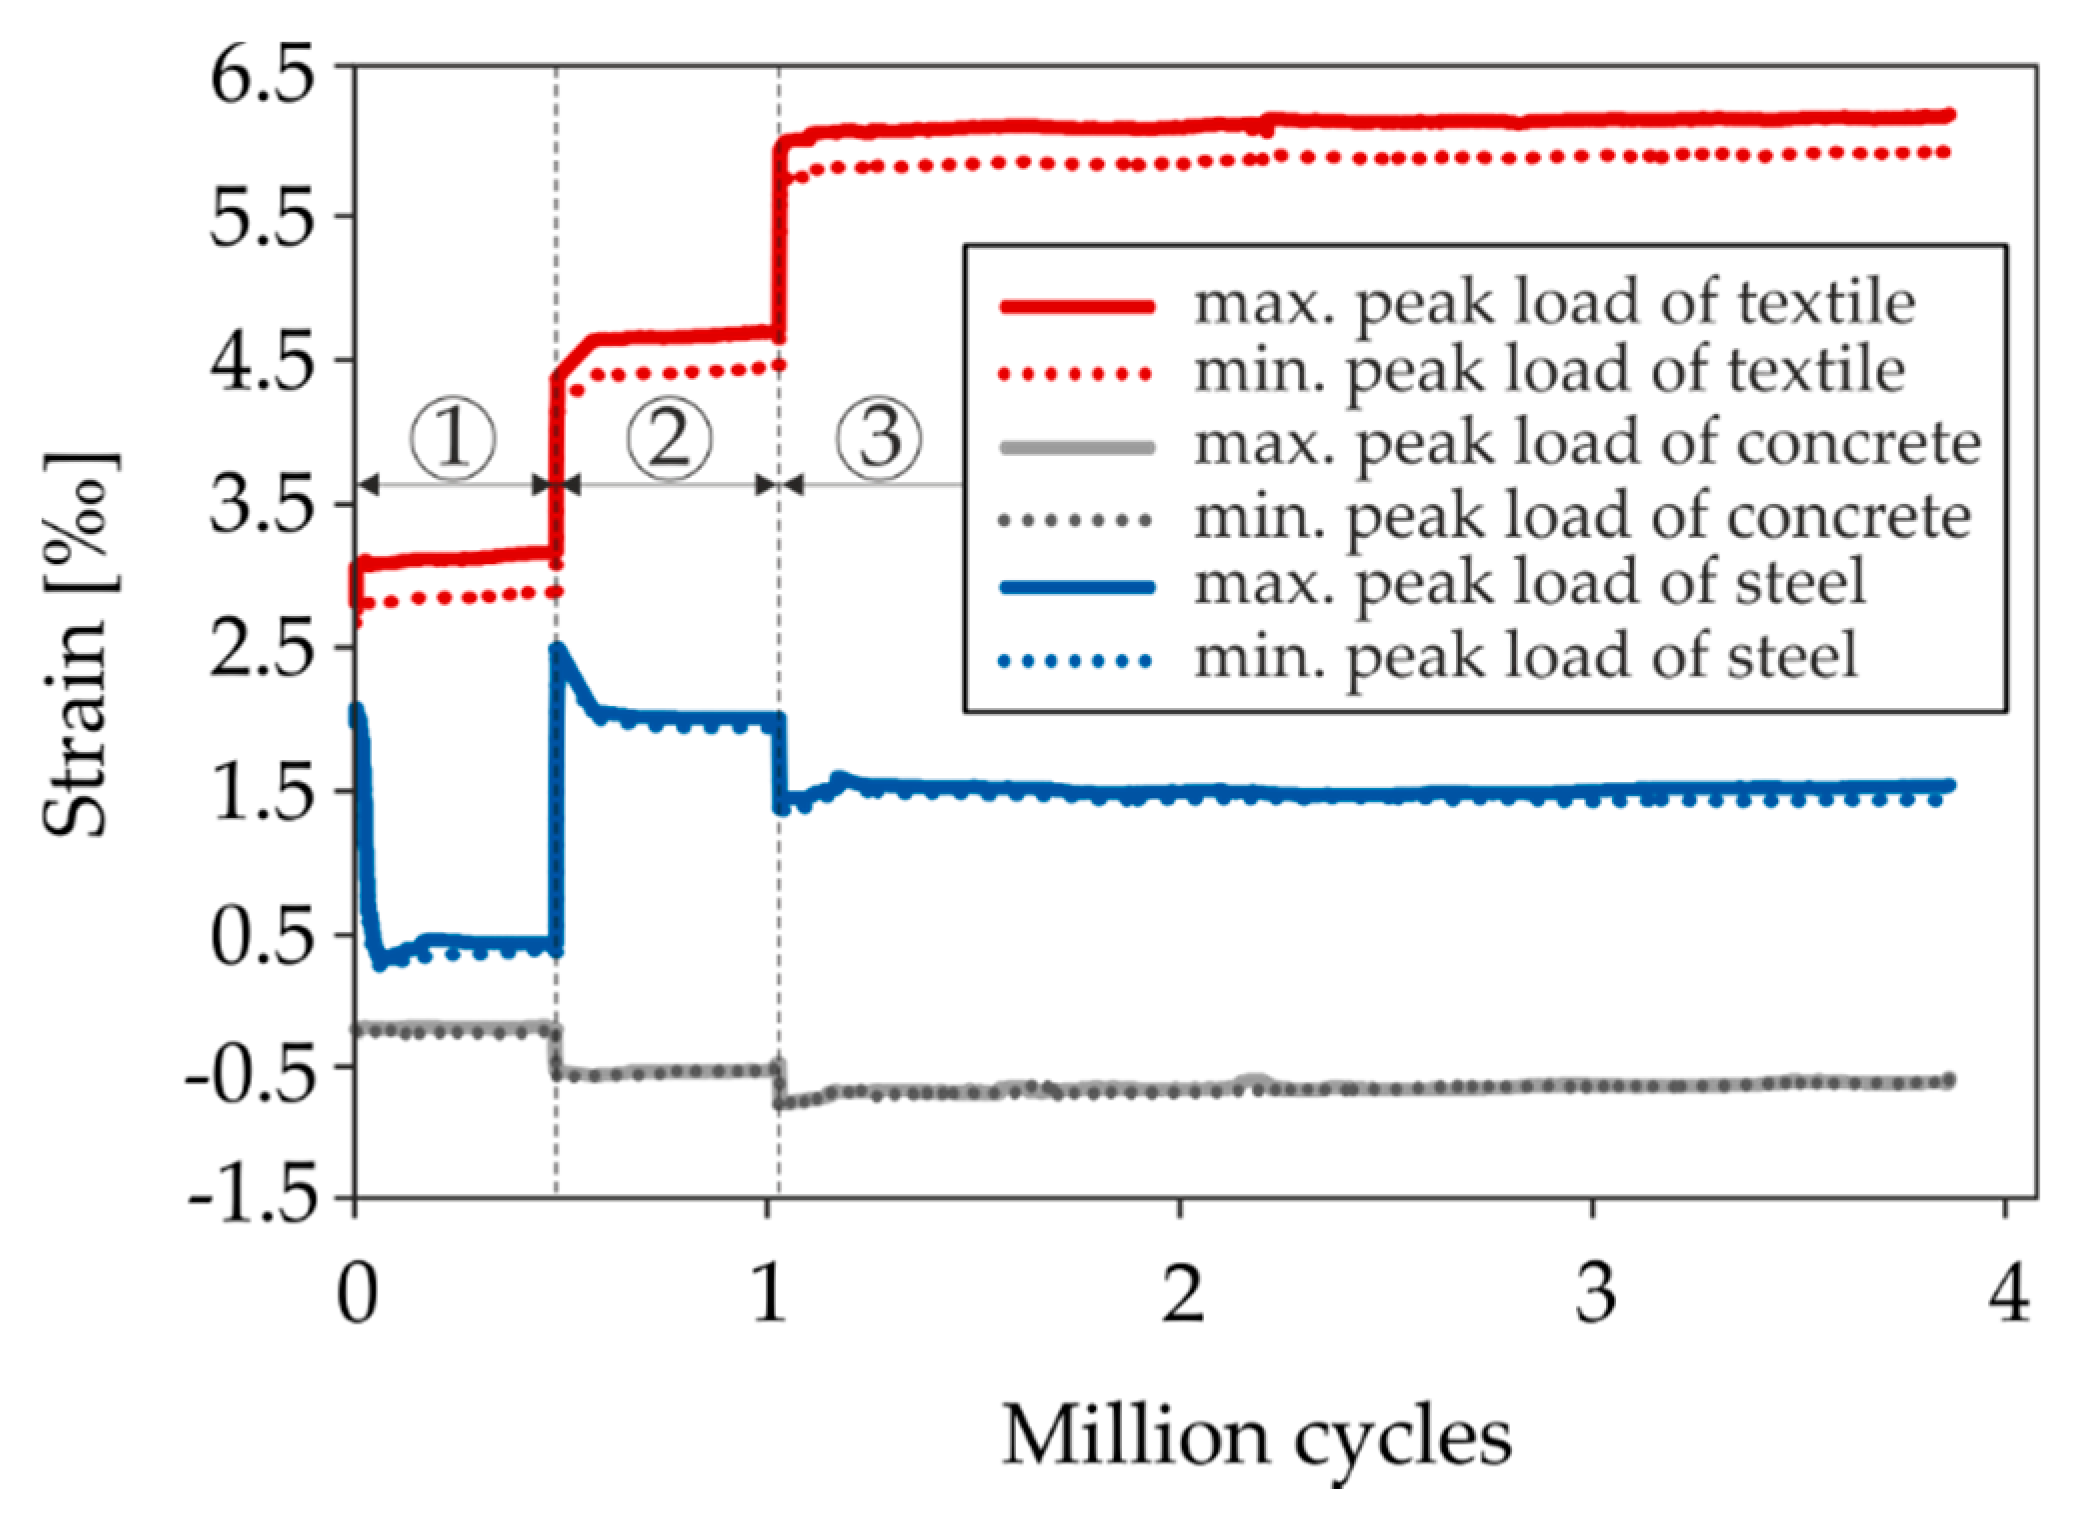
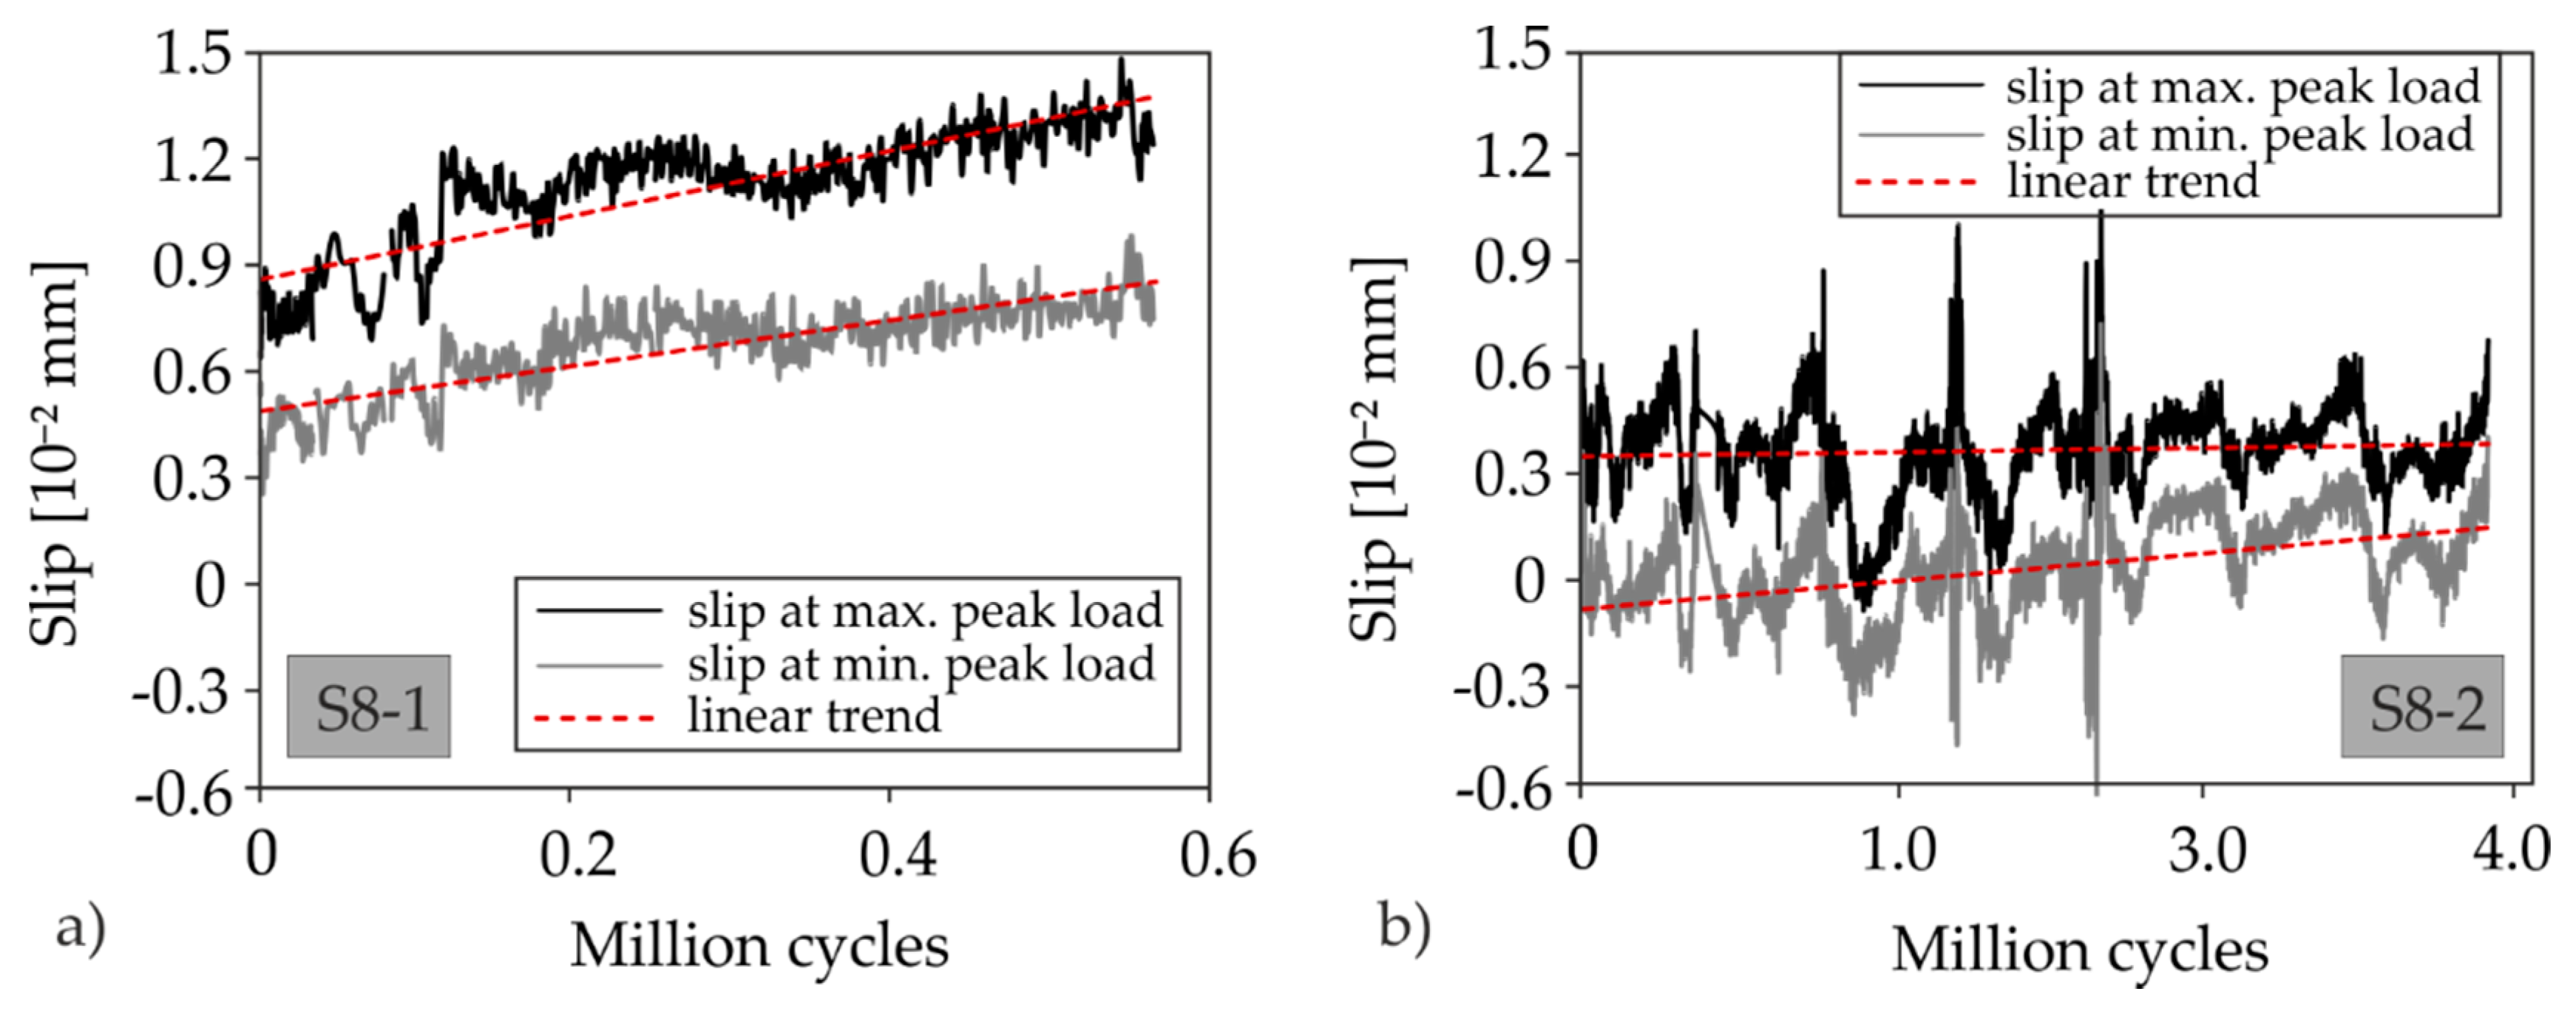
4.4. Results of Tests with Cyclic Loading
5. Summary and Conclusions
- their longitudinal reinforcement ratio (steel flexural reinforcement on RC slabs representing the existing structure) and
- the bending moment-to-shear force ratio.
- An activation of the carbon concrete strengthening for existing slabs which feature shear failure allows strengthening degrees of 30–50%.
- In case of high bending loads on the existing slab, SMART-DECK can lead to an increase of the flexural capacity of 2.3 to 2.9 times the capacity of the non-strengthened RC member.
- In some cases, a shift from flexural to shear failure was observed by means of SMART-DECK. This corresponds to the maximum flexural strengthening of the referred RC component.
Author Contributions
Funding
Acknowledgments
Conflicts of Interest
References
- Fujino, Y.; Siringoringo, D.M. Bridge monitoring in Japan: The needs and strategies. Struct. Infrastruct. Eng. 2011, 7, 597–611. [Google Scholar] [CrossRef]
- Omar, T.; Nehdi, M. Condition assessment of reinforced concrete bridges: Current practice and research challenges. Infrastructures 2018, 3, 36. [Google Scholar] [CrossRef] [Green Version]
- Bundesministerium für Verkehr, Bau und Stadtentwicklung. Strategie zur Ertüchtigung der Straßenbrücken im Bestand der Bundesfernstraßen; Federal Ministry of Traffic, Building and Urban Development, Road Engineering Division: Bonn, Germany, 2013.
- Bundesministerium für Verkehr und Digitale Infrastruktur. Bericht “Stand der Modernisierung von Straßenbrücken der Bundesfernstraßen”; Federal Ministry of Transport and Digital Infrastructure: Berlin, Germany, 2018.
- Bureau of Transportation Statistics, Department of Transportation, United States. Transportation Statistics Annual Report 2018; Bureau of Transportation Statistics, Department of Transportation, United States: Washington, DC, USA, 2018. [CrossRef]
- Federation of Canadian Municipalities. The 2019 Canada Infrastructure Report Card; Federation of Canadian Municipalities: Ottawa, ON, Canada, 2019. [Google Scholar]
- Schellenberg, K.; Vogel, T.; Chèvre, M.; Alvarez, M. Assessment of bridges on the Swiss national roads. Struct. Eng. Int. 2013, 23, 402–410. [Google Scholar] [CrossRef]
- Bundesministerium für Verkehr, Bau und Stadtentwicklung Abteilung Straßenbau. Richtlinie zur Nachrechnung von Straßenbrücken im Bestand. Nachrechnungsrichtlinie; Federal Ministry of Traffic, Building and Urban Development, Road Engineering Division: Bonn, Germany, 2011.
- Bundesministerium für Verkehr und digitale Infrastruktur Abteilung Straßenbau. Richtlinie zur Nachrechnung von Straßenbrücken im Bestand 1. Ergänzung. Nachrechnungsrichtlinie; Federal Ministry of Traffic, Building and Urban Development, Road Engineering Division: Bonn, Germany, 2015.
- American Association of State Highway and Transportation Officials. The Manual for Bridge. Evaluation, Third Edition, 2018 Interim Revisions; American Association of State Highway and Transportation Officials: Washington, DC, USA, 2018. [Google Scholar]
- SIA Schweizerischer Ingenieur- und Architektenverein, SIA Société Suisse des Ingénieurs et des Architectes. Grundlagen der Erhaltung von Tragwerken; SIA: Zürich, Switzerland, 2011. [Google Scholar]
- ÖNORM B 4008-2:2019 11 15–Bewertung der Tragfähigkeit bestehender Tragwerke—Teil 2: Brückenbau; Austrian Standards International: Vienna, Austria, 2019.
- NEN. Grondslagen Voor de Constructieve Beoordeling van Bestaande Bouw en het Constructief Ontwerp ten Behoeve van Verbouw; NEN: Amsterdam, The Netherlands, 2015. [Google Scholar]
- Marzahn, G.; Mertzsch, O.; Kramer, L. Der Traglastindex—Ein neuer Kennwert zur Bewertung struktureller Eigenschaften von Straßenbrücken. Bauingenieur 2020, 95. [Google Scholar] [CrossRef]
- Herbrand, M.; Hegger, J. Experimentelle Untersuchungen zum Einfluss einer externen Vorspannung auf die Querkrafttragfähigkeit vorgespannter Durchlaufträger. Bauingenieur 2013, 88, 428–437. [Google Scholar]
- Schnellenbach-Held, M.; Welsch, T.; Fickler, S.; Hegger, J.; Reißen, K. Verstärkungen Älterer Beton- und Spannbetonbrücken. Erfahrungssammlung Dokumentation 2016; BASt: Bergisch Gladbach, Germany, 2016. [Google Scholar]
- Randl, N.; Münger, F.; Wicke, M. Verstärkung von Brückentragwerken durch Aufbeton. Bauingenieur 2005, 80, 207–214. [Google Scholar]
- Alotaibi, N.K.; Shekarchi, W.A.; Ghannoum, W.M.; Jirsa, J.O. Shear design of reinforced concrete beams strengthened in shear with anchored carbon fiber-reinforced polymer strips. ACI SJ 2020, 117. [Google Scholar] [CrossRef]
- Brühwiler, E.; Bastien-Masse, M.; Mühlberg, H.; Houriet, B.; Fleury, B.; Cuennet, S.; Schär, P.; Boudry, F.; Maurer, M. Strengthening the Chillon viaducts deck slabs with reinforced UHPFRC. In Proceedings of the IABSE Conference—Structural Engineering: Providing Solutions to Global Challenges 2015, Geneva, Switzerland, 23–25 September 2015. [Google Scholar]
- Noshiravani, T.; Brühwiler, E. Behaviour of UHPFRC-RC composite beams subjected to combined bending and shear. In Proceedings of the 8th fib PhD Symposium, Copenhagen, Denmark, 20–23 June 2010; Fédération Internationale du Béton: Lausanne, Switzerland, 2010. [Google Scholar]
- Zwicky, D.; Brühwiler, E. Chillon Viaduct deck slab strengthening using reinforced UHPFRC: Full-scale tests. In Proceedings of the International Conference on Concrete Repair, Rehabilitation and Retrofitting (ICCRRR 2015), Leipzig, Germany, 8–9 October 2015. [Google Scholar]
- Habel, K.; Denarié, E.; Brühwiler, E. Structural response of elements combining ultrahigh-performance fiber-reinforced concretes and reinforced concrete. J. Struct. Eng. 2006, 132, 1793–1800. [Google Scholar] [CrossRef]
- Brückner, A.; Wellner, S.; Ortlepp, R.; Scheerer, S.; Curbach, M. Plattenbalken mit Querkraftverstärkung aus Textilbeton unter nicht vorwiegend ruhender Belastung. Beton Stahlbetonbau 2013, 108, 169–178. [Google Scholar] [CrossRef]
- May, S.; Schumann, A.; Bergmann, S.; Curbach, M.; Hegger, J. Shear Strengthening of Reinforced Structures with Carbon Reinforced Concrete. In Proceedings of the Concrete—Innovations in Materials, Design and Structures, 2019 fib Symposium, Krakow, Poland, 27–29 May 2019; Derkowski, W., Gwozdziewicz, P., Hojdys, L., Krajewski, P., Pantak, M., Eds.; International Federation for Structural Concrete (fib): Cham, Switzerland, 2019; pp. 1563–1570, ISBN 978-2-940643-00-4. [Google Scholar]
- Herbrand, M.; Classen, M.; Hegger, J. Querkraftversuche an Spannbetonträgern mit carbontextilbewehrter Spritzmörtelverstärkung unter zyklischer Beanspruchung. Beton Stahlbetonbau 2016, 111, 576–587. [Google Scholar] [CrossRef]
- Hirai, T. Use of continuous fibers for reinforcing concrete. Concr. Int. 1992, 14, 58–60. [Google Scholar]
- Curbach, M.; Ortlepp, R. Sonderforschungsbereich 528. Textile Bewehrungen zur Bautechnischen Verstärkung und Instandsetzung. Abschlusssbericht—Gekürzte Fassung. 2012. Available online: http://nbn-resolving.de/urn:nbn:de:bsz:14-qucosa-86425 (accessed on 18 September 2020).
- Brückner, A.; Ortlepp, R.; Curbach, M. Textile reinforced concrete for strengthening in bending and shear. Mater. Struct. 2006, 39, 741–748. [Google Scholar] [CrossRef]
- Brückner, A.; Ortlepp, R.; Curbach, M. Anchoring of shear strengthening for T-beams made of textile reinforced concrete (TRC). Mater. Struct. 2008, 41, 407–418. [Google Scholar] [CrossRef]
- Lindorf, A.; Lemnitzer, L.; Curbach, M. Experimental investigations on bond behaviour of reinforced concrete under transverse tension and repeated loading. Eng. Struct. 2009, 31, 1469–1476. [Google Scholar] [CrossRef]
- Raupach, M.; Orlowsky, J.; Büttner, T.; Dilthey, U.; Schleser, M. Epoxy-impregnated textiles in—Load bearing capacity and durability. In Proceedings of the ICTRC’2006—1st International RILEM Conference on Textile Reinforced Concrete, Aachen, Germany, 6–7 September 2006; Hegger, J., Brameshuber, W., Will, N., Eds.; RILEM Publications S.A.R.L.: Bagneux, France, 2006. ISBN 2-912143-97-7. [Google Scholar]
- Brameshuber, W.; Hinzen, M.; Dubey, A.; Peled, A.; Mobasher, B.; Bentur, A.; Aldea, C.; Silva, F.D.A.; Hegger, J.; Gries, T.; et al. Recommendation of RILEM TC 232-TDT: Test methods and design of textile reinforced concrete—Uniaxial tensile test: Test method to determine the load bearing behavior of tensile specimens made of textile reinforced concrete. Mater. Struct. 2016, 49, 4923–4927. [Google Scholar] [CrossRef] [Green Version]
- Banholzer, B.; Brameshuber, W.; Jung, W. Analytical simulation of pull-out tests—The direct problem. Cem. Concr. Compos. 2005, 27, 93–101. [Google Scholar] [CrossRef]
- Hegger, J.; Will, N.; Bruckermann, O.; Voss, S. Load–bearing behaviour and simulation of textile reinforced concrete. Mater. Struct. 2006, 39, 765–776. [Google Scholar] [CrossRef]
- Hegger, J.; Voss, S. Investigations on the bearing behaviour and application potential of textile reinforced concrete. Eng. Struct. 2008, 30, 2050–2056. [Google Scholar] [CrossRef]
- Spelter, A.; Bergmann, S.; Bielak, J.; Hegger, J. Long-term durability of carbon-reinforced concrete: An overview and experimental investigations. Appl. Sci. 2019, 9, 1651. [Google Scholar] [CrossRef]
- Kirsten, M.; Freudenberg, C.; Cherif, C. carbonfasern, der werkstoff des 21. Jahrhunderts. Beton Stahlbetonbau 2015, 110, 8–15. [Google Scholar] [CrossRef]
- Preinstorfer, P.; Kromoser, B.; Kollegger, J. Kategorisierung des Verbundverhaltens von Textilbeton. Bauingenieur 2019, 94, 416–424. [Google Scholar]
- Mechtcherine, V.; Michel, A.; Liebscher, M.; Schneider, K.; Großmann, C. Mineral-impregnated carbon fiber composites as novel reinforcement for concrete construction: Material and automation perspectives. Autom. Constr. 2020, 110. [Google Scholar] [CrossRef]
- Bielak, J.; Bergmann, S.; Hegger, J. Querkrafttragfähigkeit von Carbonbeton-Plattenbrücken mit C-förmiger Querkraftbewehrung. Beton Stahlbetonbau 2019, 114, 465–475. [Google Scholar] [CrossRef]
- Bielak, J.; Will, N.; Hegger, J. Zwei Praxisbeispiele zur Querkrafttragfähigkeit von Brückenplatten aus Textilbeton. Bautechnik 2020, 97, 499–507. [Google Scholar] [CrossRef]
- Erhard, E.; Weiland, S.; Lorenz, E.; Schladitz, F.; Beckmann, B.; Curbach, M. Anwendungsbeispiele für Textilbetonverstärkung. Beton Stahlbetonbau 2015, 110, 74–82. [Google Scholar] [CrossRef]
- Ghadioui, R.E.; Graubner, C.A. Querkrafttragfähigkeit carbonbewehrter Betonbauteile ohne Querkraftbewehrung. Beton Stahlbetonbau 2019, 114, 827–836. [Google Scholar] [CrossRef]
- Stark, A.; Classen, M.; Knorrek, C.; Camps, B.; Hegger, J. Sandwich panels with folded plate and doubly curved UHPFRC facings. Struct. Concr. 2018, 19, 1851–1861. [Google Scholar] [CrossRef]
- Valeri, P.; Guaita, P.; Baur, R.; Fernández Ruiz, M.; Fernández-Ordóñez, D.; Muttoni, A. Textile reinforced concrete for sustainable structures: Future perspectives and application to a prototype pavilion. Struct. Concr. 2020, 110. [Google Scholar] [CrossRef]
- Kromoser, B.; Preinstorfer, P.; Kollegger, J. Building lightweight structures with carbon-fiber-reinforced polymer-reinforced ultra-high-performance concrete: Research approach, construction materials, and conceptual design of three building components. Struct. Concr. 2019, 20, 730–744. [Google Scholar] [CrossRef] [Green Version]
- Mechtcherine, V. Novel cement-based composites for the strengthening and repair of concrete structures. Constr. Build. Mater. 2013, 41, 365–373. [Google Scholar] [CrossRef]
- Driessen-Ohlenforst, C.; Faulhaber, A.; Raupach, M. SMART-DECK: Monitoring des Feuchtegehaltes und kathodischer Korrosionsschutz des Bewehrungsstahles in Brückenfahrbahnen durch Zwischenschicht aus Textilbeton. Bauingenieur 2020, 95, 96–104. [Google Scholar]
- Driessen, C.; Raupach, M. Numerical Simulation for the Detection of Leakages in Bridge Deck Membranes through Resistivity Measurements. In Service Life and Durability of Reinforced Concrete Structures, Proceedings of the 8th International RILEM PhD Workshop, Marne-la-Vallée, France, 26–27 September 2016; Andrade, C., Gulikers, J., Marie-Victoire, E., Eds.; Springer: Cham, Switzerland, 2019; pp. 57–69. ISBN 978-3-319-90235-7. [Google Scholar]
- Büttner, T. SMART-DECK: Vom Konzept zum Demonstrator. Bautechnik 2020, 97, 48–56. [Google Scholar] [CrossRef]
- May, S.; Schumann, A.; Curbach, M. Shear strengthening of structures with carbon reinforced concrete. In Proceedings of the 12th fib International PhD Symposium in Civil Engineering, Prague, Czech Republic, 29–31 August 2018; Kohoutková, A., Vítek, J.L., Frantova, M., Bílý, P., Eds.; Fédération Internationale du Béton (fib): Lausanne, Switzerland, 2018; pp. 879–885, ISBN 978-80-01-06401-6. [Google Scholar]
- Brückner, A. Querkraftverstärkung von Bauteilen mit Textilbewehrtem Beton. Ph.D. Thesis, Technische Universität Dresden, Dresden, Germany, 2011. [Google Scholar]
- Herbrand, M.; Reissen, K.; Teworte, F.; Hegger, J. Shear Strengthing with Textile Reinforced Concrete. In Proceedings of the 37th IABSE Symposium: Engineering for Progress, Nature and People, Madrid, Spain, 3–5 September 2014. [Google Scholar]
- Bayrak, O.; Fernández Ruiz, M.; Kaufmann, W.; Muttoni, A. (Eds.) Towards a Rational Understanding of Shear in Beams and Slabs: Fib Bulletin 85. Workshop in Zürich, Switzerland September 2016; Fédération Internationale du Béton (fib): Lausanne, Switzerland, 2018; ISBN 2883941254. [Google Scholar]
- Möller, B.; Brückner, A.; Ortlepp, R.; Steinigen, F. Verstärken mit textilbewehrtem beton. Beton Stahlbetonbau 2004, 99, 466–471. [Google Scholar] [CrossRef]
- Schumann, A.; May, S.; Curbach, M. Experimental Study on Flexural Strengthening of Reinforced Concrete Structures with Carbon Reinforced Concrete. In Proceedings of the fib’s 2019 Symposium—Concrete: Innovations in Materials, Design and Structures, Krakow, Poland, 27–29 May 2019; Derkowski, W., Gwozdziewicz, P., Hojdys, L., Krajewski, P., Pantak, M., Eds.; International Federation for Structural Concrete (fib): Cham, Switzerland, 2019; pp. 1539–1546, ISBN 978-2-940643-00-4. [Google Scholar]
- Weiland, S. Interaktion von Betonstahl und Textiler Bewehrung bei Biegeverstärkung mit Textilbewehrtem Beton. Ph.D. Thesis, Technische Universität Dresden, Dresden, Germany, 2009. [Google Scholar]
- Scholzen, A.; Chudoba, R.; Hegger, J. Thin-walled shell structures made of textile-reinforced concrete: Part I: Structural design and construction. Struct. Concr. 2015, 16, 106–114. [Google Scholar] [CrossRef]
- Rempel, S.; Erhard, E.; Schmidt, H.-G.; Will, N. Die Sanierung des Mariendomdaches in Neviges mit carbonbewehrtem Spritzmörtel. Beton Stahlbetonbau 2018, 113, 543–550. [Google Scholar] [CrossRef]
- Bundesanstalt für Straßenwesen. Zusätzliche Technische Vertragsbedingungen und Richtlinien für Ingenieurbauten ZTV-ING–Part 3 Concrete and Masonry Structures; Federal Ministry of Transport and Digital Infrastructure: Berlin, Germany, 2015. (In German)
- Müller, E.; Scheerer, S.; Curbach, M. Strengthening of existing concrete structures: Design Models. In Textile Fibre Composites in Civil Engineering; Triantafillou, T., Ed.; Woodhead Publishing: Oxford, UK, 2016; pp. 323–359. ISBN 1782424466. [Google Scholar]
- Scheerer, S.; Schütze, E.; Curbach, M. Strengthening and Repair with Carbon Concrete Composites—The First General Building Approval in Germany. In Proceedings of the 4th International RILEM Conference on Strain-Hardening Cement-Based Composites (SHCC4), Dresden, Germany, 18–20 September 2017; Mechtcherine, V., Slowik, V., Kabele, P., Eds.; Springer: Berlin/Heidelberg, Germany, 2017; pp. 743–751, ISBN 978-94-024-1193-5. [Google Scholar]
- Scheerer, S.; Zobel, R.; Müller, E.; Senckpiel-Peters, T.; Schmidt, A.; Curbach, M. Flexural strengthening of RC structures with TRC—Experimental observations, design approach and application. Appl. Sci. 2019, 9, 1322. [Google Scholar] [CrossRef] [Green Version]
- Herbrand, M.; Adam, V.; Classen, M.; Kueres, D.; Hegger, J. Strengthening of Existing Bridge Structures for Shear and Bending with Carbon Textile-Reinforced Mortar. Materials 2017, 10, 1099. [Google Scholar] [CrossRef] [Green Version]
- Reissen, K.; Hegger, J. Shear strengthening of bridge deck slabs with textile reinforced concrete. In Proceedings of the 1st Concrete Innovation Conference (CIC), Oslo, Norway, 11–13 June 2014. [Google Scholar]
- Deutsches Institut für Normung e.V. Prüfverfahren für Zement—Teil 1: Bestimmung der Festigkeit; Deutsche Fassung EN 196-1:2016; Beuth: Berlin, Germany, 2016. [Google Scholar]
- Voss, S. Ingenieurmodelle zum Tragverhalten von Textilbewehrtem Beton. Ph.D. Thesis, RWTH Aachen University, Aachen, Germany, 2008. [Google Scholar]
- Kulas, C. Zum Tragverhalten Getränkter Textiler Bewehrungselemente für Betonbauteile. Ph.D. Thesis, RWTH Aachen University, Aachen, Germany, 2013. [Google Scholar]
- Schütze, E.; Bielak, J.; Scheerer, S.; Hegger, J.; Curbach, M. Einaxialer zugversuch für carbonbeton mit textiler bewehrung. Beton Stahlbetonbau 2018, 113, 33–47. [Google Scholar] [CrossRef]
- Reissen, K.; Hegger, J. Experimental Investigations on the shear capacity of RC cantilever bridge deck slabs under concentrated loads—Influences of moment-shear ratio and an inclined compression zone. In Proceedings of the 16th European Bridge Conference + Structural Faults and Repair, Edinburgh, UK, 23–25 June 2015. [Google Scholar]
- Reißen, K. Zum Querkrafttragverhalten von Einachsig Gespannten Stahlbetonplatten ohne Querkraftbewehrung unter Einzellasten. Ph.D. Thesis, RWTH Aachen University, Aachen, Germany, 2017. [Google Scholar]
- Henze, L. Querkrafttragverhalten von Stahlbeton-Fahrbahnplatten; Shaker Publishing House: Düren, Germany, 2019. [Google Scholar]
- Vaz Rodrigues, R.; Fernández Ruiz, M.; Muttoni, A. Shear strength of R/C bridge cantilever slabs. Eng. Struct. 2008, 30, 3024–3033. [Google Scholar] [CrossRef]
- Lantsoght, E.O.L.; de Boer, A.; van der Veen, C. Distribution of peak shear stress in finite element models of reinforced concrete slabs. Eng. Struct. 2017, 148, 571–583. [Google Scholar] [CrossRef]
- Lantsoght, E.O.L.; van der Veen, C.; Walraven, J.C.; de Boer, A. Transition from one-way to two-way shear in slabs under concentrated loads. Mag. Concr. Res. 2015, 67, 909–922. [Google Scholar] [CrossRef]
- Kaufmann, N. Das sandflächenverfahren. Strassenbau Tech. 1971, 24, 131–135. [Google Scholar]
- Deutsches Institut für Normung e.V. Eurocode 1: Einwirkungen auf Tragwerke-Teil 1–4: Allgemeine Einwirkungen-Windlasten; Deutsche Fassung EN 1991-1-4:2005 + A1:2010 + AC:2010; Beuth: Berlin, Germany, 2010. [Google Scholar]
- Adam, V.; Will, N.; Hegger, J. Verstärkung für Fahrbahnplatten von Massivbrücken aus Textilbeton: Versuche zur Realisierung eines Demonstrators. Bauingenieur 2020, 95, 85–95. [Google Scholar]
- Wagner, J.; Spelter, A.; Hegger, J.; Curbach, M. Ermüdungsverhalten von Carbonbeton unter Zugschwellbelastung. Beton Stahlbetonbau 2020, 115. [Google Scholar] [CrossRef]


| Denotation | Specification |
|---|---|
| M-1-06 | Base material with a maximum aggregate size of 6 mm |
| M-2-04 | Base material with a maximum aggregate size of 4 mm |
| M-3-04 | Advanced material based on M-2-04 |
| M-4-04 | Advanced material based on M-3-04 |
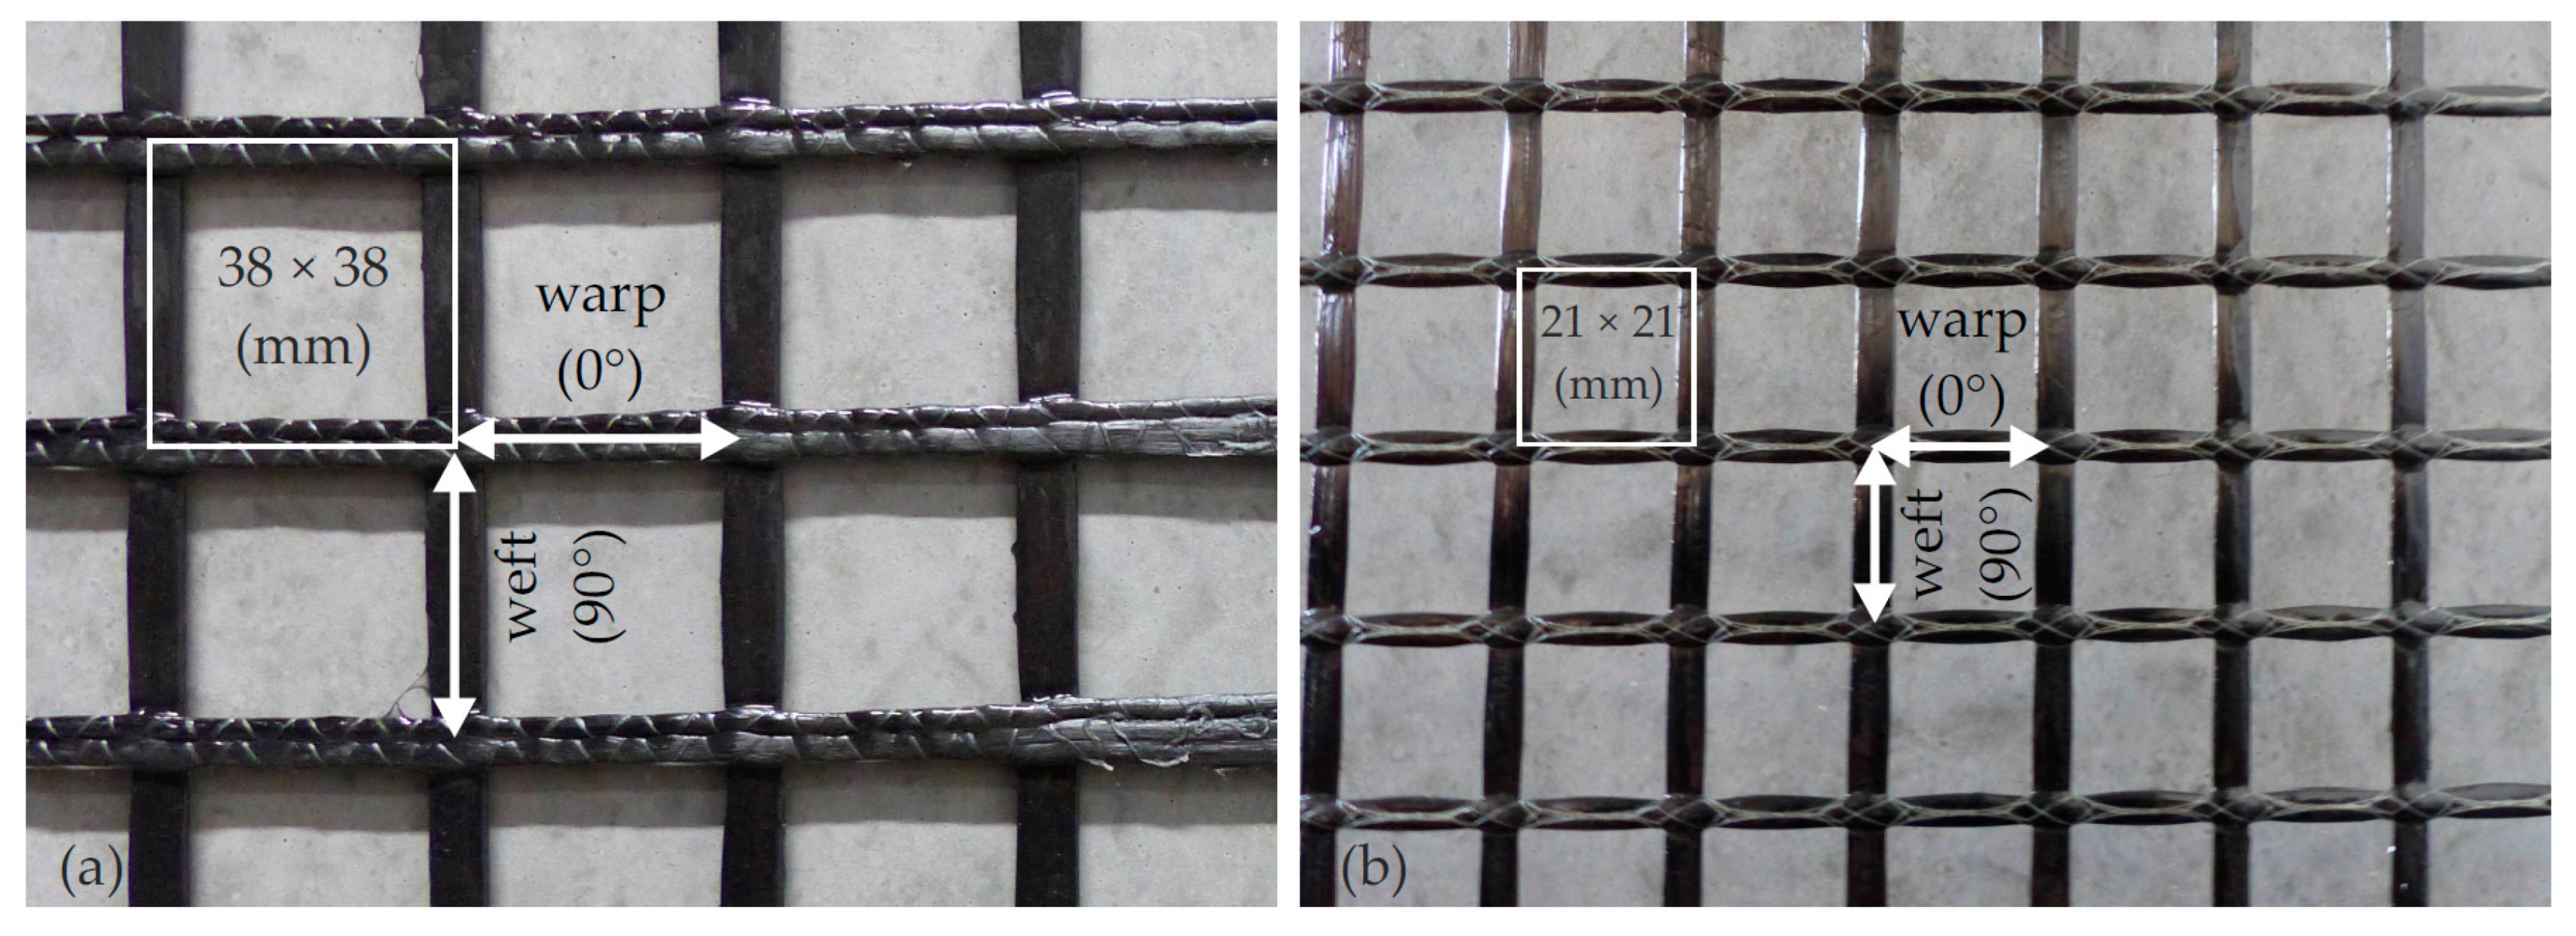
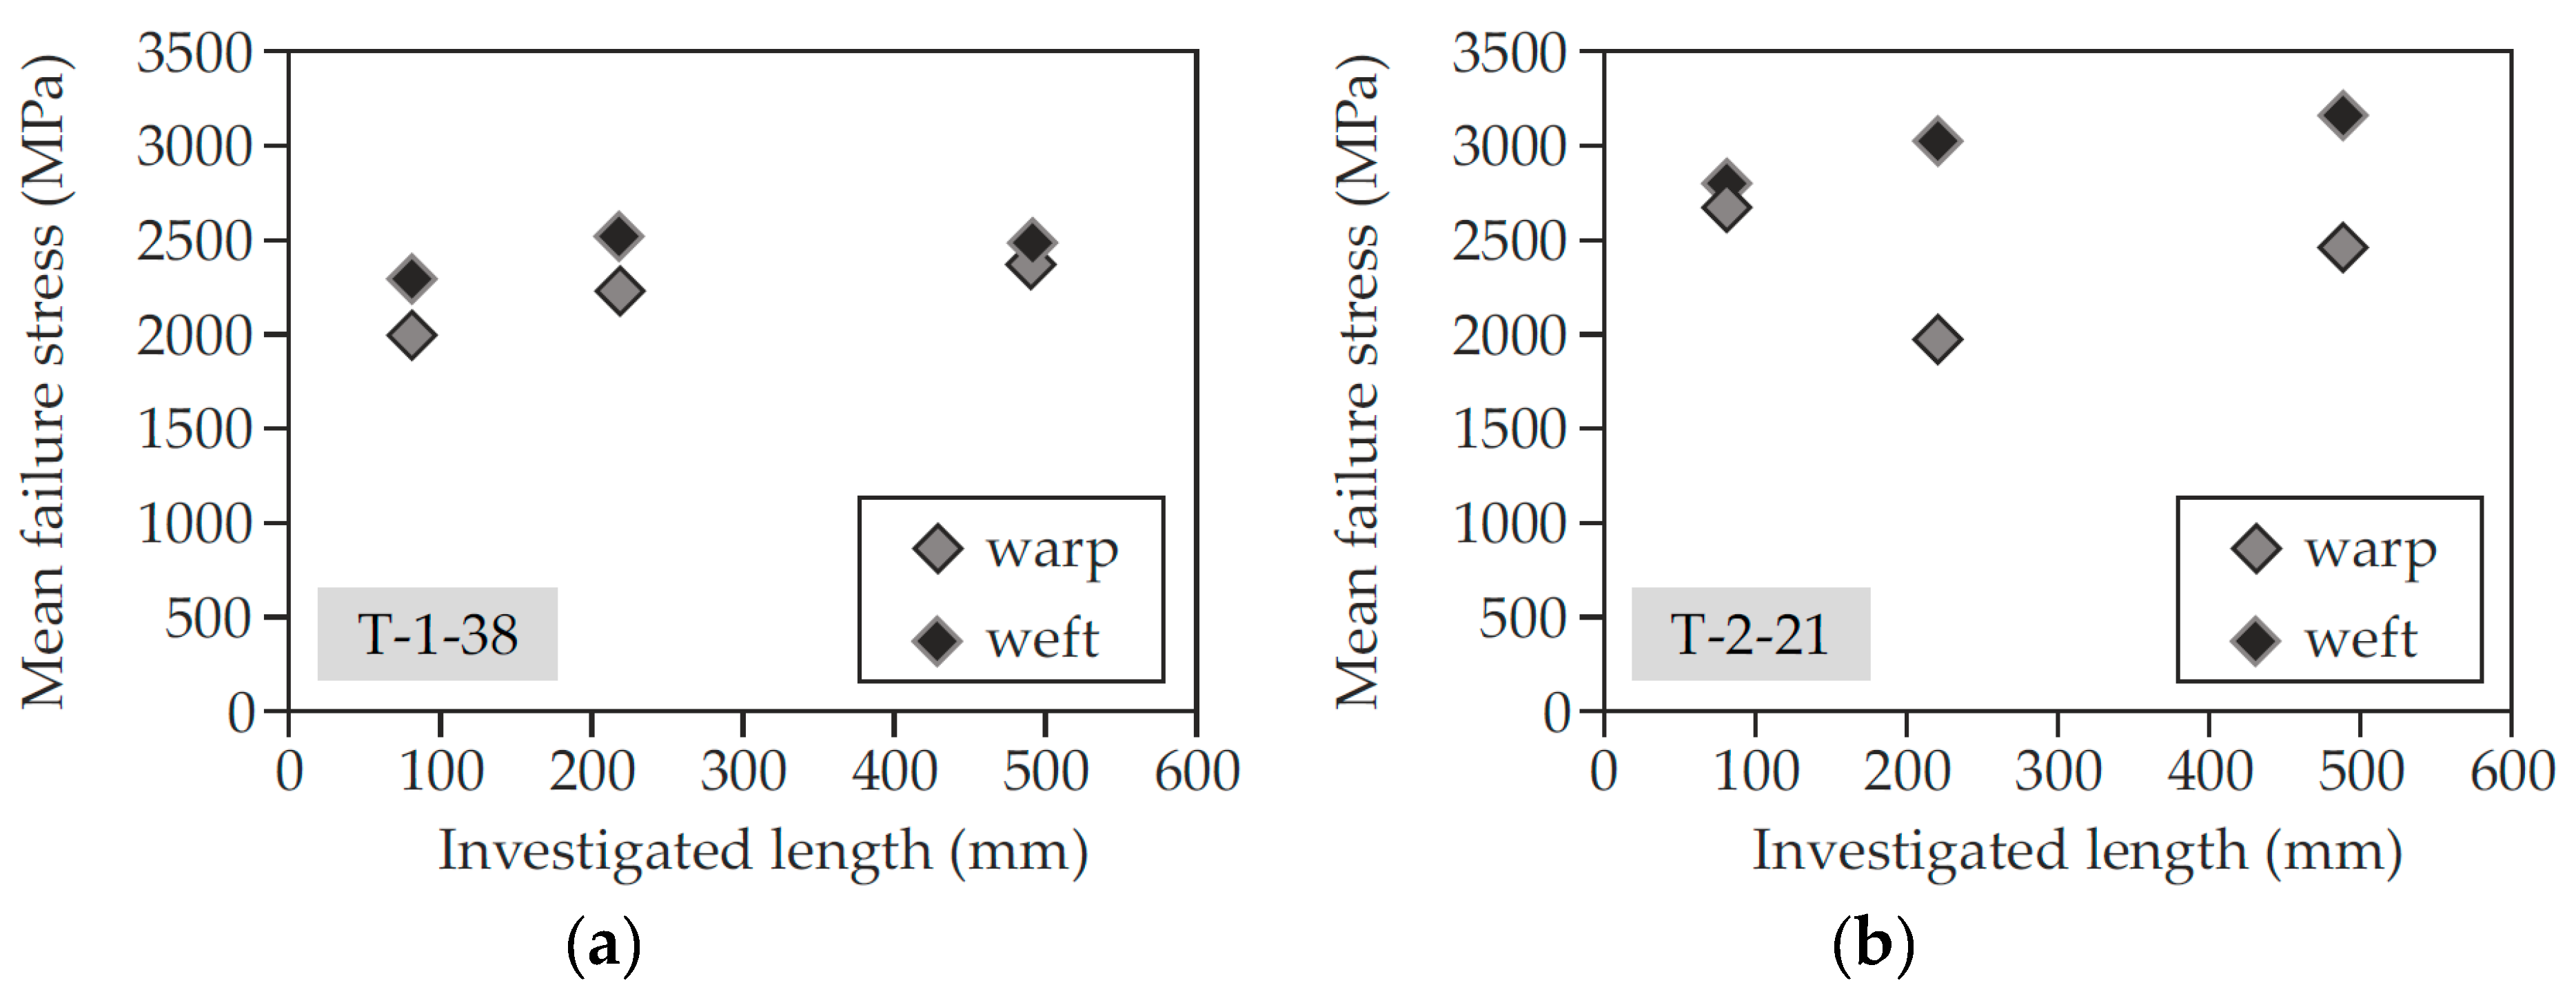
| T-1-38 | Base material with a mesh size of 38 mm |
| T-2-21 | Base material with a mesh size of 21 mm |
| T-3-38 | Advanced material based on T-1-38 with CNT * |
| T-4-38 | Advanced material based on T-1-38 with modified epoxy resin |
| Name | Target Failure Mode | Observed Failure | Material Combination Strengthening Layer | Load Distance | Longitudinal. Reinforcement Ratio | Concrete Compressive Strength ## | Mortar Strength | Strengthening Effect | Failure Load |
|---|---|---|---|---|---|---|---|---|---|
| ai (m) | ρl,s (%) | fcm,cyl (MPa) | fcm,prism/fct,fl (N/mm2) | η (-) | F (kN) | ||||
| S1-1 | V | V | 0.7 | 1.0 | 41.0 | 155 | |||
| S1-2 | V | V | 1.0 | 1.0 | 37.9 | 136 | |||
| S1-2 * | V | V | 1.0 | 1.0 | 41.0 | 145 | |||
| S2-1 | V | V | M3, T1 | 0.7 | 1.0 | 38.9 | 73.6/5.2 | 1.31 | 203 |
| S2-2 | V | I + V | M3, T1 | 1.0 | 1.0 | 38.9 | 1.03 | 144 | |
| S3-1 | V | V | 0.7 | 0.5 | 35.6 | 118 | |||
| S3-2 | V | V | 1.0 | 0.5 | 35.6 | 110 | |||
| S4-1 | V | I + V | M4, T4 | 0.7 | 0.5 | 35.6 | 78.7/10.4 | 1.05 | 124 |
| S4-2 | V | I + V | M4, T4 | 1.0 | 0.5 | 35.6 | 1.08 | 119 | |
| S5-1 | M | V | M4, T4 | 1.0 | 0.2 | 35.6 | 2.89 | 107 | |
| S5-2 | M | V + I | M4, T4 | 1.3 | 0.2 | 35.6 | 3.63 | 103 | |
| S6-1 | M | M + I | M4, T4 | 1.0 | 0.2 | 39.3 | 2.51 | 93 | |
| S6-2 | M | M + I | M4, T4 | 1.3 | 0.2 | 39.3 | 2.30 | 65 | |
| S7-1 | V | V | M4, T4 | 0.7 | 1.0 | 39.3 | 1.49 | 231 | |
| S7-2 | V | V | M4, T4 | 1.0 | 1.0 | 39.3 | 1.53 | 215 | |
| S8-1 # | V | I + V | M4, T4 | 0.7 | 1.0 | 39.3 | 1.03 | 160 | |
| S8-2 # | M | M + I | M4, T4 | 1.3 | 0.2 | 39.3 | 2.11 | 78 |
© 2020 by the authors. Licensee MDPI, Basel, Switzerland. This article is an open access article distributed under the terms and conditions of the Creative Commons Attribution (CC BY) license (http://creativecommons.org/licenses/by/4.0/).
Share and Cite
Adam, V.; Bielak, J.; Dommes, C.; Will, N.; Hegger, J. Flexural and Shear Tests on Reinforced Concrete Bridge Deck Slab Segments with a Textile-Reinforced Concrete Strengthening Layer. Materials 2020, 13, 4210. https://doi.org/10.3390/ma13184210
Adam V, Bielak J, Dommes C, Will N, Hegger J. Flexural and Shear Tests on Reinforced Concrete Bridge Deck Slab Segments with a Textile-Reinforced Concrete Strengthening Layer. Materials. 2020; 13(18):4210. https://doi.org/10.3390/ma13184210
Chicago/Turabian StyleAdam, Viviane, Jan Bielak, Christian Dommes, Norbert Will, and Josef Hegger. 2020. "Flexural and Shear Tests on Reinforced Concrete Bridge Deck Slab Segments with a Textile-Reinforced Concrete Strengthening Layer" Materials 13, no. 18: 4210. https://doi.org/10.3390/ma13184210