Estimating the Impact of Nanophases on the Production of Green Cement with High Performance Properties


Abstract
:1. Introduction
2. Experiment
2.1. The Starting Resources
2.2. Synthesis of ß-C2S, C4A3S, and C4AS Nanophases
2.3. Concrete Mix Proportions and Test Methods
3. Result and Discussions
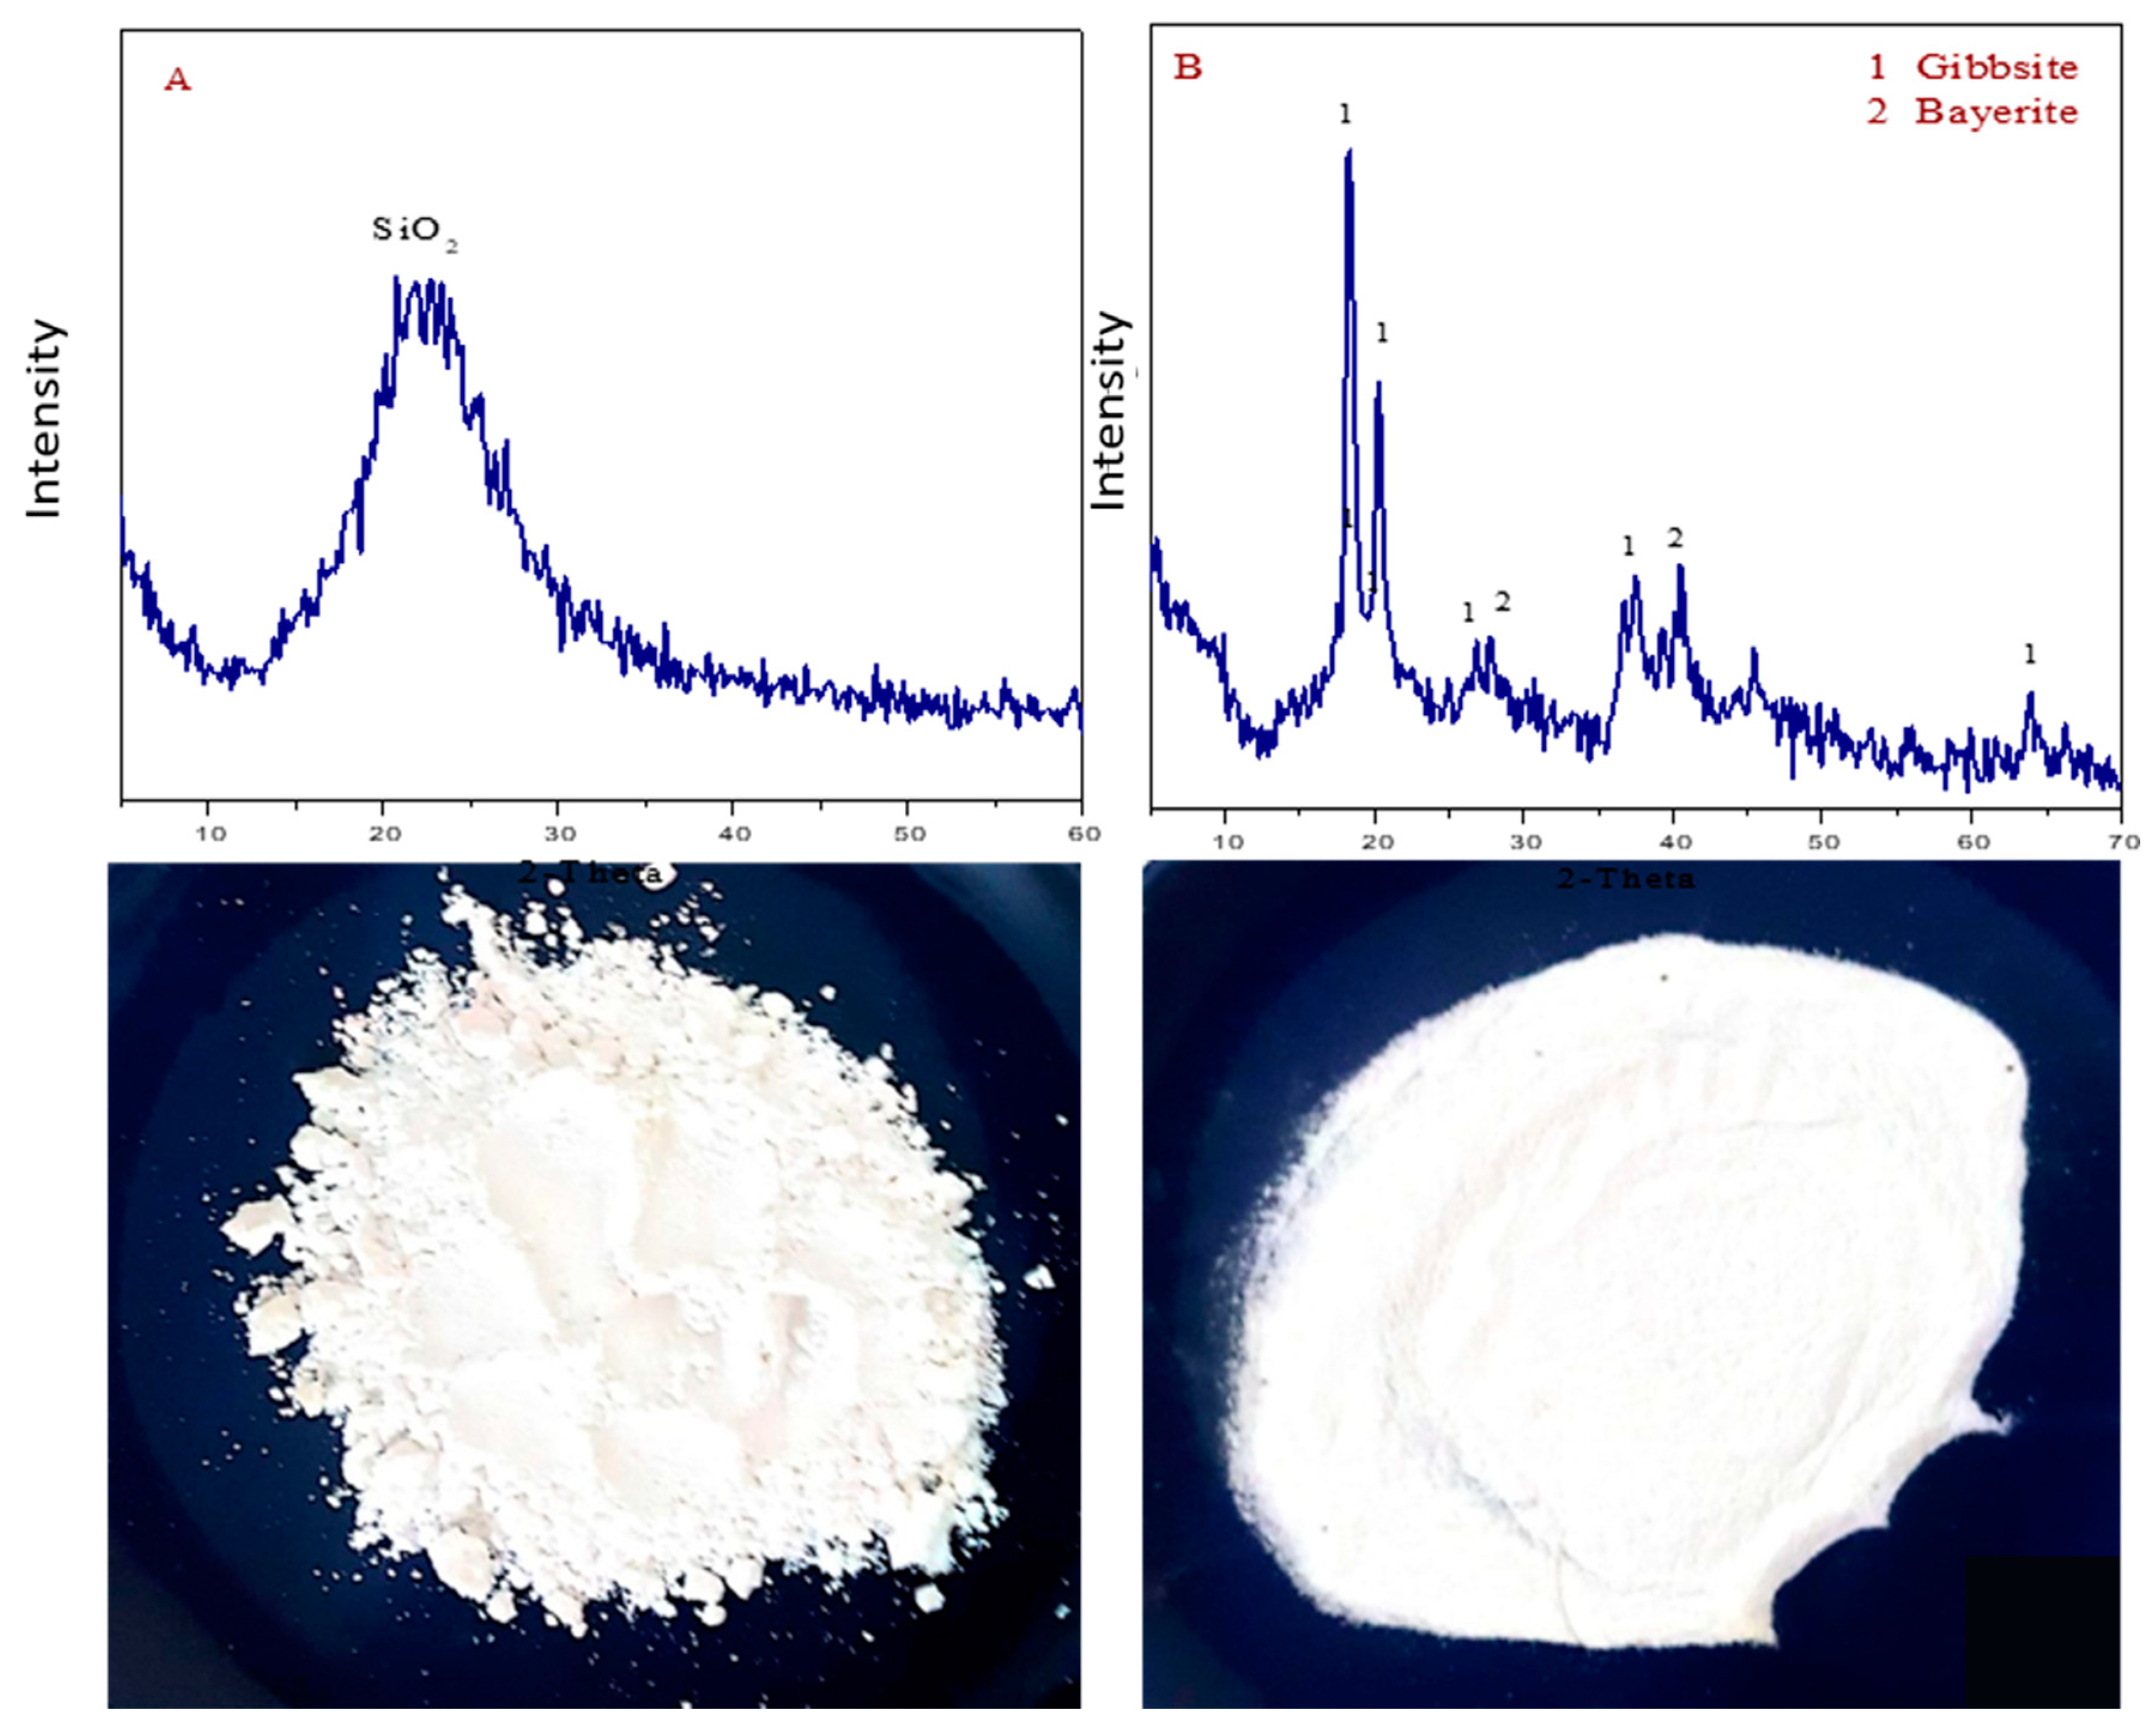
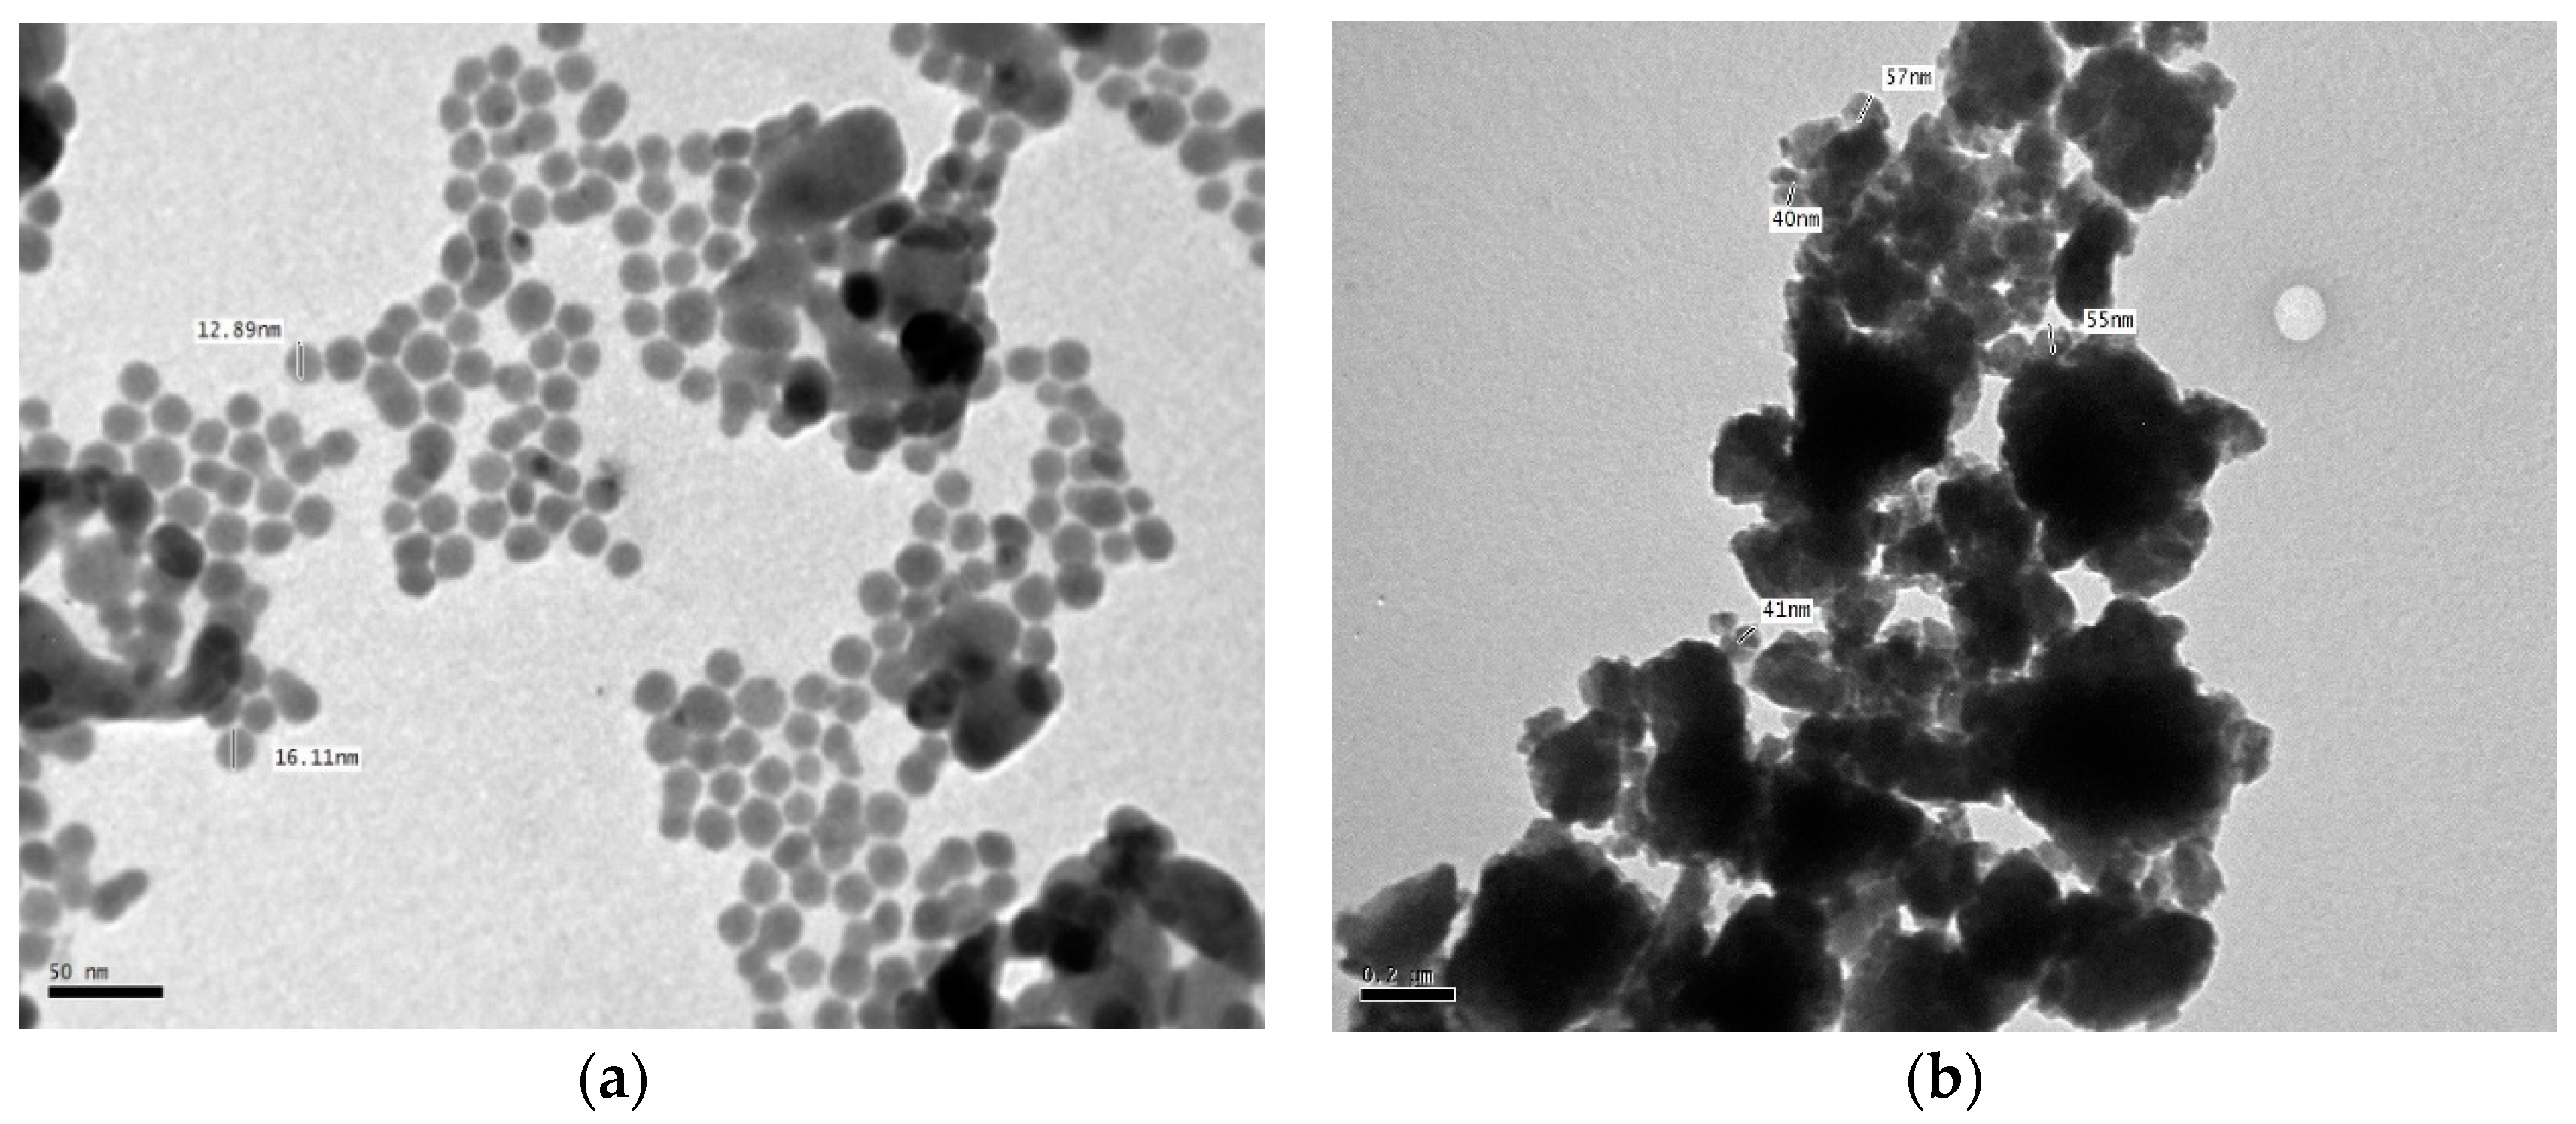
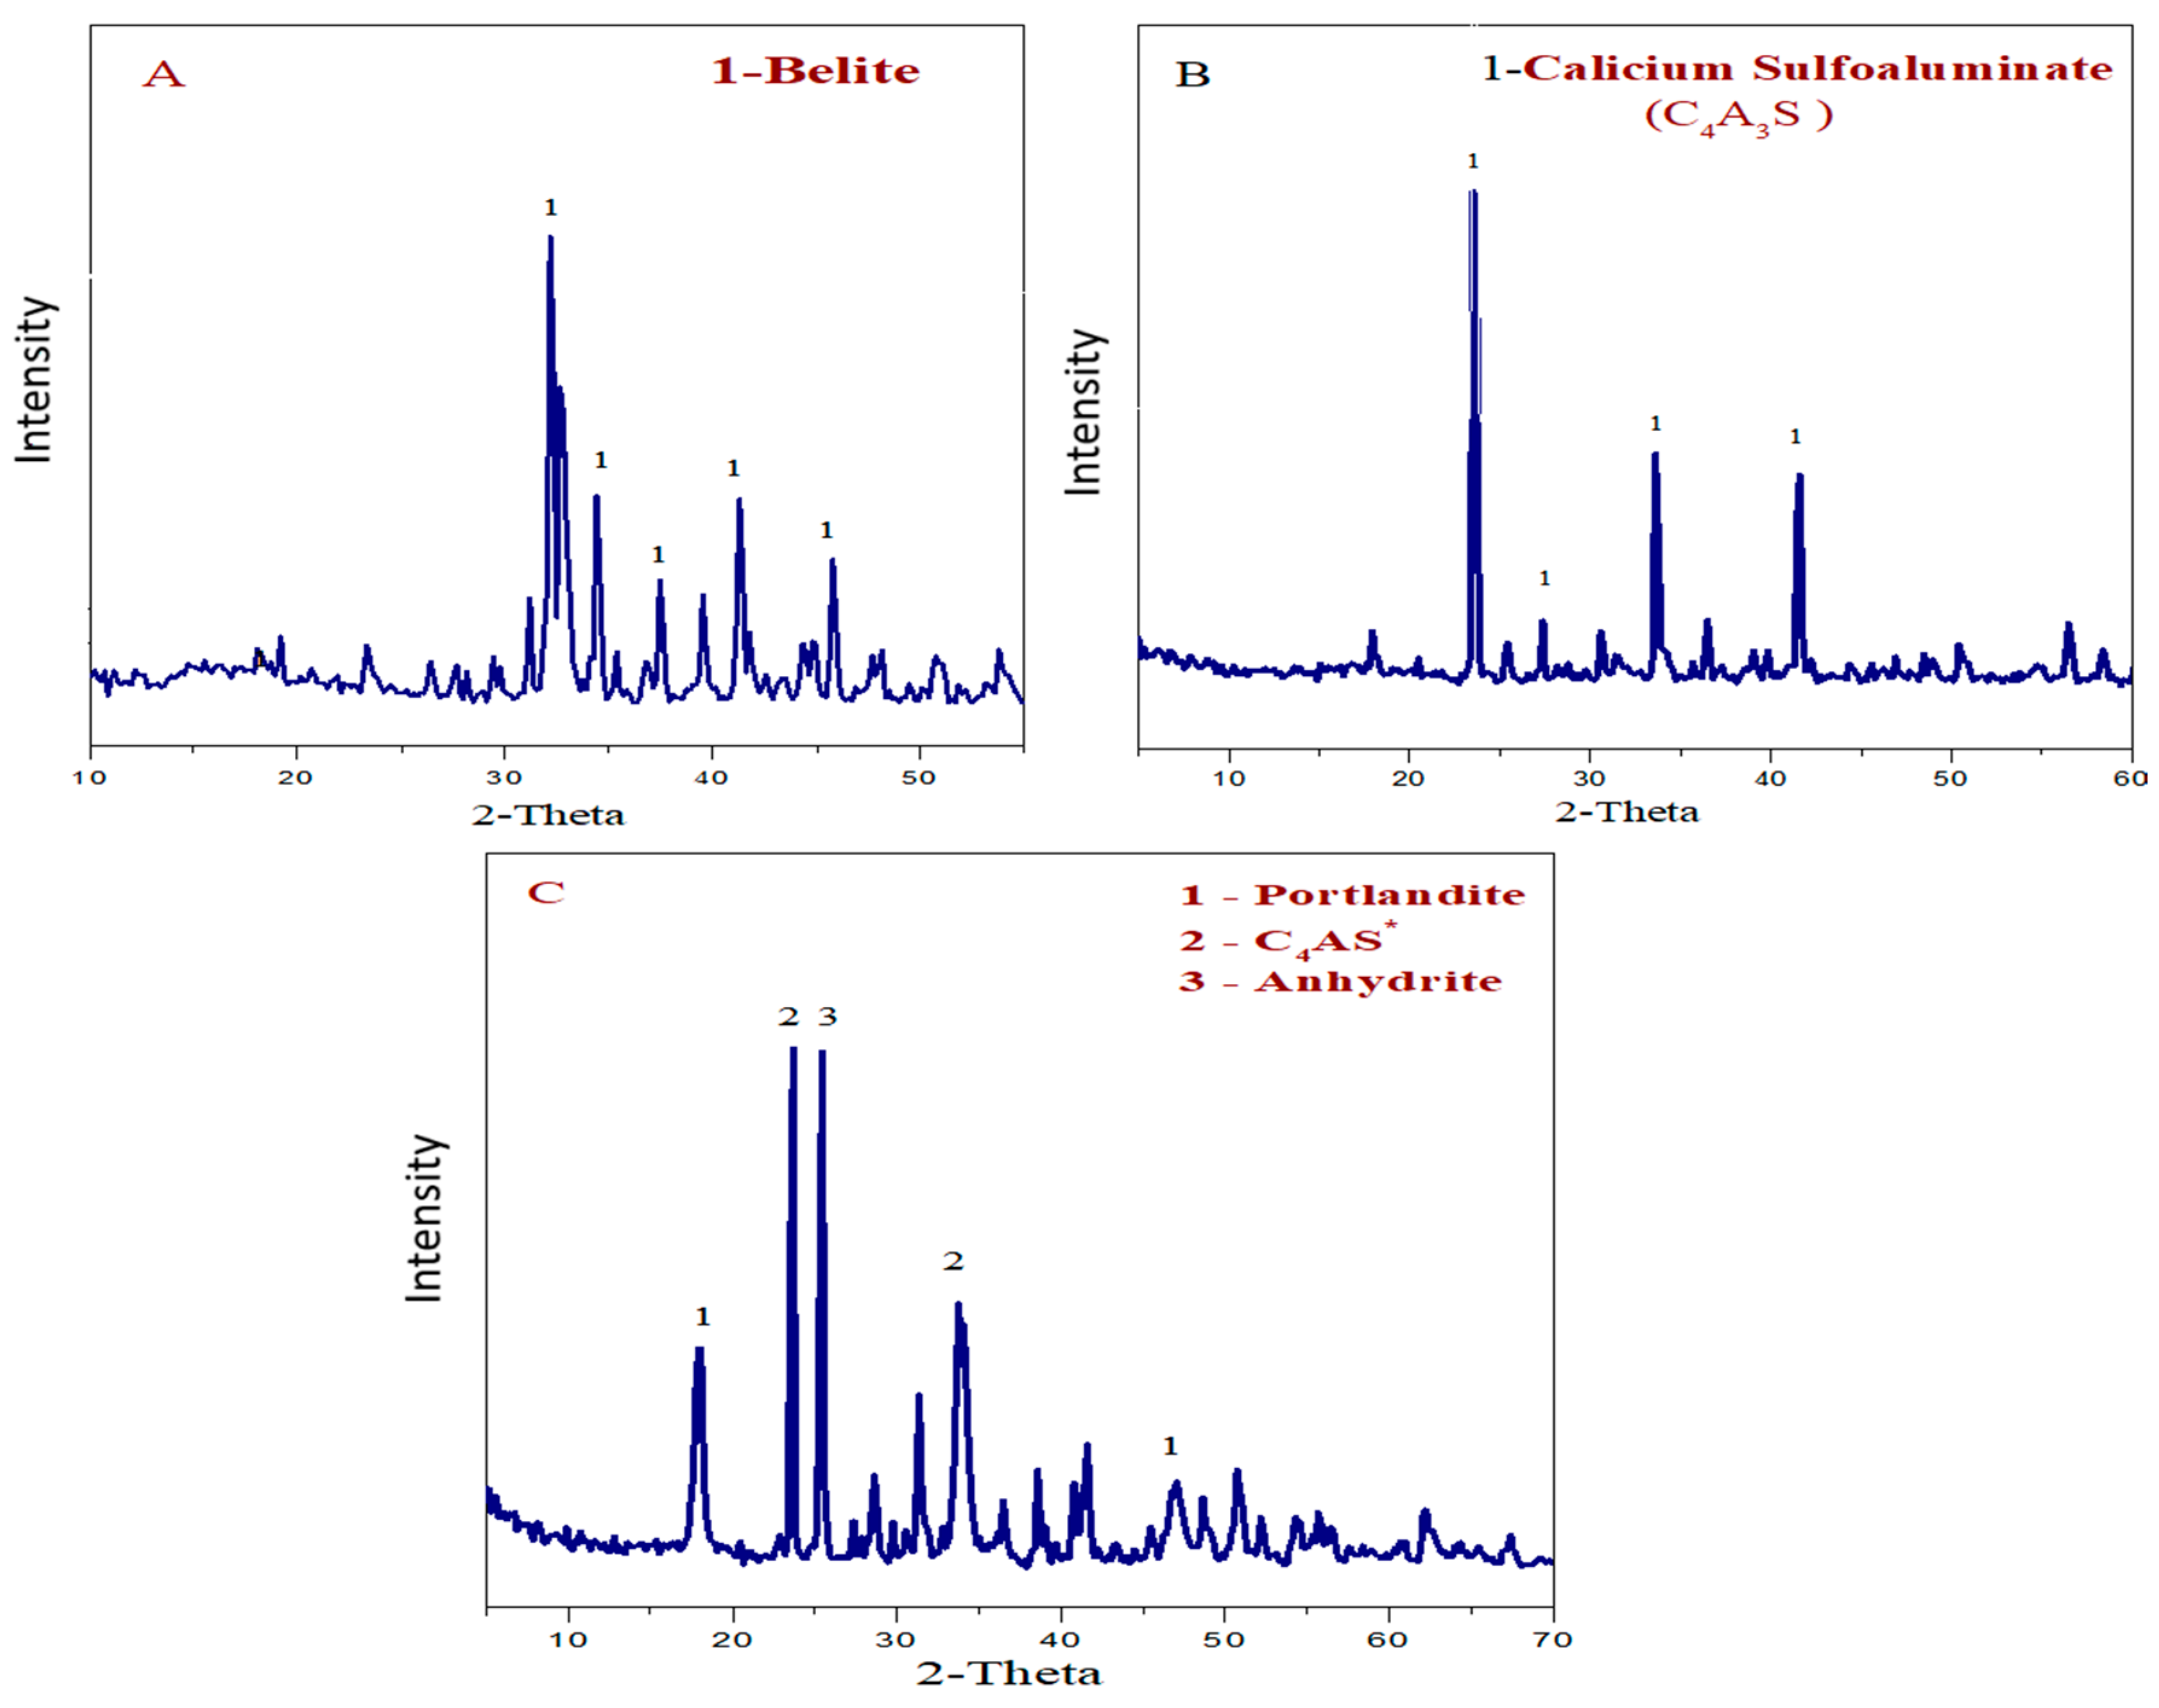
3.1. Characteristics of Nanophases
3.2. Performance of OPC, CSA, CSAB, and BC Cements
3.2.1. The Water Consistency
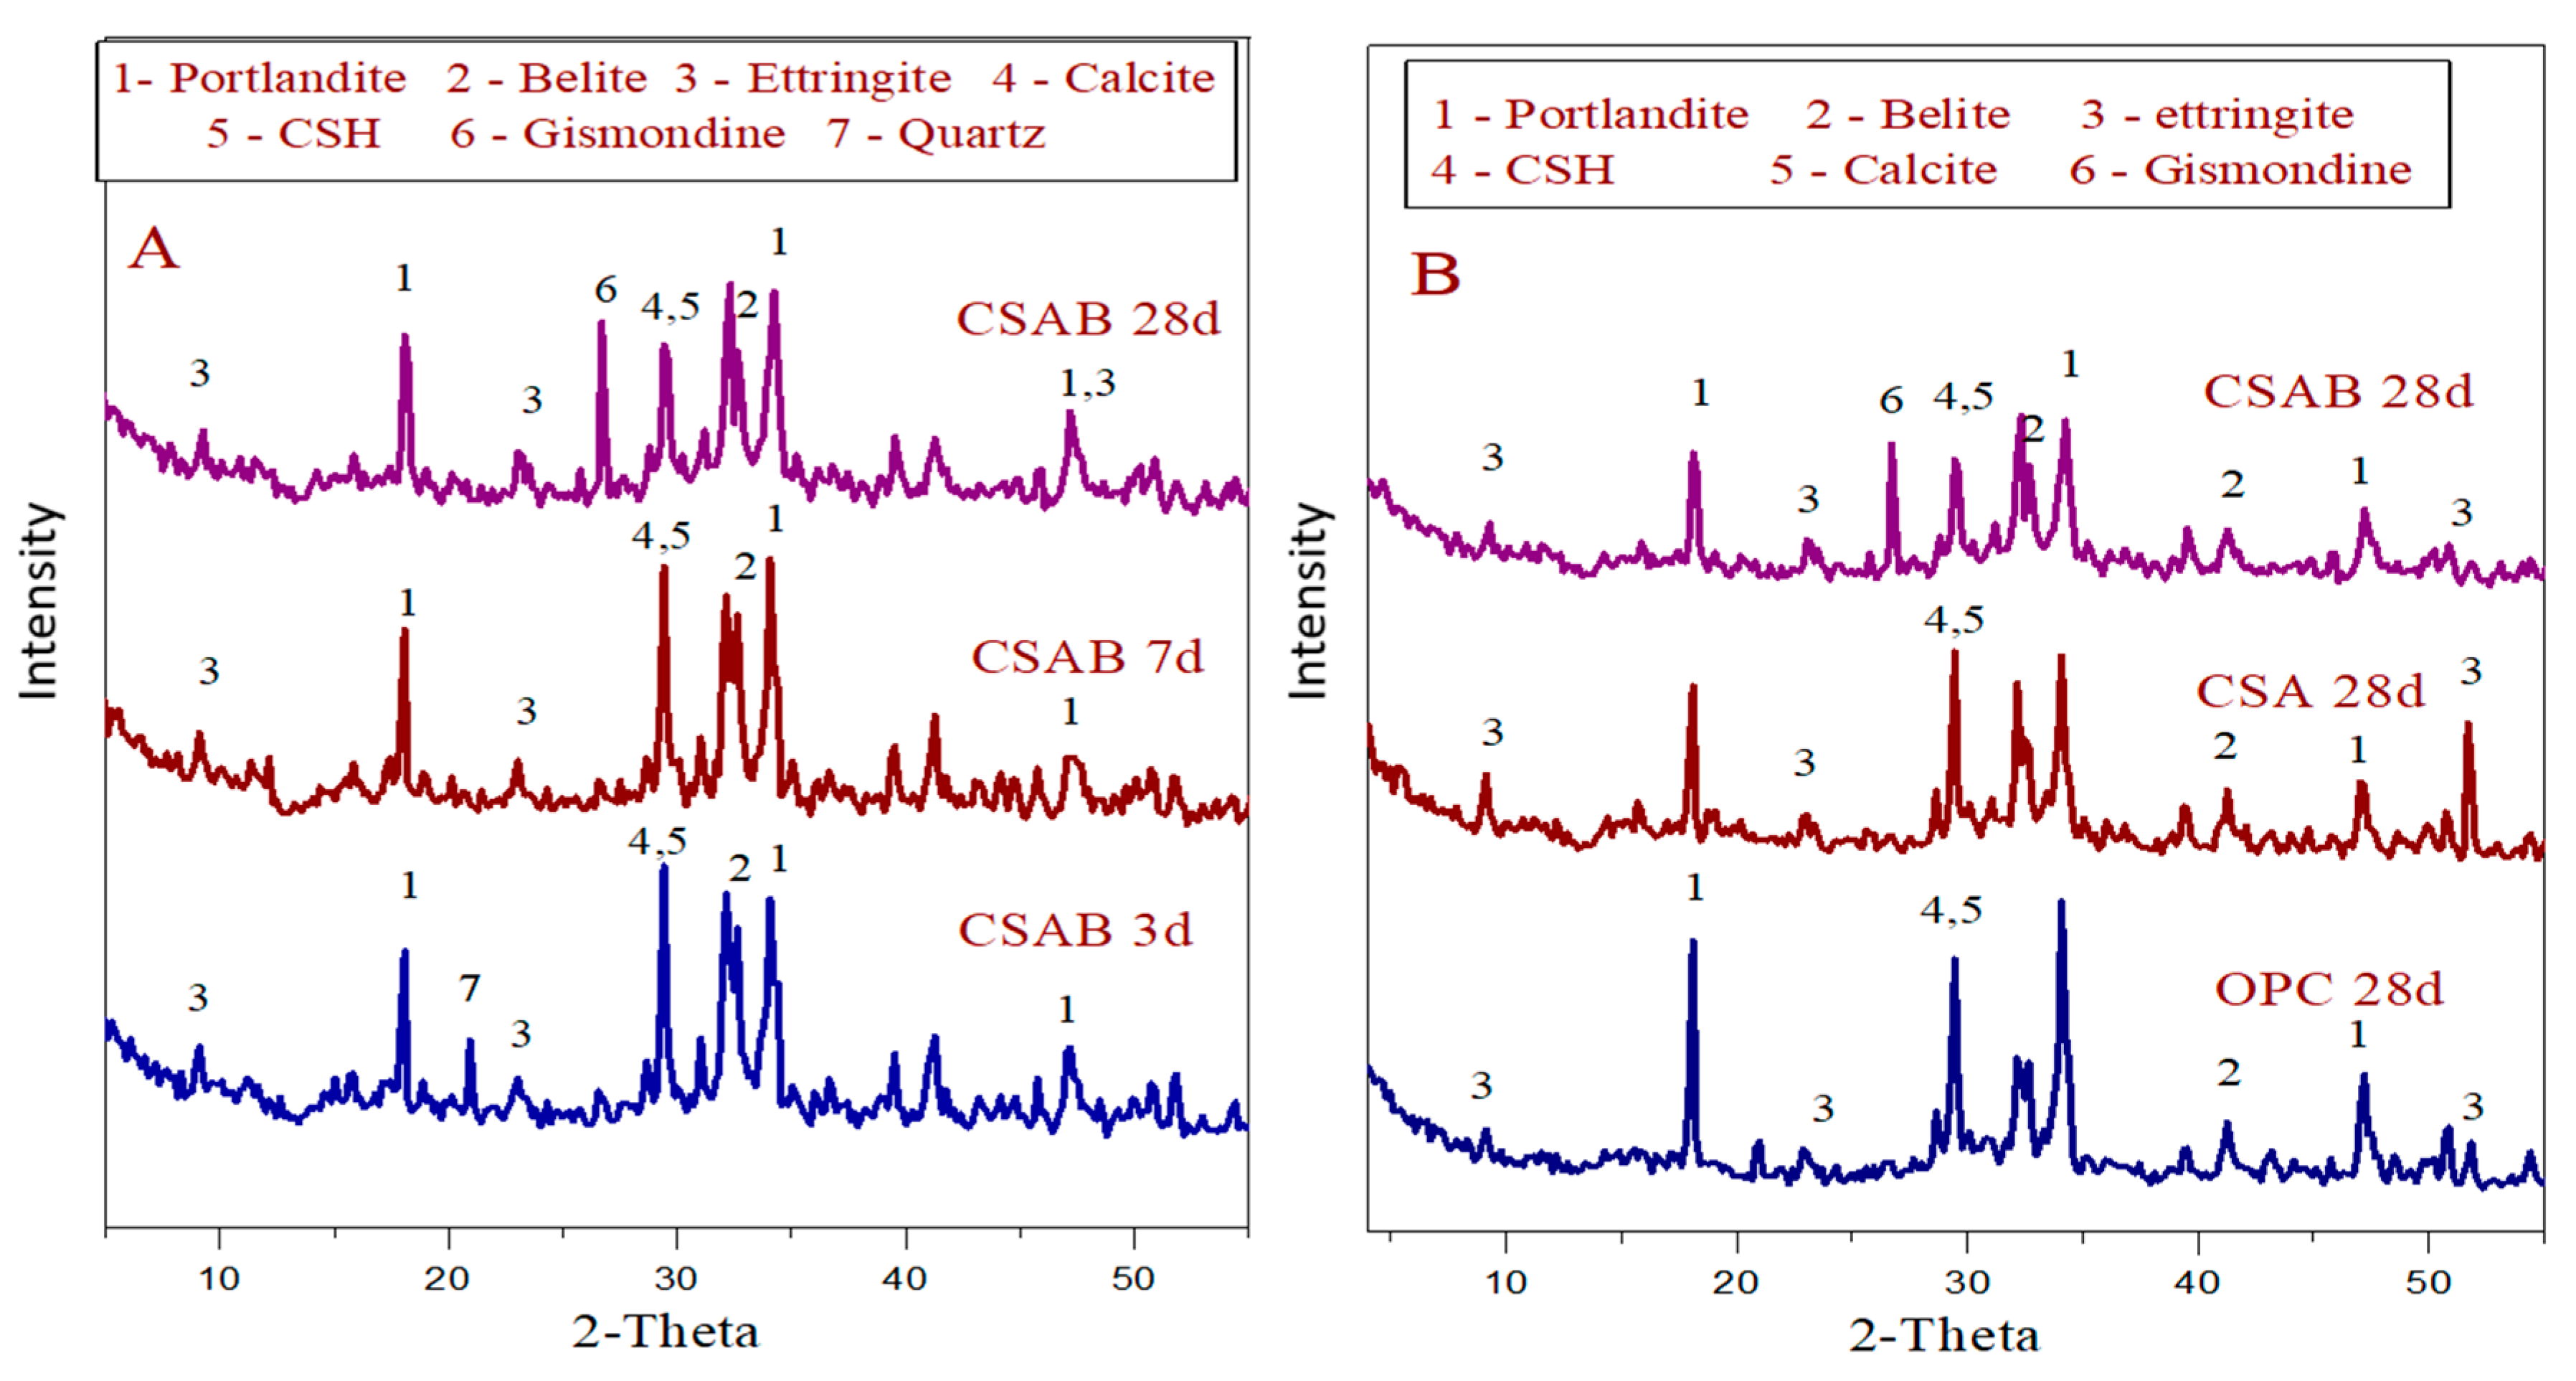
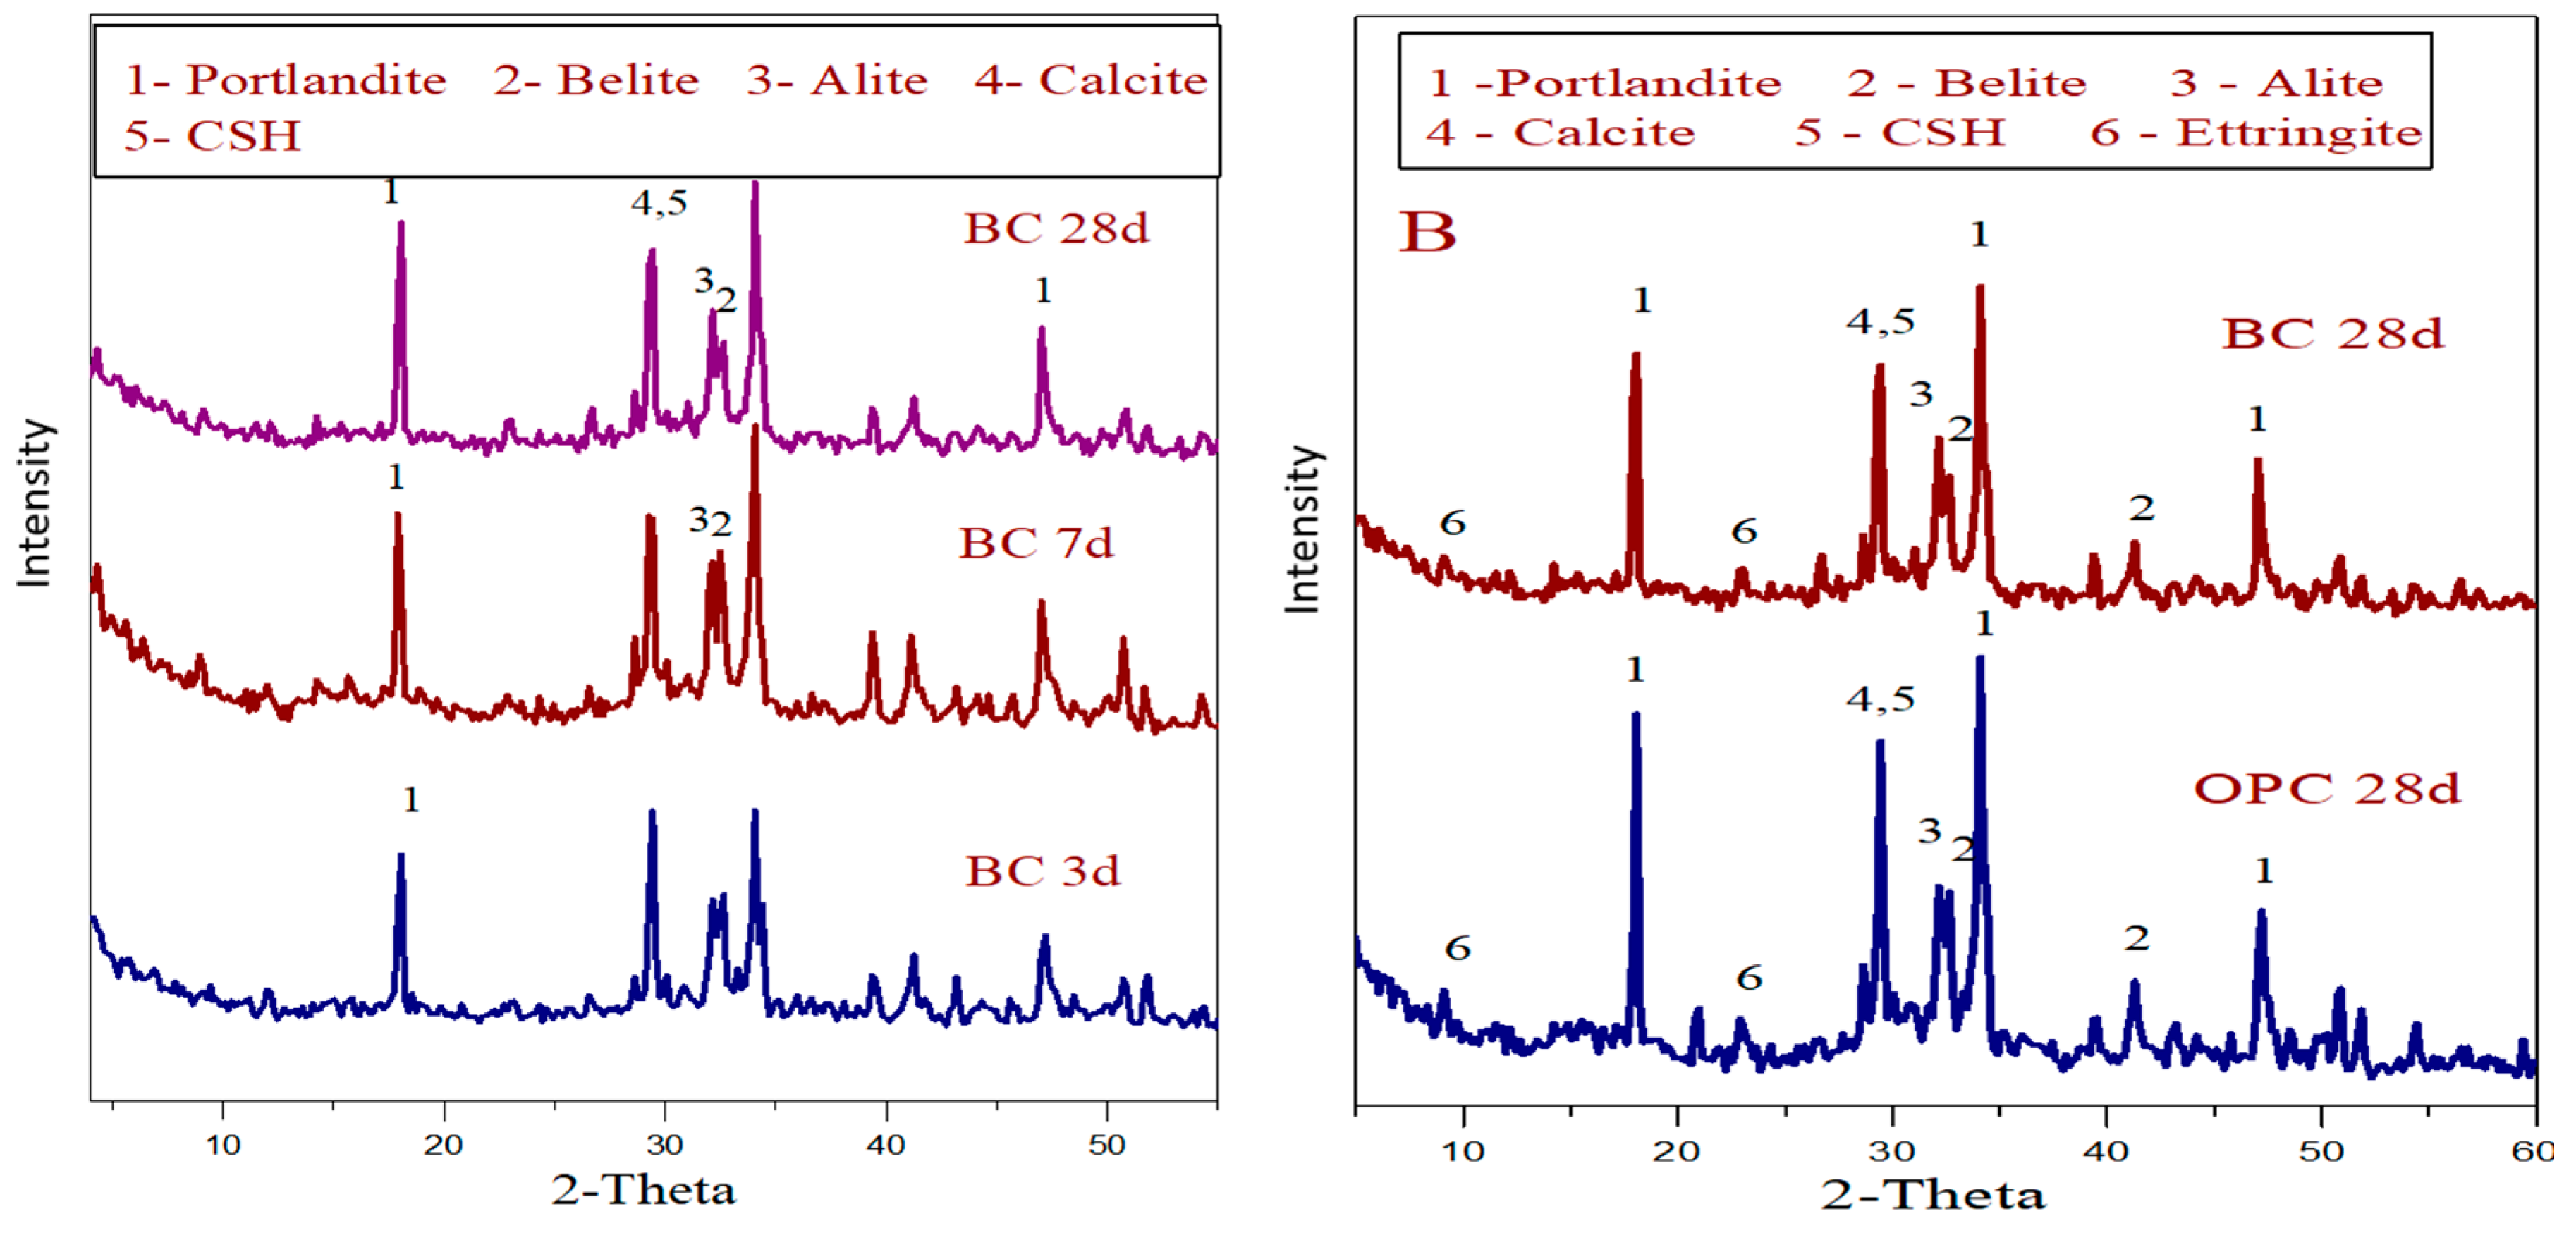
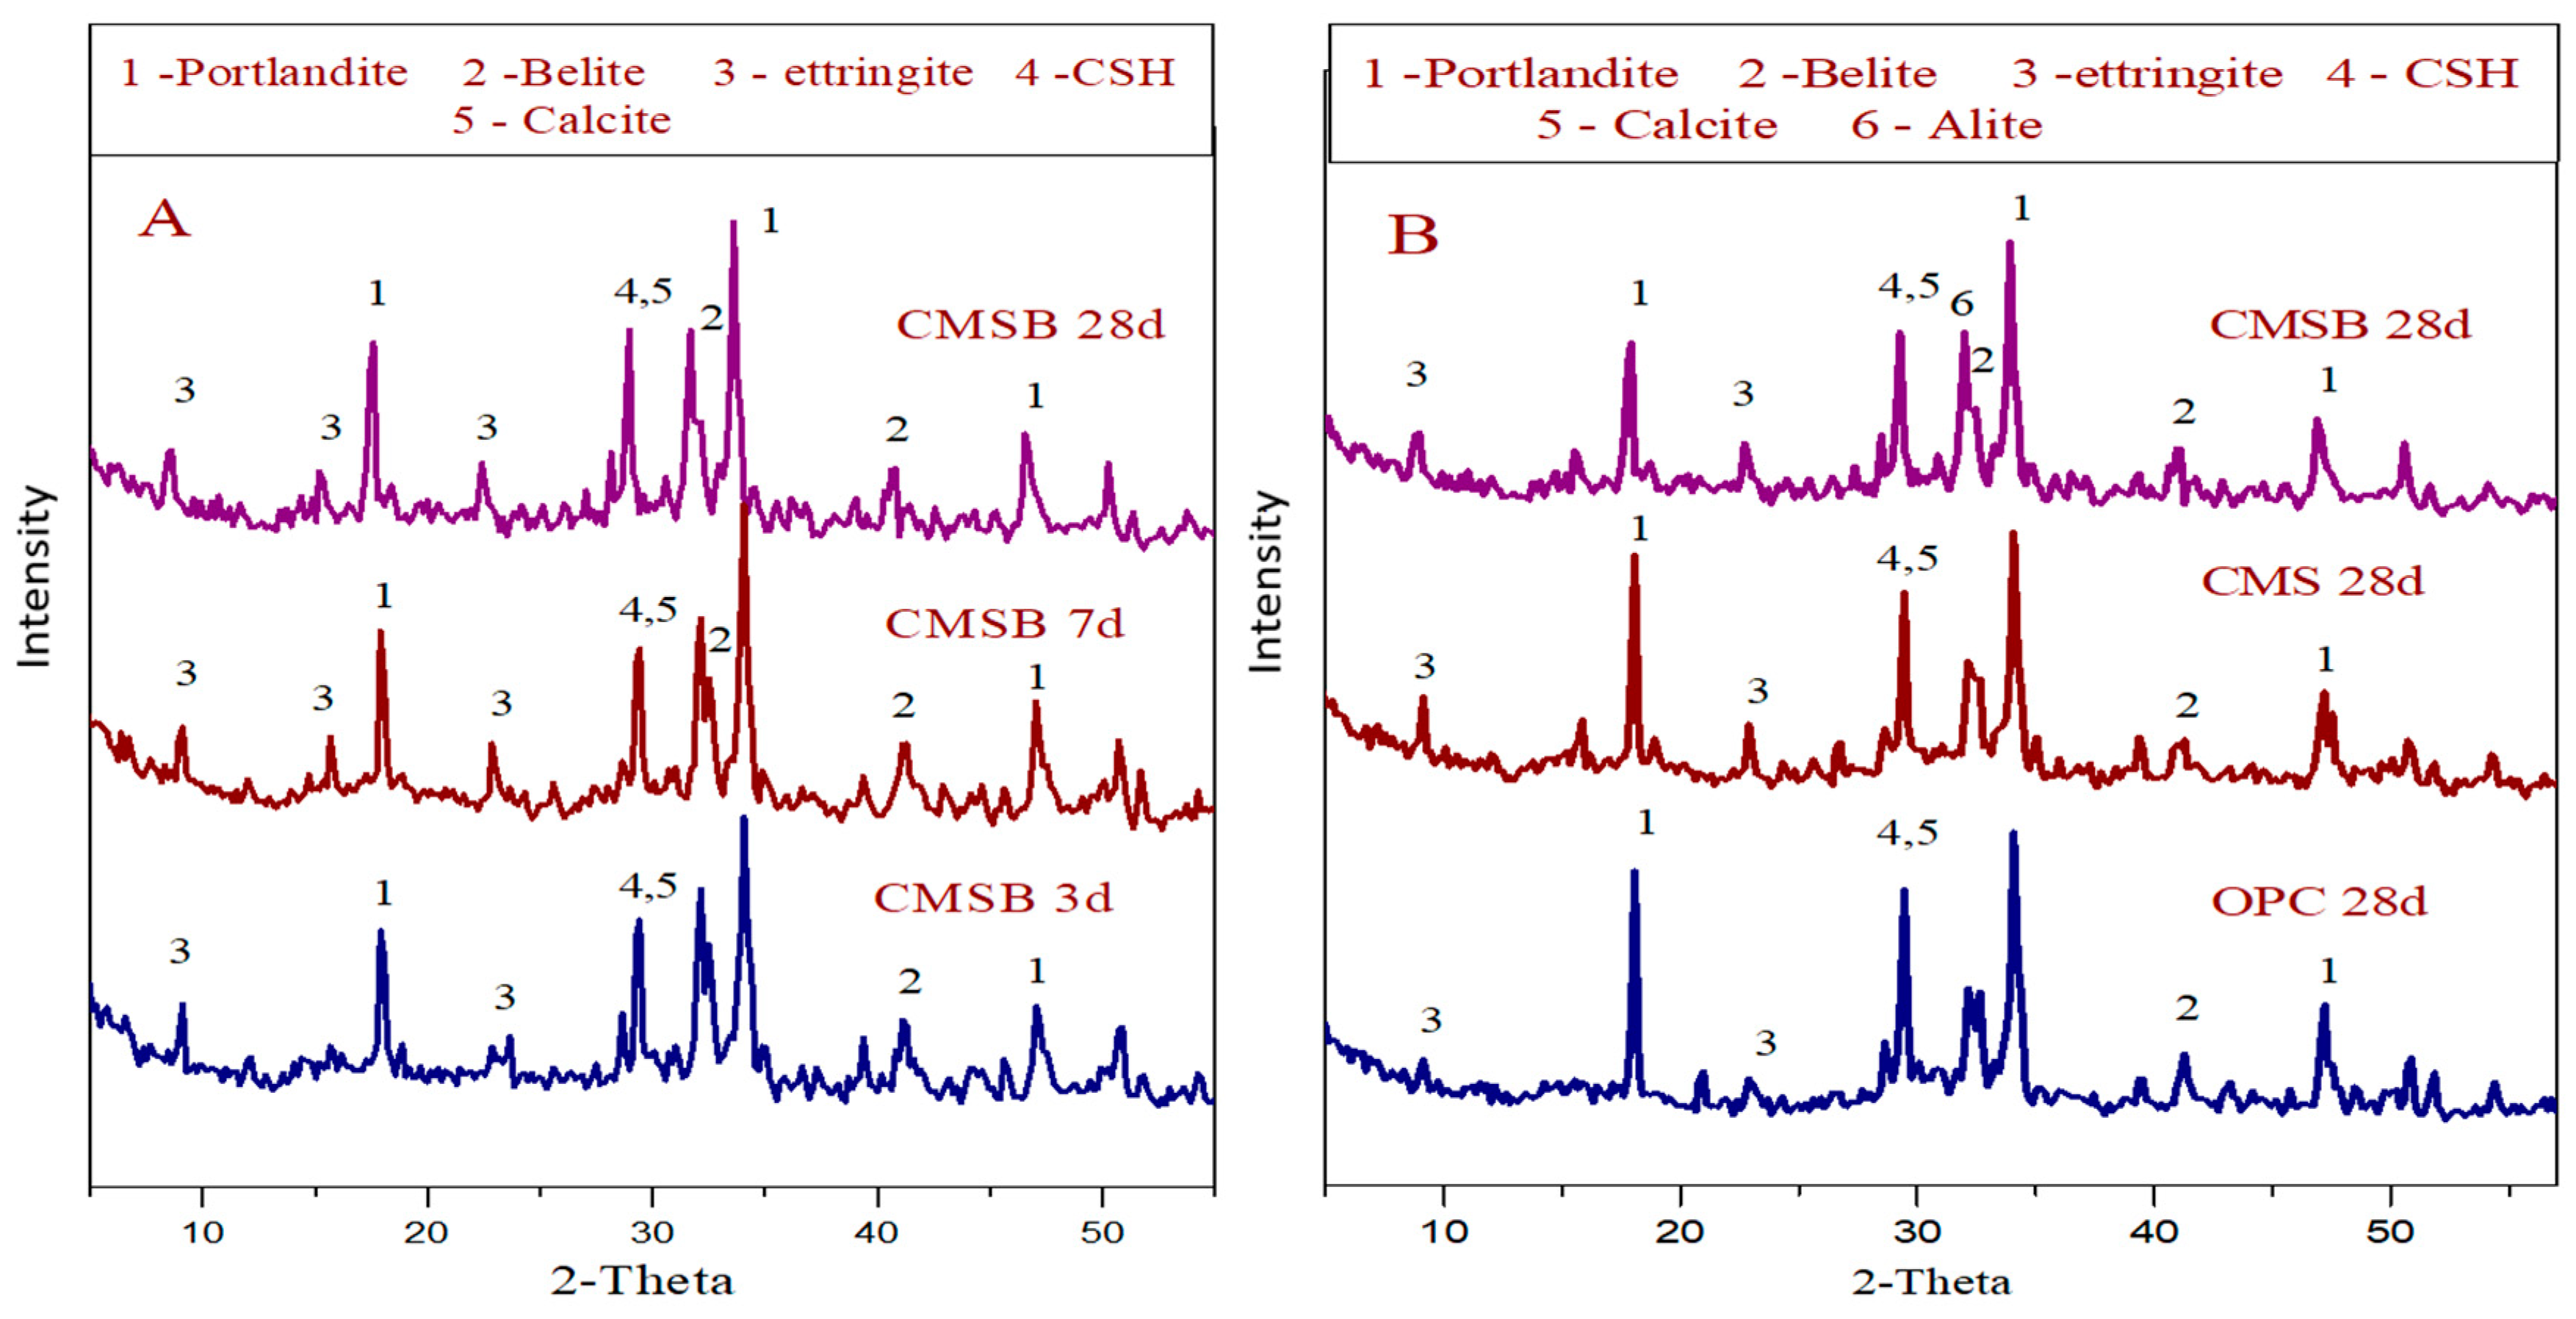
3.2.2. X-ray Study
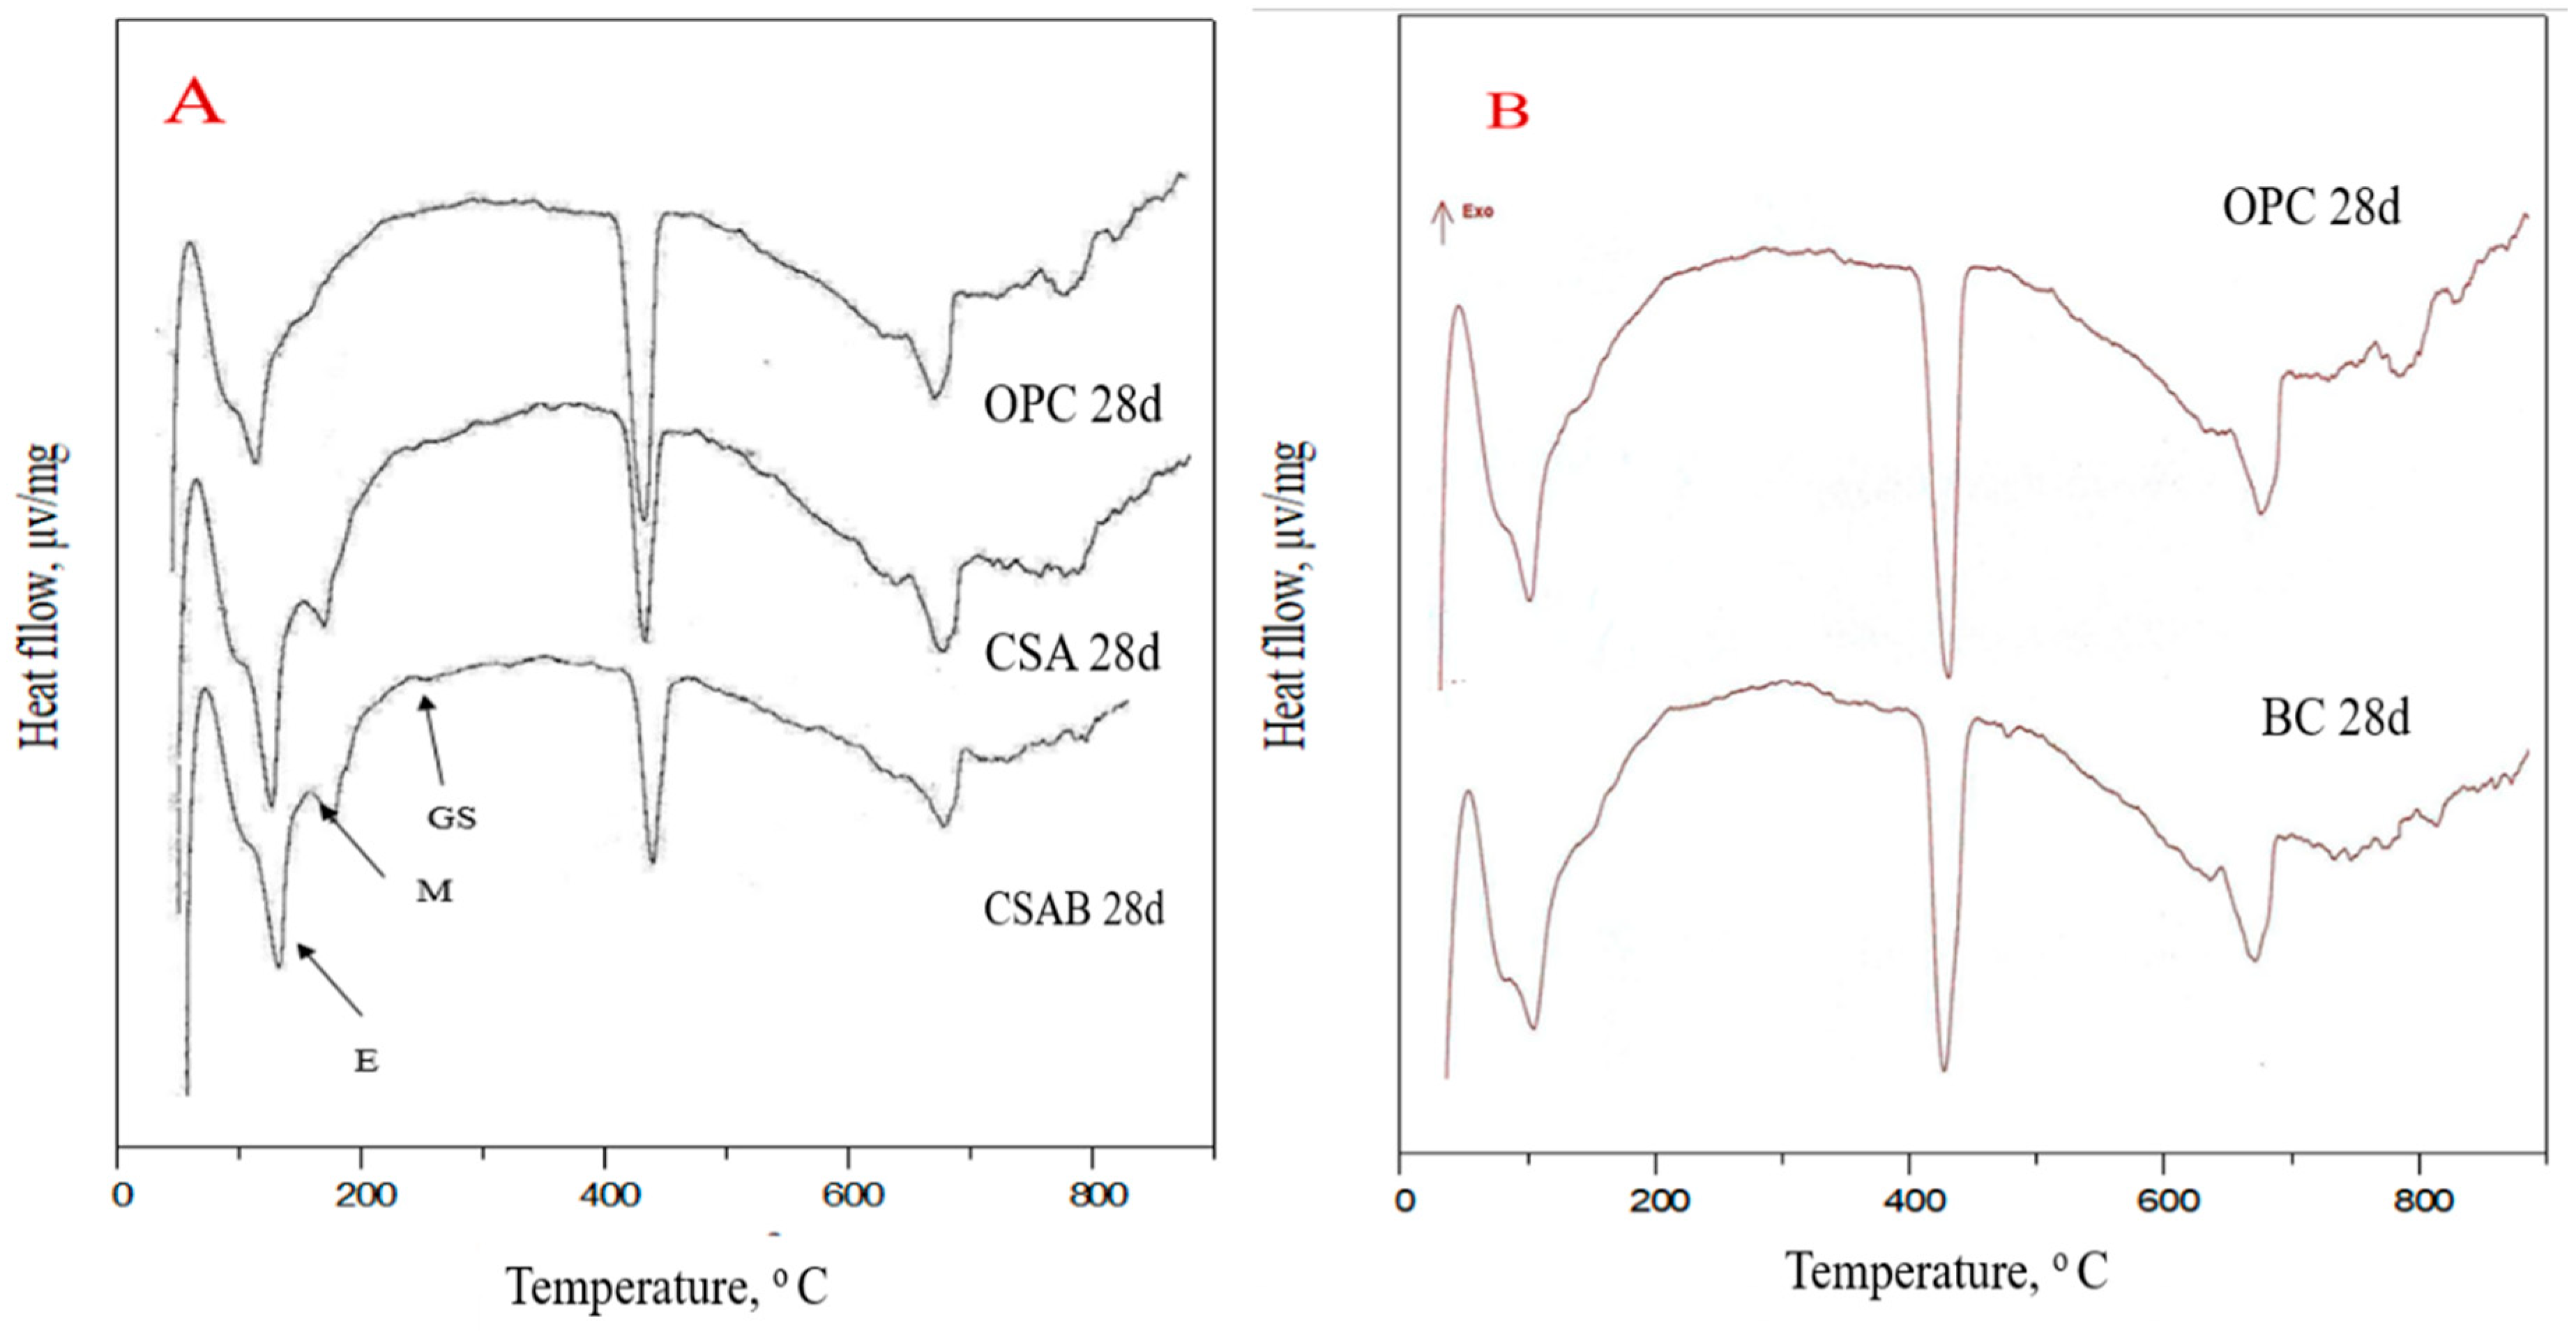
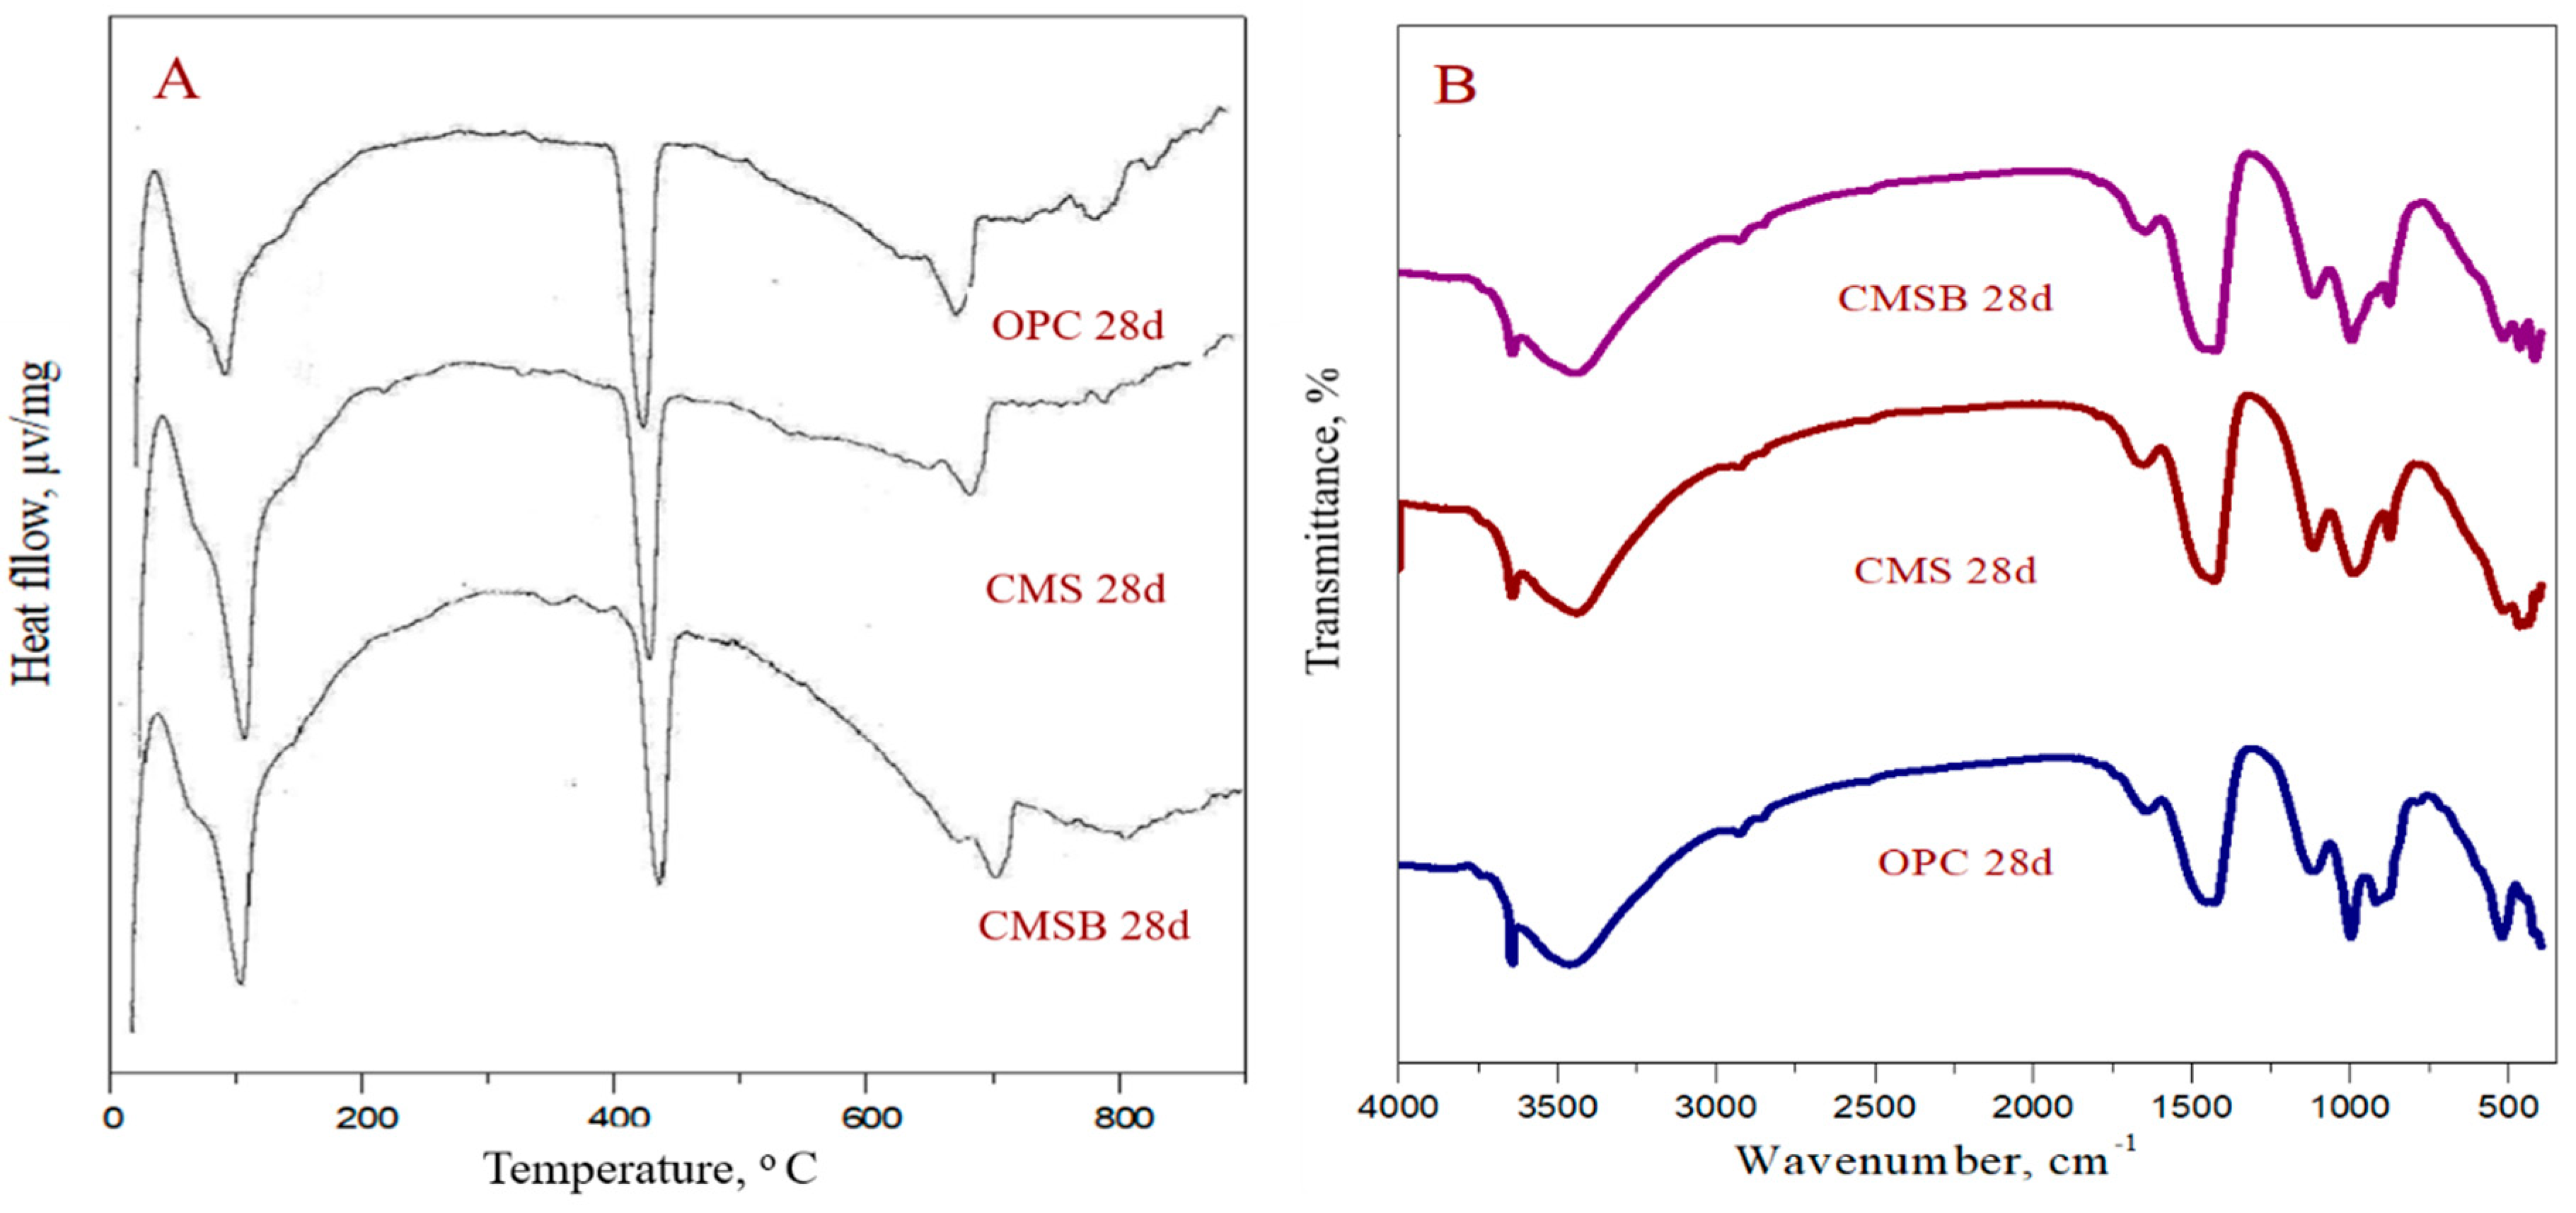
3.2.3. DSC Analysis
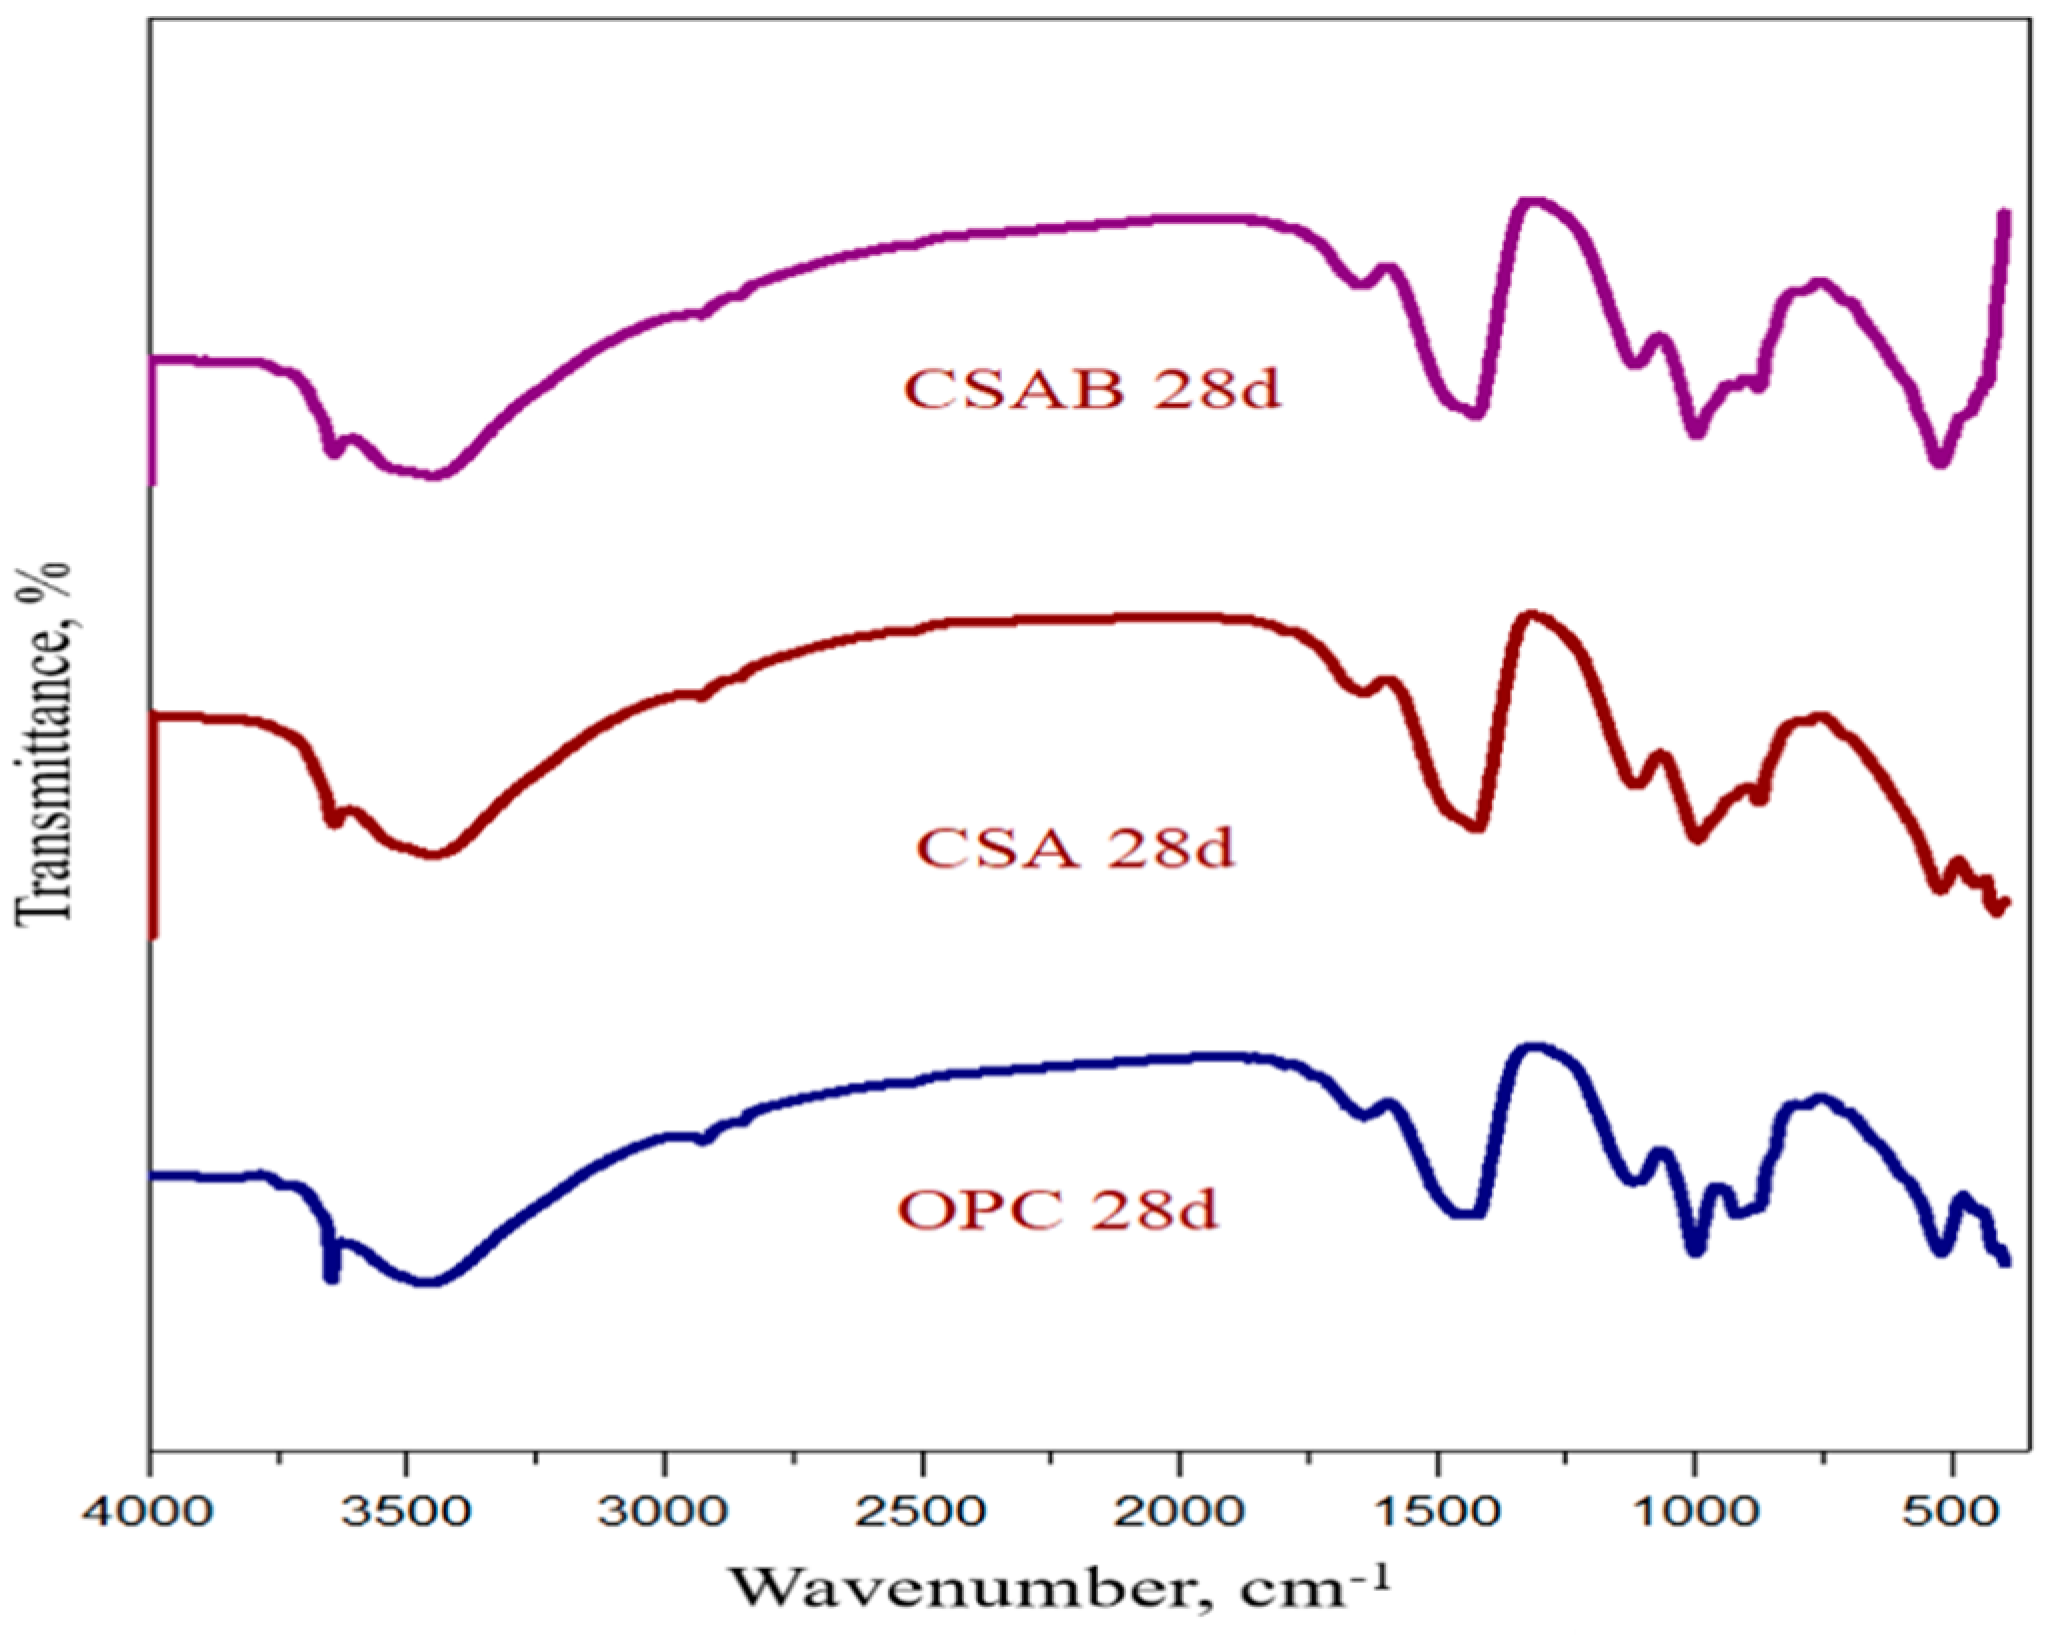
3.2.4. IR Spectra
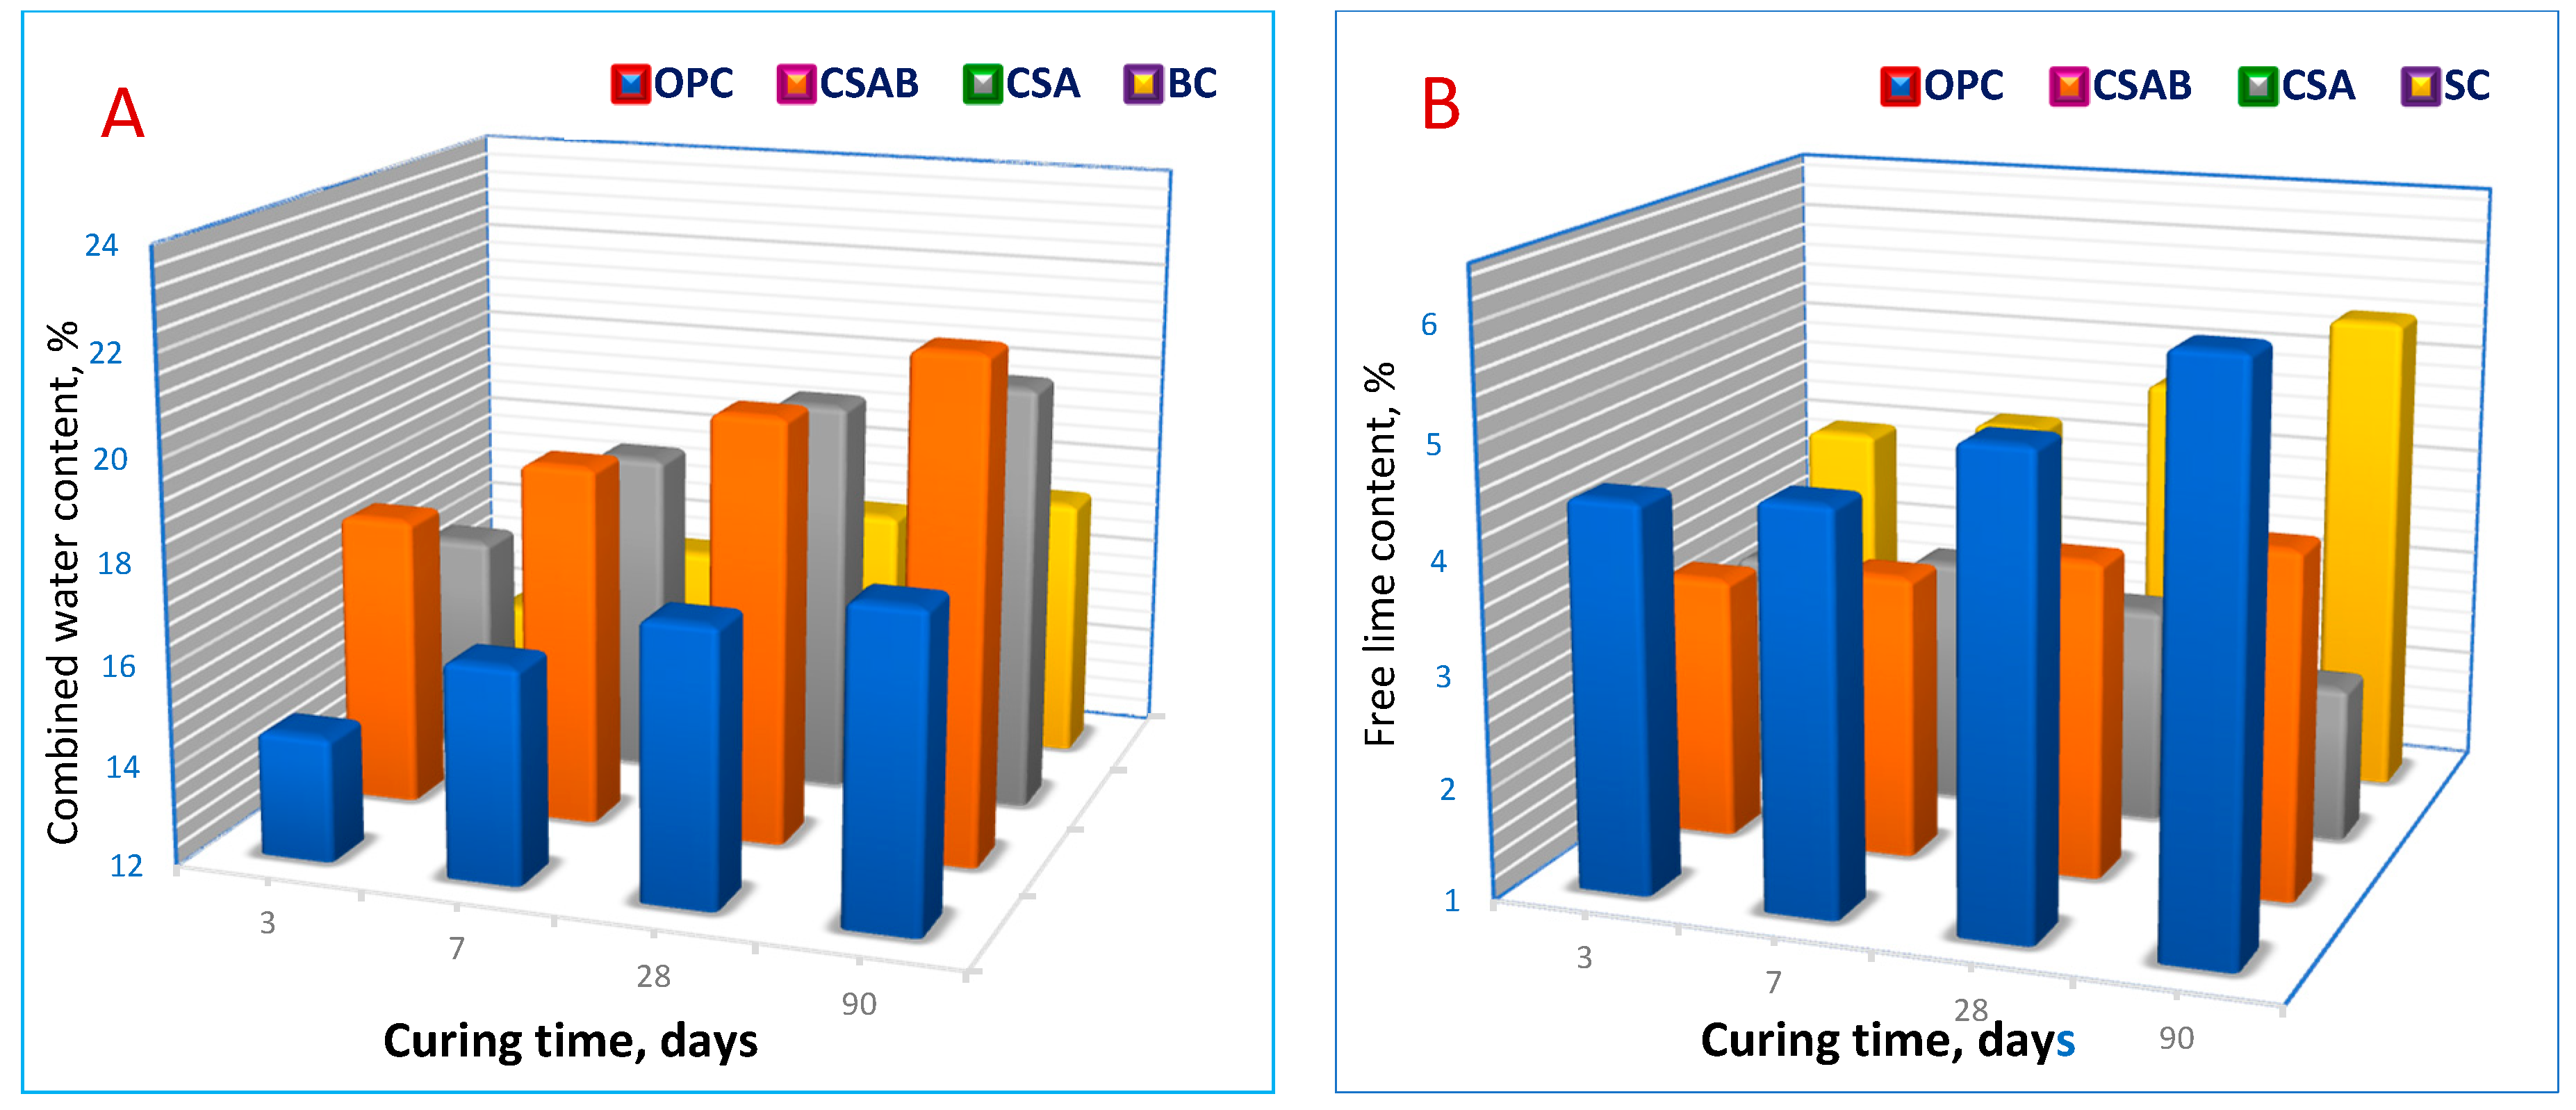
3.2.5. The Combined Water Contents
3.2.6. The Free Lime Contents
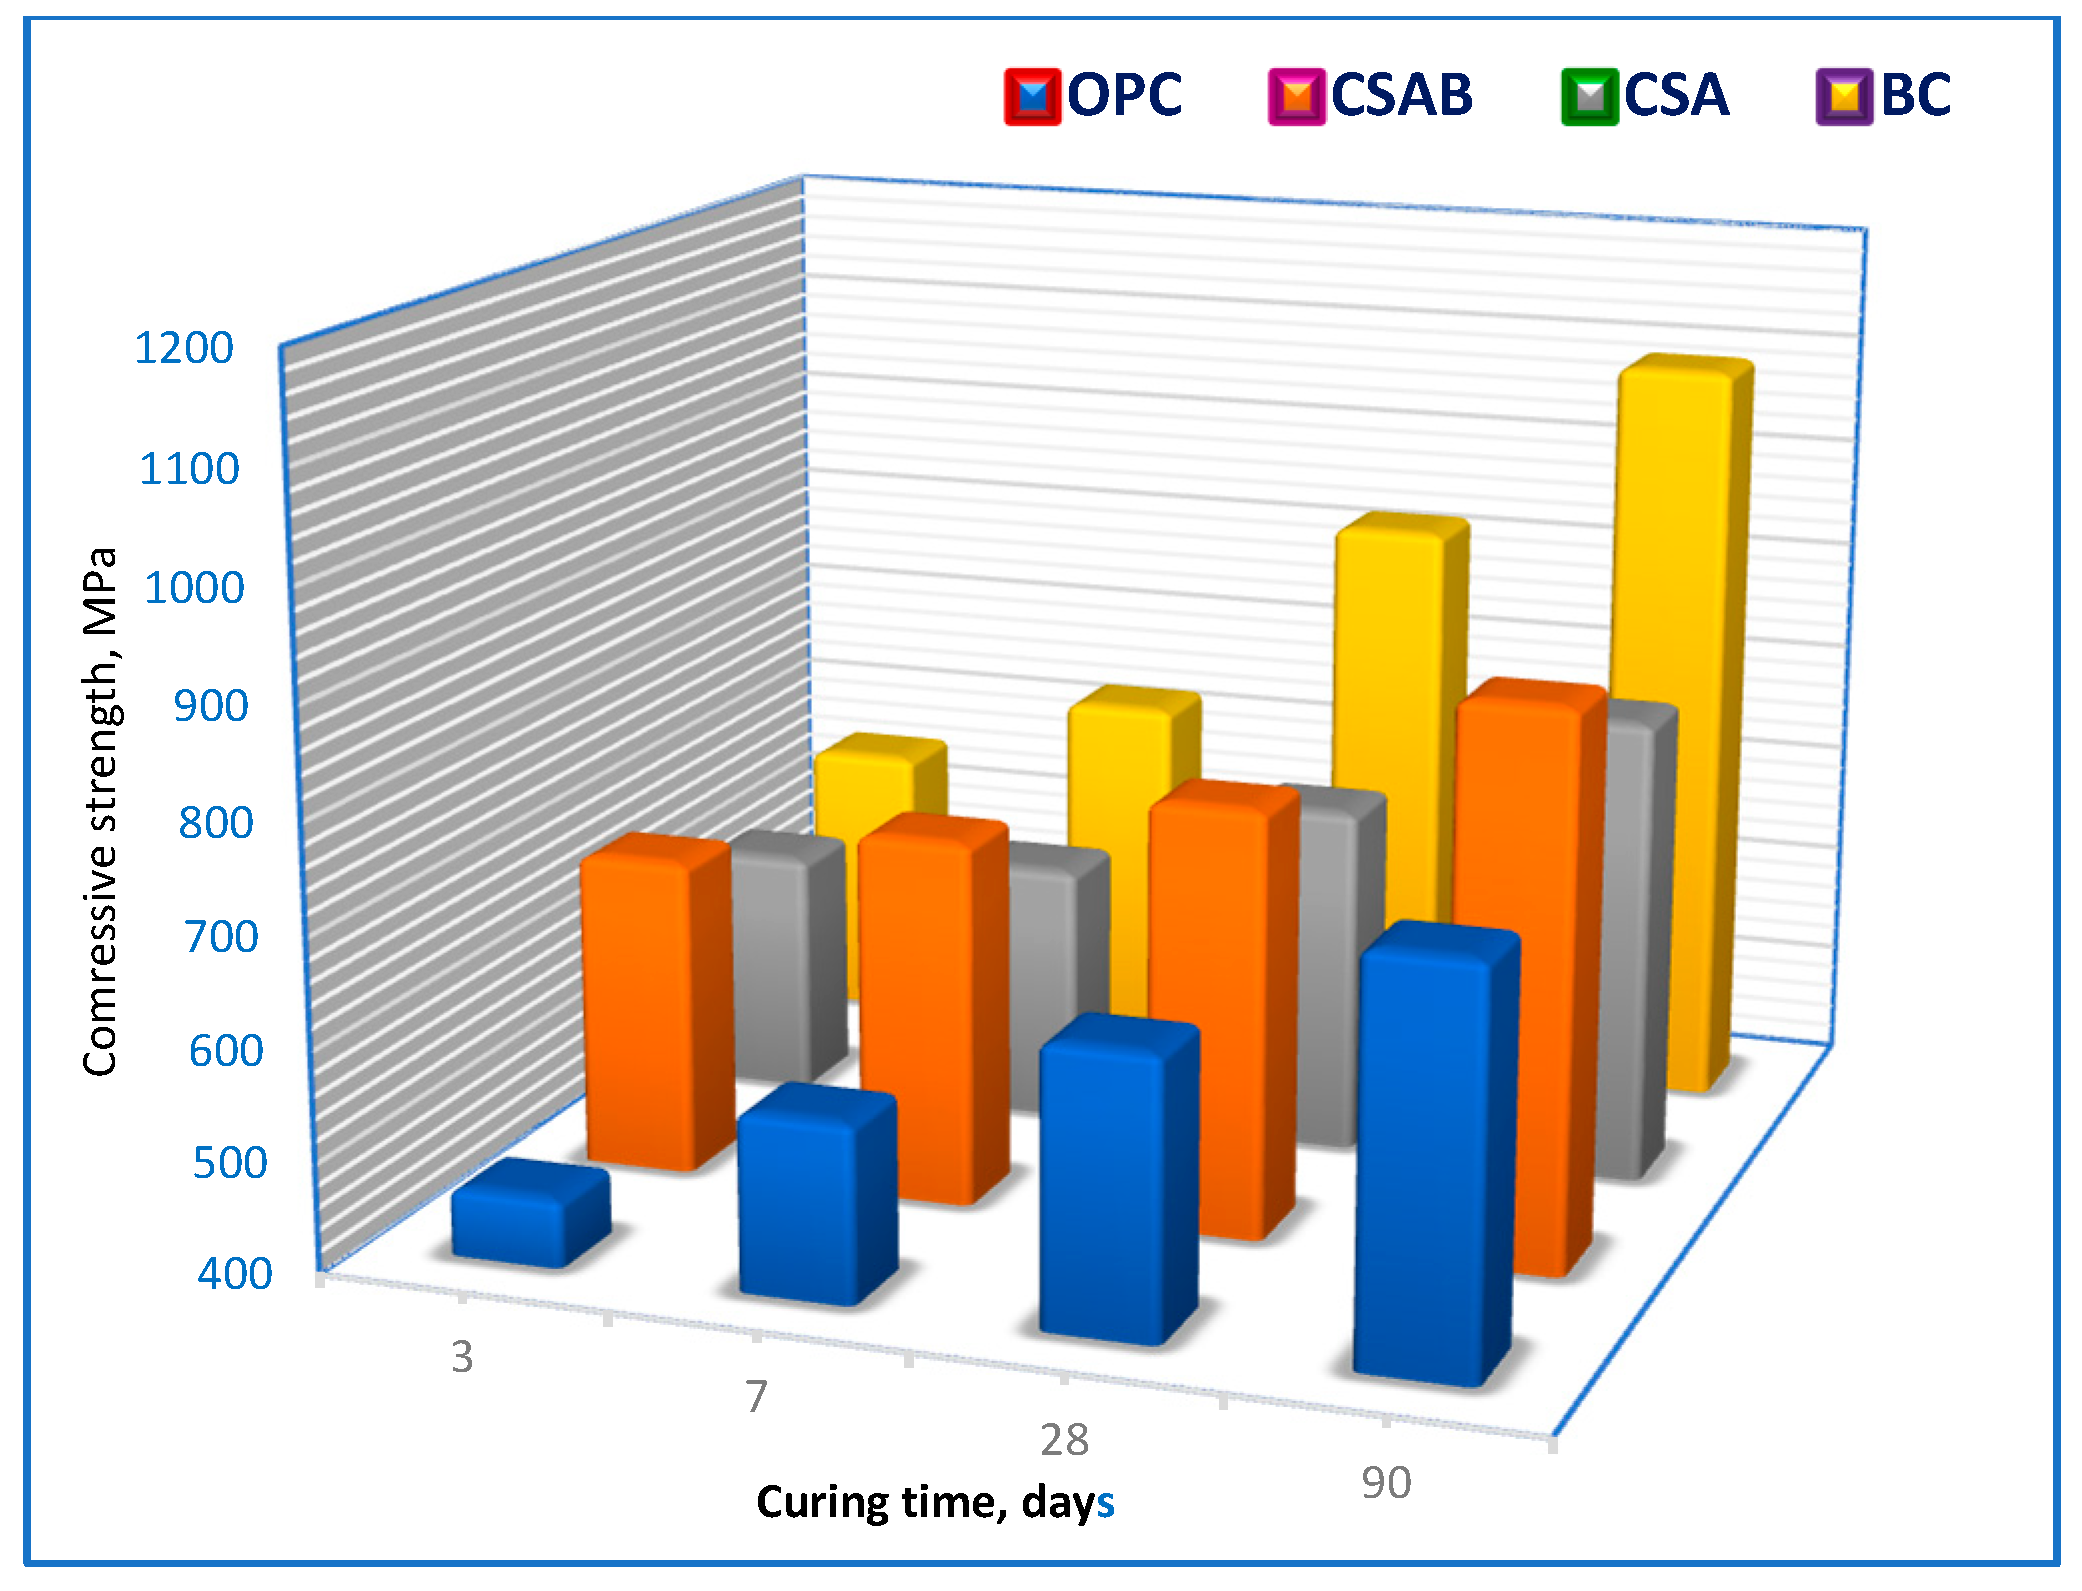
3.2.7. The Compressive Strength
3.3. Performance of OPC, CMS, and CMSB Cements
3.3.1. The Water Consistency
3.3.2. X-ray Analysis
3.3.3. DSC Analysis
3.3.4. IR Spectra
3.3.5. The Combined Water Contents
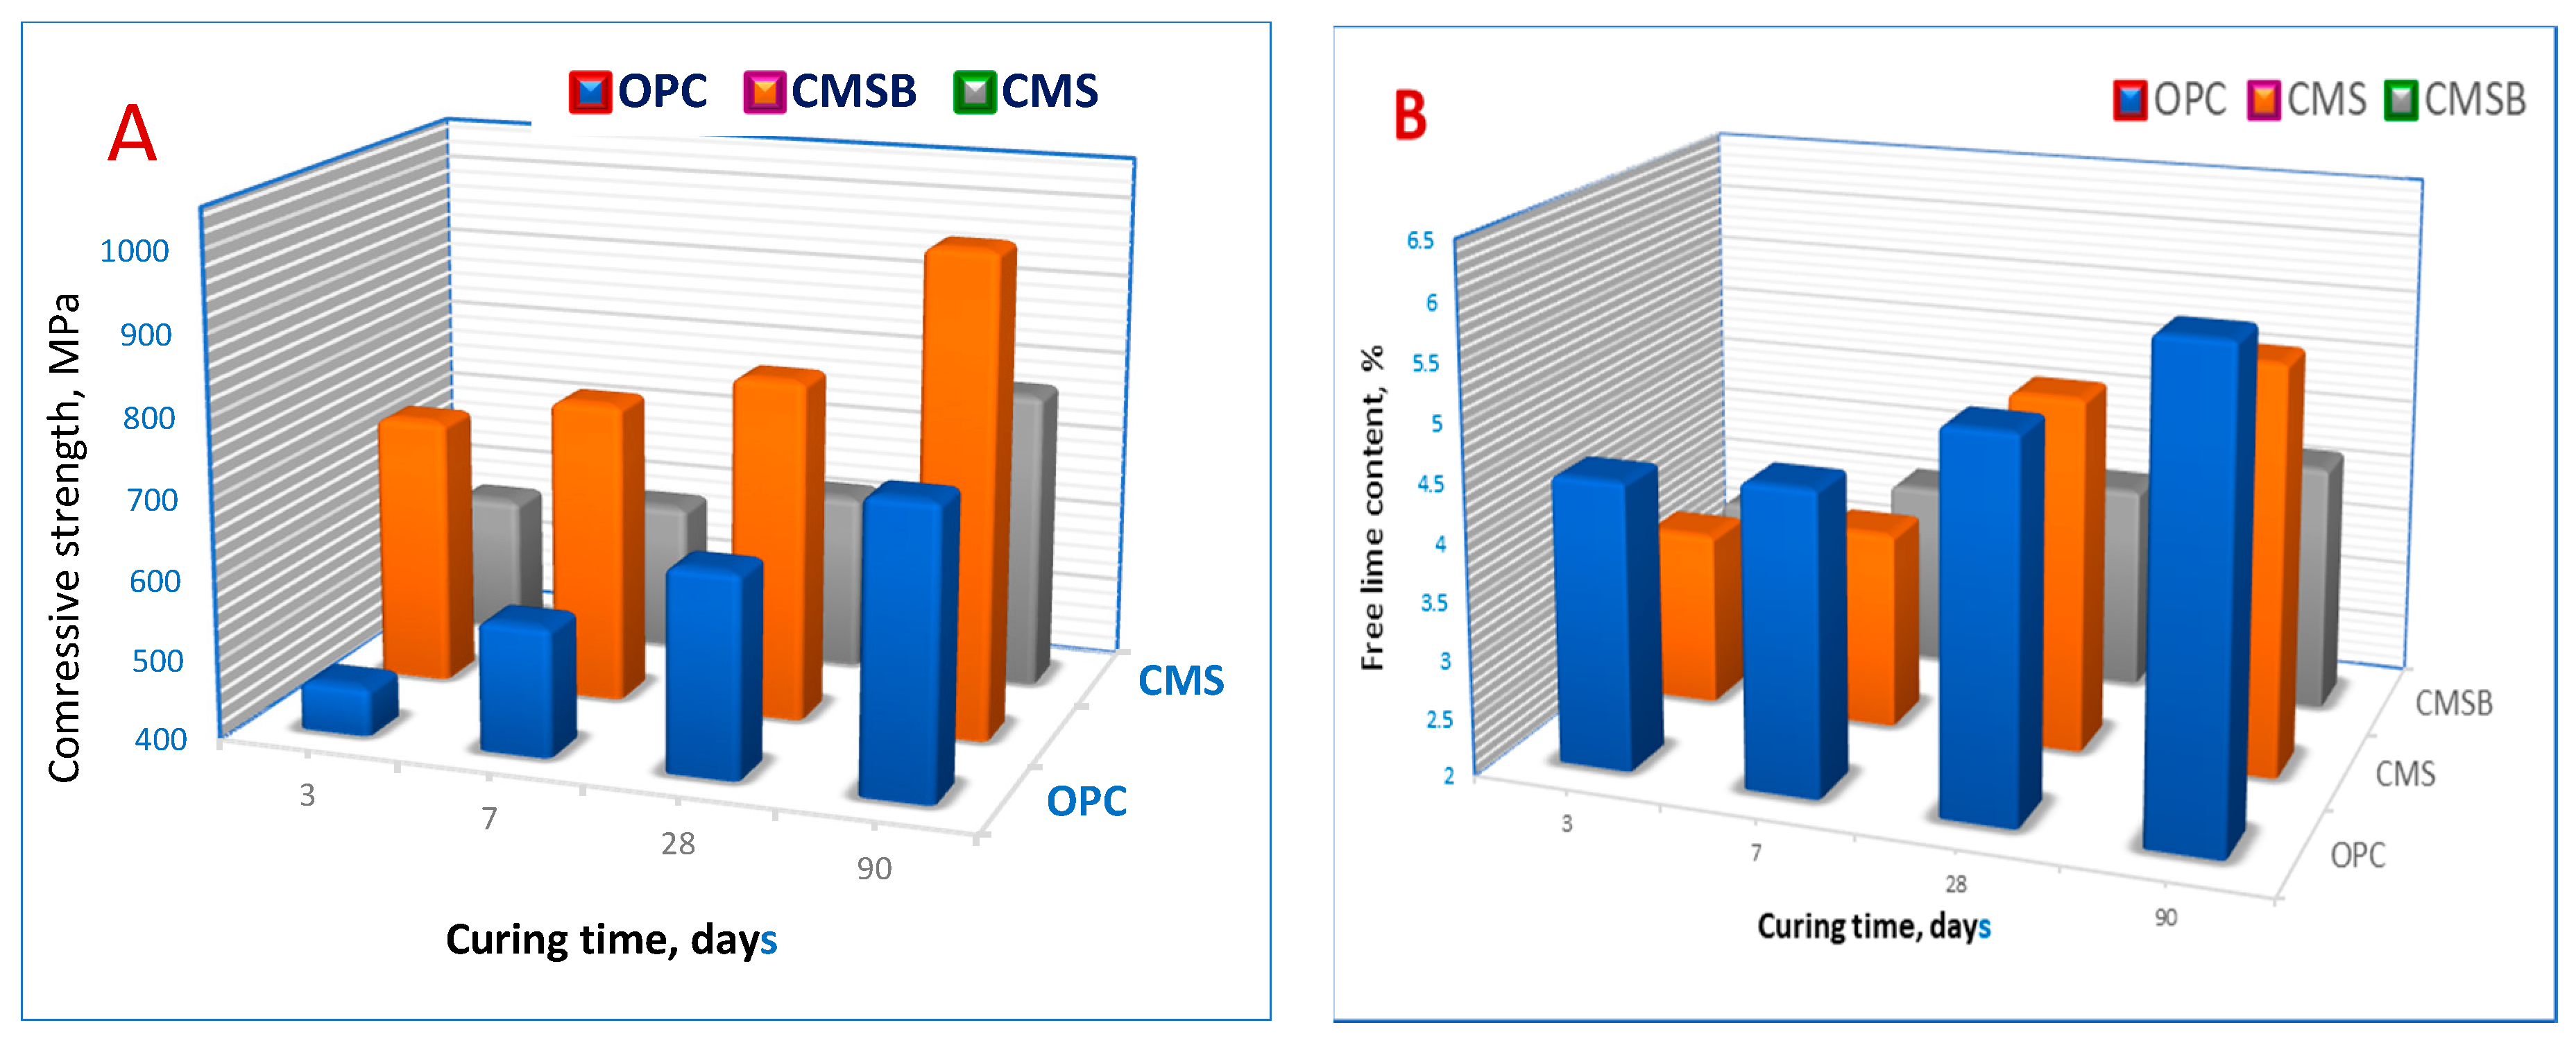
3.3.6. The Free CaO Content
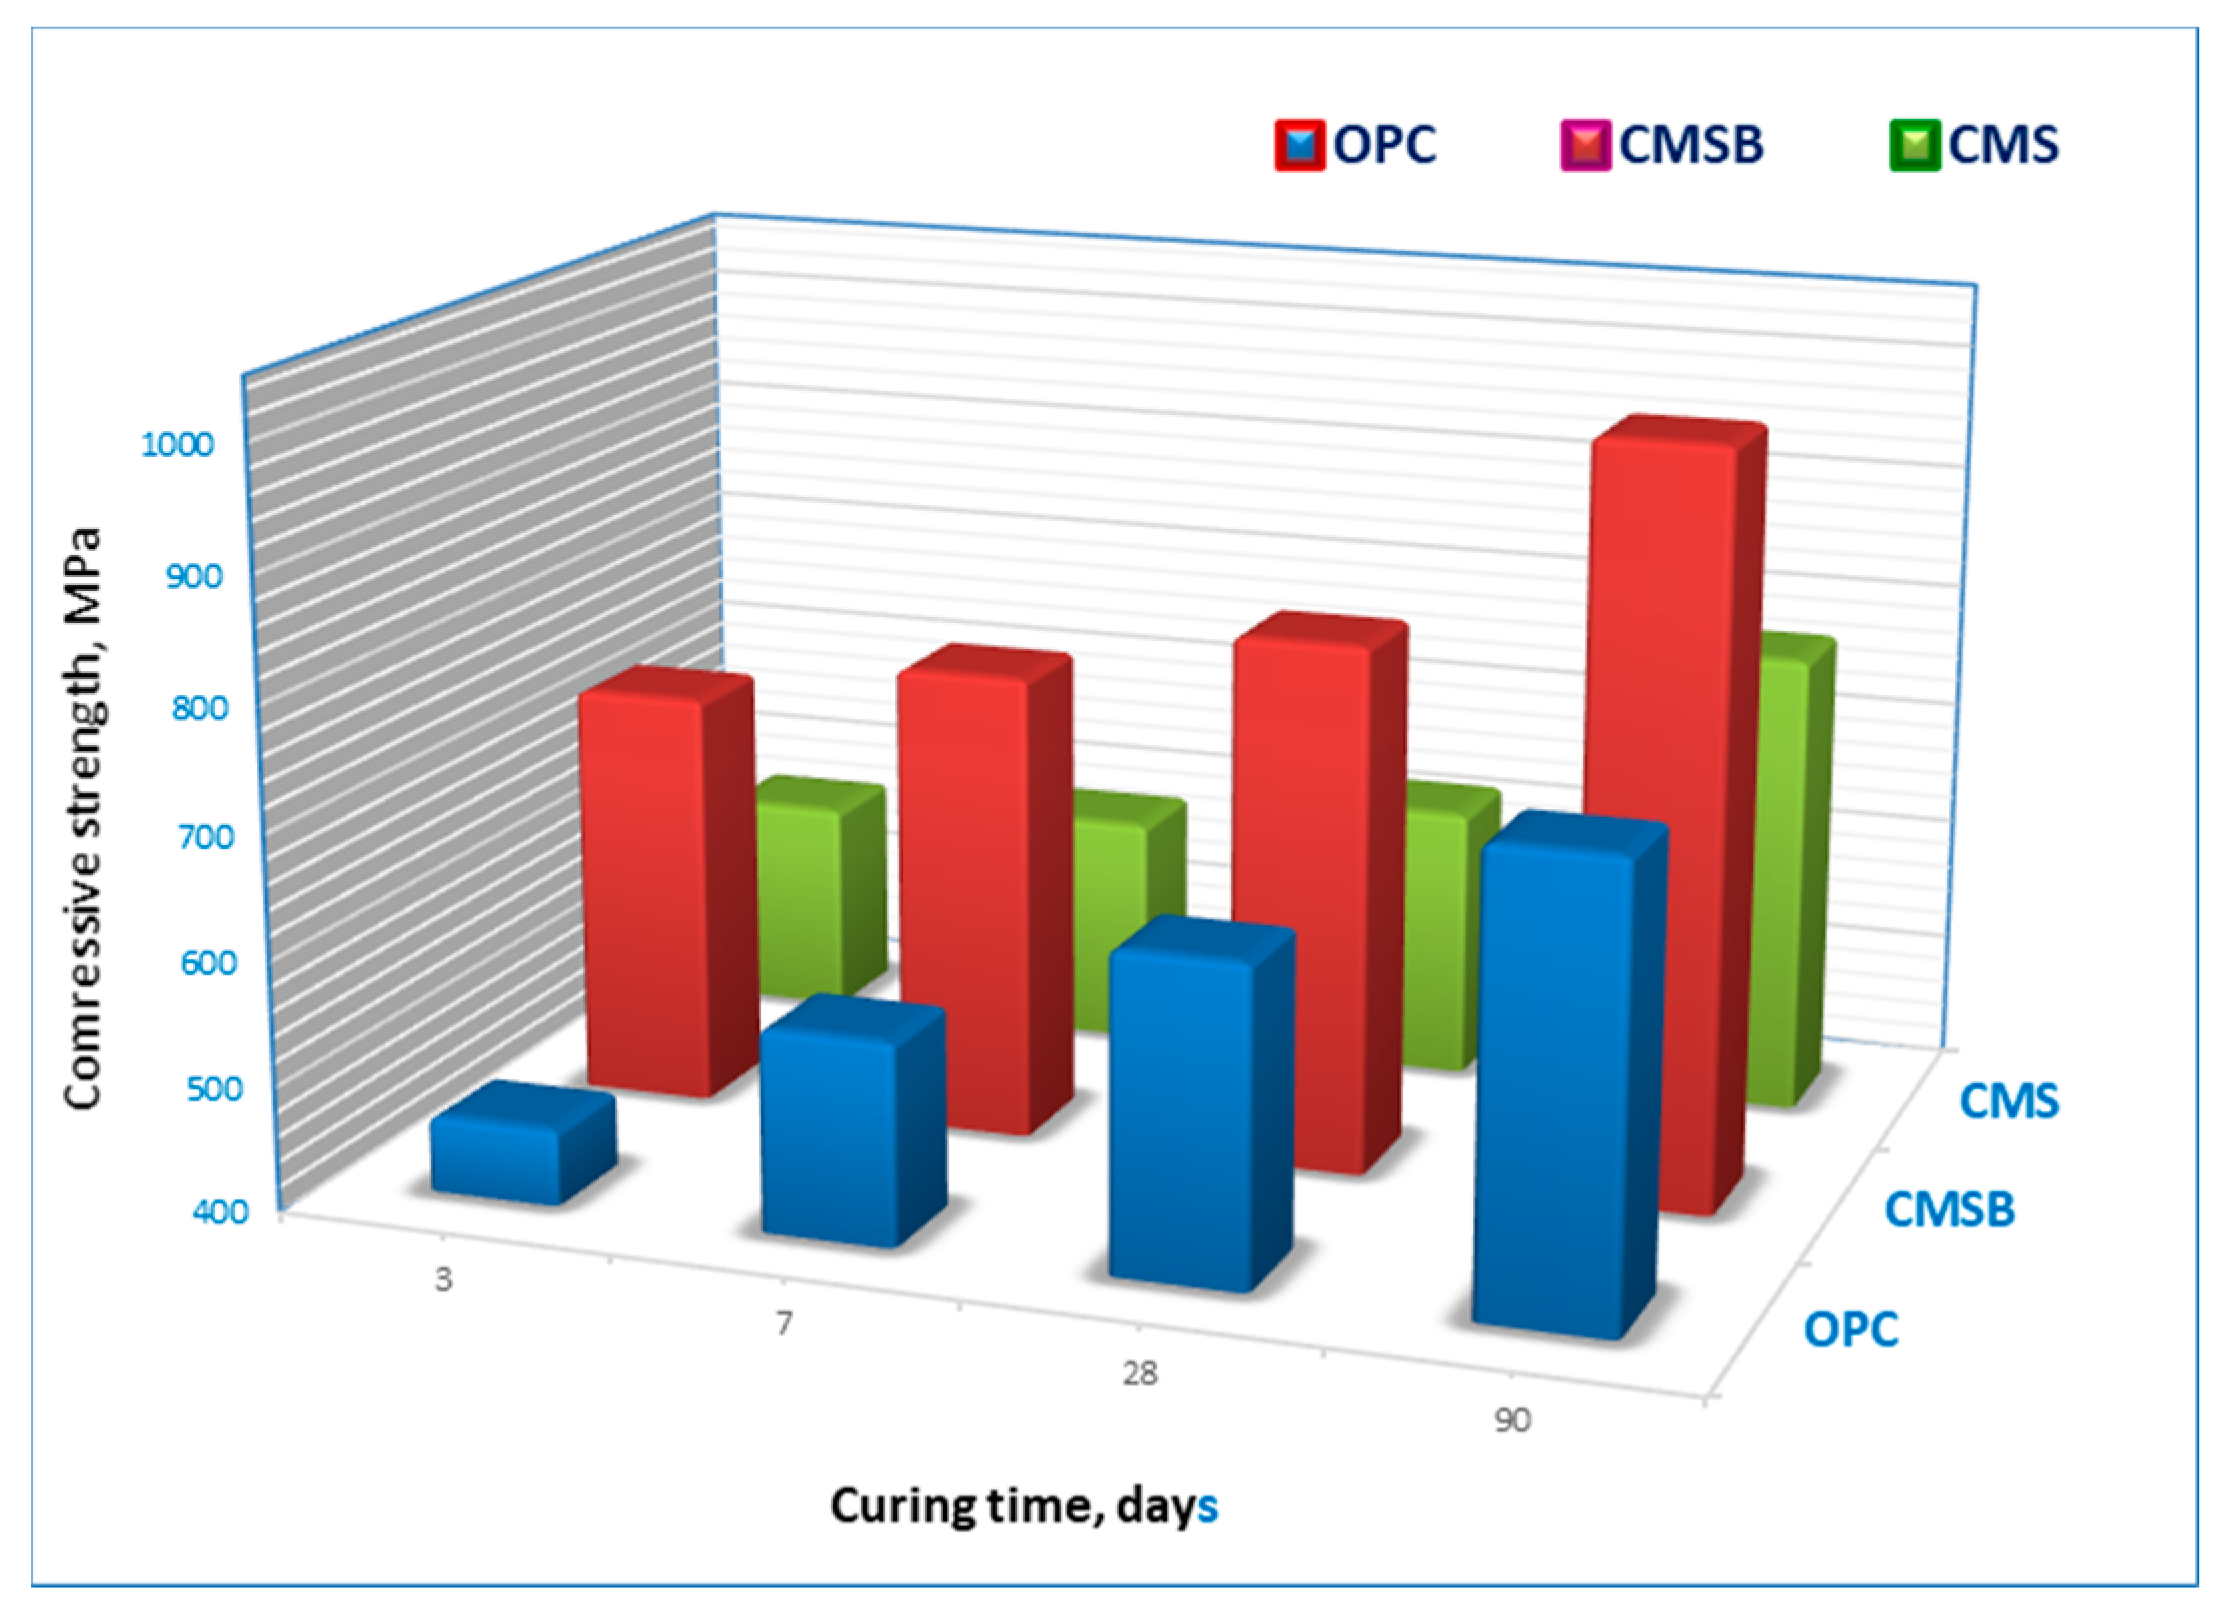
3.3.7. The Compressive Strength
4. Conclusions
- We developed a new generation of high-performance concrete material with respect to their mechanical and endurance strength for sustainable construction.
- We reduced the construction expense and energy utilization, improved the bulk property, and increased the compressive strength of OPCs.
- We produced new concrete supplies using nanotechnology-based novel cement processing and cement pastes.
- We used waste materials and cementitious resources to validate sustainable environment, development, and economic impacts that are desired by countries that prioritize the significance of nanotechnology.
Author Contributions
Funding
Acknowledgments
Conflicts of Interest
References
- Gupta, V.; Miura, N. Influence of the microstructure on the super capacitive behavior of polyaniline/single-wall carbon nano-tube composites. J. Power Sources 2006, 157, 616–620. [Google Scholar] [CrossRef]
- Hanehara, S.; Ichikawa, M. Nanotechnology of cement and concrete. J. Taiheiyo Cem. Corp. 2001, 141, 47–58. [Google Scholar]
- Daniyal, M.; Azam, A.; Akhtar, S. Application of nanomaterials in civil engineering. In Nanomaterials and Their Applications. Advanced Structured Materials; Khan, Z., Ed.; Springer: Singapore, 2018; pp. 169–189. [Google Scholar]
- Coppola, L.; Coffetti, D.; Crotti, E.; Gazzaniga, G.; Pastore, T. An empathetic added sustainability index (EASI) for cementitious based construction materials. J. Clean. Prod. 2019, 220, 475–482. [Google Scholar] [CrossRef]
- Pelletier-Chaignat, L.; Winnefeld, F.; Lothenbach, B.; Müller, C.J. Beneficial use of limestone filler with calcium sulphoaluminate cement. Constr. Build. Mater. 2012, 26, 619–627. [Google Scholar] [CrossRef]
- Li, J.; Zhou, C.Y.; Yang, Y.J. Optimization of mineral composition of high β -C2S-sulphoaluminate clinker. J. Chin. Ceram. Soc. 2012, 40, 1618–1624. [Google Scholar]
- Senff, L.; Castela, A.; Hajjaji, W.; Hotza, D.; Labrincha, J.A. Formulations of sulfoβ-C2S cement through design of experiments. Constr. Build. Mater. 2011, 25, 3410–3416. [Google Scholar] [CrossRef]
- Hewlett, P.C.; Liska, M. Lea’s Chemistry of Cement and Concrete; Elsevier: Amsterdam, The Netherlands, 2004. [Google Scholar]
- Martín-Sedeño, M.C.; Cuberos, A.J.M.; de La Torre, A.G.; Álvarez-Pinazo, G.; Ordónez, L.M.; Gateshki, M.; Aranda, M.A.G. Aluminum-rich β-C2S sulfoaluminate cements: Clinkering and early age hydration. Cem. Concr. Res. 2010, 40, 359–369. [Google Scholar] [CrossRef] [Green Version]
- Zivica, V. Possibility of the modification of the properties of sulfoaluminate β-C2S cement by its blending. Ceram. Silikáty 2001, 45, 24–30. [Google Scholar]
- Glasser, F.P.; Zhang, L. High-performance cement matrices based on calcium sulfoaluminate–β-C2S compositions. Cem. Concr. Res. 2001, 31, 1881–1886. [Google Scholar] [CrossRef]
- Janotka, I.; Ray, A.; Mojumdar, S.C. The hydration phase and pore structure formation in the blends of sulfoaluminate-β-C2S cement with Portland cement. Cem. Concr. Res. 2003, 33, 489–497. [Google Scholar] [CrossRef]
- Quillin, K. Performance of β-C2S–sulfoaluminate cements. Cem. Concr. Res. 2001, 31, 1341–1349. [Google Scholar] [CrossRef]
- Liao, Y.; Wei, X.; Li, G. Early hydration of calcium sulfoaluminate cement through electrical resistivity measurement and microstructure investigations. Constr. Build. Mater. 2011, 25, 1572–1579. [Google Scholar] [CrossRef]
- Pera, J.; Ambroise, J. New applications of calcium sulfoaluminate cement. Cem. Concr. Res. 2004, 34, 671–676. [Google Scholar] [CrossRef]
- Gastaldi, D.; Canonico, F.; Boccaleri, E. Ettringite and calcium sulfoaluminate cement: Investigation of water content by near-infrared spectroscopy. J. Mater. Sci. 2009, 44, 5788–5794. [Google Scholar] [CrossRef]
- Heikal, M.; El-Didamony, H.; El-Sokkary, T.M.; Khalil, K.A.; Ahmed, I.A. Active β-C2S and the hydration of calcium sulfoaluminates prepared from nano-materials. Ceram. Silikáty 2014, 58, 165–171. [Google Scholar]
- El-Didamony, H.; Khalil, K.A.; Ahmed, I.A.; Heikal, M. Preparation of b-dicalcium silicate (b-C2S) and calcium sulfoaluminate C3A3CS phases using non-traditional nano-materials. Constr. Build. Mater. 2012, 35, 77–83. [Google Scholar] [CrossRef]
- Mathew, L.; Narayanankutty, S.K. Synthesis and characterization of nanosilica. In Proceedings of the International Conference on Advances in Polymer Technology, Kochi, India, 26–27 February 2010. [Google Scholar]
- Abd El-Raoof, F. Assessment of Developed Refractory Composites for Slide Gates of Continuous Steel Casting Systems. Ph.D. Thesis, Zagazig University, Zagazig, Egypt, 2008. [Google Scholar]
- ASTM. ASTM Designation C-191. Standard Test Method for Normal Consistency and Setting Of Hydraulic Cement; ASTM: West Conshohocken, PA, USA, 2008. [Google Scholar]
- El-Didamony, H. Application of differental thermogravimetry to the hydration of expnsive cement pastes. Thermochim. Acta 1980, 35, 201–209. [Google Scholar] [CrossRef]
- Ettarh, C.; Galwey, A. Kinetic and mechanistic study of the thermal decomposition of calcium nitrate. Thermochim. Acta 1996, 19, 203–219. [Google Scholar] [CrossRef]
- Kurdowski, W.; Duszak, S.; Trybalska, B. B-C2S produced by means of low temperature synthesis. Cem. Concr. Res. 1997, 27, 51–62. [Google Scholar] [CrossRef]
- Ramanathan, S.; Halee, B.; Suraneni, P. Effect of calcium sulfoaluminate cement prehydration on hydration and strength gain of calcium sulfoaluminate cement-ordinary portland cement mixtures. Cem. Concr. Compos. 2020, 112, 103694. [Google Scholar] [CrossRef]
- Li, W.; Yu, J.; Ma, S.; Hu, Y.; Ge, D.; Shen, X. The properties and hydration of Portland cement containing calcium sulfoaluminate cement. Ceram. Silikáty 2018, 62, 364–373. [Google Scholar] [CrossRef]
- Si-Jun, K.; Keun-Hyeok, Y.; Gyu-Don, M. Hydration Characteristics of Low-Heat Cement Substituted by Fly Ash and Limestone Powder. Mate 2015, 8, 5847–5861. [Google Scholar]
- Ginebra, M.P.; Driessens, F.; Planell, J. Effect of the particle size on the micro and nanostructural features of a calcium phosphate cement: A kinetic analysis. Biomaterials 2004, 25, 3453–3462. [Google Scholar] [CrossRef]
- Yasong, Z.; Jianming, G.; ChuanbeiLiu, X.; Chen, Z. The particle-size effect of waste clay brick powder on its pozzolanic activity and properties of blended cement. J. Clean. Prod. 2020, 242, 118521. [Google Scholar]
- Winnefeld, F.; Lothenbach, B. Hydration of calcium sulfoaluminate cements—Experimental findings and thermodynamic modeling. Cem. Concr. Res. 2010, 40, 1239–1247. [Google Scholar] [CrossRef]
- Antiohos, S.; Papageorgiou, A.; Tsimas, S. Activation of fly ash cementitious systems in the presence of quicklime. Part II: Nature of hydration products, porosity and microstructure development. Cem. Concr. Res. 2006, 36, 2123–2131. [Google Scholar] [CrossRef]
- Alons, S.; Palomo, A. Calorimetric study of alkaline activation of calcium hydroxide-metakaolin solid mixtures. Cem. Concr. Res. 2001, 31, 25–30. [Google Scholar] [CrossRef]
- Palomo, A.; Glasser, F.P. Chemically-bonded cementitious materials based on metakaolin. Br. Ceram. Trans. J. 1992, 91, 107–112. [Google Scholar]
- El-Diadamony, H.; Amer, A.A.; Sokkary, T.M.; El-Hoseny, S. Hydration and characteristics of metakaolin pozzolanic cement pastes. HBRC J. 2018, 14, 150–158. [Google Scholar] [CrossRef] [Green Version]
- El-Gamal, S.; Amin, M.; Ramadan, M. Hydration characteristics and compressive strength of hardened cement pastes containing nano-metakaolin. HBRC J. 2017, 13, 114–121. [Google Scholar] [CrossRef] [Green Version]
- Zhen, G.; Yan, X.; Zhou, H.; Chen, H.; Zhao, T.; Youcai, Z. Effects of calcined aluminum salts on the advanced dewatering and solidification/stabilization of sewage sludge. J. Environ. Sci. 2011, 23, 1225–1232. [Google Scholar] [CrossRef]
- Haruehansapong, S.; Pulngern, T.; Chucheepsakul, S. Effect of the particle size of nanosilica on the compressive strength and the optimum replacement content of cement mortar containing nano-SiO2. Constr. Build. Mater. 2014, 50, 471–477. [Google Scholar] [CrossRef]
- Wu, K.; Shi, H.; Guo, X. Utilization of municipal solid waste incineration fly ash for sulfoaluminate cement clinker production. Waste Manag. 2011, 31, 2001–2008. [Google Scholar] [CrossRef] [PubMed]
- El-Didamony, H.; Radwan, A.; Khattab, I.; El-Alfi, E.A.; Mohammed, M.S. Charcteristics of sulphate resisting cement pastes containing different ratios of β-c2s phase. J. Eng. Technol. Res. 2014, 2, 52–62. [Google Scholar]
Sample Availability: Samples of the compounds and composite all are available from the authors. |


| Component | SiO2 | Al2O3 | Fe2O3 | CaO | MgO | SO3 | Na2O | I.L. |
|---|---|---|---|---|---|---|---|---|
| OPC | 20.35 | 4.70 | 3.63 | 60.82 | 1.64 | 3.60 | 0.42 | 4.01 |
| C4A3S | 2.73 | 34.27 | 1.18 | 47.95 | 0.20 | 11.50 | 0.22 | 1.50 |
| C4AS | 1.10 | 17.24 | 0.66 | 70.52 | 0.33 | 17.55 | 0.31 | 4.07 |
| β-C2S | 30.82 | 0.45 | 0.07 | 65.71 | 0.32 | 0.02 | 0.68 | 1.92 |
| Group No. | Sample | OPC | C4A3S | (C4AS) | β-C2S | Water Consistency, % | Setting Time | |
|---|---|---|---|---|---|---|---|---|
| Initial | Final | |||||||
| I | Mix (OPC) | 100 | 00 | 00 | 00 | 26.6 | 120 | 295 |
| Mix (CSA) | 90 | 10 | 00 | 00 | 27.0 | 45 | 250 | |
| Mix (CSAB) | 80 | 10 | 00 | 10 | 26.5 | 40 | 245 | |
| Mix (BC) | 95 | 00 | 00 | 5 | 25.0 | 95 | 285 | |
| II | Mix (OPC) | 100 | 00 | 00 | 00 | 26.6 | 120 | 295 |
| Mix (CMS) | 90 | 10 | 00 | 00 | 28.5 | 80 | 265 | |
| Mix (CMSB) | 80 | 10 | 10 | 10 | 27.3 | 65 | 255 | |
© 2020 by the authors. Licensee MDPI, Basel, Switzerland. This article is an open access article distributed under the terms and conditions of the Creative Commons Attribution (CC BY) license (http://creativecommons.org/licenses/by/4.0/).
Share and Cite
Ahmed, I.A.; S. Al-Radadi, N. Estimating the Impact of Nanophases on the Production of Green Cement with High Performance Properties. Materials 2020, 13, 4197. https://doi.org/10.3390/ma13184197
Ahmed IA, S. Al-Radadi N. Estimating the Impact of Nanophases on the Production of Green Cement with High Performance Properties. Materials. 2020; 13(18):4197. https://doi.org/10.3390/ma13184197
Chicago/Turabian StyleAhmed, Inas A., and Najlaa S. Al-Radadi. 2020. "Estimating the Impact of Nanophases on the Production of Green Cement with High Performance Properties" Materials 13, no. 18: 4197. https://doi.org/10.3390/ma13184197