Article

CO2 Curing Efficiency for Cement Paste and Mortars Produced by a Low Water-to-Cement Ratio

Department of Civil and Environmental Engineering, Korea Advanced Institute of Science and Technology, Daejeon 34141, Korea
*
Author to whom correspondence should be addressed.
Materials 2020, 13(17), 3883; https://doi.org/10.3390/ma13173883
Submission received: 3 July 2020 / Revised: 27 August 2020 / Accepted: 28 August 2020 / Published: 2 September 2020
(This article belongs to the Special Issue High Performance Concrete)

Abstract

:
Curing by CO2 is a way to utilize CO2 to reduce greenhouse gas emissions. Placing early-age cement paste in a CO2 chamber or pressure vessel accelerates its strength development. Cement carbonation is attributed to the quickened strength development, and CO2 uptake can be quantitatively evaluated by measuring CO2 gas pressure loss in the pressure vessel. A decrease in CO2 gas pressure is observed with all cement pastes and mortar samples regardless of the mix proportion and the casting method; one method involves compacting a low water-to-cement ratio mix, and the other method comprises a normal mix consolidated in a mold. The efficiency of the CO2 curing is superior when a 20% concentration of CO2 gas is supplied at a relative humidity of 75%. CO2 uptake in specimens with the same CO2 curing condition is different for each specimen size. As the specimen scale is larger, the depth of carbonation is smaller. Incorporating colloidal silica enhances the carbonation as well as the hydration of cement, which results in contributing to the increase in the 28-day strength.

1. Introduction

Greenhouse gas emissions in the industrial sector are of serious concern. In the construction industry, a large amount of CO2 is emitted during the production of cement by the calcination process. Various studies have been conducted to reduce the amount of CO2 emitted in the manufacturing process or to utilize emitted or captured CO2 for sustainable development [1,2]. CO2 curing for cement-based materials has been demonstrated as one possible way of utilizing CO2 [3,4,5,6,7].
The carbonation of calcium silicates such as C3S, β-C2S, and γ-C2S in Portland cement generally occurs more quickly than their hydration. Therefore, the CO2 curing of early-age concrete facilitates faster development of its strength [8]. The carbonation of anhydrous alite (C3S) and belite (C2S) is expressed as [9]:
3 C 3 S + ( 3 x ) CO 2 + n H C x SH n + ( 3 x ) CaCO 3
and
2 β - C 2 S + ( 2 x ) CO 2 + n H C x SH n + ( 2 x ) CaCO 3
where CxSHn refers to the calcium silicate hydrates of (CaO)x(SiO2)(H2O)n, simply denoted by C-S-H. The carbonation products are the calcium silicate hydrates and calcium carbonate (CaCO3). In addition, the calcium hydroxide, a product by the calcium silicate hydration, is also carbonated:
Ca ( OH ) 2 + CO 2 CaCO 3 + H 2 O
The calcium carbonate, produced at an early age, precipitates in pores of the cement paste. Consequently, cement-based materials obtain pore refinement, leading to enhanced durability and strength [10].
The degree of carbonation was usually estimated by the mass-curve or mass-gain method [11,12,13]. Equation (4) calculates CO2 uptake by measuring the increase in the mass of intact samples. The increase in the mass corresponds to the mass of reacted CO2. The mass-curve method [11] then evaluates
CO 2   uptake   ( % ) = Mass   of   specimen   subjected   to   CO 2   Initial   mass   of   specimen × 100
The mass-curve method needs caution when monitoring the increase in the mass of samples in a chamber. The water presented in a sample partially vaporizes due to the heat production from the carbonation, and excess water vapor condenses on the chamber wall. The mass-gain method compensates the water amount lost by vaporization to reduce experimental error [12,13,14]. Equation (5) then expresses a calculation of CO2 uptake:
CO 2   uptake   ( % ) = ( The   mass   increase   of   a   cast   sample   by   CO 2   curing ) + ( water   loss ) Mass   of   raw   materials   for   a   sample × 100
Another way to consider the CO2 uptake evaluation is by measuring the decrease in CO2 gas pressure in a sealed reactor. The decrease in the CO2 pressure monitored for the whole carbonation process can be converted into the CO2 mole consumed for the carbonation. Such a pressure monitoring method is less prone to error. This paper, therefore, proposes the pressure monitoring method.
The efficiency of CO2 curing is related to water in the pore system of a sample. Water invariably allows for the mixing and subsequent workability of cement-based materials. However, if there is much free water in the sample, water also fills the pore of a sample fully, resulting in hindering CO2 gas from entering the sample interior. CO2 diffusion into a sample is limited if its pores are fully saturated. On the other hand, CO2 in gaseous form does not react, and so its dissolution in liquid water precedes for the carbonation. Sufficient water, that is, more than the reacting amount accounted for in Equations (1) and (2), is required for the CO2 dissolution. Previous studies [15,16] suggested the use of a relatively low water-to-cement ratio (W/C less than 0.25) in CO2 curing, and made samples by compaction molding. The cement compacts produced by the low water-to-cement ratio had a large amount of air-filled pores, which resulted in a higher CO2 diffusion and CO2 uptake.
Controlling the pore system, by the use of nano-sized particles, also affects the efficiency of CO2 curing. The nucleation effect of nano-sized limestone powder on CO2 curing was reported [17,18]. In addition to the nano-sized limestone powder, this study further investigates the effect of incorporating colloidal silica. The nano-sized silica particles reportedly nucleate the hydration of cementitious materials in accompany with their pozzolanic reaction [19]. As a result, it reduces the degree of chloride ion penetration [20,21] even though the increase in compressive strength is not substantial [22]. Lastly, the optimization for CO2 curing conditions, together with the effect of specimen size, is also investigated for the purpose of controlling the pore system.

2. Experimental Details

2.1. Materials

Ordinary Type I Portland cement and ISO standard sand (ISO 679) [23] were used to produce samples in this study. Table 1 shows the chemical composition of the cement determined by X-ray fluorescence spectrometry. The specific density of the sand was 2620 kg/m3. Its grain size ranged from 0.08 to 1.60 mm. The colloidal silica (commercial grade) used in this study mainly contained particles from 10 to 20 nm, and the SiO2 content in the aqueous solution was 40%. The pH of the colloidal silica ranged from 9.5 to 10.5.

2.2. Sample Preparation

Table 2 lists the mix proportions of the samples. A planetary mixer was used for a total of 5 min mixing. The mixes were then fabricated by two methods: (1) Compacting or (2) conventional consolidating-in-mold procedure following ASTM C109 [24]. The compacting method was applied to the samples with a relatively low W/C: Paste (W/C = 0.15) and Mortar (W/C = 0.35), which considered the condition of brick production in practice. Each mix was filled in a confined mold, and then it was compacted by 5 kN compression for 30 min. The dimensions of the paste and mortar compacts were as a 40-mm cube. In contrast, the dimensions for the samples, Paste (W/C = 0.4) and Mortar (W/C = 0.5), produced by the conventional procedure [24], were various as 25-, 40-, and 50-mm cubes so as to analyze the specimen size effect on CO2 curing. The sealed curing for the premature sample in a mold proceeded for 24 h at approximately 25 °C.
An additional two mortar samples incorporating colloidal silica were produced to analyze the effect of colloidal silica. Their mix proportions and fabrication methods were the same as the samples in Table 2, with 4% colloidal silica per cement mass.

2.3. CO2 Curing and Successive Hydration

Table 3 details the schedule of the casting and curing conditions. We considered two conditions for the CO2 curing after demolding. The first CO2 curing condition was at 20% CO2 concentration, where the relative humidity (RH) was 75% ± 5% and the temperature was 25 °C under ambient pressure. Each sample was placed in a controlled chamber, and the 20% concentration CO2 curing continued for 28 days.
The other was 3 bar pressure CO2 curing. The samples in a pressure vessel, vacuum-sealed beforehand, were subjected to 99.9% purified CO2 gas for 3 h. The initial CO2 gas pressure was set above 340 kPa, but not to exceed 380 kPa (approximately 350 kPa). Each sample in Table 2 was subjected to 3 bar CO2 curing for 3 h, and then successive hydration followed: 21 h moisture curing for Paste (W/C = 0.15) and Mortar (W/C = 0.35), and 28 days water curing for Paste (W/C = 0.4) and Mortar (W/C = 0.5). The moisture curing was conducted under 85% ± 5% RH and a temperature of approximately 25 °C. The water curing was conducted at approximately 23 °C.
The control samples were produced by the moisture curing for the Paste (W/C = 0.15) and Mortar (W/C = 0.35). The control samples for Paste (W/C = 0.4) and Mortar (W/C = 0.5) took the water curing. The conditions for the controlled curing were the same as the conditions for the successive hydration after the 3 bar CO2 curing.

2.4. Measurements

Figure 1 shows a pressure vessel designed to have a single inlet valve and a single outlet valve. The internal temperature and pressure were monitored during the 3 bar CO2 curing. Pressure loss caused by cement carbonation was measured using a pressure digital gauge (PDR1000; Pressure Development of Korea Co., Daejeon, Korea). Its measurement range was from −100 kPa to 400 kPa, and its precision was 0.1%. The sampling rate for the pressure measurement was 1 record per second.
The compressive strengths of the samples were measured at the age of 1, 3, 7, 14, and 28 days in accordance with ASTM C109 [24]. The standard test method suggests a loading rate within 0.9 to 1.8 kN/s. In this study, the loading rate for the paste and mortar samples were assigned as 1.0 kN/s and 1.5 kN/s, respectively. The strength measurements took an average of the results of three replicated samples.
Each broken specimen following the strength measurement was used to evaluate the depth of carbonation. The depth of carbonation was determined using 1% phenolphthalein indicator in the broken specimen. The sprayed phenolphthalein solution on the specimen remains colorless when the specimen was carbonated, resulting in pH < 9.

3. Results

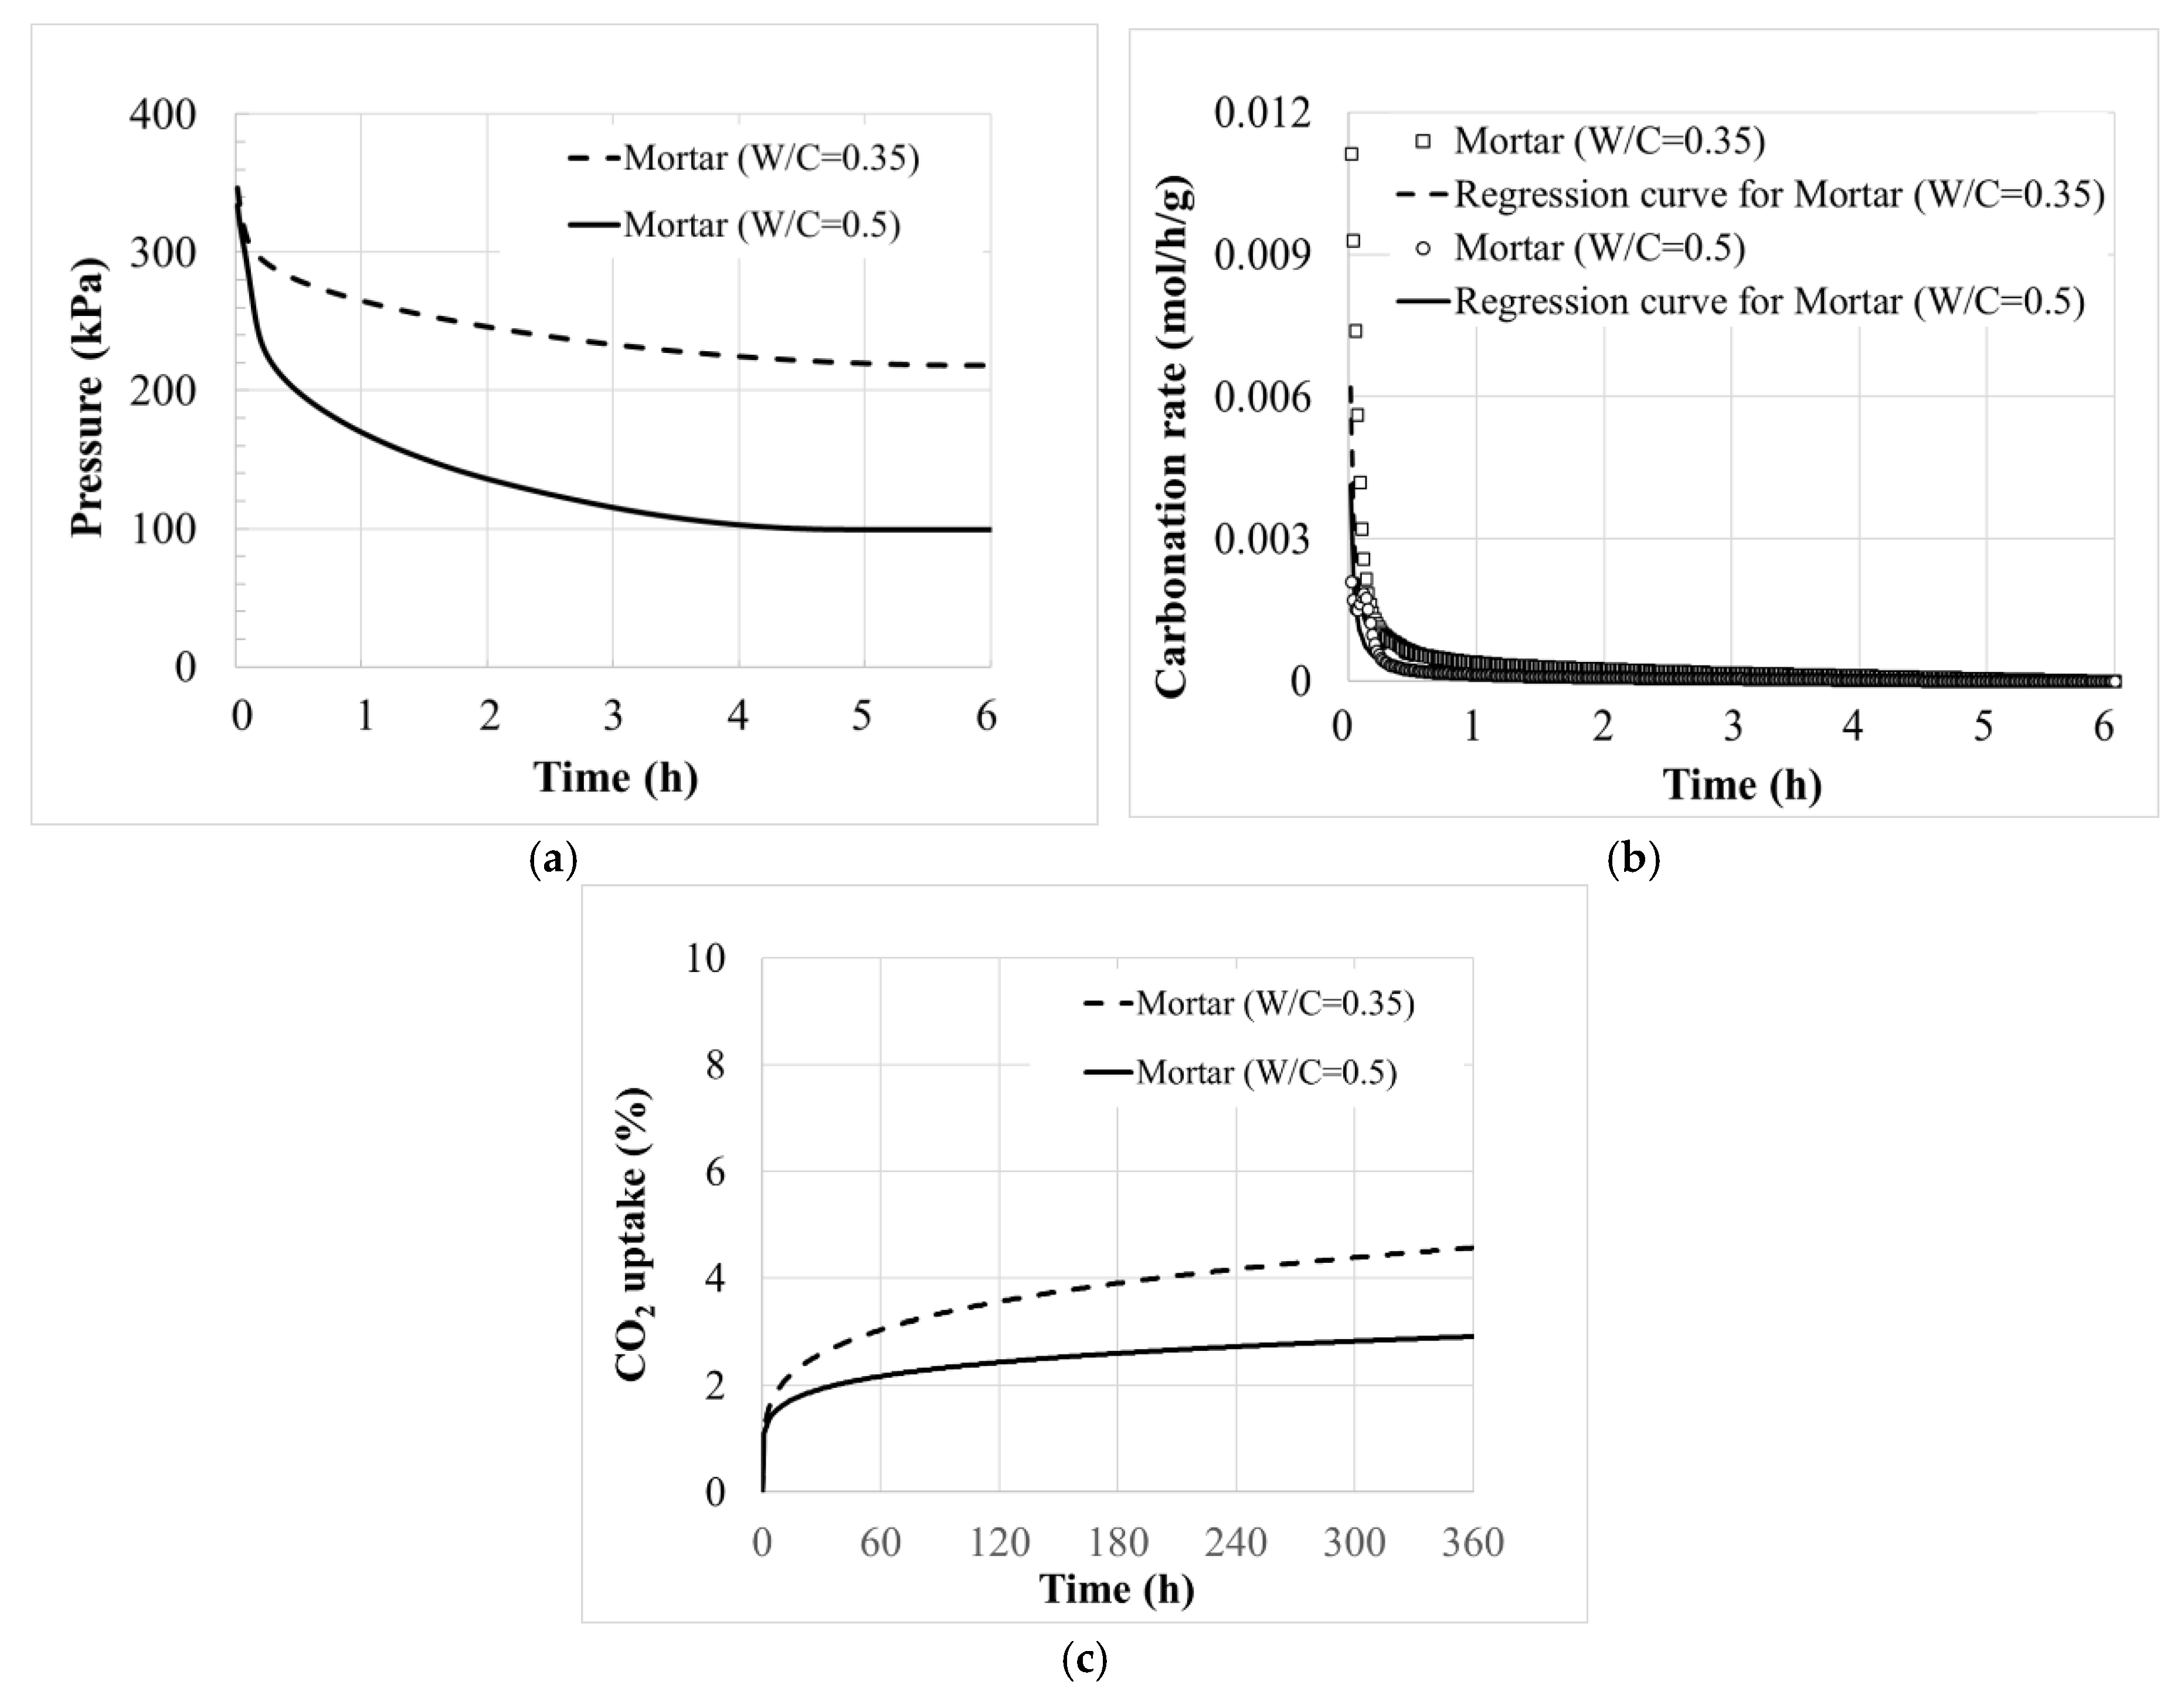
3.1. CO2 Uptake by Pressure Monitoring

Figure 2a shows the pressure loss of each pressure vessel during the 3 bar CO2 curing of Mortar (W/C = 0.35) and Mortar (W/C = 0.5) as an example. The values were calibrated by considering a CO2 leakage of 0.696 kPa/h in the pressure vessel. The CO2 pressure decreased over time, where the initial pressure was approximately 350 kPa as injected. Taking the slope at each point, the carbonation rate in a unit of kPa/h was evaluated as shown in Figure 2a. CO2 in the pressure vessel was also dissolved in the water phase of a sample, but the dissolution in water phase went to equilibrium quickly. The rate of the pressure decrease, disregarding the initial pressure records right after the initiation of the monitoring, therefore directly indicated the CO2 amount being carbonated.
The consumed CO2 was then calculated with the ideal gas equation, PV = nRT, where R is the gas constant of 8.314 J/mol/K. The volume of the pressure vessel was V = 0.004 m3. The temperature slightly changed over time, but it was averaged at T = 24 °C or 301 K. The consumed CO2, n = PV/RT per unit time, represented the carbonation rate in a unit of mol/h. Normalizing the carbonation rate with the cement mass required for producing the samples in the pressure vessel yielded its value per cement mass, as shown in Figure 2b. Integrating the carbonation rate for the time of the CO2 curing gave the CO2 uptake of each sample, where the percentage was calculated with the molecular weight of CO2 (44.01 g/mol) as shown in Figure 2c.
In Figure 2a, it can be seen that Mortar (W/C = 0.5) had a fast loss of pressure. However, as shown in Figure 2c, the actual amount of carbonation should be divided by the cement mass compared to the total mass. The result indicates that the CO2 uptake of the Mortar (W/C = 0.35) is larger than the CO2 uptake of Mortar (W/C = 0.5). As a result, it could be confirmed that the Mortar (W/C = 0.35) compact showed quicker carbonation, and with that, CO2 uptake, compared with the Mortar (W/C = 0.5) sample.
Table 4 compares the CO2 uptake per cement mass, where its value at 3 h is representatively reported. First of all, as expected, the Paste (W/C = 0.15) and Mortar (W/C = 0.35) compacts proportioned by a low W/C ratio had a higher CO2 uptake compared with the Paste (W/C = 0.4) and Mortar (W/C = 0.5) samples. The compacts made of low W/C had a high air-filled porosity, resulting in easy CO2 diffusion inside. Second, there was a size effect on the CO2 uptake of the paste samples. The 40-mm cube specimens showed a higher CO2 uptake than the 25-mm cubes of the replicated samples. Lastly, incorporating colloidal silica increased the CO2 uptake of the mortar samples. This will be discussed later in detail.

3.2. Compressive Strength

Figure 3 compares the 1-day strengths of the 40-mm cube samples. The CO2 curing was influential in the early-age strength development of the paste samples. The strengths of Paste compact (W/C = 0.15) and Paste sample (W/C = 0.4) subjected to CO2 curing were higher than the control sample (moisture curing for 24 h). The 20% CO2 curing for 24 h was much more effective in the Paste samples (W/C = 0.4), while the 3 bar CO2 curing was better in the Paste compacts (W/C = 0.15). The effectiveness of the CO2 curing condition bifurcated with the mortar samples. The 20% CO2 curing resulted in a higher strength regardless of the casting method, whereas the 3 bar CO2 curing failed.
Figure 4 shows the strength development of the 40-mm cube samples of Mortar (W/C = 0.5), where each trend was fitted in a hyperbolic equation. Following the trend of the early-age strength, as illustrated in Figure 3, the 20% CO2 curing provided a higher strength gain than the other curing conditions. Incorporating colloidal silica intensified the effect of the 20% CO2 curing, which resulted in higher 28-day strength. However, the effect of the 3 bar CO2 curing was negligible, as shown in Figure 4, and even negative for Mortar (W/C = 0.5) incorporating colloidal silica.

4. Discussions

4.1. Optimization for CO2 Curing Condition

Both the initial pressure level and the duration in which the samples remained in the pressure vessel affect the efficiency of the CO2 curing. A high pressure of CO2 reportedly accelerates the carbonate reaction at an early age [25,26]. In this study, the initial pressure was therefore controlled for all samples: 3 bar, strictly inbetween 340 to 380 kPa, as stated in the previous section. For the effect of the duration, a preliminary test was conducted to optimize the CO2 curing condition using the pressure vessel. The duration of the CO2 curing then took the period in which the carbonation rate slowed to a crawl. As shown in Figure 2, the 50-mm cube Mortar (W/C = 0.35) and Mortar (W/C = 0.5) samples were cured for more than 6 h. The carbonation rate of Mortar (W/C = 0.35) is 1.71 × 10⁻⁴ mol/h/g at 3 h, and 0.98 × 10⁻⁴ mol/h/g at 6 h. The carbonation rate of Mortar (W/C = 0.5) is 5.40 × 10⁻⁵ mol/h/g at 3 h, and 3.02 × 10⁻⁵ mol/h/g at 6 h. The carbonation rate decreased from 3 h to 6 h was within 5% compared to the carbonation rate decreased during the initial 1 h. The carbonation under the initial pressure of 350 kPa was almost accomplished within 3 h.
The time of demolding is also critical for the effectiveness of CO2 curing on the sample produced by the conventional consolidating-in-mold procedure [27]. The time of sealed curing in a mold affects the air-filled pore system [16]. Cement hydration is expected to consume water and at the same time, also produce solid hydrates in the pores. The former increases the volume of air-filled pores, but the latter adversely decreases the total amount of pores. Another preliminary test was conducted for this case. The Paste (W/C = 0.4) and Mortar (W/C = 0.5) were sealed in 40-mm cube molds for 6, 12, 18, and 21 h, and then they were subjected to 3 bar CO2 curing after their demolding. Table 5 lists their CO2 uptakes. Note that the Mortar (W/C = 0.5) sample was broken when it was demolded at 6 h. Paste (W/C = 0.4) and Mortar (W/C = 0.5) had the highest CO2 uptake with the demolding time of 12 h and 18 h, respectively. After that, the CO2 uptake monotonically decreased with the demolding time. The air-filled pores were expected to decrease stably with the cement hydration. The time of 21 h for the demolding was therefore taken for the period when the air-filled pores showed stable change.

4.2. Effect of Specimen Size

The size effect on the strength of cement-based materials is inherent, and CO2 curing affects the size effect of sample because of inconsistent CO2 diffusion. Figure 5 shows the carbonation depth of Mortar (W/C = 0.5) subjected to 20% CO2 curing for 28 days, where the area of carbonation can be clearly compared. The 25-mm cube specimen was fully carbonated, but its 40-mm and 50-mm cubes were not fully carbonated, displaying a crimson color inside (pH > 9).
The size effect law [28,29] helps us to understand the measurement of the compressive strengths of concrete. A large concrete cylinder provides a lower strength than that of a small cylinder which is geometrically similar to the large one. The tendency could be fitted with a size-effect equation [30]. Applying it to the current measurement generates an equation predicting the strength of a D-sized cube, fcu(D), based on that of a 25-mm cube:
f c u ( D ) = f c u ( 25 ) [ 1 + ( D λ 0 d a ) ] 1 / 2 B + α f c u ( 25 )
where α, B, λ0, and da can be considered empirical constants. Each parameter, notably λ0 and da, has a physical meaning; however, here it is important that the parameters are constant. The variation of each strength is then explained by a linear relation of:
f c u ( D ) f c u ( 25 ) = 1 [ 1 + ( D λ 0 d a ) ] 1 / 2 B + α
Using Equation (7) allows us to consider the strength development of each sample. For example, Δfcu (25) is calculated by the difference in the 25-mm cube strength at a certain age compared with 28 days (the reference age). Figure 6 comparatively shows the strength variation (development) of Mortar (W/C = 0.5). The linear trend lines, whose slopes correspond with the constant in Equation (6), do not change according to CO2 curing when the 25- and 40-mm cube strengths are compared: Δfcu(25) and Δfcu(40) in the left figure. However, the linear trend lines of the samples subjected to the 20% CO2 curing go off on the trend with the 50-mm cube strength (Δfcu(25) and Δfcu(50) in the right figure). The resultant nonlinear trend indicates that the size-effect parameters in Equation (6) need corrections or its reformulation. Partial carbonation on the edge of the 50-mm cube specimen, as shown in Figure 5, breaks the assumption of a geometrically similar specimen, which results in the nonlinear trend. In order to fit into the size effect law, the degree of carbonation in specimens with different size should be similar under the same CO2 curing condition. However, in this study, as the specimen size is larger, the depth of carbonation is smaller. This result may show that the size effect law of the specimen in CO2 curing does not fit.

4.3. Effect of Colloidal Silica on CO2 Curing

Colloidal silica reportedly contributes to a low diffusivity in a hardened cement paste and a low degree of carbonation because it has the filling/nucleating effect [20,31]. However, the CO2 curing produced an opposite effect. Incorporating the colloidal silica in the mortar samples subjected to the 3 bar CO2 curing increased the CO2 uptake approximately 56% for Mortar (W/C = 0.35) and 19% for Mortar (W/C = 0.5), as documented in Table 4. Incorporating non-reactive nanoparticles reportedly result in a slight increase in the rate of cement hydration because they provide supplementary nucleation sites [32,33,34]. Colloidal silica provides nucleation sites for the carbonation as well as the hydration of cement. Colloidal silica is more effective in the high-rate carbonation during which cement hydration is dormant. As a result, carbonation by 3 bar CO2 curing (at the age of 3 h) is accelerated.
Conversely, as shown in Figure 4, the strength of the mortar incorporating colloidal silica was not enhanced, but even weakened by the 3 bar CO2 curing. The carbonation products, mostly calcite, are not helpful for improving strength. Calcites are crystallized, and they do not provide a binding force among aggregates. Their inclusion in a paste matrix even cuts a binding link of the main hydrates (C–S–H). The strength of the mortar is consequently less developed.
When the samples incorporating colloidal silica were continuously subjected to 20% CO2 curing, their strengths increased up to 15% at 28 days. Colloidal silica certainly accelerates carbonation with 20% CO2 curing. Here, as opposed to the short-period 3 bar CO2 curing, carbonation continues concurrently with cement hydration in 20% CO2 curing. Calcite crystals produced by the carbonation put C–S–H on themselves at nano-scale, and the C–S–H layer is consequently reinforced by the distributed calcite [35,36,37]. The continuous 20% CO2 curing consequently improves the strength of the mortar sample.

5. Conclusions

Curing by CO2 can accelerate and improve the strength of cement-based materials via cement carbonation. In this study, 3 bar CO2 curing was applied to premature cement paste and mortar for 3 h, and then successive conventional curing followed for cement hydration. As a result, the strength of a paste compact (W/C = 0.15) increased a lot, providing a high CO2 uptake. That of a Paste (W/C = 0.4) consolidated in a mold also displayed a meaningful increase. However, despite cement carbonation, 3 bar CO2 curing resulted in an adverse effect in terms of the strength of a mortar compact (W/C = 0.35), while that of a mortar (W/C = 0.5) consolidated in a mold was unchanged. In contrast, continuous 20% CO2 curing increased the strengths of all the cement paste and mortar samples. Partial carbonation inside a specimen affects the size effect on the strength of the cement mortar. Incorporating colloidal silica provides more nucleation sites for cement carbonation, with the result that the effect of 20% CO2 curing is slightly improved.

Author Contributions

Conceptualization, S.H.H.; Methodology, J.H.K; Validation, J.H.K.; Formal Analysis, S.H.H.; Investigation, S.H.H. and T.Y.S.; Data Curation, Y.J.; Writing—Original Draft Preparation, S.H.H; Writing—Review & Editing, Y.J. and J.H.K.; Visualization, S.H.H.; Supervision, J.H.K.; Funding Acquisition, J.H.K. All authors have read and agreed to the published version of the manuscript.

Funding

This work was supported by a Korea Institute of Energy Technology Evaluation and Planning (KETEP) grant funded by the Korean government (MOTIE) (No. 20188550000580).

Conflicts of Interest

The authors declare no conflict of interest.

References

  1. Gartner, E.; Hirao, H. A review of alternative approaches to the reduction of CO2 emissions associated with the manufacture of the binder phase in concrete. Cem. Concr. Res. 2015, 78, 126–142. [Google Scholar] [CrossRef] [Green Version]
  2. Huang, C.-H.; Tan, C.-S. A Review: CO2 Utilization. Aerosol Air Qual. Res. 2014, 14, 480–499. [Google Scholar] [CrossRef] [Green Version]
  3. Klemm, W.A.; Berger, R.L. Accelerated curing of cementitious systems by carbon dioxide. Part I. Portland cement. Cem. Concr. Res. 1972, 2, 567–576. [Google Scholar] [CrossRef]
  4. Watanabe, K.; Yokozeki, K.; Ashizawa, R.; Sakata, N.; Morioka, M.; Sakai, E.; Daimon, M. High durability cementitious material with mineral admixtures and carbonation curing. Waste Manag. 2006, 26, 752–757. [Google Scholar] [CrossRef]
  5. Monkman, S.; Shao, Y. Carbonation curing of slag-cement concrete for binding CO2 and improving performance. J. Mater. Civ. Eng. 2010, 22, 296–304. [Google Scholar] [CrossRef]
  6. Rostami, V.; Shao, Y.; Boyd, A.J.; He, Z. Microstructure of cement paste subject to early carbonation curing. Cem. Concr. Res. 2012, 42, 186–193. [Google Scholar] [CrossRef]
  7. El-Hassan, H.; Shao, Y. Early carbonation curing of concrete masonry units with Portland limestone cement. Cem. Concr. Compos. 2015, 62, 168–177. [Google Scholar] [CrossRef]
  8. Young, J.F.; Berger, R.L.; Breese, J. Accelerated Curing of Compacted Calcium Silicate Mortars on Exposure to CO2. J. Am. Ceram. Soc. 1974, 57, 394–397. [Google Scholar] [CrossRef]
  9. Berger, R.L.; Young, J.F.; Leung, K. Acceleration of Hydration of Calcium Silicates by Carbon Dioxide Treatment. Nat. Phys. Sci. 1972, 240, 16–18. [Google Scholar] [CrossRef]
  10. Shaikh, F.U.A.; Supit, S.W.M. Mechanical and durability properties of high volume fly ash (HVFA) concrete containing calcium carbonate (CaCO3) nanoparticles. Constr. Build. Mater. 2014, 70, 309–321. [Google Scholar] [CrossRef]
  11. Mahoutian, M.; Ghouleh, Z.; Shao, Y. Carbon dioxide activated ladle slag binder. Constr. Build. Mater. 2014, 66, 214–221. [Google Scholar] [CrossRef]
  12. Monkman, S.; Shao, Y. Assessing the carbonation behavior of cementitious materials. J. Mater. Civ. Eng. 2006, 18, 768–776. [Google Scholar] [CrossRef]
  13. Shi, C.; He, F.; Wu, Y. Effect of pre-conditioning on CO2 curing of lightweight concrete blocks mixtures. Constr. Build. Mater. 2012, 26, 257–267. [Google Scholar] [CrossRef]
  14. Matsushita, F.; Aono, Y.; Shibata, S. Carbonation degree of autoclaved aerated concrete. Cem. Concr. Res. 2000, 30, 1741–1745. [Google Scholar] [CrossRef]
  15. Shi, C.; Wu, Y. Studies on some factors affecting CO2 curing of lightweight concrete products. Resour. Conserv. Recycl. 2008, 52, 1087–1092. [Google Scholar] [CrossRef]
  16. Zhang, D.; Li, V.C.; Ellis, B.R. Optimal Pre-hydration Age for CO2 Sequestration through Portland Cement Carbonation. ACS Sustain. Chem. Eng. 2018, 6, 15976–15981. [Google Scholar] [CrossRef]
  17. Tu, Z.; Guo, M.Z.; Poon, C.S.; Shi, C. Effects of limestone powder on CaCO3 precipitation in CO2 cured cement pastes. Cem. Concr. Compos. 2016, 72, 9–16. [Google Scholar] [CrossRef]
  18. Shao, Y.; Rostami, V.; He, Z.; Boyd, A.A. Accelerated carbonation of portland limestone cement. J. Mater. Civ. Eng. 2014, 26, 117–124. [Google Scholar] [CrossRef]
  19. Aly, M.; Hashmi, M.S.J.; Olabi, A.G.; Messeiry, M.; Abadir, E.F.; Hussain, A.I. Effect of colloidal nano-silica on the mechanical and physical behaviour of waste-glass cement mortar. Mater. Des. 2012, 33, 127–135. [Google Scholar] [CrossRef]
  20. Zhang, M.H.; Li, H. Pore structure and chloride permeability of concrete containing nano-particles for pavement. Constr. Build. Mater. 2011, 25, 608–616. [Google Scholar] [CrossRef]
  21. Givi, A.N.; Rashid, S.A.; Aziz, F.N.A.; Salleh, M.A.M. Investigations on the development of the permeability properties of binary blended concrete with nano-SiO2 particles. J. Compos. Mater. 2011, 45, 1931–1938. [Google Scholar] [CrossRef]
  22. Jo, B.W.; Kim, C.H.; Lim, J.H. Characteristics of cement mortar with nano-SiO 2 particles. ACI Mater. J. 2007, 104, 404–407. [Google Scholar] [CrossRef]
  23. ISO. ISO 679:2009 Cement—Test Methods—Determination of Strength; ISO: Geneva, Switzerland, 2009. [Google Scholar]
  24. ASTM C109. Standard Test Method for Compressive Strength of Hydraulic Cement Mortars (Using 2-in. or [50-mm] Cube Specimens); ASTM International: West Conshohocken, PA, USA, 2013. [Google Scholar] [CrossRef]
  25. Shi, C.; Liu, M.; He, P.; Ou, Z. Factors affecting kinetics of CO2 curing of concrete. J. Sustain. Cem. Mater. 2012, 1, 24–33. [Google Scholar] [CrossRef]
  26. Kashef-Haghighi, S.; Shao, Y.; Ghoshal, S. Mathematical modeling of CO2 uptake by concrete during accelerated carbonation curing. Cem. Concr. Res. 2015, 67, 1–10. [Google Scholar] [CrossRef]
  27. El-Hassan, H.; Shao, Y.; Ghouleh, Z. Effect of initial curing on carbonation of lightweight concrete masonry units. ACI Mater. J. 2013, 110, 441–450. [Google Scholar] [CrossRef]
  28. Bažant, Z.P. Size effect in blunt fracture: Concrete, rock, metal. J. Eng. Mech. 1984, 110, 518–535. [Google Scholar] [CrossRef]
  29. Kim, J.-K. Size effect in concrete specimens with dissimilar initial cracks. Mag. Concr. Res. 1990, 42, 233–238. [Google Scholar] [CrossRef]
  30. Yi, S.-T.; Yang, E.-I.; Choi, J.-C. Effect of specimen sizes, specimen shapes, and placement directions on compressive strength of concrete. Nucl. Eng. Des. 2006, 236, 115–127. [Google Scholar] [CrossRef]
  31. Lim, S.; Mondal, P. Effects of incorporating nanosilica on carbonation of cement paste. J. Mater. Sci. 2015, 50, 3531–3540. [Google Scholar] [CrossRef]
  32. Péra, J.; Husson, S.; Guilhot, B. Influence of finely ground limestone on cement hydration. Cem. Concr. Compos. 1999, 21, 99–105. [Google Scholar] [CrossRef] [Green Version]
  33. Sato, T.; Diallo, F. Seeding effect of nano-CaCO3 on the hydration of tricalcium silicate. Transp. Res. Rec. 2010, 2141, 61–67. [Google Scholar] [CrossRef]
  34. Jayapalan, A.R.; Lee, B.Y.; Fredrich, S.M.; Kurtis, K.E. Influence of additions of anatase TiO2 nanoparticles on early-age properties of cement-based materials. Transp. Res. Rec. 2010, 41–46. [Google Scholar] [CrossRef] [Green Version]
  35. Farahi, E.; Purnell, P.; Short, N.R. Supercritical carbonation of calcareous composites: Influence of curing. Cem. Concr. Compos. 2013, 43, 48–53. [Google Scholar] [CrossRef]
  36. Šavija, B.; Luković, M. Carbonation of cement paste: Understanding, challenges, and opportunities. Constr. Build. Mater. 2016, 117, 285–301. [Google Scholar] [CrossRef] [Green Version]
  37. Farahi, E.; Purnell, P.; Short, N.R. Supercritical carbonation of calcareous composites: Influence of mix design. Cem. Concr. Compos. 2013, 43, 12–19. [Google Scholar] [CrossRef]
Figure 1. Pressure vessel.
Materials 13 03883 g001
Figure 2. Pressure loss and CO2 uptake of Mortar (W/C = 0.35) and Mortar (W/C = 0.5). (a) Decrease of CO2 pressure, (b) Carbonation rate, (c) CO2 uptake.
Materials 13 03883 g002
Figure 3. Strength of 1-day samples fabricated by (a) compacting and (b) consolidating-in-mold method.
Materials 13 03883 g003
Figure 4. Strength development of Mortar (W/C = 0.5).
Materials 13 03883 g004
Figure 5. Carbonation depth of Mortar (W/C = 0.5) cured in 20% concentration CO2 for 28 days.
Materials 13 03883 g005
Figure 6. Comparison of the size effect on the strength development of mortar (W/C = 0.5).
Materials 13 03883 g006
Table 1. Chemical composition of ordinary Portland cement (wt.%).
CaOSiO2Al2O3Fe2O3SO3MgONa2OK2O
67.2917.184.134.173.161.940.221.23
Table 2. Mix proportion of samples.
LabelFabrication MethodMix Proportion (g)
WaterCementSandColloidal Silica
Paste (W/C = 0.15)Compacting 15010000
Mortar (W/C = 0.35)157.54501350
Mortar (W/C = 0.35) with colloidal silica157.5450135018
Paste (W/C = 0.4)Consolidating-in-mold 40010000
Mortar (W/C = 0.5)2254501350
Mortar (W/C = 0.5) with colloidal silica225450135018
Each stiff sample in a confined mold was compressed by 5 kN (within 30 min). The mortar flow of each sample was within 150 to 250 mm.
Table 3. Curing condition and sequence for samples.
LabelFabrication Time Initial Curing for 24 hCuring Until 28 Days
3 h21 h
Paste (W/C = 0.15)
Mortar (W/C = 0.35)
0.5 hMoisture curing (Control)
3 bar CO2 curingMoisture curing
20% concentration CO2 curing
Paste (W/C = 0.4) Mortar
(W/C = 0.5)
24 hWater curing (Control)
3 bar CO2 curingWater curing
20% concentration CO2 curing
Table 4. Results of CO2 uptake.
SampleCO2 Uptake at 3 h (%)
40-mm Cube25-mm Cube
Paste compact (W/C = 0.15)17.5415.80
Paste sample (W/C = 0.4)1.430.80
Mortar compact (W/C = 0.35)9.51
Mortar sample (W/C = 0.5)2.60
Mortar compact (W/C = 0.35) with colloidal silica14.85
Mortar sample (W/C = 0.5) with colloidal silica3.11
Table 5. CO2 uptake depending on sealed time.
SampleDemolding Time (h)CO2 Uptake (%)
Paste (W/C = 0.4)60.76
121.31
180.89
210.74
Mortar (W/C = 0.5)6
123.06
183.77
212.74

