Modeling SAOS Yield Stress of Cement Suspensions: Microstructure-Based Computational Approach

 ,
,  , and
, and
Abstract
:1. Introduction
2. Theoretical Framework
2.1. Non-Destructive Rheological Investigation
2.2. Mathematical Models for Yield Stress Description
2.2.1. Kapur’s Model
2.2.2. YODEL Model
2.2.3. Yield Stress Model Based on Inter-Particle Bond Breaking Probability (BreakPro)
2.2.4. Numerical Implementation
3. Materials and Methods
Mix Design and Sample Preparation
4. Results and Discussion
4.1. SAOS Measurements
4.2. Modeling Approach
5. Conclusions
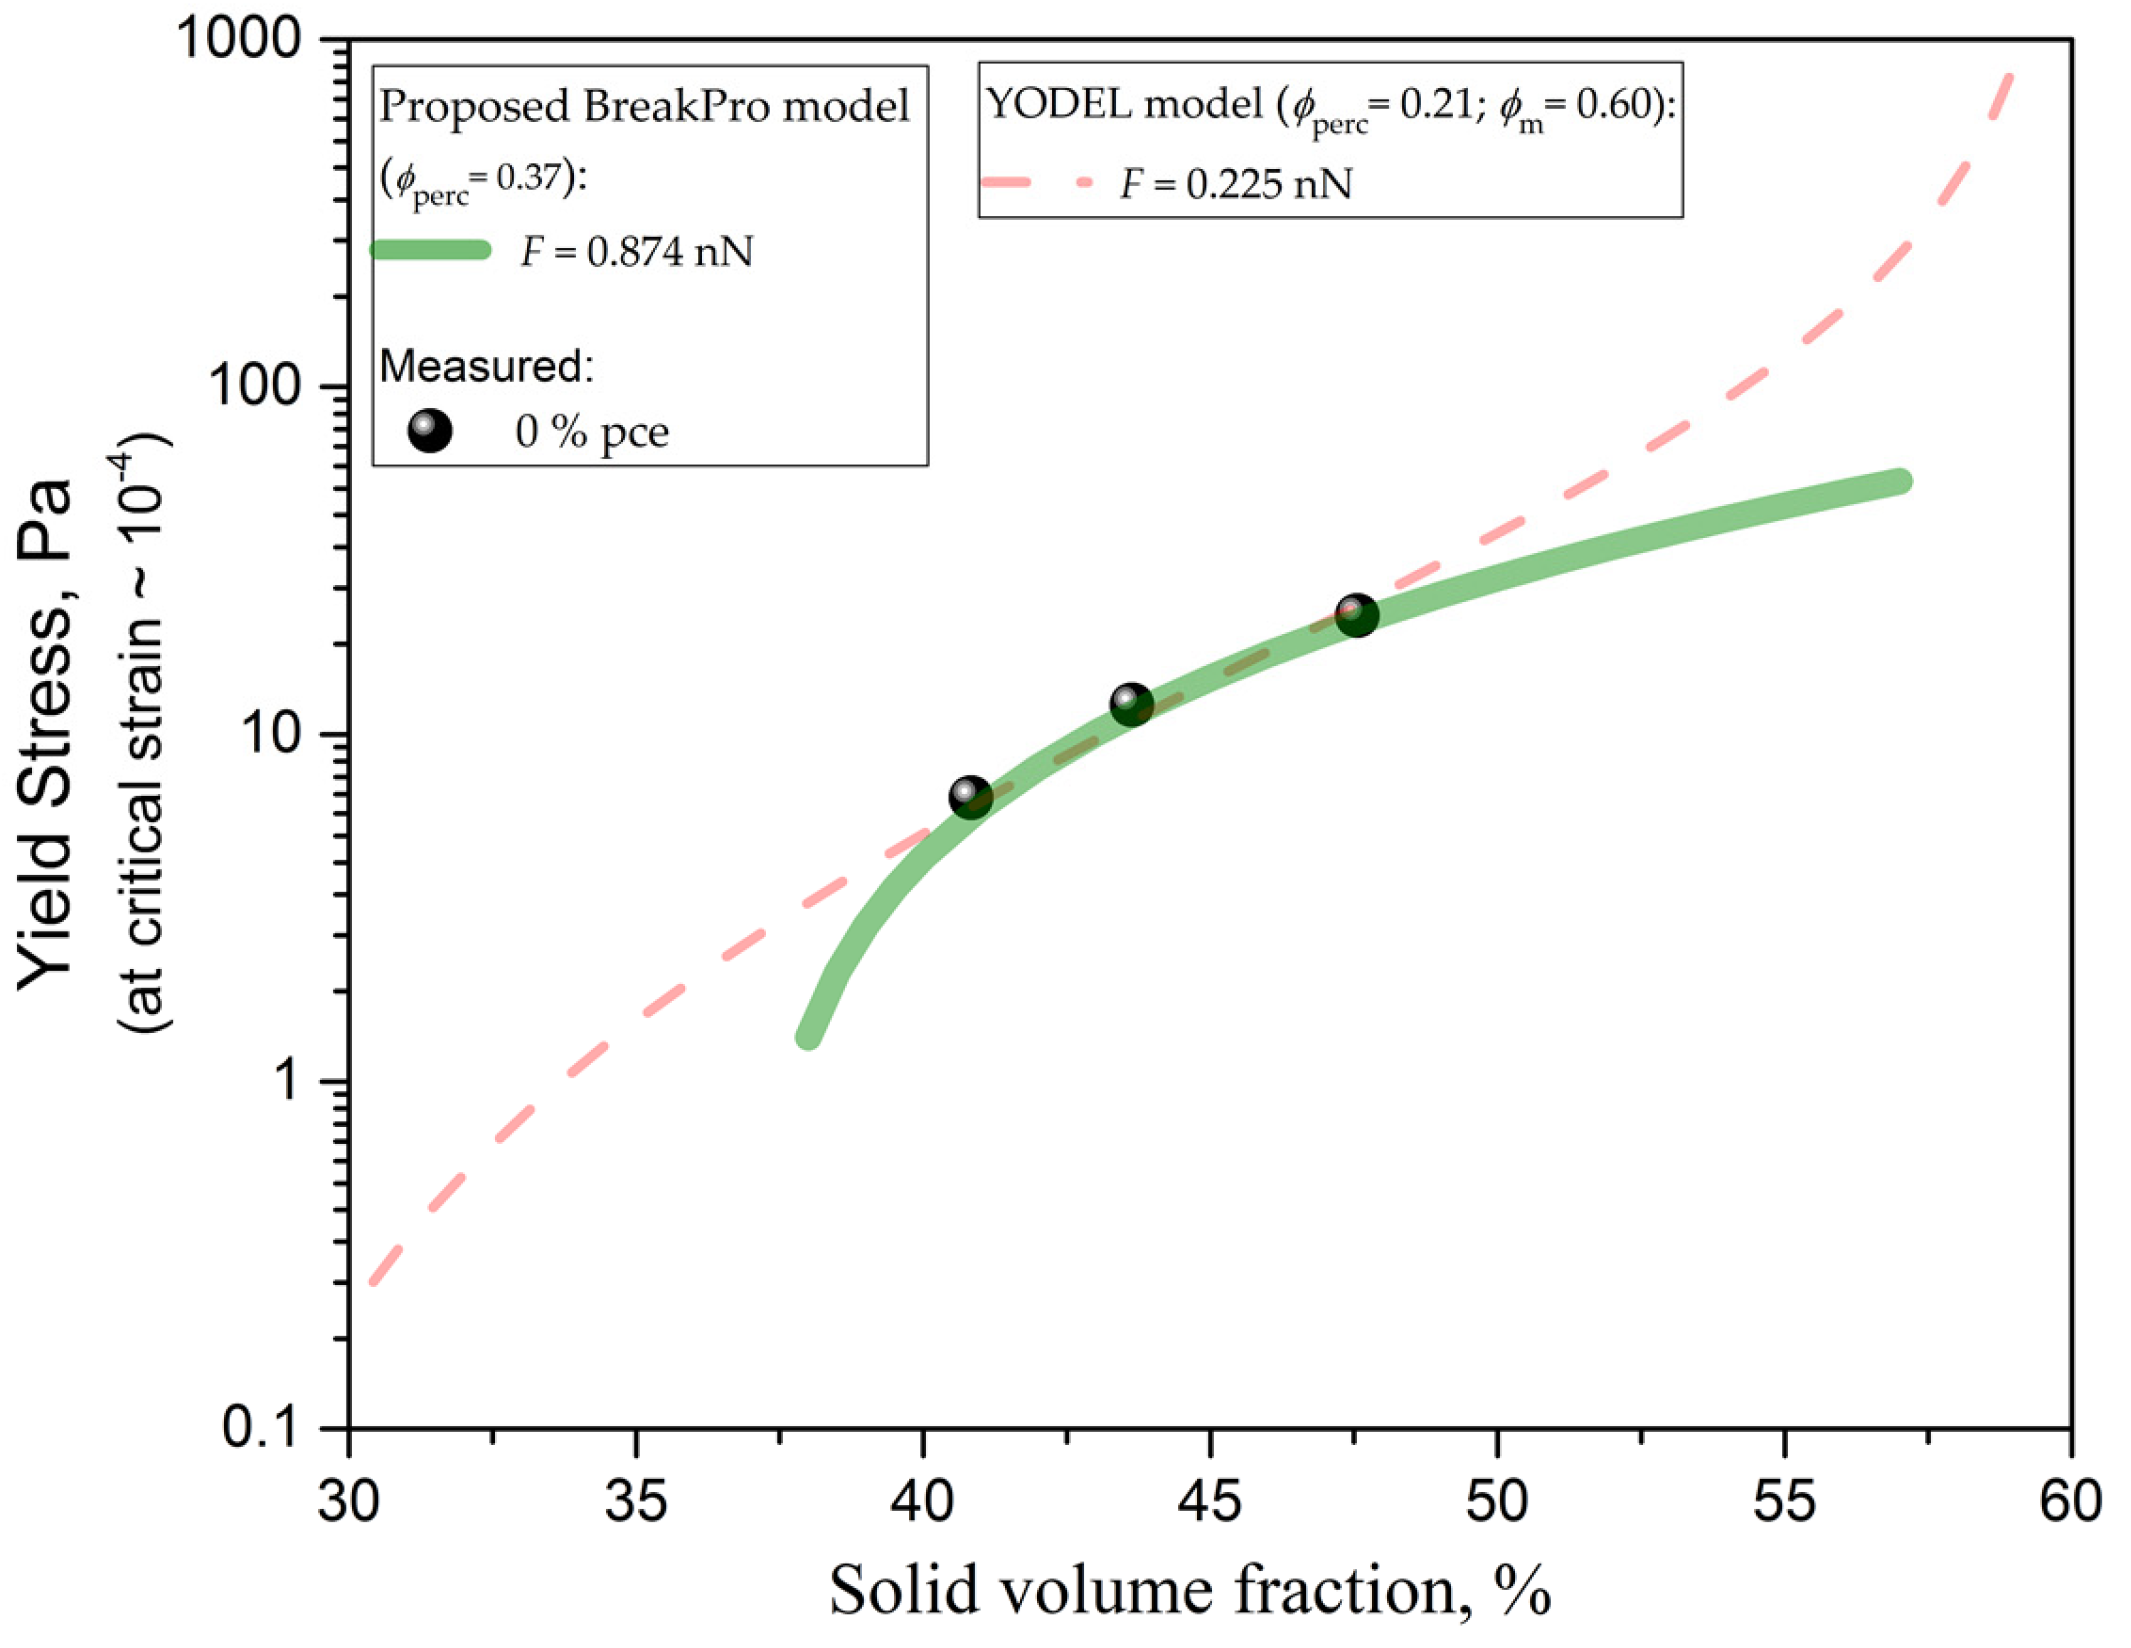
- The calibration of the BreakPro model to the experimental values resulted in an estimated percolation threshold of 37%, in agreement with previous results from the literature [11], while YODEL resulted in a significantly lower calibrated value of 21%. This was attributed to the differing mechanisms between the rotational and oscillatory rheometry, explained namely by shorter range (ion correlation, C-S-H bridging forces) versus longer range (e.g., van der Waals) displacements. This demonstrates that the BreakPro modeling assumptions are better suited for the description of yield stress at SAOS critical strain than the YODEL model.
- The forces estimated using inverse BreakPro and YODEL modeling approaches were found to be 5.57 and 1.43 times higher, respectively, than typical van der Waals forces (Equation (4)).
- Comparing the BreakPro force estimates with the literature values for C-S-H cohesion forces, obtained by AFM, resulted in an average inter-particle intersection surface area of 55.9 nm2. This implies that either a very small amount of C-S-H particles is needed to induce such strong attractive forces between cement particles (after 4 min of hydration), or that ion correlation forces do not require C-S-H, but could also form directly between the (hydrated) surfaces of cement particles.
- As the obtained experimental results are specific to the applied mixing energy and hydration time, in future research, the effect of mixing energy and hydration time on the estimated model parameters should be investigated.
Author Contributions
Funding
Acknowledgments
Conflicts of Interest
References
- Choi, M.; Park, K.; Oh, T. Viscoelastic properties of Fresh Cement Paste to Study the Flow Behavior. Int. J. Concr. Struct. Mater. 2016, 10, 65–74. [Google Scholar] [CrossRef] [Green Version]
- Genovese, D.B. Shear rheology of hard-sphere, dispersed, and aggregated suspensions, and filler-matrix composites. Adv. Colloid Interface Sci. 2012, 171–172, 1–16. [Google Scholar] [CrossRef] [PubMed]
- Firth, B.A.; Hunter, R.J. Flow Properties of Coagulated Colloidal Suspensions: Energy Dissipation in the Flow Units. J. Colloid Interface Sci. 1976, 57, 248–256. [Google Scholar] [CrossRef]
- Kovler, K.; Roussel, N. Properties of fresh and hardened concrete. Cem. Concr. Res. 2011, 41, 775–792. [Google Scholar] [CrossRef]
- Roussel, N. Rheology of fresh concrete: From measurements to predictions of casting processes. Mater. Struct. 2007, 40, 1001–1012. [Google Scholar] [CrossRef]
- Barnes, H.A. The yield stress—A review or ‘panta roi’-everything flows? J. Non-Newton. Fluid Mech. 1999, 81, 133–178. [Google Scholar] [CrossRef]
- Chan Man Fong, C.F.; de Kee, D. Yield Stress and Small Amplitude Oscillatory Flow in Transient Networks. Ind. Eng. Chem. Res. 1994, 33, 2374–2376. [Google Scholar] [CrossRef]
- Mantellato, S.; Flatt, R.J. Shifting factor—A new paradigm for studying the rheology of cementitious suspensions. J. Am. Ceram. Soc. 2020, 103, 3562–3574. [Google Scholar] [CrossRef]
- Roussel, N.; Bessaies-Bey, H.; Kawashima, S.; Marchon, D.; Vasilic, K.; Wolfs, R. Recent advances on yield stress and elasticity of fresh cement-based materials. Cem. Concr. Res. 2019, 124, 105798. [Google Scholar] [CrossRef]
- Roussel, N.; Ovarlez, G.; Garrault, S.; Brumaud, C. The origins of thixotropy of fresh cement pastes. Cem. Concr. Res. 2012, 42, 148–157. [Google Scholar] [CrossRef]
- Mostafa, A.M.; Yahia, A. Physico-chemical kinetics of structural build-up of neat cement-based suspensions. Cem. Concr. Res. 2017, 97, 11–27. [Google Scholar] [CrossRef]
- Jönsson, B.; Nonat, A.; Labbez, V.; Cabane, B.; Wennerström, H. Controlling the cohesion of cement paste. Langmuir 2005, 21, 9211–9221. [Google Scholar] [CrossRef] [PubMed]
- Labbez, C.; Jönsson, B.; Pochard, I.; Nonat, A.; Cabane, B. Surface charge density and Electrokinetic potential of highly charged minerals: Experiments and Monte Carlo simulations on calcium silicate hydrate. J. Phys. Chem. B 2006, 110, 9219–9230. [Google Scholar] [CrossRef] [PubMed]
- Flatt, R.J.; Bowen, P. Yodel: A yield stress model for suspensions. J. Am. Ceram. Soc. 2006, 89, 1244–1256. [Google Scholar] [CrossRef]
- Kapur, P.C.; Scales, P.J.; Boger, D.V.; Healy, T.W. Yield Stress of Suspensions Loaded with Size Distributed Particles. AICHE J. 1997, 43, 1171–1179. [Google Scholar] [CrossRef]
- Ma, S.; Qian, Y.; Kawashima, S. Experimental and modeling study on the non-linear structural build-up of fresh cement pastes incorporating viscosity modifying admixtures. Cem. Concr. Res. 2018, 108, 1–9. [Google Scholar] [CrossRef]
- Yuan, Q.; Lu, X.; Khayat, K.H.; Feys, D.; Shi, C. Small amplitude oscillatory shear technique to evaluate structural build-up of cement paste. Mater. Struct. 2017, 50, 112. [Google Scholar] [CrossRef]
- Perrot, A.; Lecompte, T.; Khelifi, H.; Brumaud, C.; Hot, J.; Roussel, N. Yield stress and bleeding of fresh cement pastes. Cem. Concr. Res. 2012, 42, 937–944. [Google Scholar] [CrossRef]
- Lecompte, T.; Perrot, A. Non-linear modeling of yield stress increase due to SCC structural build-up at rest. Cem. Concr. Res. 2017, 92, 92–97. [Google Scholar] [CrossRef]
- Hot, J.; Bessaies-Bey, H.; Brumaud, C.; Duc, M.; Castella, C.; Roussel, N. Adsorbing polymers and viscosity of cement pastes. Cem. Concr. Res. 2014, 63, 12–19. [Google Scholar] [CrossRef]
- Rumpf, H. The strength of granulates and agglomerates. In Agglomeration; Knepper, W.A., Ed.; Interscience: New York, NY, USA, 1962; pp. 379–418. [Google Scholar]
- Zhou, Z.; Solomon, M.J.; Scales, P.J.; Boger, D.V. The Yield Stress of Concentrated Flocculated Suspensions of Size Distributed Particles. J. Rheol. 1999, 43, 651–671. [Google Scholar] [CrossRef]
- Suzuki, M.; Oshima, T. Estimation of the Coordination Number in a Multi-Component Mixture of Spheres. Powder Technol. 1983, 35, 159–166. [Google Scholar] [CrossRef]
- Lu, Z.; Haist, M.; Ivanov, D.; Jakob, C.; Jansen, D.; Leinitz, S.; Link, J.; Mechtcherine, V.; Neubauer, J.; Plank, J.; et al. Characterization data of reference cement CEM I 42.5 R used for Priority Program DFG SPP 2005 “Opus Fluidum Futurum—Rheology of reactive, multiscale, multiphase construction materials”. Data Brief 2019, 27, 104699. [Google Scholar] [CrossRef] [PubMed]
- Nachbaur, L.; Mutin, J.C.; Nonat, A.; Choplin, L. Dynamic mode rheology of cement and tricalcium silicate pastes from mixing to setting. Cem. Concr. Res. 2001, 31, 183–192. [Google Scholar] [CrossRef]
- Shih, W.-H.; Shih, W.Y.; Kim, S.-I.; Liu, J.; Aksay, I.A. Scaling behavior of the elastic properties of colloidal gels. Phys. Rev. A Mol. Opt. Phys. 1990, 42, 4772–4780. [Google Scholar] [CrossRef]
- Jakob, C.; Jansen, D.; Ukrainczyk, N.; Koenders, E.; Pott, U.; Stephan, S.; Neubauer, J. Relating Ettringite Formation and Rheological Changes during the Initial Cement Hydration: A Comparative Study Applying XRD Analysis, Rheological Measurements and Modeling. Materials 2019, 12, 2957. [Google Scholar] [CrossRef] [Green Version]
- Kjellander, R.; Marcelja, S.; Pashley, R.M.; Quirk, J.P. A theoretical and experimental study of forces between charged mica surfaces in aqueous CaCl2 solutions. J. Chem. Phys. 1990, 92, 4399–4407. [Google Scholar] [CrossRef]
- Jönsson, B.; Wennerström, H.; Nonat, A.; Cabane, B. Onset of Cohesion in Cement Paste. Langmuir 2004, 20, 6702–6709. [Google Scholar] [CrossRef] [Green Version]
- Plassard, C.; Lesniewska, E.; Pochard, I.; Nonat, A. Nanoscale Experimental Investigation of Particle Interactions at the Origin of the Cohesion of Cement. Langmuir 2005, 21, 7263–7270. [Google Scholar] [CrossRef]
- Bonn, D.; Levich, B.; Berthier, L.; Divoux, T.; Manneville, S. Yield stress materials in soft condensed matter. Rev. Mod. Phys. 2017, 89, 035005. [Google Scholar] [CrossRef] [Green Version]
- Yogesh, M. Harshe and Marco Lattuada, Universal Breakup of Colloidal Clusters in Simple Shear Flow. J. Phys. Chem. B 2016, 120, 7244–7252. [Google Scholar]


| Mixture | w/c Ratio | Solid Volume Fraction Φ | Cement (kg/m3) | Water (kg/m3) |
|---|---|---|---|---|
| 0.41 | 0.46 | 0.41 | 1275.1 | 590.0 |
| 0.44 | 0.41 | 0.44 | 1368.4 | 560.0 |
| 0.48 | 0.35 | 0.48 | 1492.8 | 520.0 |
| Mixture | G′ (Pa) | G″(Pa) | ||
|---|---|---|---|---|
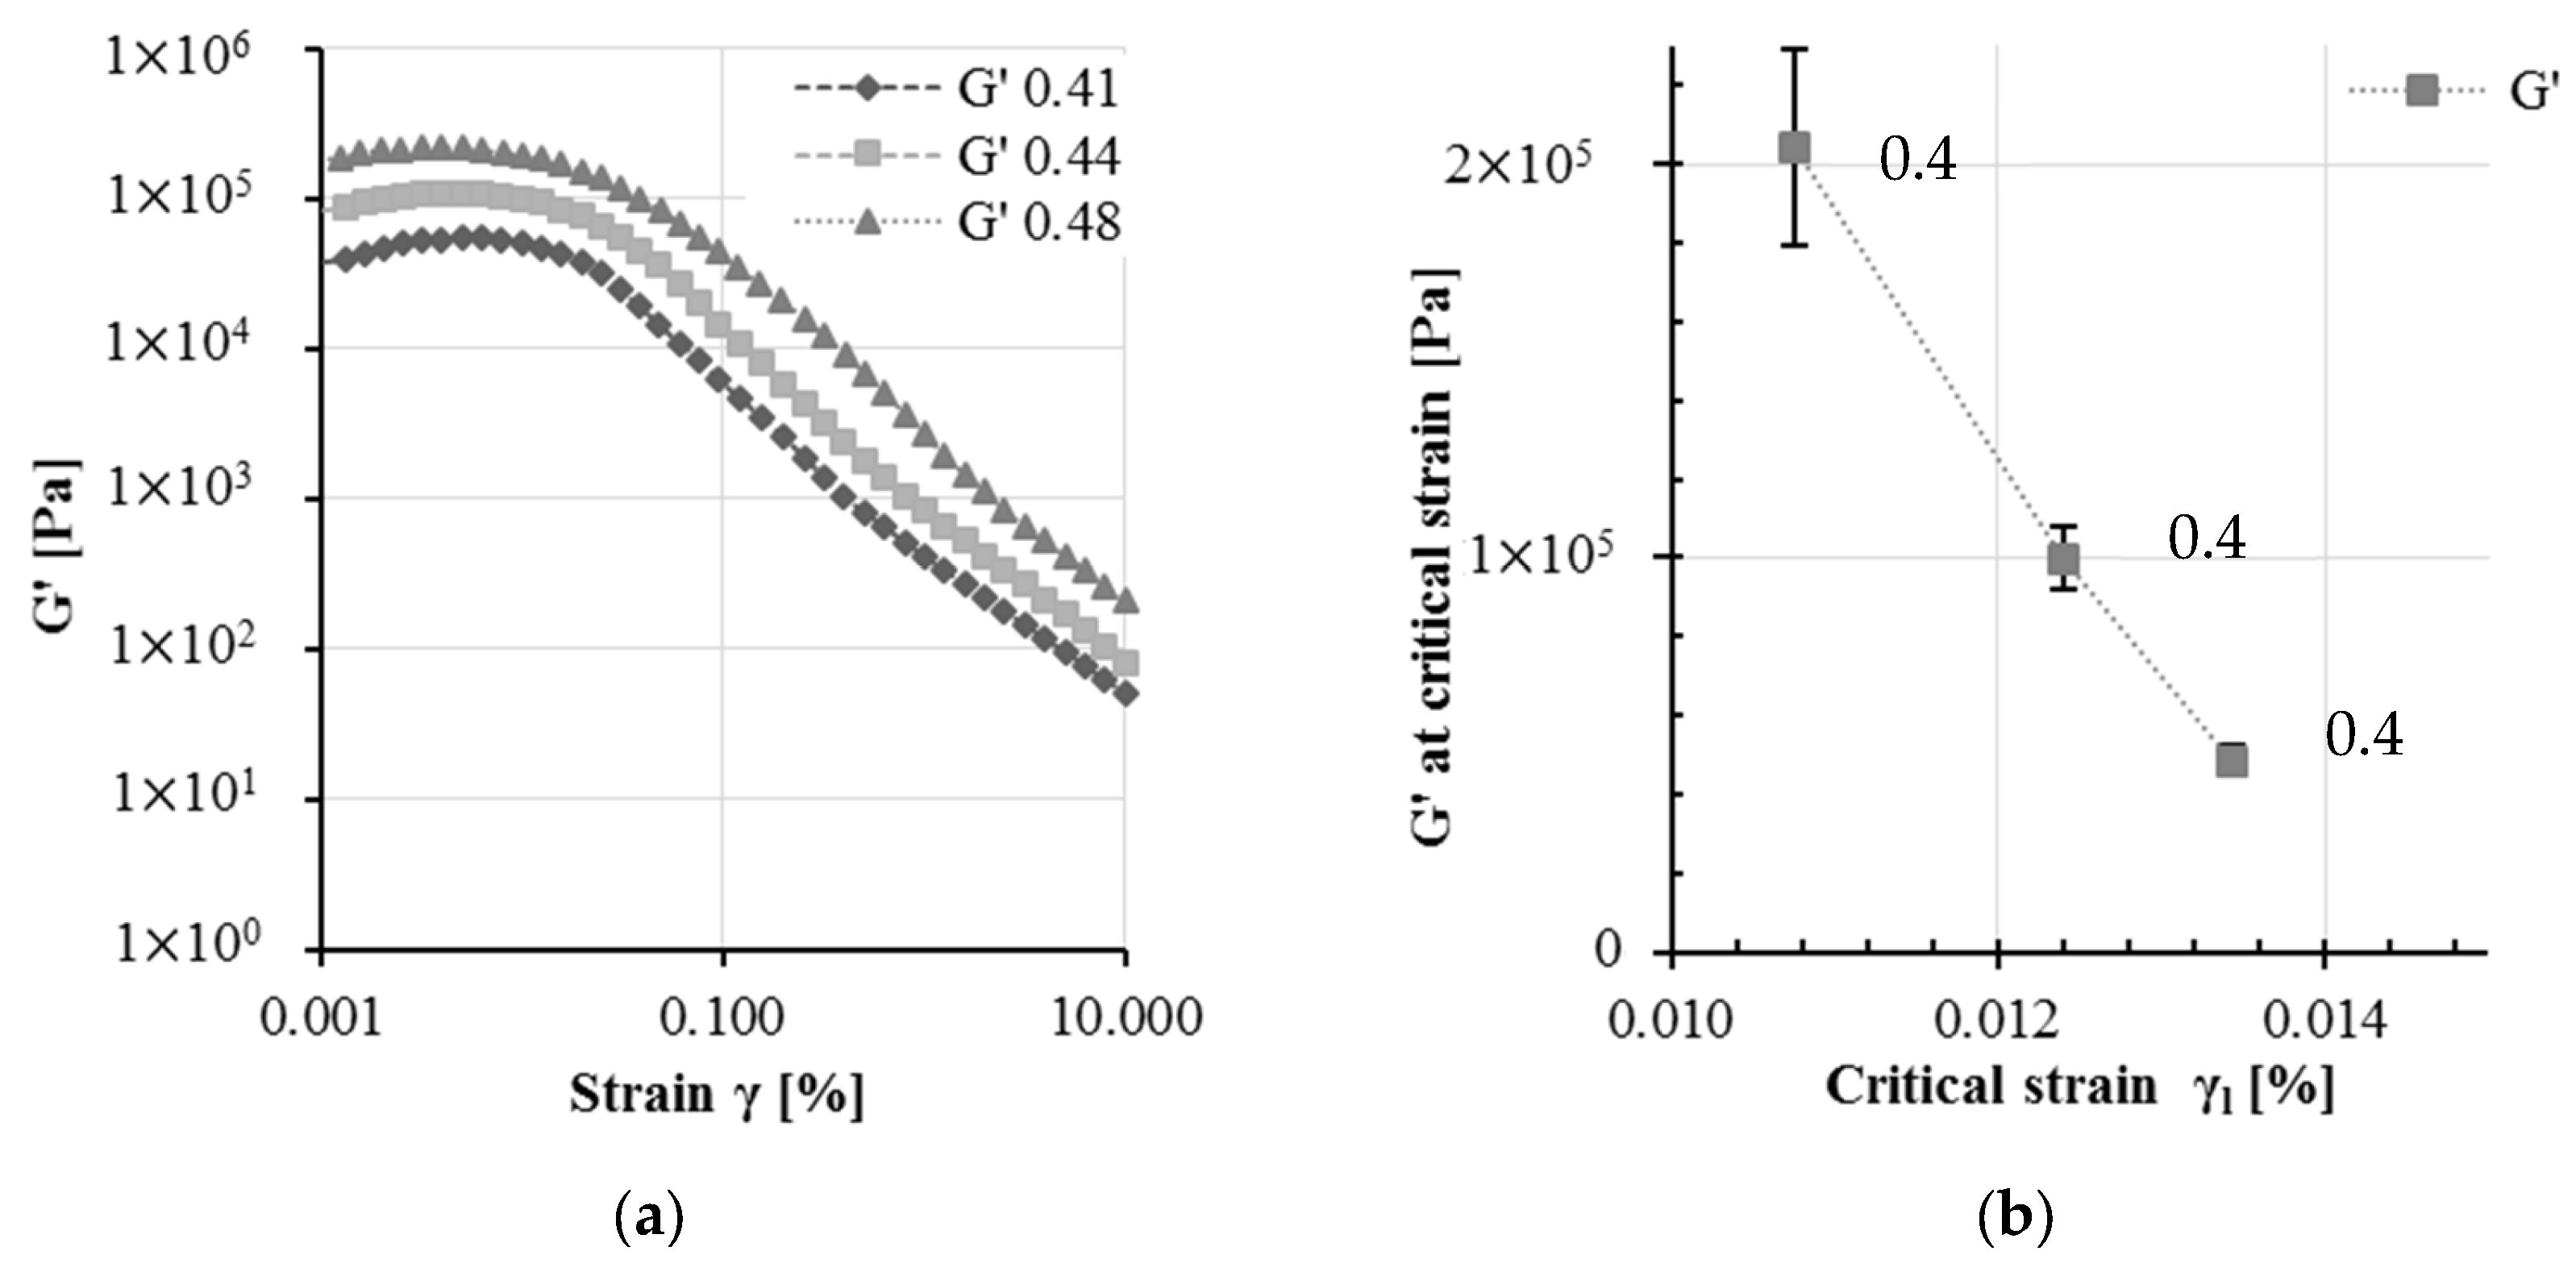
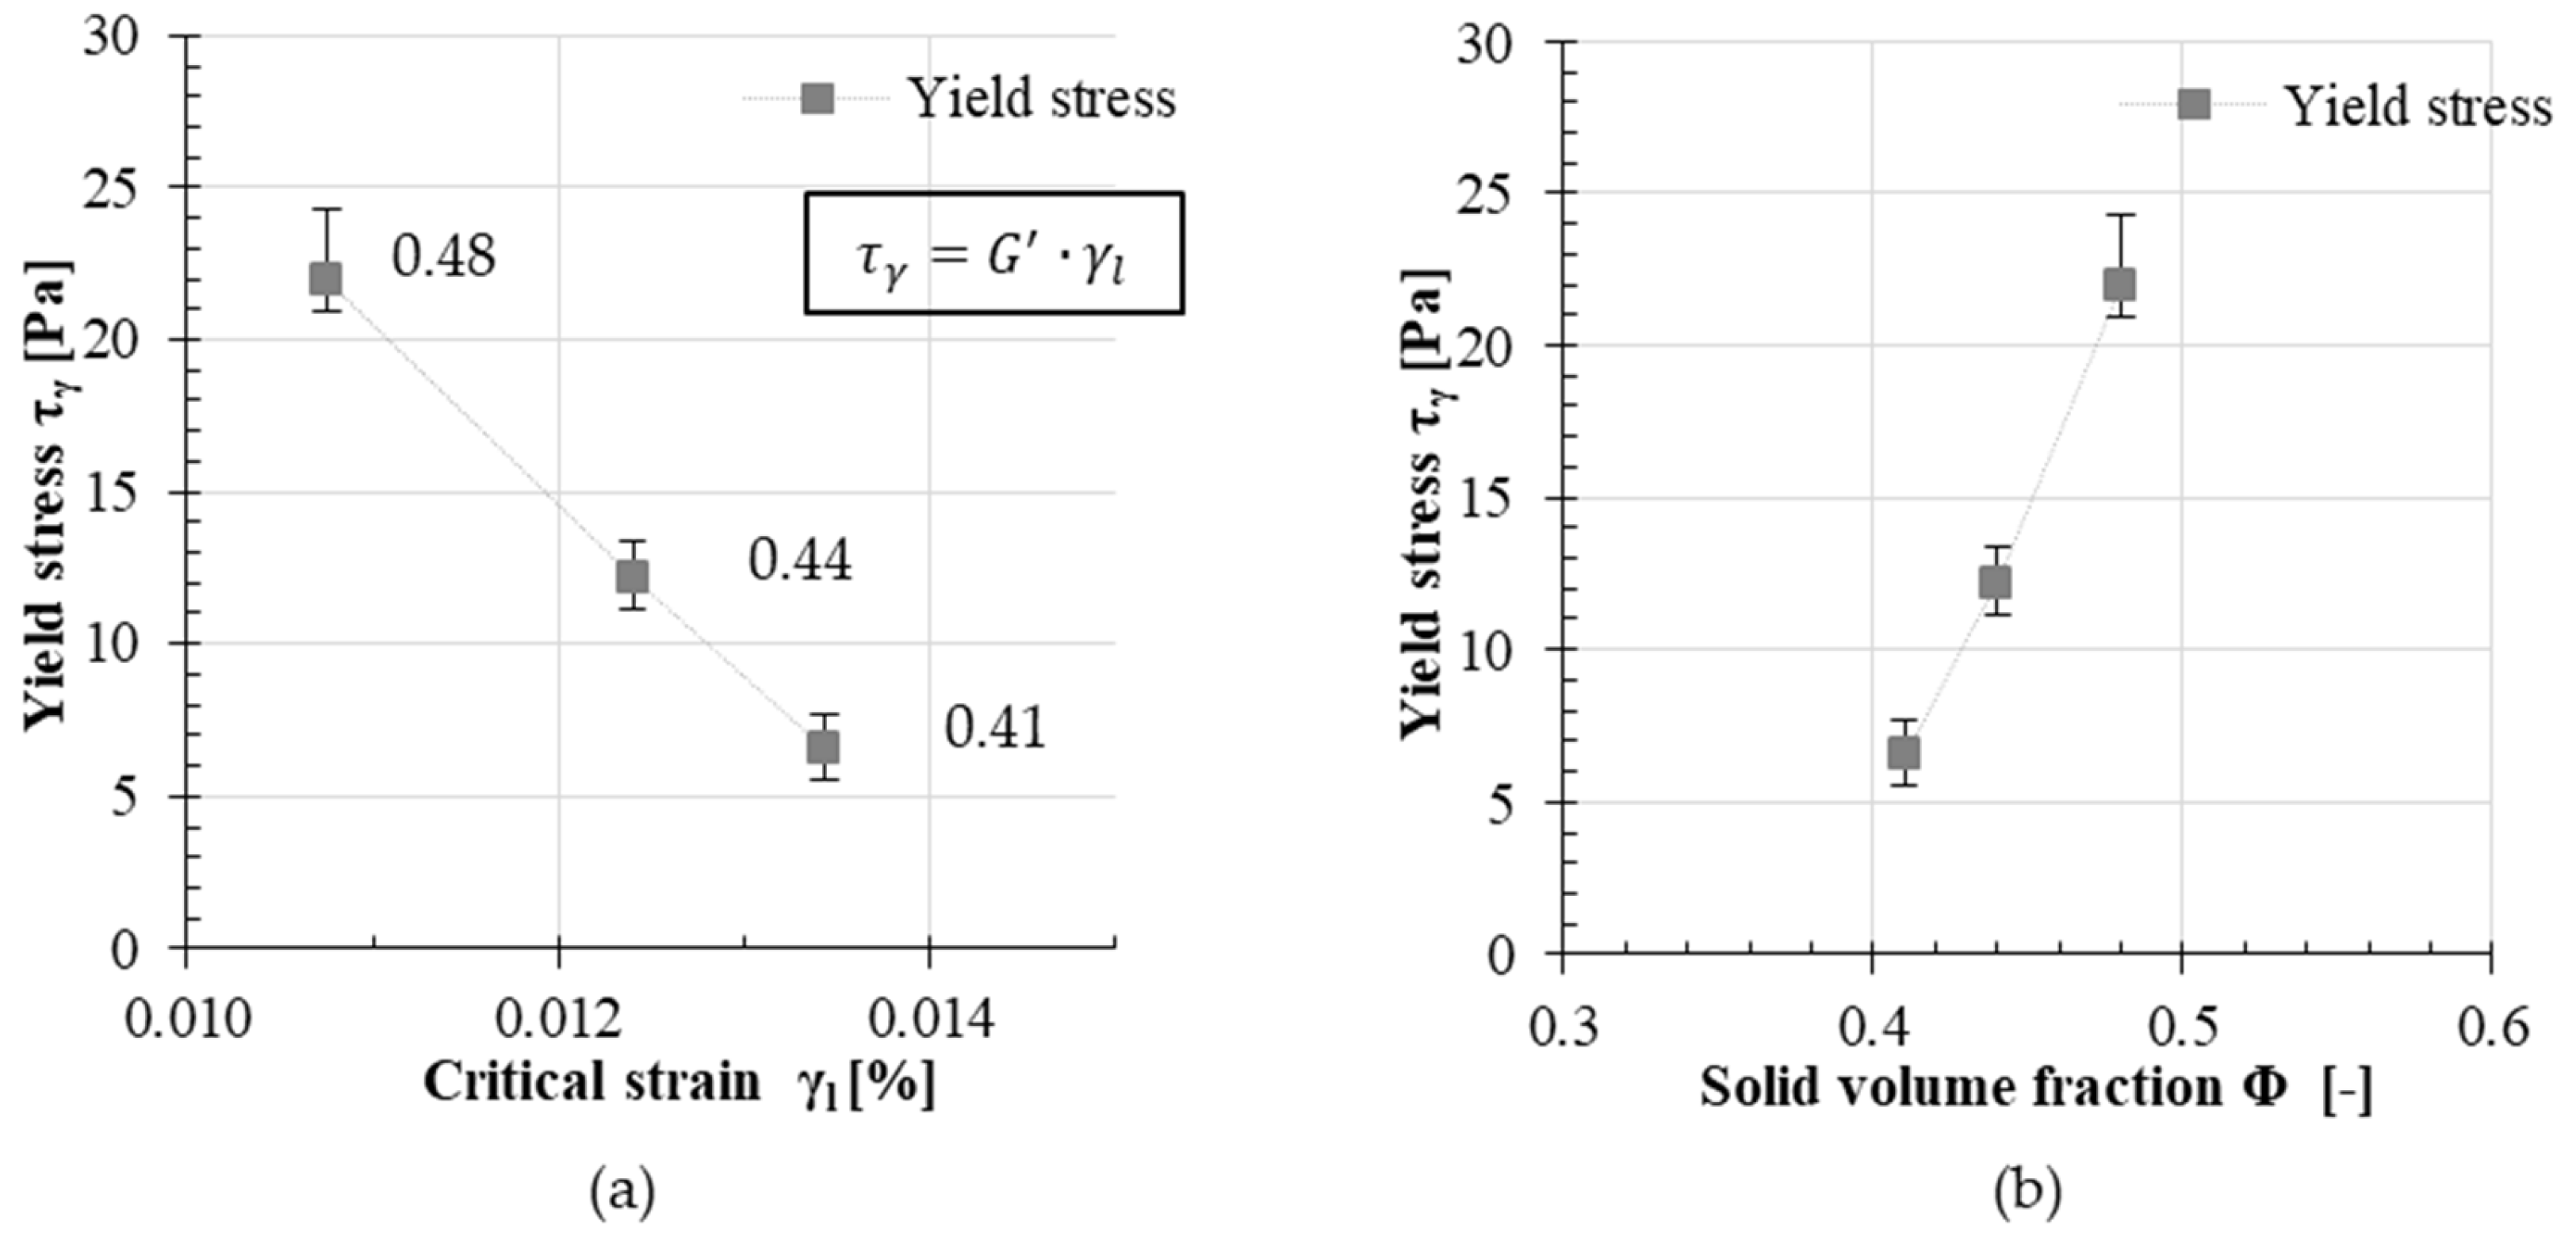
| 0.41 | 48,699 | 16,886 | 0.0134 | 6.52 |
| 0.44 | 99,874 | 13,319 | 0.0124 | 12.38 |
| 0.48 | 204,267 | 15,336 | 0.0108 | 22.06 |
© 2020 by the authors. Licensee MDPI, Basel, Switzerland. This article is an open access article distributed under the terms and conditions of the Creative Commons Attribution (CC BY) license (http://creativecommons.org/licenses/by/4.0/).
Share and Cite
Ukrainczyk, N.; Thiedeitz, M.; Kränkel, T.; Koenders, E.; Gehlen, C. Modeling SAOS Yield Stress of Cement Suspensions: Microstructure-Based Computational Approach. Materials 2020, 13, 2769. https://doi.org/10.3390/ma13122769
Ukrainczyk N, Thiedeitz M, Kränkel T, Koenders E, Gehlen C. Modeling SAOS Yield Stress of Cement Suspensions: Microstructure-Based Computational Approach. Materials. 2020; 13(12):2769. https://doi.org/10.3390/ma13122769
Chicago/Turabian StyleUkrainczyk, Neven, Mareike Thiedeitz, Thomas Kränkel, Eddie Koenders, and Christoph Gehlen. 2020. "Modeling SAOS Yield Stress of Cement Suspensions: Microstructure-Based Computational Approach" Materials 13, no. 12: 2769. https://doi.org/10.3390/ma13122769