Characterization of Cementation Factor of Unconsolidated Granular Materials Through Time Domain Reflectometry with Variable Saturated Conditions

Abstract
:1. Introduction
2. Background Theory
3. Specimens
4. Experimental Section
5. Results
6. Discussion
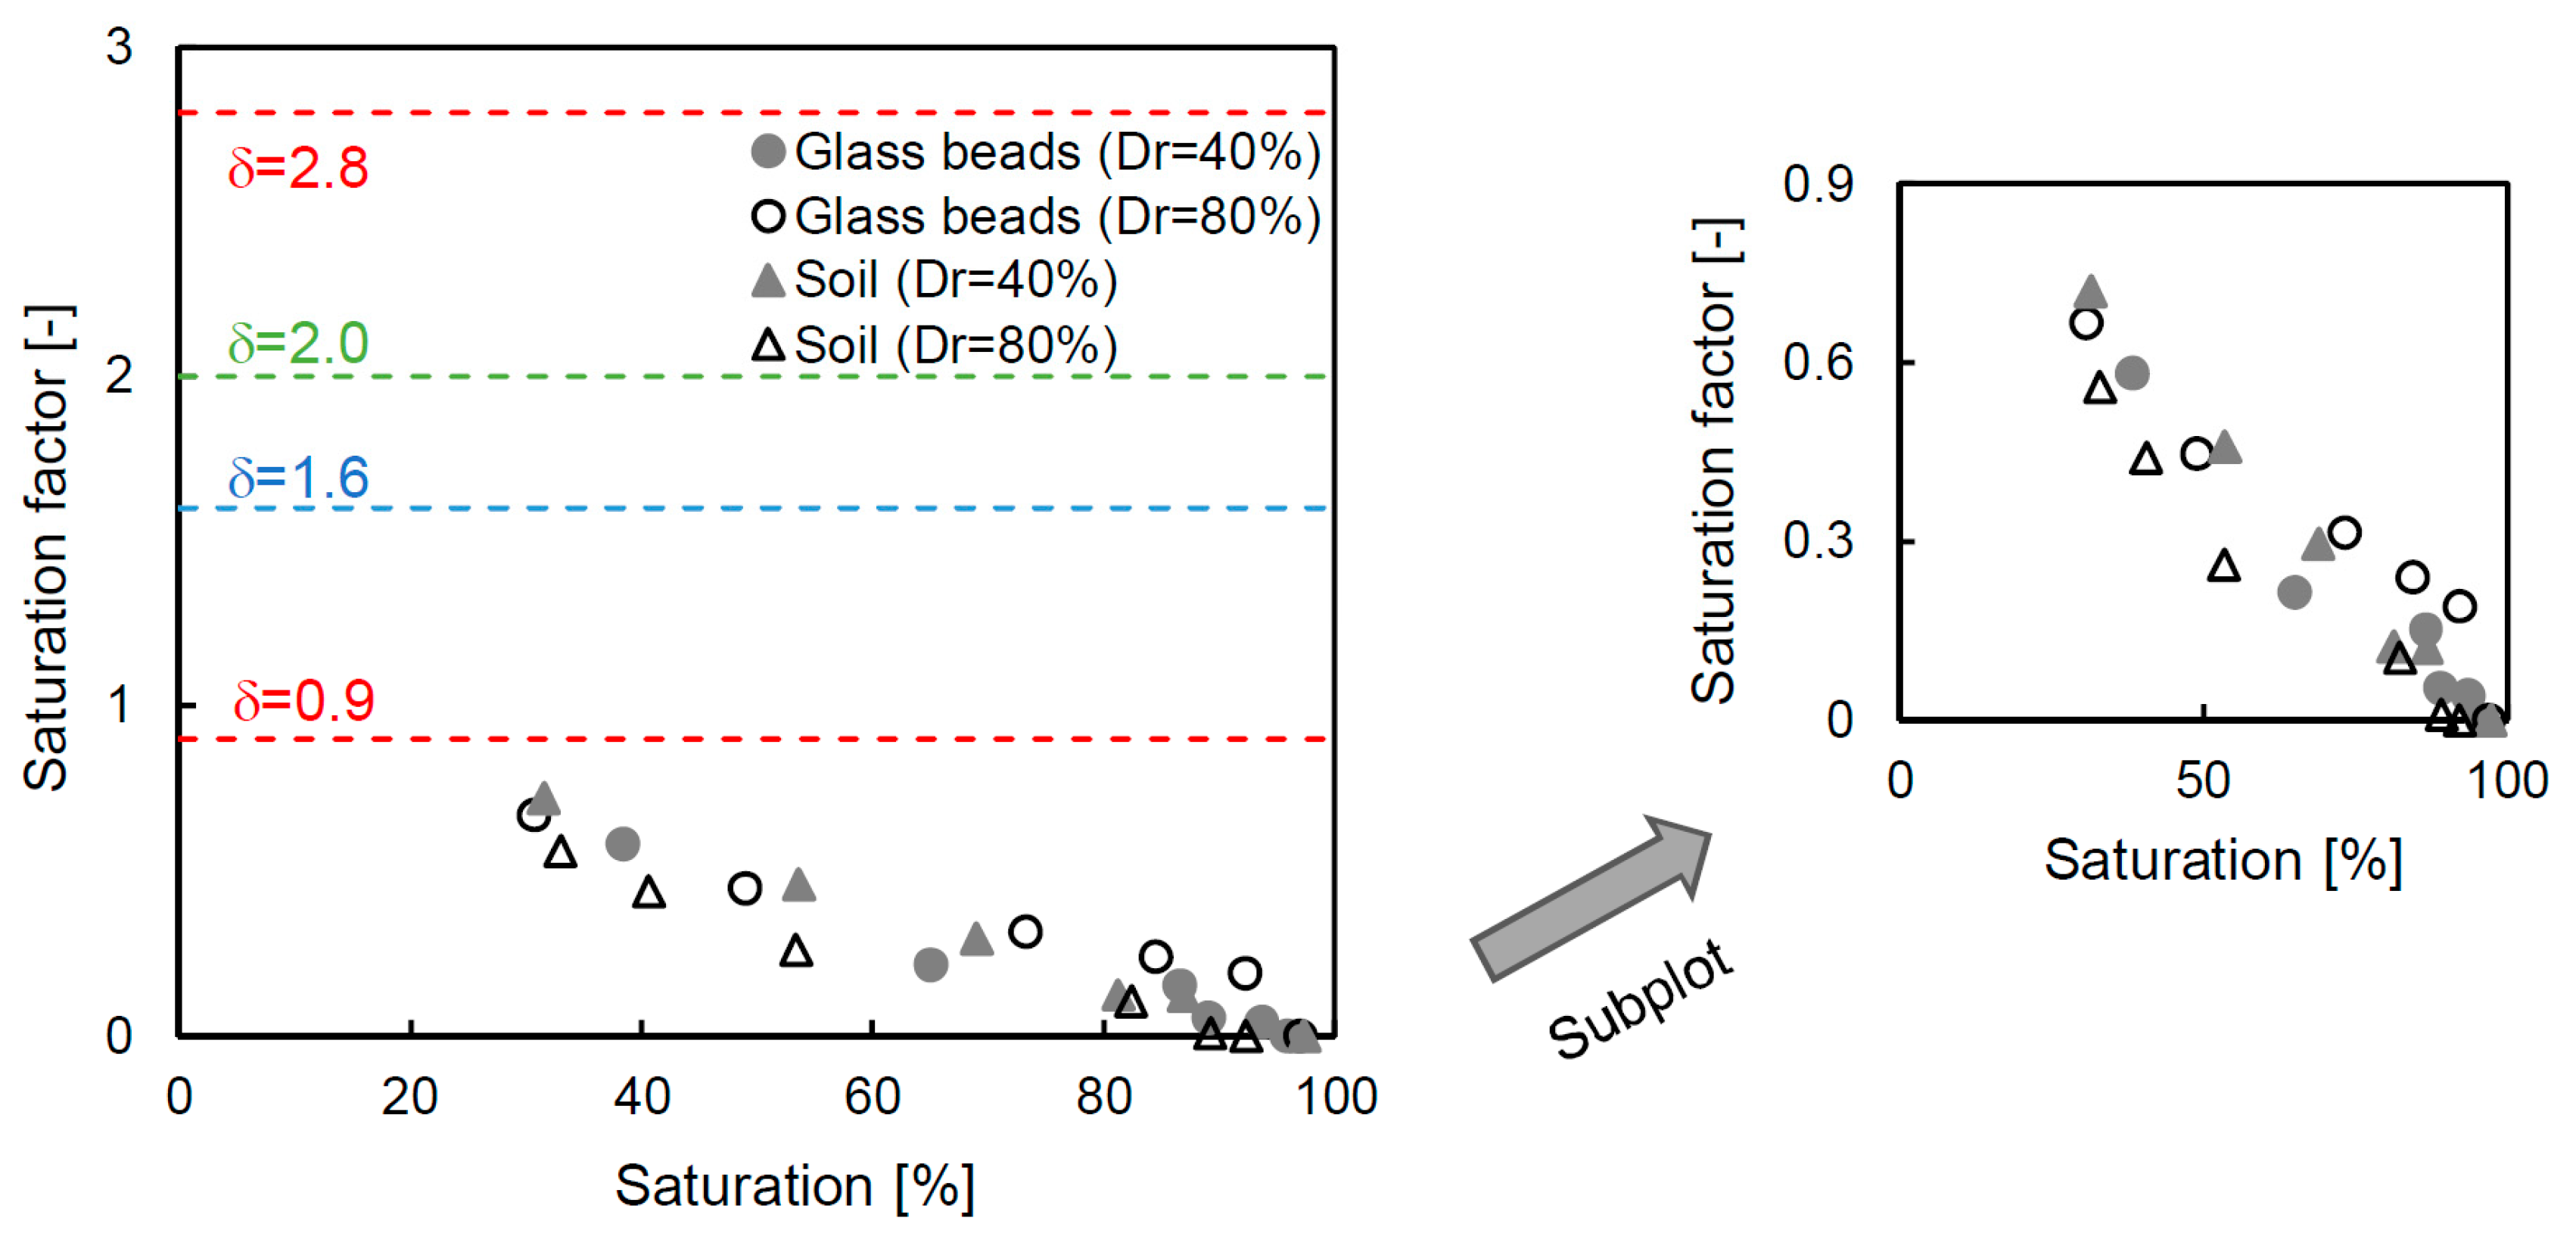
6.1. Saturation Factor
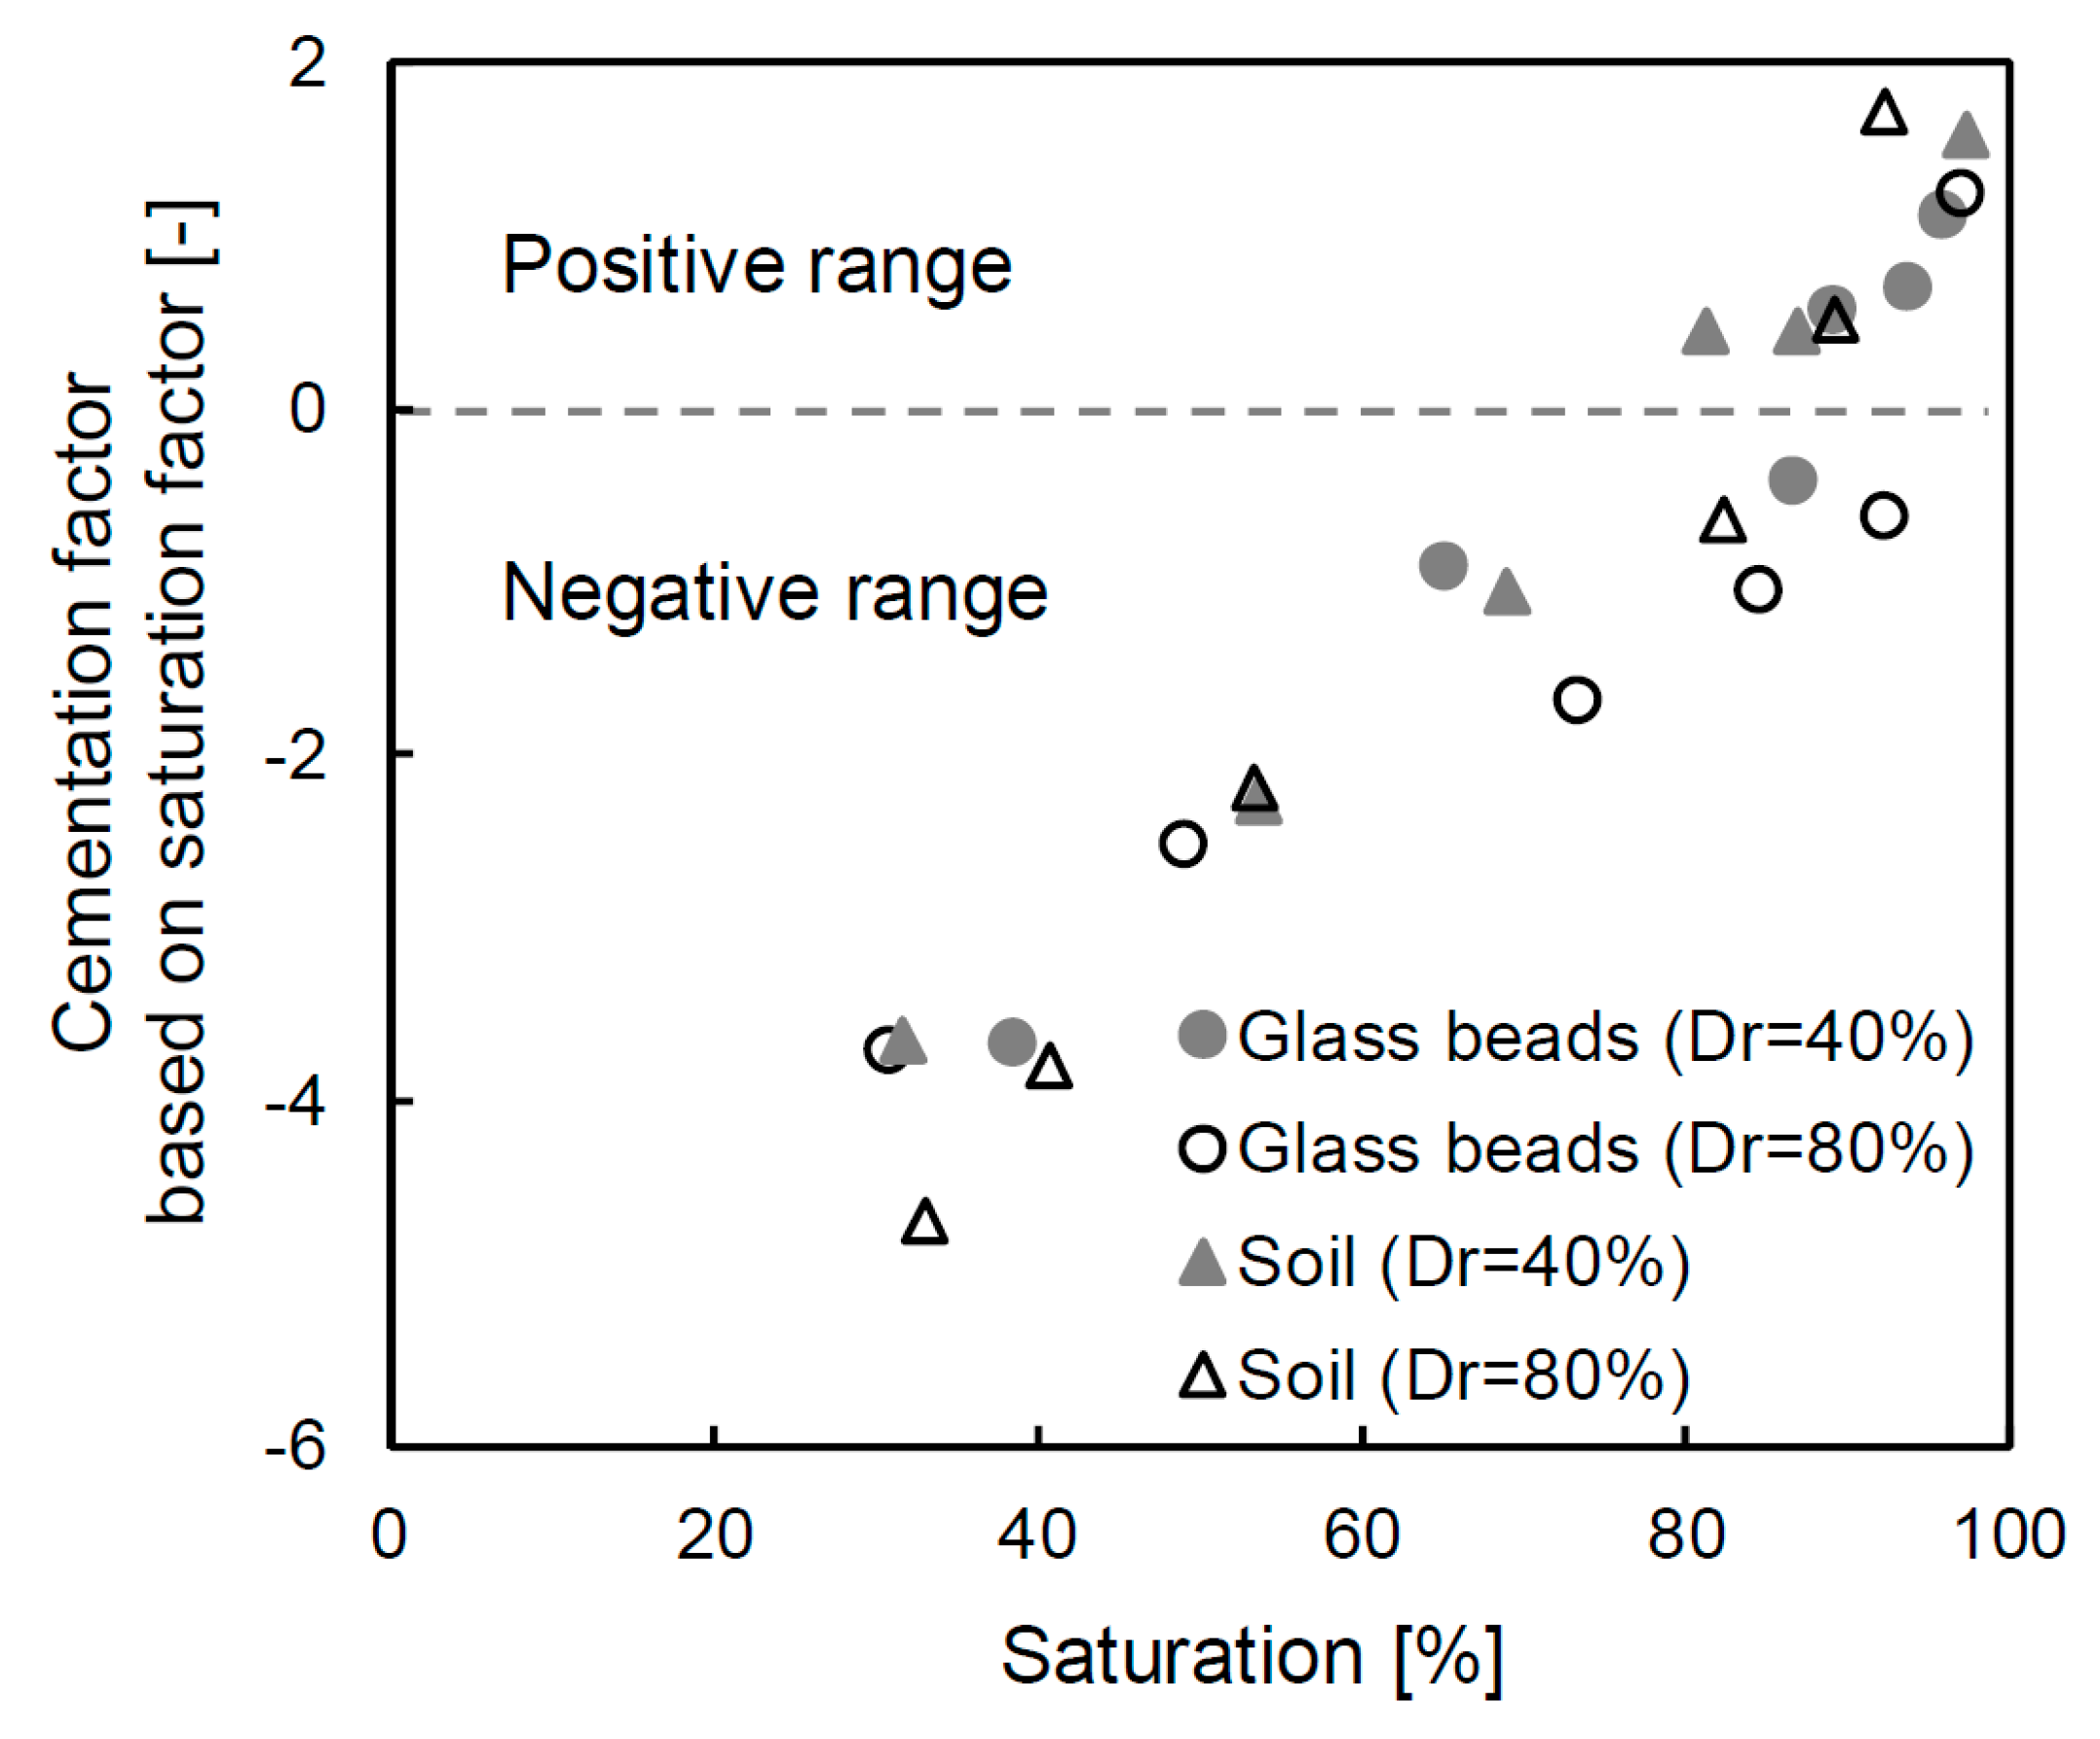
6.2. Cementation Factor
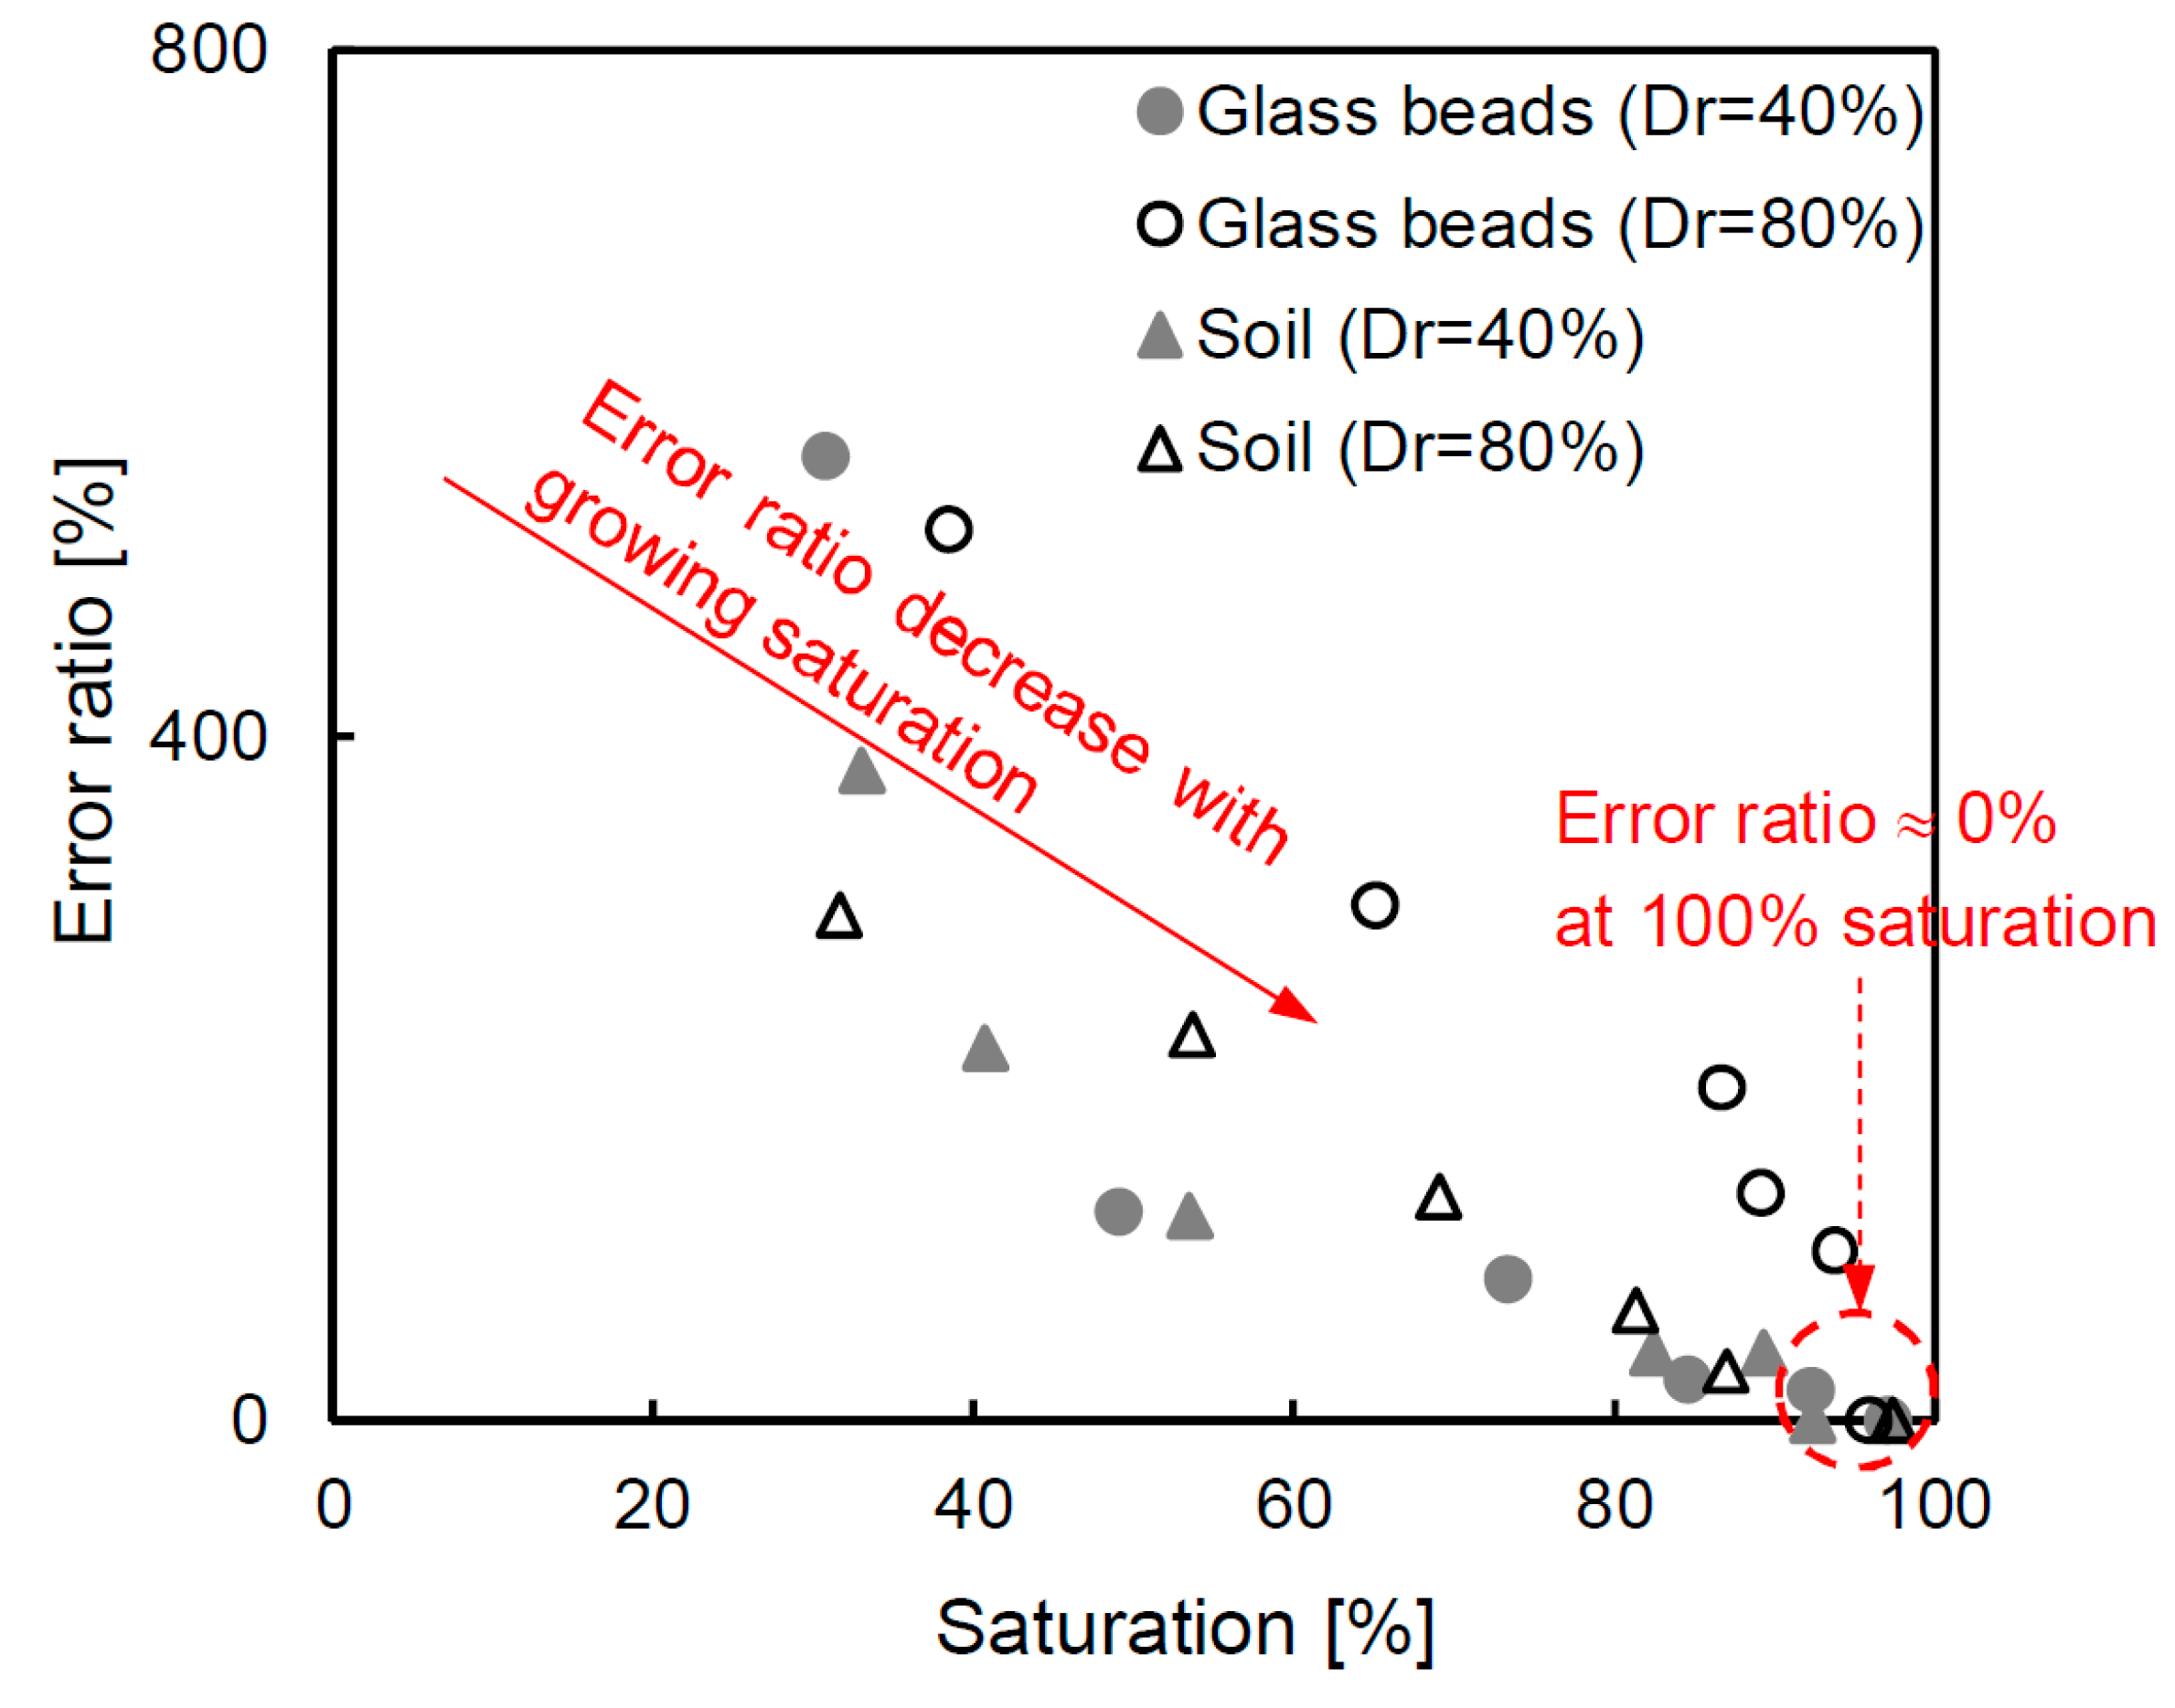
6.3. Error Ratio of Porosity
7. Conclusions
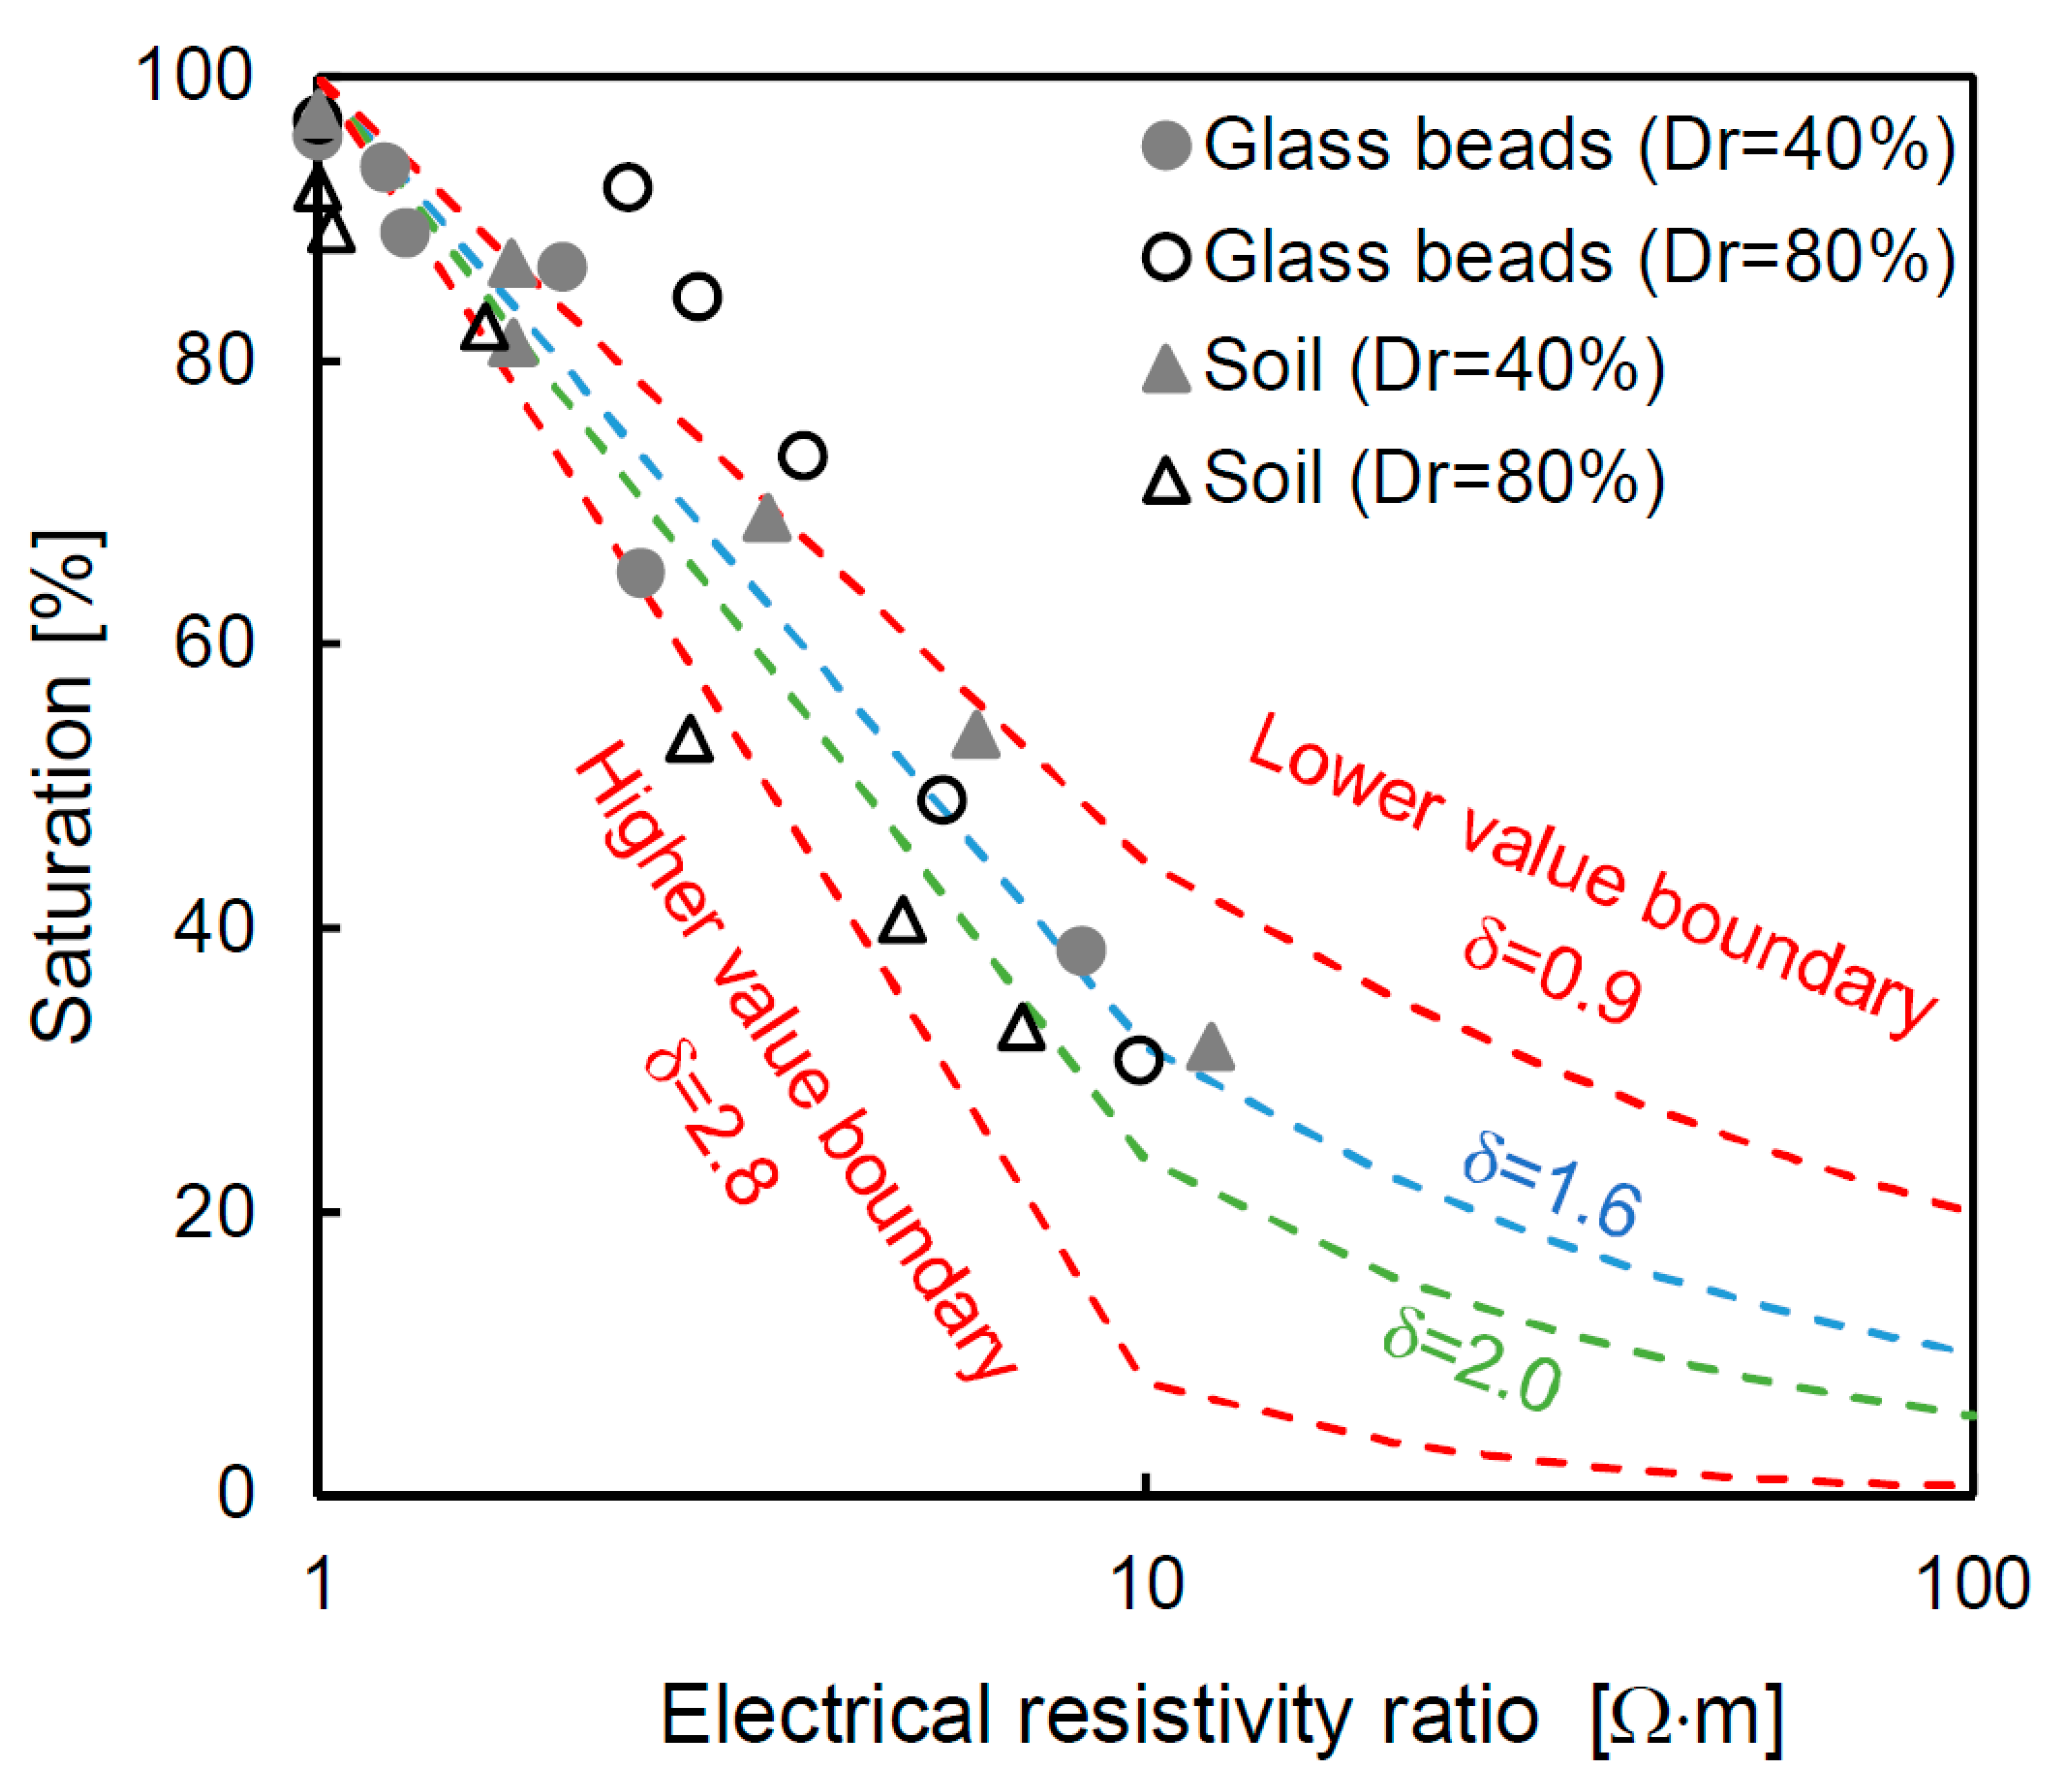
- Time domain reflectometry is selected to measure the dielectric constant, and the value is converted into the saturation and electrical resistivity of each specimen. Additionally, the saturation factor at every saturation stage is determined from the relationship between the saturation and electrical resistivity ratio.
- The cementation factor, suitable for each degree of saturation, is derived, and the value ranges from negative to positive.
- The error ratio based on the porosity is computed, and a high error ratio indicates an inaccurate saturation range. The results show that the determination of the true cementation factor is necessary for enhancing the reliability.
- Finally, the result shows that the Archie equation can be applied under dried, unsaturated and saturated conditions when the suitable cementation factor is applied.
Author Contributions
Funding
Conflicts of Interest
References
- Rouquerol, J.; Avnir, D.; Fairbridge, C.W.; Everett, D.H.; Haynes, J.M.; Pernicone, N.; Ramsay, J.D.F.; Sing, K.S.W.; Unger, K.K. Recommendations for the characterization of porous solids (Technical Report). Pure Appl. Chem. 1994, 66, 1739–1758. [Google Scholar] [CrossRef] [Green Version]
- Lee, J.S.; Yoon, H.K. Characterization of rock weathering using elastic waves: A Laboratory-scale experimental study. J. Appl. Geophys. 2017, 140, 24–33. [Google Scholar] [CrossRef]
- Lee, J.S.; Byun, Y.H.; Yoon, H.K. Study of Activation Energy in Soil through Elastic Wave Velocity and Electrical Resistivity. Vadose Zone J. 2017, 16. [Google Scholar] [CrossRef]
- Taiwo, S.M.; Lee, J.S.; Yoon, H.K. Analytical and experimental studies to obtain electrical resistivity in a small-scaled laboratory test. Geophysics 2017, 82, E267–E275. [Google Scholar] [CrossRef]
- Lee, J.S.; Yoon, H.K. Theoretical relationship between elastic wave velocity and electrical resistivity. J. Appl. Geophys. 2015, 116, 51–61. [Google Scholar] [CrossRef]
- Archie, G.E. The electrical resistivity log as an aid in determining some reservoir characteristics. Trans. AIME 1942, 146, 54–62. [Google Scholar] [CrossRef]
- Byun, J.H.; Lee, J.S.; Park, K.; Yoon, H.K. Prediction of crack density in porous-cracked rocks from elastic wave velocities. J. Appl. Geophys. 2015, 115, 110–119. [Google Scholar] [CrossRef]
- Jackson, P.D.; Smith, D.T.; Stanford, P.N. Resistivity-porosity-particle shape relationships for marine sands. Geophysics 1978, 43, 1250–1268. [Google Scholar] [CrossRef]
- Park, C.H.; Byun, J.H.; Won, K.S.; Cho, H.T.; Yoon, H.K. Characterization of alluvium soil using geophysical and sounding methods. Mar. Georesour. Geotechnol. 2017, 35, 127–135. [Google Scholar] [CrossRef]
- Kim, J.H.; Yoon, H.K.; Lee, J.S. Void ratio estimation of soft soils using electrical resistivity cone probe. J. Geotech. Geoenviron. Eng. 2010, 137, 86–93. [Google Scholar] [CrossRef]
- Kim, J.H.; Yoon, H.K.; Cho, S.H.; Kim, Y.S.; Lee, J.S. Four electrode resistivity probe for porosity evaluation. Geotech. Test. J. 2011, 34, 668–675. [Google Scholar]
- Yoon, H.K.; Lee, J.S. Field velocity resistivity probe for estimating stiffness and void ratio. Soil Dyn. Earthq. Eng. 2010, 30, 1540–1549. [Google Scholar] [CrossRef]
- Rezaee, M.R.; Motiei, H.; Kazemzadeh, E. A new method to acquire m exponent and tortuosity factor for microscopically heterogeneous carbonates. J. Pet. Sci. Eng. 2007, 56, 241–251. [Google Scholar] [CrossRef]
- Choo, H.; Lee, W.; Lee, C.; Burns, S.E. Estimating Porosity and Particle Size for Hydraulic Conductivity of Binary Mixed Soils Containing Two Different-Sized Silica Particles. J. Geotech. Geoenviron. Eng. 2017, 144, 04017104. [Google Scholar] [CrossRef]
- Salem, H.S.; Chilingarian, G.V. The cementation factor of Archie’s equation for shaly sandstone reservoirs. J. Pet. Sci. Eng. 1999, 23, 83–93. [Google Scholar] [CrossRef]
- Topp, G.C.; Davis, J.L.; Annan, A.P. Electromagnetic determination of soil water content: Measurements in coaxial transmission lines. Water Resour. Res. 1980, 16, 574–582. [Google Scholar] [CrossRef]
- Ferré, T.; Nissen, H.H.; Šimůnek, J. The effect of the spatial sensitivity of TDR on inferring soil hydraulic properties from water content measurements made during the advance of a wetting front. Vadose Zone J. 2002, 1, 281–288. [Google Scholar] [CrossRef]
- Ngui, Y.J.; Lin, C.P.; Wu, T.J. Dielectric Spectroscopy Using Dual Reflection Analysis of TDR Signals. Sensors 2019, 19, 1299. [Google Scholar] [CrossRef]
- Ferré, P.A.; Redman, J.D.; Rudolph, D.L.; Kachanoski, R.G. The dependence of the electrical conductivity measured by time domain reflectometry on the water content of a sand. Water Resour. Res. 1998, 34, 1207–1213. [Google Scholar] [CrossRef] [Green Version]
- Yu, J.D.; Lee, J.S.; Yoon, H.K. Circular time-domain reflectometry system for monitoring bridge scour depth. Mar. Georesour. Geotechnol. 2019, 1–10. [Google Scholar] [CrossRef]
- Janik, G.; Dawid, M.; Walczak, A.; Słowińska-Osypiuk, J.; Skierucha, W.; Wilczek, A.; Daniel, A. Application of the TDR technique for the detection of changes in the internal structure of an earthen flood levee. J. Geophys. Eng. 2017, 14, 292–302. [Google Scholar] [CrossRef]
- Lee, J.S.; Song, J.U.; Hong, W.T.; Yu, J.D. Application of time domain reflectometer for detecting necking defects in bored piles. NDT&E Int. 2018, 100, 132–141. [Google Scholar]
- Santamarina, J.C.; Klein, K.A.; Fam, N.A. Soils and Waves; John Wiley & Sons: Hoboken, NJ, USA, 2001. [Google Scholar]
- Winsauer, W.O.; Shearin, H.M., Jr.; Masson, P.H.; Williams, M. Resistivity of brine-saturated sands in relation to pore geometry. AAPG Bull. 1952, 36, 253–277. [Google Scholar]
- Wyllie, M.R.J.; Gregory, A.R. Formation factors of unconsolidated porous media: Influence of particle shape and effect of cementation. J. Pet. Technol. 1953, 5, 103–110. [Google Scholar] [CrossRef]
- Hill, H.J.; Milburn, J.D. Effect of clay and water salinity on electrochemical behavior of reservoir rocks. Pet. Trans. 1956, 207, 65–72. [Google Scholar]
- Wyble, D.O. Effect of applied pressure on the conductivity, porosity and permeability of sandstones. J. Pet. Technol. 1958, 10, 57–59. [Google Scholar] [CrossRef]
- Atkins, E.R., Jr.; Smith, G.H. The significance of particle shape in formation resistivity factor-porosity relationships. J. Pet. Technol. 1961, 13, 285–291. [Google Scholar] [CrossRef]
- Brace, W.F.; Orange, A.S. Electrical resistivity changes in saturated rocks during fracture and frictional sliding. J. Geophys. Res. 1968, 73, 1433–1445. [Google Scholar] [CrossRef]
- Carothers, J.E.; Porter, C.R. Formation factor-porosity relation derived from well log data. Log Anal. 1971, 12, 1–11. [Google Scholar]
- Taylor-Smith, D. Acoustic and electric techniques for sea-floor sediment identification. In Proceedings of the International Symposium on Engineering Properties of the Sea-Floor and their Geophysical Identification, Seattle, WA, USA, 25 July 1971; pp. 253–267. [Google Scholar]
- Barnes, B.B.; Corwin, R.F.; Beyer, J.H.; Hildenbrand, T.G. Geologic Prediction: Developing Tools and Techniques for the Geophysical Identification and Classification of Sea-Floor Sediments; U.S. Dept. Commerce Publication, NOAA Tech. Rep. ERL224- MMT-C2; U.S. Geological Survey: Reston, VA, USA, 1972; 163p.
- Windle, D.; Wroth, C.P. Electrical resistivity method for determining volume changes that occur during a pressuremeter test. In In Situ Measurement of Soil Properties; ASCE: Reston, VA, USA, 1975; p. 497. [Google Scholar]
- Worthington, P.F. The uses and abuses of the Archie equations, 1: The formation factor-porosity relationship. J. Appl. Geophys. 1993, 30, 215–228. [Google Scholar] [CrossRef]
- Donaldson, E.C.; Siddiqui, T.K. Relationship between the Archie saturation exponent and wettability. SPE Form. Eval. 1989, 4, 359–362. [Google Scholar] [CrossRef]
- Dalton, F.N.; Herkelrath, W.N.; Rawlins, D.S.; Rhoades, J.D. Time-domain reflectometry: Simultaneous measurement of soil water content and electrical conductivity with a single probe. Science 1984, 224, 989–990. [Google Scholar] [CrossRef]
- Archer, D.G.; Wang, P. The dielectric constant of water and Debye-Hückel limiting law slopes. J. Phys. Chem. Ref. Data 1990, 19, 371–411. [Google Scholar] [CrossRef]
- Benson, C.H.; Chen, J.N.; Edil, T.B.; Likos, W.J. Hydraulic conductivity of compacted soil liners permeated with coal combustion product leachates. J. Geotech. Geoenviron. Eng. 2018, 144, 04018011. [Google Scholar] [CrossRef]
- Hong, W.T.; Jung, Y.S.; Kang, S.; Lee, J.S. Estimation of soil-water characteristic curves in multiple-cycles using membrane and TDR system. Materials 2016, 9, 1019. [Google Scholar] [CrossRef]
- Lee, J.S.; Hong, W.T.; Park, K.; Hong, S.; Lee, S.H.; Byun, Y.H. Evaluation of water content in an active layer using penetration-type time domain reflectometry. Appl. Sci. 2018, 8, 935. [Google Scholar] [CrossRef]
- MacDonald, A.M.; Maurice, L.; Dobbs, M.R.; Reeves, H.J.; Auton, C.A. Relating in situ hydraulic conductivity, particle size and relative density of superficial deposits in a heterogeneous catchment. J. Hydrol. 2012, 434, 130–141. [Google Scholar] [CrossRef] [Green Version]
- Ponizovsky, A.A.; Chudinova, S.M.; Pachepsky, Y.A. Performance of TDR calibration models as affected by soil texture. J. Hydrol. 1999, 218, 35–43. [Google Scholar] [CrossRef]
- Sweeney, S.A.; Jennings, H.Y. The electrical resistivity of preferentially water-wet and preferentially oil-wet carbonate rock. Prod. Mon. 1960, 24, 29–32. [Google Scholar]
- Talabani, S.; Boyd, D.; El Wazeer, F.; Al Arfi, S. Validity of Archie equation in carbonate rocks. In Proceedings of the Abu Dhabi International Petroleum Exhibition and Conference, Abu Dhabi, UAE, 13–15 October 2000; Society of Petroleum Engineers: Richardson, TX, USA, 2000. [Google Scholar]
- Lucia, F.J. Petrophysical parameters estimated from visual descriptions of carbonate rocks: A field classification of carbonate pore space. J. Pet. Technol. 1983, 35, 629–637. [Google Scholar] [CrossRef]


| β | Material Type | Reference |
|---|---|---|
| 1.6 | Natural sand | [6] |
| 2.15 | Rock | [24] |
| 1.3 | Glass sphere | [25] |
| 1.64–2.23 | Natural sediment | [26] |
| 5.12 | Sand stone | [27] |
| 1.8-3.0 | Kaolinite and sodium montmorillonite | [28] |
| 2.0 | Rock with small fissures | [29] |
| 1.3-2.15 | Sand | [30] |
| 1.5–2.0 | Sea-floor sediment | [31] |
| 1.4–1.66 | Quartz and dolomite sand | [32] |
| 1.52–1.58 | Natural quartz sand | [33] |
| 1.4–1.6 | Marine sands | [8] |
| 1.3–3.3 | Sand with shale | [34] |
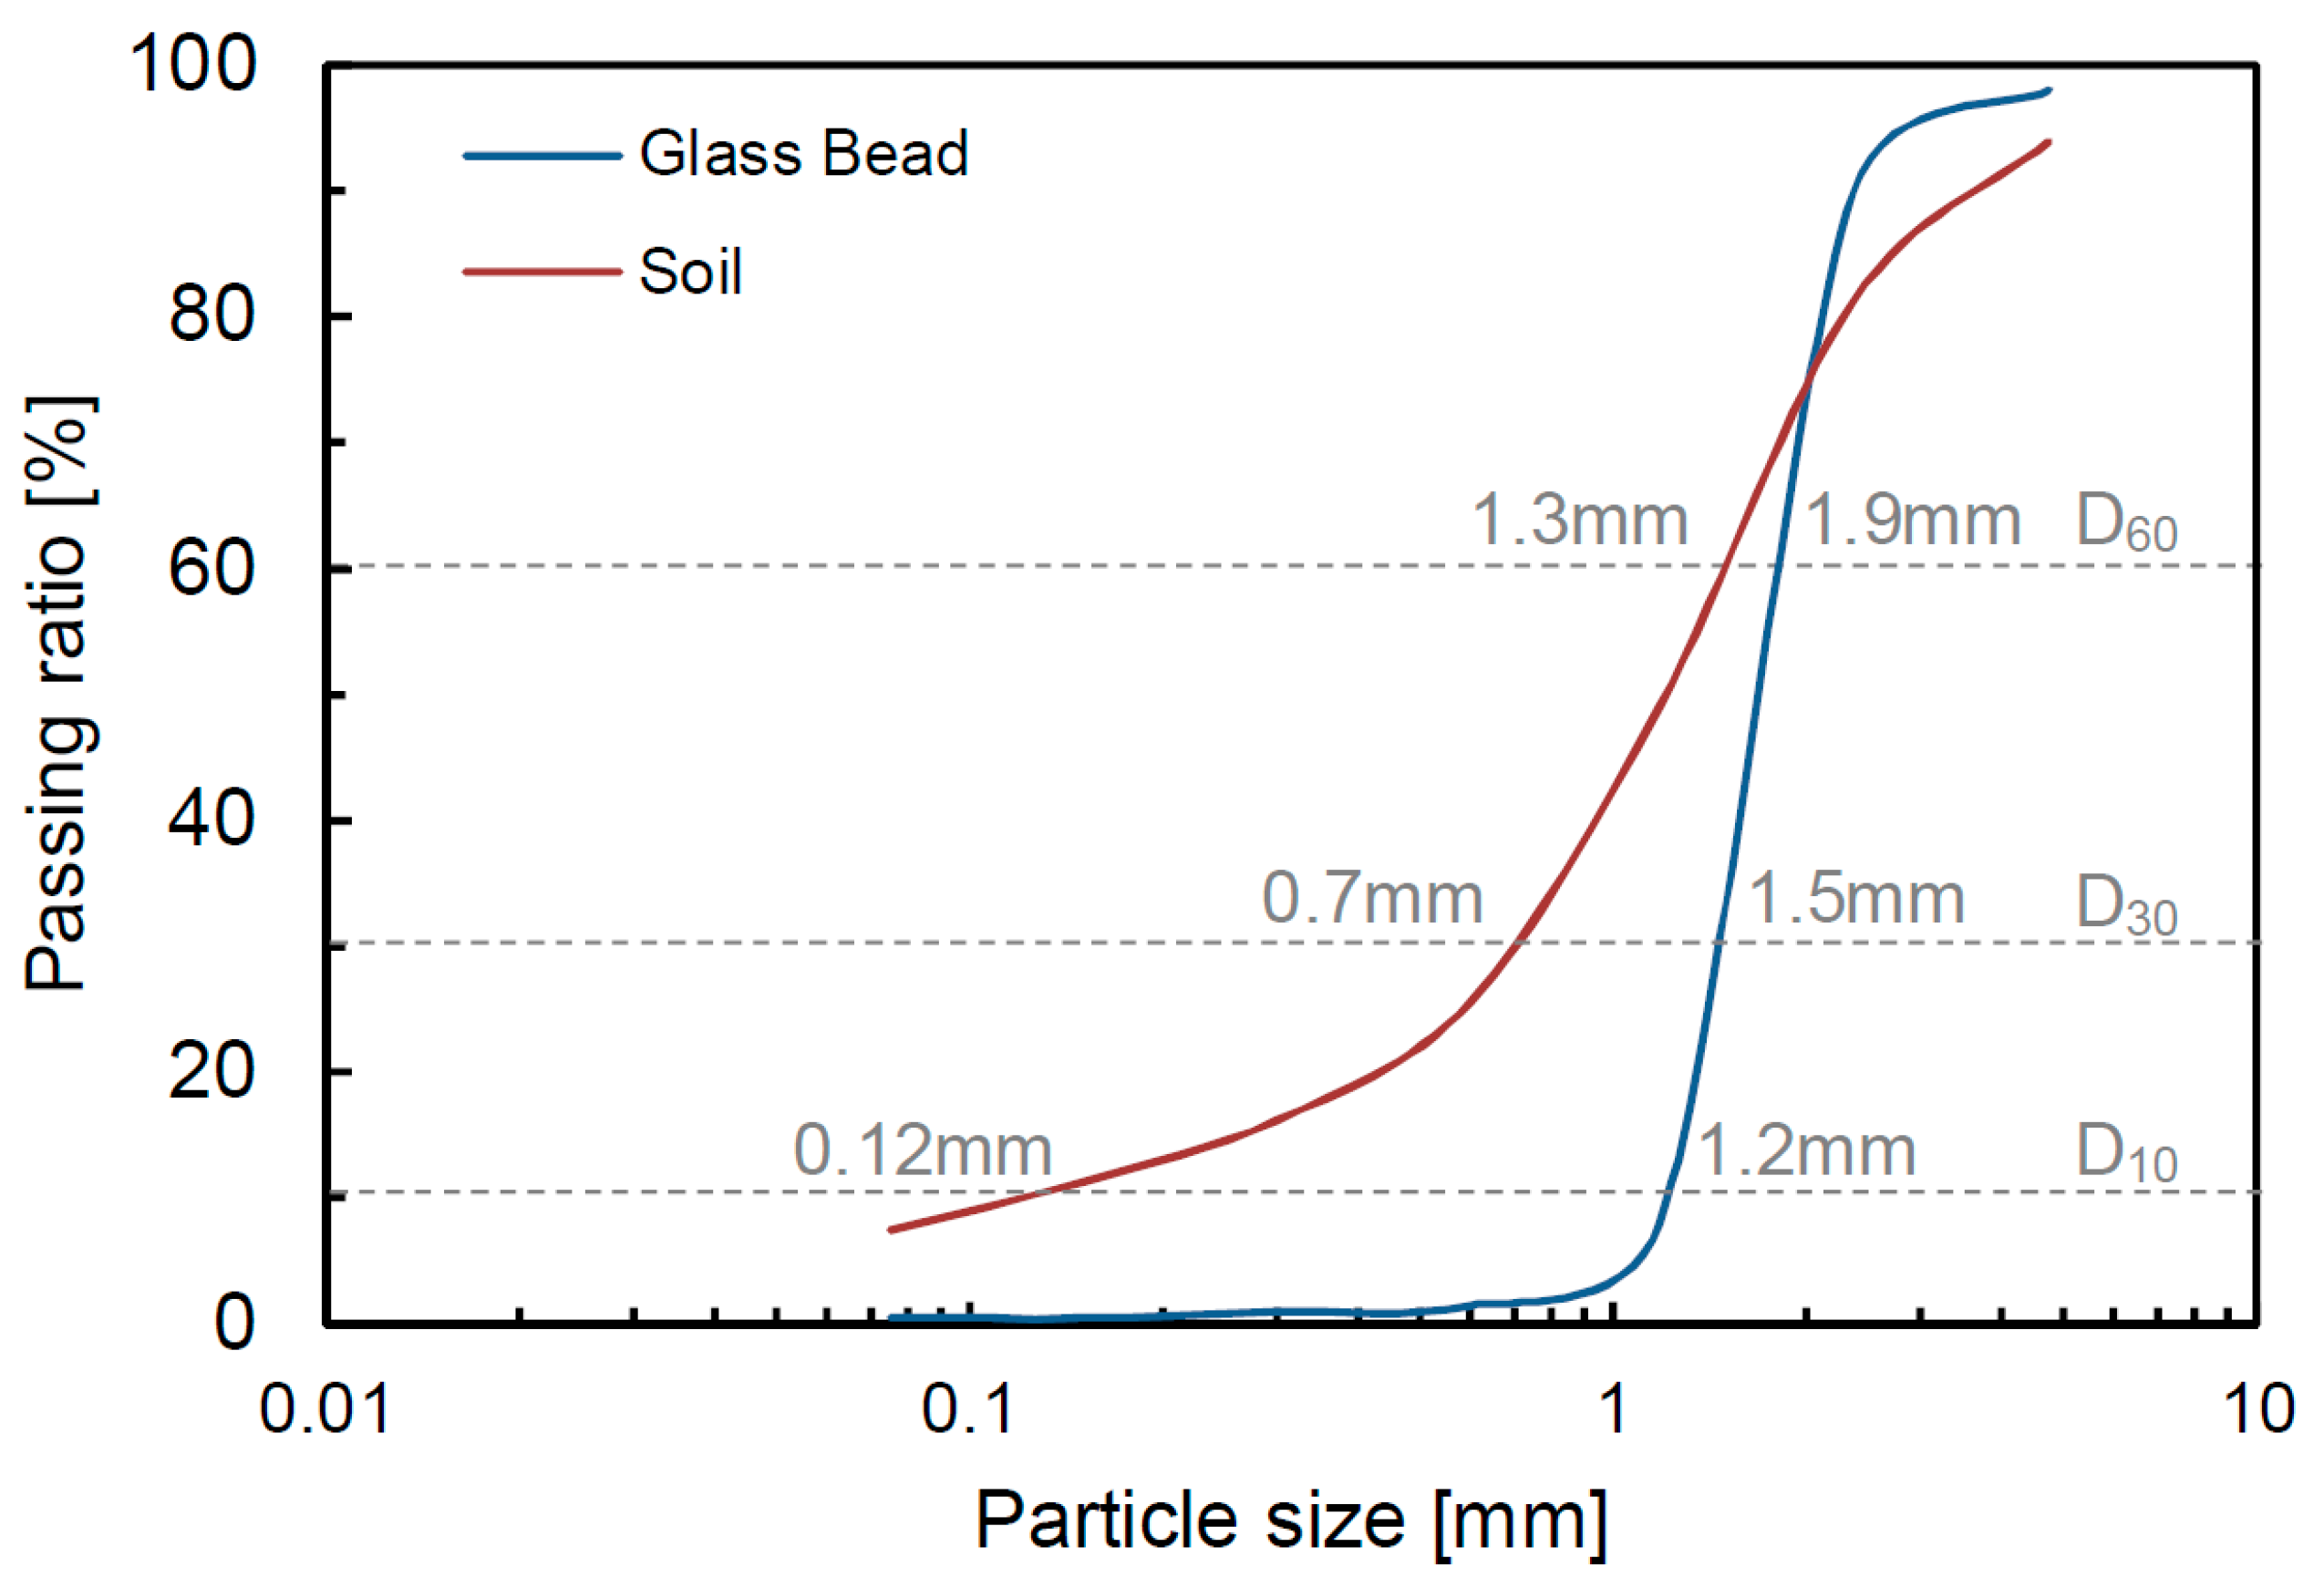
| Specimens | D10(mm) | D30(mm) | D60(mm) | Cc | Cu | emax | emin | USCS |
|---|---|---|---|---|---|---|---|---|
| Glass bead | 1.2 | 1.5 | 1.9 | 1.0 | 1.6 | 0.68 | 0.63 | - |
| Soil | 0.12 | 0.7 | 1.3 | 3.1 | 10.8 | 0.82 | 0.59 | SW |
| Saturation | Cementation Factor | ||||
|---|---|---|---|---|---|
| Saturation Range (%) | Specific Saturation Value (%) | Glass Bead Dr = 40% | Glass Bead Dr = 80% | Soil Dr = 40% | Soil Dr = 40% |
| 0~29 | - | - | - | - | - |
| 30~39 | 30 31 33 38 | - - - −3.66 | −3.70 - - - | - −3.68 - - | - - −4.69 - |
| 40~49 | 40 49 | - - | - −2.51 | - - | −3.80 - |
| 50~59 | 53 | - | - | −2.26 | −2.18 |
| 60~69 | 65 69 | - −0.90 | - - | - −1.04 | - - |
| 70~79 | 73 | ⋅ | −1.68 | ⋅ | - |
| 80~89 | 81 84 86 89 | - - −0.40 0.57 | - −1.04 - - | 0.44 - 0.44 - | −0.63 - 0.52 - |
| 90~100 | 92 93 95 97 | - −0.70 1.12 - | −0.61 - - 1.25 | - - - 1.58 | 1.71 - - - |
© 2019 by the authors. Licensee MDPI, Basel, Switzerland. This article is an open access article distributed under the terms and conditions of the Creative Commons Attribution (CC BY) license (http://creativecommons.org/licenses/by/4.0/).
Share and Cite
Byun, Y.-H.; Hong, W.-T.; Yoon, H.-K. Characterization of Cementation Factor of Unconsolidated Granular Materials Through Time Domain Reflectometry with Variable Saturated Conditions. Materials 2019, 12, 1340. https://doi.org/10.3390/ma12081340
Byun Y-H, Hong W-T, Yoon H-K. Characterization of Cementation Factor of Unconsolidated Granular Materials Through Time Domain Reflectometry with Variable Saturated Conditions. Materials. 2019; 12(8):1340. https://doi.org/10.3390/ma12081340
Chicago/Turabian StyleByun, Yong-Hoon, Won-Taek Hong, and Hyung-Koo Yoon. 2019. "Characterization of Cementation Factor of Unconsolidated Granular Materials Through Time Domain Reflectometry with Variable Saturated Conditions" Materials 12, no. 8: 1340. https://doi.org/10.3390/ma12081340