Parametric Optimization of Trochoidal Step on Surface Roughness and Dish Angle in End Milling of AISID3 Steel Using Precise Measurements


Abstract
:1. Introduction
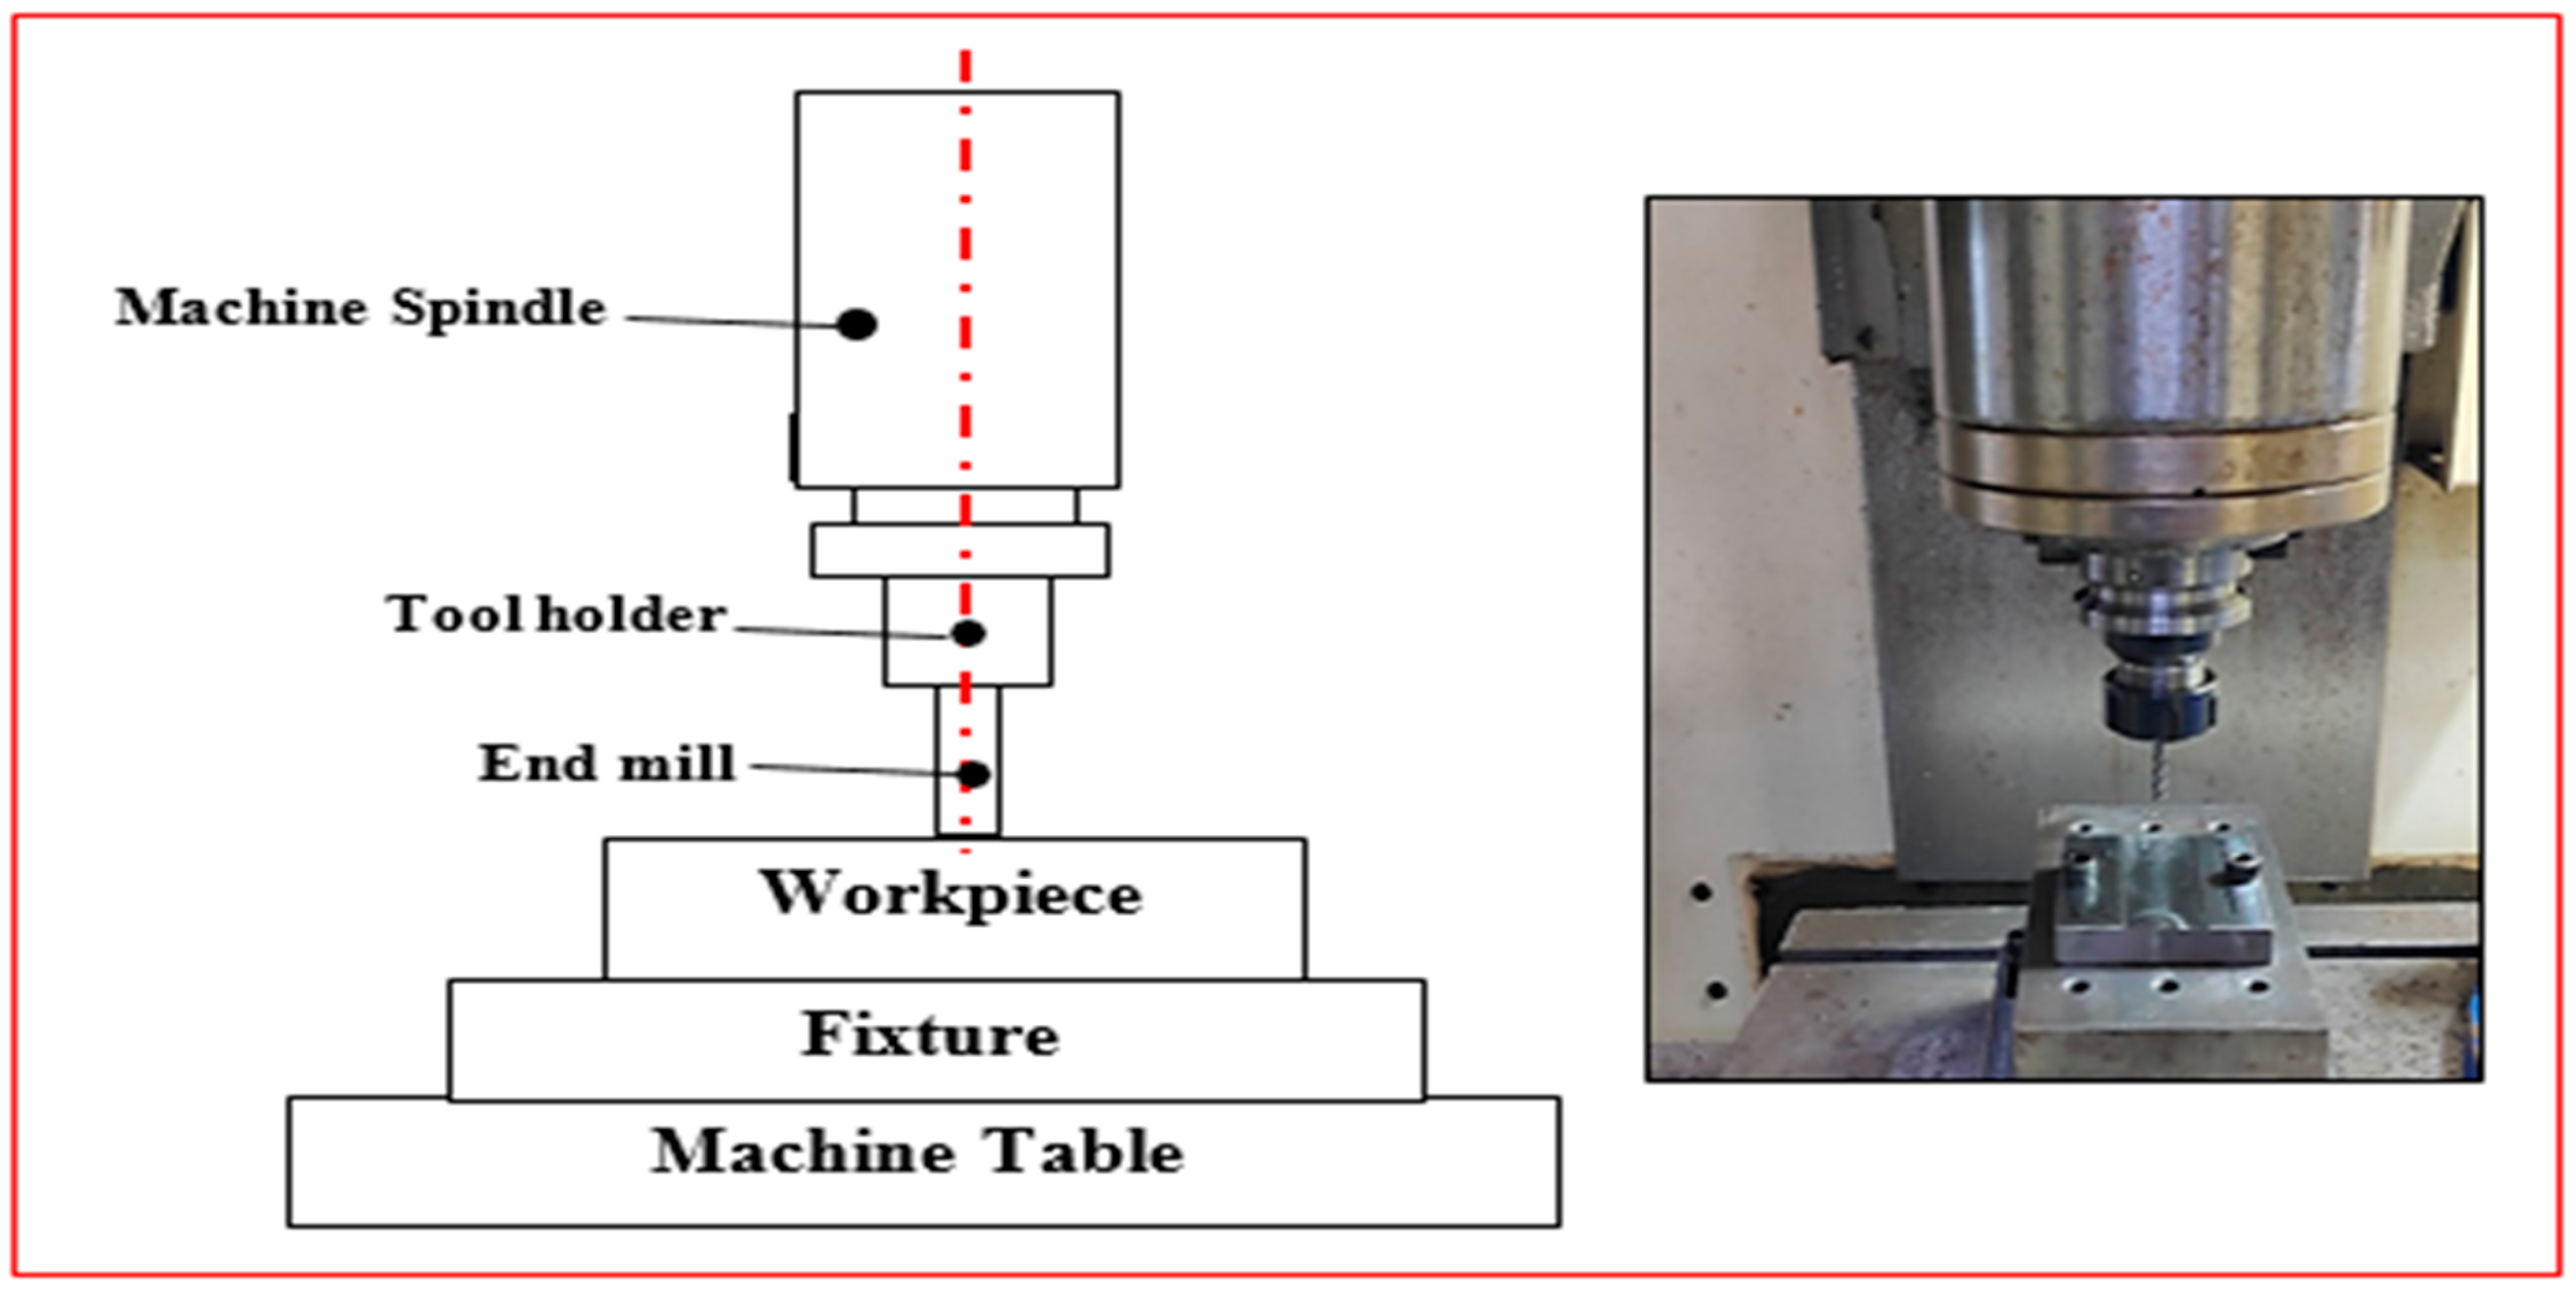
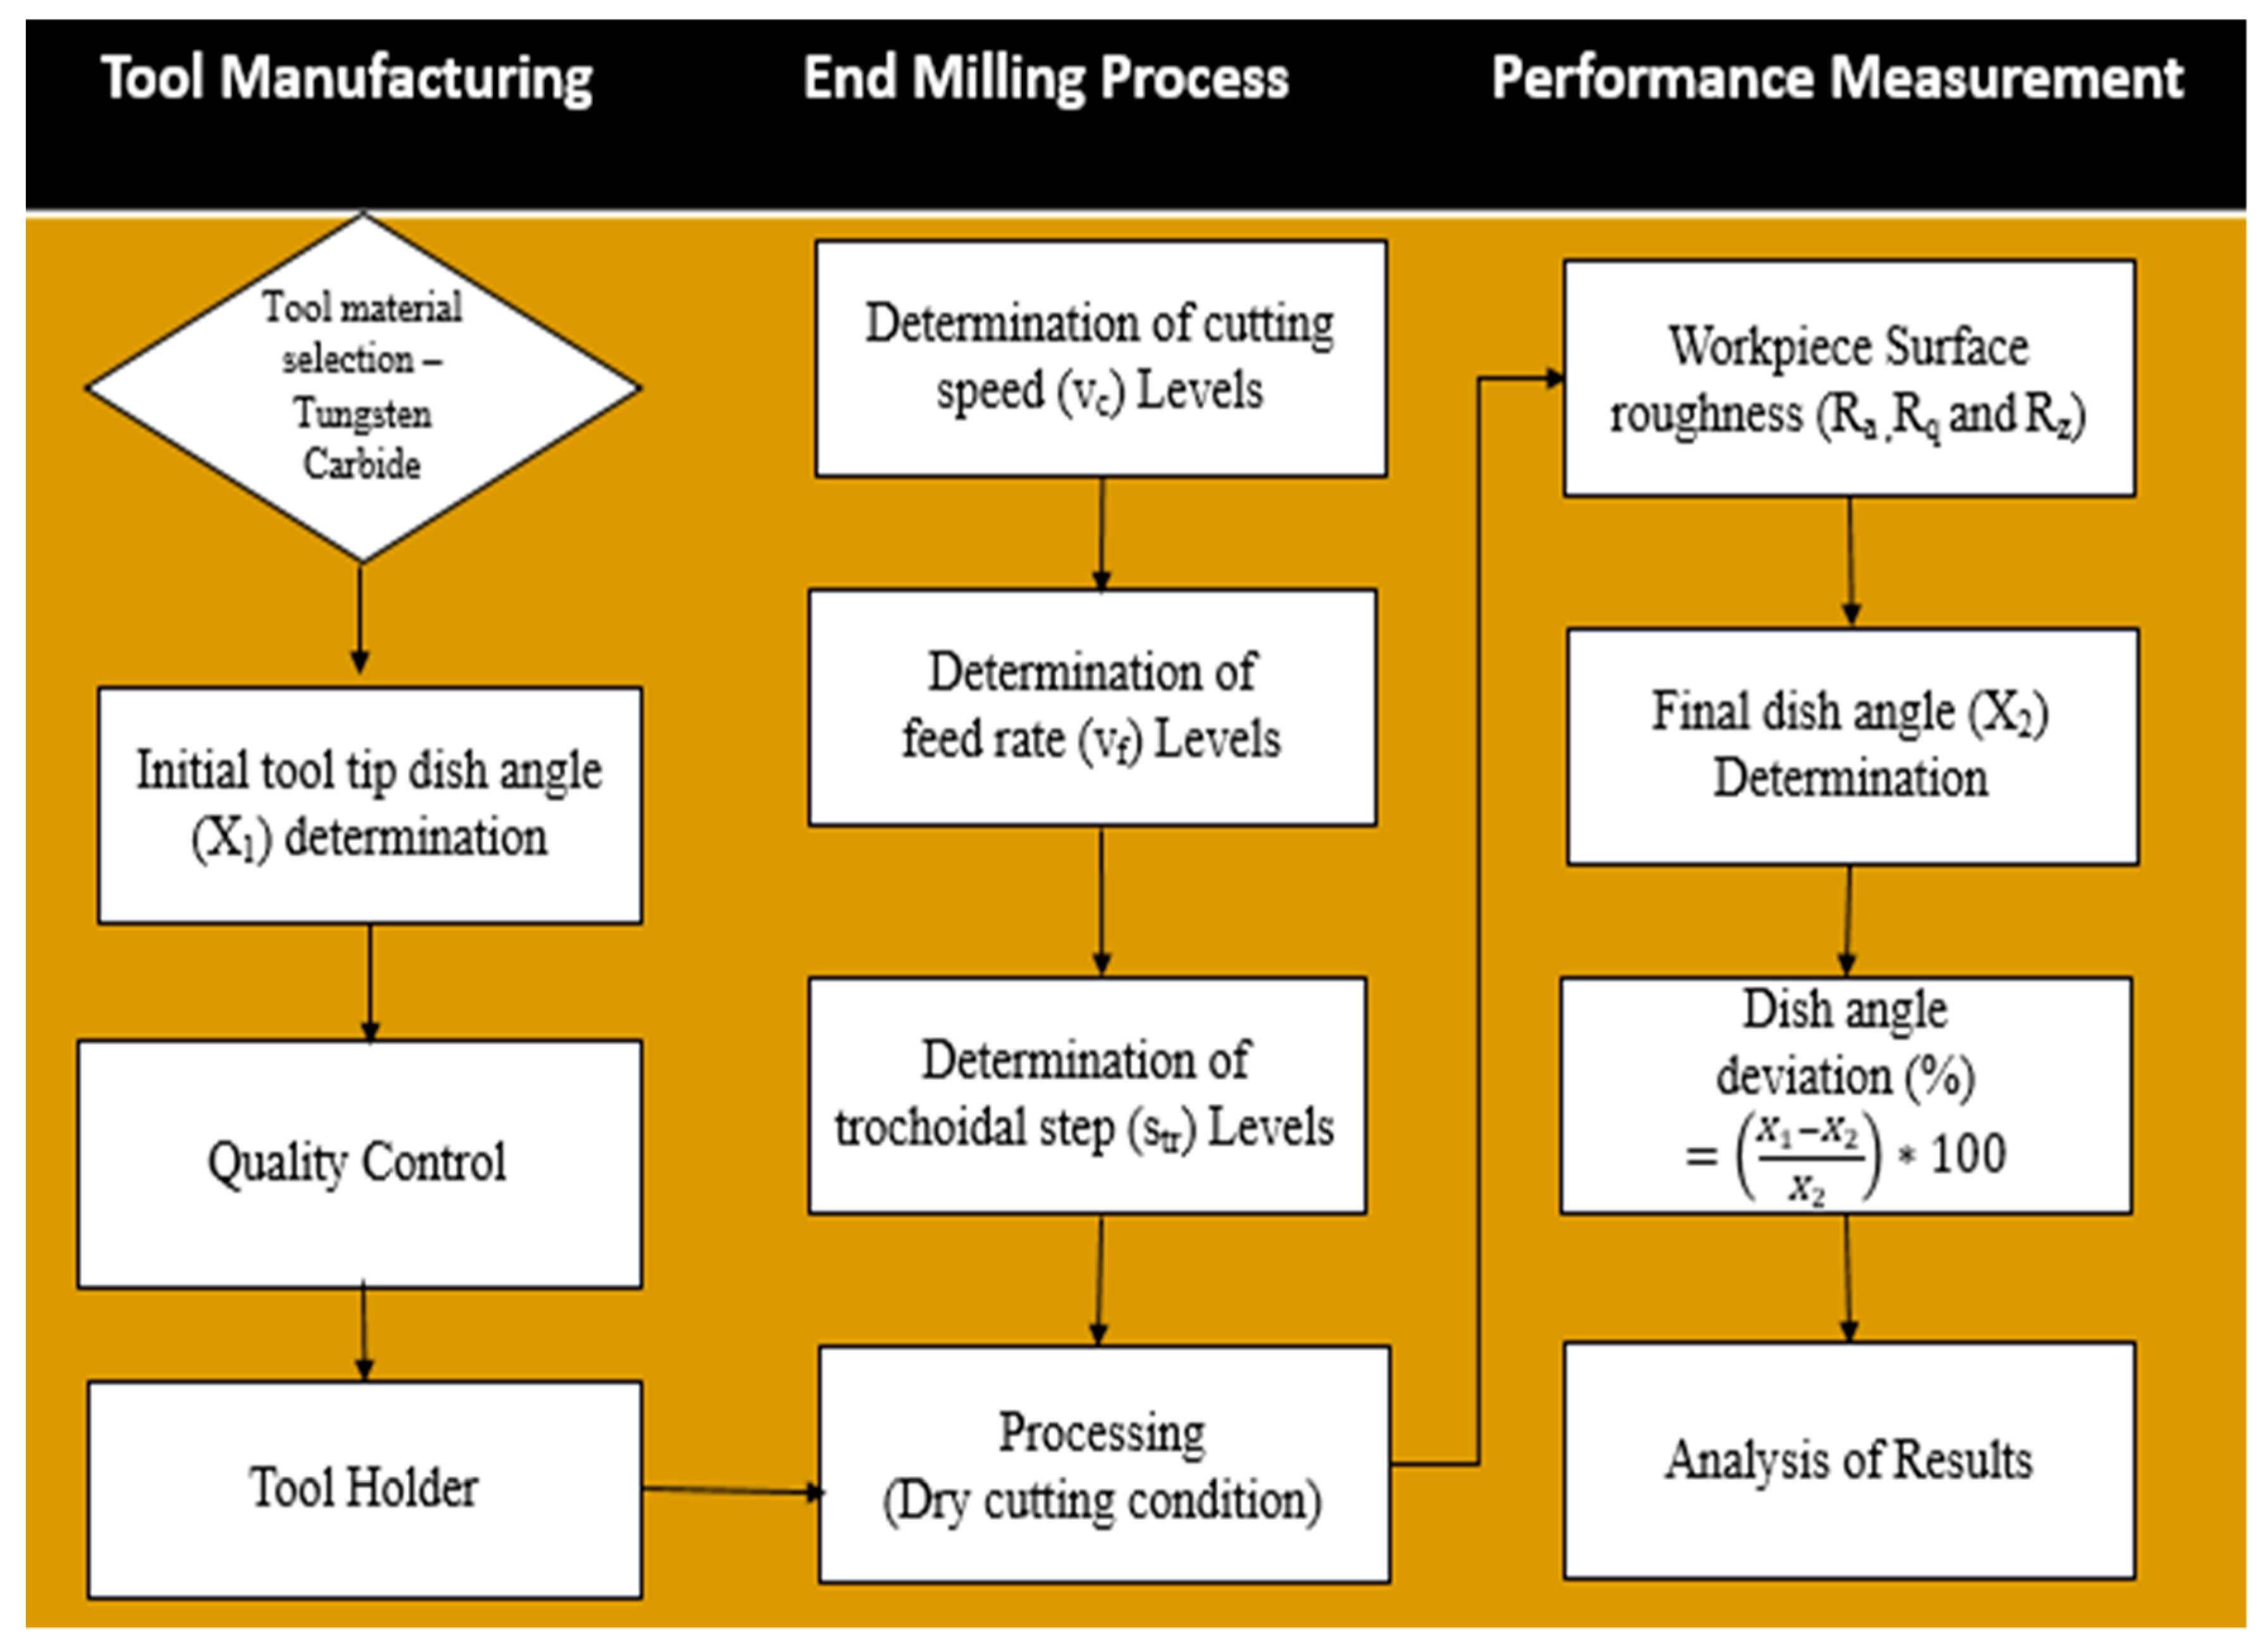
2. Materials and Methods
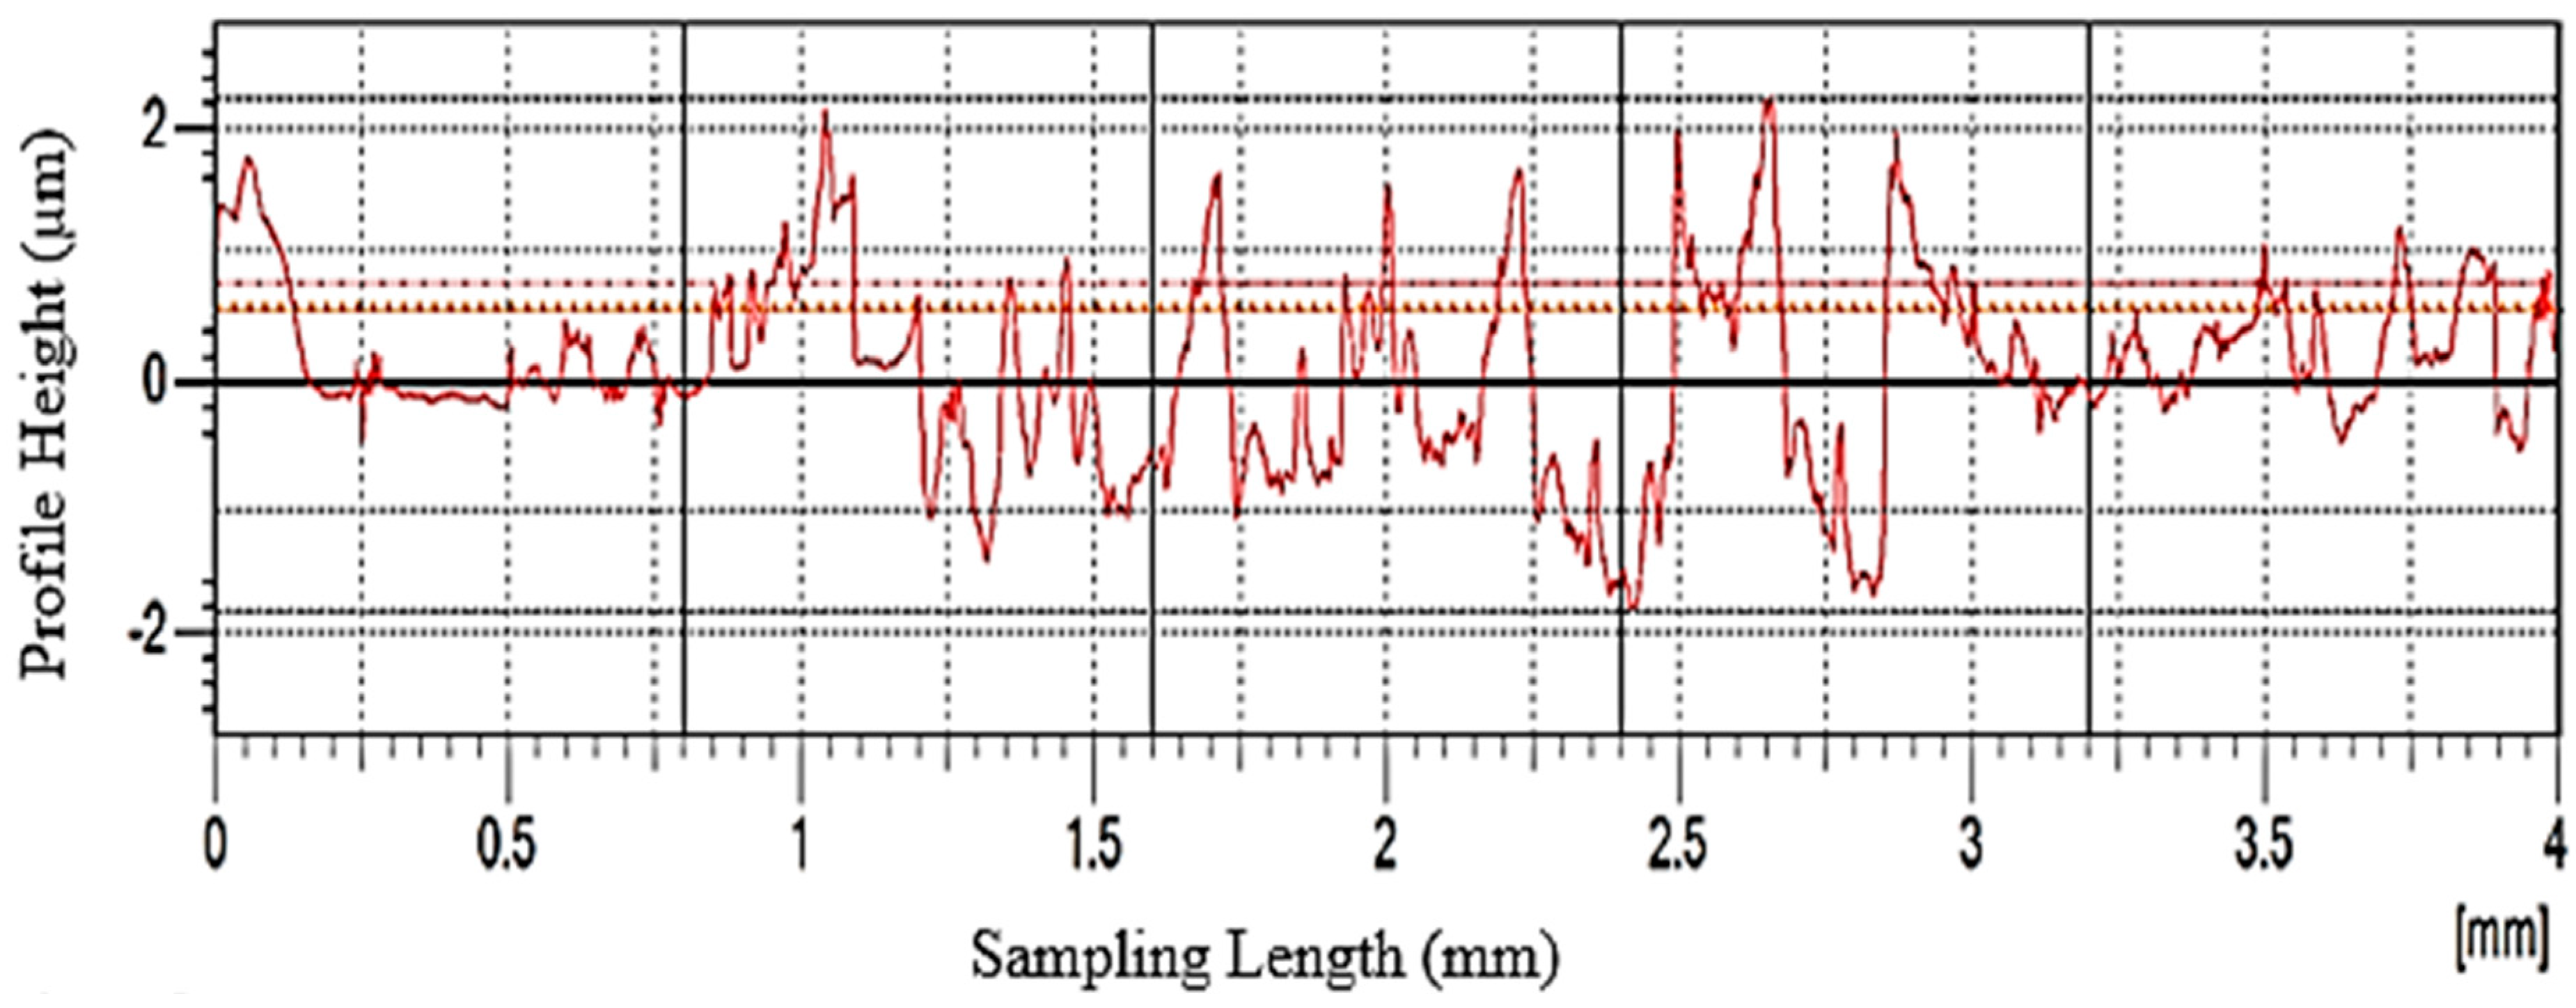
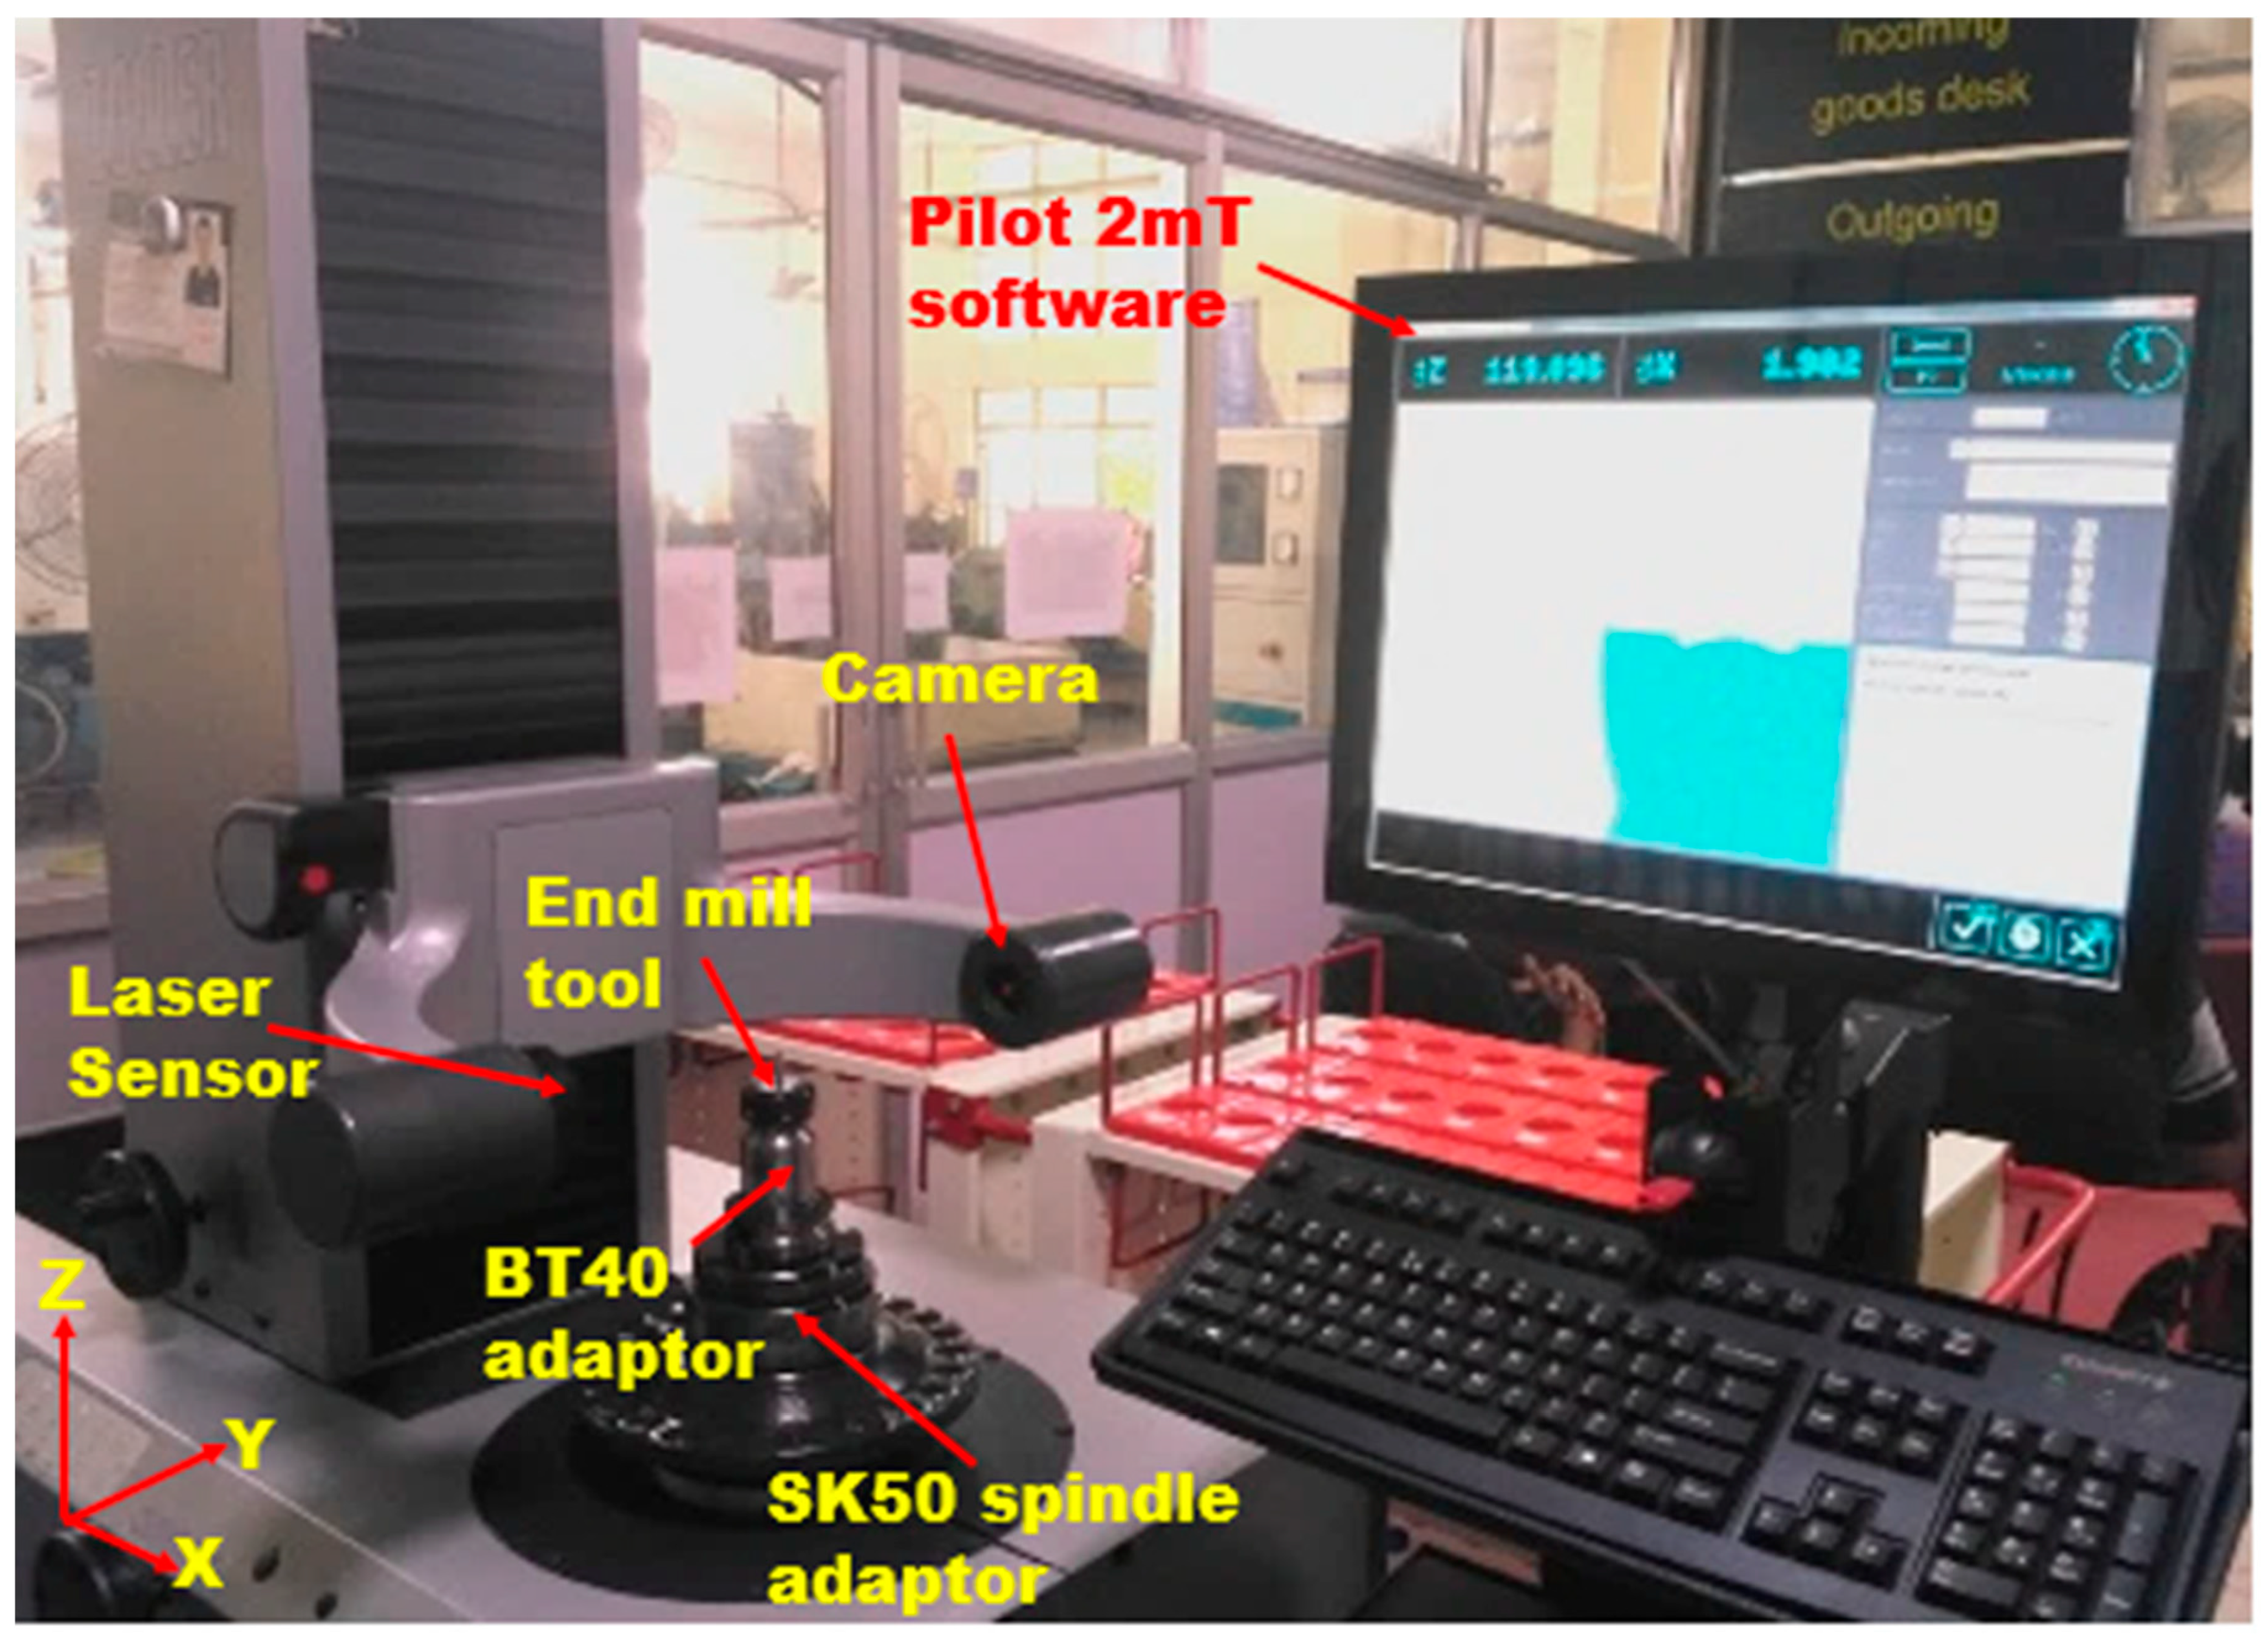
Measurement of Output Responses
3. Response Surface Methodology (RSM) Experimental Design Matrix
3.1. Developing Mathematical Relationships and Regression Analysis
0.0075 × vf × str + 0.0240 × vc2 + 0.0140 × vf2 + 0.0140 × str2
str + 0.0213 × fz × str − 0.0005 × vc 2 − 0.0205 × vf2 − 0.0105 × str2
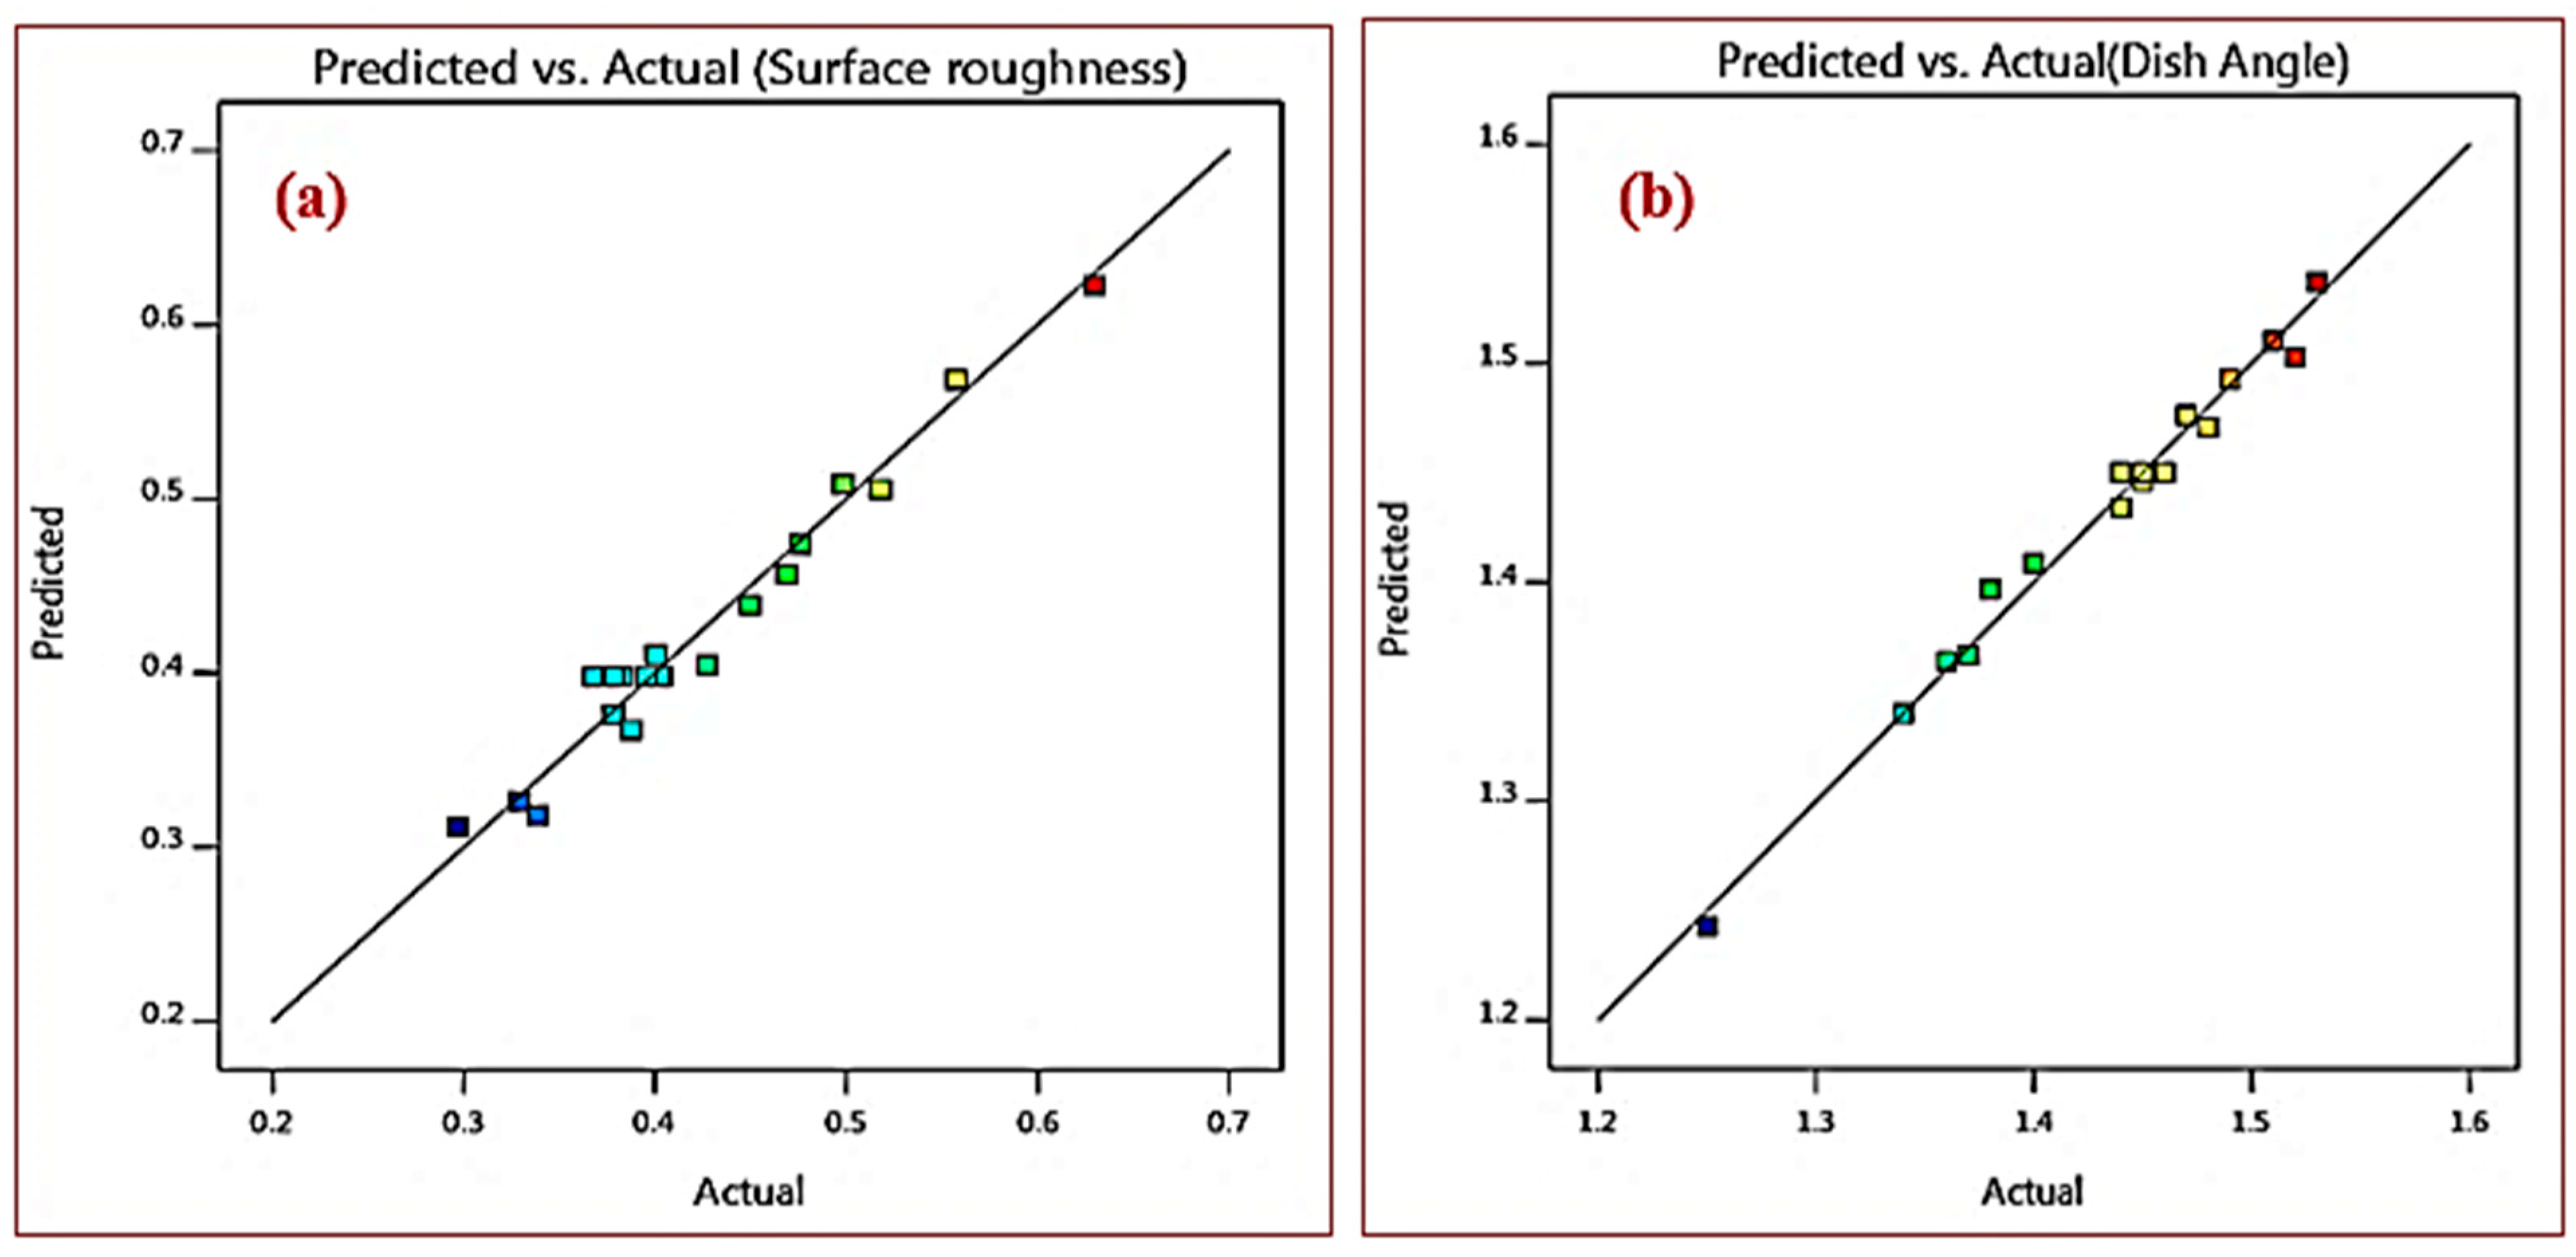
3.2. Evaluating the Correctness of the Empirical Relationship
4. Results and Discussion
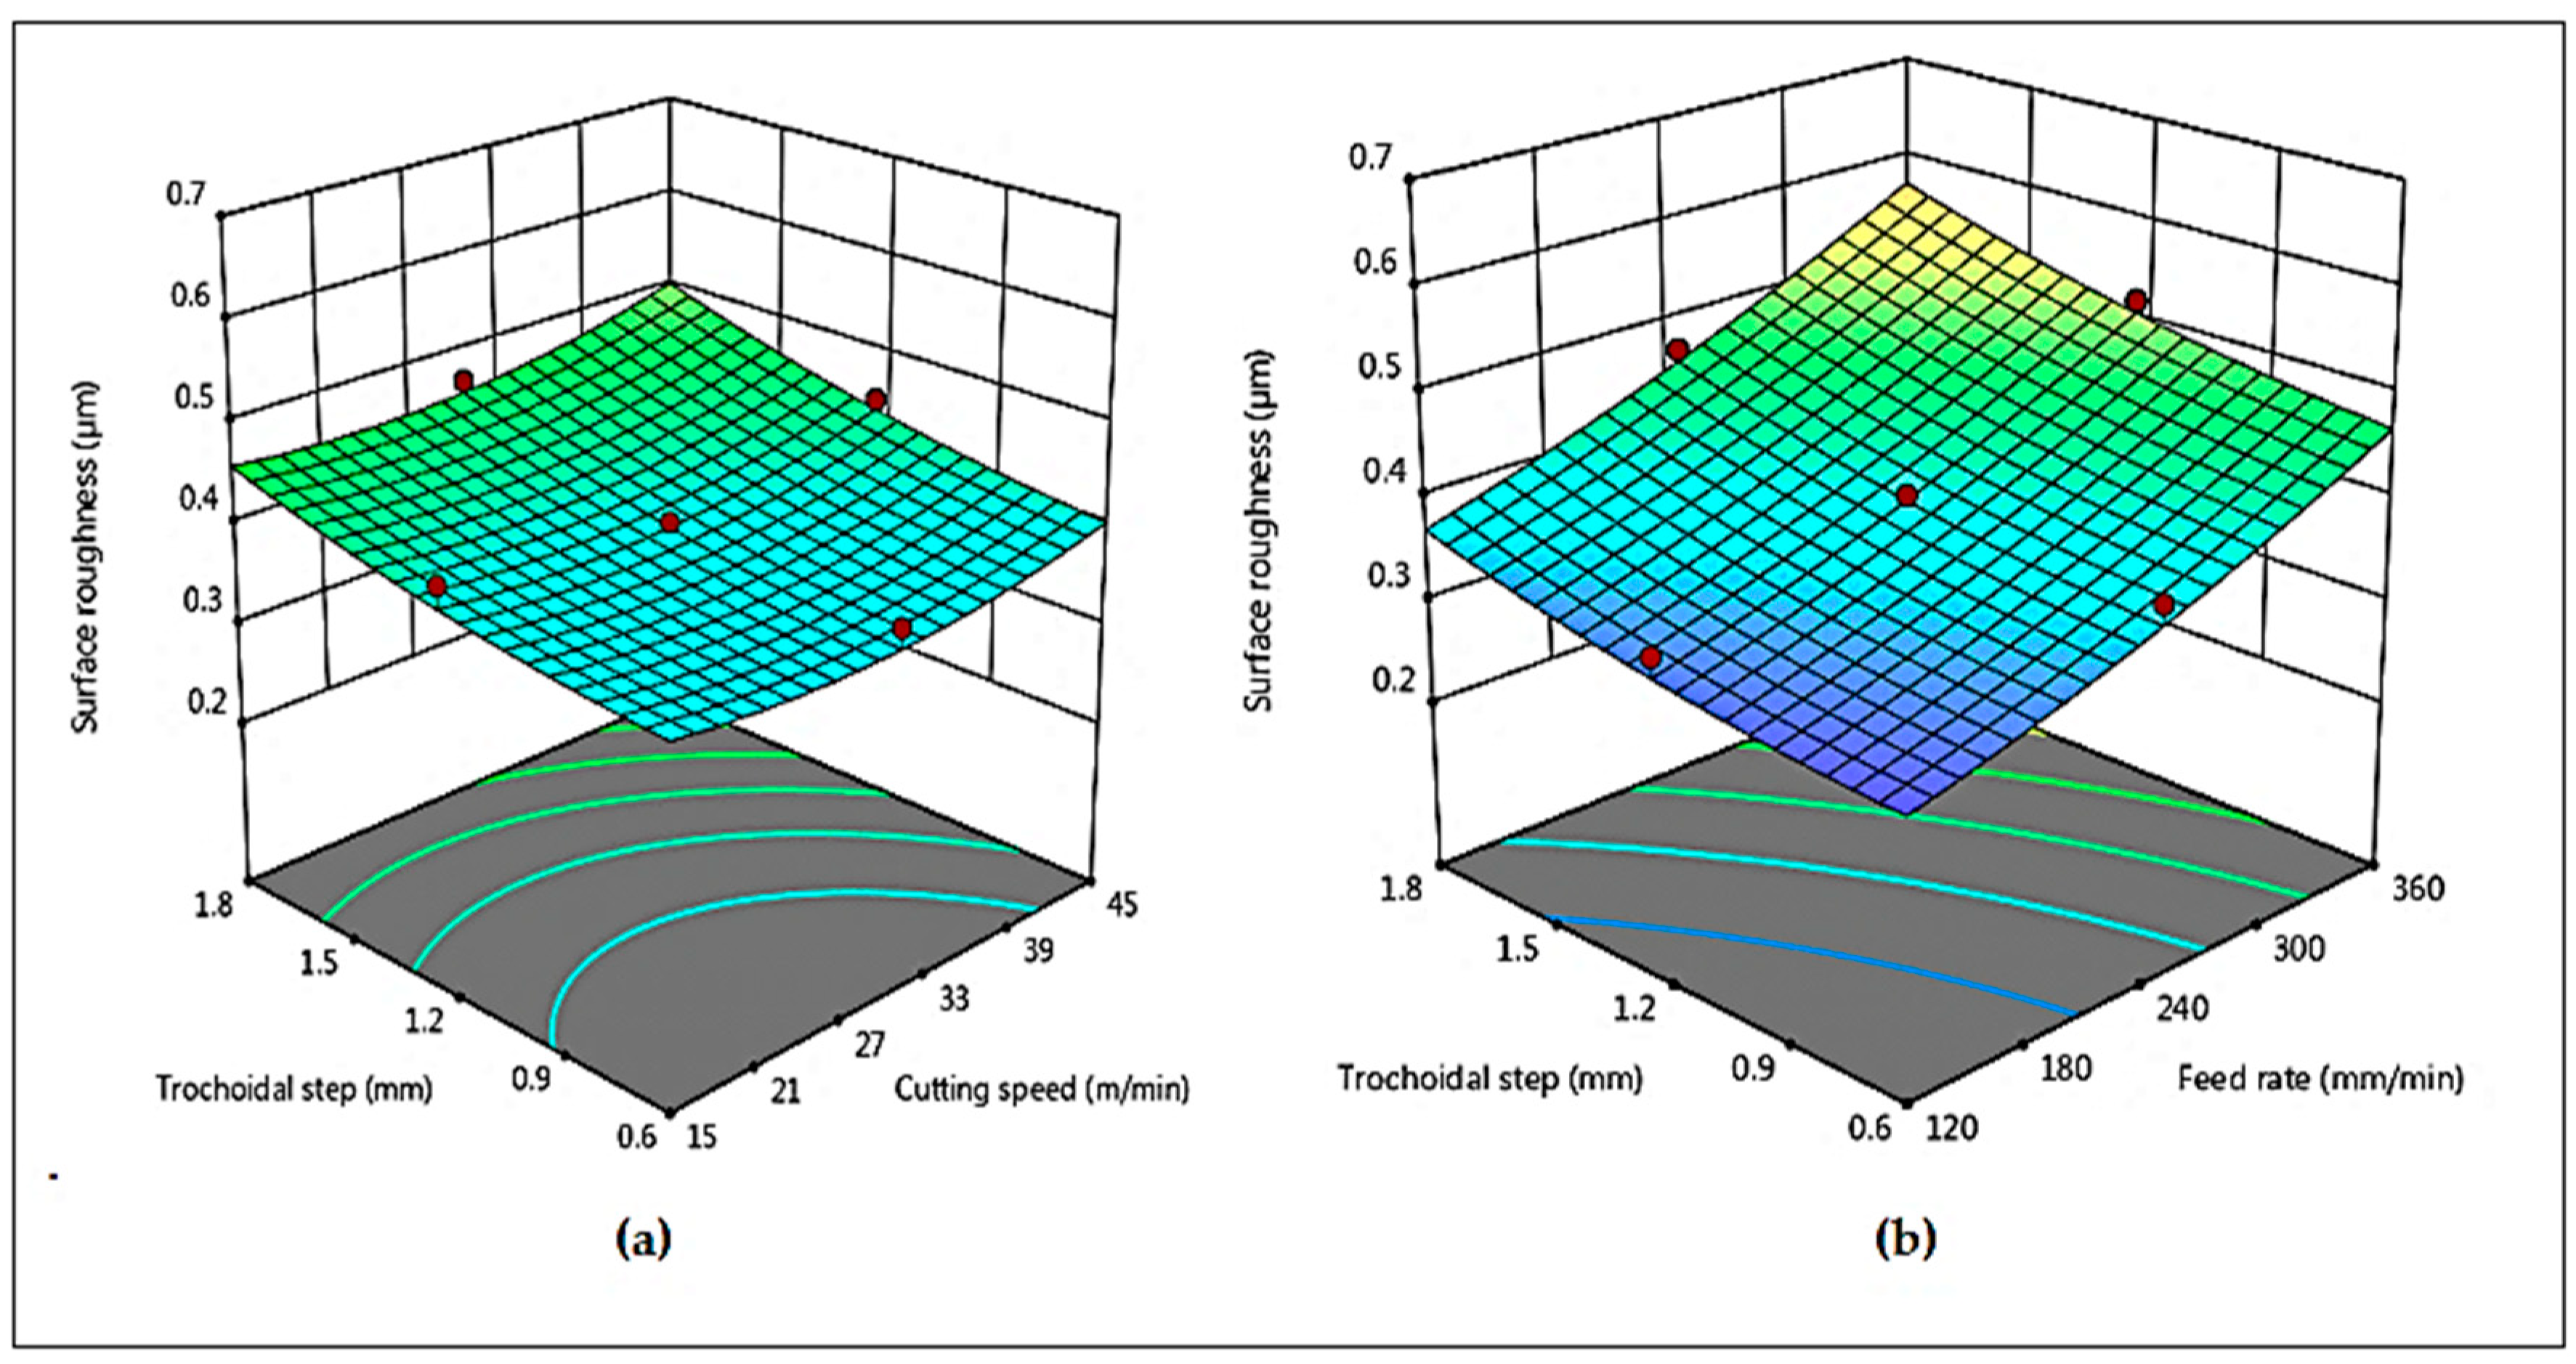
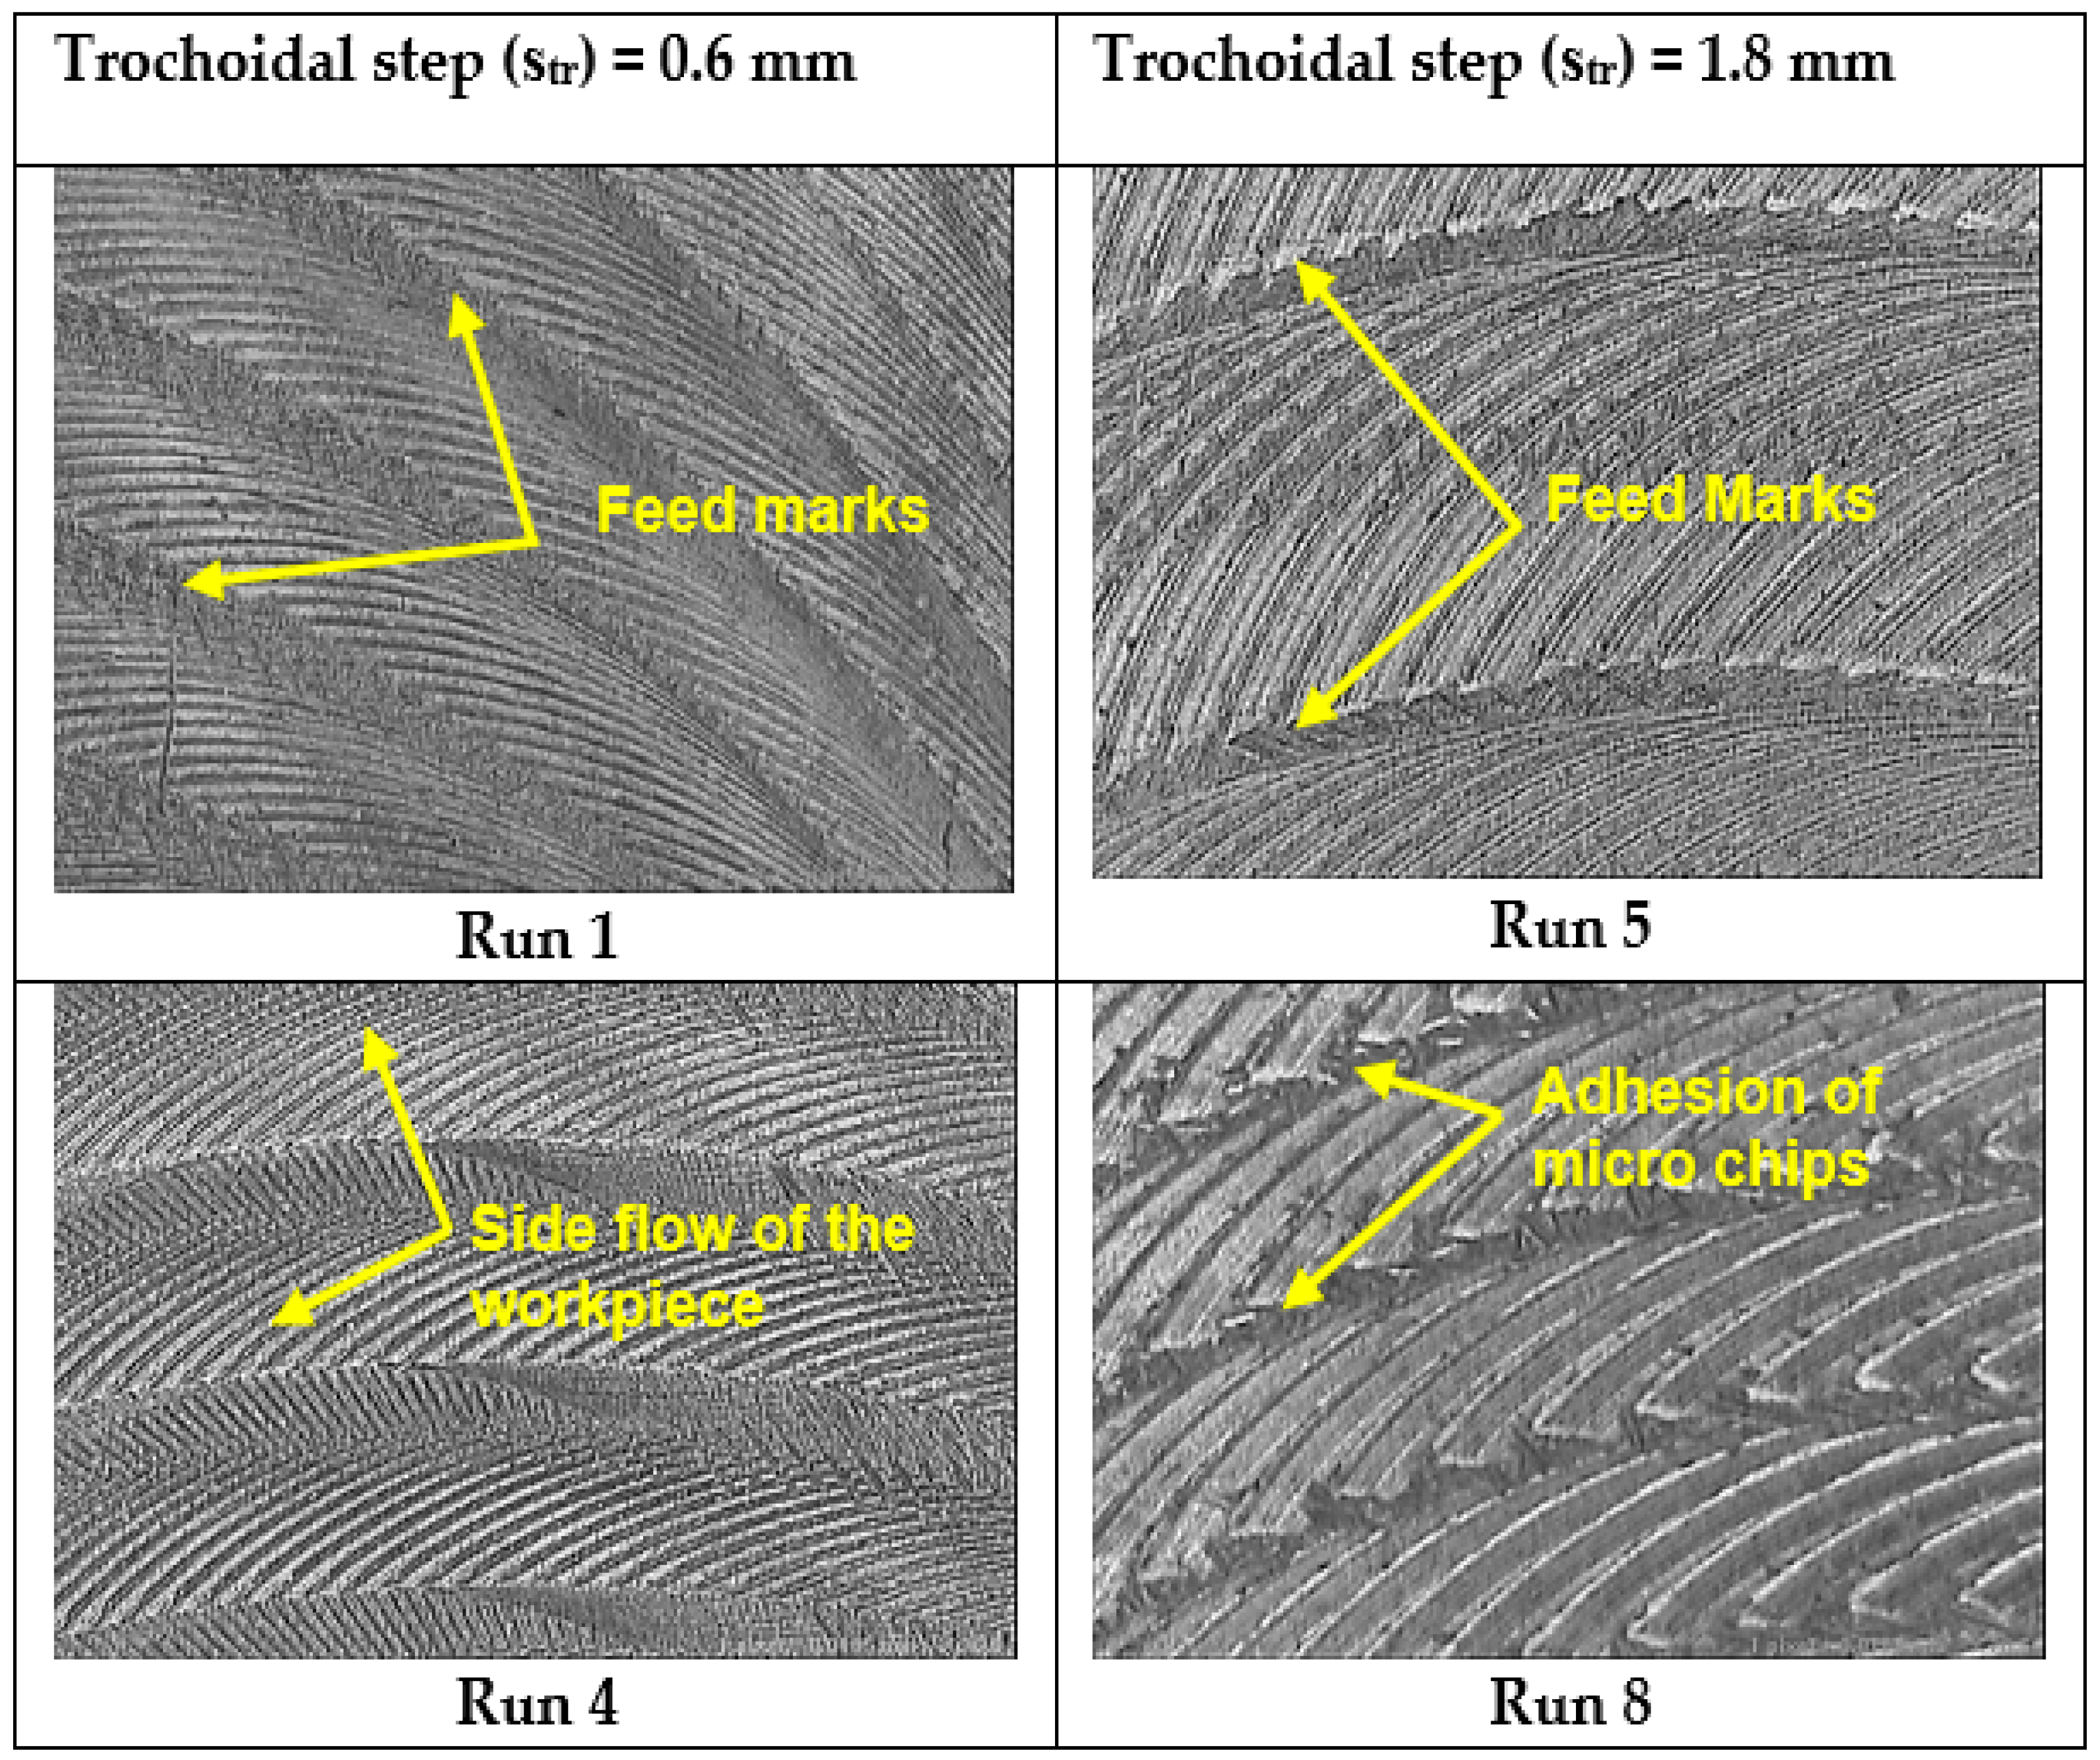
4.1. Effect of Process Parameter on Surface Roughness
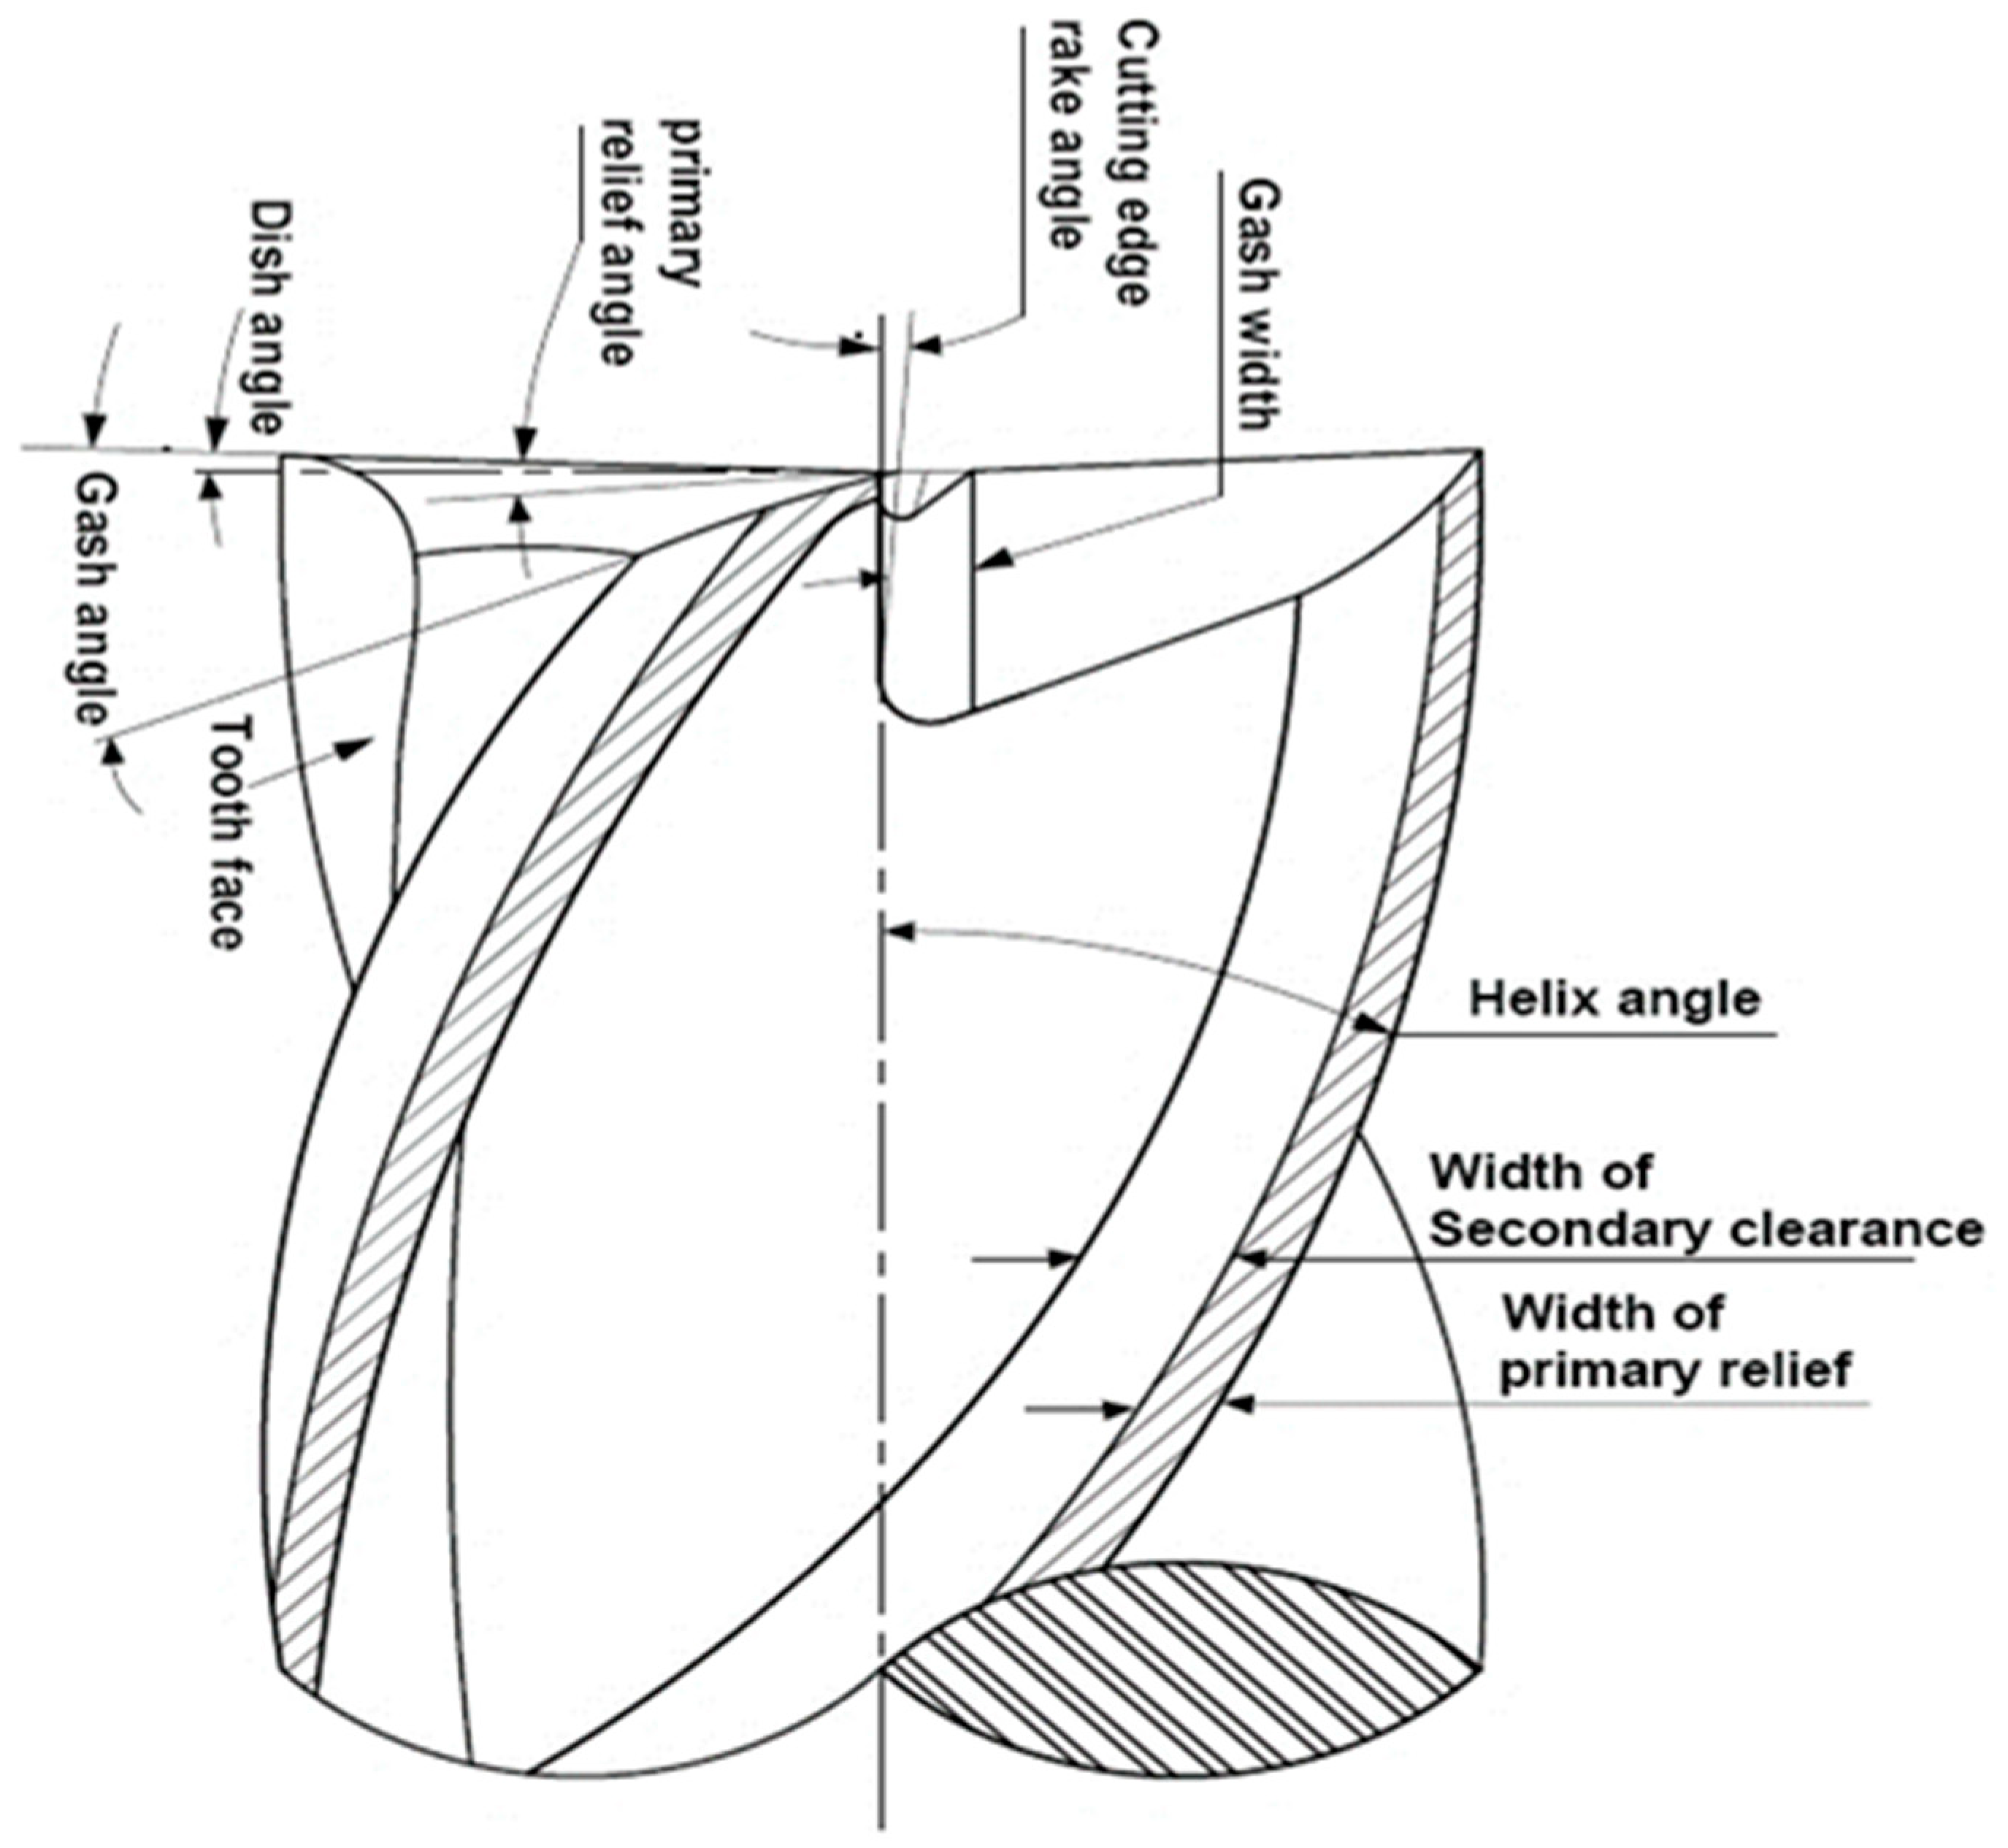
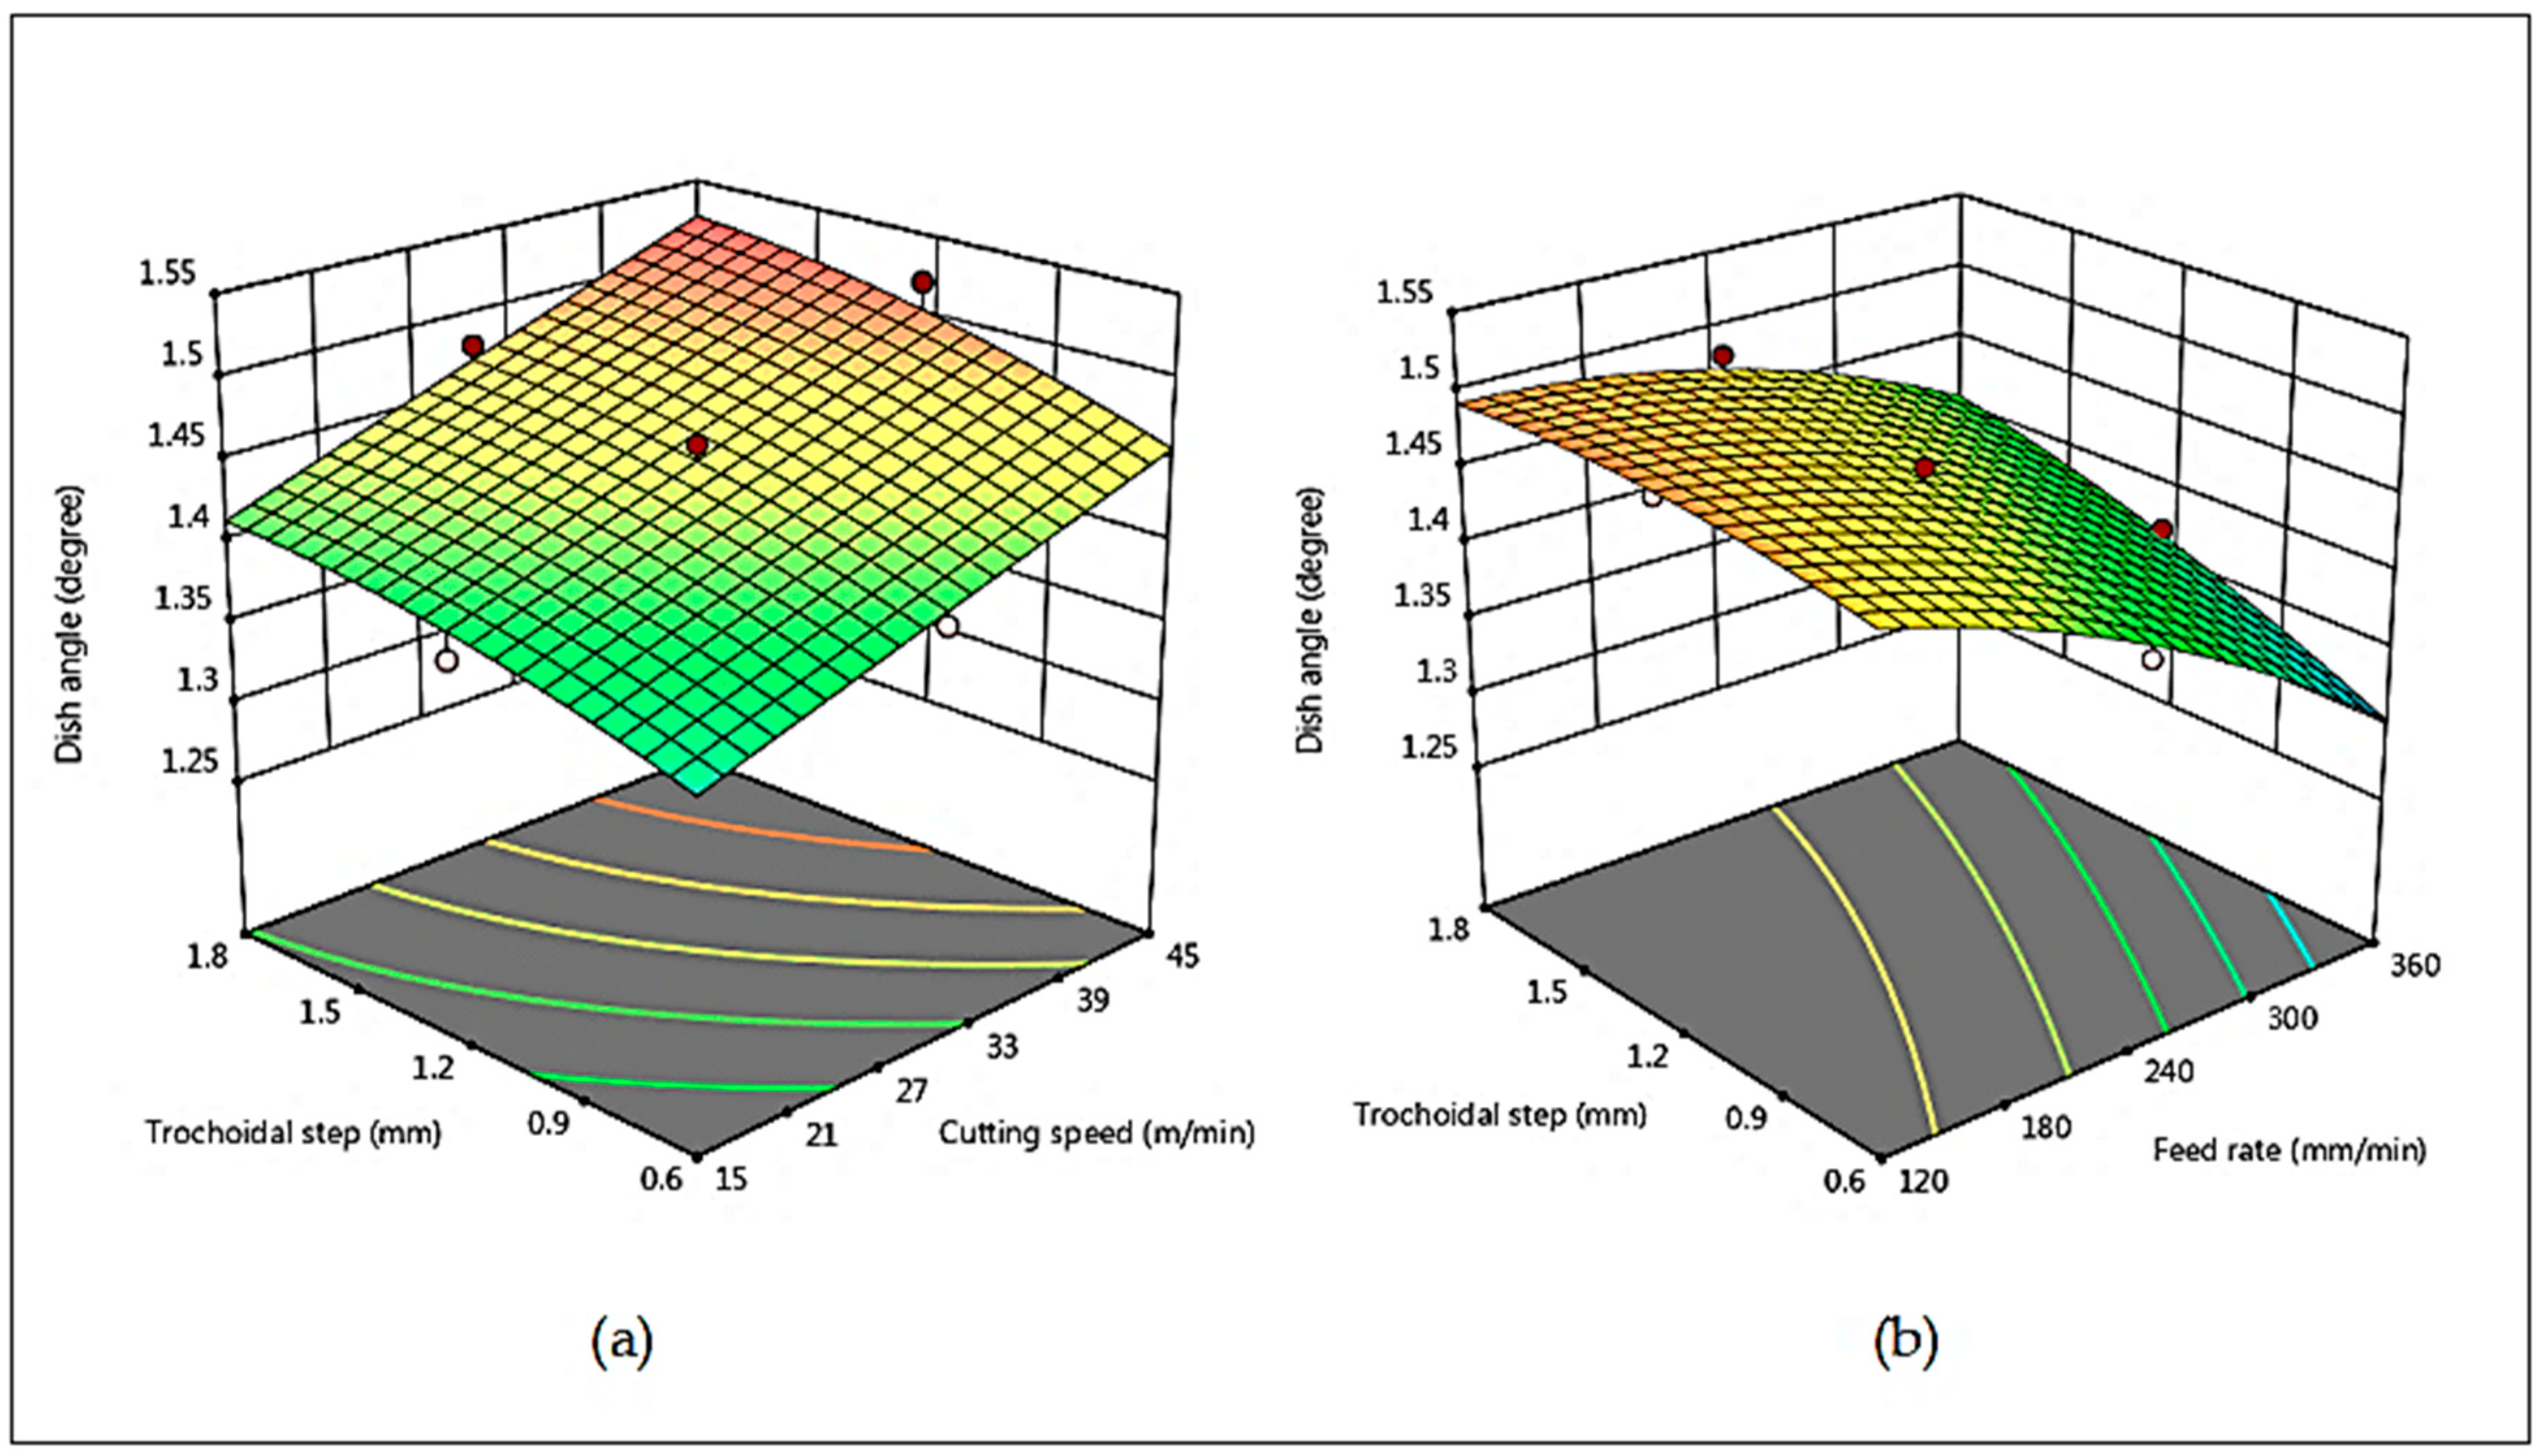
4.2. Effect of Process Parameter on Dish Angle
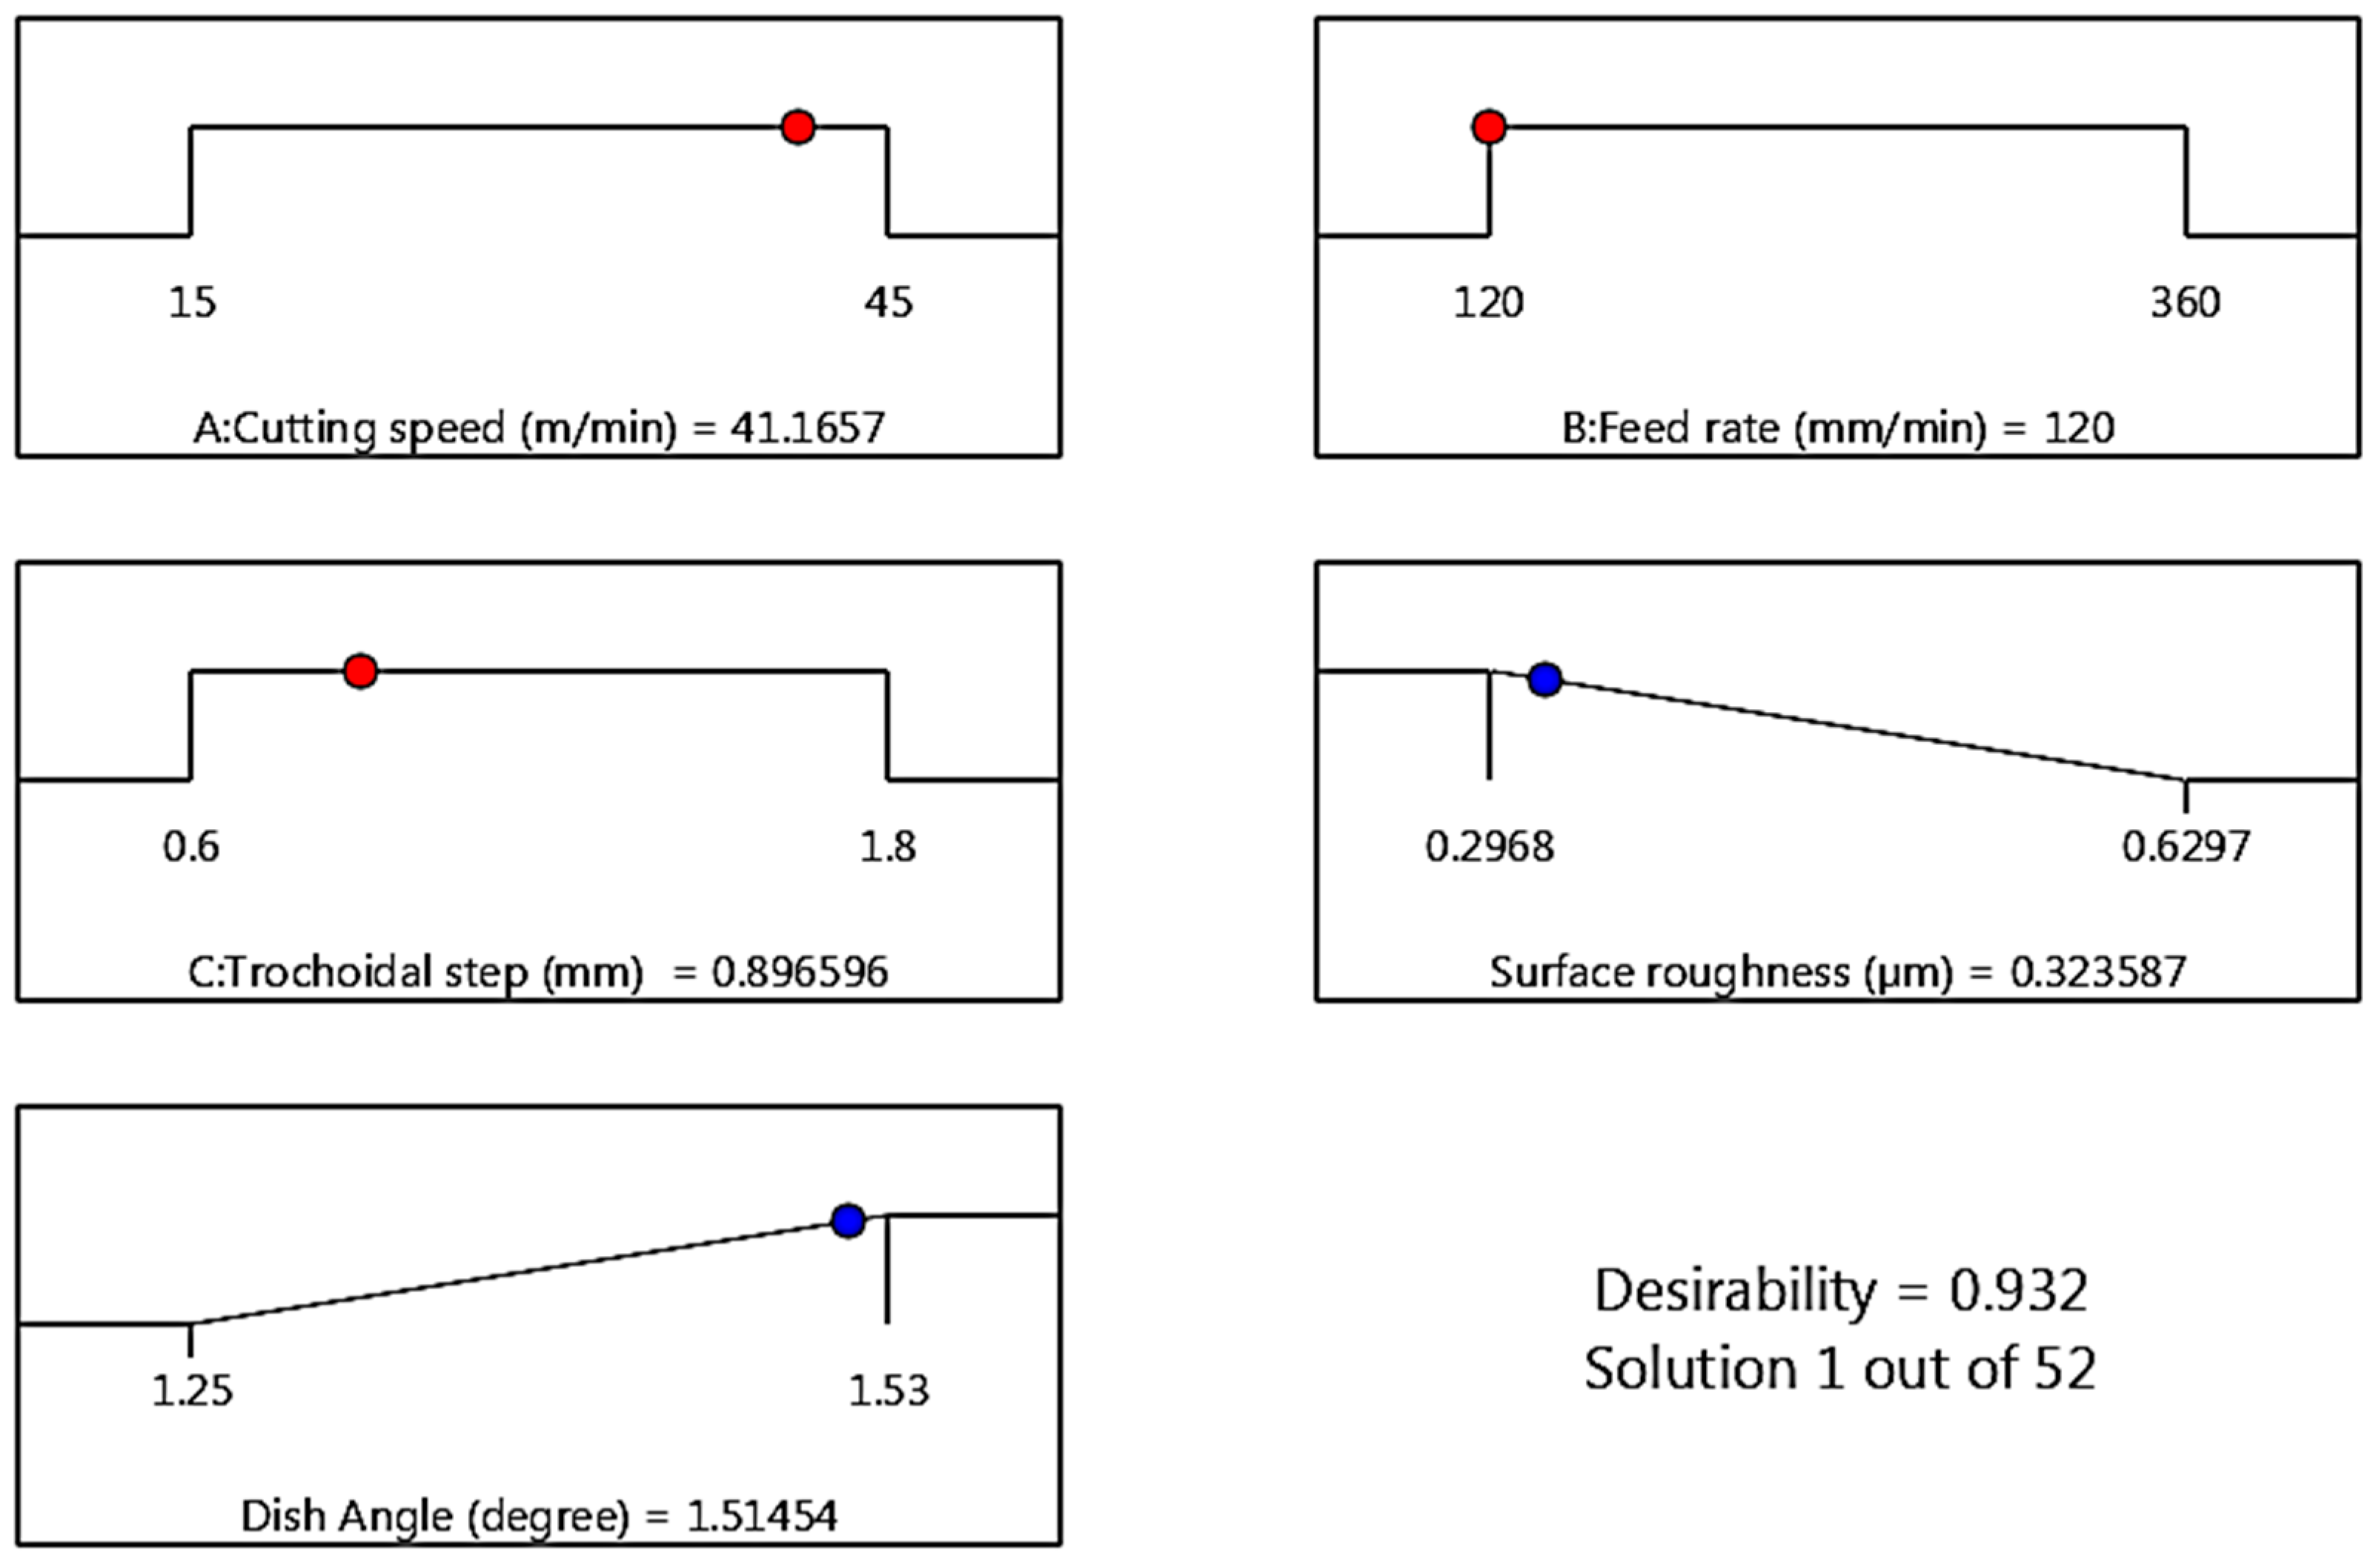
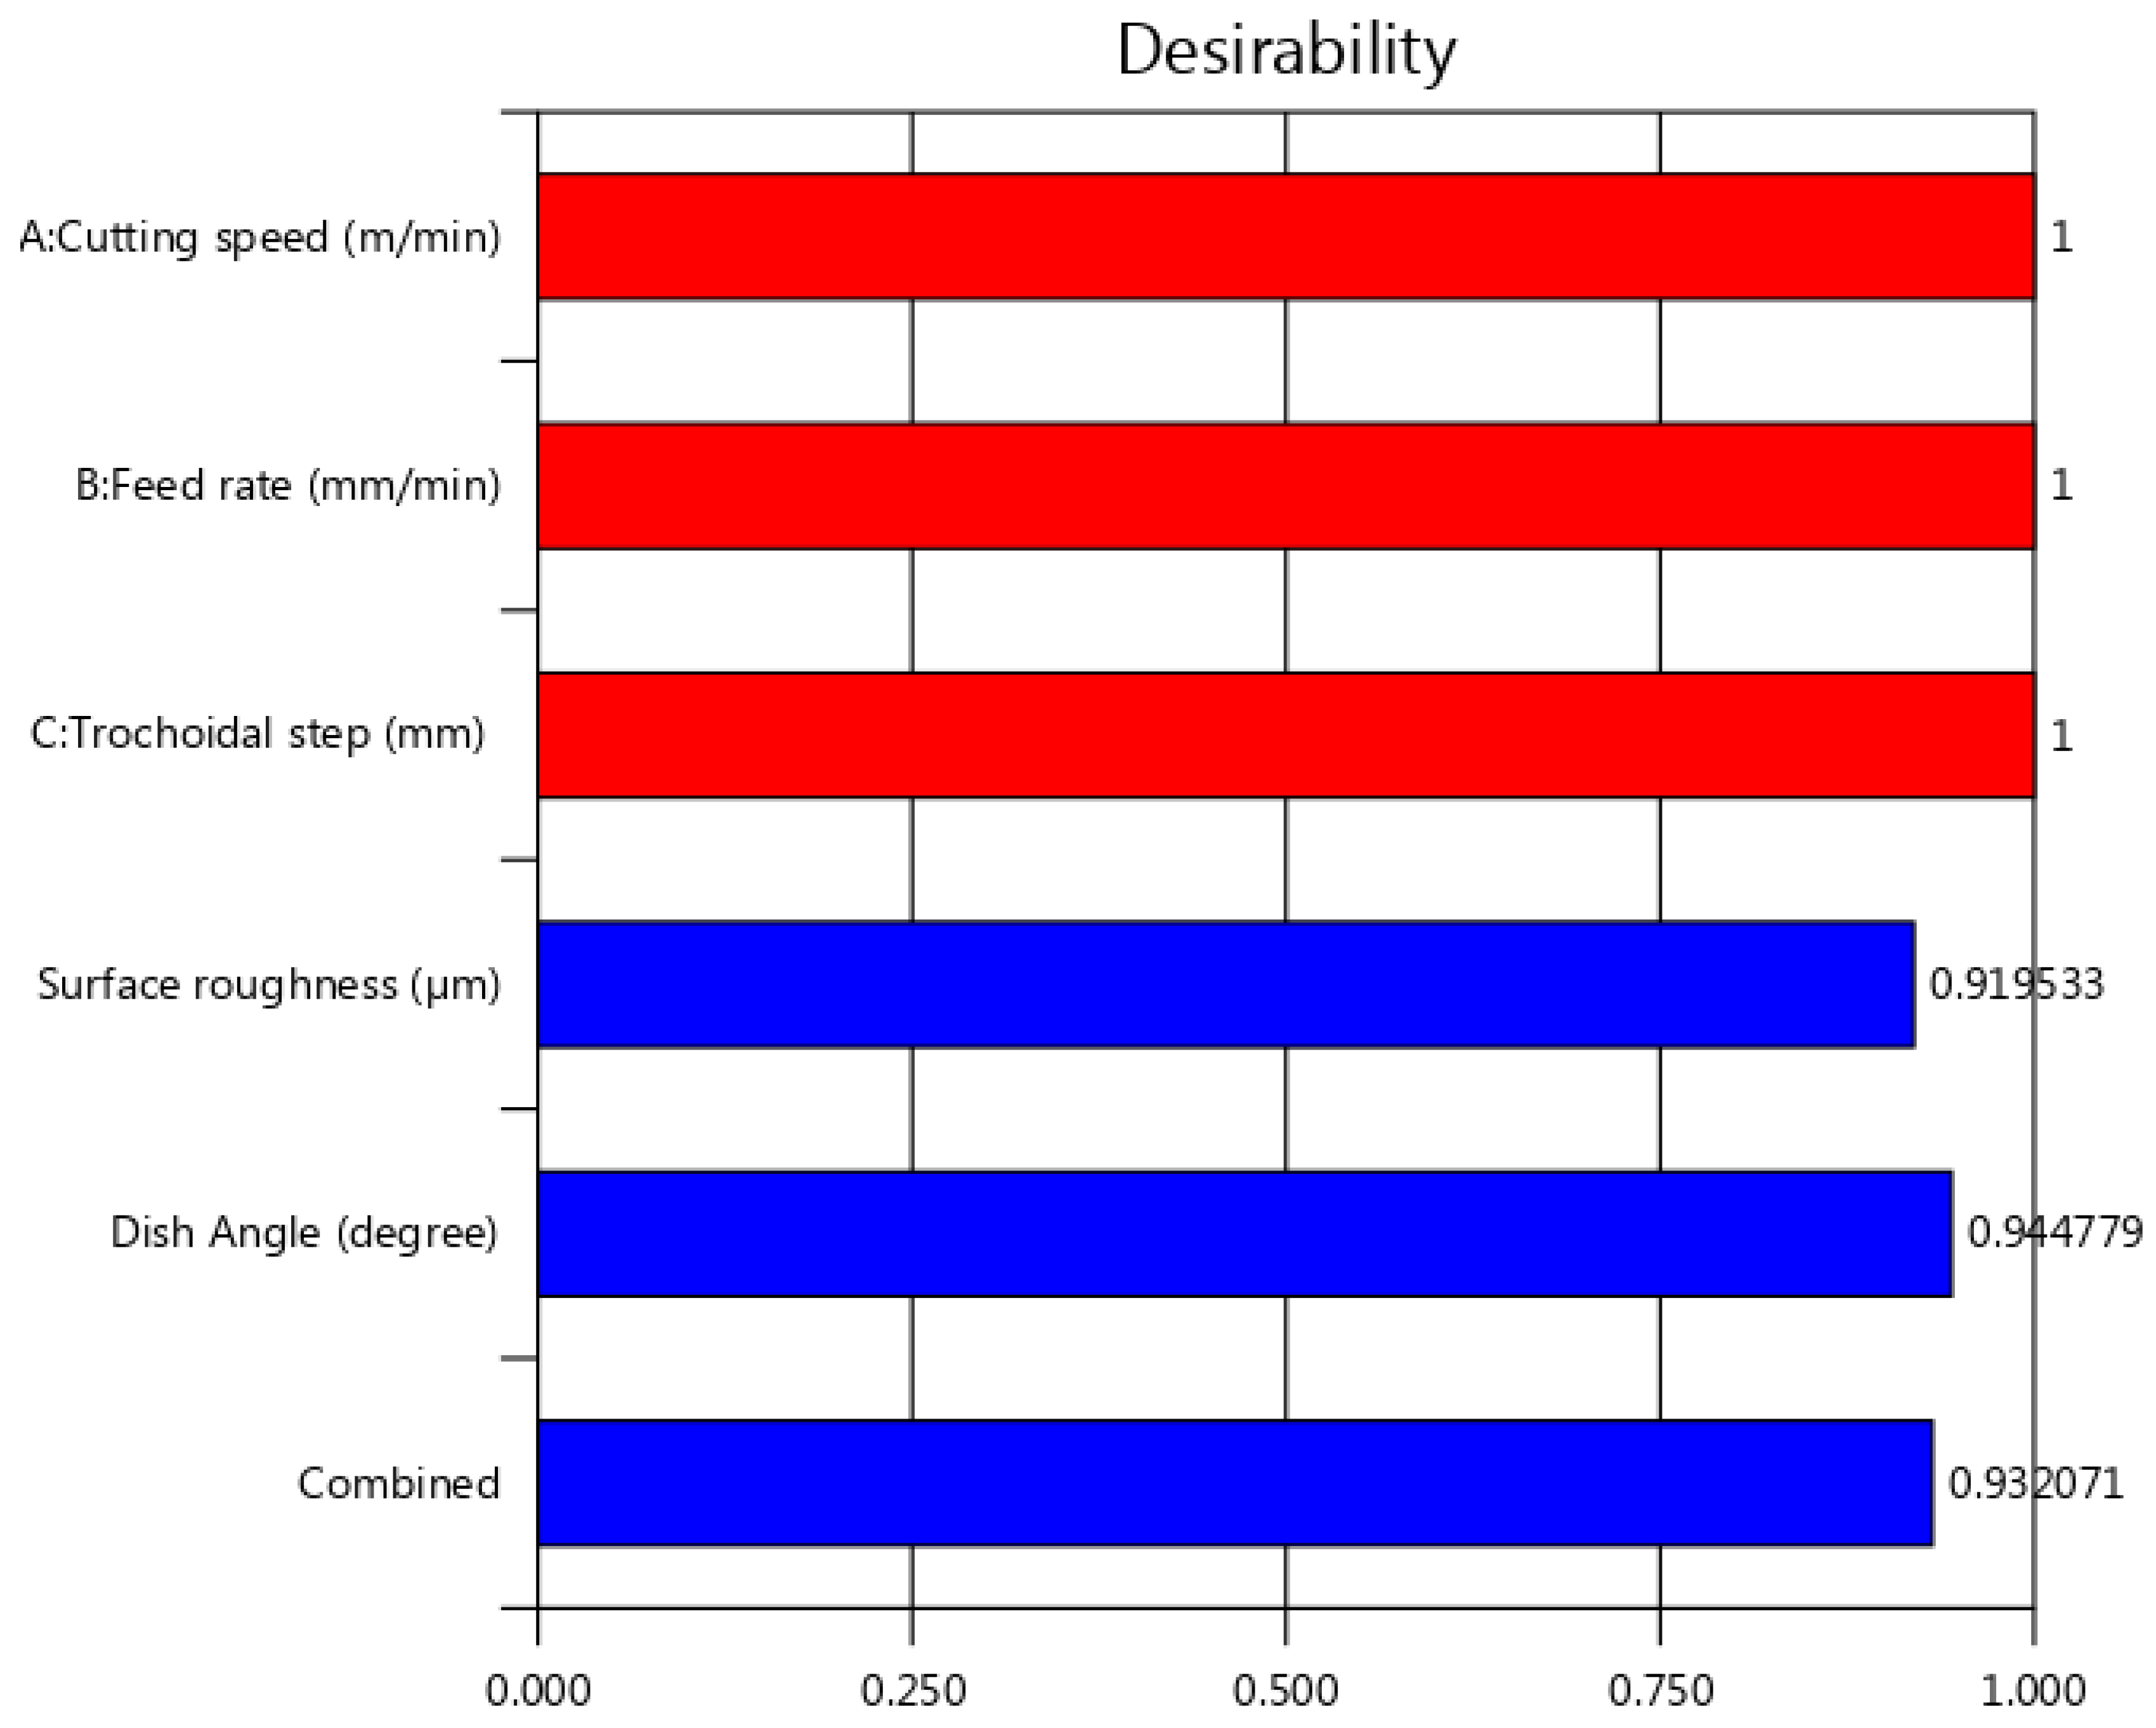
4.3. Multi Objective Optimization
5. Conclusions
- The developed mathematical modeling relationships of surface roughness and dish angle agreed well with the experimental results, since the error between the experimental and predicted value is within 6.10%, and 1.33%, respectively. The high rating of determination coefficients (R2) value prove their credibility.
- The ANOVA studies substantiate that the most influence process parameter affecting the surface roughness is feed rate and trochoidal step, and the parameter dish angle is influenced by all the three-input parameters based on F-ratio value.
- The formation of laces and adhesion of microchips on the machined surface leads to decrease the surface finish.
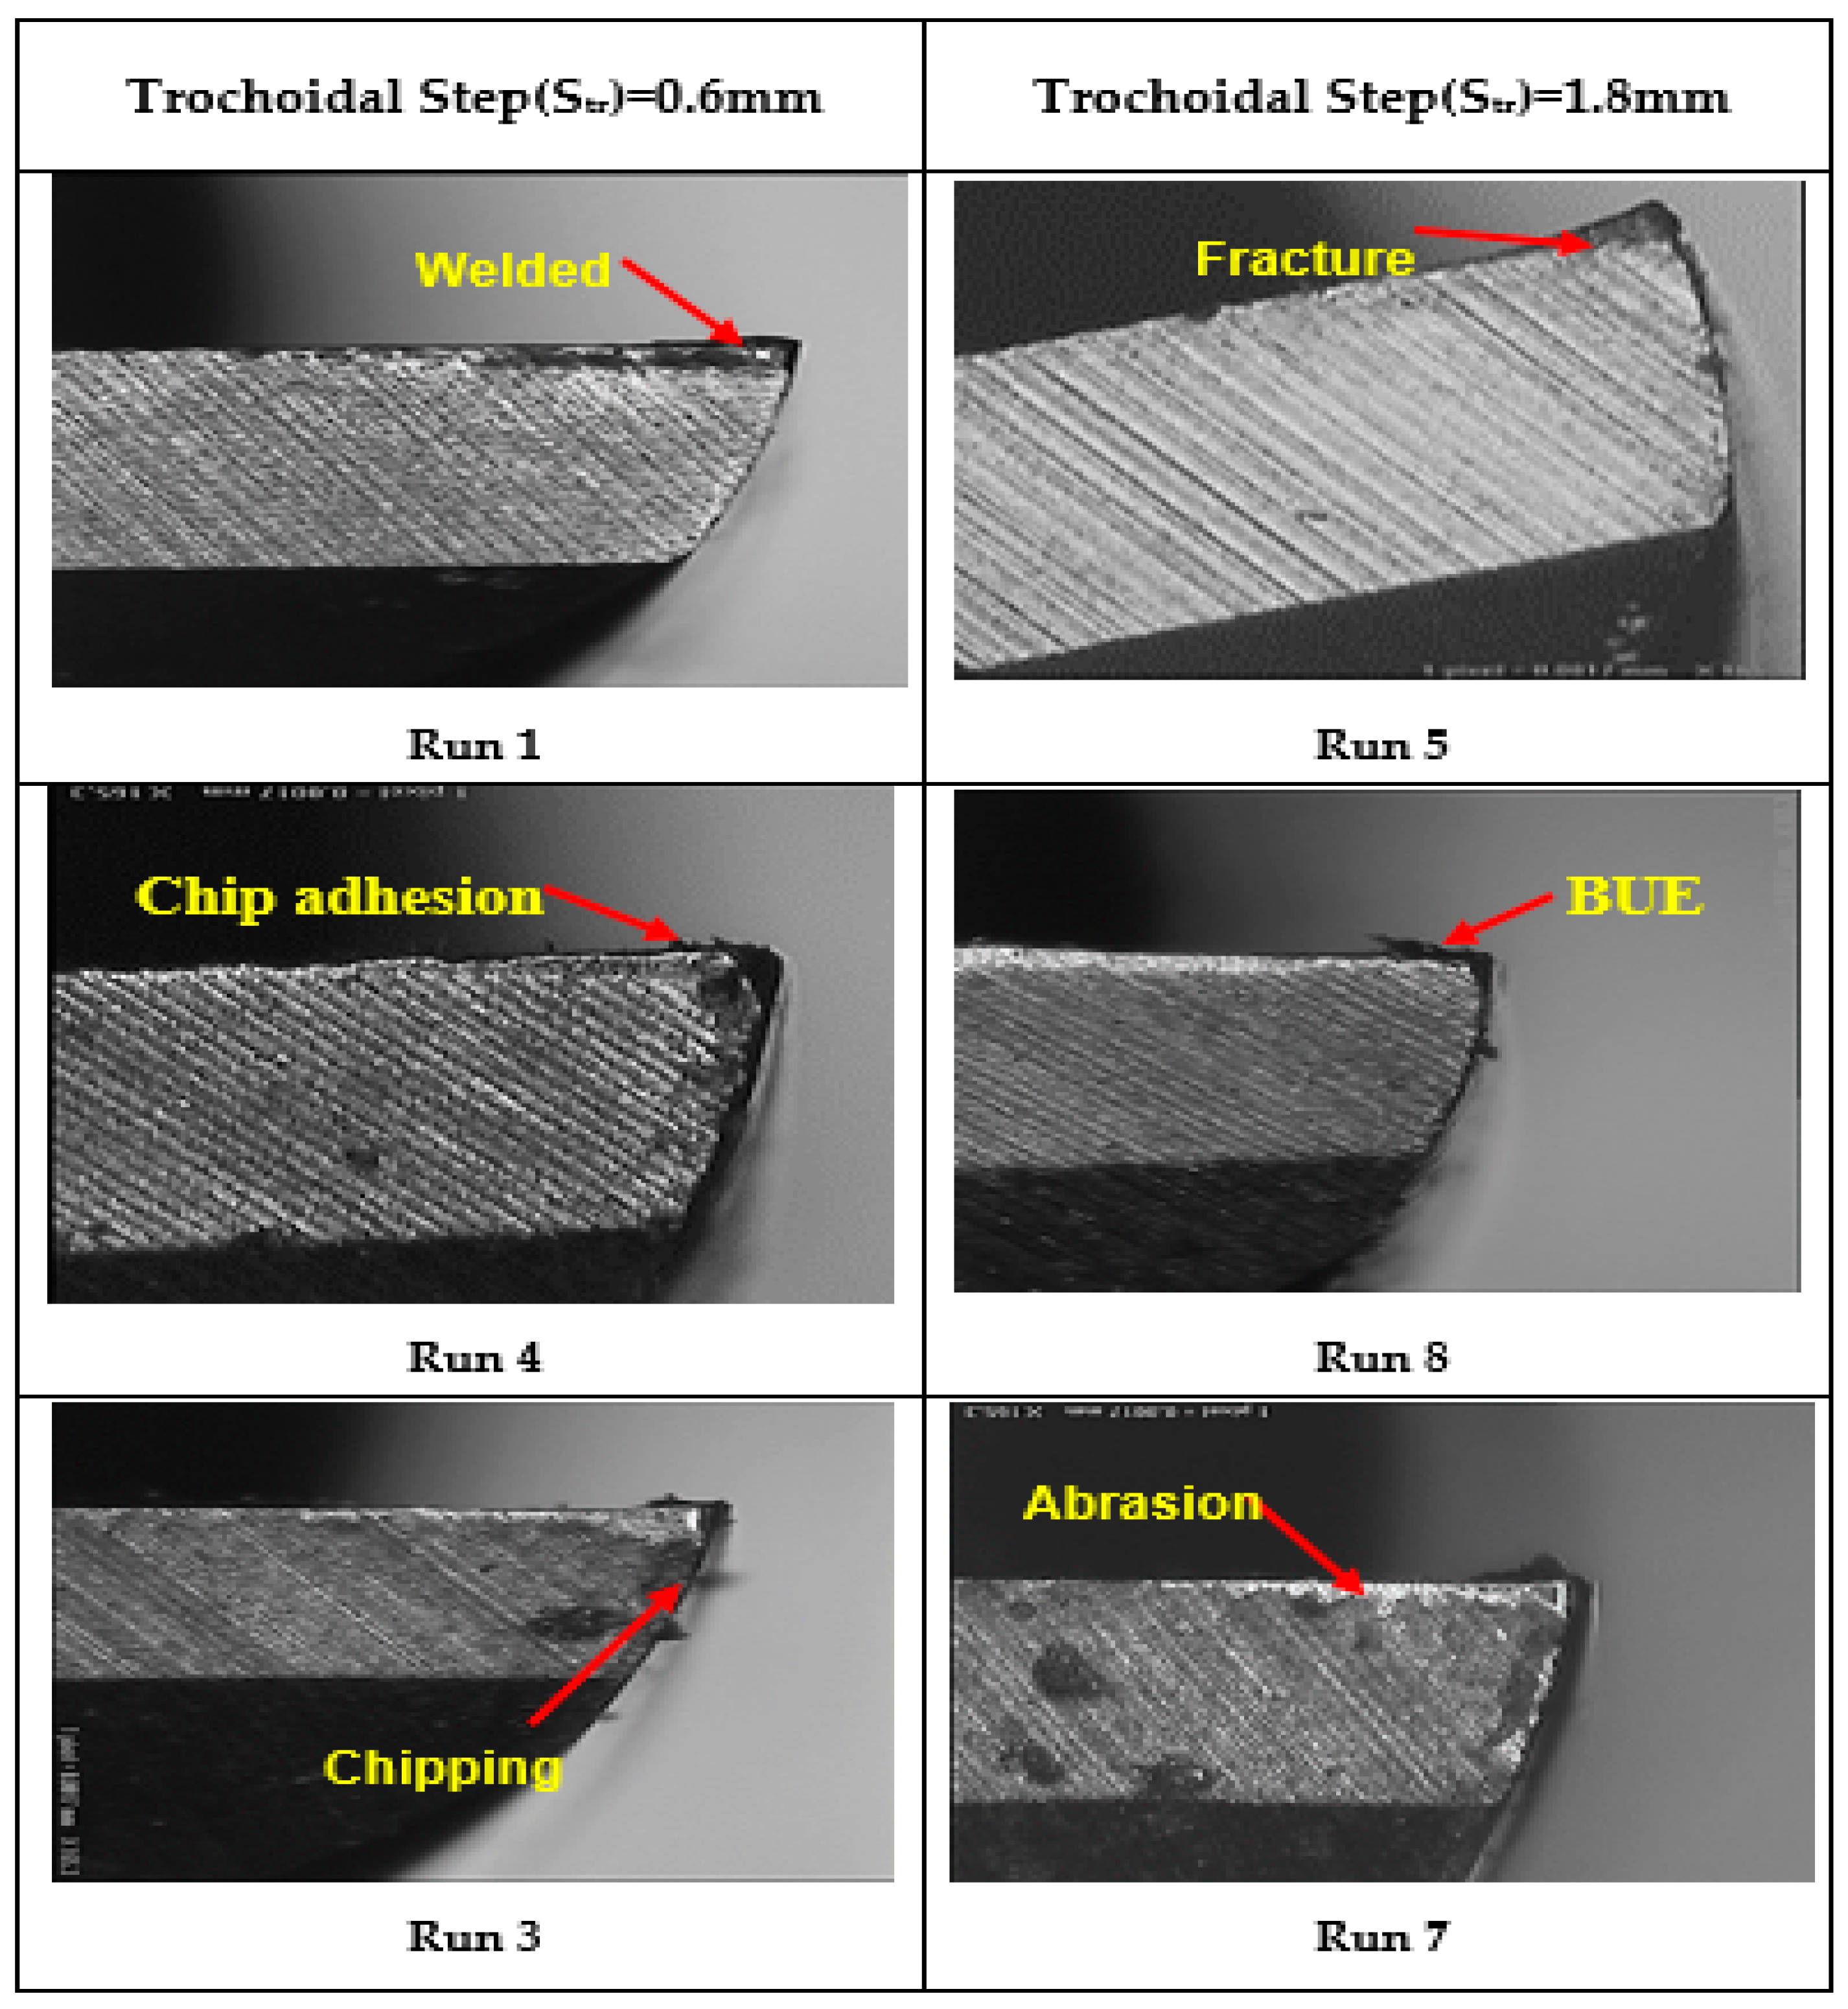
- From the tool wear studies determined by the vision measurement system, it was concluded that the built-up-edge, chipping, abrasion and fracture leads to reduction in the dish angle. It was also concluded that the higher dish angle deviation was observed at a lower cutting speed, lower trochoidal step and higher feed rate.
- Desirability based multi-objective optimization approach revealed that an optimum process parameter setting of 41m/min of vc, 210 mm/min of vf and 0.9mm of str. It is summarized that the decrease in feed rate with increase in cutting speed and trochoidal step improve the output quality characteristics.
Author Contributions
Funding
Acknowledgments
Conflicts of Interest
Abbreviations
| Notation | |
| AISI | American Iron & Steel Institute |
| ANOVA | Analysis of variance |
| HRC | Hardness measured with the Rockwell test for hard materials |
| CAM | Computer aided manufacture |
| RSM | Response surface methodology |
| BUE | Built up edge |
| CCD | Central composite design |
| MRR | Material removal rate |
| SS | Sum of Squares |
| MS | Mean Square Symbols |
| VMS | Vision measuring system |
| d.f | Degree of freedom |
| Symbol | |
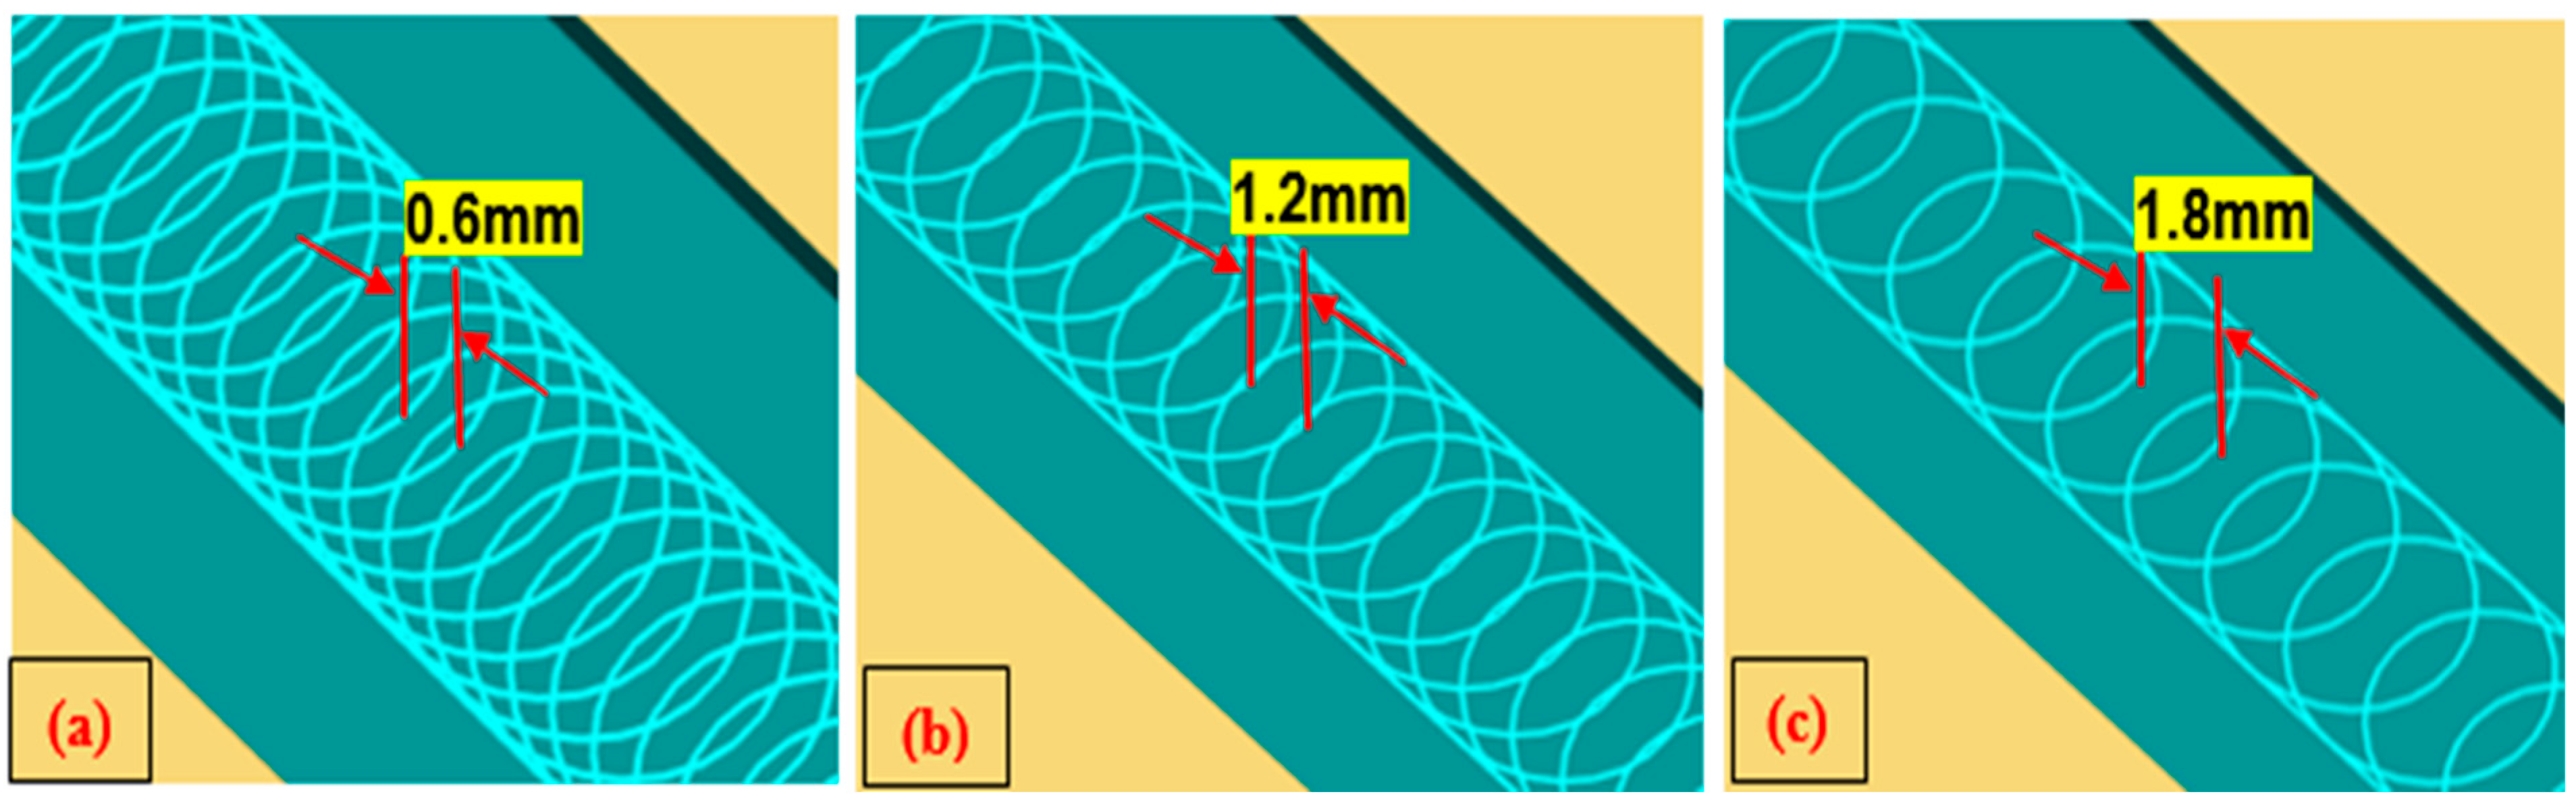
| str | The trochoidal step means the distance between adjacent centers of revolution path (mm) |
| vc | Cutting speed (m/min) |
| vf | Feed rate(mm/min) |
| Ra | Surface roughness (μm) |
| Rz | Ten point average height (μm) |
| Rq | Root-mean-square roughness (μm) |
| Rsk | skewness |
| Rku | kurtosis |
| Rsm | Mean spacing between profile peaks at the mean line |
| Xi | Estimated output response |
| xi | Represents the input parameter |
| d0 | Free term of regression equation |
| di | Coefficients of linear terms |
| dij | Coefficients of square terms |
| ∈ | Experimental error |
| d1, d2…dn | coefficients of linear terms |
| X1 | Before machining of the tool |
| X2 | After machining of the tool |
References
- Kuczmaszewski, J.; Zaleski, K.; Matuszak, J.; Palka, T.; Madry, J. Studies on the effect of mill microstructure upon tool life during slot milling of Ti6Al4V alloy parts. Maintenance Reliab. 2017, 19, 590–596. [Google Scholar] [CrossRef]
- Polvorosa, R.; Suarez, A.; Lopez de Lacalle, L.N.; Cerrillo, I.; Wretland, A.; Veiga, F. Tool wear on nickel alloys with different coolant pressures: Comparison of Alloy 718 and Waspaloy. J. Manuf. Process. 2017, 26, 44–56. [Google Scholar] [CrossRef]
- Chen, W.J.; Hsu, C.C.; Yang, Y.L. Improving roughness quality of end milling Al 7075-T6 alloy with Taguchi based multi objective quantum behaved particle swarm optimisation algorithm. Mater. Res. Innov. 2014, 18, 647–653. [Google Scholar]
- Wang, M.-Y.; Chang, H.-Y. Experimental study of surface roughness in slot end milling AL2014-T6. Int. J. Mach. Tools Manuf. 2004, 44, 51–57. [Google Scholar] [CrossRef]
- Mahesh, G.; Muthu, S.; Devadasan, S.R. Prediction of surface roughness of end milling operation using genetic algorithm. Int. J. Adv. Manuf. Technol. 2015, 77, 369–381. [Google Scholar] [CrossRef]
- Ren, J.X.; Zhou, J.H.; Wei, J.W. Optimization of Cutter Geometric Parameters in End Milling of Titanium Alloy Using the Grey-Taguchi Method. Adv. Mech. Eng. 2015, 7, 1–10. [Google Scholar] [CrossRef]
- Wang, Y.-C.; Chen, C.-H.; Lee, B.-Y. Analysis model of parameters affecting cutting performance in high-speed machining. Int. J. Adv. Manuf. Technol. 2014, 72, 521–530. [Google Scholar] [CrossRef] [Green Version]
- Topal, E. The role of stepover ratio in prediction of surface roughness in flat end milling. Int. J. Mech. Sci. 2009, 51, 782–789. [Google Scholar] [CrossRef]
- Gologlu, C.; Sakarya, N. The effects of cutter path strategies on surface roughness of pocket milling of 1.2738 steel based on Taguchi method. J. Mater. Process. Technol. 2008, 206, 7–15. [Google Scholar] [CrossRef]
- Li, H.; Peng, F.Y.; Tang, X.W.; Xu, J.W.; Zeng, H.H. Stability prediction and step optimization of Trochoidal Milling. J. Manuf. Sci. Eng. 2017, 139. [Google Scholar] [CrossRef]
- Akhavan Niaki, F.; Pleta, A.; Mears, L. Trochoidal milling: investigation of a new approach on uncut chip thickness modeling and cutting force simulation in an alternative path planning strategy. Int. J. Adv. Manuf. Technol. 2018, 97, 641–656. [Google Scholar] [CrossRef]
- Ibaraki, S.; Yamaji, I.; Matsubara, A. On the Removal of Critical Cutting Regions by Trochoidal Grooving. Precis. Eng. 2010, 34, 467–473. [Google Scholar] [CrossRef]
- Deng, Q.; Mo, R.; Chen, Z.C.; Chang, Z.Y. A new approach to generating trochoidal tool paths for effective corner machining. Int. J. Adv. Manuf. Technol. 2017, 95, 3001–3012. [Google Scholar] [CrossRef]
- Uriarte, L.; Azcarate, S.; Herrero, A.; Lopez de Lacalle, L.N.; Lamikiz, A. Mechanistic modelling of the micro end milling operation. Proc. Inst. Mech. Eng. B J. Eng. Manuf. 2008, 222, 23–33. [Google Scholar] [CrossRef]
- Patil, P.; Polishetty, A.; Golberg, M.; Littlefair, G.; Nomani, J. Slot Machining of TI6AL4V with Trochoidal Milling Technique. J. Mach. Eng. 2014, 14, 42–54. [Google Scholar]
- Wu, S.X.; Ma, W.; Li, B.; Wang, C.Y. Trochoidal machining for high speed milling of pockets. J. Mater. Process. Technol. 2016, 233, 29–43. [Google Scholar]
- Palanisamy, P.; Rajendran, I.; Shanmugasundaram, S. Prediction of tool wear using regression and ANN models in end-milling operation. Int. J. Adv. Manuf. Technol. 2008, 37, 29–41. [Google Scholar] [CrossRef]
- Sivaraosa, K.R.; Milkey, A.R.; Samsudin, A.K.; Dubey Kidd, P. Comparison between Taguchi method and response surface methodology (RSM) in modelling CO2 laser machining. Jordan J. Mech. Ind. Eng. 2014, 8, 35–42. [Google Scholar]
- Mia, M. Multi-response optimization of end milling parameters under through-tool cryogenic cooling condition. Measurement 2017, 111, 134–145. [Google Scholar] [CrossRef]
- Abou-El-Hossein, K.A.; Kadirgamaa, K.; Hamdi, M.; Benyounis, K.Y. Prediction of cutting force in end-milling operation of modified AISI P20 tool steel. J. Mater. Process. Technol. 2007, 182, 241–247. [Google Scholar] [CrossRef]
- Calıskan, H.; Kurbanoglu, C.; Panjan, P.; Kramar, D. Investigation of the performance of carbide cutting tools with hard coatings in hard milling based on the response surface methodology. Int. J. Adv. Manuf. Technol. 2013, 66, 883–893. [Google Scholar] [CrossRef]
- Rajeswari, B.; Amirthagadeswaran, K.S. Experimental investigation of machinability characteristics and multi response optimization of end milling in aluminium composites using RSM based grey relational analysis. Measurement 2017, 105, 78–86. [Google Scholar] [CrossRef]
- Mohammed Iqbal, U.; Senthil Kumar, V.S.; Gopala Kannan, S. Application of Response Surface Methodology in optimizing the process parameters of Twist Extrusion process for AA6061-T6 aluminum alloy. Measurement 2016, 94, 126–138. [Google Scholar] [CrossRef]
- Chauhan, S.R.; Dass, K. Optimization of Machining Parameters in Turning of Titanium (Grade-5) Alloy Using Response Surface Methodology. Mater. Manuf. Process. 2012, 27, 531–537. [Google Scholar] [CrossRef]
- Ravi Kumar, K.; Sreebalaji, V.S. Desirability based multi objective optimisation of abrasive wear and frictional behaviour of aluminium (Al/3.25Cu/8.5Si)/fly ash composites. Tribol. Mater. Surf. Interfaces 2015, 9, 128–136. [Google Scholar] [CrossRef]
- Koshy, P.; Dewes, R.C.; Aspinwall, D.K. High speed end milling of hardened AISI D2 tool steel (58 HRC). J. Mater. Process. Technol. 2002, 127, 266–273. [Google Scholar] [CrossRef]
- Mohammed Iqbal, U.; Senthil Kumar, V.S. Modeling of twist extrusion process Parameters of AA6082-T6 alloy by response surface approach. Proc. Inst. Mech. Eng. B J. Eng. Manuf. 2014, 228, 1458–1468. [Google Scholar] [CrossRef]


| Element | Carbon (C) | Silicon (Si) | Chromium (Cr) | Manganese (Mn) | Nickel (Ni) | Vanadium (V) | Iron (Fe) |
|---|---|---|---|---|---|---|---|
| Content (wt%) | 2.1 | 0.3 | 11.5 | 0.4 | 0.31 | 0.25 | Balance |
| Workpiece Materials | Mechanical Properties of D3 Cold Work Tool Steel | ||||
|---|---|---|---|---|---|
| Hardness, (HRC) | Density, (kg/cm3) | Tensile Strength, (N/mm2) | Yield Strength, (N/mm2) | Heat Conductivity, (W/mK) | |
| AISI D3 | 30 | 7.7 | 970 | 850 | 20 |
| Factors | Symbol | Units | Coded Values | ||
|---|---|---|---|---|---|
| (−1) | (0) | (+1) | |||
| Cutting speed | vc | m/min | 15 | 30 | 45 |
| Feed rate | vf | mm/min | 120 | 240 | 360 |
| Trochoidal step | str | mm | 0.6 | 1.2 | 1.8 |
| Run | Input Parameters | Output Responses | ||||||
|---|---|---|---|---|---|---|---|---|
| vc (m/min) | vf (mm/min) | str (mm) | Ra (μm) | Rq (μm) | Rz (μm) | Dish Angle (degree) | Dish Angle Deviation (%) | |
| 1 | 15 | 120 | 0.6 | 0.2968 | 0.3135 | 2.0018 | 1.42 | 8.38 |
| 2 | 45 | 120 | 0.6 | 0.3292 | 0.3592 | 2.4050 | 1.51 | 2.5 |
| 3 | 15 | 360 | 0.6 | 0.4759 | 0.5070 | 3.3420 | 1.25 | 19.35 |
| 4 | 45 | 360 | 0.6 | 0.4983 | 0.5288 | 3.6948 | 1.36 | 12.25 |
| 5 | 15 | 120 | 1.8 | 0.3783 | 0.4130 | 2.8704 | 1.45 | 6.45 |
| 6 | 45 | 120 | 1.8 | 0.4006 | 0.4309 | 3.5797 | 1.53 | 1.29 |
| 7 | 15 | 360 | 1.8 | 0.5574 | 0.6017 | 4.9839 | 1.34 | 13.54 |
| 8 | 45 | 360 | 1.8 | 0.6297 | 0.7478 | 5.6560 | 1.47 | 5.16 |
| 9 | 15 | 240 | 1.2 | 0.4271 | 0.5324 | 3.7702 | 1.38 | 10.96 |
| 10 | 45 | 240 | 1.2 | 0.4494 | 0.4812 | 2.8073 | 1.52 | 1.93 |
| 11 | 30 | 120 | 1.2 | 0.3387 | 0.3963 | 2.1260 | 1.49 | 3.87 |
| 12 | 30 | 360 | 1.2 | 0.5178 | 0.6138 | 4.2041 | 1.37 | 11.61 |
| 13 | 30 | 240 | 0.6 | 0.3875 | 0.4334 | 2.6660 | 1.40 | 9.67 |
| 14 | 30 | 240 | 1.8 | 0.4690 | 0.5012 | 3.1440 | 1.48 | 4.51 |
| 15 | 30 | 240 | 1.2 | 0.3949 | 0.4237 | 2.4030 | 1.45 | 6.45 |
| 16 | 30 | 240 | 1.2 | 0.3824 | 0.4131 | 2.2032 | 1.44 | 7.09 |
| 17 | 30 | 240 | 1.2 | 0.4032 | 0.4631 | 2.4601 | 1.46 | 5.8 |
| 18 | 30 | 240 | 1.2 | 0.3786 | 0.4284 | 2.3031 | 1.45 | 6.45 |
| 19 | 30 | 240 | 1.2 | 0.3678 | 0.4057 | 2.4216 | 1.46 | 5.8 |
| 20 | 30 | 240 | 1.2 | 0.3956 | 0.4317 | 2.6856 | 1.44 | 7.09 |
| Source | SS | d.f | MS | F-Value | p-Value Prob > F | Remarks |
|---|---|---|---|---|---|---|
| Model | 0.1213 | 9 | 0.0255 | 34.38 | <0.0001 | significant |
| vc | 0.0029 | 1 | 0.2165 | 7.52 | 0.0208 | |
| vf | 0.0875 | 1 | 0.0013 | 223.18 | <0.0001 | |
| str | 0.0200 | 1 | 0.0001 | 51.02 | <0.0001 | |
| vc × vf | 0.0002 | 1 | 0.0050 | 0.5100 | 0.4915 | |
| vc × str | 0.0002 | 1 | 0.0002 | 0.5049 | 0.4936 | |
| vf × str | 0.0005 | 1 | 0.0039 | 1.15 | 0.3092 | |
| vc2 | 0.0016 | 1 | 0.0008 | 4.03 | 0.0726 | |
| vf2 | 0.0005 | 1 | 0.0018 | 1.37 | 0.2694 | |
| str2 | 0.0005 | 1 | 0.0000 | 1.37 | 0.2694 | |
| Residual | 0.0039 | 10 | 0.0001 | |||
| Lack of fit | 0.0031 | 5 | 3.56 | 0.0947 | not significant | |
| Pure Error | 0.0009 | 5 | ||||
| Total | 0.1252 | 19 | ||||
| Standard Deviation | 0.0198 | R2 | 0.9687 | |||
| Mean | 0.4239 | Adjusted R2 | 0.9405 | |||
| Cv % | 4.67 | Predicted R2 | 0.8152 | |||
| Adeq Precision | 22.203 |
| Source | SS | d.f | MS | F-Value | p-Value Prob > F | Remarks |
|---|---|---|---|---|---|---|
| Model | 0.0861 | 9 | 0.0096 | 70.34 | <0.0001 | significant |
| vc | 0.0281 | 1 | 0.0281 | 206.44 | <0.0001 | |
| vf | 0.0397 | 1 | 0.0397 | 291.69 | <0.0001 | |
| str | 0.0096 | 1 | 0.0096 | 70.63 | <0.0001 | |
| vc × vf | 0.0010 | 1 | 0.0010 | 7.44 | 0.0213 | |
| vc × str | 0.0001 | 1 | 0.0001 | 0.8268 | 0.3846 | |
| vf × str | 0.0036 | 1 | 0.0036 | 26.55 | 0.0004 | |
| vc2 | 5.682 × 10⁻⁷ | 1 | 5.682 × 10⁻⁷ | 0.0042 | 0.9498 | |
| Vf2 | 0.0012 | 1 | 0.0012 | 8.46 | 0.0156 | |
| str2 | 0.0003 | 1 | 0.0003 | 2.21 | 0.1680 | |
| Residual | 0.0014 | 10 | 0.0001 | |||
| Lack of fit | 0.0010 | 5 | 2.40 | 0.1792 | not significant | |
| Pure Error | 0.0004 | 5 | ||||
| Total | 0.0875 | 19 | ||||
| Standard Deviation | 0.0117 | R2 | 0.9844 | |||
| Mean | 1.43 | Adjusted R2 | 0.9705 | |||
| Cv. % | 0.8132 | Predicted R2 | 0.9067 | |||
| Adeq Precision | 35.6438 |
| Optimum Run | Input Parameters | Ra (μm) | Dish Angle (°) | ||||
|---|---|---|---|---|---|---|---|
| vc | vf | str | Value | %[Error] | Values | %[Error] | |
| Optimum (RSM) | 41 | 120 | 0.9 | 0.323 | 6.10 | 1.51 | 1.34 |
| Optimum (Actual) | 41 | 120 | 0.9 | 0.344 | - | 1.49 | - |
© 2019 by the authors. Licensee MDPI, Basel, Switzerland. This article is an open access article distributed under the terms and conditions of the Creative Commons Attribution (CC BY) license (http://creativecommons.org/licenses/by/4.0/).
Share and Cite
J, S.; U, M.I. Parametric Optimization of Trochoidal Step on Surface Roughness and Dish Angle in End Milling of AISID3 Steel Using Precise Measurements. Materials 2019, 12, 1335. https://doi.org/10.3390/ma12081335
J S, U MI. Parametric Optimization of Trochoidal Step on Surface Roughness and Dish Angle in End Milling of AISID3 Steel Using Precise Measurements. Materials. 2019; 12(8):1335. https://doi.org/10.3390/ma12081335
Chicago/Turabian StyleJ, Santhakumar, and Mohammed Iqbal U. 2019. "Parametric Optimization of Trochoidal Step on Surface Roughness and Dish Angle in End Milling of AISID3 Steel Using Precise Measurements" Materials 12, no. 8: 1335. https://doi.org/10.3390/ma12081335