The Influence of Non-Uniformities on the Mechanical Behavior of Hemp-Reinforced Composite Materials with a Dammar Matrix


Abstract
:1. Introduction
2. Materials and Methods
2.1. Making the Samples
2.2. Theoretical Considerations
- -
- the elasticity factorwhere E is the elasticity modulus of the analyzed sample and is the elasticity modulus of the material considered to be ideal, without uniformities;
- -
- the resistance factorwhere is the tensile strength of the analyzed sample material and is the tensile strength of the material considered as ideal, without non-uniformities;
- -
- the uniformity factor
3. Experimental Determinations
- -
- force range: 5 kN;
- -
- travel: 1 to 735 mm;
- -
- crosshead speed: 0.1 to 1020 mm/min;
- -
- analysis software: NEXYGEN.
- -
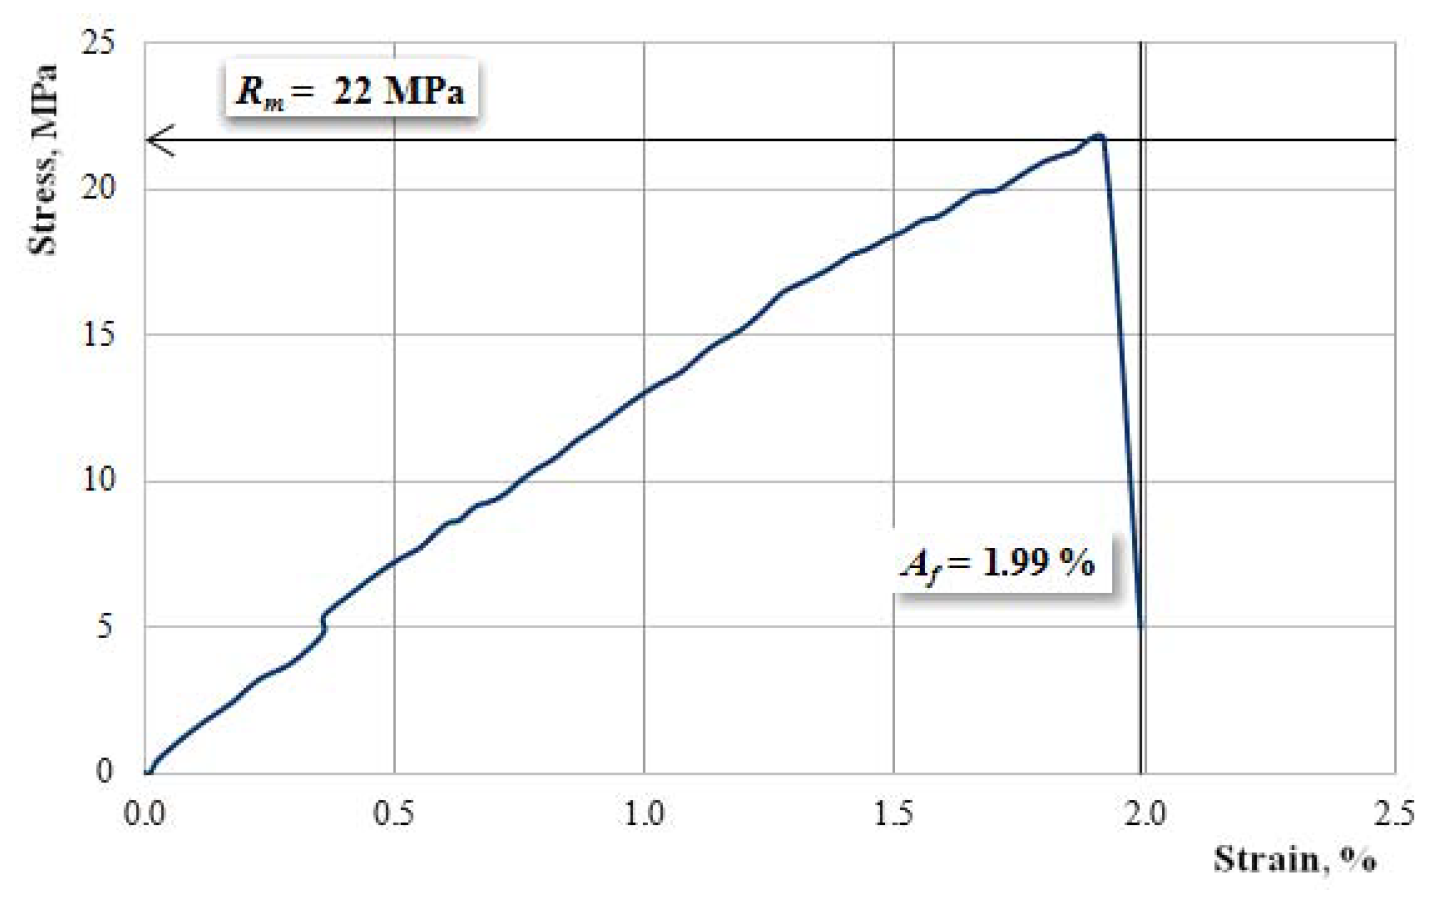
- tensile strength: 21–22 MPa;
- -
- elongation at break: 1.95–2.20%;
- -
- modulus of elasticity: 1130–1220 MPa.
4. Conclusions
- -
- the properties of the component materials (modulus of elasticity and the tensile strength , of the reference material, respectively modulus of elasticity of the matrix);
- -
- number of interrupted layers (the ratio between the number of interrupted layers and the total number of layers);
- -
- the interruption length of the layers (the ratio between the interruption length and the bar length).
- -
- the elasticity factor decreases if the number of interrupted layers increases; this shows that if the number of layers with interruptions increases, the elasticity modulus of the composite decreases;
- -
- the elasticity factor decreases if the layer interruption length increases; this shows that if the length of the area where resin replaces reinforcement increases, then the elasticity modulus of the composite decreases;
- -
- the resistance factor decreases if the number of interrupted layers increases; therefore, the tensile strength decreases if the number of interrupted layers increases;
- -
- the resistance factor is not influenced by the layer interruption length; this shows that breaking can occur when the fibers in the area where the bar section rigidity minimal break up;
- -
- the uniformity factor decreases if the number of interrupted layers increases;
- -
- the uniformity factor increases if the layer interruption length increases.
5. Discussion
Author Contributions
Funding
Conflicts of Interest
Nomenclature
| the elasticity factor | |
| the resistance factor | |
| the uniformity factor | |
| E | the elasticity modulus of analyzed sample |
| the elasticity modulus of the material considered to be ideal, without non-uniformities | |
| the elasticity modulus of a layer without discontinuities | |
| the elasticity modulus of the resin | |
| the elasticity modulus of the layer k in the section of the abscissa x | |
| the tensile strength of the analyzed sample material | |
| the tensile strength of the reference material | |
| the normal tension in layer k in the section of the abscissa x | |
| the tensile strength of the material considered as ideal, without non-uniformities | |
| the characteristic deformation in layer k in the section of the abscissa x | |
| the thickness of the layer k | |
| l | the bar length |
| the interruption length | |
| b | the bar width |
| h | the bar thickness. |
References
- Hosseini, A.; Ghafoori, E.; Wellauer, M.; Marzaleh, A.S.; Motavalli, M. Short-term bond behavior and debonding capacity of prestressed CFRP composites to steel substrate. Eng. Struct. 2018, 176, 935–947. [Google Scholar] [CrossRef]
- Soutis, C. Fibre reinforced composites in aircraft construction. Prog. Aerosp. Sci. 2005, 41, 143–151. [Google Scholar] [CrossRef]
- Shahmohammadi, M.; Asgharzadeh Shirazi, H.; Karimi, A.; Navidbakhsh, M. Finite element simulation of an artificial intervertebral disk using fiber reinforced laminated composite model. Tissue Cell 2014, 46, 299–303. [Google Scholar] [CrossRef]
- Scribante, A.; Vallittu, P.K.; Özcan, M. Fiber-reinforced composites for dental applications. BioMed Res. Int. 2018, 4734986. [Google Scholar] [CrossRef]
- Zia-ul-Haq; Khan, F.U.; Shah, A.M.H.; Ullah, M.A.; Abdusubhan; Khabir, A.; Ali, F.; Rauf, A.; Khattak, A.K. Effects of different environmental factors on the mechanical properties of different samples of fiber glass. J. Biodivers. Environ. Sci. 2017, 10, 115–123. [Google Scholar]
- Chen, T.T.; Liu, W.D.; Qiu, R.H. Mechanical properties and water absorption of hemp fibers-reinforced unsaturated polyester composites: Effect of fiber surface treatment with a heterofunctional monomer. BioResources 2013, 8, 2780–2791. [Google Scholar] [CrossRef]
- Derrien, K.; Gilormini, P. The effect of moisture-induced swelling on the absorption capacity of transversely isotropic elastic polymer-matrix composites. Int. J. Solids Struct. 2009, 46, 1547–1553. [Google Scholar] [CrossRef]
- Dhakal, H.N.; Zhang, Z.Y.; Richardson, M.O.W. Effect of water absorption on the mechanical properties of hemp fibre reinforced unsaturated polyester composites. Compos. Sci. Technol. 2007, 67, 1674–1683. [Google Scholar] [CrossRef]
- Huang, Z.; Wang, N.; Zhang, Y.; Hu, H.; Luo, Y. Effect of mechanical activation pretreatment on the properties of sugarcane bagasse/poly(vinyl chloride) composites. Compos. Part A Appl. Sci. Manuf. 2012, 43, 114–120. [Google Scholar] [CrossRef]
- Summerscales, J.; Grove, S. Manufacturing methods for natural fibre composites. In Natural Fibre Composites: Materials, Processes and Properties; Hodzic, A., Shanks, R., Eds.; Taylor and Francis: Boca Raton, FL, USA, 2014; pp. 157–186. [Google Scholar]
- Chatterjee, A. Non-uniform fiber networks and fiber-based composites: Pore size distributions and elastic moduli. J. Appl. Phys. 2010, 108, 063513. [Google Scholar] [CrossRef]
- Chi, S.H.; Chung, Y.L. Mechanical behavior of functionally graded material plates under transverse load, I: Analysis. Int. J. Solids Struct. 2006, 43, 3657–3674. [Google Scholar] [CrossRef]
- Tanaka, M.; Hojo, M.; Hobbiebrunken, T.; Ochiai, S.; Hirosawa, Y.; Fujita, K. Influence of non-uniform fiber arrangement on tensile fracture behavior of unidirectional fiber/epoxy model composites. Compos. Interface 2005, 12, 365–378. [Google Scholar] [CrossRef]
- Bolcu, D.; Stanescu, M.M.; Ciuca, I.; Dumitru, S.; Sava, M. The non-uniformity from the composite materials reinforced with fiber glass fabric. Mater. Plast. 2014, 51, 97–100. [Google Scholar]
- Stanescu, M.M.; Bolcu, D.; Ciuca, I.; Dinita, A. Non uniformity of composite materials reinforced with carbon and carbon-kevlar fibers fabric. Mater. Plast. 2014, 51, 355–358. [Google Scholar]
- Bolcu, D.; Sava, M.; Dinita, A.; Miritoiu, C.M.; Baciu, F. The influence of discontinuities on elastic and mechanical properties of composite materials reinforced with woven carbon, carbon-kevlar and kevlar. Mater. Plast. 2016, 53, 23–28. [Google Scholar]
- Jarve, D.; Kim, R. Strength prediction and measurement in model multilayered discontinuous tow reinforced composites. J. Compos. Mater. 2004, 38, 5–18. [Google Scholar]
- Baucom, J.N.; Thomas, J.P.; Pogele, W.R. Tiled composite laminates. J. Compos. Mater. 2010, 44, 3115–3132. [Google Scholar] [CrossRef]
- Dyskin, A.V.; Estrin, Y.; Pasternak, E. Topological interloking of platonic solids: A way to new materials and structures. Philos. Mag. Lett. 2003, 83, 197–203. [Google Scholar] [CrossRef]
- Dyskin, A.V.; Pasternak, E.; Estrin, Y.; Pasternak, E.; Kanel-Belov, A.J. A new principle in design of composite materials: Reinforcement by interloked elements. Compos. Sci. Technol. 2003, 63, 483–491. [Google Scholar] [CrossRef]
- Ghafoori, E.; Motavalli, M. A retrofit theory to prevent fatigue crack initiation in aging riveted bridges using carbon fiber-reinforced polymer materials. Polymers 2016, 8, 308. [Google Scholar] [CrossRef]
- Scribante, A.; Massironi, S.; Pieraccini, G.; Vallittu, P.; Lassila, L.; Sfondrini, M.F.; Gandini, P. Effects of nanofillers on mechanical properties of fiber-reinforced composites polymerized with light-curing and additional postcuring. J. Appl. Biomater. Funct. Mater. 2015, 13, e296–e299. [Google Scholar] [CrossRef]
- Bogoeva-Gaceva, G.; Avella, M.; Malinconico, M.; Buzaovska, A.; Grozdanov, A.; Gentile, G.; Errico, M.E. Naturalfiber eco-composites. Polym. Compos. 2007, 28, 98–107. [Google Scholar] [CrossRef]
- Brouwer, W.D. Natural fiber composites—From uphols-tery to structural components. In Proceedings of the Natural Fibres for Automotive Industry Conference, Manchester Conference Centre, Manchester, UK, 28 November 2000. [Google Scholar]
- Ivens, J.; Bos, H.; Verpoest, I. The applicability of natural fibers as reinforcement for polymer composites. In Proceedings of the Symposium on Renewable Bioproducts—Industrial Outlets and Research for 21st Century, International Agriculture Centre, Wegeningen, The Netherlands, 24–25 June 1997. [Google Scholar]
- Mougin, G. Natural fiber composites—Problems and solutions. JEC Compos. Mag. 2006, 25, 32–35. Available online: http://www.jeccomposites.com/news/composites-news/natural-fibre-composites-problemsand-solutions (accessed on 25 October 2011).
- Mueller, D.H.; Krobjilowski, A. New discovery in the properties of composites reinforced with natural fibers. J. Ind. Text. 2003, 33, 111–130. [Google Scholar] [CrossRef]
- Liu, M.; Fernando, D.; Daniel, G.; Madsen, B.; Meyer, A.; Ale, M.; Thygesen, A. Effect of harvest time and field retting duration on the chemical composition, morphology and mechanical properties of hemp fibers. Ind. Crop. Prod. 2015, 69, 29–39. [Google Scholar] [CrossRef]
- Liu, M.; Fernando, D.; Meyer, A.S.; Madsen, B.; Daniel, G.; Thygesen, A. Characterization and biological depectinization of hemp fibers originating from different stem sections. Ind. Crop. Prod. 2015, 76, 880–891. [Google Scholar] [CrossRef]
- Shahzad, A. Hemp fiber and its composites—A review. J. Compos. Mater. 2012, 46, 973–986. [Google Scholar] [CrossRef]
- Liu, M.; Thygesen, A.; Summerscales, J.; Meyer, A. Targeted pre-treatment of hemp bast fibres for optimal performance in biocomposite materials: A review. Ind. Crop. Prod. 2017, 108, 660–683. [Google Scholar] [CrossRef]
- Hoque, M.B.; Alam, A.B.M.; Mahmud, H.; Nobi, A. Mechanical, degradation and water uptake properties of fabric reinforced polypropylene based composites: Effect of alkali on composites. Fibers 2018, 6, 94. [Google Scholar] [CrossRef]
- Malkapuram, R.; Kumar, V.; Yuvraj, S.N. Recent development in natural fibre reinforced polypropylene composites. J. Reinf. Plast. Compos. 2008, 28, 1169–1189. [Google Scholar] [CrossRef]
- Hargitai, H.; Racz, I.; Anandjiwala, R.D. Developmentof hemp fiber reinforced polypropylene composites. J. Thermoplast. Compos. Mater. 2008, 21, 165–174. [Google Scholar] [CrossRef]
- Mechraoui, A.; Riedl, B.; Rodrigue, D. The effect of fiber and coupling agent content on the mechanical properties of hemp/polypropylene composites. Compos. Interfaces 2007, 14, 837–848. [Google Scholar] [CrossRef]
- Sain, M.; Suhara, P.; Law, S.; Bouillox, A. Interface mod-ification and mechanical properties of natural fiber-poly-olefin composite products. J. Reinf. Plast. Compos. 2005, 24, 121–130. [Google Scholar] [CrossRef]
- Mohanty, A.K.; Misra, M.; Hinrichsen, G. Biofibers, biodegradable polymers and biocomposites: An overview. Macromol. Mater. Eng. 2000, 276–277, 1–24. [Google Scholar] [CrossRef]
- Shogren, R.L.; Petrovic, Z.; Liu, Z.S.; Erhan, S.Z. Biodegradation behavior of some vegetable oil-based polymers. J. Polym. Environ. 2004, 12, 173–178. [Google Scholar] [CrossRef]
- Uyama, H.; Kuwabara, M.; Tsujimoto, T.; Kobayashi, S. Enzymatic synthesis and curing of biodegradable epoxide-containing polyesters from renewable resources. Biomacromolecules 2003, 4, 211–215. [Google Scholar] [CrossRef] [PubMed]
- Prati, S.; Sciutto, G.; Mazzeo, R.; Torri, C.; Fabbri, D. Application of ATR-far-infrared spectroscopy to the analysis of natural resins. Anal. Bioanal. Chem. 2011, 399, 3081–3091. [Google Scholar] [CrossRef] [PubMed]
- Suprakas, S.R.; Mosto, B. Biodegradable polymers and their layered silicate nanocomposites: In greening the 21st century materials world. Prog. Mater. Sci. 2005, 50, 962–1079. [Google Scholar]
- Azemard, C.; Menager, M.; Vieillescazes, C. On the tracks of sandarac, review and chemical analysis. Environ. Sci. Pollut. Res. 2017, 24, 27746–27754. [Google Scholar] [CrossRef] [PubMed] [Green Version]
- Kononenko, I.; Viguerie, L.; Rochut, S.; Walter, P. Qualitative and quantitative studies of chemical composition of sandarac resin by GC-MS. Environ. Sci. Pollut. Res. 2017, 24, 2160–2165. [Google Scholar] [CrossRef]
- Hidayat, A.T.; Farabi, K.; Harneti, D.; Maharani, R.; Mayanti, T.; Setiawan, A.S.; Supratman, U.; Shiono, Y. Cytotoxicity and structure activity relationship of Dammarane-type triterpenoids from the bark of aglaia elliptica against P-388 murine leukemia cells. Nat. Prod. Sci. 2017, 23, 291–298. [Google Scholar] [CrossRef]
- Zakaria, R.; Ahmad, A.H. Adhesion and hardness evaluation of modified silicone-Dammar as natural coating materials. J. Appl. Sci. 2012, 9, 890–893. [Google Scholar] [CrossRef]
- Zakaria, R.; Ahmad, A.H. The performance of modified silicone-Dammar resin in nanoindentation test. Int. J. Adv. Sci. Technol. 2012, 42, 33–44. [Google Scholar]
- Pethe, A.M.; Joshi, S.B. Mechanical and film forming studies of novel biomaterial. Int. J. Pharm. Sci. Res. 2013, 4, 2761–2769. [Google Scholar]
- Nurfajriani, L.W.; Gea, S.; Thamrin, B.W. Mechanical properties of oil palm trunk by reactive compregnation methode with Dammar resin. Int. J. PharmTech Res. 2015, 8, 74–79. [Google Scholar]
- Ciuca, I.; Bolcu, A.; Stanescu, M.M. A study of some mechanical properties of bio-composite materials with a Dammar-based matrix. Environ. Eng. Manag. J. 2017, 16, 2851–2856. [Google Scholar]
- Stanescu, M.M.; Bolcu, D. A study of some mechanical properties of a category of composites with a hybrid matrix and natural reinforcements. Polymers 2019, 11, 478. [Google Scholar] [CrossRef]
- Kanehashi, S.; Oyagi, H.; Lu, R.; Miyakoshi, T. Developement of bio-based hybrid resin, from natural lacquer. Prog. Org. Coat. 2010, 77, 24–29. [Google Scholar] [CrossRef]
- Ishimura, T.; Lu, R.; Yamasaki, K.; Miyakoshi, T. Development of an eco-friendly hybrid lacquer based on kurome lacquer sap. Prog. Org. Coat. 2010, 69, 12–15. [Google Scholar] [CrossRef]
- Drisko, G.L.; Sanchez, C. Hybridization in materials science—Evolution, current state, and future aspirations. Eur. J. Inorg. Chem. 2012, 32, 5097–5105. [Google Scholar] [CrossRef]
- De Paola, S.; Minak, G.; Fragassa, C.; Pavlovic, A. Green Composites: A Review of State of Art. In Proceedings of the 30th Danubia Adria Symposium on Advanced Mechanics, Primosten, Croatia, 25–28 September 2013; Croatian Society of Mechanics, Ed.; pp. 77–78. [Google Scholar]
- Hyseni, A.; De Paola, S.; Minak, G.; Fragassa, C. Mechanical characterization of ecocomposites. In Proceedings of the 30th Danubia Adria Symposium on Advanced Mechanics, Primosten, Croatia, 25–28 September 2013; pp. 175–176. [Google Scholar]
- Zivkovic, I.; Pavlovic, A.; Fragassa, C.; Brugo, T. Influence of moisture absorption on the impact properties of flax, basalt and hybrid flax/basalt fiber reinforced green composites. Compos. Part B Eng. 2017, 111, 148–164. [Google Scholar] [CrossRef]
- Fragassa, C.; Pavlovic, A.; Santulli, C. Mechanical and impact characterisation of flax and basalt fibre bio-vinylester composites and their hybrids. Compos. Part B Eng. 2018, 137, 247–259. [Google Scholar] [CrossRef]
- Resoltech 1050, hardeners 1053 to 1059. Structural Lamination Epoxy System. Available online: www.scabro.com/images/.../1/.../Resoltech%201050/DS-1050.pdf (accessed on 9 January 2019).
- Singh, A.A.; Afrin, S.; Karim, Z.L. Green composites: Versatile material for future, chapter Green Biocomposites. In Series Green Energy and Technology; Springer International Publishing: Berlin, Germany, 2017; pp. 29–44. [Google Scholar] [CrossRef]
- ASTM D3039, Standard Test Method for Tensile Properties of Polymer Matrix Composite Materials. Available online: https://www.astm.org/Standards/D3039 (accessed on 9 January 2019).
- LLOYD LRX PLUS SERIES, Materials Testing Machine. Available online: http://www.elis.it/lloyd-pdf/LRXPlus.pdf (accessed on 28 March 2019).


| Abbreviation Sample | The Total Number of Layers of Reinforcement | Number of Layers Interrupted | Length of Interruption [mm] | Number of Samples Tested |
|---|---|---|---|---|
| A00 | 5 | 0 | 0 | 10 |
| A10 | 5 | 1 | 0 | 10 |
| A12 | 5 | 1 | 20 | 10 |
| A14 | 5 | 1 | 40 | 10 |
| A20 | 5 | 2 | 0 | 10 |
| A22 | 5 | 2 | 20 | 10 |
| A24 | 5 | 2 | 40 | 10 |
| B00 | 5 | 0 | 0 | 10 |
| B10 | 5 | 1 | 0 | 10 |
| B12 | 5 | 1 | 20 | 10 |
| B14 | 5 | 1 | 40 | 10 |
| B20 | 5 | 2 | 0 | 10 |
| B22 | 5 | 2 | 20 | 10 |
| B24 | 5 | 2 | 40 | 10 |
| Abbreviation Sample | Modulus of Elasticity E [MPa] | Tensile Strength [MPa] | Elongation at Break A [%] |
|---|---|---|---|
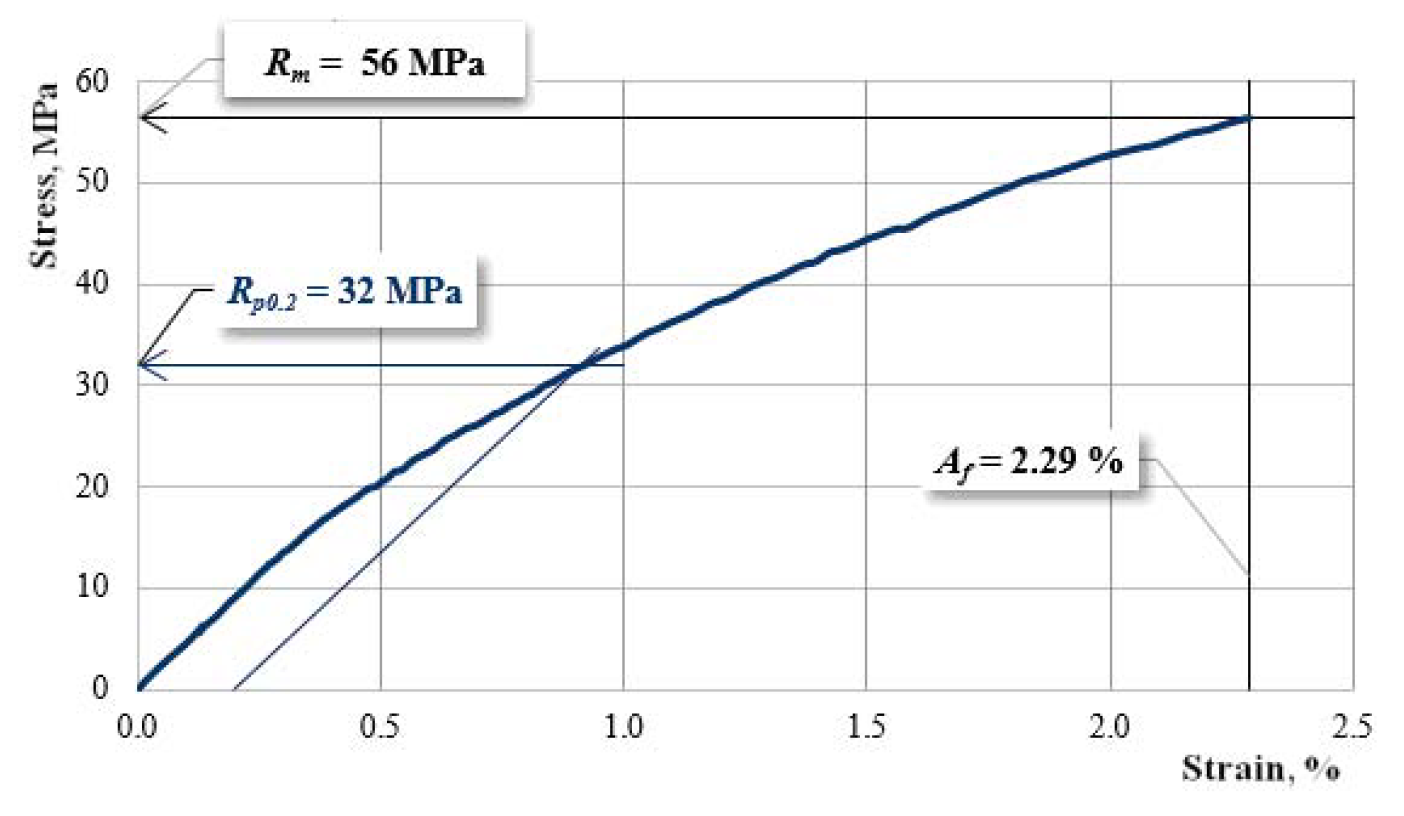
| A00 | 4473–4622 (4547 ± 75) | 55–57 (56 ± 1) | 2.24–2.29 (2.27 ± 0.03) |
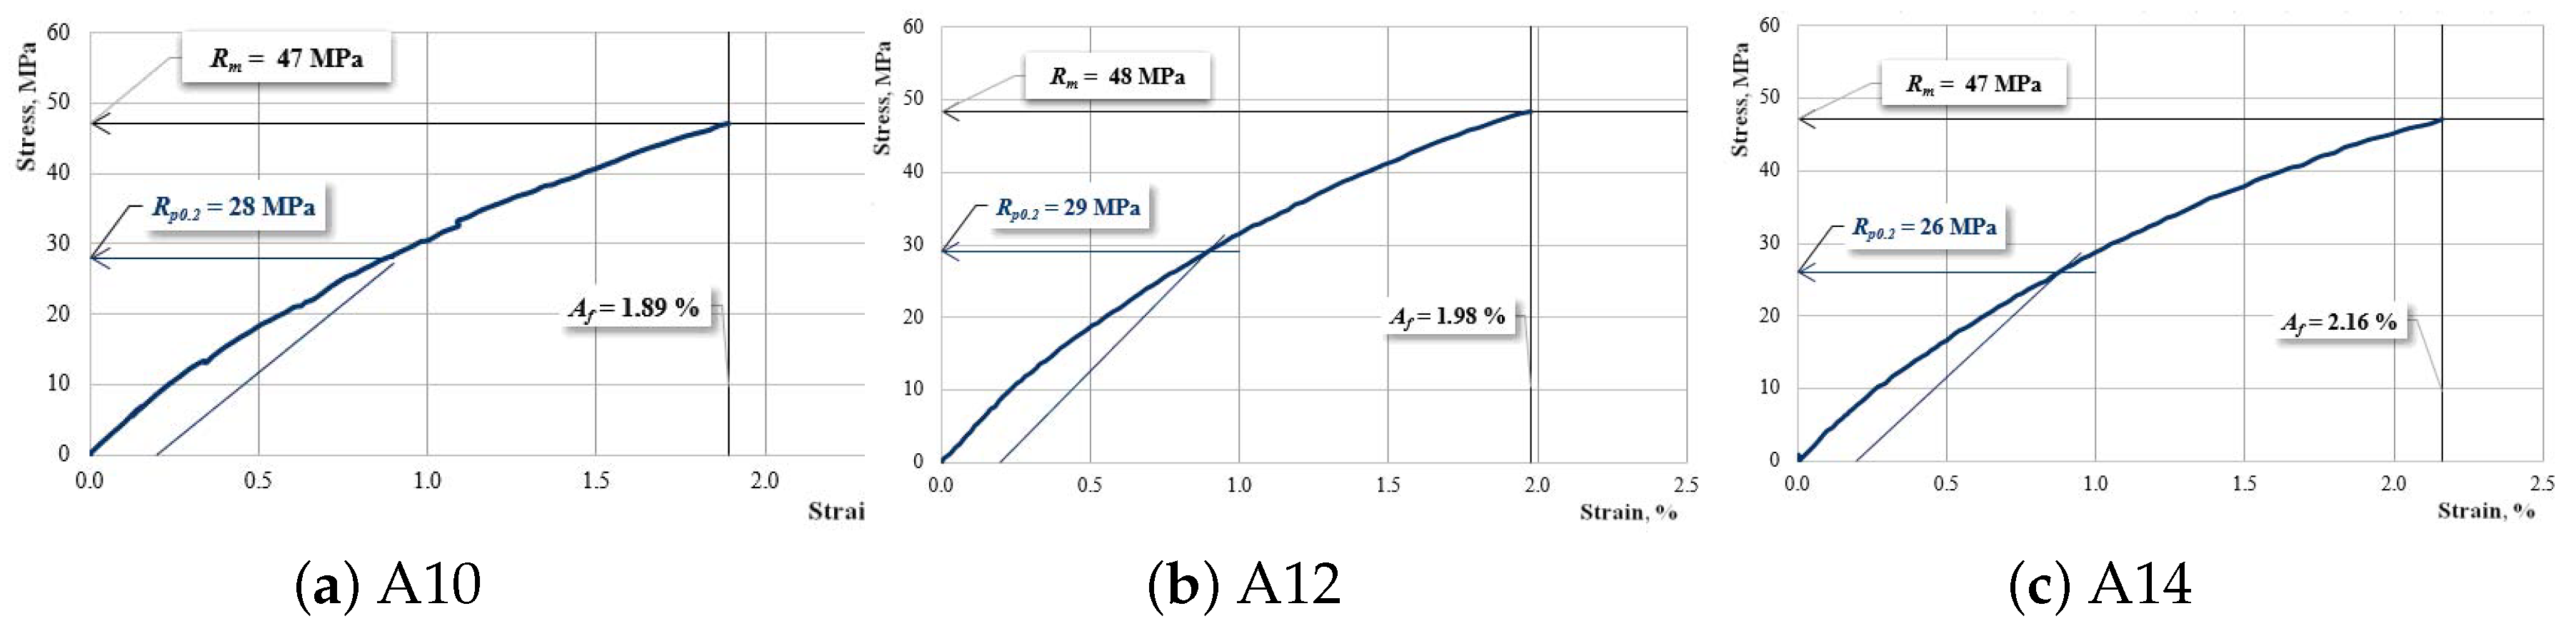
| A10 | 4440–4618 (4529 ± 89) | 47–48 (47.5 ± 0.5) | 1.89–1.95 (1.92 ± 0.03) |
| A12 | 4326–4445 (4386 ± 60) | 47–48 (47.5 ± 0.5) | 1.96–2.02 (1.99 ± 0.03) |
| A14 | 4090–4209 (4150 ± 60) | 46–48 (47 ± 1) | 2.08–2.16 (2.12 ± 0.04) |
| A20 | 4421–4573 (4497 ± 76) | 40–41 (40.5 ± 0.5) | 1.56–1.62 (1.59 ± 0.03) |
| A22 | 4062–4199 (4131 ± 68) | 39–41 (40 ± 1) | 1.71–1.77 (1.74 ± 0.03) |
| A24 | 3692–3790 (3741 ± 49) | 38–40 (39 ± 1) | 1.87–1.93 (1.90 ± 0.03) |
| Abbreviation Sample | Modulus of Elasticity E [MPa] | Tensile Strength [MPa] | Elongation at Break A [%] |
|---|---|---|---|
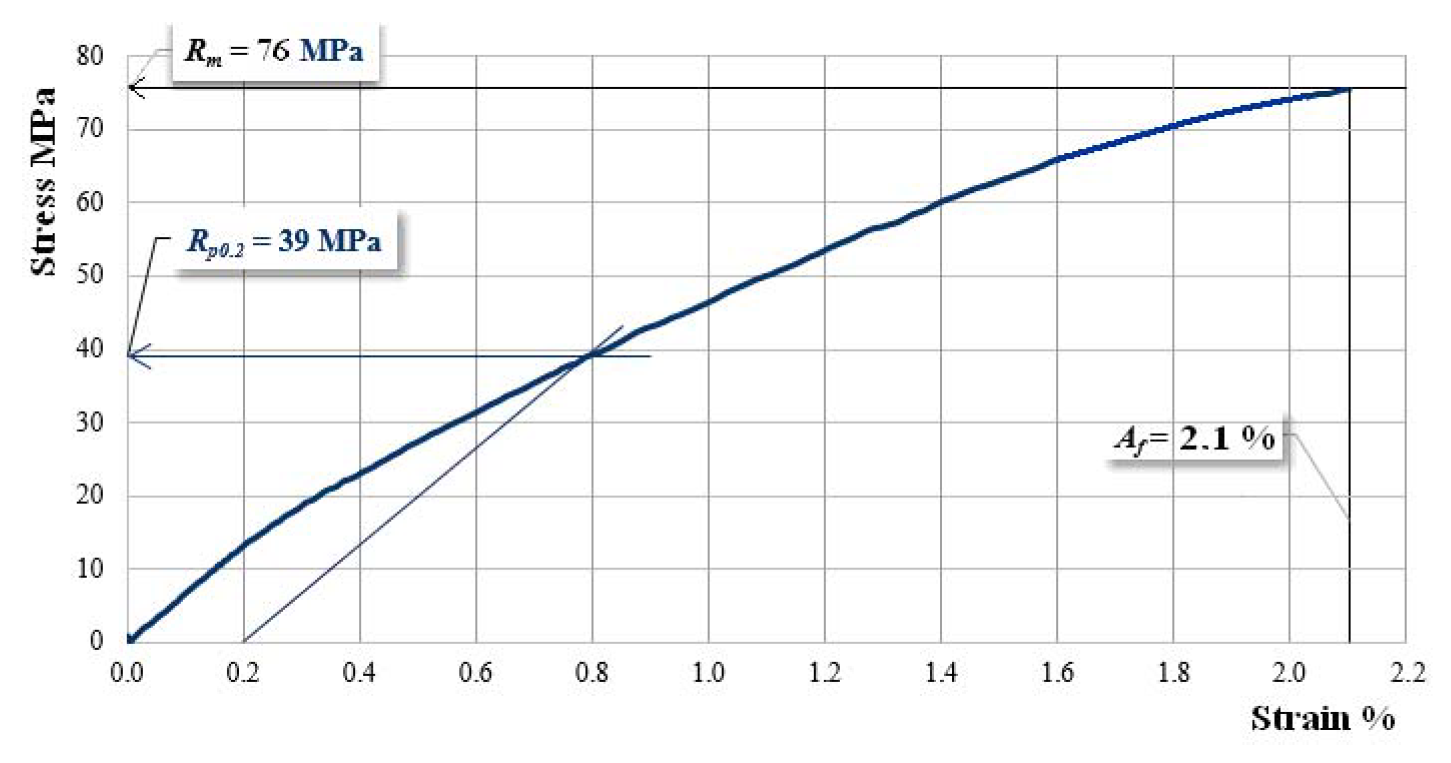
| B00 | 6580–6654 (6617 ± 37) | 74–76 (75 ± 1) | 2.02–2.10 (2.06 ± 0.04) |
| B10 | 6528–6610 (6569 ± 41) | 62–64 (63 ± 1) | 1.60–1.66 (1.63 ± 0.03) |
| B12 | 6094–6226 (6160 ± 66) | 62–64 (63 ± 1) | 1.70–1.74 (1.72 ± 0.02) |
| B14 | 5872–5989 (5930 ± 58) | 61–64 (62.5 ± 1.5) | 1.86–1.92 (1.89 ± 0.03) |
| B20 | 6568–6640 (6604 ± 36) | 51–53 (52 ± 1) | 1.21–1.29 (1.25 ± 0.04) |
| B22 | 5770–5899 (5834 ± 64) | 50–54 (52 ± 2) | 1.44–1.48 (1.46 ± 0.02) |
| B24 | 5257–5363 (5310 ± 53) | 50–53 (51.5 ± 1.5) | 1.72–1.82 (1.77 ± 0.05) |
| Sample Type | Elasticity Factor | Resistance Factor | Uniformity Factor | |||
|---|---|---|---|---|---|---|
| Theoretical | Experimental | Theoretical | Experimental | Theoretical | Experimental | |
| A10 | 1 | 0.991 | 0.853 | 0.848 | 0.853 | 0.855 |
| A12 | 0.967 | 0.959 | 0.853 | 0.848 | 0.883 | 0.884 |
| A14 | 0.936 | 0.908 | 0.853 | 0.839 | 0.912 | 0.924 |
| A20 | 1 | 0.984 | 0.707 | 0.723 | 0.707 | 0.735 |
| A22 | 0.923 | 0.903 | 0.707 | 0.714 | 0.765 | 0.790 |
| A24 | 0.858 | 0.818 | 0.707 | 0.696 | 0.824 | 0.851 |
| Sample Type | Elasticity Factor | Resistance Factor | Uniformity Factor | |||
|---|---|---|---|---|---|---|
| Theoretical | Experimental | Theoretical | Experimental | Theoretical | Experimental | |
| B10 | 1 | 0.993 | 0.836 | 0.840 | 0.836 | 0.846 |
| B12 | 0.962 | 0.931 | 0.836 | 0.840 | 0.869 | 0.902 |
| B14 | 0.927 | 0.896 | 0.836 | 0.833 | 0.902 | 0.929 |
| B20 | 1 | 0.998 | 0.673 | 0.693 | 0.673 | 0.694 |
| B22 | 0.911 | 0.882 | 0.673 | 0.693 | 0.738 | 0.785 |
| B24 | 0.837 | 0.802 | 0.673 | 0.687 | 0.804 | 0.856 |
© 2019 by the authors. Licensee MDPI, Basel, Switzerland. This article is an open access article distributed under the terms and conditions of the Creative Commons Attribution (CC BY) license (http://creativecommons.org/licenses/by/4.0/).
Share and Cite
Bolcu, D.; Stănescu, M.M. The Influence of Non-Uniformities on the Mechanical Behavior of Hemp-Reinforced Composite Materials with a Dammar Matrix. Materials 2019, 12, 1232. https://doi.org/10.3390/ma12081232
Bolcu D, Stănescu MM. The Influence of Non-Uniformities on the Mechanical Behavior of Hemp-Reinforced Composite Materials with a Dammar Matrix. Materials. 2019; 12(8):1232. https://doi.org/10.3390/ma12081232
Chicago/Turabian StyleBolcu, Dumitru, and Marius Marinel Stănescu. 2019. "The Influence of Non-Uniformities on the Mechanical Behavior of Hemp-Reinforced Composite Materials with a Dammar Matrix" Materials 12, no. 8: 1232. https://doi.org/10.3390/ma12081232