Plastics—Villain or Hero? Polymers and Recycled Polymers in Mineral and Metallurgical Processing—A Review


Abstract
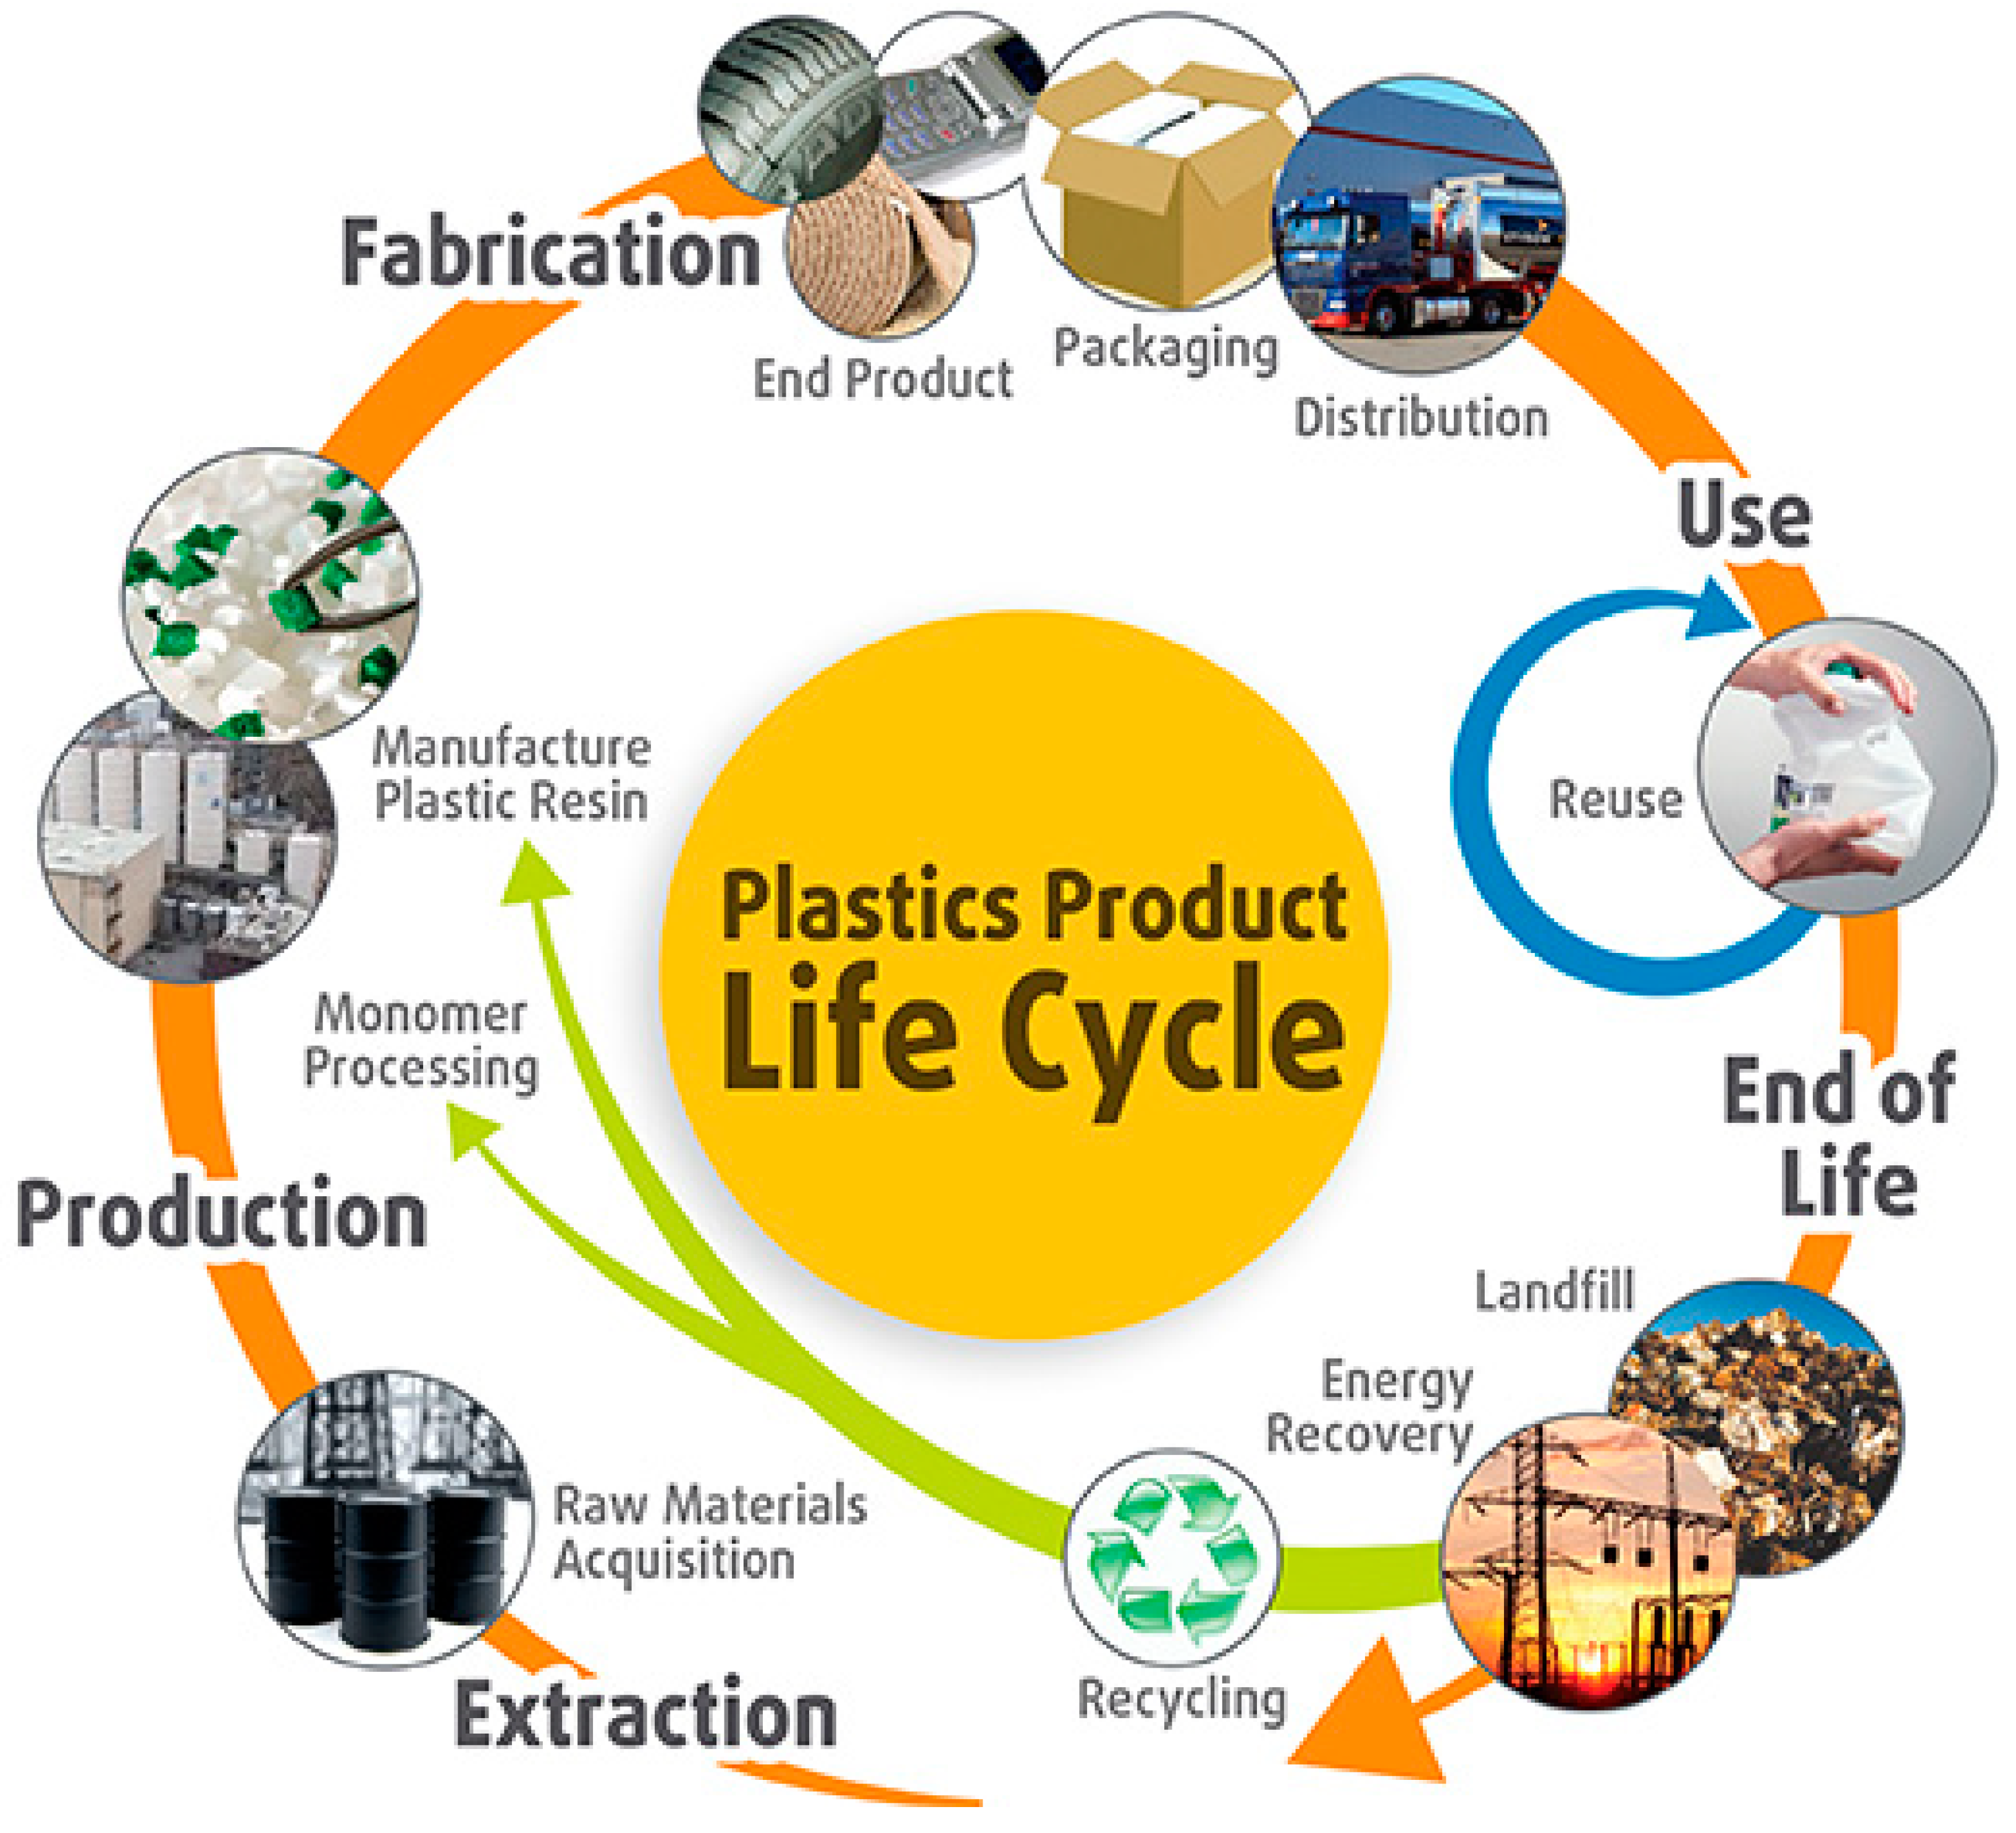
:1. Introduction
End of Life Options for Plastics
- ➢
- Land filling results in no net greenhouse gas (GHG) emissions, no GHG benefits and a waste of valuable resources [4].
- ➢
- Mechanical recycling corresponds to the reprocessing of plastic waste to produce new products.
- ➢
- Energy recovery option is used to generate heat, steam or electricity or as solid refuse fuel for co-fuelling of blast furnaces or cement kilns, or pyrolysis to diesel fuel or gasification. Highly mixed plastics, such as some electronic and electrical wastes and automotive shredder residues, are the candidates.
- ➢
- Pyrolysis, a recycling technique, includes non-catalytic thermal or catalytic thermal methods. High-temperature pyrolysis of plastics is particularly advantageous for metallurgical processes running at very high temperatures, e.g., the Corex Process, blast furnace, HTK Process (HTK: Hochtemperatur-Konversionsverfahren, aka High-Temperature Conversion Process) of Voestalpine-Österreichische Mineralölverwaltung (VOEST-ÖMV), and the Thermoselect Process [5]. Unsorted plastic wastes are converted into fuels, monomers, and other valuable materials, such as liquid fuels, solids (char) and combustible gases, carbon, hydrogen chloride (from PVC) and bromine via thermal and catalytic cracking processes in the absence of oxygen at about 300° C to 500° C.
- ▪
- Gasification of plastics occurs approximately at 525–625 °C, much before the steel melting temperature [5].
- ▪
- Chemical recycling routes can be broadly divided into thermochemical and catalytic conversion processes. Chemical or feedstock recycling breaks down heterogeneous, contaminated and hard-to-recycle waste polymers into their chemical constituents and converts them into monomers for new plastics or fuels, usually in blast furnaces.
- ▪
- Thermal depolymerization breaks down waste plastics into crude oil products under high temperatures and pressure (>400 °C and 4 MPa) in the presence of water via hydrous pyrolysis. Long chain polymers depolymerise into short chain monomers. Small gaseous molecules like methane or carbon dioxide cannot be converted into oil using this process. In this process, organic toxins lose their toxicity due to the breaking down of chemical bonds. Heavy metals are eliminated from the samples as ionized or stable oxide forms. However, toxic by-products like furan and dioxin may be released in addition to methane and carbon dioxide. When applied to E-wastes, this process is effective in dealing with the plastics portion of the E-wastes but offers no method of bromine recovery. The solid fraction resulting from this process would have much higher concentrations of metals. Metal recovery from this metal-laden slag becomes complicated due to the high concentration of oxides, offering no overall increase in recycling efficiency. Thus, a thermal depolymerization process is not suitable for maximum metal extraction, or for increased recycling efficiency.
2. Outline of Specific Applications of Polymers in Mineral and Metallurgical Processing
- Energy and fuel: Plastics have a high calorific value when compared with other materials (as they are essentially made from crude oil), making them a convenient energy source.
- Reductant: The CH4, CO, H2 and the char produced during the pyrolysis of the plastics can replace the coal-based coke as a reducing agent in blast furnace applications.
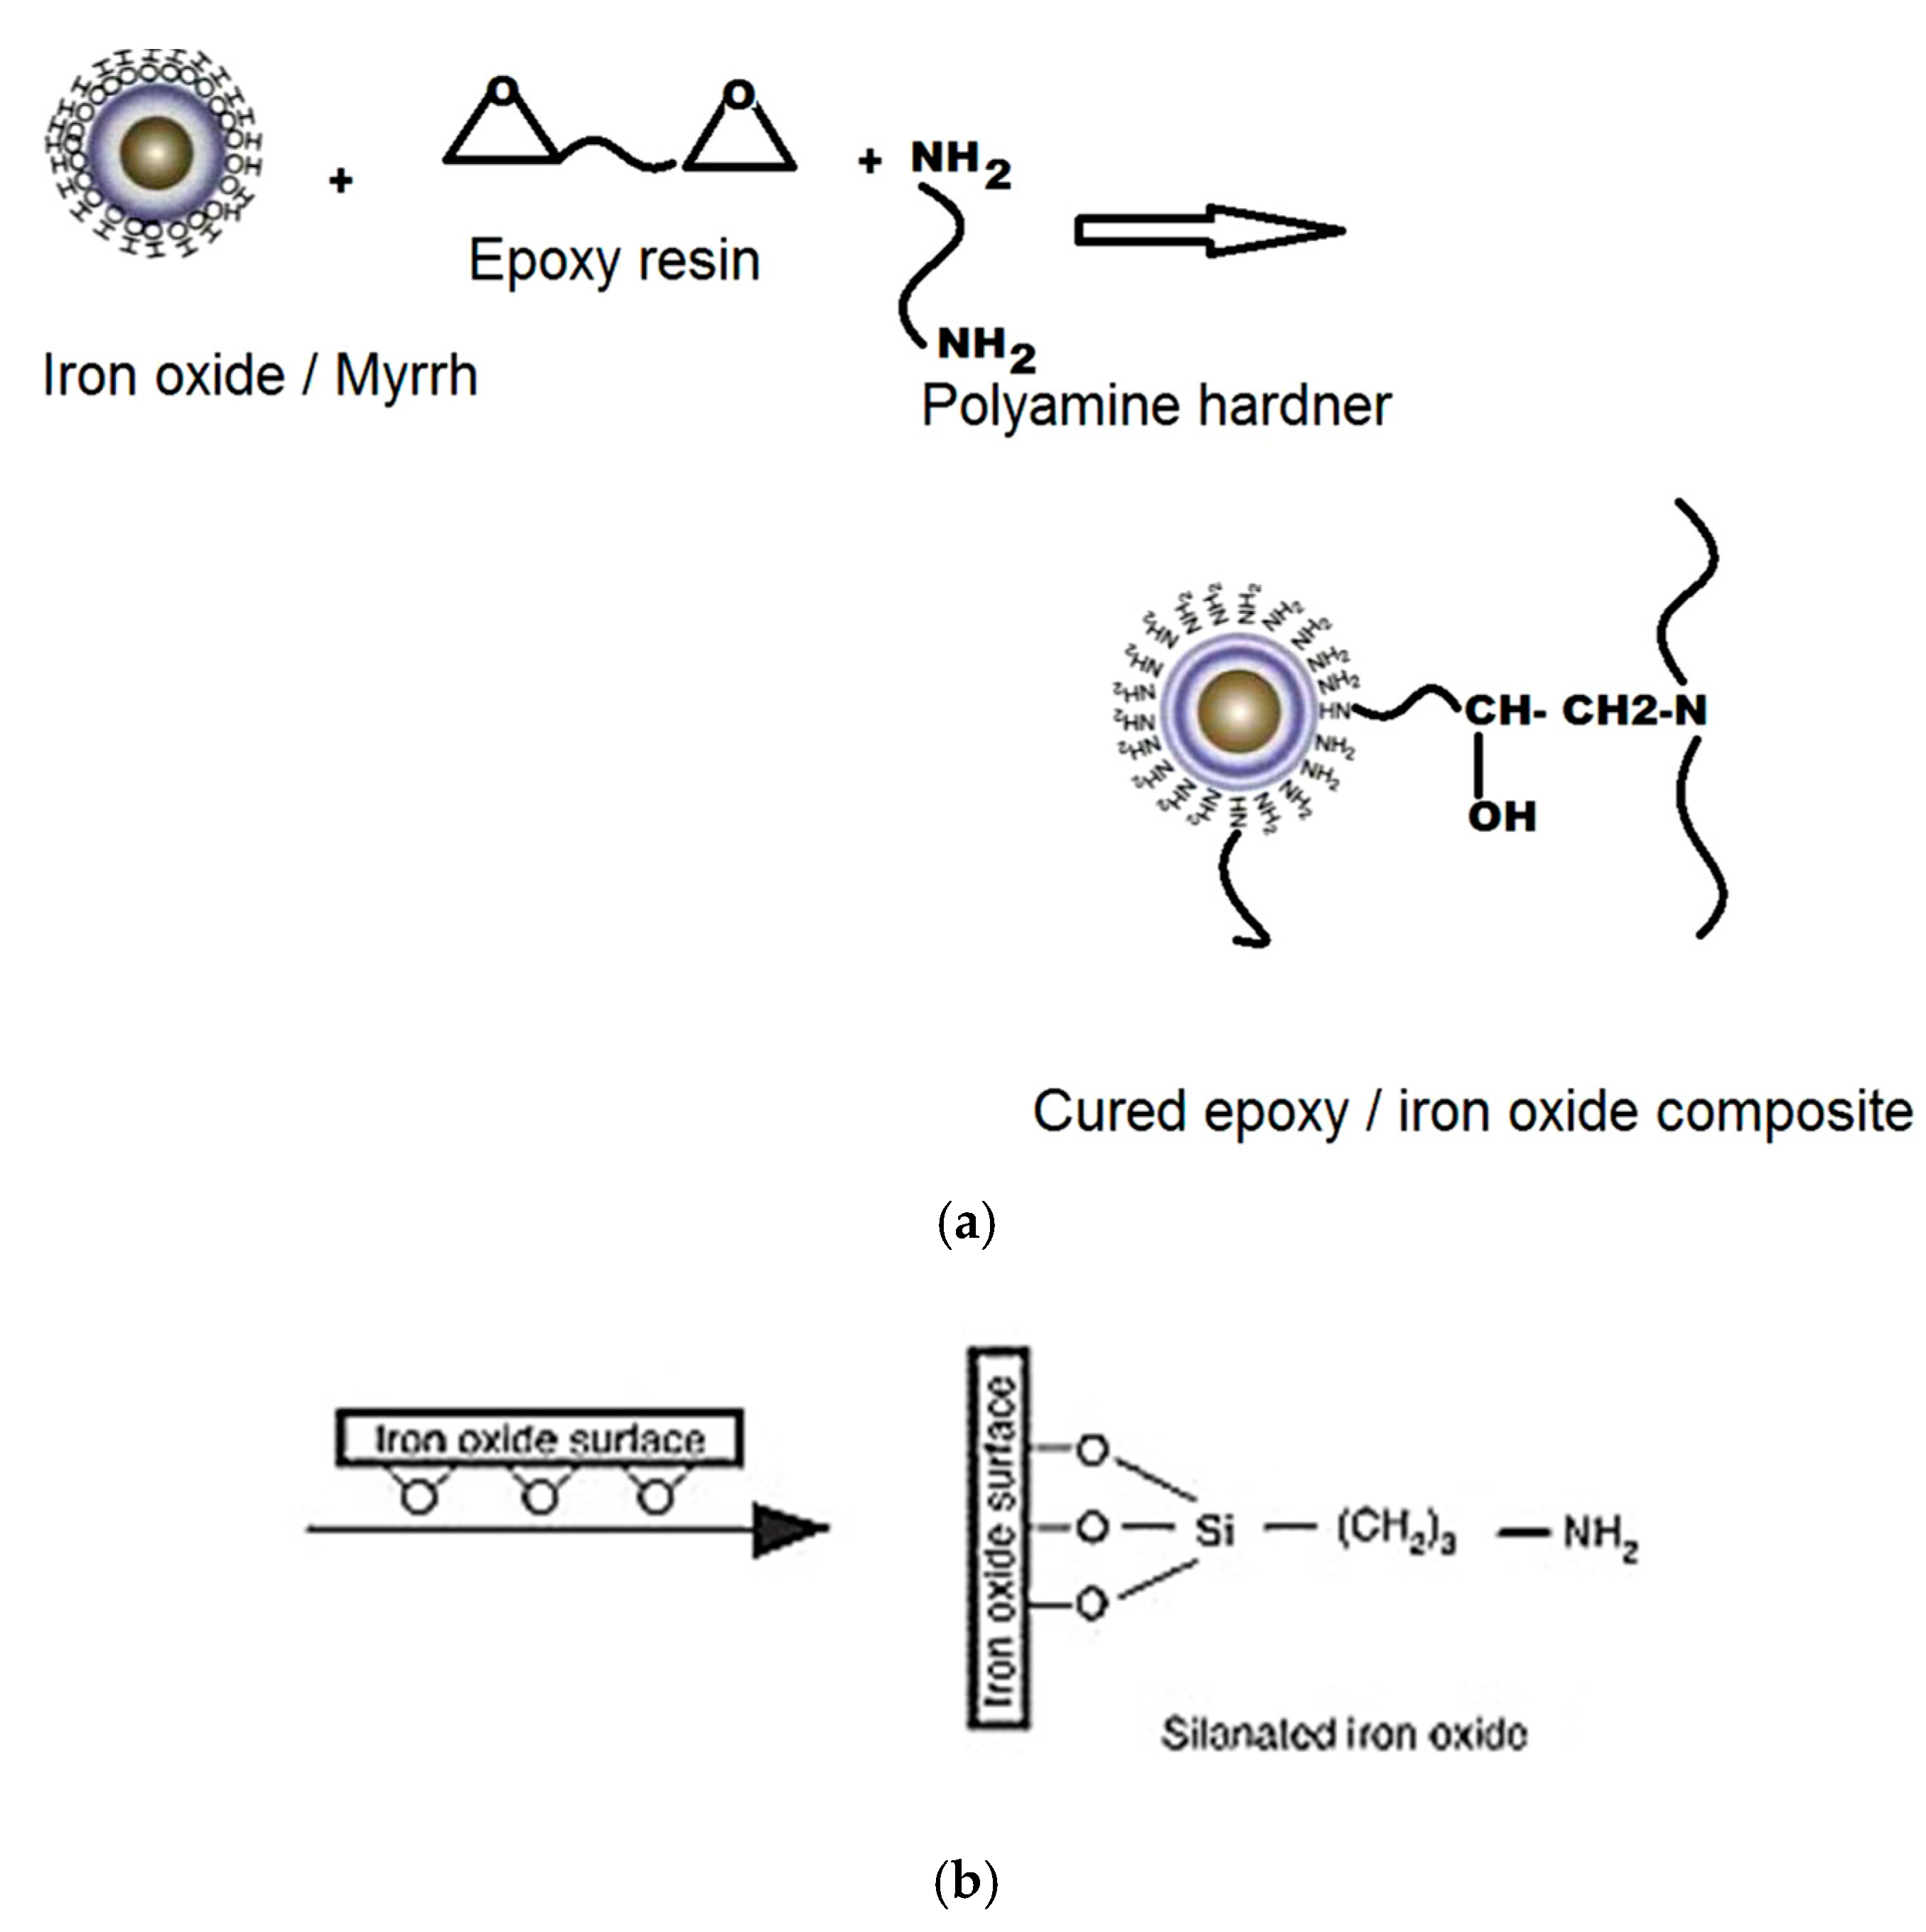
- Binder: Virgin thermoset polymers and inorganic silicones are adhesives and adhesion promotors (coupling agents). They form strong interfacial chemical bonds with transition metal oxide and impart high strength in the pellets using these thermosets as the binder. While epoxy thermoset resins lend high compression strength, the silicones, on the other hand, are easily compressible; nevertheless, they form stronger bonds with metal oxide and do not crumble. In addition, they also offer other advantages of the plastics as an energy source and as the reductants. They offer energy savings, better mechanical properties compared to the conventional binders, such as bentonite, which due to the high silica content, adds to the slag burden. Thermoset polymers offer high strength to the pellets under ambient conditions and can replace the conventional binders, such as bentonites, and organic binders in palletisation process [7].
- Alloying material: Virgin thermoset polymers and inorganic silicones also act as alloying agents in ferrosilicon and silicon carbide, and iron carbide. Silicones can substitute coke and quartz in iron alloy (ferrosilicon) production [8]. The viscous nature of the virgin thermosets provides for solid–liquid–gas reactions promoting good wetting between the reactants. This promotes the elemental silicon in silicones to react with the hematite to form ferrosilicon at much lower than the conventional temperatures. Similarly, the fillers in the epoxy resins easily form alloys with the hematite to produce SiC and FeC8 with nano- and microstructures.
- Carbon sequestration: Virgin thermosets can completely consume the carbon dioxide produced in a high carbon footprint reaction, such as magnesia and magnesium and clinker production, greatly reducing the global warming potential by up to 99%. This is achieved through the use of thermosets for carbon sequestration in the thermal decomposition of magnesite [9].
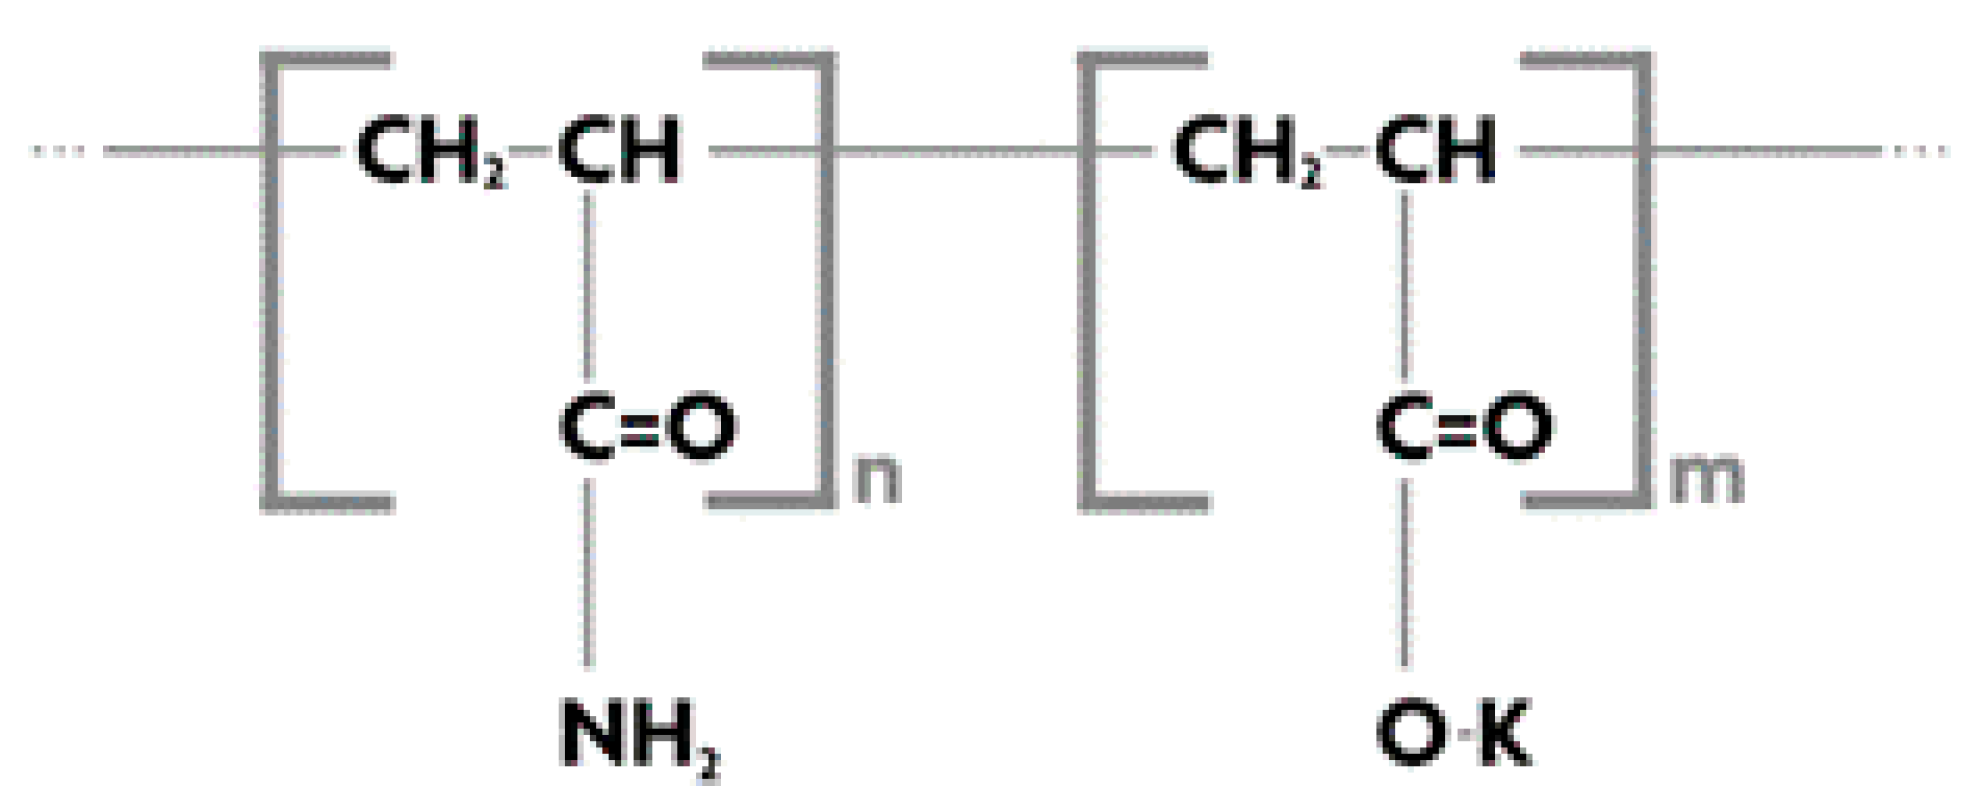
- Application in dewatering of coal: High moisture content in coal, in addition to detrimentally impacting the calorific value, also attracts high transportation tariffs and energy penalties when evaporating techniques are employed for dewatering. Superabsorbent polymers (SAPs) offer ambient dewatering of low-grade coals, greatly improving their calorific values and reducing the transport tariffs. Use of SAPs to dewater fine black coals, brown coals and tailings has been reported [10,11,12].
3. Polymers Used in Mineral Processing and Metallurgy
3.1. Recycled Thermoplastics and Thermosets
3.2. Virgin Thermoset Polymers
3.3. Virgin Silicones (Organic–Inorganic Polymers)
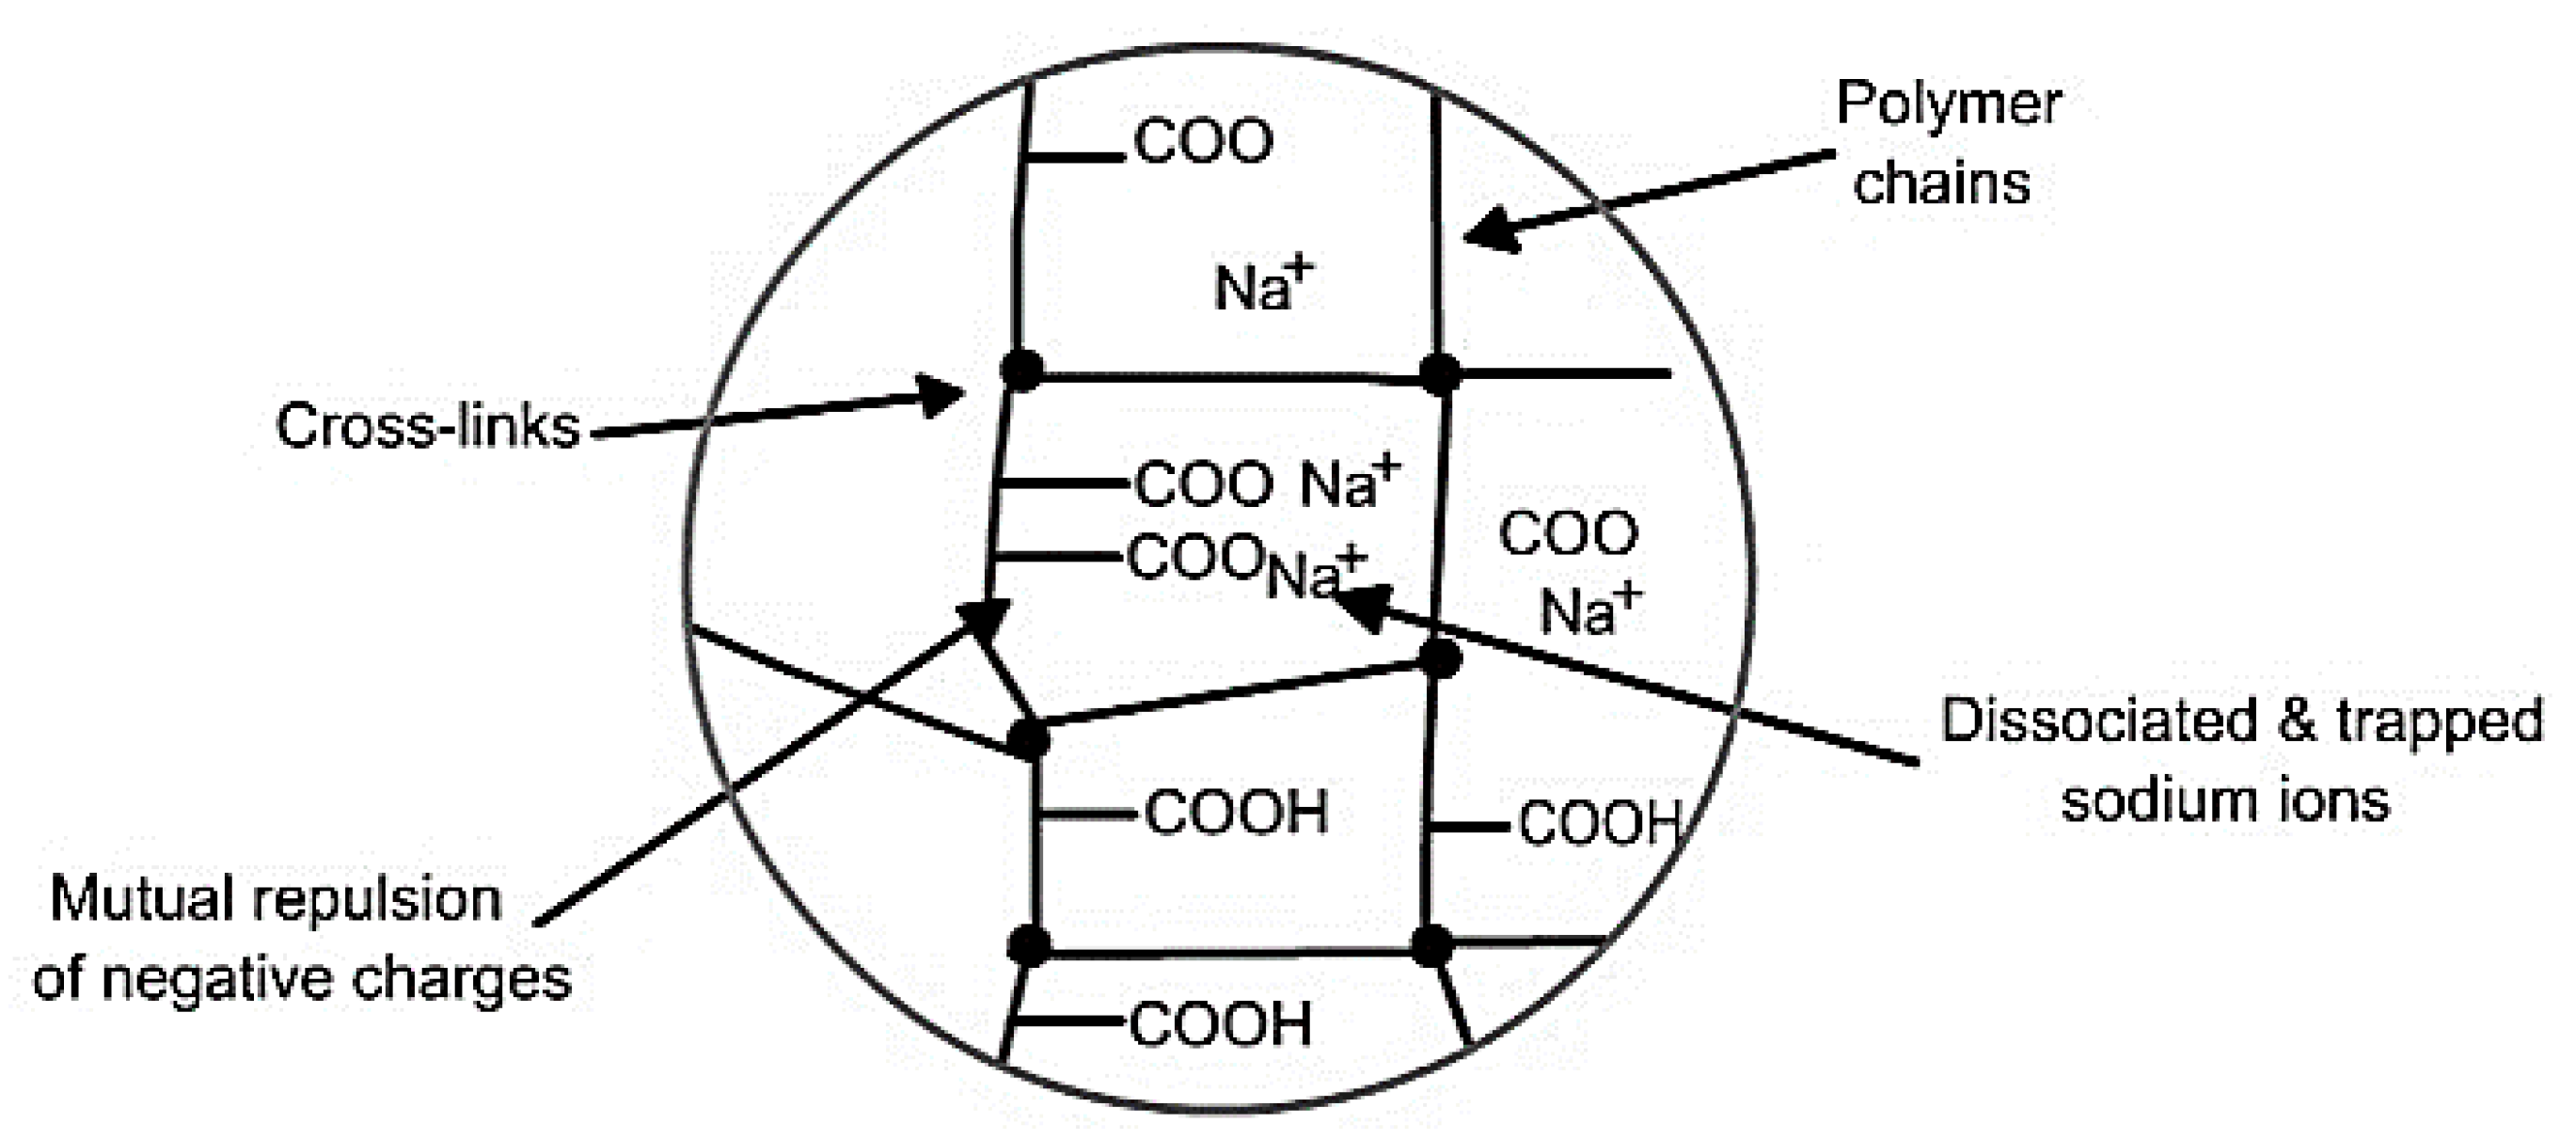
3.4. Superabsorbent Polymers
4. Mineral and Metallurgical Processes Using Recycled and Virgin Polymers
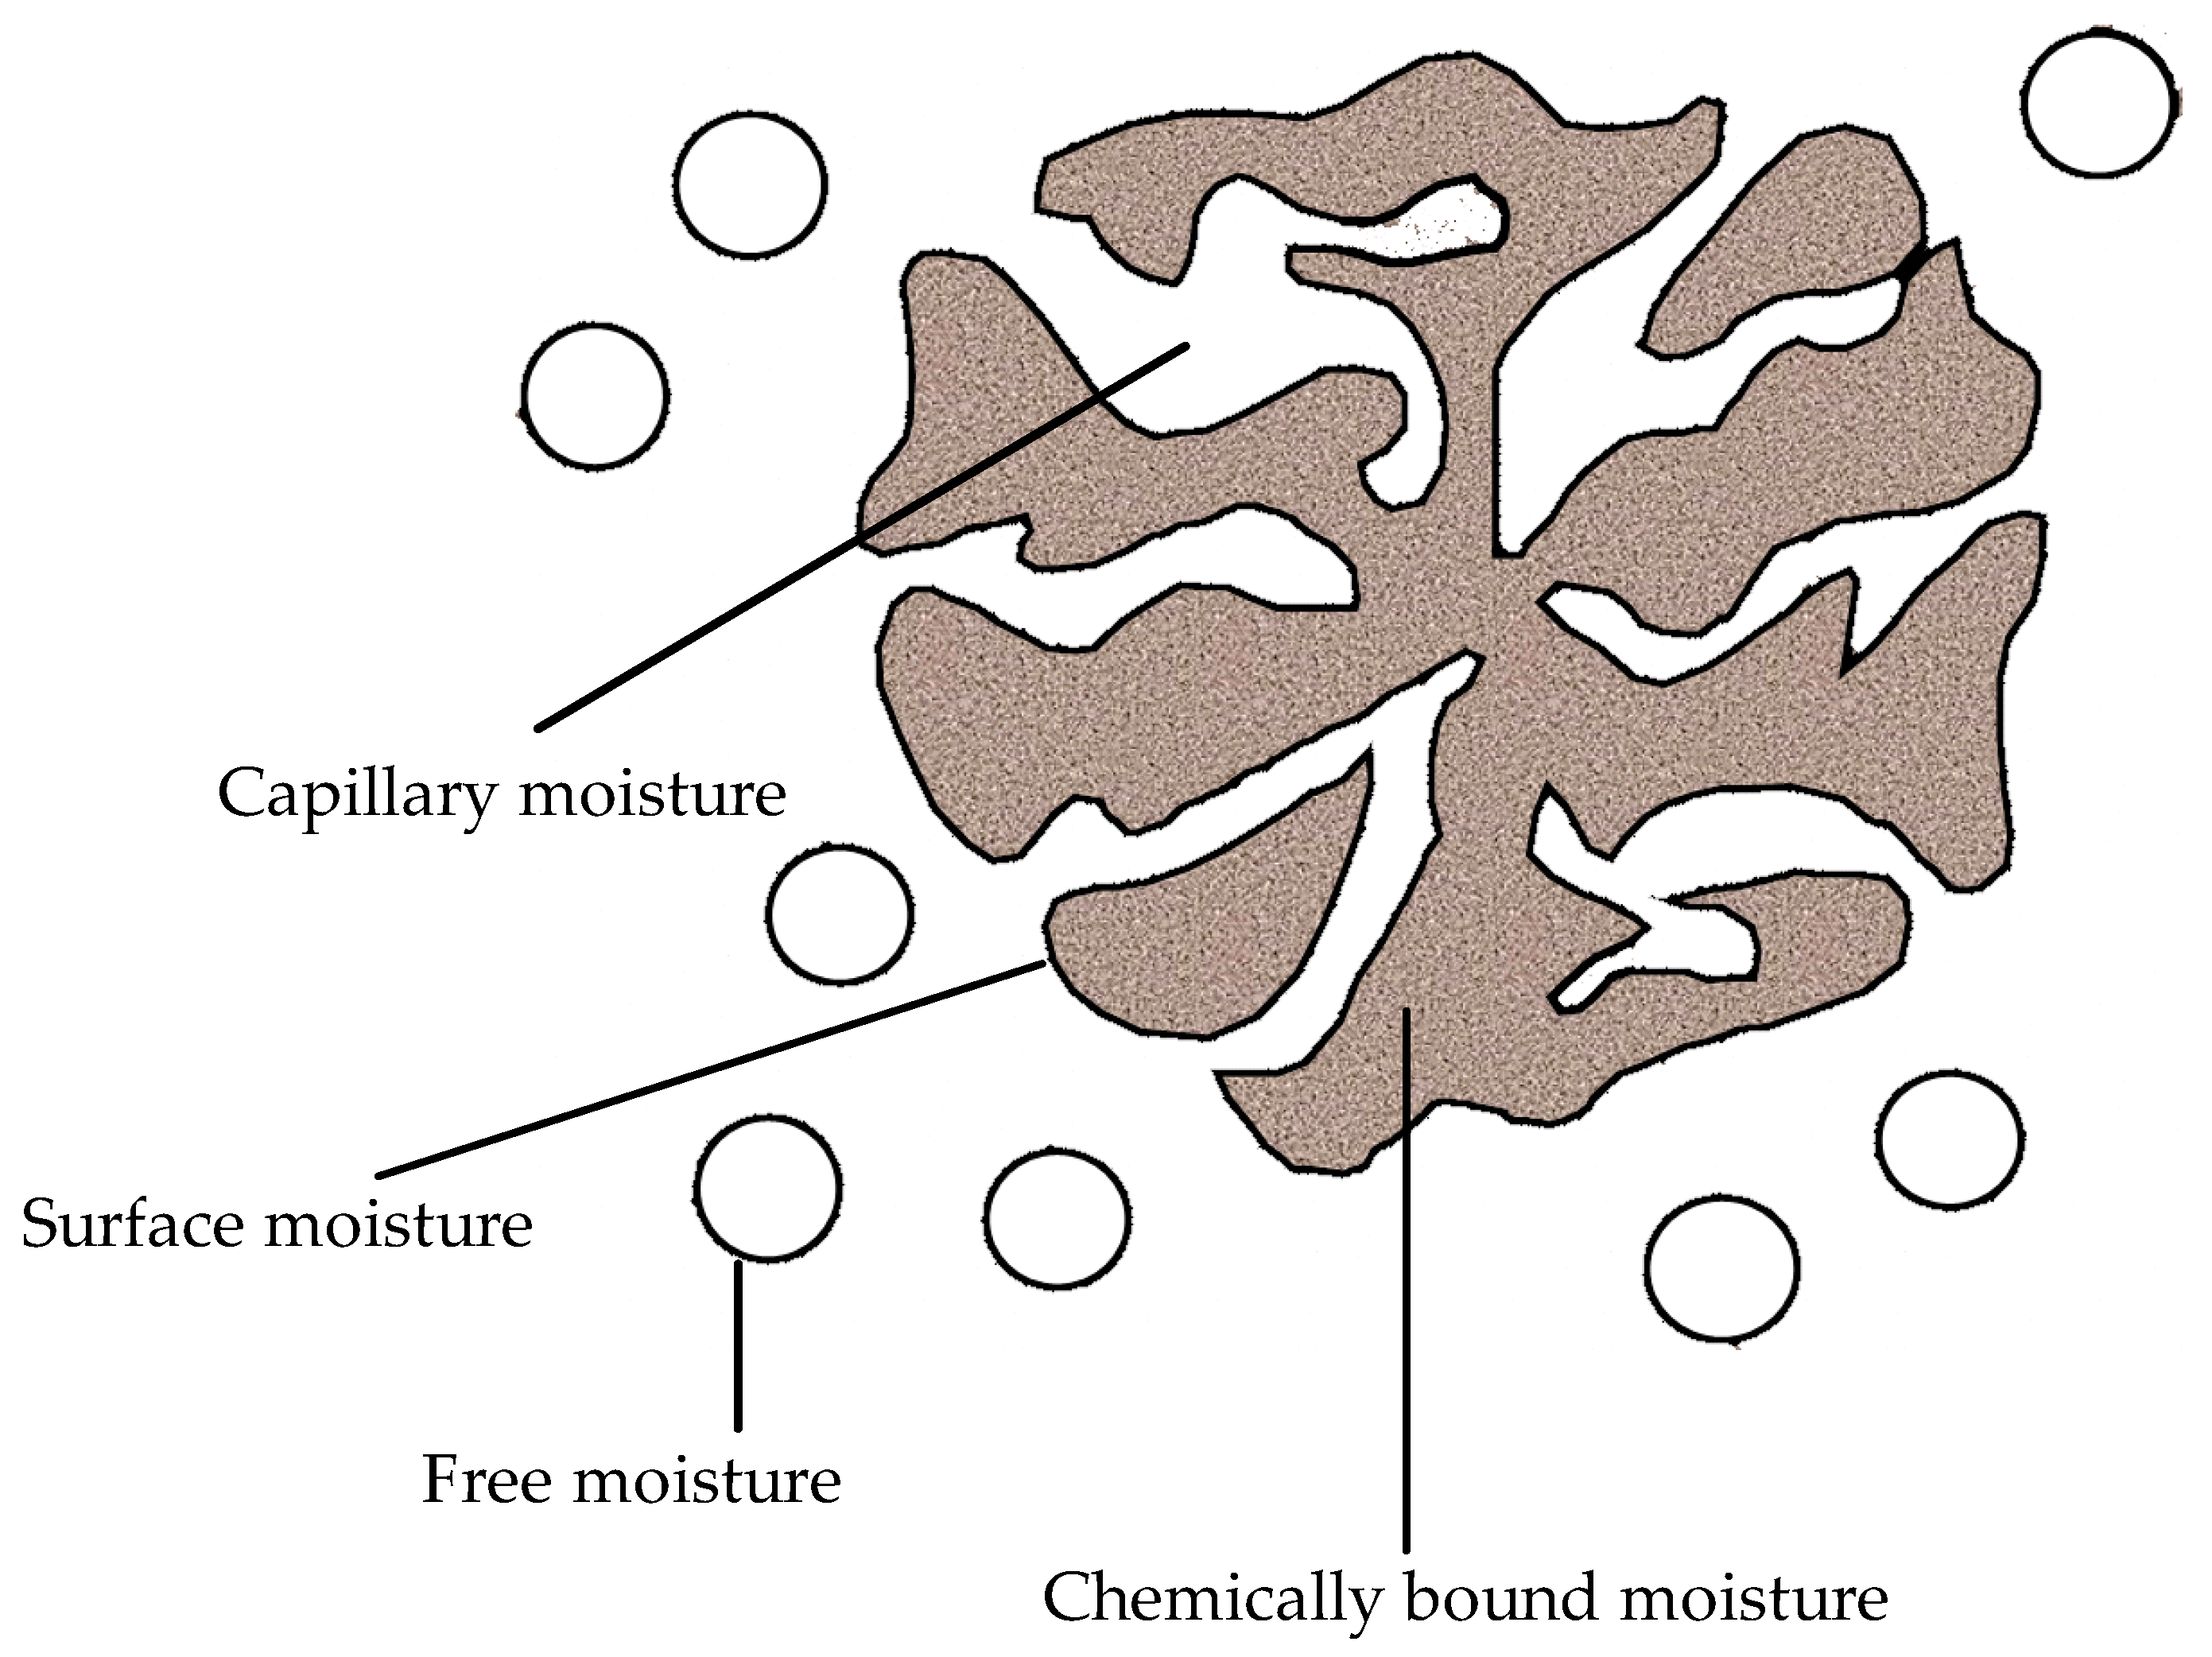
4.1. Dewatering of Coal
- Inter-particle capillary and/or pendular moisture, which can be removed by mechanical techniques broadly classified as centrifugal, vacuum or pressure dewatering processes.
- Surface and intra-particle moisture (held by capillary forces or by chemical adsorption within the macro and micro pores of the particles), which can be removed by thermal drying.
- Chemical water, which is held in chemical combination with certain mineral matter in the coal and may only be released during combustion or gasification process.
- ➢
- Swelling properties (attributed to presence of hydrophilic groups in the network).
- ➢
- Cross-linking density (generally higher molecular weight with lower cross-linking densities exhibits higher absorption capacities).
- ➢
- Structural integrity (high cross-linking density is crucial to retain the structural integrity of the polymer loaded with moisture as the high cross-linking density offers high mechanical strength).
- ➢
- The “availability” of target water, i.e., how tightly it is bound to the drying substrate.
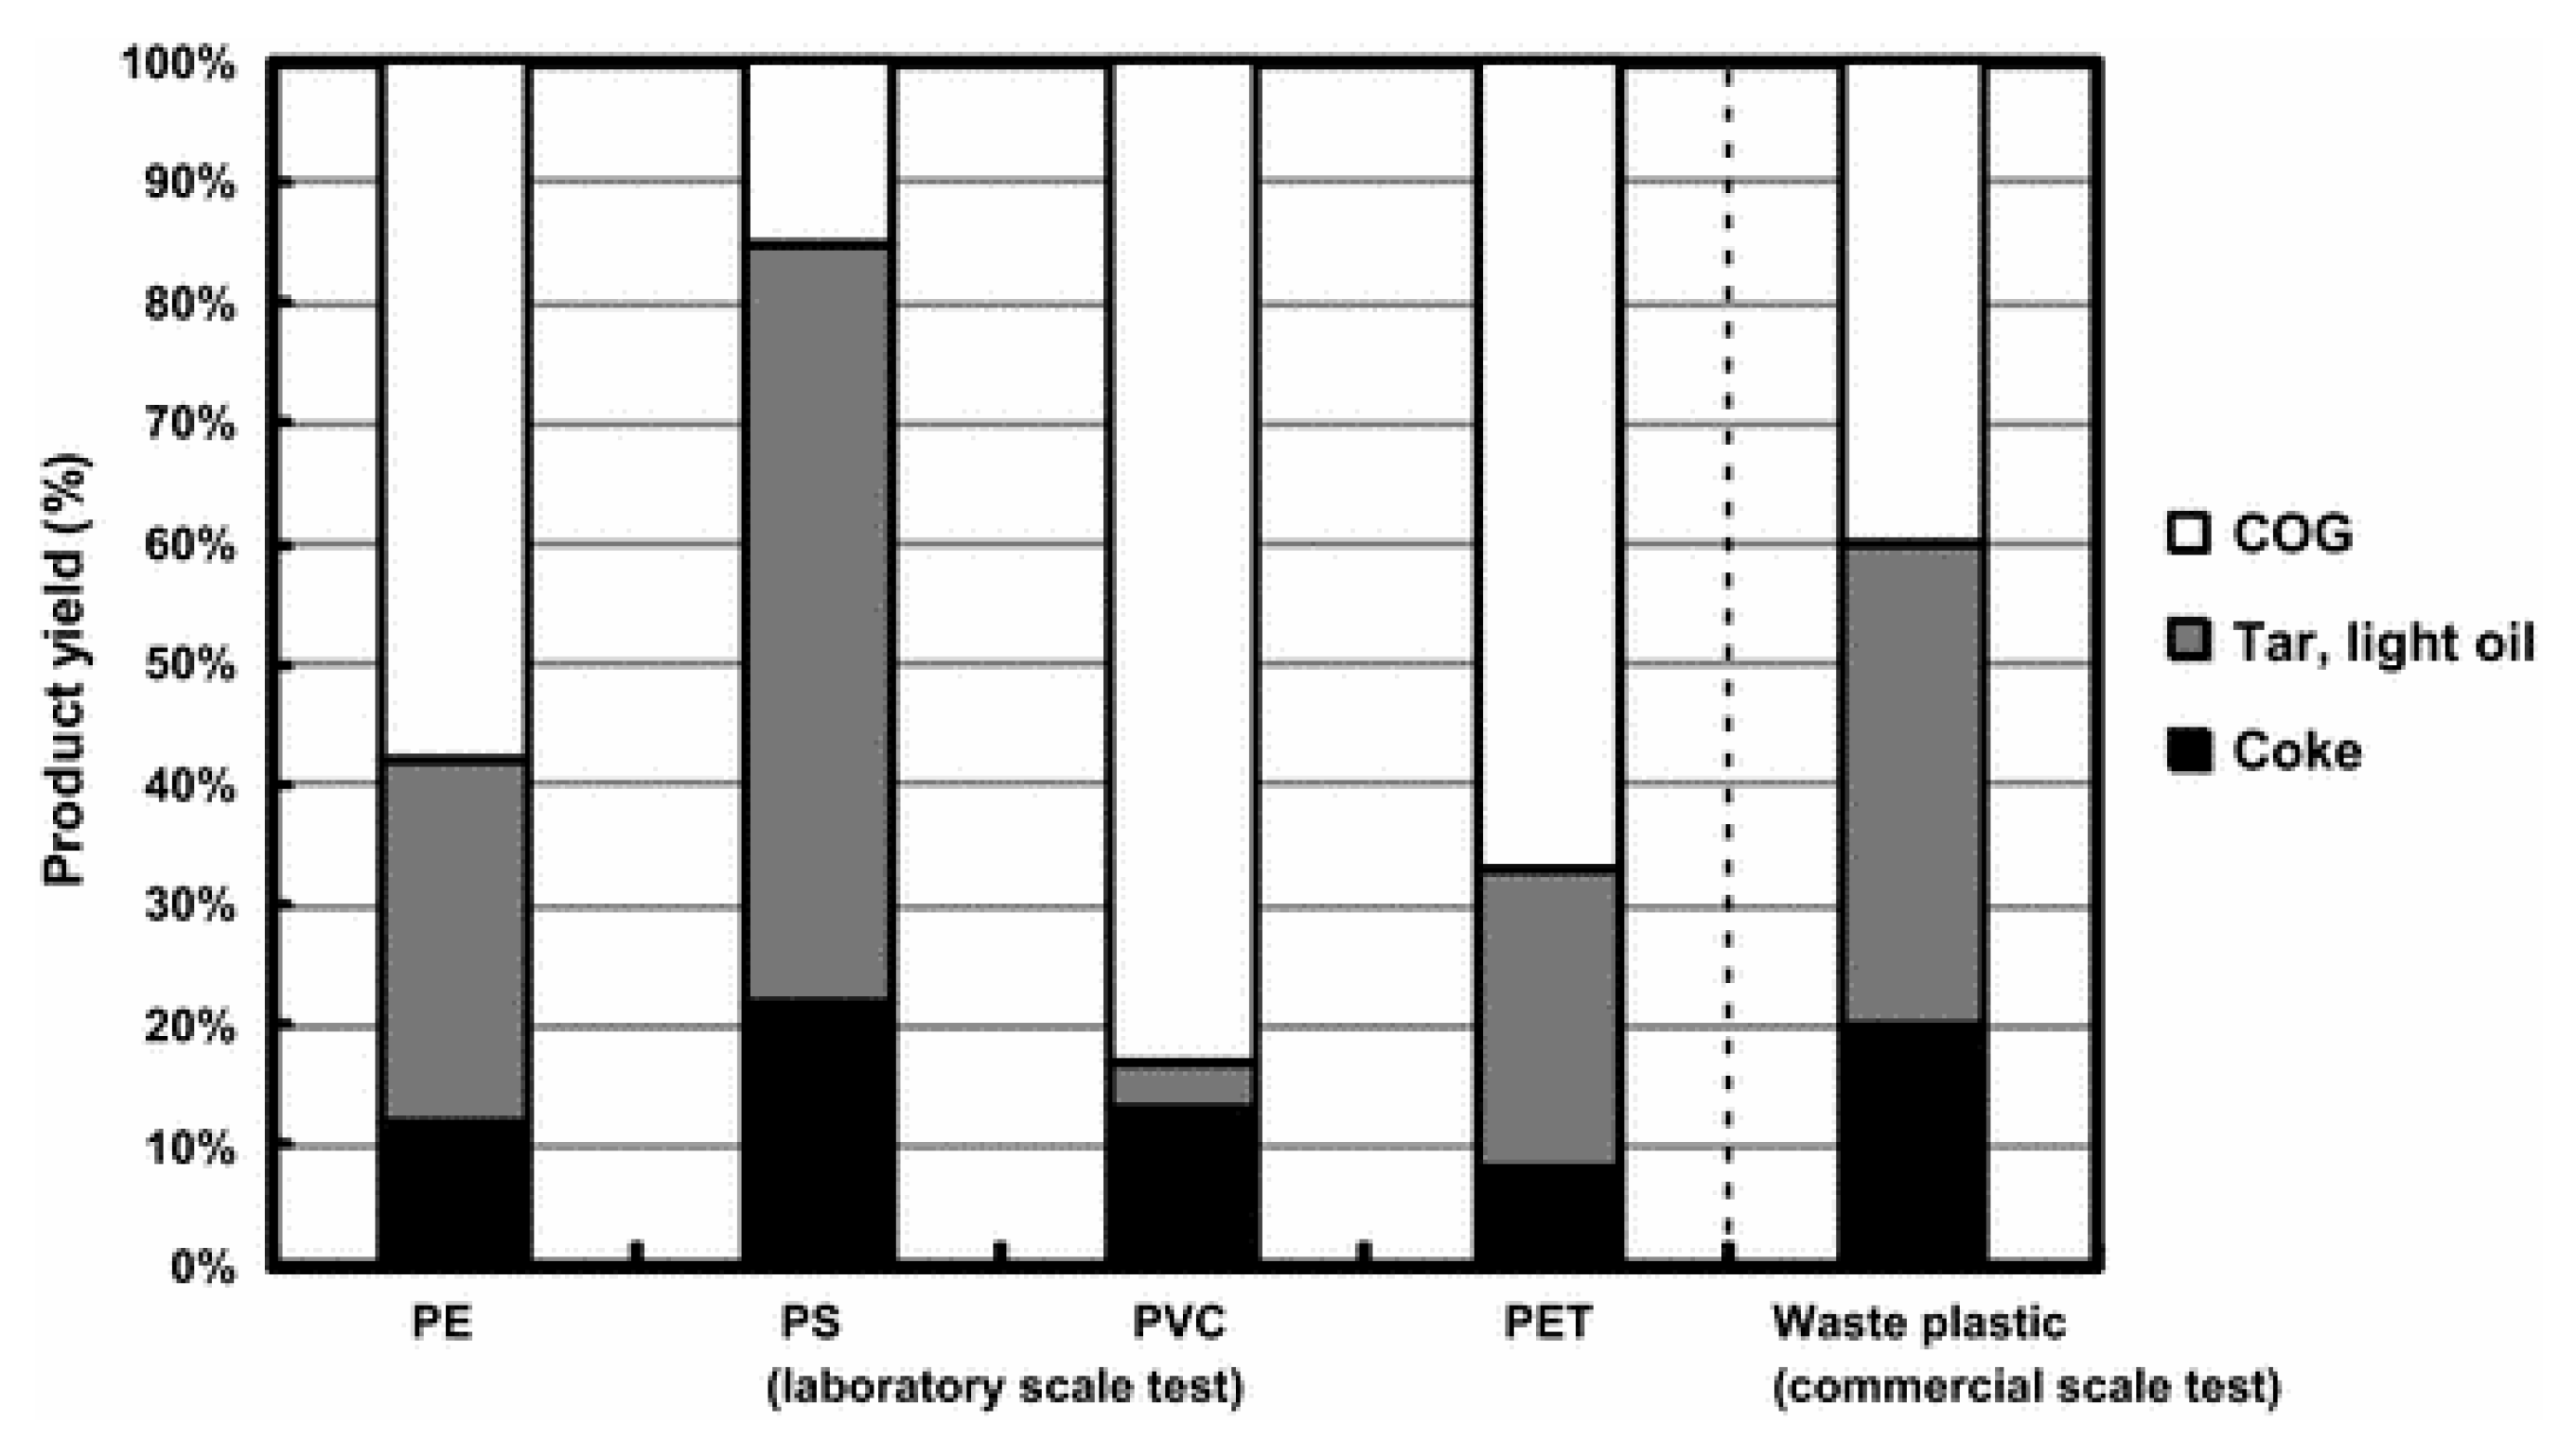
4.2. Coke Oven
4.3. Iron and Steel Making
4.3.1. Recycled Polymers
4.3.2. Virgin Thermoset Polymer
Iron Ore Palletisation
Alloy Formation
- SiC and FeSi formation does not require any high-purity quartz or coke.
- Solid-liquid-gas reactions facilitated by the viscous polymer resin help achieve high reaction efficiency.
- Resources such as H2, CH4, C and Si produced in situ are derived from virgin polymers resins.
- There is a potential to recover these resources from feed stock recycling of thermosets and inorganic–organic polymers like silicones. However, it is necessary to make sure intimate contacts between the reactants are facilitated.
- Iron oxide–polymer composites as potential replacement for coke as spacer.
- Nano- and microstructured alloy phases are formed.
4.4. Manganese Processing
4.5. E-Wastes Processing
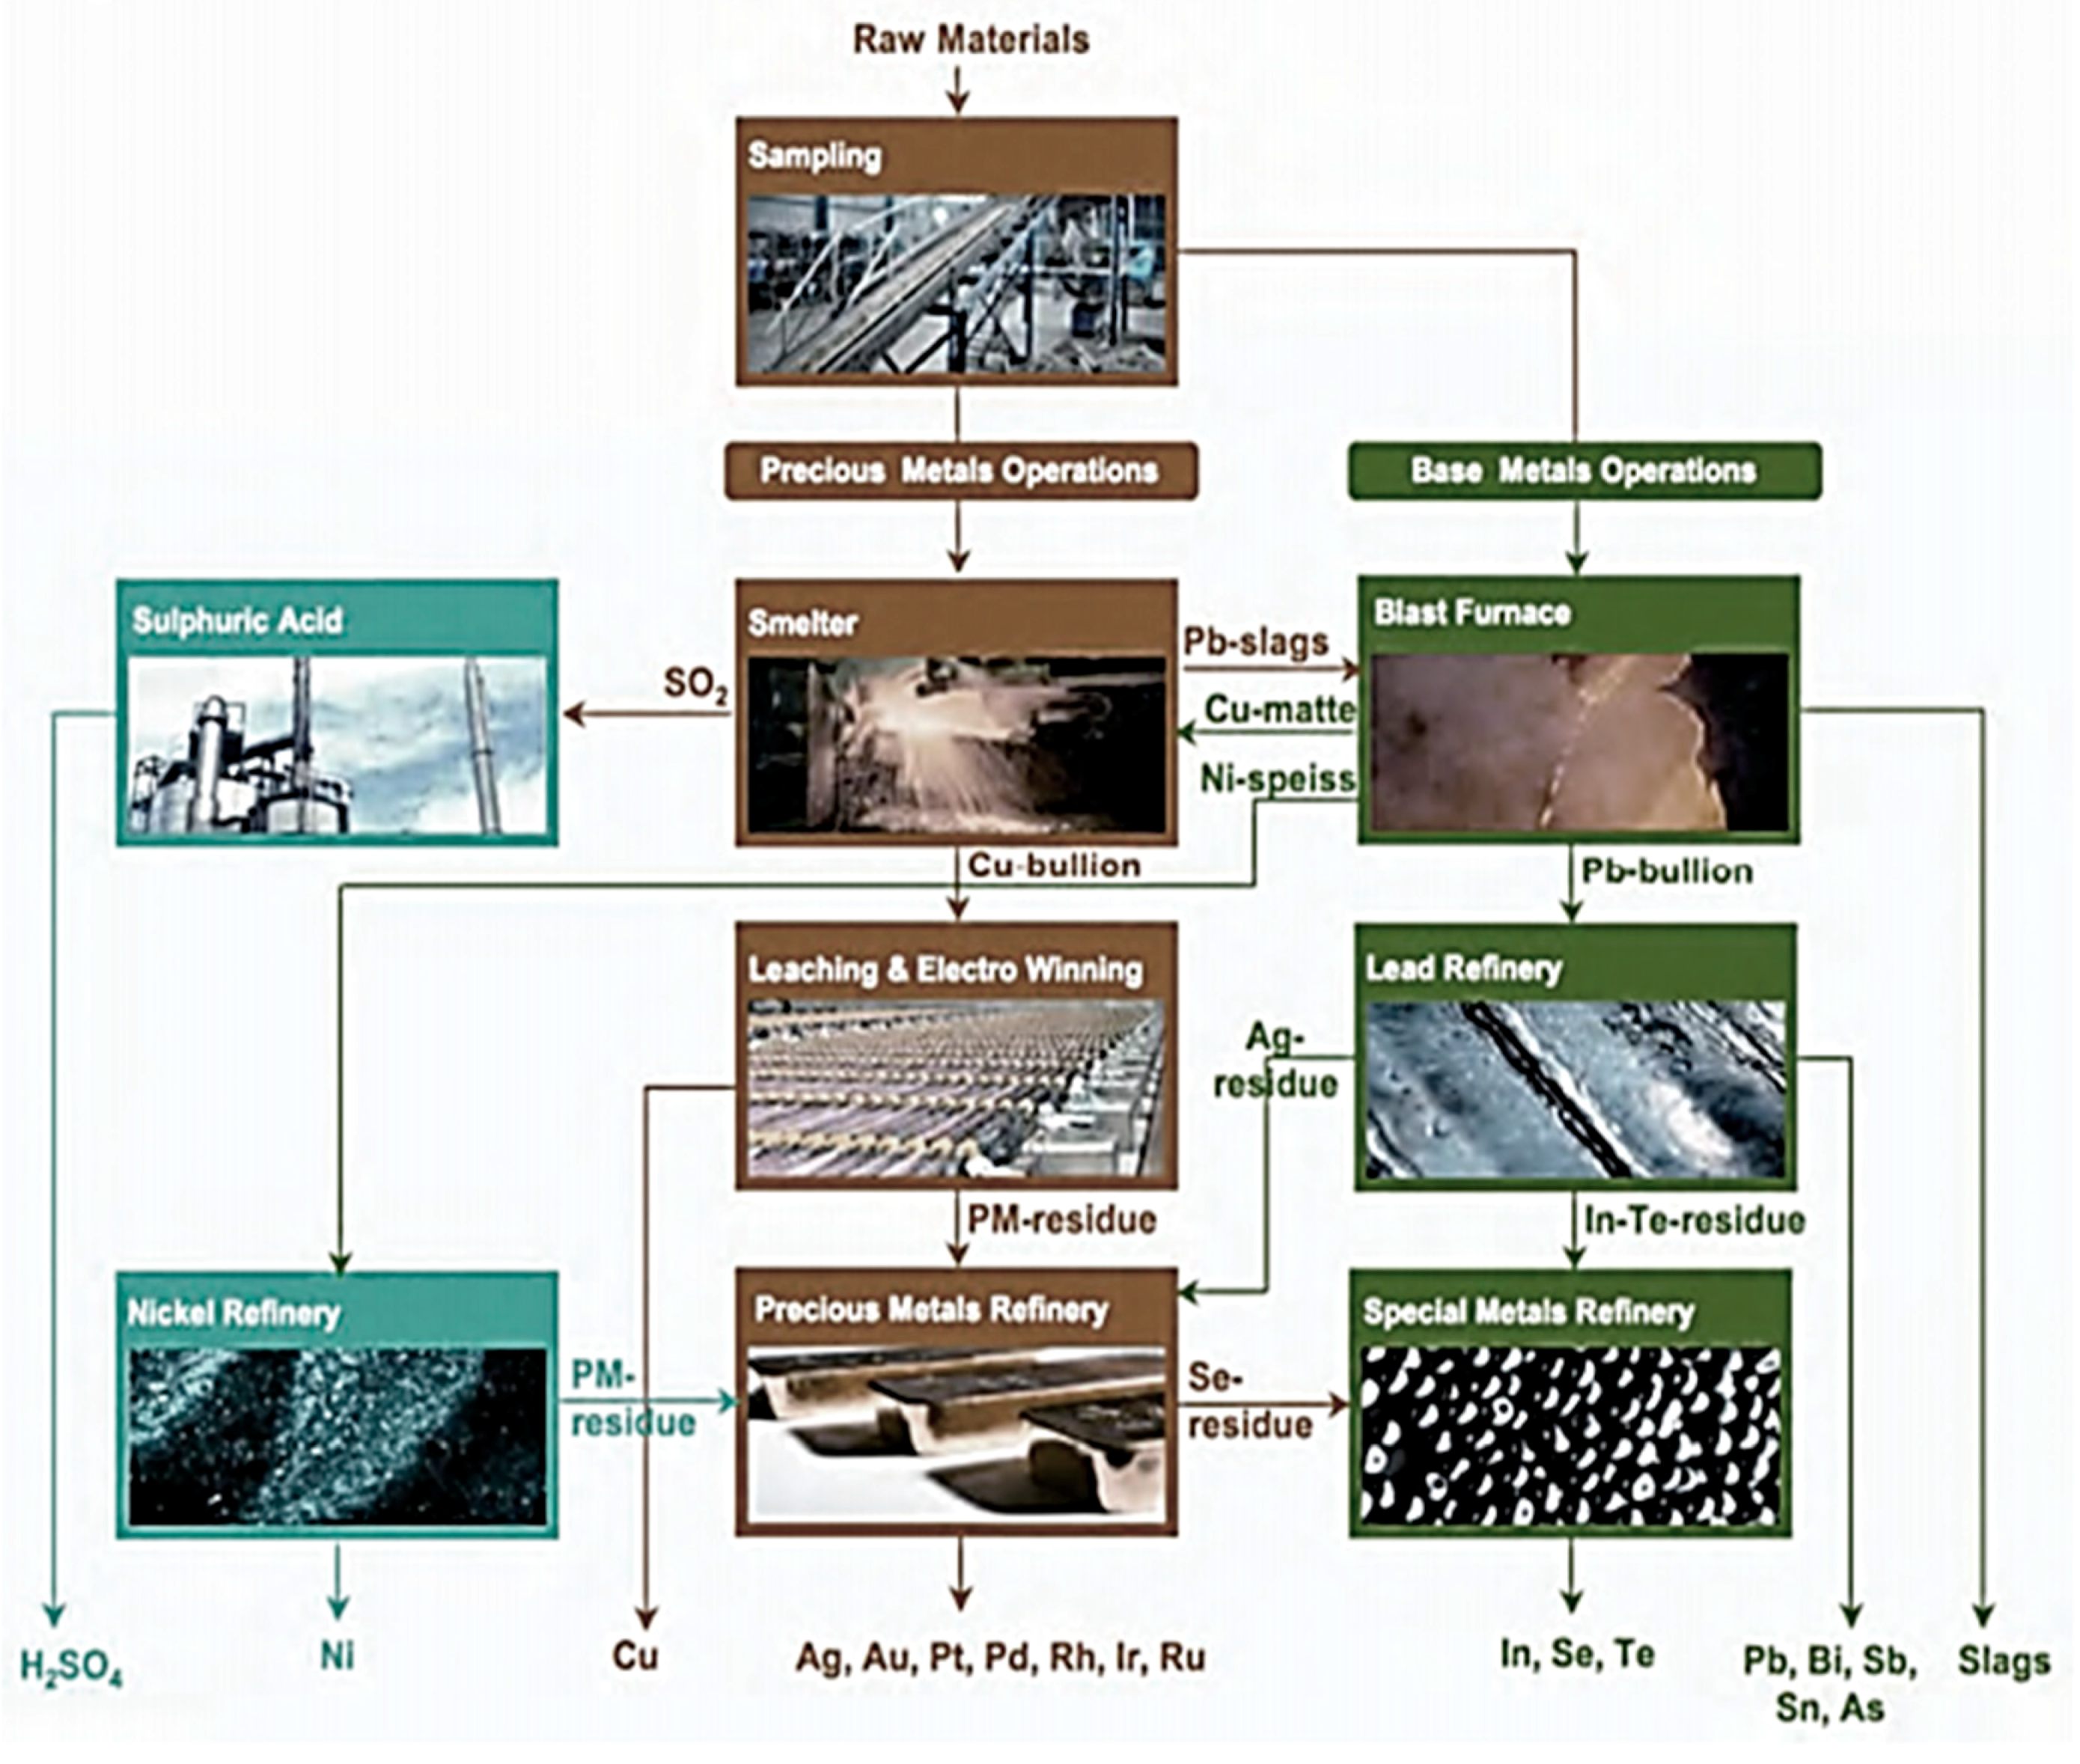
- The integrated furnace has necessary installations to collect the off-gases.
- The plastic fraction serves as a replacement of coke either partially or fully as a reducing agent as well as the fuel.
- The rapid heating above 1000 °C will contain the emissions of Dioxin/Furans within the acceptable limits.
- The copper/nickel/lead base metal metallurgy allows the precious and the lead special metals to be collected as slag.
- The smelter separates precious metals in a copper bullion. Other metals concentrate in a lead slag are further processed at base metals operations.
- The ceramics and the glass are recovered as a slag.
Dioxins/Furan Management
4.6. Carbon Sequestration
4.6.1. Refractories (Magnesium Production, Magnesia-Carbon Production)
4.6.2. Clinker Production
- raw material decomposition (59%),
- fuel combustion (26%), and
- electricity consumption (12%).
5. Distinct Advantages and Limitations of Using Polymers in Mineral and Metallurgical Processing
5.1. Mitigate GHG and Toxic Emissions
5.2. Replaces or Minimises Required Resources and Non-Renewables (Dematerialization)
5.3. Reduction in Process Temperatures and Energy
6. Disadvantages
7. Conclusions
- Coal dewatering, where super absorbent polymers offer ambient non-evaporative technology to dry low-grade brown coals and fine black coals saving on costs, energy and emissions while simultaneously enhancing the calorific values of the same. These super absorbent polymers can be regenerated at low pH or low temperatures (37–52 °C)
- Chemical feedstock recycling of waste plastics in coke oven and blast furnaces produce carbon residues and reducing gases such as methane and hydrogen and fuel oils. They reduce the coke consumption in blast furnace iron making and CO2 emissions >30%. In EAF, they aid slag foaming contributing to energy reductions. Harmful emissions of dioxins are reduced during the feedstock recycling of waste plastics.
- For iron ore palletisation in this novel process, the epoxy resins used as the binder, reductant and as fuel, offer high compression strength under ambient conditions, far exceeding the heat induration strength, saving on costs, energy and emissions. In addition, the reducing atmosphere provided by the polymer resins reduce the reaction temperature by about 100 °C. Use of the bio-renewable epoxy resins, currently being commercialised, makes this a green process.
- Iron alloy production, where silicones and the epoxy resins are used as the alloying agents, binder, reductant and fuel towards the production of ferrosilicon, silicon carbide with varying microstructures. The alloy formation occurs at 1600 °C as opposed to the conventional 2000 °C.
- The polymer resins reduce the non-renewable coke consumption in the above processes.
- Carbon sequestration, where the plastics used totally consume the CO2 produced in a high carbon high footprint reaction, such as thermal decomposition of magnesite or clinker production, simultaneously producing hydrogen, contributing to hydrogen economy.
- The plastics in e-wastes are used as fuel and reductant in recovering valuable metals.
- Recycling of used polymers offers competent waste management strategy reducing the land-fill burden.
Author Contributions
Funding
Conflicts of Interest
References
- Bernardo, C.A.; Simões, C.L.; Pinto, L.M.C. Environmental and economic life cycle analysis of plastic waste management options. Aip Conf. Proc. 2016. [Google Scholar] [CrossRef]
- Life Cycle Assessment. Available online: https://lifecycleofplastic.wordpress.com/ (accessed on 17 February 2019).
- Geyer, R.; Jambeck, J.; Law, K.L. Supplementary materials for production, use, and fate of all plastics ever made. Sci. Adv. 2017, 3, e1700782. [Google Scholar] [CrossRef] [PubMed]
- Pilz, H. Criteria for Eco-Efficient (Sustainable) Plastic Recycling and Waste Management; GmbH Hietzinger Hauptstrasse: Vienna, Austria, 2014. [Google Scholar]
- VOEST. High Temperature Pyrolysis of Plastic Waste; Plant Construction of VOEST-Alpine, Styrian Material Flow Management, Styrian Provincial Government: Styria, Austria, 1997.
- ImpEE Project, Recycling of Plastics. Available online: http://www-g.eng.cam.ac.uk/impee/topics/RecyclePlastics/files/Recycling%20Plastic%20v3%20PDF.pdf (accessed on 17 February 2019).
- Devasahayam, S. A novel iron ore pelletization for increased strength under ambient conditions. Sustain. Mater. Technol. 2018, 17, e00069. [Google Scholar] [CrossRef]
- Devasahayam, S. Sustainable development of selective iron carbide, silicon carbide and ferrosilicon (low temperature) phases during iron ore reduction using only polymers. Sustain. Mater. Technol. 2018, 16, 23–37. [Google Scholar] [CrossRef]
- Devasahayam, S.; Strezov, V. Thermal decomposition of magnesium carbonate with biomass and plastic wastes for simultaneous production of hydrogen and carbon avoidance. J. Clean. Prod. 2018, 174, 1089–1095. [Google Scholar] [CrossRef]
- Dzinomwa, G.; Wood, C.; Hill, D. Fine coal dewatering using pH-sensitive and temeprature sensitive super absorbent polymers. Polym. Adv. Technol. 1997, 8, 767–772. [Google Scholar] [CrossRef]
- Devasahayam, S.; Ameen, M.; Verheyen, T.; Bandyopadhyay, S. Brown coal dewatering using poly acrylamide-co-potassium acrylic based super absorbent polymers. Minerals 2015, 5, 623–636. [Google Scholar] [CrossRef]
- Roshani, A.; Fall, M.K. Kennedy Drying behavior of mature fine tailings pre-dewatered with super-absorbent polymer (SAP): Column experiments. Geotech. Test. J. 2047, 40, 20160034. [Google Scholar] [CrossRef]
- García, J.; Jones, G.; Virwani, K.; McCloskey, B.; Boday, D.; Huurne, G.T.; Horn, H.; Coady, D.; Bintaleb, A.; Alabdulrahman, A.; et al. Recyclable, strong thermosets and organogels via paraformaldehyde condensation with diamines. Science 2014, 344, 732–735. [Google Scholar] [CrossRef]
- Schneiderman, D.; Vanderlaan, M.; Mannion, A.; Panthani, T.; Batiste, D.; Wang, J.; Bates, F.; Macosko, C.; Hillmyer, M. Chemically recyclable biobased polyurethanes. ACS Macro Lett. 2016, 5, 515–518. [Google Scholar] [CrossRef]
- Ma, S.; Webster, D.; Jabeen, F. Hard and flexible, degradable thermosets from renewable bioresources with the assistance of water and ethanol. Macromolecules 2016, 49, 3780–3788. [Google Scholar] [CrossRef]
- Ray, S.; Cooney, R.P. Thermal degradation of polymer and polymer composites. In Handbook of Environmental Degradation of Materials, 2nd ed.; Kutz, M., Ed.; Elsevier: Oxford, UK, 2012. [Google Scholar]
- Pickering, S. Recycling technologies for thermoset composite materials—Current status. Compos. Part A Appl. Sci. Manuf. 2006, 37, 1206–1215. [Google Scholar] [CrossRef]
- Pimenta, S.; Pinho, S. Recycling carbon fibre reinforced polymers for structural applications: Technology review and market outlook. Waste Manag. 2011, 31, 378–392. [Google Scholar] [CrossRef] [PubMed] [Green Version]
- Nakanoh, K.; Hayashi, S.; Kida, K. Waste treatment using induction heated pyrolysis. Fuji Electr. Rev. 2001, 47, 69–73. [Google Scholar]
- Bailer, C.L.; Hirchler, M. Thermal decomposition of polymers. SFPE Handb. Fire Prot. Eng. 2002, 2, 111–131. [Google Scholar]
- Kato, K.; Nomura, S.; Uematsu, H. Waste plastics recycling process using coke ovens. J. Mater. Cycles Waste Manag. 2003, 5, 98–101. [Google Scholar] [CrossRef]
- Arabiourrutia, M.; Elordi, G.; Lopez, G.; Borsella, E.; Bilbao, J.; Olazar, M. Characterization of the waxes obtained by the pyrolysis of polyolefin plastics in a conical spouted bed reactor. J. Anal. Appl. Pyrolysis 2012, 94, 230–237. [Google Scholar] [CrossRef]
- Almeida, D.; Marques, M.D.F. Thermal and catalytic pyrolysis of plastic waste. Polímeros 2016, 26, 44–51. [Google Scholar] [CrossRef] [Green Version]
- Donaj, P.; Kaminsky, W.; Buzeto, F.; Yang, W. Pyrolysis of polyolefins for increasing the yield of monomers’ recovery. Waste Manag. 2012, 32, 840–846. [Google Scholar] [CrossRef]
- Sekine, Y.; Fukunda, K.; Kato, K.; Adachi, Y.; Matsuno, Y. CO2 reduction potentials by utilizing waste plastics in steel works. Int. J. Life Cycle Assess. 2009, 14, 122–136. [Google Scholar] [CrossRef]
- Cunliffe, A.; Jones, N.; Williams, P.T. Recycling of fibre-reinforced polymeric waste by pyrolysis: Thermo-gravimetric and bench-scale investigations. J. Anal. Appl. Pyrolysis 2003, 70, 315–338. [Google Scholar] [CrossRef]
- Costiuc, L.; Tierean, M.; Baltes, L.; Patachia, S. Experimental investigation on the heat of combustion for solid plastic waste mixtures. Environ. Eng. Manag. J. 2015, 14, 1295–1302. [Google Scholar] [CrossRef]
- Farzana, R.; Rajarao, R.; Sahajwalla, V. Transforming waste plastic into reductants for synthesis of ferrosilicon alloy. Ind. Eng. Chem. Res. 2014, 53, 19870–19877. [Google Scholar] [CrossRef]
- Atta, M.A.; El-Saeed, M.A.; Al-Shafey, I.H.; El-Mahdy, A.G. Self-healing passivation of antimicrobial iron oxide nanoparticles for Epoxy nanocomposite coatings on carbon steel. Int. J. Electrochem. Sci. 2016, 11, 5735–5752. [Google Scholar] [CrossRef]
- Takeshi, K. Process for Recycling Silicone; United. States Patent 6172253, 9 Jan 2001. [Google Scholar]
- ECO, USA. Silicone Recycling. 2015. Available online: http://www.siliconerecycling.com/benefits-of-silicone-recycling/ (accessed on 11 February 2019).
- Shin-Etsu Chemical, Co., Ltd. Silane Coupling Agents. 2017. Available online: https://www.shinetsusilicone-global.com/products/type/silanecoup/index.shtml (accessed on 13 February 2019).
- Asanuma, M.; Ariyama, T.; Sato, M.; Murai, R.; Nonka, T.; Okochi, I.; Tsukiji, H.; Nemoto, K. Development of waste plastics injection process in blast furnace. ISIJ Int. 2000, 40, 244251. [Google Scholar] [CrossRef]
- Kumar, C. Nanometerials for Life Sciences, Magnetic Nanomaterials; Kumar, C.S.S.R., Ed.; Wiley-VCH Verlag Gmbh & Co.: Weinheim, Germany, 2011; Volume 4. [Google Scholar]
- Lutz, M.; Gentle, T.E.; Perz, S.; Owen, M. Novel silane adhesion promotoers for hydrosilylation cure system. Silanes Other Coupling Agents 2000, 2, 3–13. [Google Scholar]
- NuSil Technology, Thermally Stable Silicones for Space and Aircraft Applications. 2010. Available online: http://www.eimmedical.com/wp-content/uploads/2011/03/Thermally-Stable-Silicones-for-Space-and-Aircraft-Applications.pdf (accessed on 17 February 2019).
- Brandt, B.; Kletzer, E.; Pilz, H.; Hadzhiyska, D.; Seizov, P. In a nut shell: Silicon-Chemistry, an assessment of greenhouse, covering the production, use and end-of-Life. Denkstatt. Austria. 2012. Available online: www.siliconescarbonbalance.com (accessed on 4 February 2019).
- Masuda, K.; Iwata, H.; Masuda, K.; Iwata, H. Dewatering of particulate materials utilizing highly water-absorptive polymer. Powder Technol. 1990, 63, 113–119. [Google Scholar] [CrossRef]
- Moody, G. Role of polyacrylamides and related products in treatment of mineral processing effluent. Trans. Inst. Min. Metall. 1990, 99, C136. [Google Scholar]
- SadeghiI, M.; Hosseinzadeh, H. Synthesis and properties of collagen-g-poly(sodium acrylate-co-2-hydroxyethylacrylate) superabsorbent hydrogels. Braz. J. Chem. Eng. 2013, 30, 379–389. [Google Scholar] [CrossRef] [Green Version]
- Jiang, S.; Sun, X.; Xie, Z.; Qin, L. Study on synthesis and property of anti-salt super absorbent resin. Adv. Mater. Res. 2013, 873, 683–688. [Google Scholar] [CrossRef]
- Laftha, W.; Hashim, S.; Ibrahim, A. Polymers hydrogel: A review. Polym. Plast. Technol. Eng. 2011, 50, 1475–1486. [Google Scholar] [CrossRef]
- Williams, D.; Whitton, S. Improving the Control of Product Coal Moisture Based on Unsaturated Soil Mechanics Principles; Australian Coal Association Research Program: Brisbane City, Australia, 2008. [Google Scholar]
- Sastry, K. Dewatering of Fine Coal. EPRI Research: Palo Alto, CA, USA, 1991. [Google Scholar]
- Devasahayam, S.; Bandyopadhyay, S.; Hill, D.J.T. Study of Victorian brown coal dewatering by super absorbent polymers using attenuated total reflection Fourier transform infrared spectroscopy. Miner. Process. Extr. Metall. Rev. 2016, 37, 220–226. [Google Scholar] [CrossRef]
- Elliott, M. Super Absorbent Polymers; BASF: Aktiengesellschaft, Germany, 2004. [Google Scholar]
- Devasahayam, S.; Bandyopadhyay, S.; Strezov, V.; Sarkhel, G.; Sen, A.K. An Overview of New Ambient Coal Drying by Superabsorbent Polymer-Fly Ash-Nanocomposites—A Clean Coal Technology; MPT: Chennai, India, 2017. [Google Scholar]
- Kato, K.; Nomura, S.; Uematsu, H. Development of waste plastics recycling process using coke oven. ISIJ Int. 2002, 42, S10–S13. [Google Scholar] [CrossRef]
- Kato, K.; Nomura, S.; Fukuda, K.; Uematsu, H.; Kondoh, H. Development of waste plastics recycling process using coke oven. In Nippon Steel Technical Report No. 94; Nippon Steel and Sumitomo metal corporation: Tokyo, Japan, 2004. [Google Scholar]
- Nomura, S. Use of waste plastics in coke oven: A review. J. Sustain. Met. 2015, 1, 85. [Google Scholar] [CrossRef]
- Nomura, S.; Kato, K.; Nakagawa, T.; Komaki, I. The effect of plastic addition on coal caking properties during carbonization. Fuel 2003, 82, 1775–1782. [Google Scholar] [CrossRef]
- Arens, M. Energy Efficiency and CO2 Emissions Reduction in the Steel Industry; Fraunhofer Institute for Systems and Innovation Research: Berlin, Germany, 2010. [Google Scholar]
- IEA. Energy Technology Perspectives 2010—Scenarios and Strategies to 2050; IEA: Paris, France, 2010. [Google Scholar]
- Plastics Europe AISBL. Plastics Convert Iron Ore to Steel, Feedstock Recycling in Blast Furnaces; Plastics Europe AISBL: Brussels, Belgium, 2009. [Google Scholar]
- Carpenter, A.M. CO2 Abatement in the Iron and Steel Industry; IEA Clean Coal Centre: London, UK, 2012. [Google Scholar]
- Carpenter, A. Injection of Coal and Waste Plastics in Blast Furnaces; IEA Clean Coal Centre: London, UK, 2010. [Google Scholar]
- Asanuma, M.; Kajioka, M.; Kuwabara, M.; Fukumoto, Y.; Terada, K. Establishment of Advanced Recycling Technology for Waste Plastics in Blast Furnace, JFE Technical Report; JFE Holdings, Inc.: Tokyo, Japan, 2009. [Google Scholar]
- Janz, J.; Weiss, W. Injection of waste plastics into the blast furnace of Stahlwerke Bremen. In Proceedings of the 3rd International Cokemaking Congress, Gent, Belgium, 16–18 September 1996. [Google Scholar]
- Ogaki, Y.; Tomioka, K.; Watanabe, A.; Arita, K.; Kuriyama, I.; Sugayoshi, T. Recycling of waste plastic packaging in a blast furnace system. NKK Tech. Rev. 2001, 84, 1–7. [Google Scholar]
- Sahajwalla, V.; Zaharia, M.; Kongkarat, S.; Khanna, R.; Rahman, M.; Chaudhury, N.; O’Kane, P.; Dicker, J.; Skidmore, C.; Knights, D. Arc furnace steelmaking process: Fundamentals of polymer reactions with slag and metal. Energy Fuels 2012, 26, 58–66. [Google Scholar] [CrossRef]
- Bale, C.W.; Pelton, A.D.; Thompson, W.T.; Eriksson, G.; Hack, K.; Chartrand, G.; Decterov, S.; Melancon, J.; Petreson, S. FactSage Thermochemical Software and Databases; Elsevier Science B.V.: Amsterdam, The Netherlands, 2002. [Google Scholar]
- Bandyopadhyay, D.; Singh, S.D.; Sanyal, D.; Singh, K.; Singh, K. A study on dissolution kinetics of carbon in liquid iron bath. Chem. Eng. J. 2003, 94, 79–92. [Google Scholar] [CrossRef]
- Worrell, E.; Blinde, P.; Neelis, M.; Blomen, E.; Masanet, E. Energy Efficiency Improvement and Cost Saving Opportunities for the U.S. Iron and Steel Industry. An ENERGY STAR Guide for Energy and Plant Managers; Energy Analysis Department Environmental Energy Technologies Division, Ernest Orlando Lawrence Berkeley National Laboratory: Berkeley, CA, USA, 2010. [Google Scholar]
- OneSteel. Building a Sustainable Future; OneSteel: Sydney, Australia, 2010. [Google Scholar]
- Dhunna, R.; Khanna, R.; Mansuri, I.; Sahajwalla, V. Recycling waste Bakelite as an alternative carbon resource for ironmaking applications. ISIJ Int. 2014, 54, 613–619. [Google Scholar] [CrossRef]
- Li, X.; Zhang, G.; Tang, K.; Ostrovski, O.; Tronstad, R. Carbothermal reduction of quartz in methane-hydrogen-argon gas mixture. Metall. Mater. Trans. B 2015, 46, 2384–2393. [Google Scholar] [CrossRef]
- De Souza, R.; de Mendonca, C.; Kater, T. Production of acid iron ore pellet for direct reduction, using an organic binder. Min. Eng. Mag. 1984, 36, 1437–1441. [Google Scholar]
- Kater, T.; Steeghs, H. Organic binders for iron ore palletization. In Proceedings of the 57th Annual Meeting of the Minnesota Section of AIME, Duluth, MN, USA, 18–19 January 1984; pp. 13.1–13.29. [Google Scholar]
- Heerema, R.; Kortmann, H.; Kater, T.; den Boogaard, V.V. Improvements of acid, olivine and dolomite fluxed iron ore pellets using an organic binder. In Proceedings of the 5th International Symposium on Agglomeration, Brighton, UK, 25–27 September 1989. [Google Scholar]
- Sivrikaya, O.; Arol, A. Alternative binders to bentonite for iron ore pelletizing: PART I: Effects on physical and mechanical properties. In Proceedings of the VIII Meeting of the Southern Hemisphere on Mineral Technology, Goiânia, Brazil, 19–24 October 2013. [Google Scholar]
- Devasahayam, S. Effect of moisture ingress on adhesion energy in a metal oxide-polymer system. J. Appl. Polym. Sci. 2006, 99, 2052–2061. [Google Scholar] [CrossRef]
- Devasahayam, S. Towards improving wet-adhesion in a metal oxide-polymer coating system. J. Appl. Polym. Sci. 2006, 99, 3318–3327. [Google Scholar] [CrossRef]
- Derjaguin, B. The definition and magnitude of disjoining pressure and its role in the statics and dynamics of thin fluid films. Kolloid Zh 1955, 17, 207. [Google Scholar]
- Bouchet, J.; Roche, A.A.; Jacquelin, E.J. How do residual stresses and interphase mechanical properties affect practical adhesion of epoxy diamine/metallic substrate systems. J. Adhes. Sci. Technol. 2002, 16, 1603–1623. [Google Scholar] [CrossRef]
- Ashby, M.F.; Jones, D.R.H. Engineering Materials: An Introduction to Their Properties and Applications; Pergamon: Oxford, UK, 1989. [Google Scholar]
- Devasahayam, S. Interfacial toughness in polymer layered laminar composites. J. Polym. Sci. Part B Polym. Phys. 2004, 42, 3822–3835. [Google Scholar] [CrossRef]
- Devasahayam, S.; Bandyopadhyay, S. Evolution of novel size-dependent properties in polymer-matrix composites due to polymer filler interactions. In New Developments in Polymer Composites Research; Montanuniversitaet Leoben, Department Kunststofftechnik: Leoben, Austria, 2013; Nova Publication. [Google Scholar]
- Mitsuishi, K.; Kodama, S.; Kawasaki, M. Mechanical properties of polypropylene filled with calcium carbonate. Polym. Eng. Sci. 1985, 25, 1069–1073. [Google Scholar] [CrossRef]
- Kalinski, R.; Galeski, A.; Kryszewski, M. Low-density polyethylene filled with chalk and liquid modifier. J. Appl. Polym. Sci. 1981, 26, 4047. [Google Scholar] [CrossRef]
- Badran, B.M.; Galeski, A.; Kryszewski, M. High-density polyethylene filled with modified chalk. J. Appl. Polym. Sci. 1982, 27, 3669. [Google Scholar] [CrossRef]
- Galeski, A. Strength and toughness of crystalline polymer systems. Prog. Polym. Sci. 2003, 28, 1643. [Google Scholar] [CrossRef]
- Yang, G.; Rohde, B.J.; Tesefay, H.; Robertson, M.L. Biorenewable epoxy resins derived from plant-based phenolic acids. ACS Sustain. Chem. Eng. 2016, 4, 6524–6533. [Google Scholar] [CrossRef]
- Naguib, H.M.; Ahmed, M.A.; Abo-Shanab, Z.L. Silane coupling agent for enhanced epoxy-iron oxide nanocomposite. J. Mater. Res. Technol. 2018, 7, 21–28. [Google Scholar] [CrossRef]
- Gardiner, G. Recyclable epoxy proven in HP-RTM. Composites World. 2016. Available online: https://www.compositesworld.com/blog/post/recyclable-epoxy-proven-in-hp-rtm (accessed on 17 February 2019).
- Blagus, A.; Dankwah, J.R.; Sahajwalla, V. Interfacial reactions between coke/HDPE blends and high carbon ferromanganese slag. ISIJ Int. 2013, 53, 41–47. [Google Scholar] [CrossRef]
- Dankwah, J.R.; Adjei-Kyeremeh, F.; Dwumah, B.K.; Dankwah, J.B.; Koshy, P. Microwave production of manganese from manganese (IV) oxide using postconsumer polypropylene as reductant. Ghana Min. J. 2015, 15, 65–72. [Google Scholar]
- Dankwah, J.R.; Dankwah, J.; Dankwah, J.B. Effect of waste plastics addition on the reduction of MnO from silicomanganese Slag. Ghana J. Technol. 2017, 2, 69–76. [Google Scholar]
- Baldé, C.V.F.; Gray, V.; Kuehr, R.; Stegmann, P. The Global E-Waste Monitor; United Nations University: Bonn, Germany; International Telecommunication Union: Geneva, Switzerland; International Solid Waste Association: Vienna, Austria, 2017. [Google Scholar]
- Kjeldsen, P.; Barlaz, M.; Rooker, A.; Baun, A.; Ledin, A.; Christensen, T. Present and long-term composition of MSW landfill leachate: A Review. Crit. Rev. Environ. Sci. Technol. 2002, 32, 297–336. [Google Scholar] [CrossRef]
- Groot, D.; van der Linde, J. The preparation and characterization of a metallic alloy derived from the smelting of printed circuit boards. J. S. Afr. Inst. Min. Metall. 2009, 109, 697–700. [Google Scholar]
- Appropedia. Metal Reclamation and Recycling of Electronic Waste; Appropedia: Arcata, CA, USA, 2017. [Google Scholar]
- Simpson, S. Afghanistan holds enormous bounty of rare earths, minerals. Sci. Am. 2011, 305, 58–65. [Google Scholar] [CrossRef]
- Cucchiela, F.; D’Adamo, I.; Lenny Koh, S.C.; Rosa, P. Recycling of WEEEs: An economic assessment of present and future e-waste streams. Renew. Sust. Energ. Rev. 2015, 51, 263–272. [Google Scholar] [CrossRef] [Green Version]
- Namias, J. The Future of Electronic Waste Recycling in the United States: Obstacles and Domestic Solutions. Master’s Thesis, Columbia University, New York, NY, USA, 2013. [Google Scholar]
- Mathias, S.; Christian, H.; Ruediger, K.; Magalinic, F.; Claudia, M.; Christina, M.; Esther, M.; Feng, W. Recycling- from e-Waste to Resources, Sustainable Innovation and Technology Transfer Industrial Sector Studies, United Nations Environment Programme & United Nations University, 2009. Available online: http://www.unep.org/PDF/PressReleases/E-Waste_publication_screen_FINALVERSION-sml.pdf (accessed on 17 February 2019).
- Mark, F.E.; Lehner, T. Plastics Recovery from Waste Electrical & Electronic Equipment in Non-Ferrous Metal Processes; Association of Plastics Manufacturers in Europe: Brussels, Belgium, 2000. [Google Scholar]
- Dangerous Substances Law Legal and Administrative Regulations on Hazardous Substances in Occupational and Consumer Protection. In Hazardous Substances Ordinance; last amended 27 January 1999; Federal Institute for Occupational Safety and Health (BAuA): Dortmund, Germany, 1993.
- Ordinance on bans and restrictions on the marketing of dangerous substances, preparations and articles under the Chemicals Act. In Chemicals Banning Ordinance; Food and Agriculture Organization of the United Nations: Rome, Italy, 1993.
- Baldauf-Sommerbauer, G.; Lux, S.; Aniser, W.; Siebenhofer, M. Reductive calcination of mineral magnesite: Hydrogenation of carbon dioxide without catalysts. Chem. Eng. Technol. 2016, 39, 2035–2041. [Google Scholar] [CrossRef]
- Couderc, P.; Hyvernat, P.; Lemarchand, J. Correlations between ability of pitch to penetrate coke and the physical characteristics of prebaked anodes for the aluminium industry. Fuel 1986, 65, 281–287. [Google Scholar] [CrossRef]
- Chatterjee, A. Sponge Iron Production by Direct Reduction of Iron Oxide; PHI Learning Pvt. Ltd.: New Delhi, India, 2010; p. 353. [Google Scholar]
- Shuye, S. A Study Ofkinetics and Mechanisms of Iron Ore Reduction in Ore/Coal Composite. Ph.D. Thesis, McMaster University, Hamilton, ON, Canada, 1997. [Google Scholar]
- Haig, S.; Morrish, L.; Morton, R.; Onwuamaegbu, U.; Speller, P.; Wilkinson, S. Plastic to Oil Products; Axionconsulting: Bramhall, Cheshire, UK, 2013. [Google Scholar]
- Desai, R.; Balkunde, H.A.S.P.B.; Tanksali, A. Waste Plastic Pyrolysis; BLDEA College of Engineering and Technology: Vijaypur, India, 2015. [Google Scholar]
- Sahajwalla, V.; Rahman, M.R.K.; Saha, C.N.; Knights, D.; O’Kane, P. Recycling of waste plastics for slag foaming in EAF steelmaking. In Proceedings of the Iron & Steel Technology Conference, Cleveland, OH, USA, 1–4 May 2006. [Google Scholar]
- Ostrovski, O.; Anacleto, N.; Ganguly, S. Reduction of manganese ores by methane-containing gas. In Proceedings of the INFACON, Cape Town, South Africa, 1–4 February 2004; pp. 173–183. [Google Scholar]
- Knacke, O.; Kubaschewski, O.; Hasselmann, K. Thermochemical Properties of Inorganic Substances I, 2nd ed.; Springer: Berlin/Heidelberg, Germany, 1991; p. 129. [Google Scholar]
- Trinkel, V.; Kieberger, N.; Burgler, T.; Rechberger, H.J.; Fellner, J. Influence of waste plastic utilisation in blast furnace on heavy metal emissions. J. Clean. Prod. 2015, 94, 312–320. [Google Scholar] [CrossRef]
- Thompson, R.; Moore, C.; Saal, F.v.; Swan, S. Plastics, the environment and human health: Current consensus and future trends. Philos. Trans. R. Soc. Lond. B Biol. Sci. 2009, 364, 2153–2166. [Google Scholar] [CrossRef] [PubMed]


| Market Sector | 2015 Primary Production (Mt) | Mean (yrs) Life | 2015 Primary Waste Generation (Mt) |
|---|---|---|---|
| Packaging | 146 | 0.5 | 141 |
| Transportation | 27 | 13 | 17 |
| Building and Construction | 65 | 35 | 13 |
| Electrical/Electronic | 18 | 8 | 13 |
| Consumer & Institutional Products | 42 | 3 | 37 |
| Industrial Machinery | 3 | 20 | 1 |
| Textiles | 59 | 5 | 42 |
| Other | 47 | 5 | 38 |
| Total | 407 | - | 302 |
| * Polymer Type/Additive | 2015 Primary Production (Mt) | 2015 Primary Waste Generation (Mt) | Share of Polymer Types Produced during 2002–2014 according to Industry Sectors | ||||||||
|---|---|---|---|---|---|---|---|---|---|---|---|
| TRANSPORTATION % | Packaging % | Building and Construction % | Electrical/Electronic % | Consumer & Institutional Products % | Industrial Machinery % | Textiles % | Other % | Total % | |||
| LDPE | 64 | 57 | 0.1 | 13.5 | 1.1 | 0.5 | 2.9 | 0.2 | 1.7 | 20.0 | |
| HDPE | 52 | 40 | 0.8 | 9.3 | 3.3 | 0.2 | 1.7 | 0.1 | 0.9 | 16.3 | |
| PP | 68 | 55 | 2.6 | 8.2 | 1.2 | 0.9 | 3.8 | 0.2 | 4.2 | 21.0 | |
| PS | 25 | 17 | 0.0 | 2.3 | 2.2 | 0.6 | 1.8 | 0.0 | 0.7 | 7.6 | |
| PVC | 38 | 15 | 0.3 | 0.9 | 8.1 | 0.4 | 0.6 | 0.0 | 1.4 | 11.8 | |
| PET | 33 | 32 | 0.0 | 10.1 | 0.0 | 0.0 | 0.0 | 0.0 | 0.0 | 10.2 | |
| PUR | 27 | 16 | 1.6 | 0.2 | 2.4 | 0.4 | 1.0 | 0.3 | 2.5 | 8.2 | |
| Other | 59 | 42 | 1.4 | 0.1 | 0.5 | 1.0 | 0.2 | 0.0 | 1.7 | 4.9 | |
| PP&A fibers | 16 | 11 | - | - | - | - | - | - | 100 | 100 | |
| Additives | 25 | 17 | - | - | - | - | - | - | - | - | - |
| Total (non-fibres only (2002–2014) | - | - | 6.7 | 44.8 | 18.8 | 3.8 | 11.9 | 0.8 | - | 13.2 | 100.0 |
| Total (2015) | 407 | 302 | - | - | - | - | - | - | - | - | - |
| Pyrolysis Product Yield (wt. %) | HDPE (450 °C) | HDPE (550 °C) | LDPE (550 °C) | |
|---|---|---|---|---|
| Gas Fraction | 13.0 | 16.3 | 14.6 | |
| Liquid Fraction | Total | 84.0 | 84.7 | 93.1 |
| C6–C12 | 56.55 | |||
| C13–C23 | 37.79 | |||
| >C23 | 5.66 | |||
| Solid Fraction | 3.0 | - | - | |
| Offgas | Without Plastics | PE | PP | PS | PET |
|---|---|---|---|---|---|
| Total blast furnace gases (BFG) m3/thm | 1670.9 | 1747.3 | 1787.2 | 1684.4 | 1741.8 |
| CO vol % | 22.9 | 21.1 | 21.2 | 21.9 | 22.4 |
| CO2 vol % | 21.3 | 20.2 | 20 | 20.8 | 20.6 |
| H2 vol % | 4.6 | 7.3 | 7.2 | 6.3 | 5.4 |
| H2O vol % | 2.4 | 3.8 | 3.8 | 3.3 | 2.7 |
| N2 vol % | 48.9 | 47.5 | 47.9 | 47.8 | 48.9 |
| CV of BFG MJ/m3 | 3.4 | 3.47 | 3.46 | 3.44 | 3.41 |
| Properties | Coke | PE | PP | PS | PET | PVC | Bakelite | Epoxy |
|---|---|---|---|---|---|---|---|---|
| Calorific value (kJ/kg) | 25,000–30,000 | 44,800 | 42,700 | 41,900 | 23,200 | 1800 | NA | ≈32,000 |
| Carbon contents (kg C/kg) | - | 0.86 | 0.86 | 0.92 | 0.62 | 0.38 | 0.53 | 0.70 |
| Sample Description | Temperature (°C) | Solids (wt. %) | Oil/Wax (wt. %) | Gas (wt. %) | Oil/Gas Ratio |
|---|---|---|---|---|---|
| PE1: Thermoset polyester/styrene resin with calcium carbonate and aluminium trihydrate fillers (36 wt. %), glass fibre reinforcement (12 wt. %) | 350 | 82.9 | 14.5 | 2.6 | 5.6 |
| 400 | 52.6 | 41.2 | 6.2 | 6.7 | |
| 450 | 48.7 | 45.0 | 6.3 | 7.1 | |
| 500 | 45.8 | 45.7 | 8.5 | 5.4 | |
| 650 | 46.6 | 47.0 | 6.4 | 7.3 | |
| 800 | 38.2 | 47.4 | 14.4 | 3.3 | |
| PH1: Phenolic resin with magnesium oxide and calcium carbonate fillers (41 wt. %), glass fibre reinforcement (31 wt. %) | 400 | 94.3 | 5.1 | 0.6 | 8.5 |
| 500 | 90.2 | 8.8 | 1.0 | 8.8 | |
| 600 | 86.6 | 10.9 | 2.6 | 4.2 | |
| 700 | 85.3 | 12.0 | 2.8 | 4.3 | |
| 800 | 83.4 | 11.9 | 4.6 | 2.6 | |
| EP: Epoxy resin, inorganic fillers (30 wt. %) glass and carbon fibre reinforcement (45 wt. %) | 350 | 81.7 | 18.0 | 0.2 | 90 |
| 400 | 70.7 | 27.6 | 1.7 | 16.2 | |
| 500 | 67.4 | 31.3 | 1.2 | 26.1 | |
| 600 | 69.6 | 29.4 | 1.0 | 29.4 | |
| 800 | 65.3 | 31.7 | 3.0 | 10.6 | |
| PE2: Thermoset polyester/styrene resin, gel-coat surface, glass fibre reinforcement (30 wt. %) | 450 | 32.6 | 64.1 | 3.3 | 19.4 |
| PH2: Phenolic resin, Nomex paper core, carbon fibre reinforcement | 550 | 65.0 | 30.4 | 4.6 | 6.6 |
| PP: Polypropylene resin, glass fibre tape (75 wt. %) | 550 | 78.9 | 20.0 | 1.1 | 18.2 |
| VE: Vinylester resin with woven glass fibre fabric (70 wt. %) | 550 | 83.4 | 15.0 | 1.6 | 9.4 |
| Gas Yield (mol·g−1 × 10⁻⁴) | Final Pyrolysis Temperature (°C) | ||||
|---|---|---|---|---|---|
| 350 | 400 | 500 | 600 | 800 | |
| Carbon dioxide | 2.31 | 7.20 | 4.55 | 13.68 | 26.19 |
| Carbon monoxide | 0.00 | 0.44 | 1.13 | 0.55 | 4.04 |
| Hydrogen | 0.00 | 0.00 | 0.02 | 0.08 | 0.63 |
| Methane | 0.12 | 3.74 | 1.10 | 1.04 | 2.73 |
| Ethane and ethene | 0.15 | 0.42 | 0.84 | 0.42 | 1.22 |
| Propane | 0.05 | 0.16 | 0.21 | 0.08 | 0.25 |
| Propene | 0.09 | 0.27 | 0.27 | 0.08 | 0.37 |
| Butane | 0.00 | 0.01 | 0.01 | 0.01 | 0.01 |
| Butene | 0.01 | 0.00 | 0.01 | 0.00 | 0.01 |
| Butadiene | 0.00 | 0.00 | 0.01 | 0.00 | 0.03 |
| GCV (MJ/m3) | 51.1 | 39.8 | 42.0 | 28.9 | 23.9 |
| Bond | Bond Energy kJ·mol−1 |
|---|---|
| Ionic | 600–1000 |
| Covalent | 60–700 |
| Metallic | 100–350 |
| Strong H bonds (involving F) | Up to 40 |
| Other H bonds | 10–25 |
| Dipole-dipole | 4–20 |
| Dipole-induced dipole | 1–2 |
| London dispersion forces | 0.1–40 |
| Material | Water Absorption wt. % |
|---|---|
| Whatman No. 3 filter paper | 180 |
| Facial tissue paper | 400 |
| Soft polyurethane sponge | 1050 |
| Wood pulp fluff | 1200 |
| Cotton ball | 1890 |
| SAP, i.e., Superab A-200 | 20,200 |
| PE | PS | PET | PVC | PP | |
|---|---|---|---|---|---|
| Gas % | 58 a | 15 a | 67 a | 83 a | 40 b |
| Oil % | 29 a | 63 a | 25 a | 4.0 a | 44 b |
| Coke % | 13 a | 22 a | 8.0 a | 14 a | 16 b |
| Carbon content (kg C/kg) | 0.86 b | 0.92 b | 0.62 b | 0.38 b | 0.86 b |
| Volatile matter % | 17 b | 3.4 b | 39 b | 25 b | 15 b |
| Products | I | II | III | IV | V | VI | VII | VIII | IX | X | XI | XII | XIII | XIV |
|---|---|---|---|---|---|---|---|---|---|---|---|---|---|---|
| Materials | g/unit | |||||||||||||
| Aluminum | 0.77 | 67 | 242 | 130 | 130 | 12 | 2.9 | 1370 | 441 | 441 | ||||
| Antimony | 0.001 | 0.001 | 14 | 0.71 | 0.71 | 0.084 | 0.154 | |||||||
| Arsenic | 2.5 | 2.5 | 0.002 | |||||||||||
| Barium | 1 | 0.49 | ||||||||||||
| Beryllium | 0.003 | |||||||||||||
| Cadmium | 0.2 | 0.407 | ||||||||||||
| Cerium | ≤0.001 | ≤0.001 | 0.005 | ≤0.001 | ≤0.001 | ≤0.001 | ≤0.001 | |||||||
| Chromium | 0.07 | 0.07 | 0.03 | |||||||||||
| Cobalt | 0.065 | 0.065 | ||||||||||||
| Copper | 135 | 135 | 656 | 824 | 824 | |||||||||
| Dysposium | 0.06 | 0.06 | ||||||||||||
| Europium | ≤0.001 | ≤0.001 | 0.008 | ≤0.001 | ||||||||||
| Ferrite | 483 | |||||||||||||
| Gadolinium | ≤0.001 | ≤0.001 | ≤0.001 | 0.002 | ≤0.001 | 0.002 | ≤0.001 | |||||||
| Gallium | 0.016 | 0.005 | 0.003 | 0.003 | 0.119 | |||||||||
| Glass | 15,760 | 162 | 216 | 6845 | 590 | 590 | 10.6 | 6915 | ||||||
| Gold | 0.22 | 0.22 | 0.11 | 0.11 | 0.31 | 0.2 | 0.2 | 0.024 | 0.038 | 0.005 | 0.005 | 0.044 | ||
| Indium | 0.04 | 0.04 | 0.003 | 0.003 | 0.079 | 0.082 | 0.012 | 0.008 | ||||||
| Lanthanum | ≤0.001 | 0.007 | ≤0.001 | ≤0.001 | ||||||||||
| Lead | 5.3 | 5.3 | 1319 | 464 | 16 | 1 | 0.6 | 1.1 | ||||||
| Mercury | ≤0.001 | ≤0.001 | ≤0.001 | 0.004 | 1 | ≤0.001 | ||||||||
| Molybdenum | 0.04 | 0.04 | 0.633 | 0.633 | 0.295 | 0.008 | ||||||||
| Neodyumium | 2.1 | 2.1 | 0.005 | 1 | 0.427 | |||||||||
| Nickel | 3.6 | 3.6 | 199 | 1 | 1.5 | 0.722 | ||||||||
| Palladium | 0.04 | 0.04 | 0.044 | 0.044 | 0.04 | 0.04 | 0.009 | 0.015 | 0.003 | 0.003 | 0.008 | |||
| Plastics | 8755 | 612 | 573 | 2481 | 1780 | 1780 | 63 | 60 | 1172 | 44 | 44 | |||
| Platinum | 0.004 | 0.004 | 0.004 | |||||||||||
| Praseodymium | 0.274 | 0.274 | ≤0.001 | ≤0.001 | 0.001 | 0.145 | 0.055 | |||||||
| Selenium | 0.119 | |||||||||||||
| Silicon | 5 | 226 | ||||||||||||
| Silver | 0.25 | 0.25 | 0.45 | 0.45 | 1.25 | 0.52 | 0.52 | 1 | 0.244 | 0.031 | 0.031 | 0.05 | ||
| Steel/Iron | 2088 | 3322 | 2530 | 2530 | 11 | 8 | 62 | 62 | ||||||
| Tantalum | 1.7 | 1.7 | ||||||||||||
| Tellurium | 0.406 | |||||||||||||
| Terbium | ≤0.001 | 0.002 | ≤0.001 | ≤0.001 | ||||||||||
| Tin | 32 | 18 | 18 | 20 | 24 | 24 | 1 | 1 | 0.116 | |||||
| Titanium | 0.633 | 0.633 | ||||||||||||
| Tungsten | 0.633 | 0.633 | ||||||||||||
| Vanadium | 1 | |||||||||||||
| Yttrium | 0.002 | 0.002 | 0.11 | 0.005 | 1 | 0.016 | ≤0.001 | ≤0.001 | ||||||
| Zinc | 0.004 | 0.004 | 8.6 | 4 | 1 | 0.4 | ≤0.001 | |||||||
| # of critical raw materials | 14 | 13 | 1 | 10 | 8 | 1 | 10 | 7 | 2 | 8 | 2 | 4 | 1 | 14 |
| # of precious metals | 4 | 4 | 0 | 3 | 3 | 2 | 3 | 3 | 3 | 4 | 0 | 3 | 3 | 3 |
| Input | ||||||
| Feed | Quantity (tons) | PXDD/F Concentration (mg/kg) | Flux (g/batch) | |||
| Slag | 86 | 0 | 0.0 | |||
| Steel Dust | 5 | 30.6 | 0.15 | |||
| Cold Slag | 5 | 0 | 0.0 | |||
| PC Scrap | 5 | 1250 | 6.25 | |||
| Total Input | 6.4 | |||||
| Output | ||||||
| Output | Quantity | PXDD/F Concentration | Flux (g/batch) | |||
| (m3/h) | (tons) | (µg/kg) | (ng/m3) | Sampling Time (h) | ||
| Stack Gas | 130,000 | 182 | 2 | 0.047 | ||
| Raw Fume | 8.48 | 6.68 | 0.057 | |||
| Total output | 0.104 | |||||
| Heading | GHG Emissions (kg CO2 (e) Per Tonne of Mixed Plastic) | ||||
|---|---|---|---|---|---|
| Input Materials | Transport | Processing | Displacement Savings * | Net Emissions | |
| Landfill | 0.0 | 15.1 | 55.7 | 0.0 | 70.8 |
| Incineration | 0.0 | 15.1 | 2408.0 | −565.5 | 1857.6 |
| Pyrolysis | 13.0 | 197.2 | 55.6 | −425.5 | −159.7 |
| Gasification w/MTG (methanol-to-gasoline process) | 153.7 | 153.7 | 995.5 | −261.7 | 1041.2 |
| Gasification w/F-T (Fischer–Tropsch process ) | 153.7 | 139.3 | 285.2 | −147.1 | 431.1 |
| Gasification w/Bio (gasification with biological conversion of syngas to ethanol) | 153.7 | 187.7 | 1217.1 | −454.9 | 1103.6 |
| Catalytic depolymerisation | 16 | 197.5 | 51.0 | −397.4 | −132.8 |
© 2019 by the authors. Licensee MDPI, Basel, Switzerland. This article is an open access article distributed under the terms and conditions of the Creative Commons Attribution (CC BY) license (http://creativecommons.org/licenses/by/4.0/).
Share and Cite
Devasahayam, S.; Raman, R.K.S.; Chennakesavulu, K.; Bhattacharya, S. Plastics—Villain or Hero? Polymers and Recycled Polymers in Mineral and Metallurgical Processing—A Review. Materials 2019, 12, 655. https://doi.org/10.3390/ma12040655
Devasahayam S, Raman RKS, Chennakesavulu K, Bhattacharya S. Plastics—Villain or Hero? Polymers and Recycled Polymers in Mineral and Metallurgical Processing—A Review. Materials. 2019; 12(4):655. https://doi.org/10.3390/ma12040655
Chicago/Turabian StyleDevasahayam, Sheila, R. K. Singh Raman, K. Chennakesavulu, and Sankar Bhattacharya. 2019. "Plastics—Villain or Hero? Polymers and Recycled Polymers in Mineral and Metallurgical Processing—A Review" Materials 12, no. 4: 655. https://doi.org/10.3390/ma12040655