Article

Prediction of the Ultra-Low-Cycle Fatigue Damage of Q345qC Steel and its Weld Joint

1
School of Civil Engineering and Architecture, Nanchang University, Nanchang 330031, Jiangxi Province, China
2
School of Civil Engineering and Architecture, Zhejiang University, Hangzhou 310012, Zhejiang Province, China
*
Author to whom correspondence should be addressed.
Materials 2019, 12(23), 4014; https://doi.org/10.3390/ma12234014
Submission received: 1 November 2019 / Revised: 21 November 2019 / Accepted: 21 November 2019 / Published: 3 December 2019
(This article belongs to the Section Construction and Building Materials)

Abstract

:
Based on the continuum damage mechanics model (CDM) for monotonic tension, a new CDM for ultra-low-cycle fatigue (ULCF) is put forward to predict ULCF damage of steel and its weld joint under strong earthquakes. The base metal, heat-affected zone and weld metal of Q345qC steel were considered as research objects, and the uniaxial plastic strain threshold of the CDM model was calibrated via tensile testing combined with finite element analysis of notched round bar specimens. ULCF tests of the base metal and weld specimens were carried out to analyse their fatigue life, fracture life and post-fracture path. Based on the calibrated uniaxial plastic strain threshold, the finite element models of base metal and weld specimens suitable for CDM model were established by ABAQUS. The calibration results of material parameters show that the weld metal has the lowest plastic strain threshold and the largest dispersion coefficient at the plastic strain threshold. Prediction results under cyclic loading with a large strain were compared with experimental values, and results showed that the predicted crack initiation and fracture lives of the base metal and weld specimens are lower than their corresponding experimental values. The predicted errors of crack initiation life and fracture life decrease with increasing strain level. The development law of the damage variable reveals exponential growth combined with a stepped pattern. The CDM model can also accurately predict the number of cycles to initial damage. Taking the results together, the CDM of the ULCF of the base metal and weld specimens could successfully predict post-fracture paths.

1. Introduction

Steel piers are seismic-vulnerable components of bridge structures. In previous earthquakes, large plastic deformation and local buckling of steel plates led to seismic damage of steel piers [1] and ultra-low-cycle fatigue (ULCF) damage at welded joints [2]. For example, in the 1995 Kobe earthquake in Japan, ULCF damage was observed at the weld joints of steel structures [2,3]. Since this earthquake, researchers worldwide have widely studied the local buckling of steel plates and ULCF damage at welded joints. Some structural measures, such as setting longitudinal stiffened ribs, increasing the thickness of the steel plate and filling concrete into steel piers, have been used to solve the problem of local buckling failure [4,5,6]. However, the problem of ULCF damage has yet to be completely explored.
A number of researchers have recently carried out studies on the mechanism of the LCF and ULCF damage of steel materials [7,8]. The fracture mechanism of ULCF is essentially different from that of LCF. LCF fractures involve brittle fractures [9], whereas ULCF failures are due to ductile failure under the cyclic loading of a large strain [10,11]. ULCF failure is characterised by a few loading cycles (generally less than 20) [12,13,14]. For example, in 1998, Kuwamura [15] confirmed that the fracture morphologies of LCF and ULCF failures greatly differ by applying electron microscopy. ULCF cracks are blunt, wide and largely open, and the fracture surface shows obvious dimples; these characteristics indicate a ductile failure morphology [16]. By comparison, LCF cracks are sharp, narrow and deep and present a brittle fracture morphology. In addition, microvoids are not formed around the fractures LCF failure, and the fracture mode of this failure type is transgranular cleavage fracture [17]. Considering that the fracture mechanism of ULCF is different from that of LCF [9,18,19,20], damage prediction methods suitable for LCF cannot be directly used for ULCF damage prediction.
Several scholars have studied the prediction methods of fatigue life and damage process of ULCF in steel materials. At present, four main methods are used to study the fracture properties of steel and its weld joints, namely, the traditional fracture mechanics method, the empirical formula, the micro mechanical model and the continuum damage mechanics model (CDM). Early researchers mainly used fracture mechanics to study the fracture properties of steel. The traditional fracture mechanics method assumes that cracks exist and that the initial crack tip has a high strain constraint; thus, this method is suitable for research on brittle and pseudo-brittle fractures [21]. However, the method cannot be applied to predict ductile fractures when the steel structure does not show obvious defects under a strong earthquake [22]. In 1954, Coffin [23] and Manson [24] introduced an empirical formula, i.e., the Coffin–Manson formula, to predict the LCF life of materials based on the relationship between fatigue life and plastic strain amplitude. However, this method requires several tests to calibrate the necessary parameters and does not consider the effect of triaxiality on fatigue life. In addition, the empirical formula cannot predict the crack path [20,22,25]. A micromechanical model was recently introduced not only to predict the fatigue life of steel structure, but also to describe the effect of stress‒strain field on the microstructural characteristics of the material [26]. Hence, this model can be used to accurately predict the development of ductile cracks in steel structure joints [27].
Micromechanical models mainly include the void growth model (VGM) [28], the stress-modified critical strain model (SMCS), the cyclic void growth model (CVGM) [29] and the degraded significant plastic strain model (DSPS) [30]. VGM and SMCS are suitable for calculating the case of monotonic tensile, whilst CVGM and DSPS are used to calculate the case of cyclic loading. In comparison with CVGM, DSPS assumes that the triaxiality of the specimen is constant. Both CVGM and DSPS are semi-empirical and semitheoretical formulas [26] and, thus, require several tests to conduct analysis. The damage degradation parameters of weld specimens are relatively discrete [31]. Moreover, CVGM and DSPS assume that the expansion and contraction rates of microvoids are identical [32], which is inconsistent with actual findings. The location of crack initiation and path cannot be correctly predicted. Finally, CVGM and DSPS cannot directly consider the effect of material damage on material constitutive, and the element size is small, which leads to low calculation efficiency.
The continuum damage mechanics model (CDM) is another method used to study the fracture properties of steel structures that is applicable to brittle and ductile fractures [33]. By introducing appropriate damage variables, this model can consider the influence of damage on the material constitutive and directly describe the macroscopic mechanical behaviour of the tested materials [34,35]. Moreover, the CDM model can present the law of damage evolution and the post-fracture path [36]. In summary, CDM model has the following advantages: (1) In comparison with the micromechanical model, the CDM model, which is suitable for describing ductile fracture, only needs monotonic tensile test results to calibrate the relevant parameters. This test is simple. In addition, the finite element size is not limited by the characteristic length, and the calculation efficiency is high. (2) The CDM model can predict the ULCF life and fracture position of steel structures as well as the post-fracture path. (3) The CDM model can consider the influence of damage on the material constitutive and can be directly combined with finite element software. Thus, this model can easily be employed in engineering applications and has good development prospects.
In this paper, a refined method to predict the ULCF damage of steel and its welded joints based on the CDM model is studied. The CDM model for monotonic tension is introduced in detail, and the CDM model for ULCF is expanded from this model. Uniaxial tensile tests of Q345qC base metal, heat affected zone (HAZ) and weld metal were carried out to calibrate the material parameters of the CDM model, and a finite element model based on the CDM model was established to predict the fatigue life, fracture life, number of cycles to initial damage and post-fracture path of the specimens. ULCF tests are finally conducted to validate the reliability of the proposed CDM model.

2. Theoretical Model for ULCF of Structural Steel

2.1. Continuum Damage Mechanics Model for Monotonic Tension

The term damage is used to indicate the deterioration of a material’s capability to carry loads. Damage generally develops in the material microstructure when non-reversible phenomena, such as microcracking, debonding between the matrix and second phase particles and microvoid formation, take place. In the CDM model, the damage degree is generally expressed by the damage variable D as follows:
D = 1 A e f f A 0 ,
where A 0 and A e f f are the nominal and effective cross-sectional area reduced by the presence of microdefects and their mutual interaction, respectively.
In the uniaxial case, the effective stress σ e f f is expressed as follows:
σ e f f = F A e f f = F A 0 ( 1 D ) = σ 1 D ,
where F and σ represent the uniaxial tension and tension stress, respectively.
In the framework of the thermodynamics of irreversible phenomena, the constitutive equations of the material can be derived using some state variables [37]. The Helmholtz free energy ψ can be used to characterise a material. The relationship between the Helmholtz free energy and internal variables x i is shown as follows:
y i = ( ρ ψ ) x i ,
where ρ is the material density.
Based on Equations (2) and (3), damage only modifies nominal stress by introducing the concept of effective stress. Hence, elastic effect can be separated from plastic effect.
ψ = ψ e ( ε i j e , T , D ) + ψ P ( T , r , χ ) ,
where ψ e ( ε i j e , T , D ) and ψ P ( T , r , χ ) are the elastic and plastic Helmholtz free energies, respectively, ε i j e is the elastic strain tensor, T represents the temperature, and r and χ are the hardening variable and kinematic hardening parameter, respectively.
In linear thermoelastic theory, the expression of damage energy release rate is presented as follows [38]:
Y = ρ ψ e D .
In isotropic materials, the damage energy release rate Y can be expressed by Equations (6)–(8):
Y = σ e q 2 2 E ( 1 D ) 2 f ( σ m σ e q )
T = σ m σ e q
f ( σ H / σ e q ) = 2 ( 1 + v ) / 3 + 3 ( 1 2 v ) ( σ H / σ e q ) 2 ,
where T is the stress triaxiality, σ H and σ e q present the hydrostatic stress and equivalent von Mises stress respectively, v is Poisson’s ratio and f ( σ m / σ e q ) is a function of stress triaxiality T .
Based on the Legendre–Fenchel transformation, the dissipative potential F T can be expressed as a function of the related variables [39] F P ( σ , R , X ; D ) and F D ( Y ; ε p , D ) :
F T = F P ( σ , R , X ; D ) + F D ( Y ; ε p , D ) ,
where R and X are the isotropic hardening stress and kinematic back stress, respectively, and ε p is the effective cumulative plastic strain.
The dissipative potential F T in Equation (9) decreases with the classical yield function when the material is not damaged or the damage phenomena associated with void growth are suppressed. For isotropic materials, the first term of Equation (9) can be expressed as in Equation (10). The second term is shown in Equation (11):
F P ( σ , R ; D ) = σ e q 1 D R ( r ) σ y
F D = [ 1 2 ( Y S 0 ) 2 S 0 1 D ] ( D c r D ) ( α 1 ) / α ( ε p ) ( 2 + n ) / n ,
where σ y and S 0 represent the yield stress of the material and the material constant, respectively, α is the damage exponent characteristic of the material, n is the material hardening exponent and D c r represents critical damage variable.
The partial derivation of Equation (11) for Y is as follows:
F D Y = Y S 0 ( D c r D ) ( α 1 ) / α ( ε p ) ( 2 + n ) / n 1 1 D
Equation (13) can be obtained by substituting Equation (6) into Equation (12):
F D Y = ( σ e q 2 ( 1 D ) 2 ) f ( σ m σ e q ) 1 2 E S 0 ( D c r D ) ( α 1 ) / α ( ε p ) ( 2 + n ) / n 1 1 D .
For ductile materials, the relationship between von Mises equivalent stress σ e q and effective cumulative plastic strain ε p based on the Ramberg–Osgood formula can be obtained as follows [40]:
σ e q ( 1 D ) = K ( ε p ) ( 1 / n ) ,
where K is the material constant.
The kinetic law of damage evolution is expressed by Equation (15). The relationship between the plastic multiplier λ ˙ and the effective accumulated plastic strain rate ε ˙ p is expressed by Equation (16).
D ˙ = λ ˙ F D Y
λ ˙ = ε ˙ p ( 1 D )
Equations (17) and (18) can be obtained by substituting Equations (14)–(16) into Equation (13):
D ˙ = K 2 2 E S 0 ( D c r D ) ( α 1 ) / α f ( σ m σ e q ) ε ˙ p ε p
d D = K 2 2 E S 0 ( D c r D ) ( α 1 ) / α f ( σ m σ e q ) 1 ε p d ε p .
Considering proportional monotonic loading, where the stress triaxiality remains constant, Equation (19) can be obtained by integrating Equation (18) between [ D 0 , D c r ] and [ ε t h p , ε f p ] . Similarly, Equation (20) can be obtained by integrating Equation (18) between [ D , D c r ] and [ ε p , ε f p ] :
( D c r D 0 ) 1 / α = 1 α K 2 2 E S 0 ln ( ε f p ε t h p ) f ( σ m σ e q )
( D c r D ) 1 / α = 1 α K 2 2 E S 0 ln ( ε f p ε p ) f ( σ m σ e q ) ,
where ε t h p represents the plastic strain threshold under multiaxial stress, ε p and ε f p represent the accumulated plastic strain and fracture accumulated plastic strain under multiaxial stress, respectively, and D 0 is the initial damage variable.
Under uniaxial loading, the stress triaxiality T is equal to 1/3. Equation (8) can then be expressed as follows:
f ( σ m σ e q ) = 1 .
The stress triaxiality (T) has a weak effect on the plastic strain threshold under multiaxial stress ε t h p . Therefore, ε t h p is equal to the plastic strain threshold under uniaxial stress ε t h , and ε f p is equal to the fracture accumulated plastic strain under uniaxial stress ε f . Equation (19) can be expressed as follows:
( D c r D 0 ) 1 / α = 1 α K 2 2 E S 0 ln ( ε f ε t h ) .
Equation (23) can be obtained by substituting Equation (22) into Equation (20).
D = D 0 + ( D c r D 0 ) { 1 [ 1 ln ( ε / ε t h ) ln ( ε f / ε t h ) ] α } ,
where ε represents the accumulated plastic strain under uniaxial stress.
By substituting Equation (22) into Equation (18), Equation (24) can be obtained.
d D = α ( D c r D 0 ) 1 / α ln ( ε f / ε t h ) f ( σ m σ e q ) ( D c r D ) ( α 1 ) / α d ε p ε p
Under proportional loading, Equation (23) can be transformed into Equation (25):
D = D 0 + ( D c r D 0 ) { 1 [ 1 ln ( ε p / ε t h p ) ln ( ε f / ε t h ) f ( σ m σ e q ) ] α } .
Equation (26) can be obtained by substituting Equation (22) into Equation (18):
ln ( ε f p / ε t h p ) ln ( ε f / ε t h ) f ( σ m σ e q ) = 1 .
Considering the weak effect of T on the plastic strain threshold, ε t h equals to ε t h p . However, the effect of T on ε t h p cannot be ignored. Equation (26) can be transformed into Equation (27) as follows:
ε f p = ε t h ( ε f ε t h ) 1 / f ( σ m σ e q ) .
According to the derivation above, Equations (24), (25) and (27) represent the CDM for monotonic tension.

2.2. Continuum Damage Mechanics Model for ULCF

The fracture mechanisms for ULCF and monotonic tension involve ductile fracture. Therefore, the CDM for ULCF can be obtained by modifying the CDM for monotonic tension. Under ULCF, when the accumulated plastic tensile strain ε p + is greater than the uniaxial plastic strain threshold ε t h , damage begins to accumulate. Tensile and compressive strain can be distinguished according to the positive or negative sign of stress triaxiality. The CDM calculation (Equation (24)) for monotonic tension can be extended to the field of ULCF, such as in Equations (28) and (29):
d D = α ( D c r D 0 ) 1 / α ln ( ε f / ε t h ) f ( σ m σ e q ) ( D c r D ) ( α 1 ) / α d ε p + ε p
{ d ε p + = d ε p H ( T ) H ( T ) = { 0 T < 0 1 T 0
where ε p + presents the accumulated plastic tensile strain and H ( T ) describes the damage state.
Based on the CDM formula for ULCF, the elastic modulus of the material is modified as follows:
E = E 0 [ 1 D H ( T ) ]
where E 0 and E represent the elastic modulus before and after damage, respectively.

3. Calibration of Material Parameters for CDM

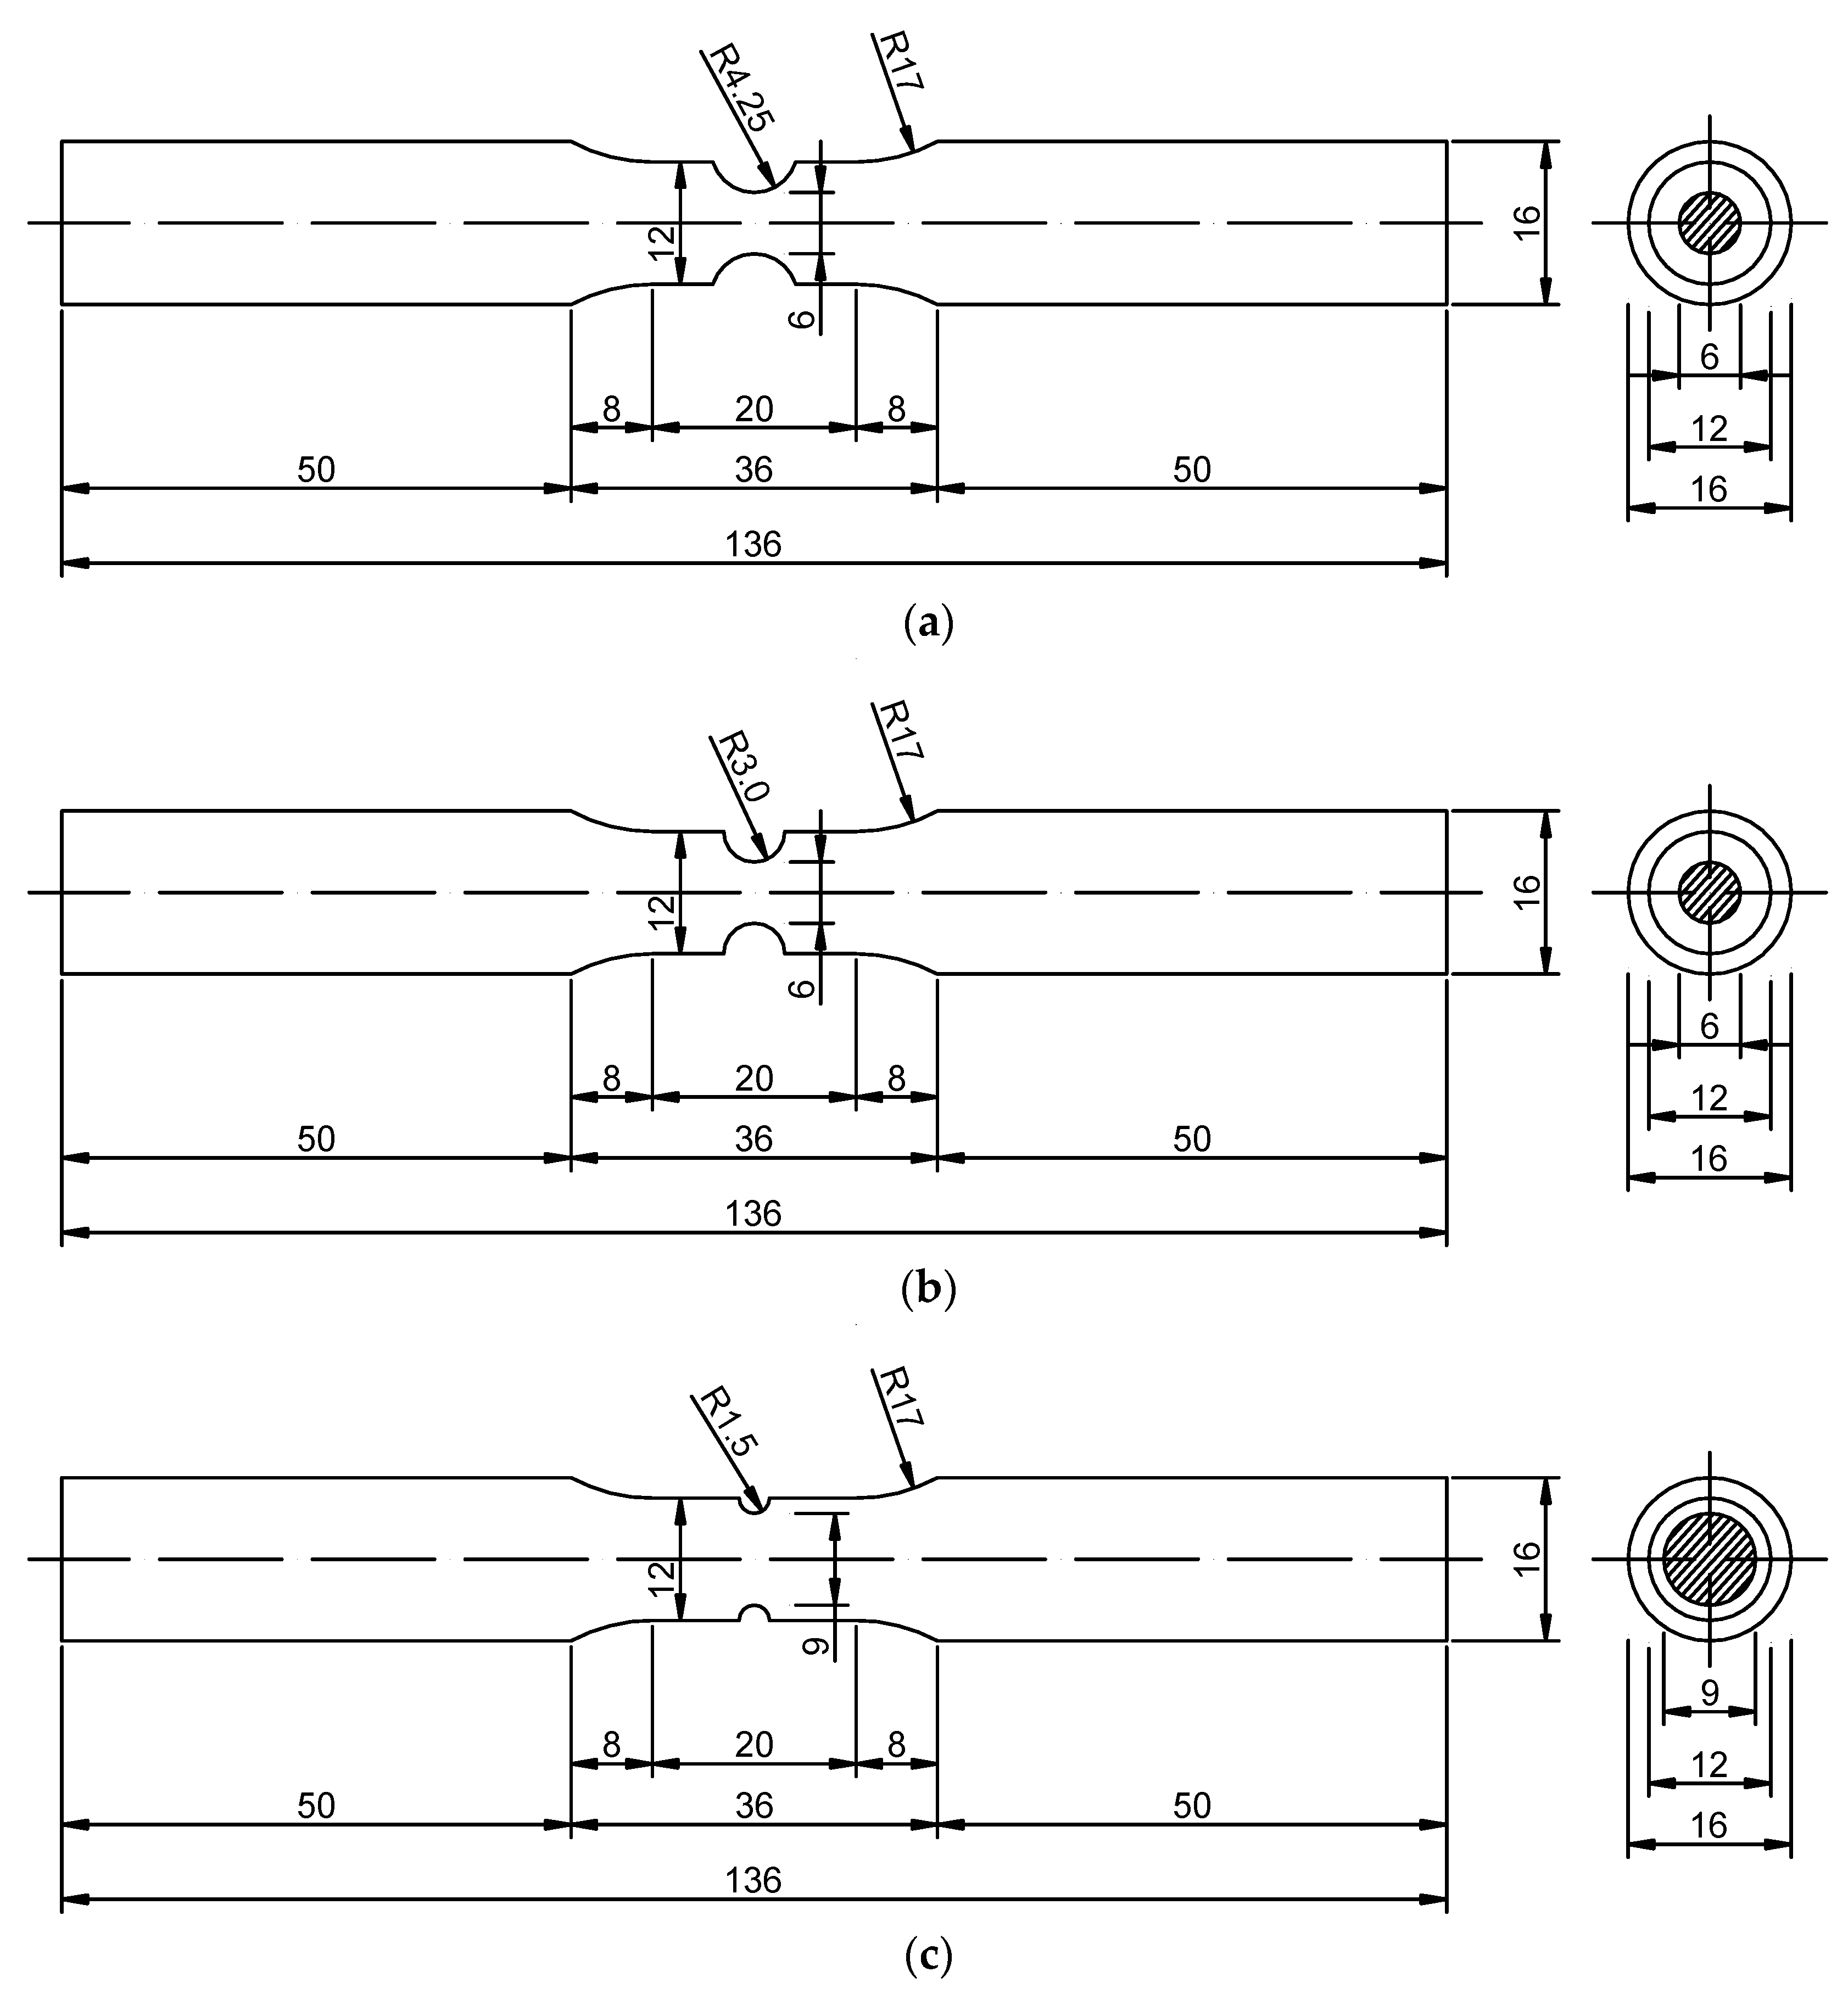
3.1. Uniaxial Tensile Test for Notched Round Bar Specimen

Uniaxial tensile tests of Q345qC base metal, heat-affected zone (HAZ) and weld metal are carried out to calibrate the uniaxial plastic strain threshold ε t h in the CDM for ULCF. Here, notched round bar specimens of the base metal, HAZ and weld metal are extracted from the welded steel plate. Different notch radii of specimens result in different stress triaxialities. Three different notch radii (R = 4.25, 3.0, 1.5 mm) are prepared for each material in this test, and two specimens are produced for each radius; thus, the total number of specimens is 18. The design dimensions of the specimens are shown in Figure 1, and the number and measurements of the notched round bar specimens are shown in Table 1. A schematic of the loading and measurement procedures for the specimens is shown in Figure 2. The test was carried out at Zhejiang University of Technology. The type of the testing machine is INSTRON-8801 (INSTRON, Norwood, MA, USA).
The load–deformation curve of notched round bar specimens at gauge segment is shown in Figure 3. P and δ represent the uniaxial tensile load and extension length at the gauge segment, respectively. Under the same radius, the ultimate load-bearing capacity of the weld metal is larger than that of the base metal and HAZ, but the ductility of the former decreases remarkably compared with that of the latter. The ultimate bearing capacity and ductility of the base metal and HAZ are similar.
The abrupt change point of the slope in the descending part of the curve, as shown in Figure 3, reflects the crack initiation point of ductility. During finite element analysis, the extension length at the gauge segment corresponding to the crack initiation point of ductility is taken as the control deformation, which is used to calibrate the uniaxial plastic strain threshold ε t h .

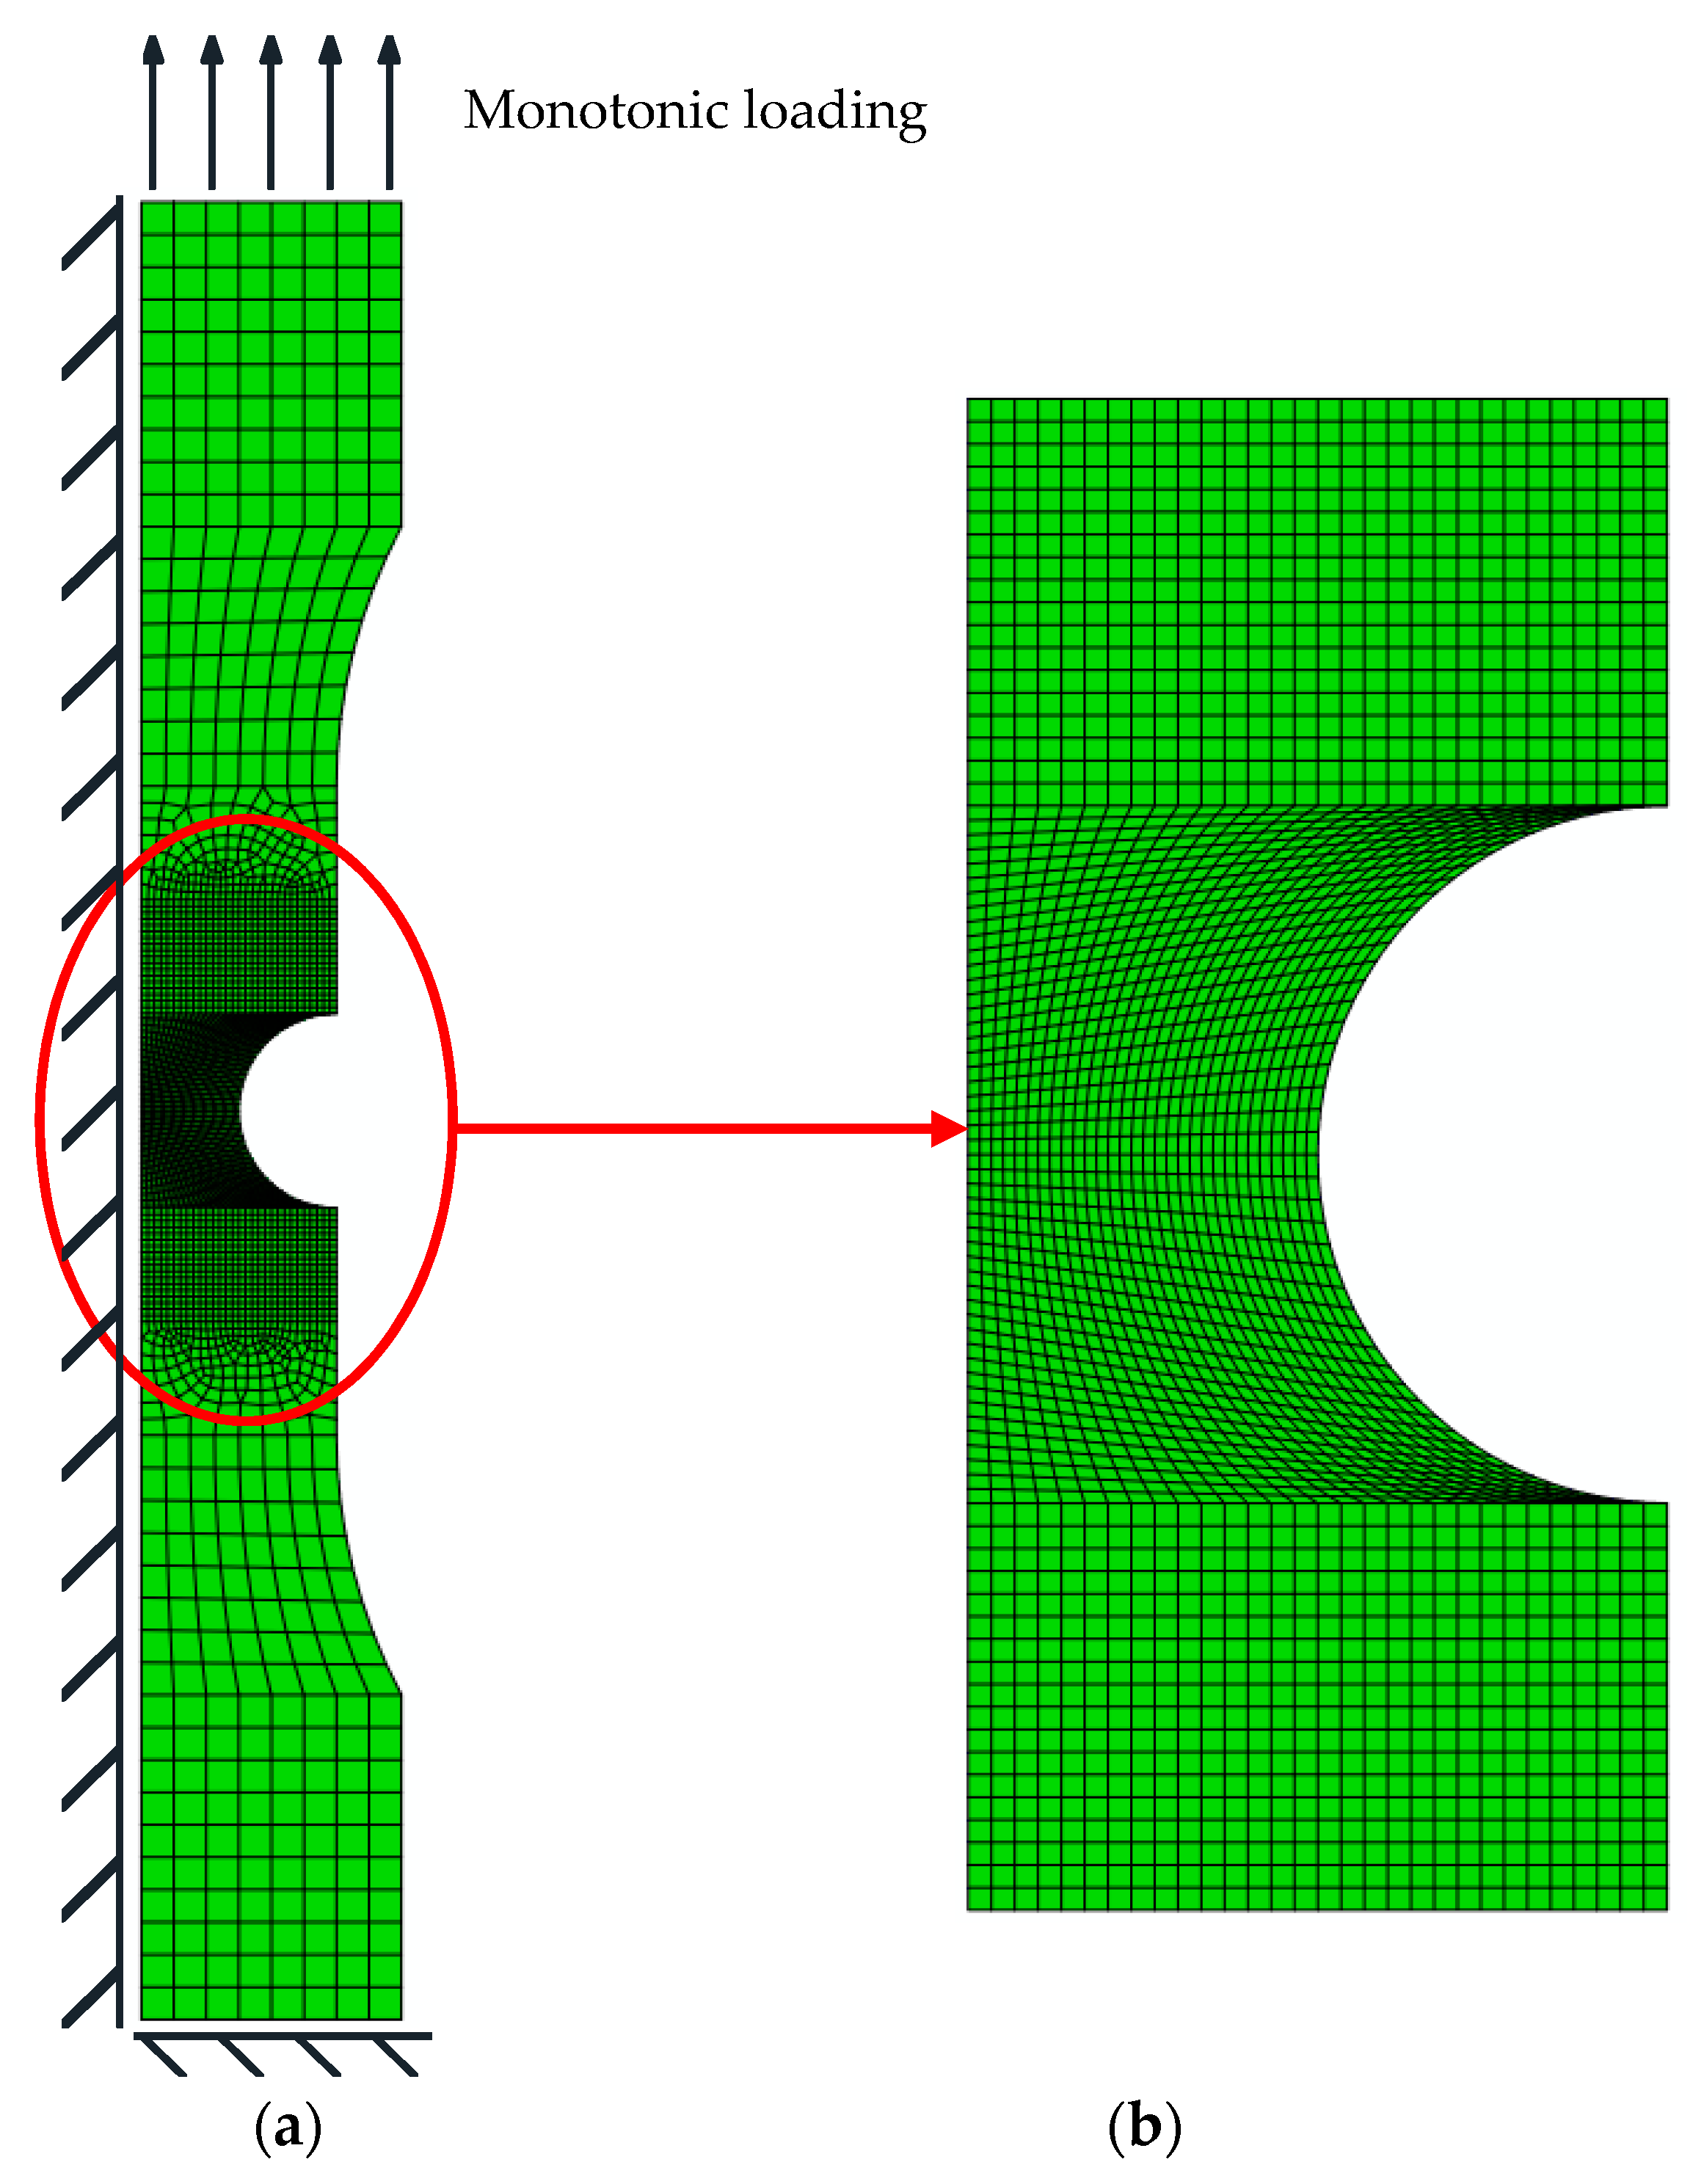
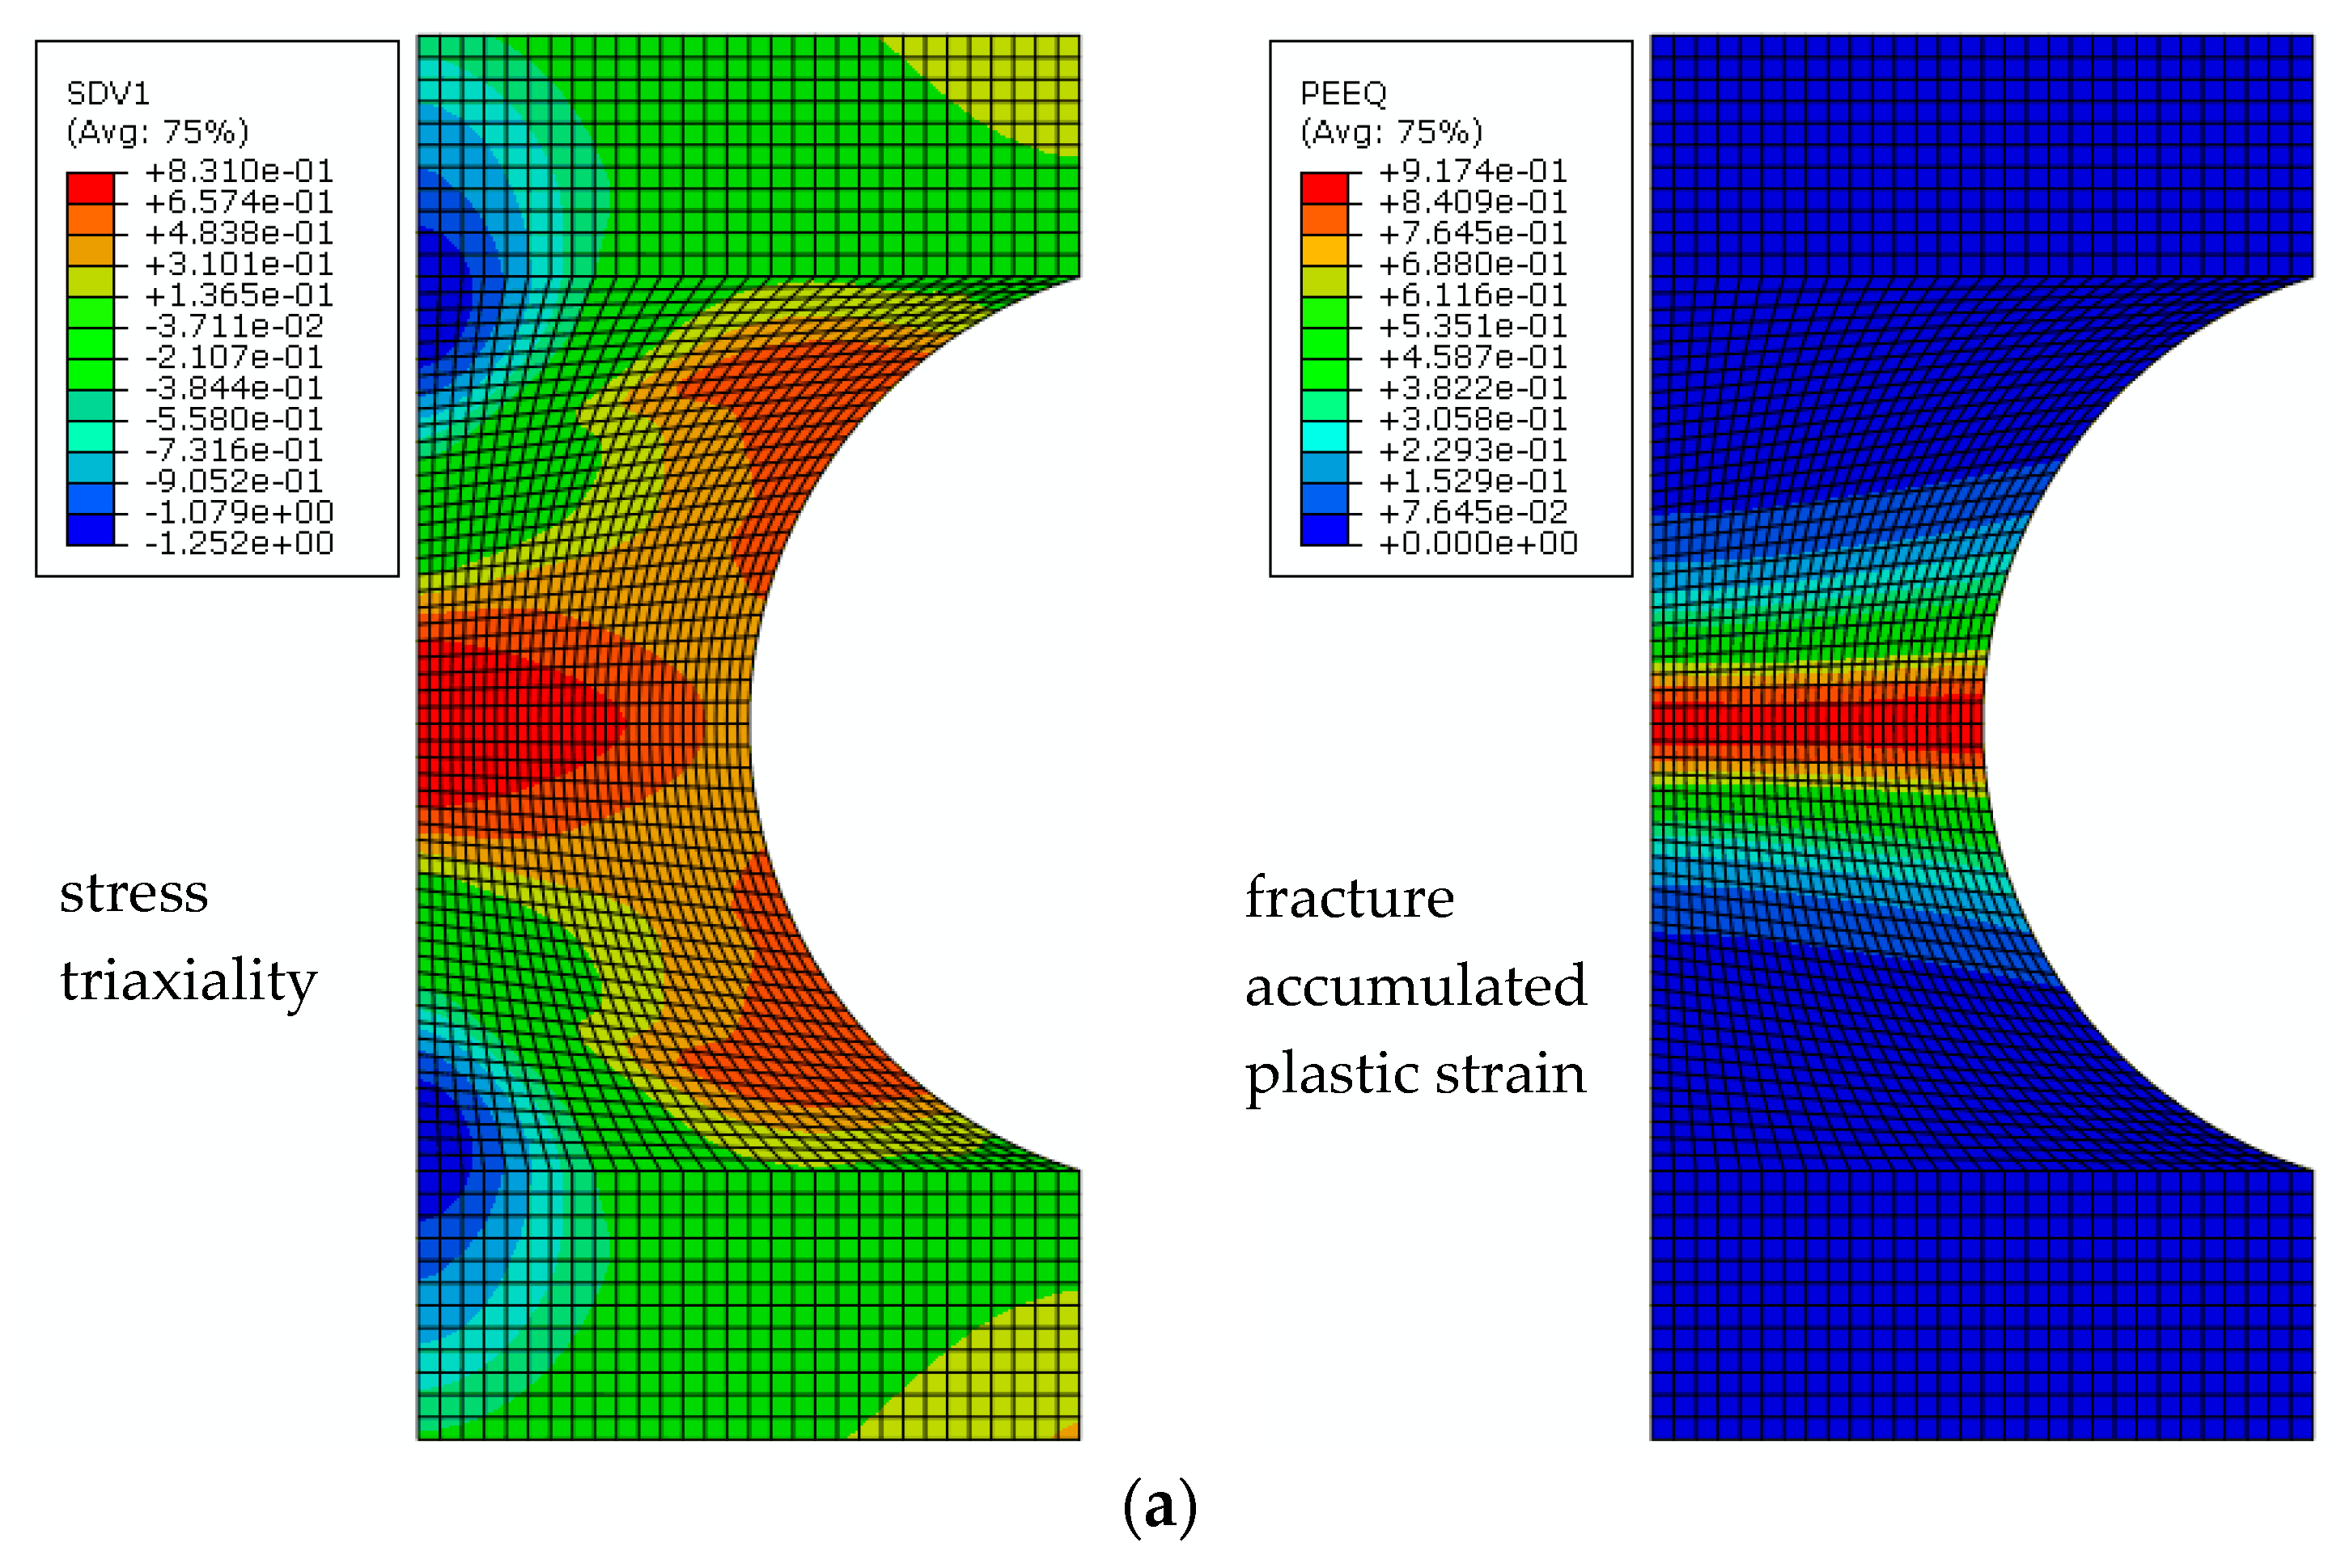
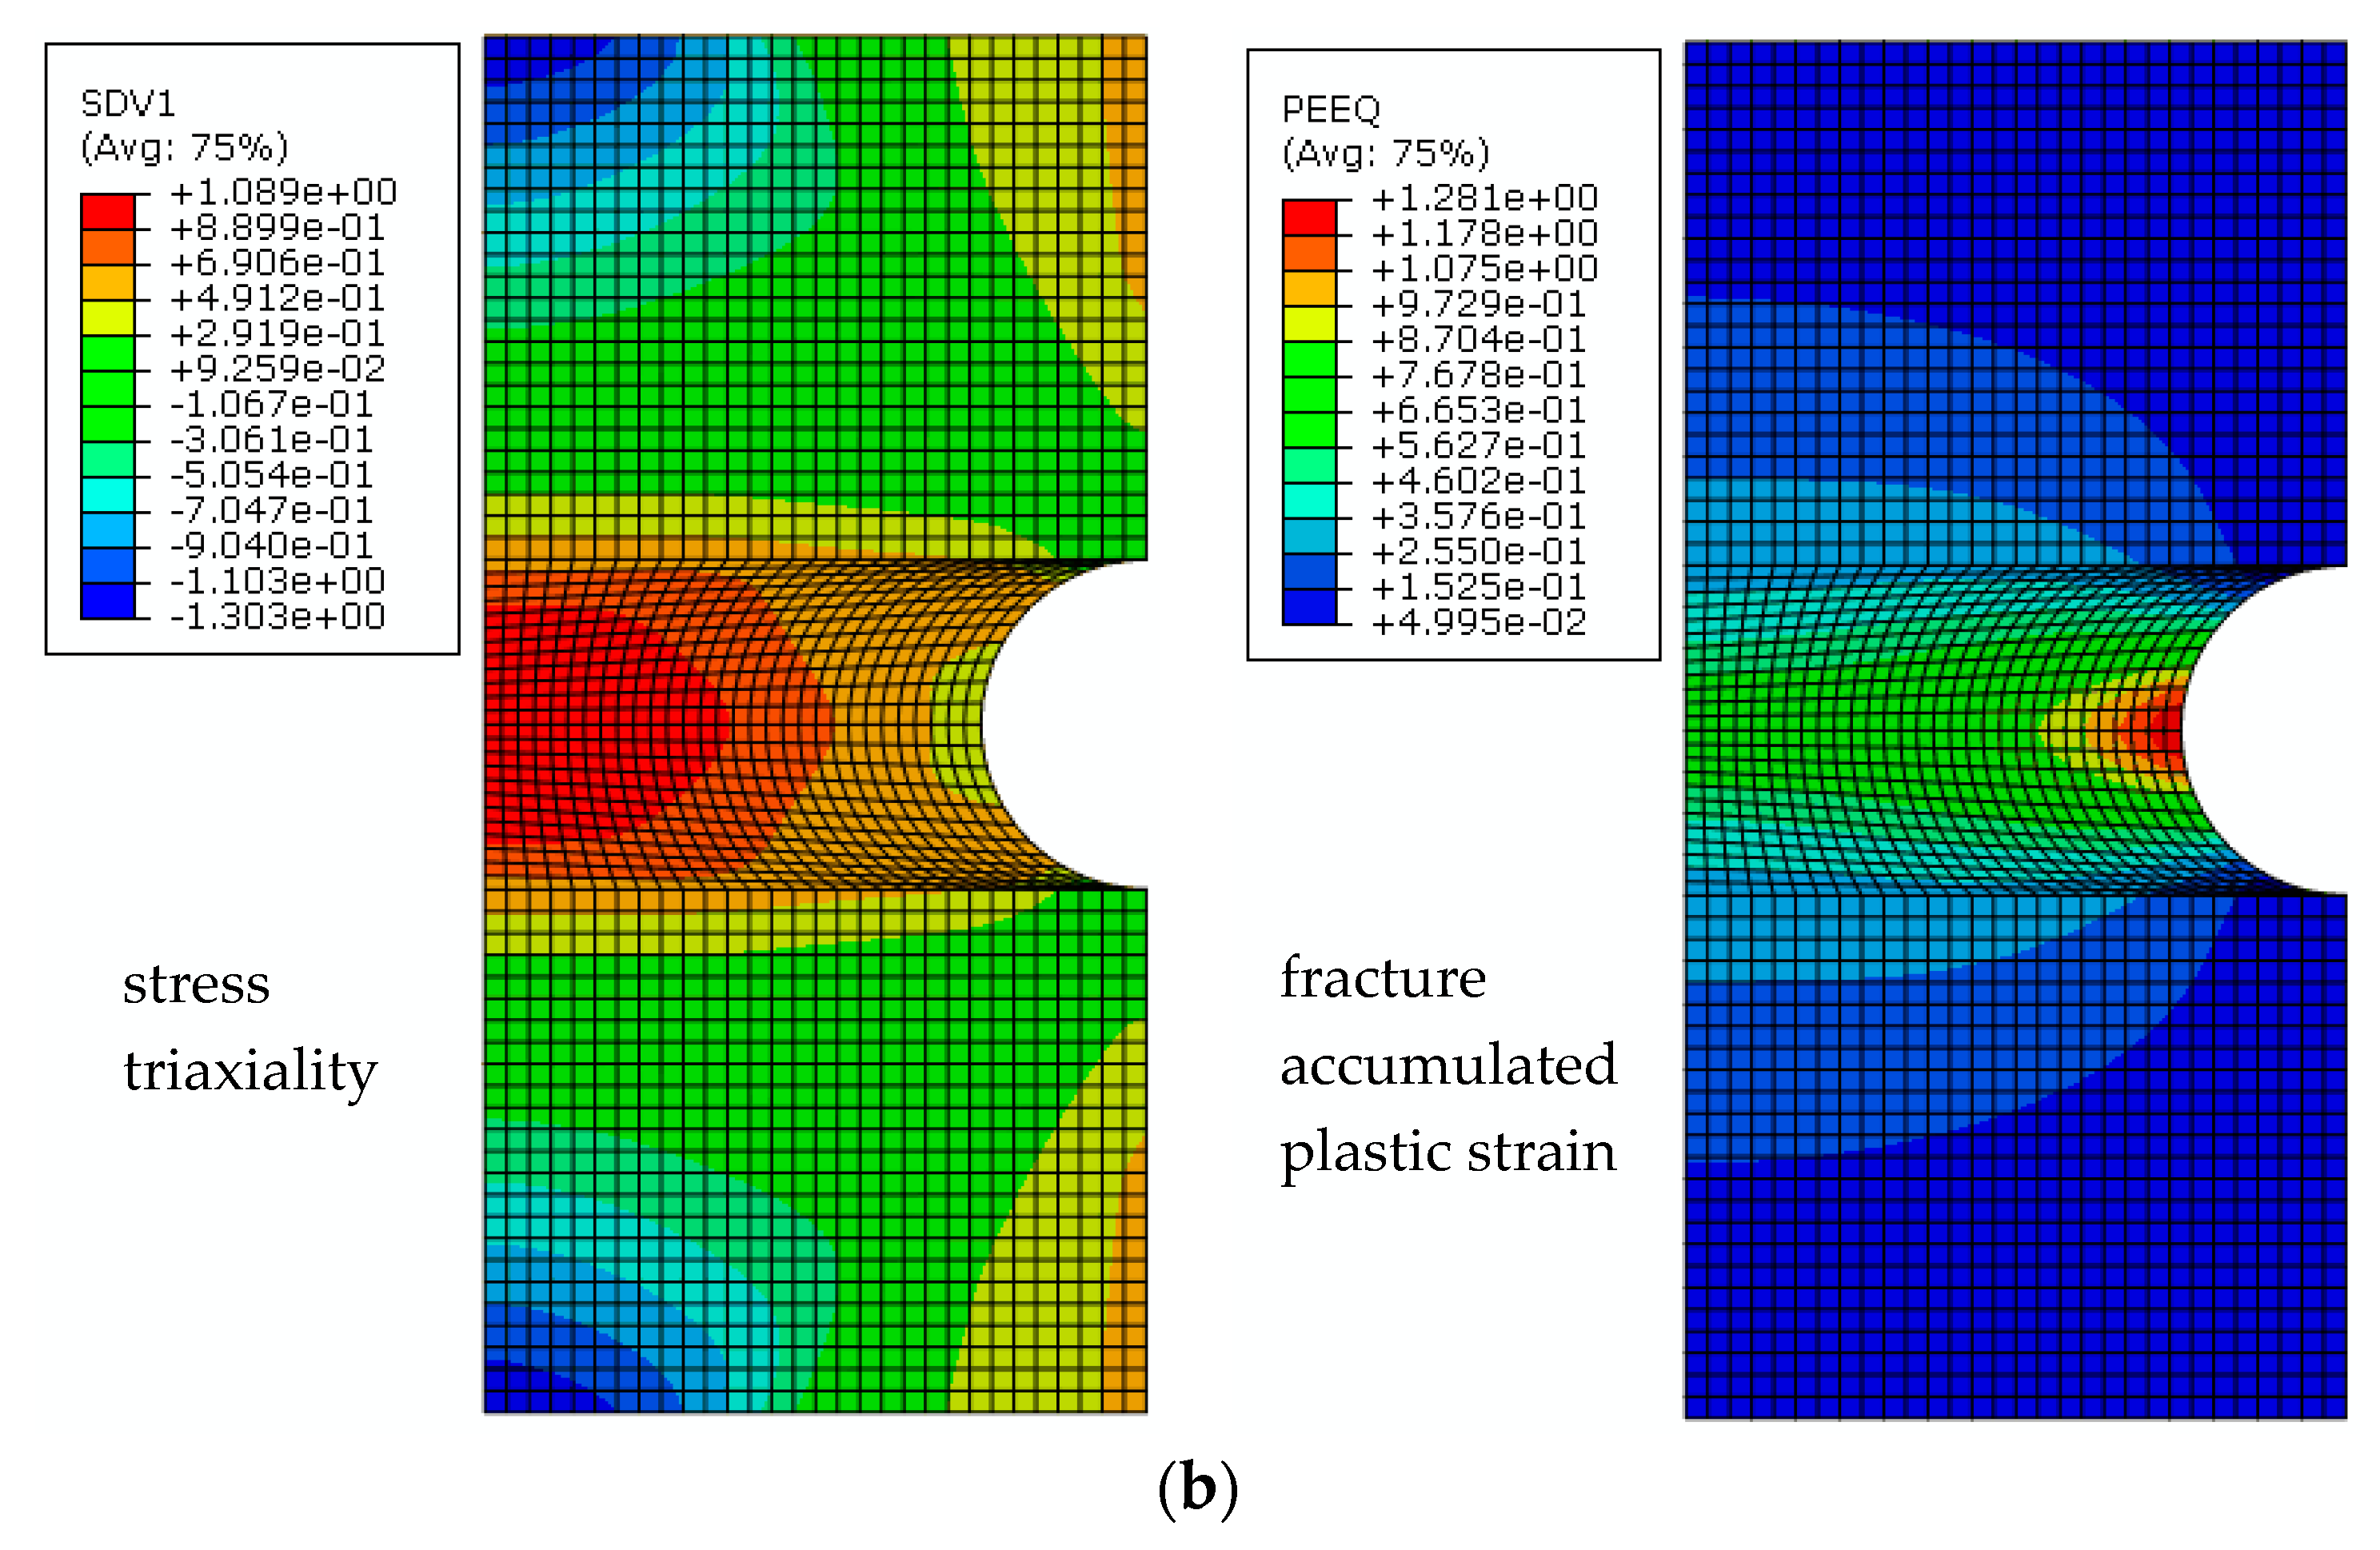
3.2. Calibration of Material Parameters for CDM by Finite Element Analysis

The two-dimensional axisymmetric finite element model of each notched specimen is established according to the symmetry of the specimen by using ABAQUS (Version 2016, Dassault Systèmes Simulia Corp., Johnston, RI, USA.), as shown in Figure 4. The element type is CAX8R, which is an eight-node quadrilateral biquadratic axisymmetric reduced integral element. The finite element size in the notch area is 0.2 mm, and the central axis of the specimen is subjected to axisymmetric boundary conditions. One end of the notched specimen is articulated, whilst the other end is free in the axial direction.
Uniaxial tension analysis of the finite element model of notched round bar specimens of the three materials is carried out respectively. When the extension length at the gauge segment δ in finite element analysis reaches the critical extension length at the crack initiation point of ductility in the test, the stress triaxiality T and fracture accumulated plastic strain ε f p at the centre of the model are recorded. Figure 5 shows the stress–strain field and stress triaxiality nephograms of base metals with different notch radius. The maximum stress triaxiality T appears at the centre of the finite element model. At R = 4.25 and 3 mm, fracture accumulated plastic strain remains relatively constant throughout the notched section, whilst the maximum fracture accumulated plastic strain appears at the notched surface at R = 1.5 mm. Finally, according to T, ε f p and ε f of the uniaxial tension specimen, the uniaxial plastic strain threshold ε t h can be calibrated by Equation (28).
Table 2 presents the calibration results of ε t h . The average uniaxial plastic strain threshold of the base metal and HAZ are 0.4455 and 0.4357, respectively, and show little difference. The ε t h of the weld metal is 0.3673, which is 17.56% and 15.70% less than those of the base metal and HAZ, respectively. The weld metal is the most vulnerable to damage, followed by HAZ and then the base metal. The dispersion coefficients of base metal, HAZ and weld material are 13.75%, 14.91% and 34.84%, respectively, which indicates that the base metal and HAZ materials are more uniform than the weld material. The weld material has the largest dispersion coefficient amongst the specimens tested because of the influence of material uniformity and welding quality.

4. ULCF Life Prediction for the Q345qC Base Material and Welded Joints

4.1. ULCF Test for Base Material and Welded Joints

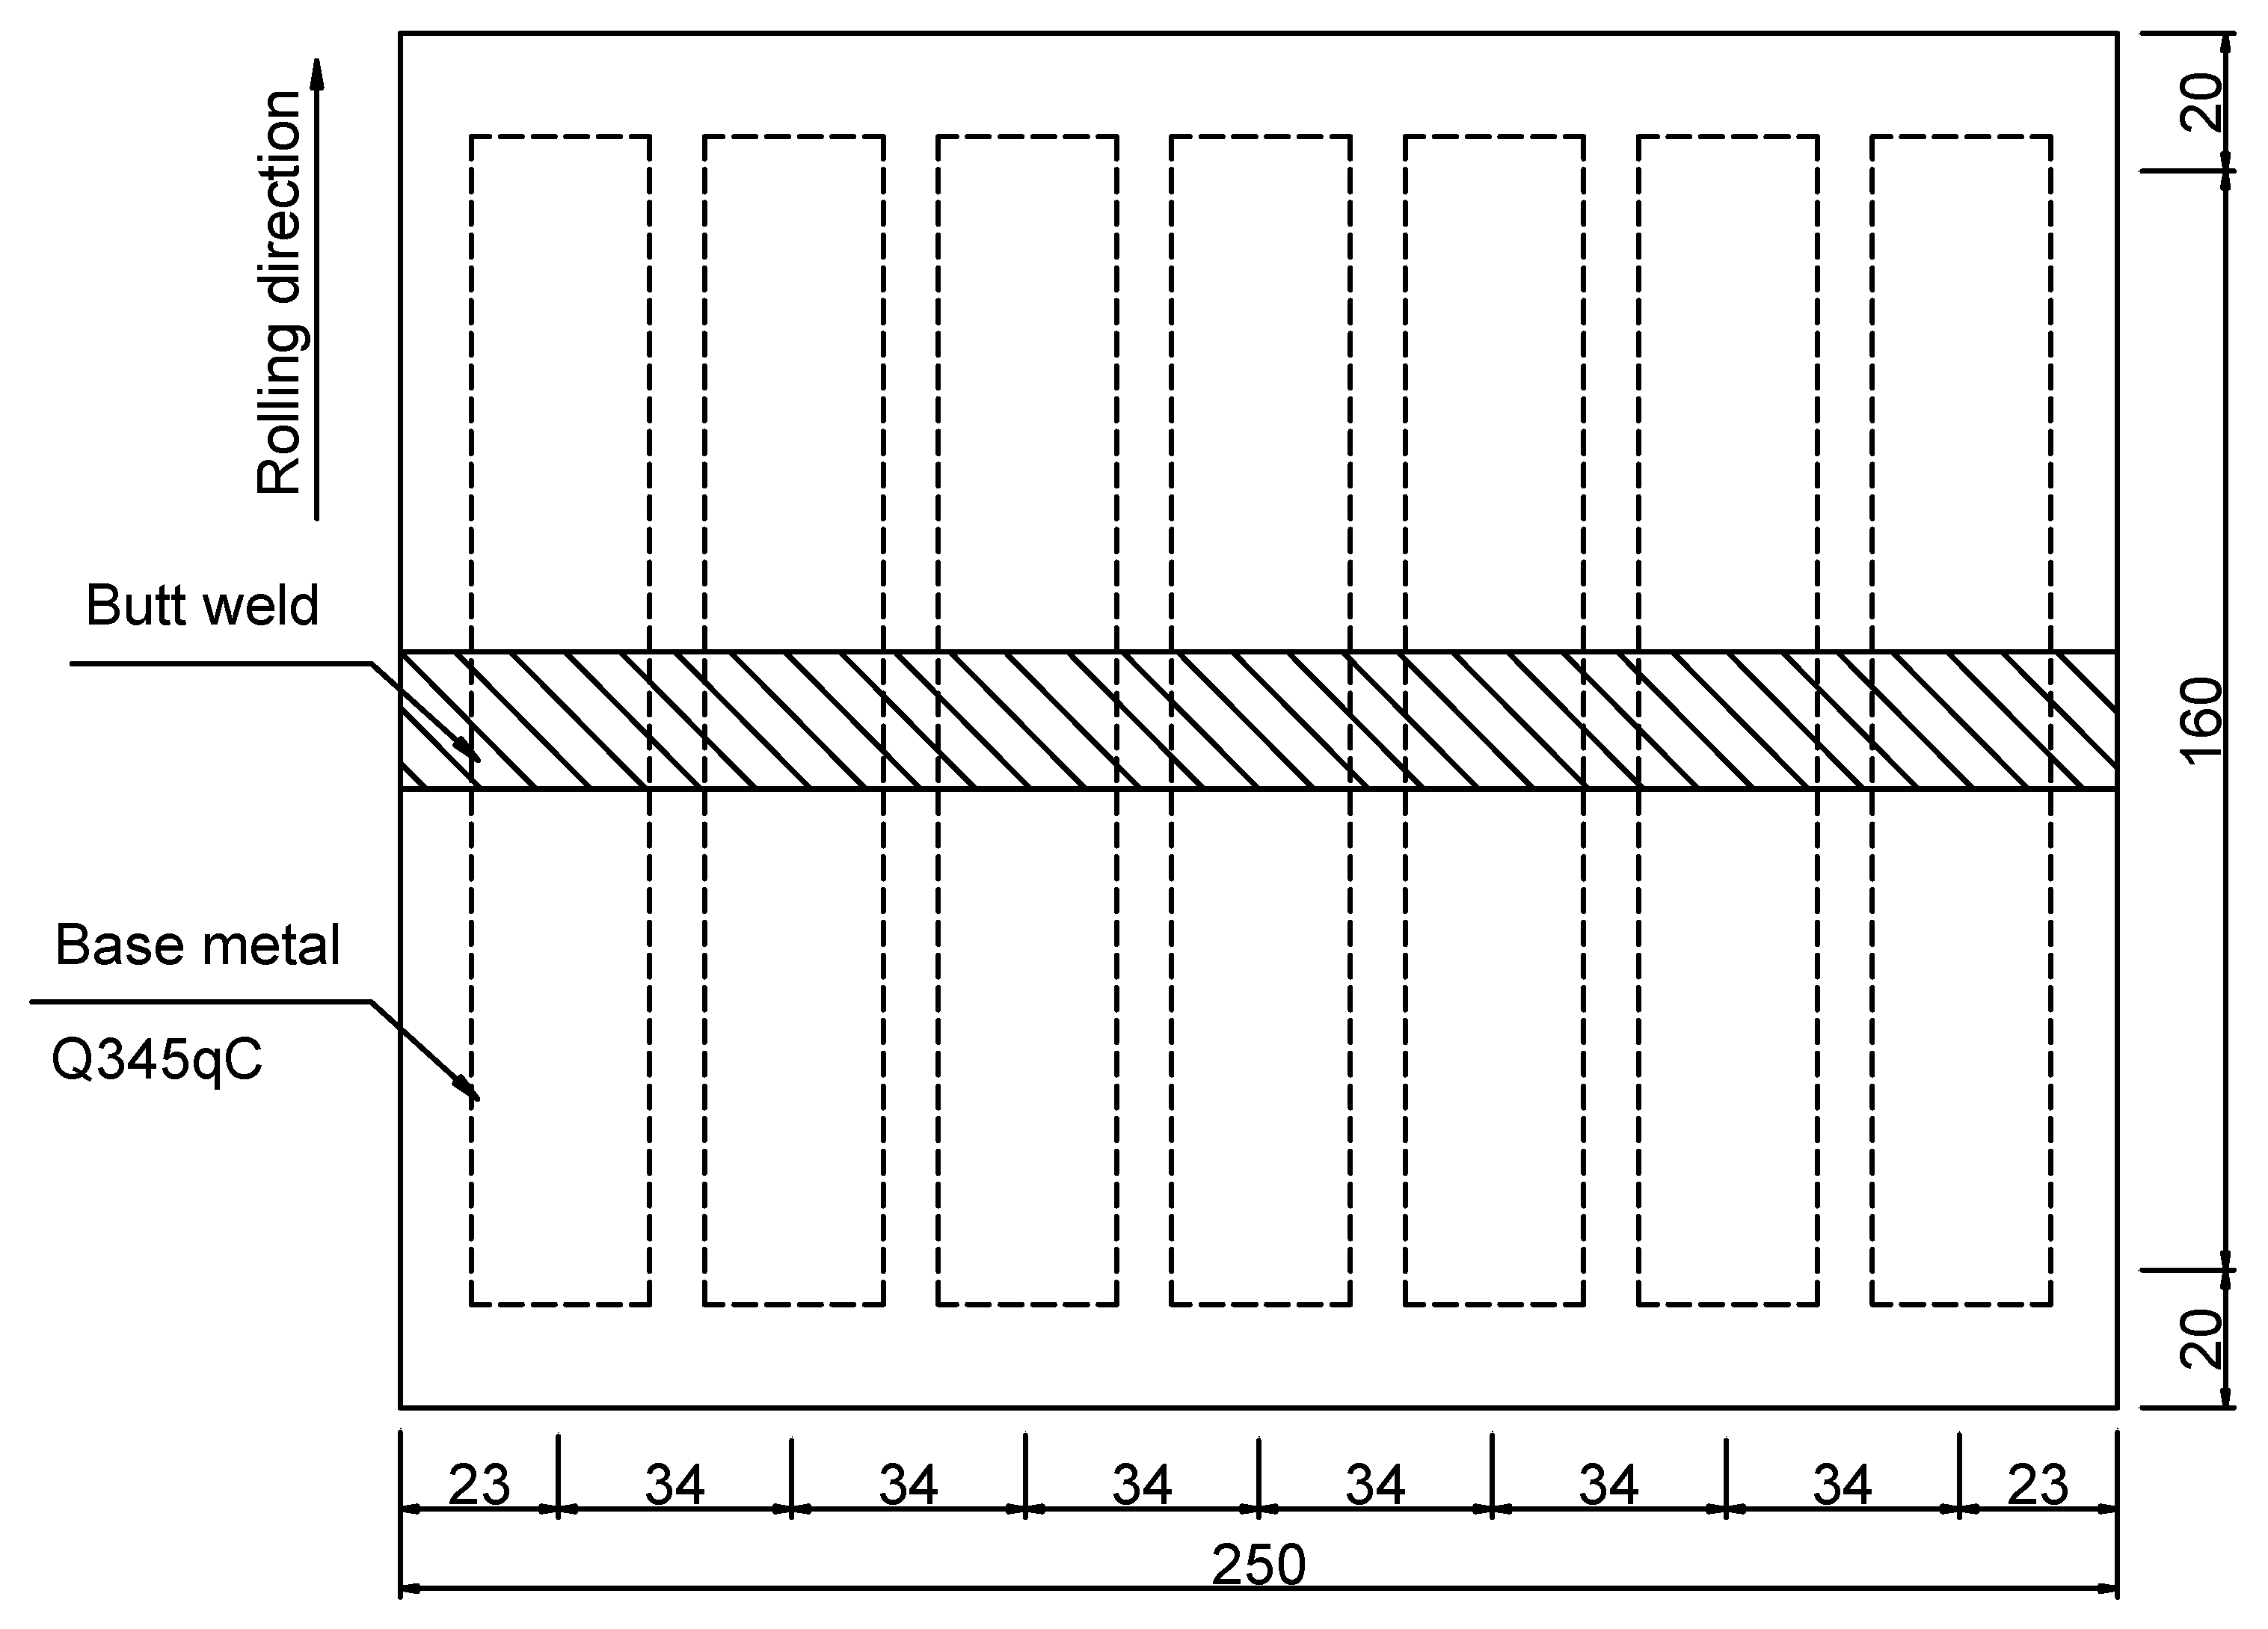
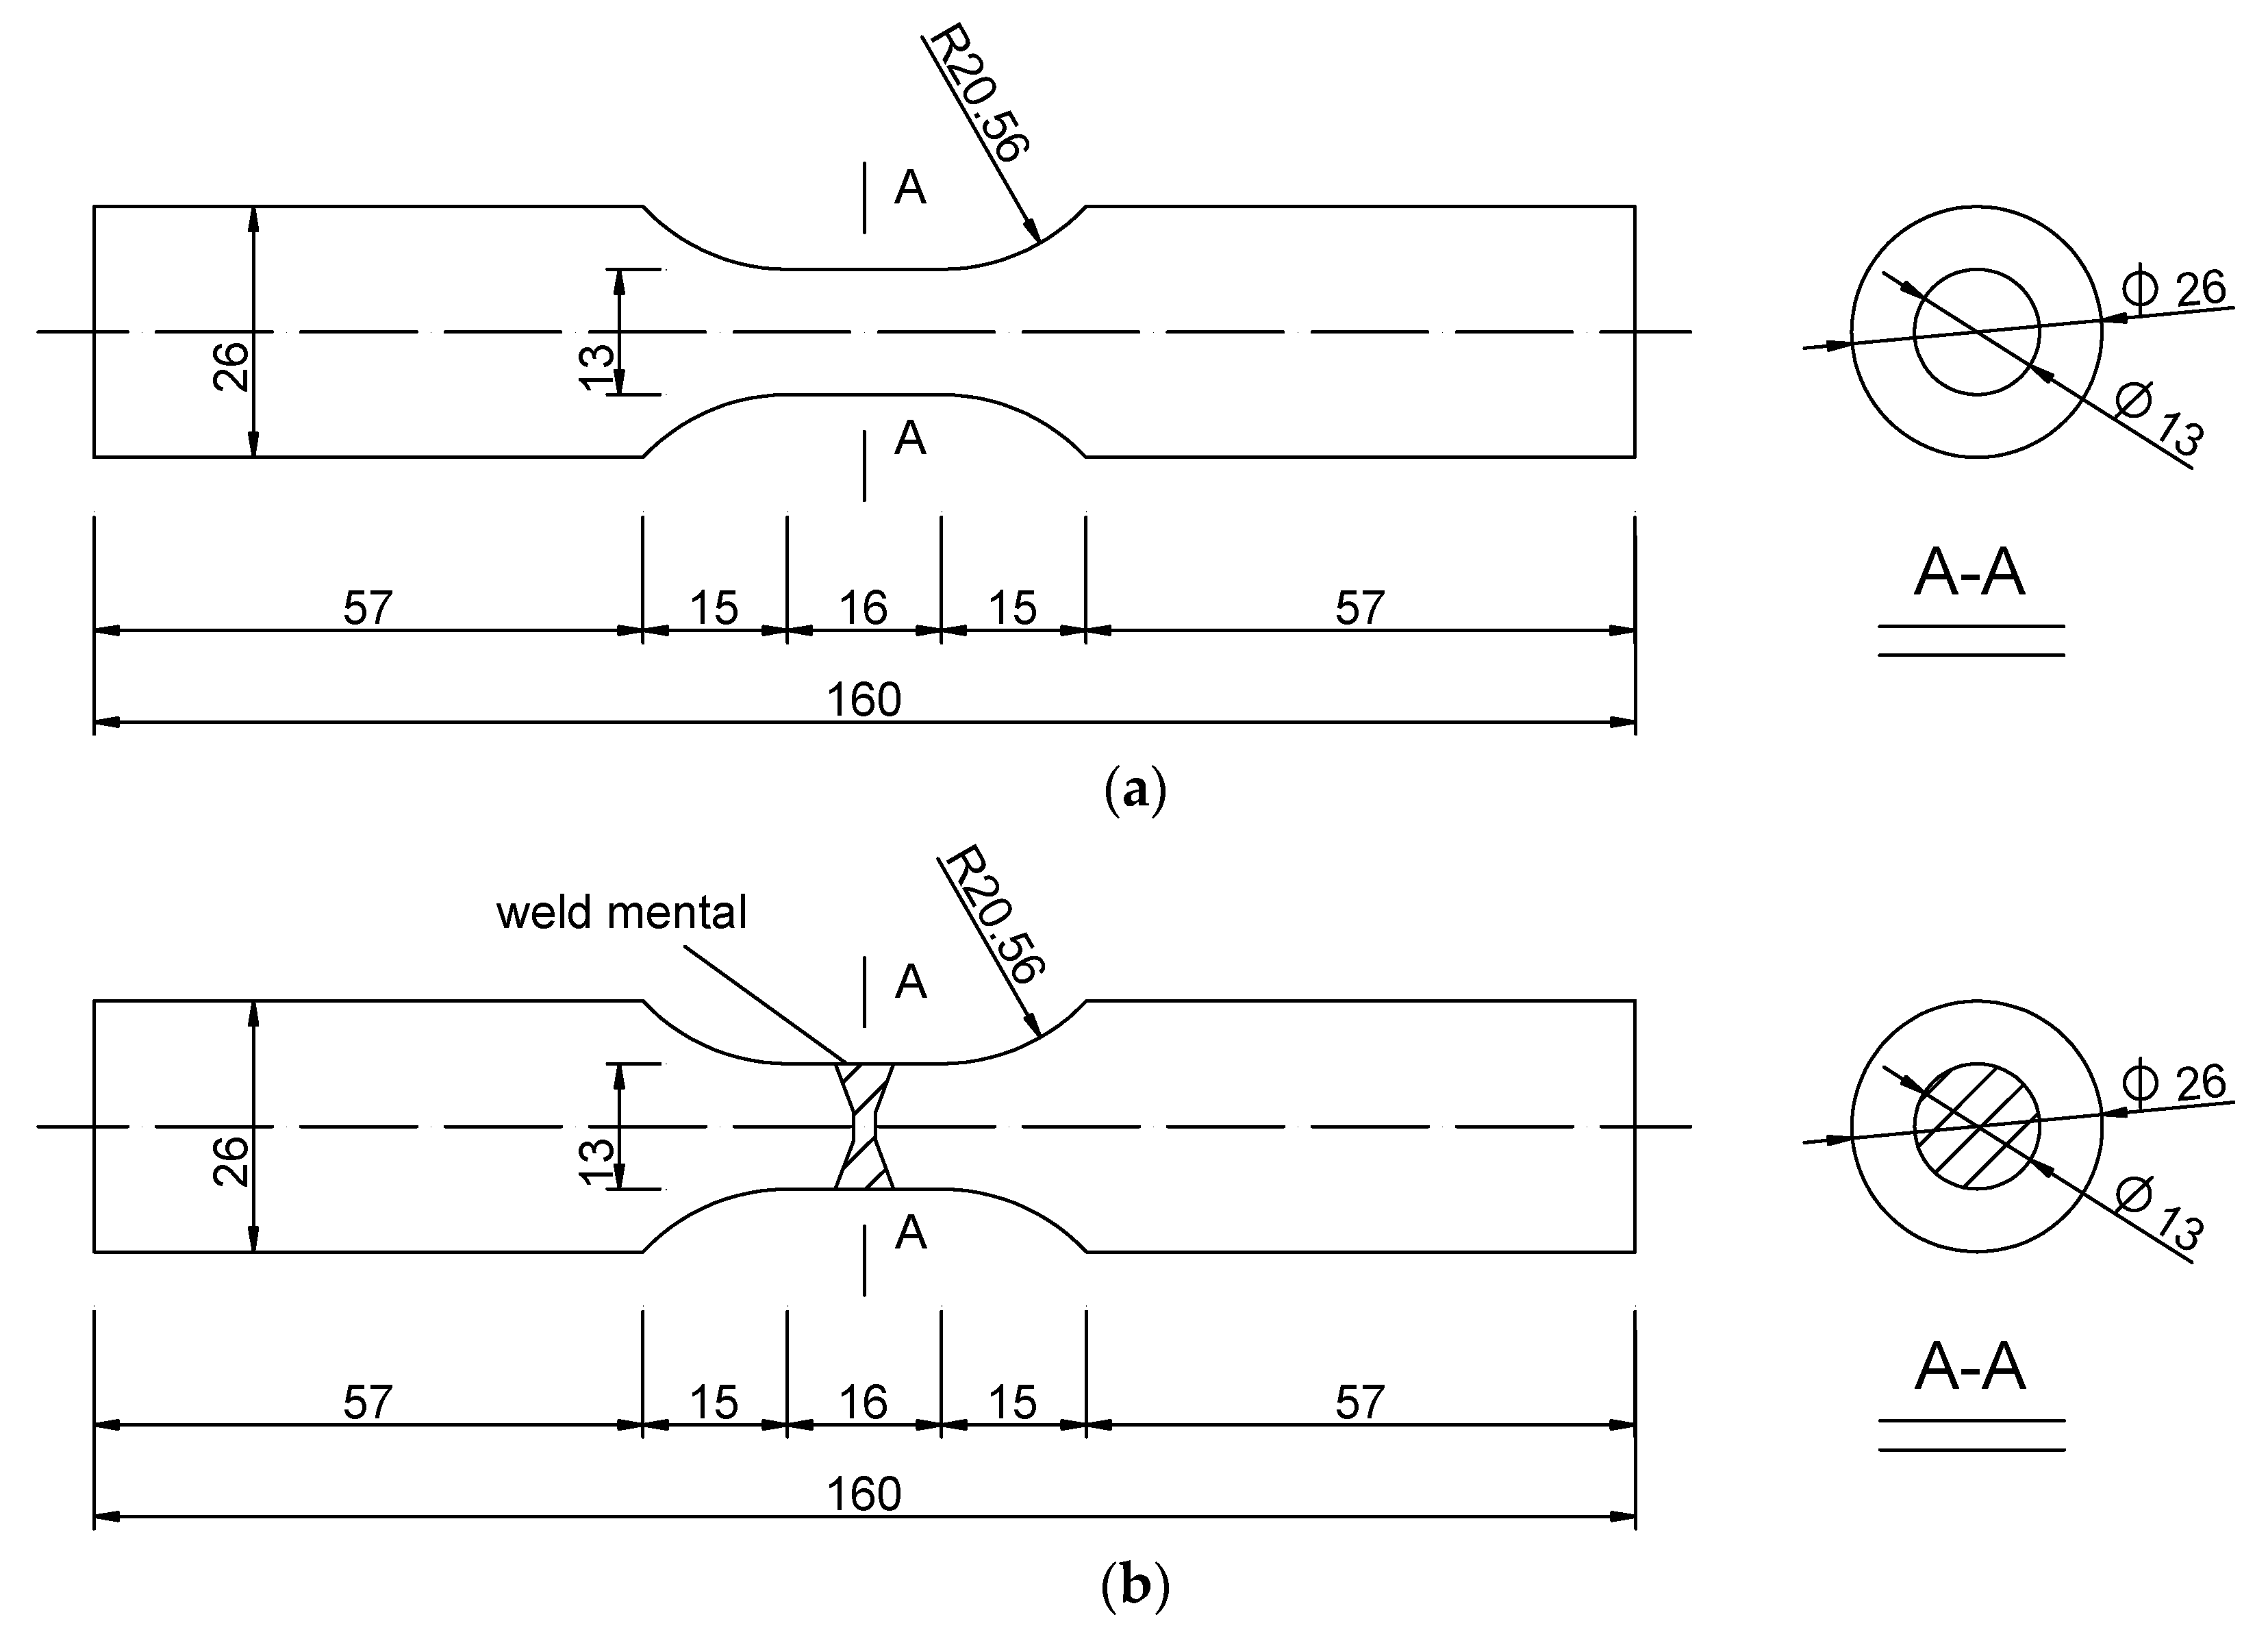
4.1.1. Material and Size of Test Specimen

The base material used in the test is Q345qC, which is commonly employed in bridges. A schematic of the extraction of weld metal specimens is shown in Figure 6. The thickness of the steel plate is 32 mm, and the national standard of welding wire is ER50-6. The steel plate is machined into the X-groove perpendicular to the rolling direction, and the welding method is butt welding with a CO2 gas shield. The post weld heat treatment method was used to eliminate the influence of welding residual stress on the test result. The sizes of the base and weld metals are shown in Figure 7. The base and weld metal specimens have a circular section with a diameter of 13 mm.

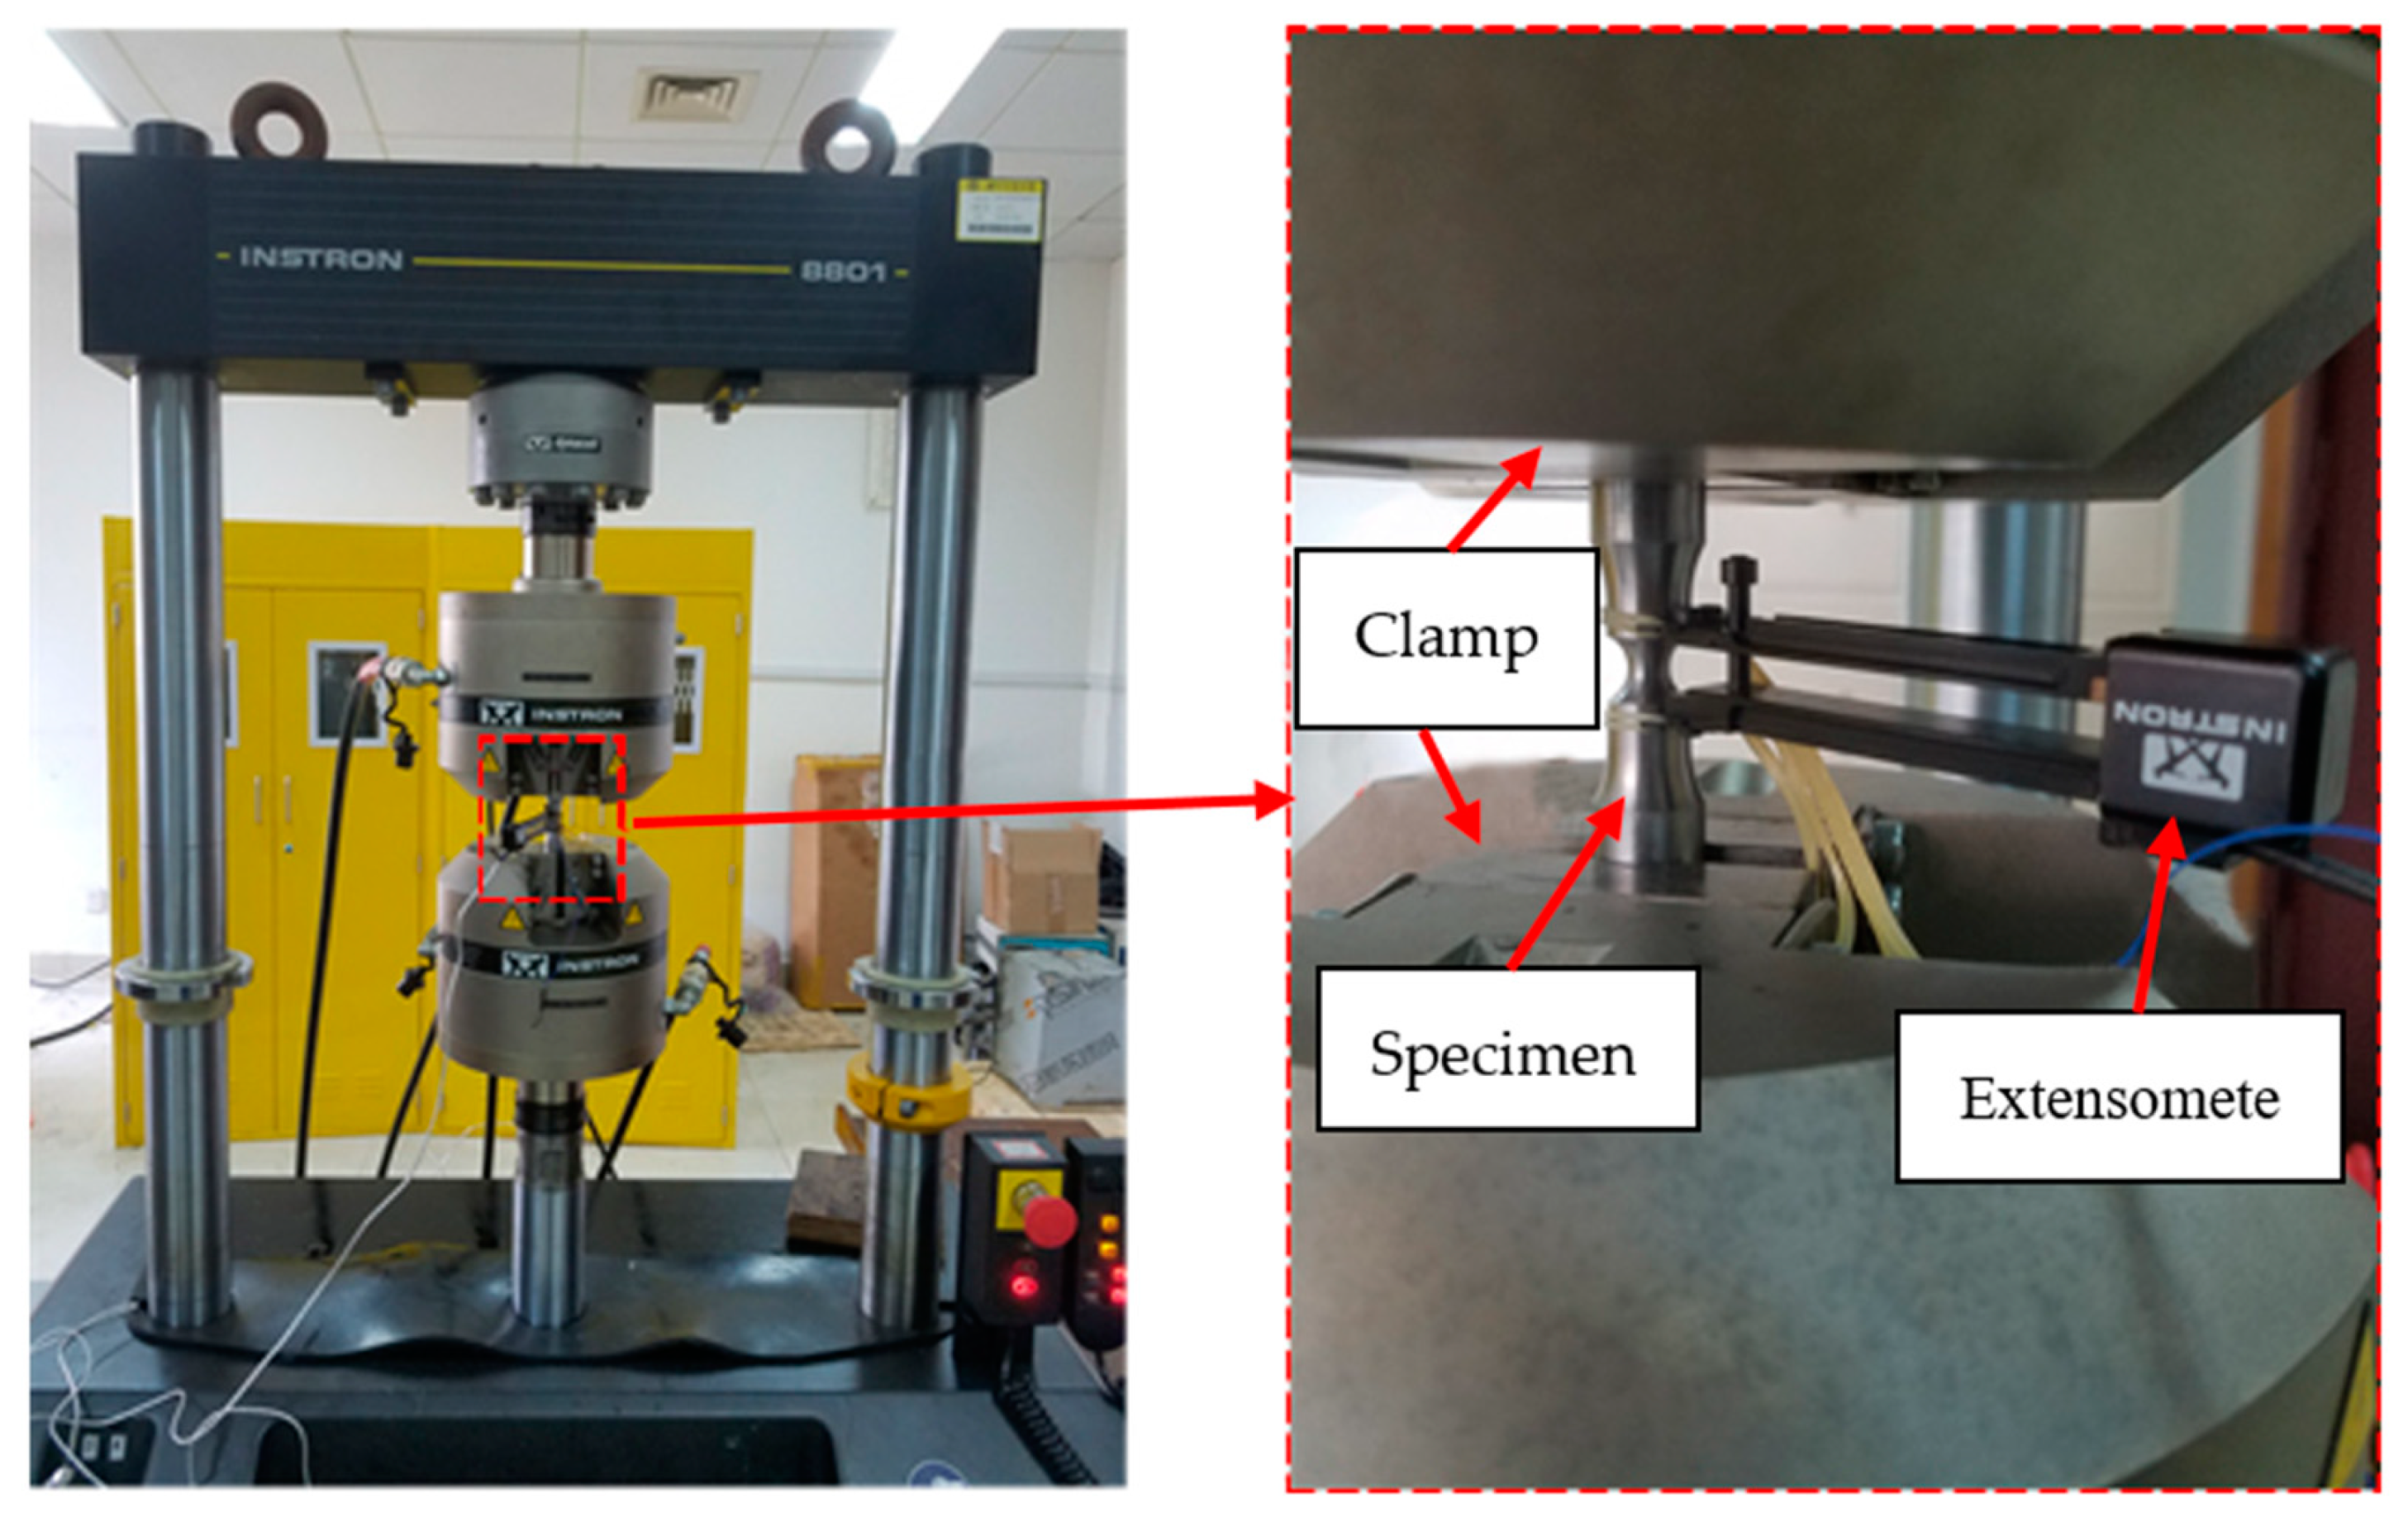
4.1.2. Test Device and Loading System
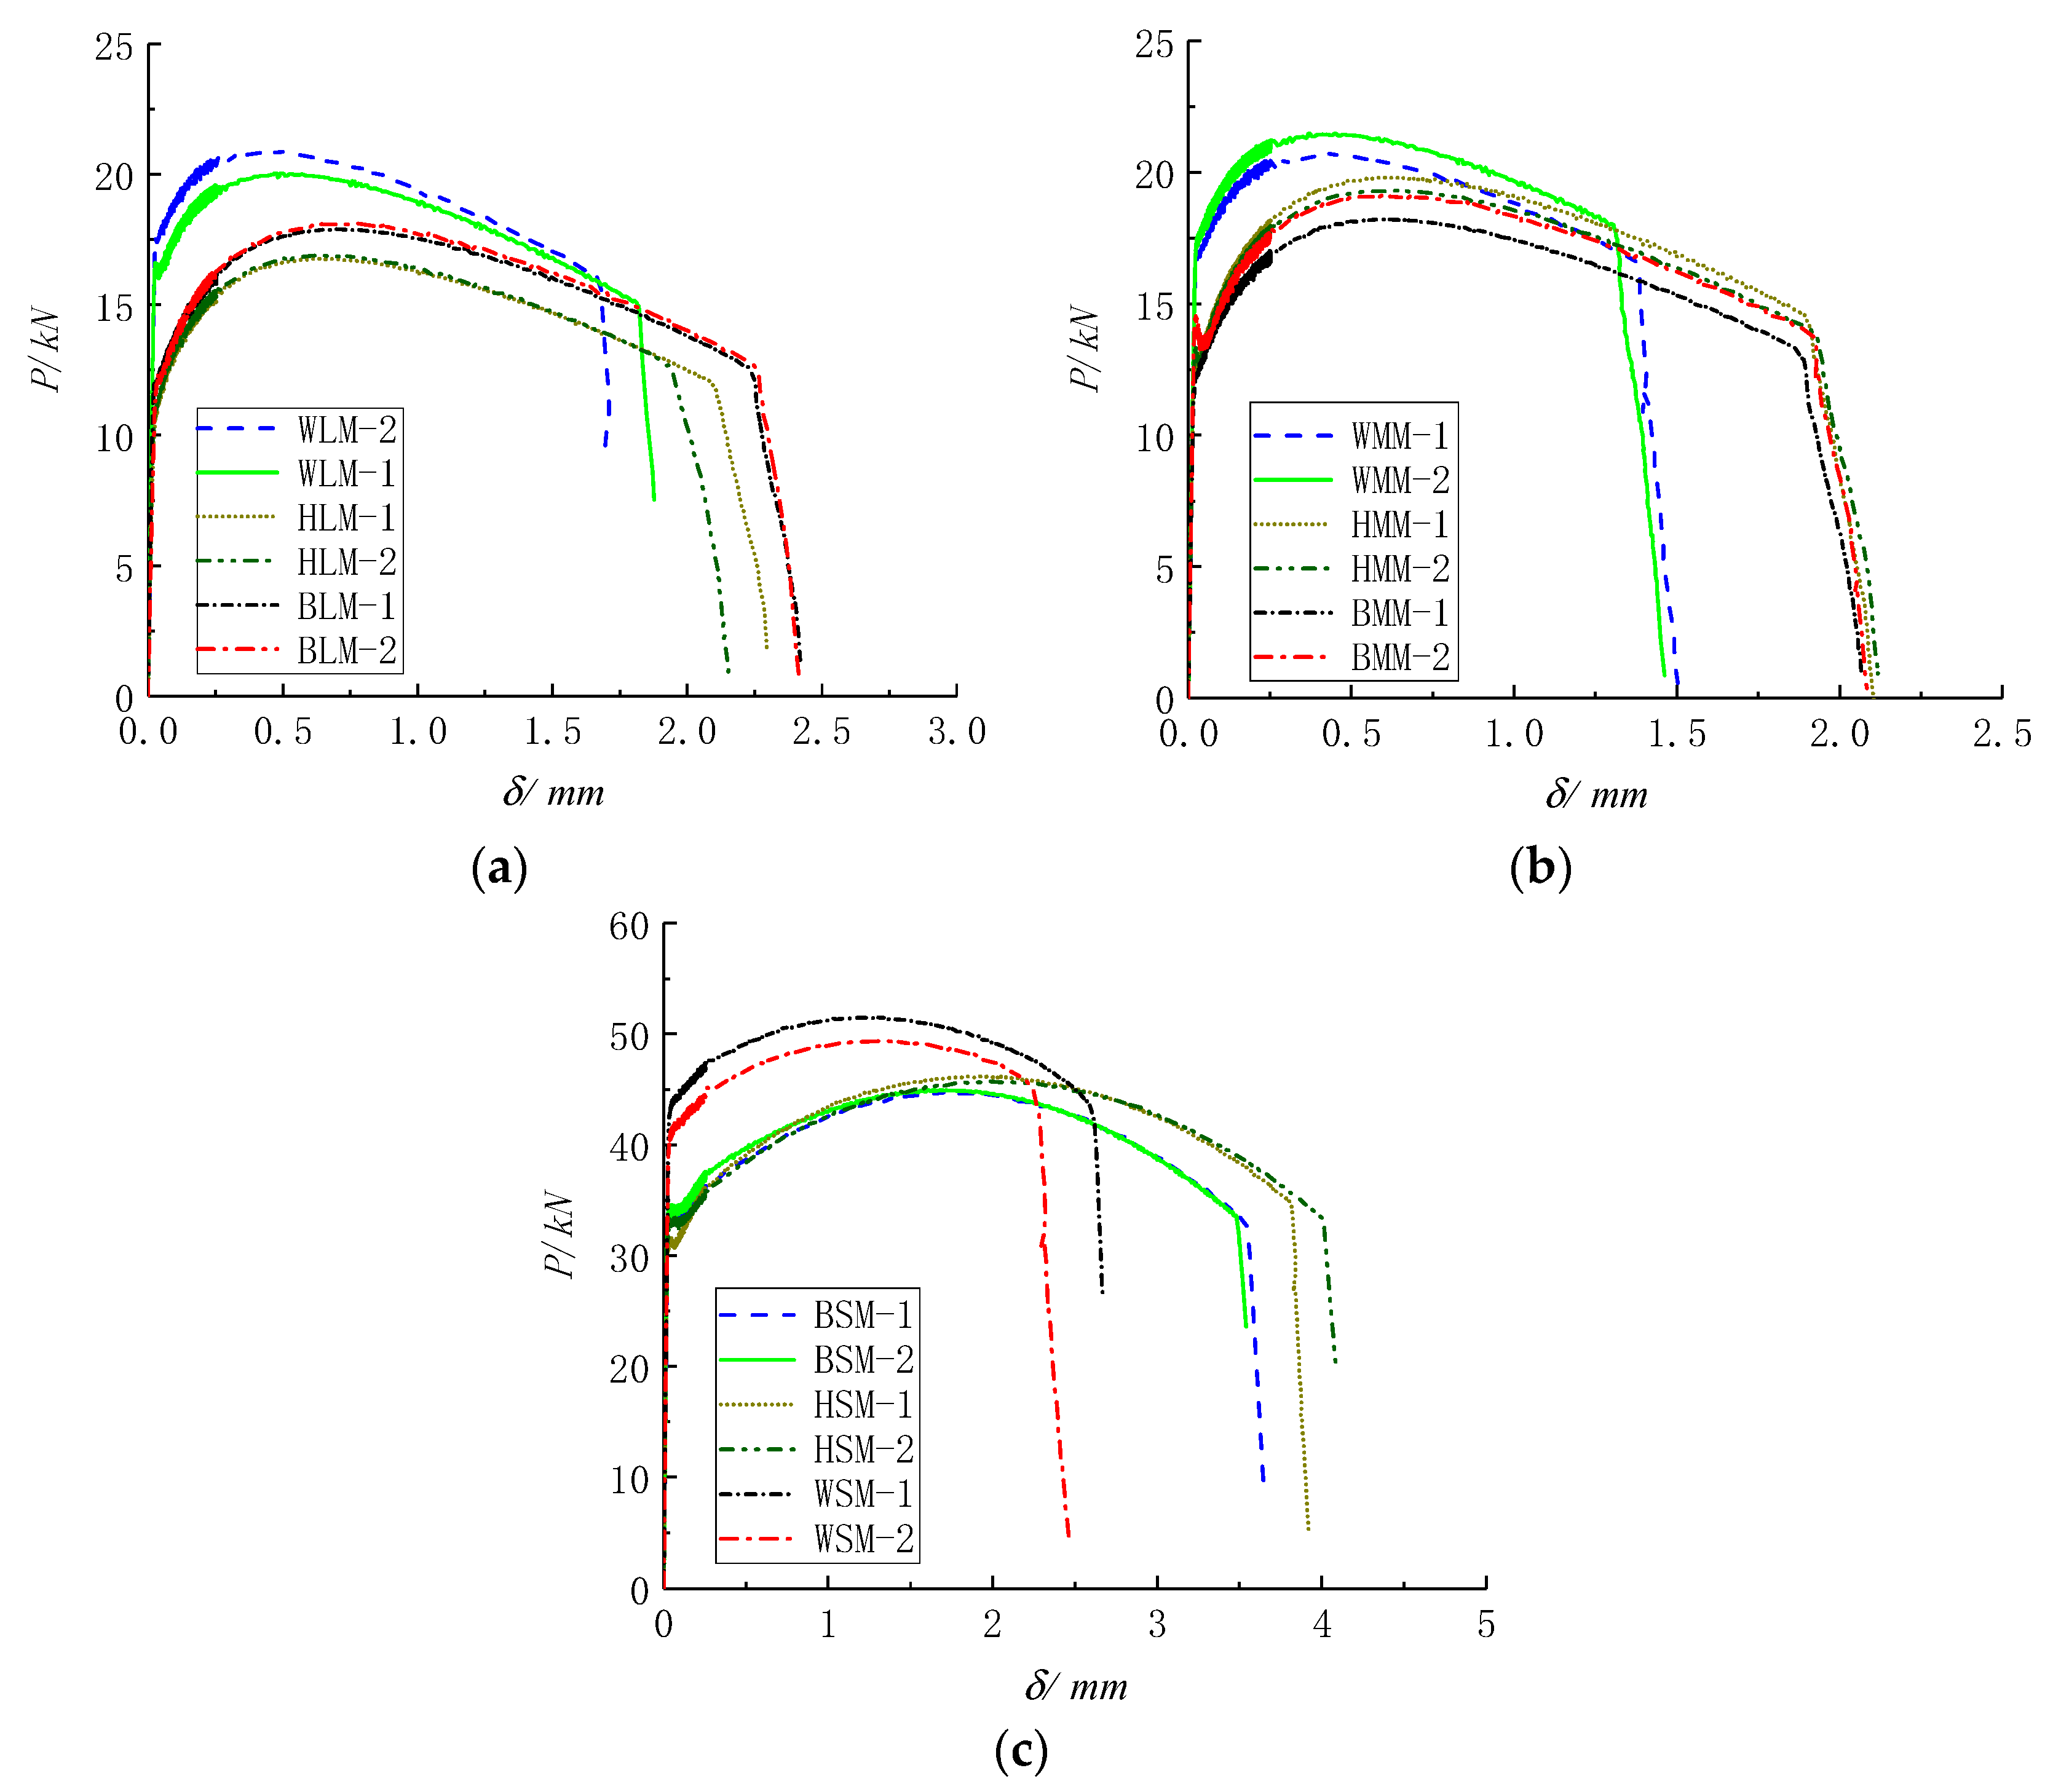
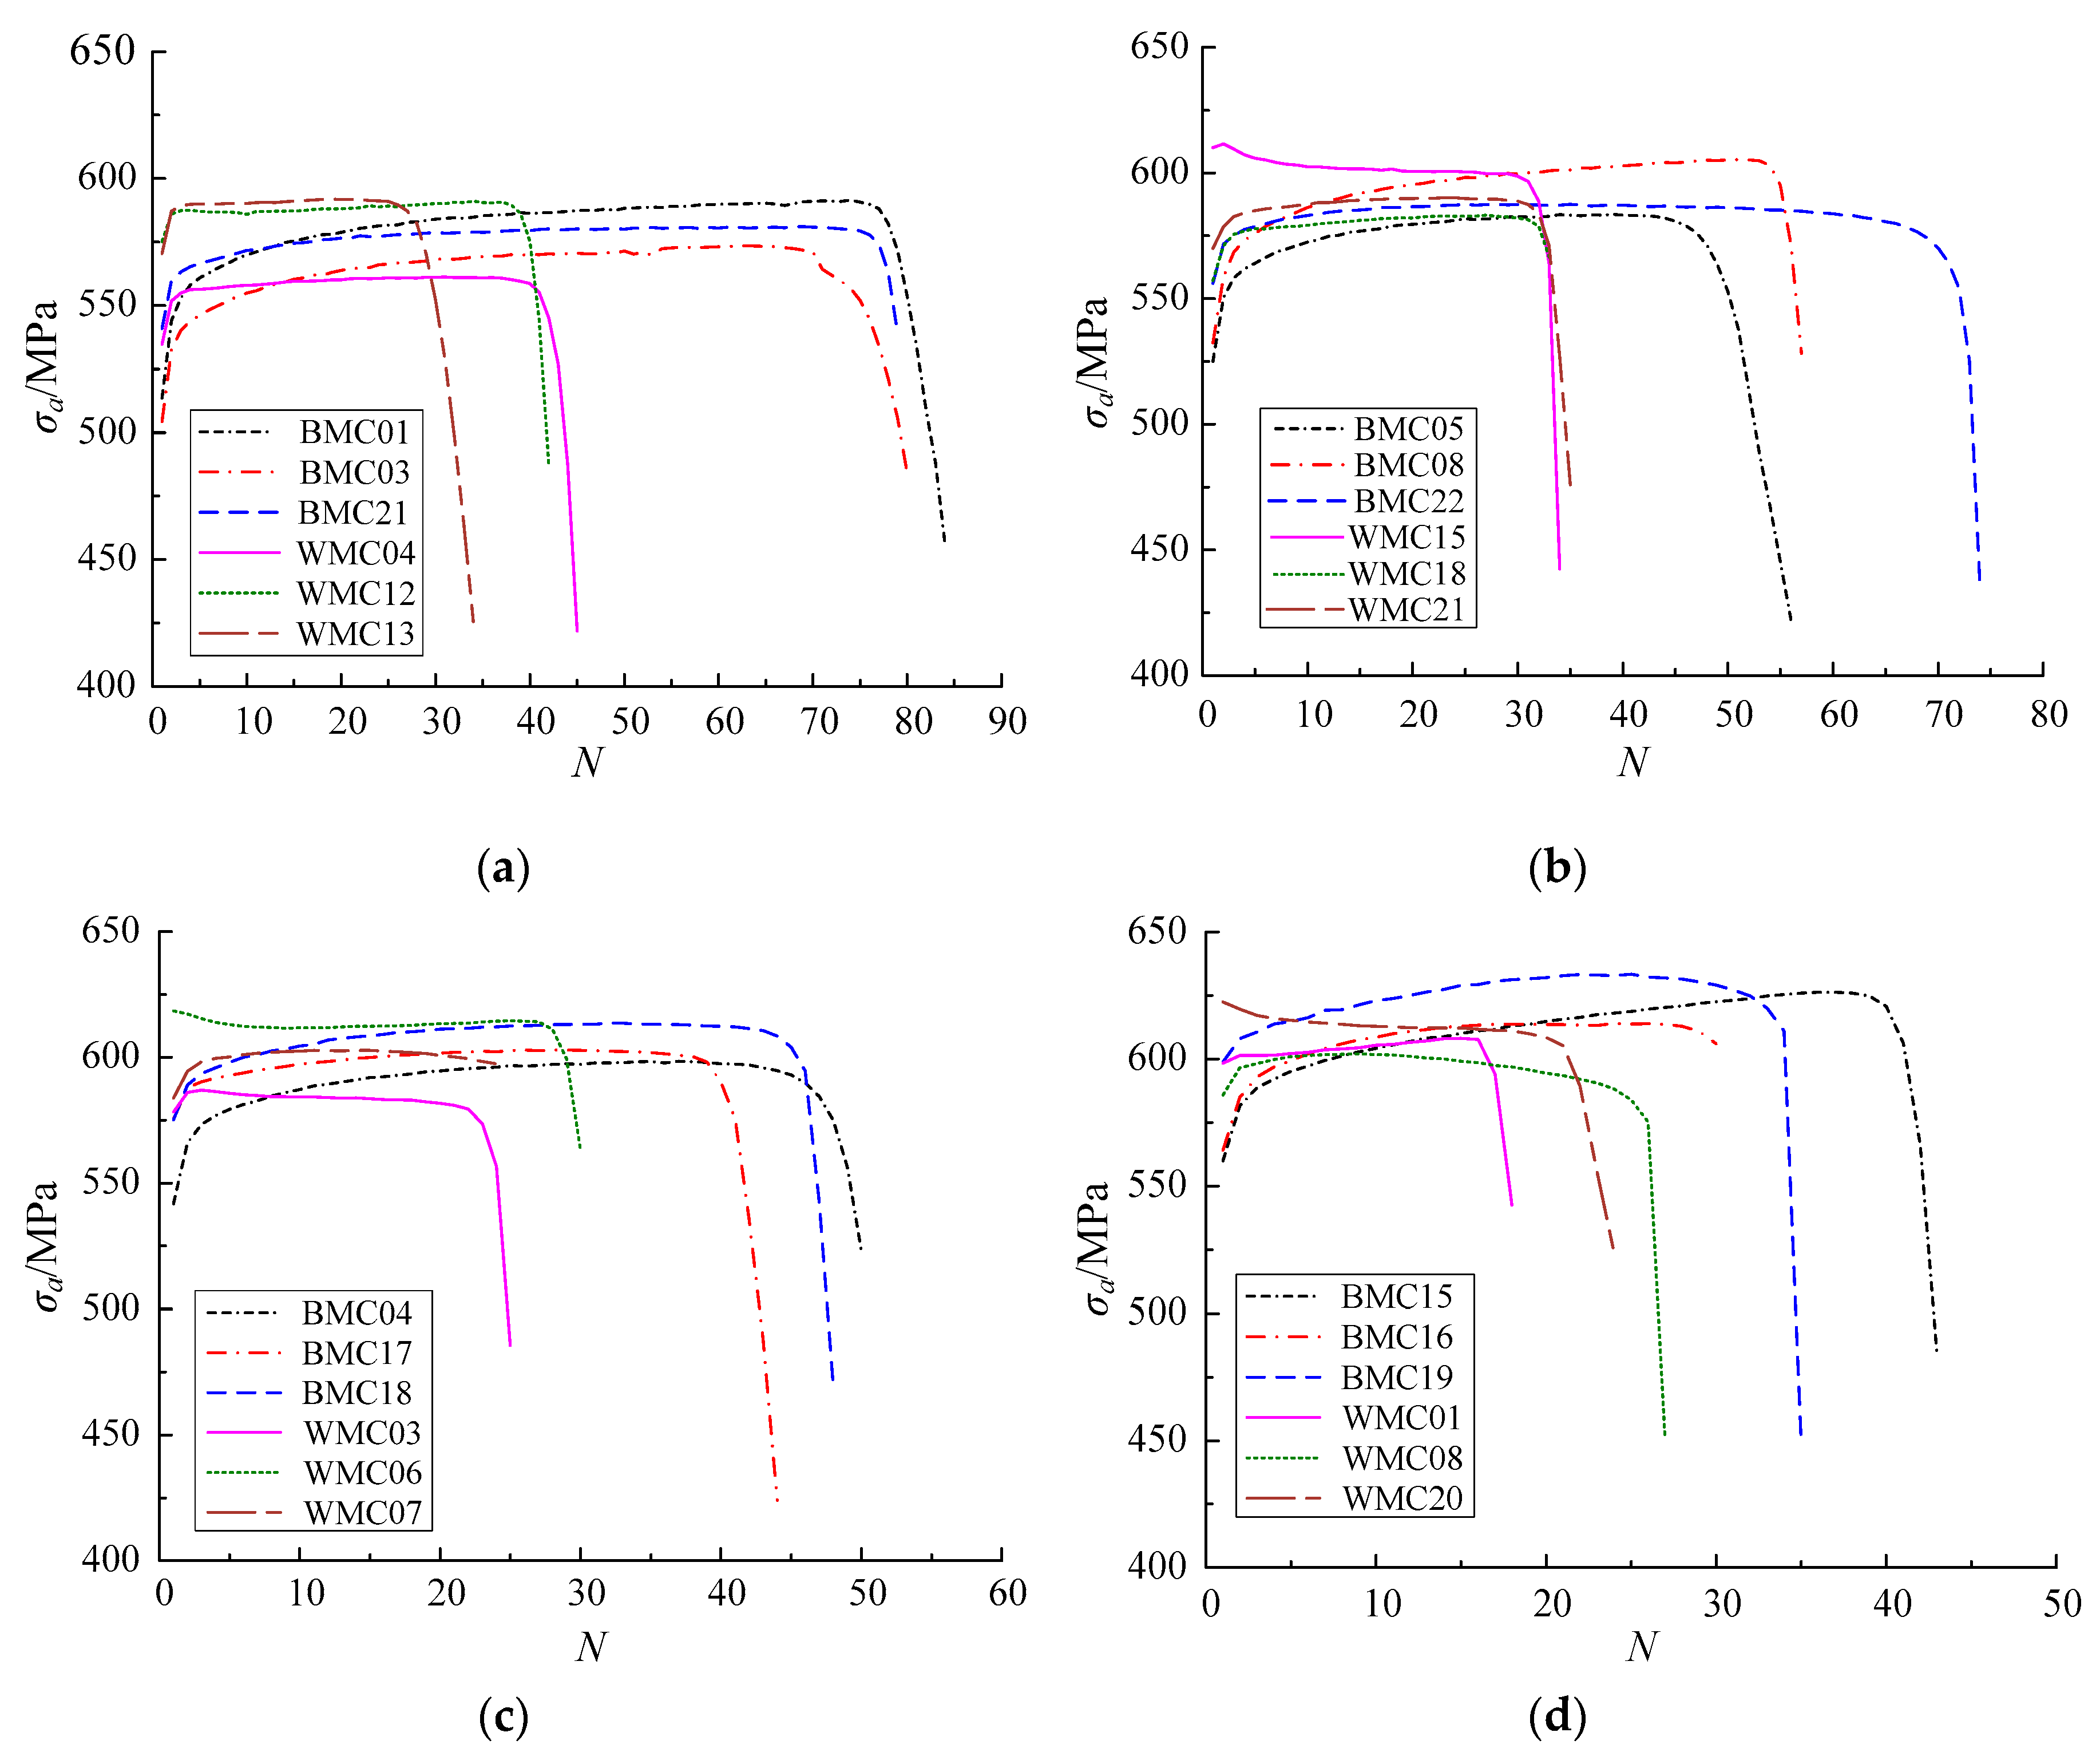
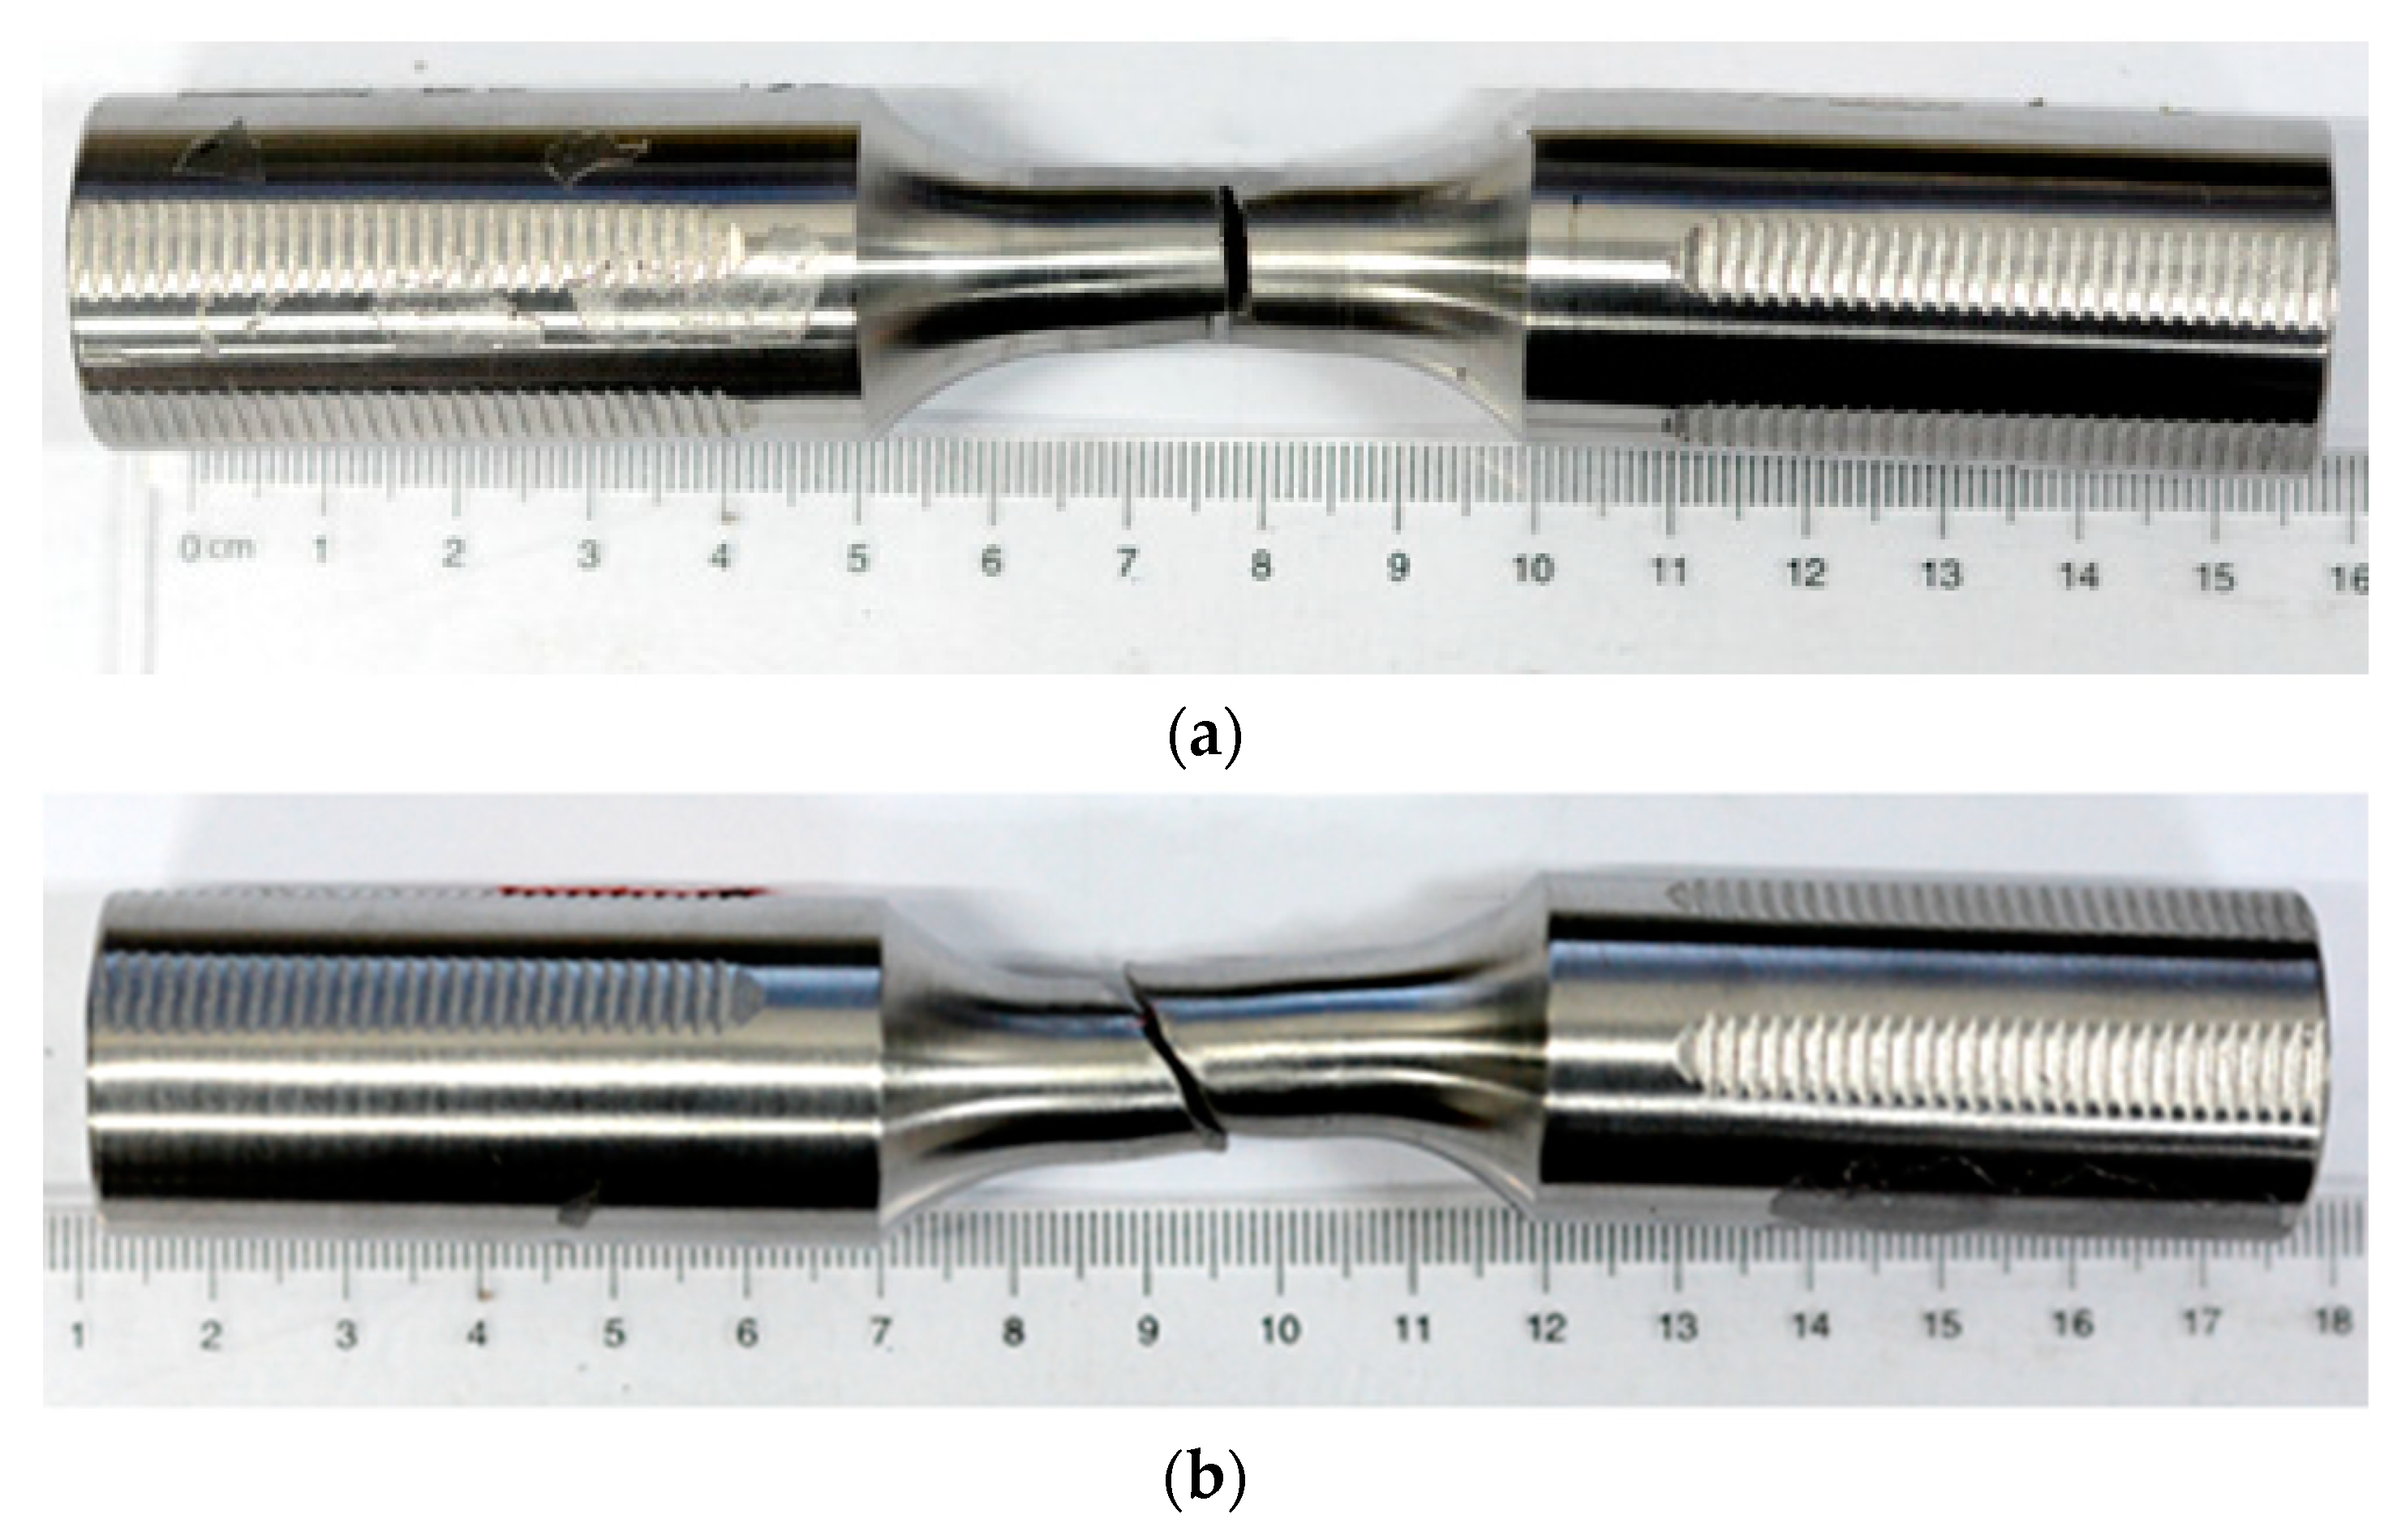
The test device is an electro-hydraulic servo fatigue testing machine, as shown in Figure 2. Axial strain loading is used in the test. The strain ratio is −1, the loading strain rate is 0.5%/s and the extensometer gauge length is 12.5 mm. Considering the extension measurement range, we set the test loading strain to 7%, 8%, 9% and 10% to obtain ULCF failure of the base and weld metals. Each test was repeated thrice at each loading strain. The numbers of base metal and weld specimens are BMC and WMC, respectively, as shown in Table 3.

4.1.3. Test Results

Figure 8 shows the characteristic curve of the cyclic responses at different strain ranges. Cyclic hardening of the base metal specimen rapidly occurs at the initial stage of the cycle. Subsequently, the degree of cyclic hardening decreases obviously at later stages of the cycle. Finally, the development of cracks causes the stress to decrease sharply until specimen fracture occurs. The welded specimen presents cyclic stability or softening. As shown in Figure 8, the cycle number is defined as the fatigue life of the specimen N f when the stress begins to decrease rapidly. When the specimen fails due to fracture, the cycle number is defined as the fracture life N r . The relationship between the fatigue and fracture lives in test is shown in Table 3. The ratio of crack initiation life to fracture life is 84.0–97.5%. Hence, the crack initiation stage occupies most of the cyclic loading period. When the cycle number exceeds the crack initiation life N f , the bearing capacity of the specimen decreases sharply and the crack expands rapidly until fracture failure occurs.
The test results for ULCF are shown in Table 4. The average fatigue life of the specimen is Nf. Table 4 shows that the fatigue life of each specimen is fewer than 100 cycles. The fatigue life decreases significantly with increasing strain range. At the same strain range, the fatigue life of weld specimens is only 48–62% that of the base metal specimens. The dispersion of fatigue life of weld specimens is generally larger than that of base metal specimens. The fatigue cracks of base metal specimen are generated from the edge of the section. The fatigue cracks of weld specimen are generated from the edge of HAZ, near the weld area.
The post-fracture of base metal and welded specimens under ULCF is shown in Figure 9. Crack initiation occurs at the edge of the cross section of the base metal specimen in the standard distance section, and the post-fracture path occurs along horizontal direction perpendicular to cross section. The fatigue crack of welded specimens originates from the edge of HAZ near the weld area. Then cracks pass through the weld metal and extend to the HAZ at the opposite side.

4.2. ULCF Predictions for Base Material and Welded Joints

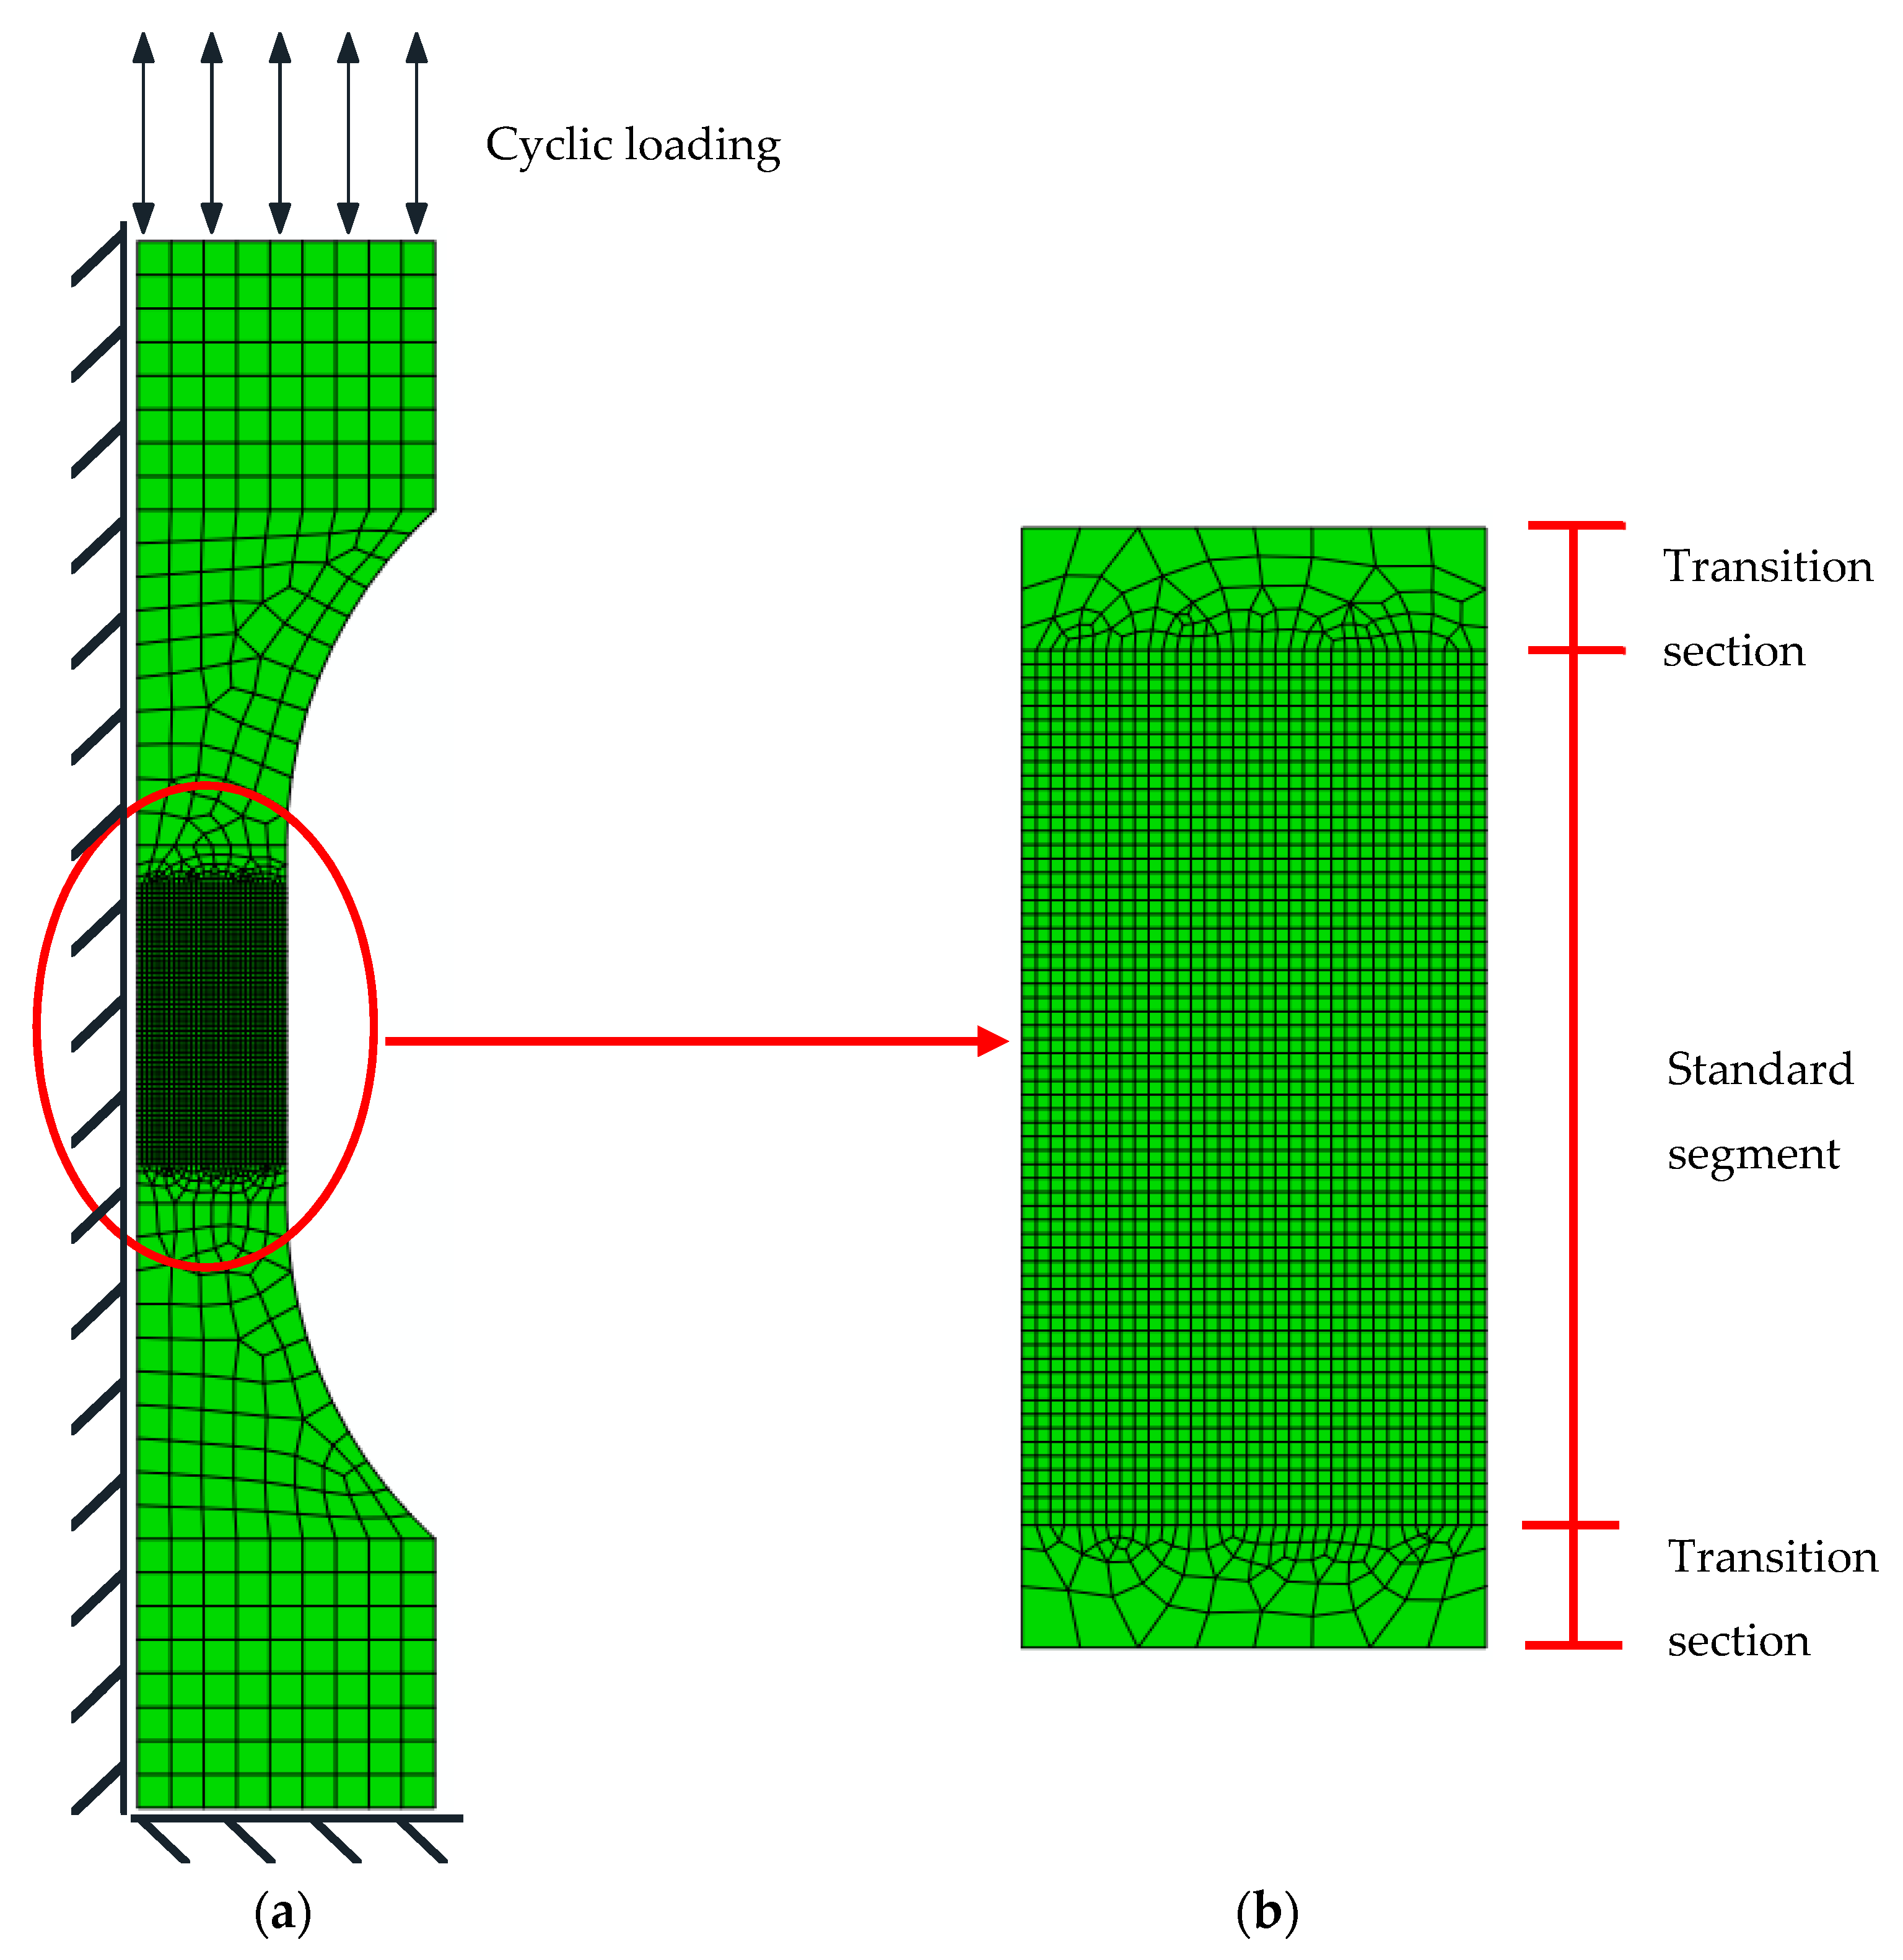
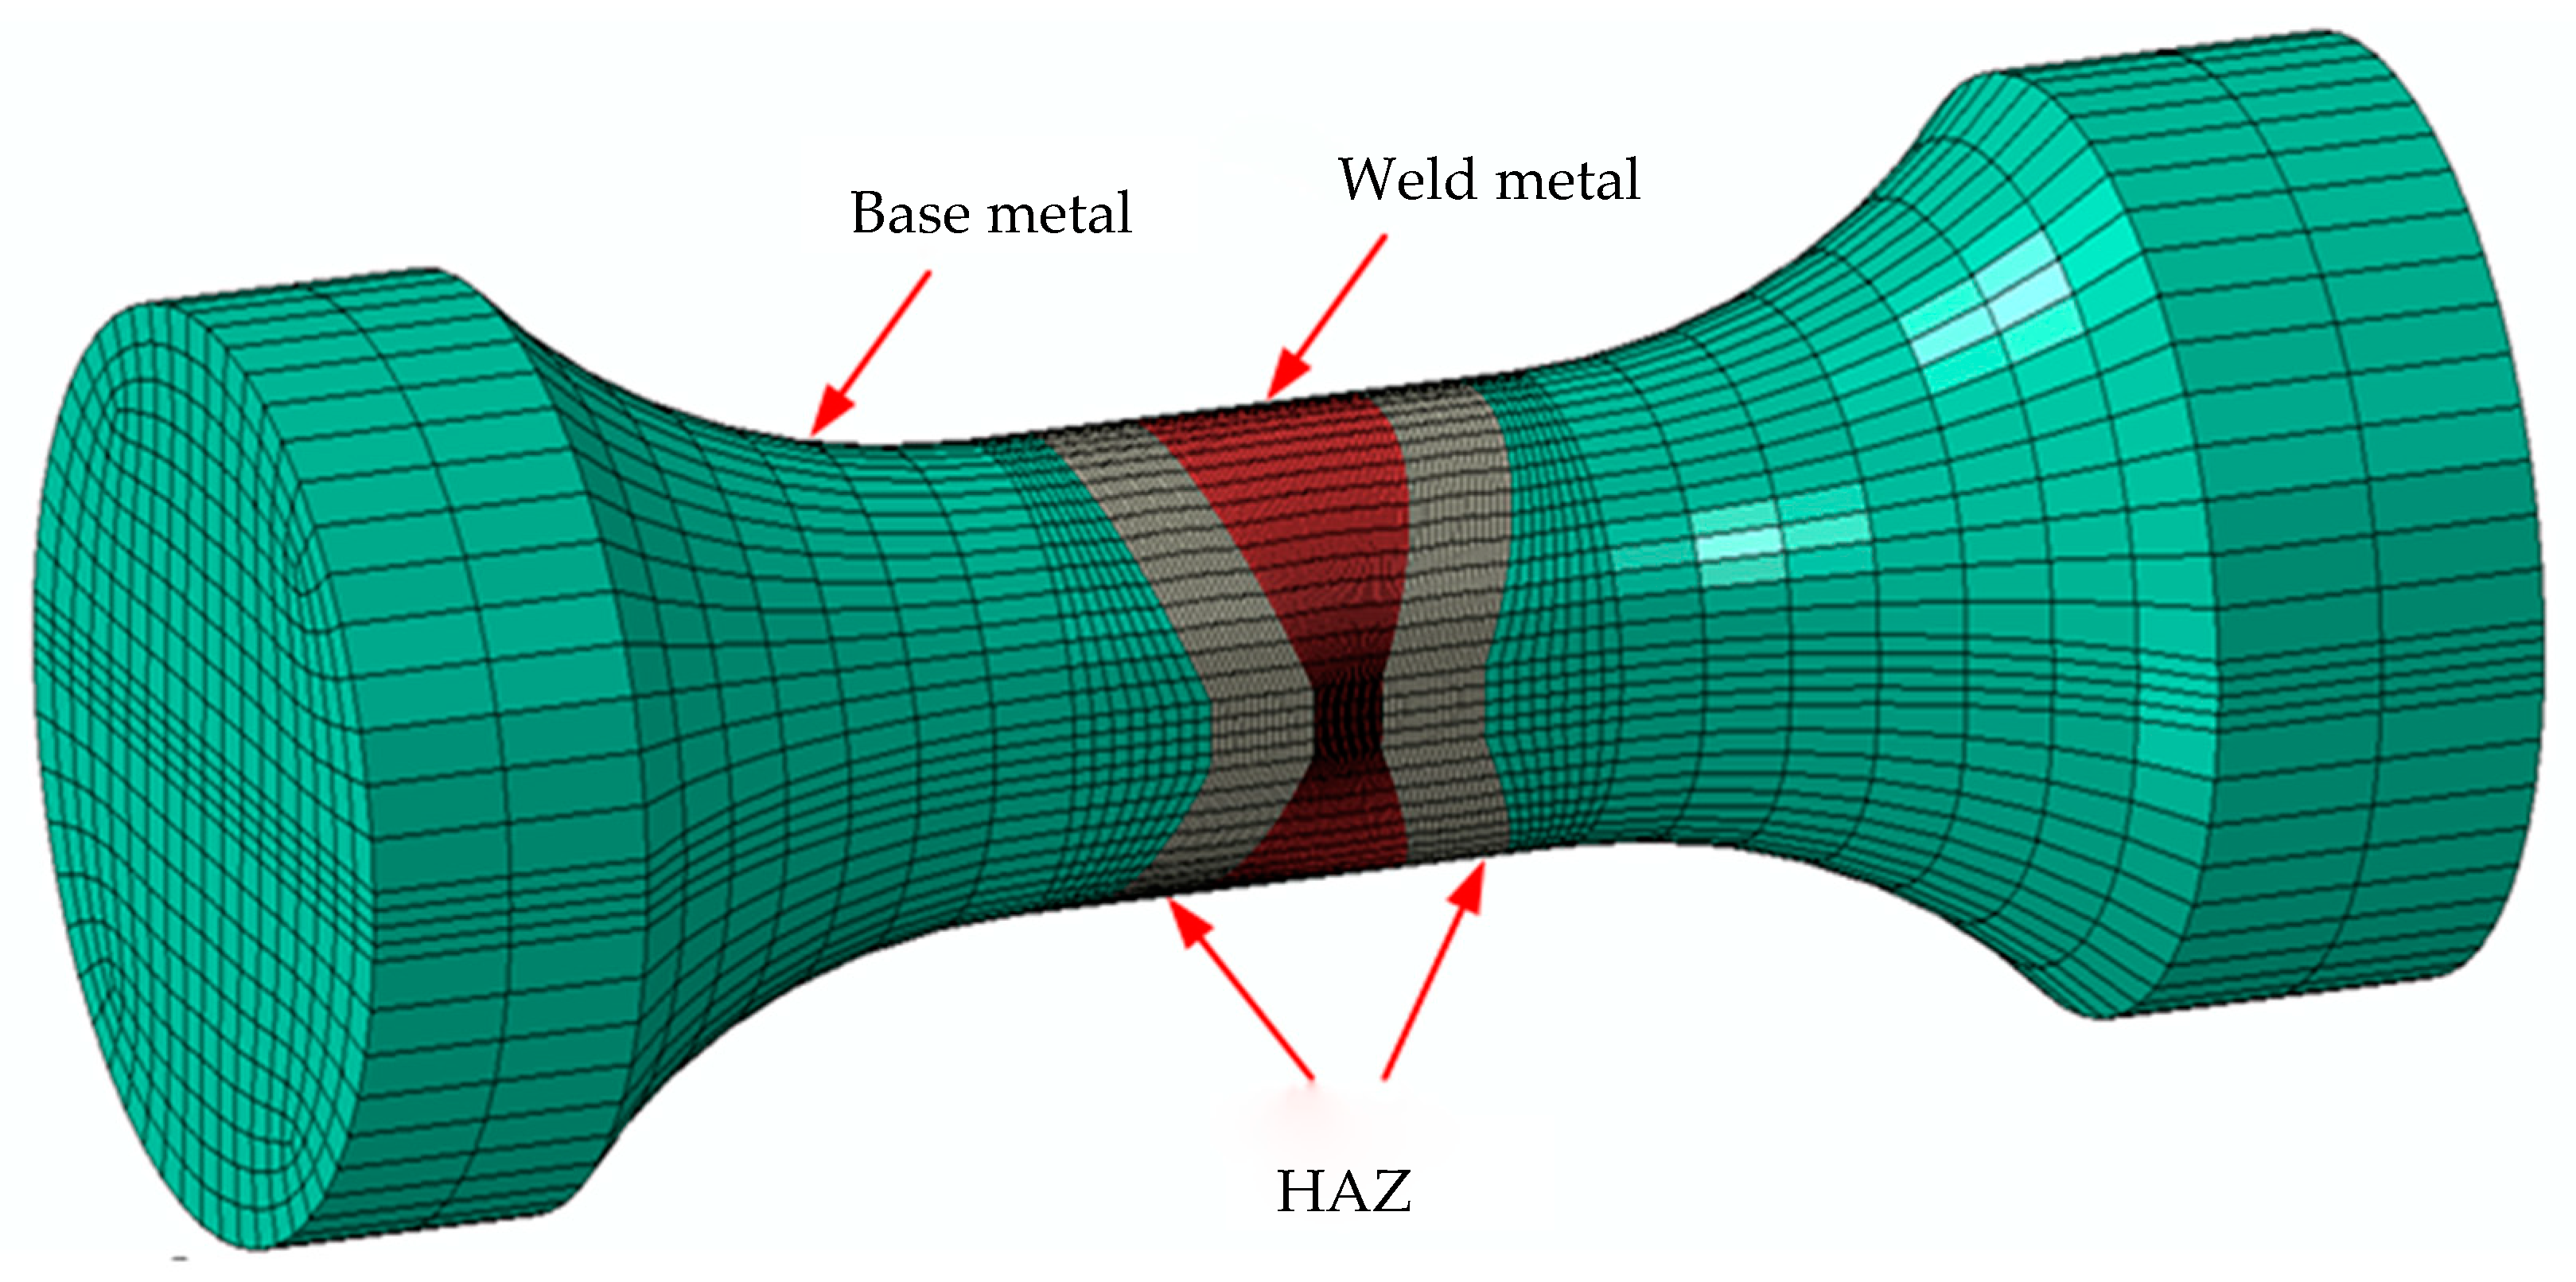
4.2.1. Establishment of a Finite Element Model

The two-dimensional axisymmetric finite element model of base metal specimen is established by using ABAQUS, as shown in Figure 10. Figure 11 shows that the weld specimens consist of a base metal, HAZ and weld metal, but welding defects are not considered in the model. Considering both calculation efficiency and accuracy, the multiscale model is adopted for element division. Material and geometric nonlinearities are considered in the 3D finite element model. The material constitutive model is based on the mixed hardening model. Amplitudes, the loading interface provided by ABAQUS, is used to simulate the strain-controlled loading process. Based on Equations (29–30), the subroutine VUMAT of ABAQUS, which is suitable for explicit integration, is used to calculate the damage variable D, and the effect of D on the elastic modulus E is described by Equation (30). D0 and Dcr are equal to 0 and 1, respectively, and α is equal to 0.198 [27]. ε t h is obtained from Table 2.

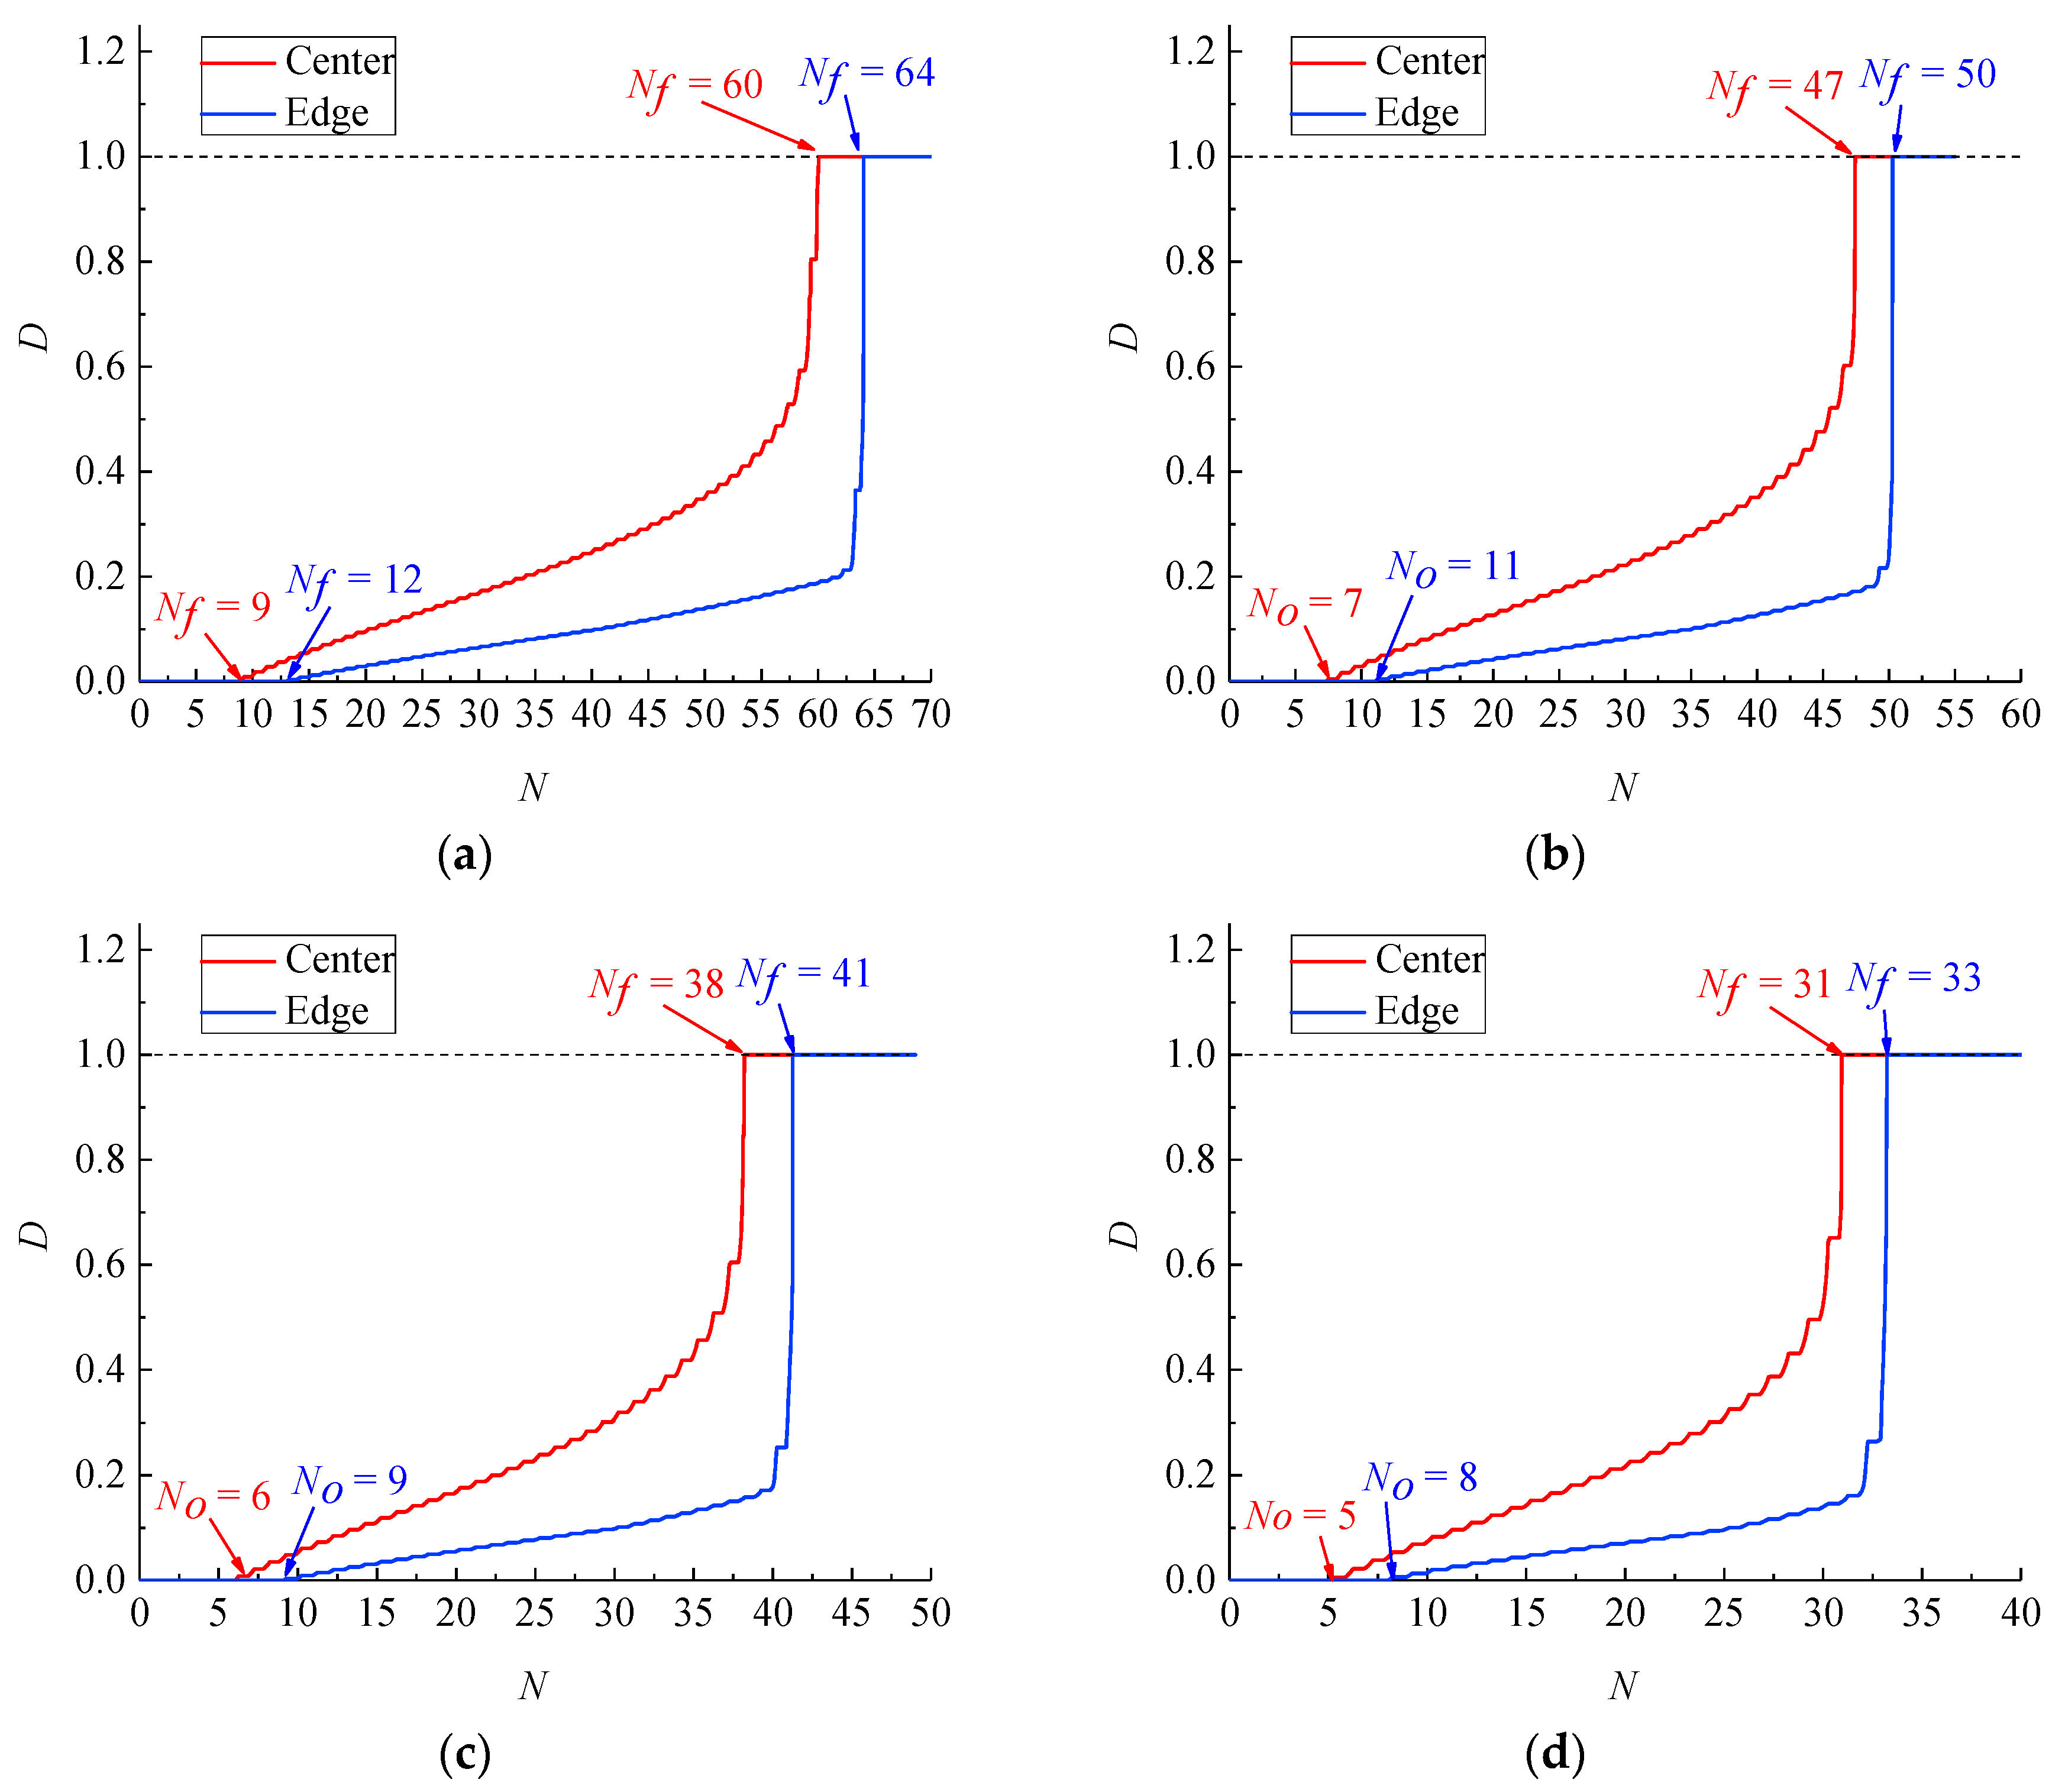
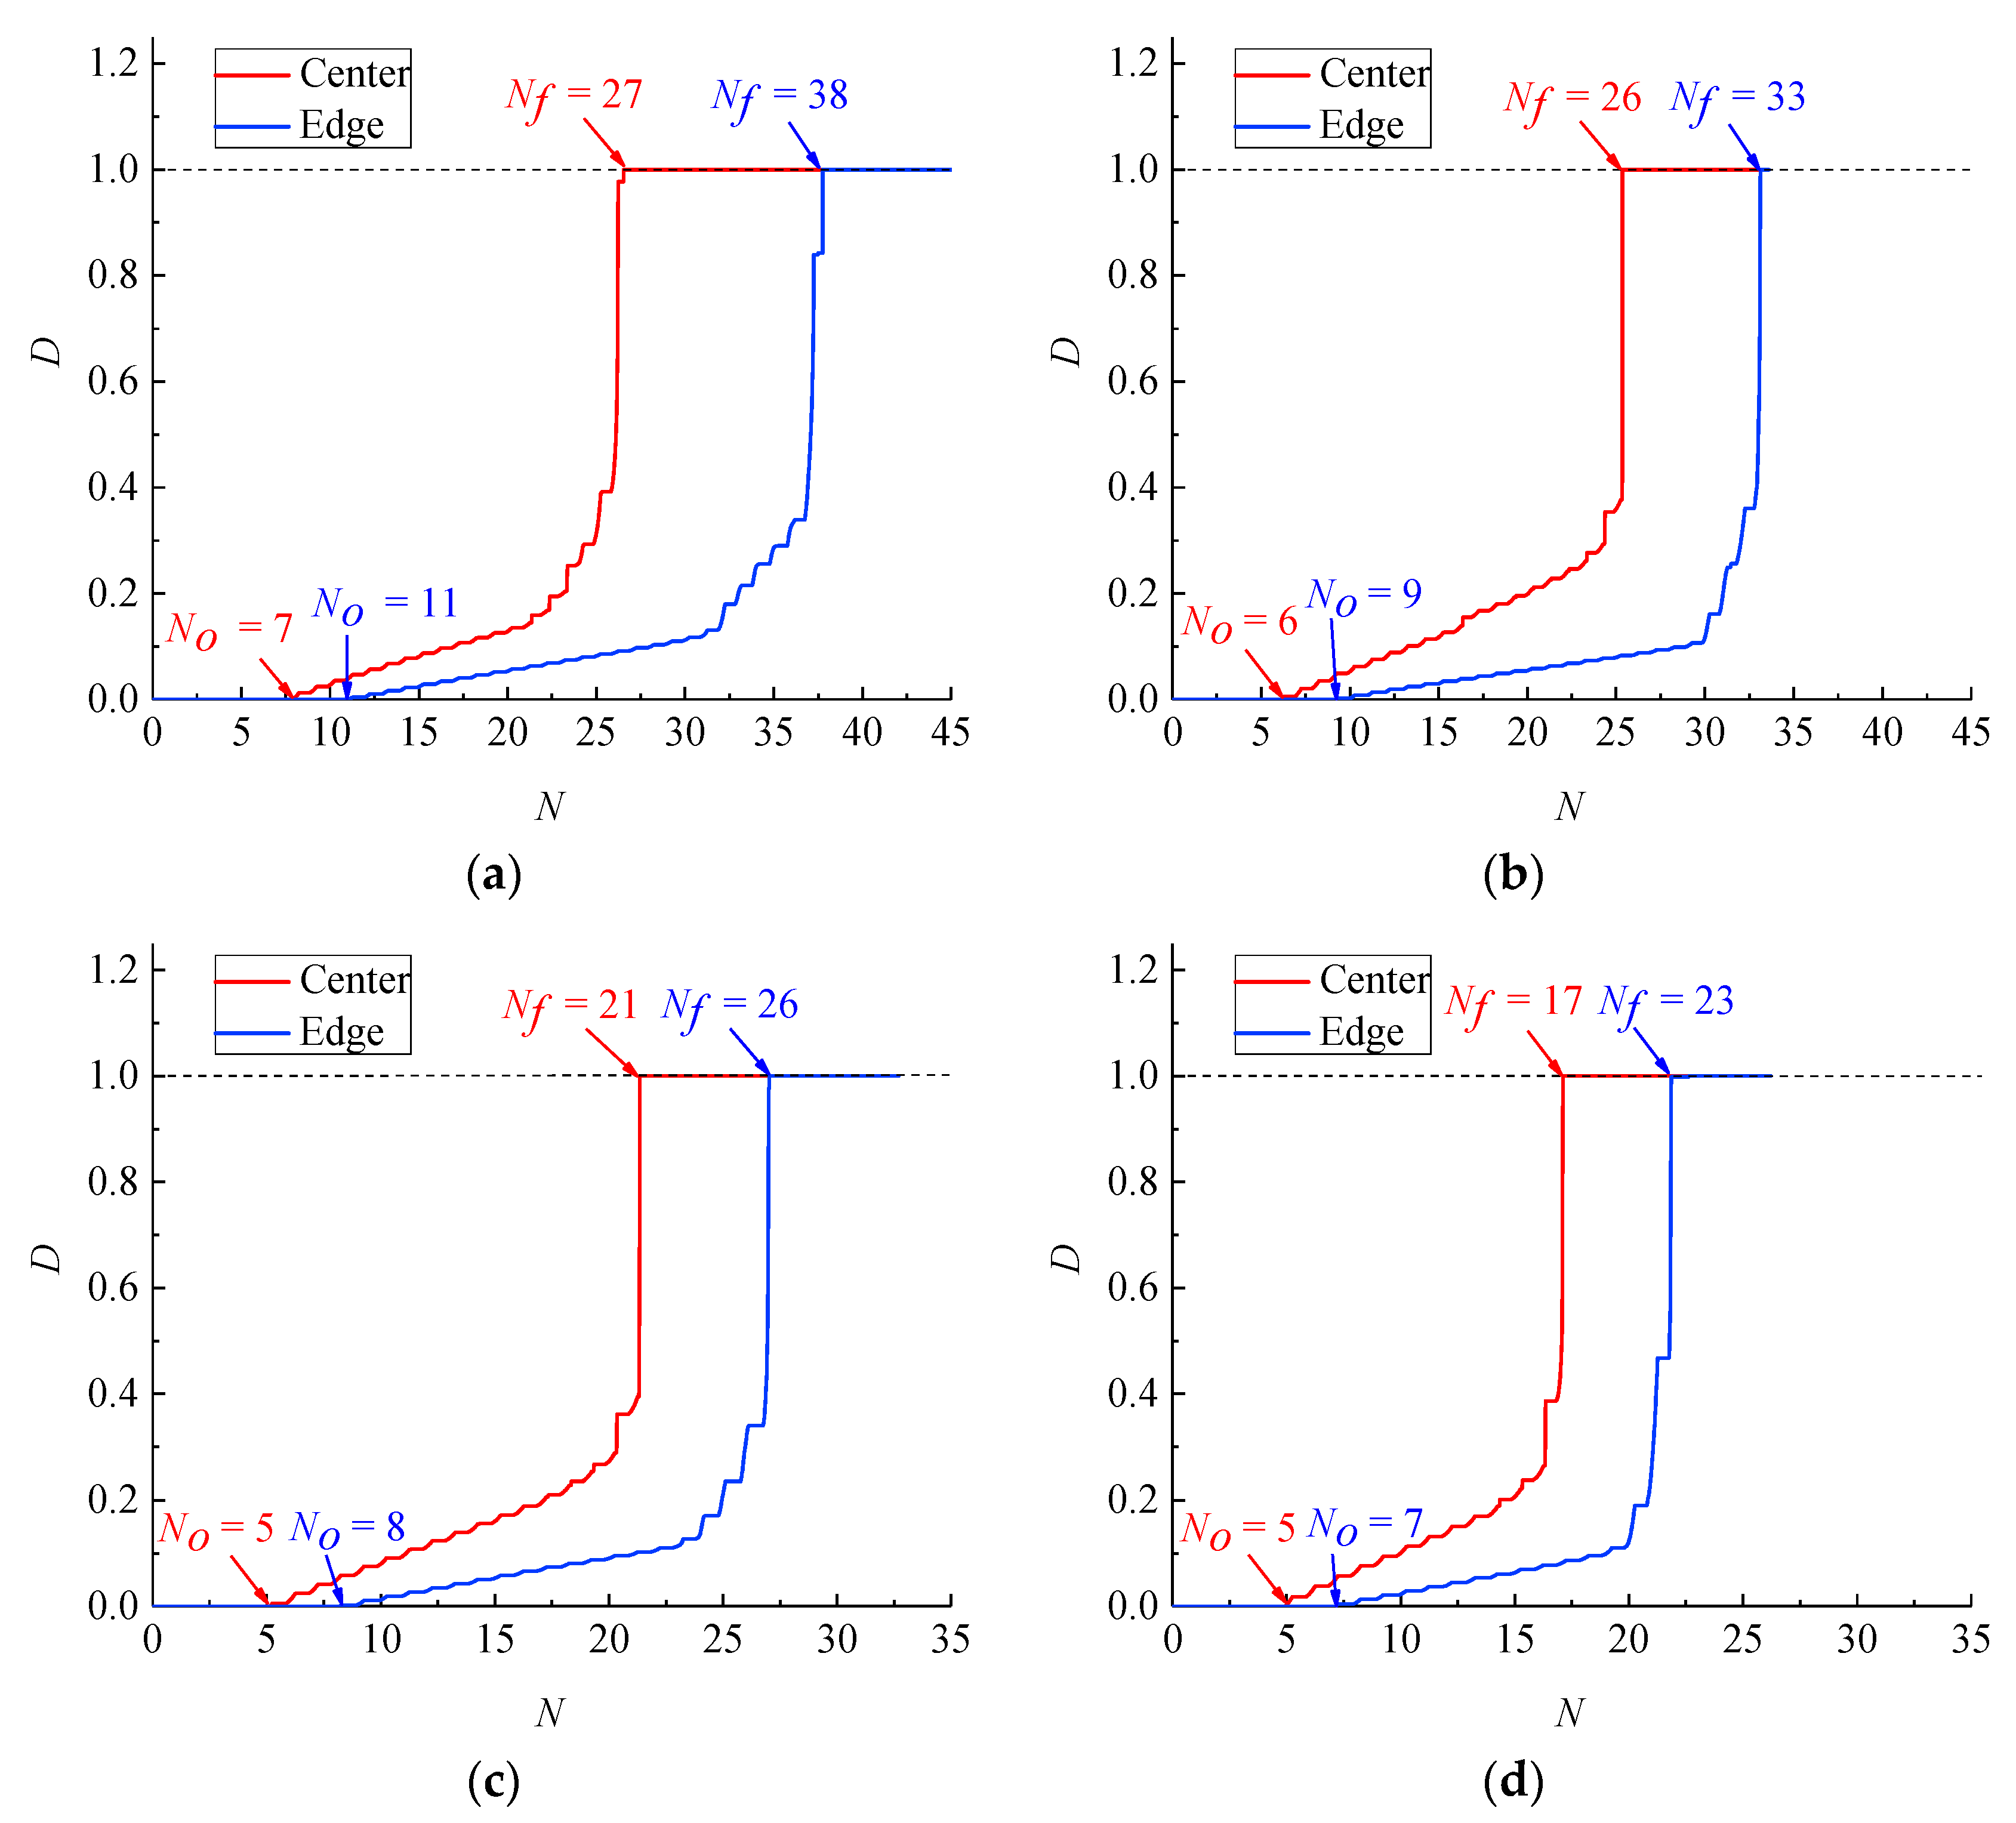
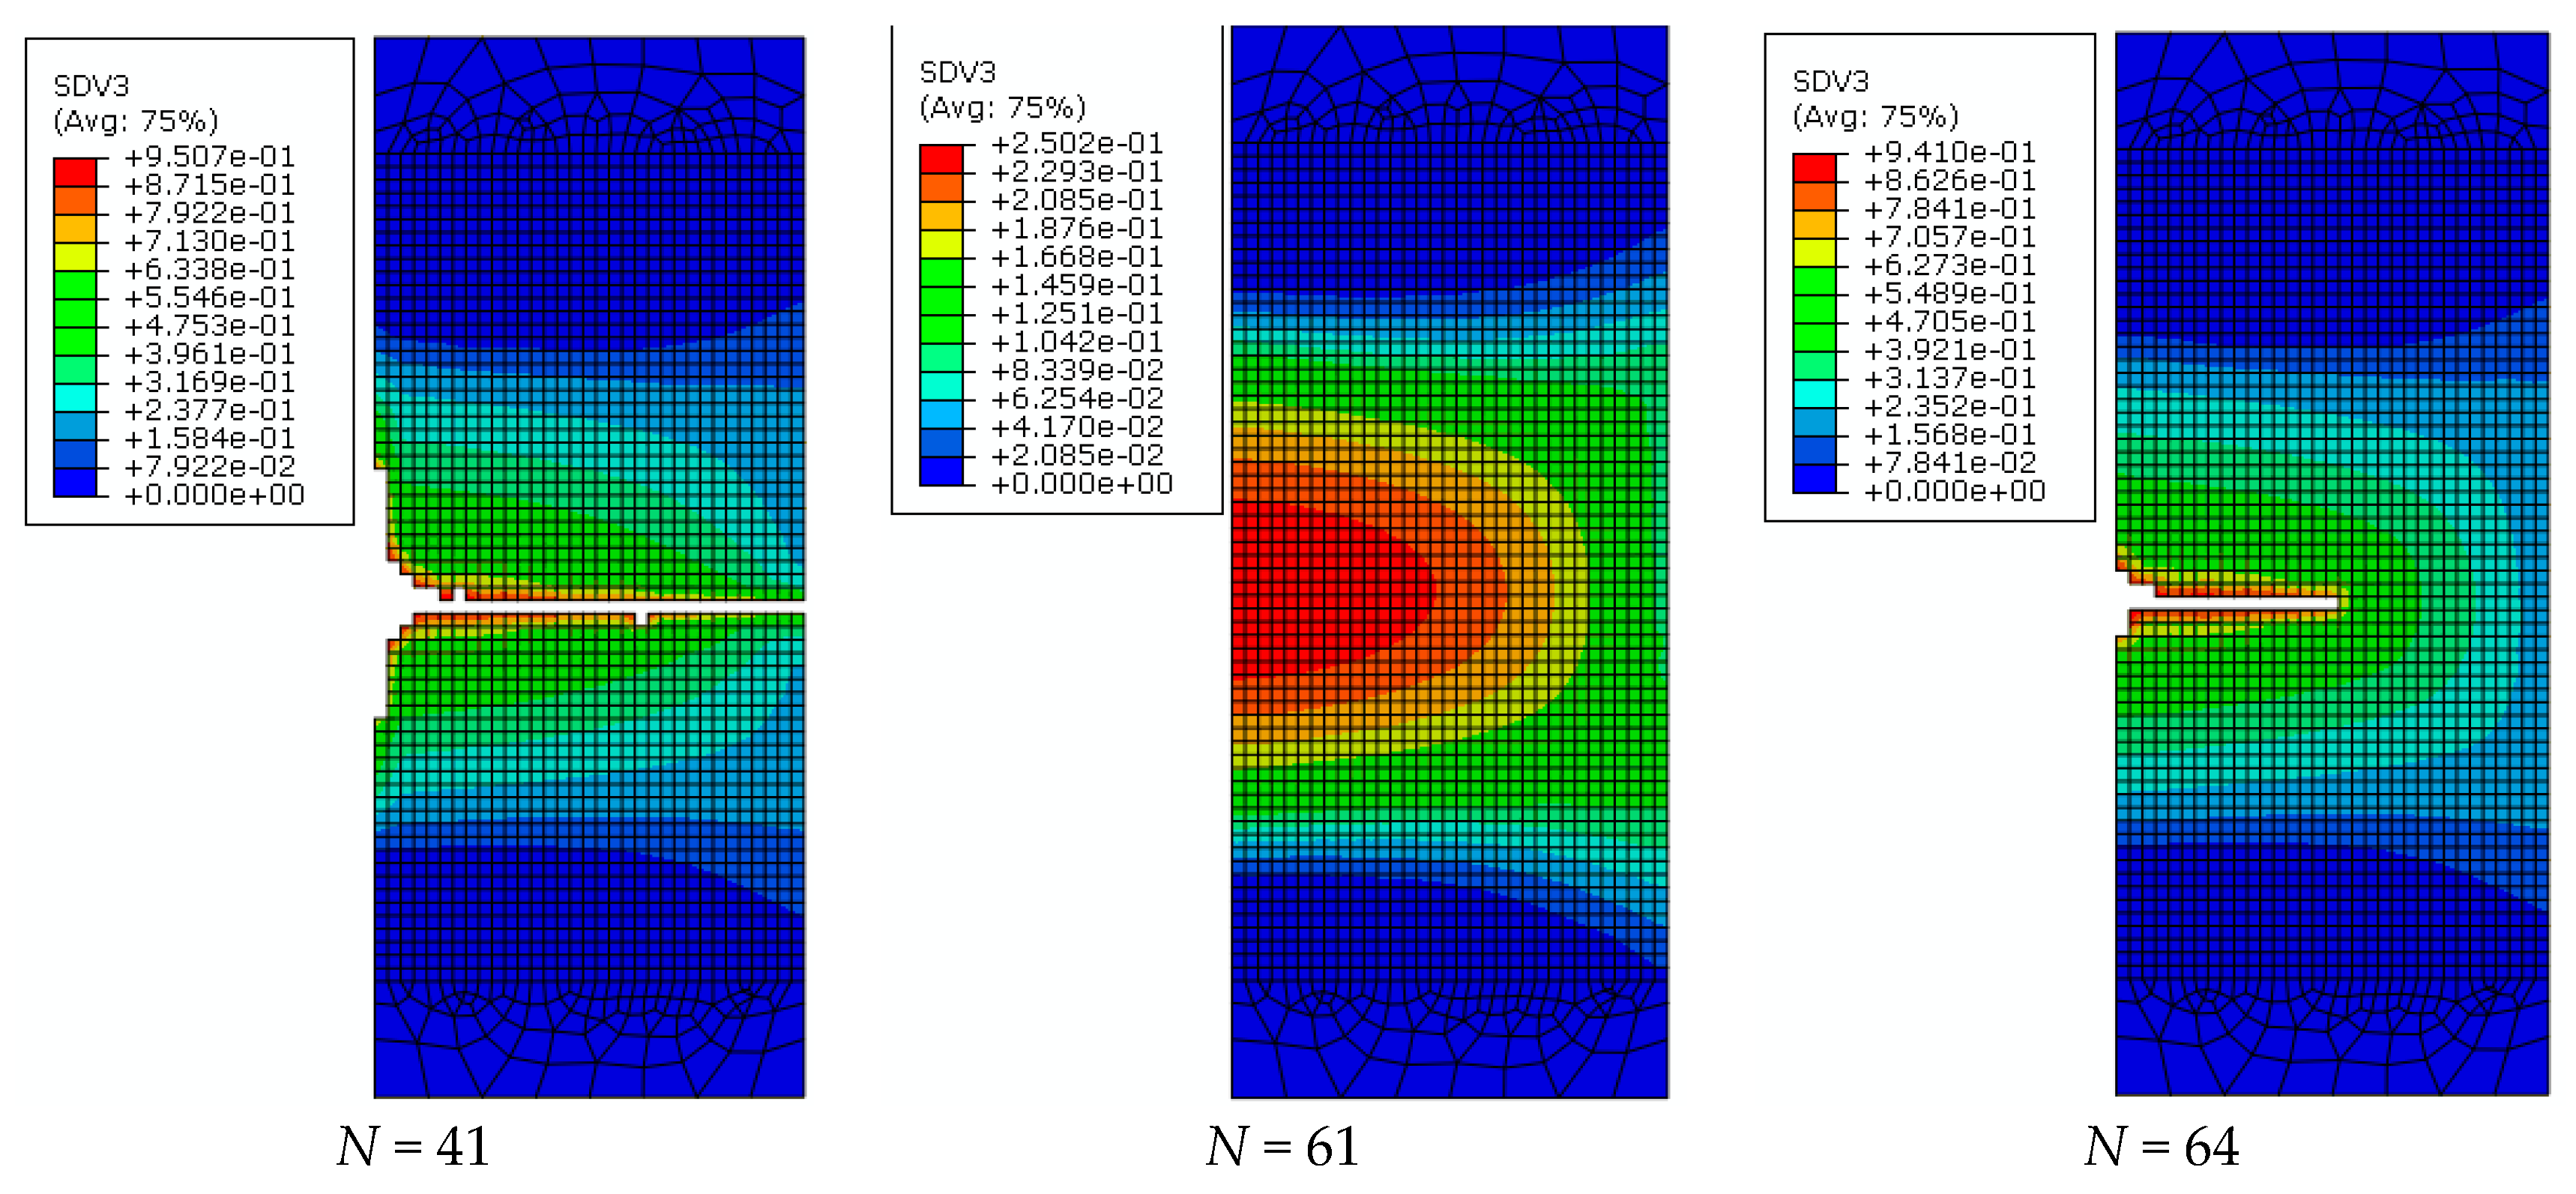
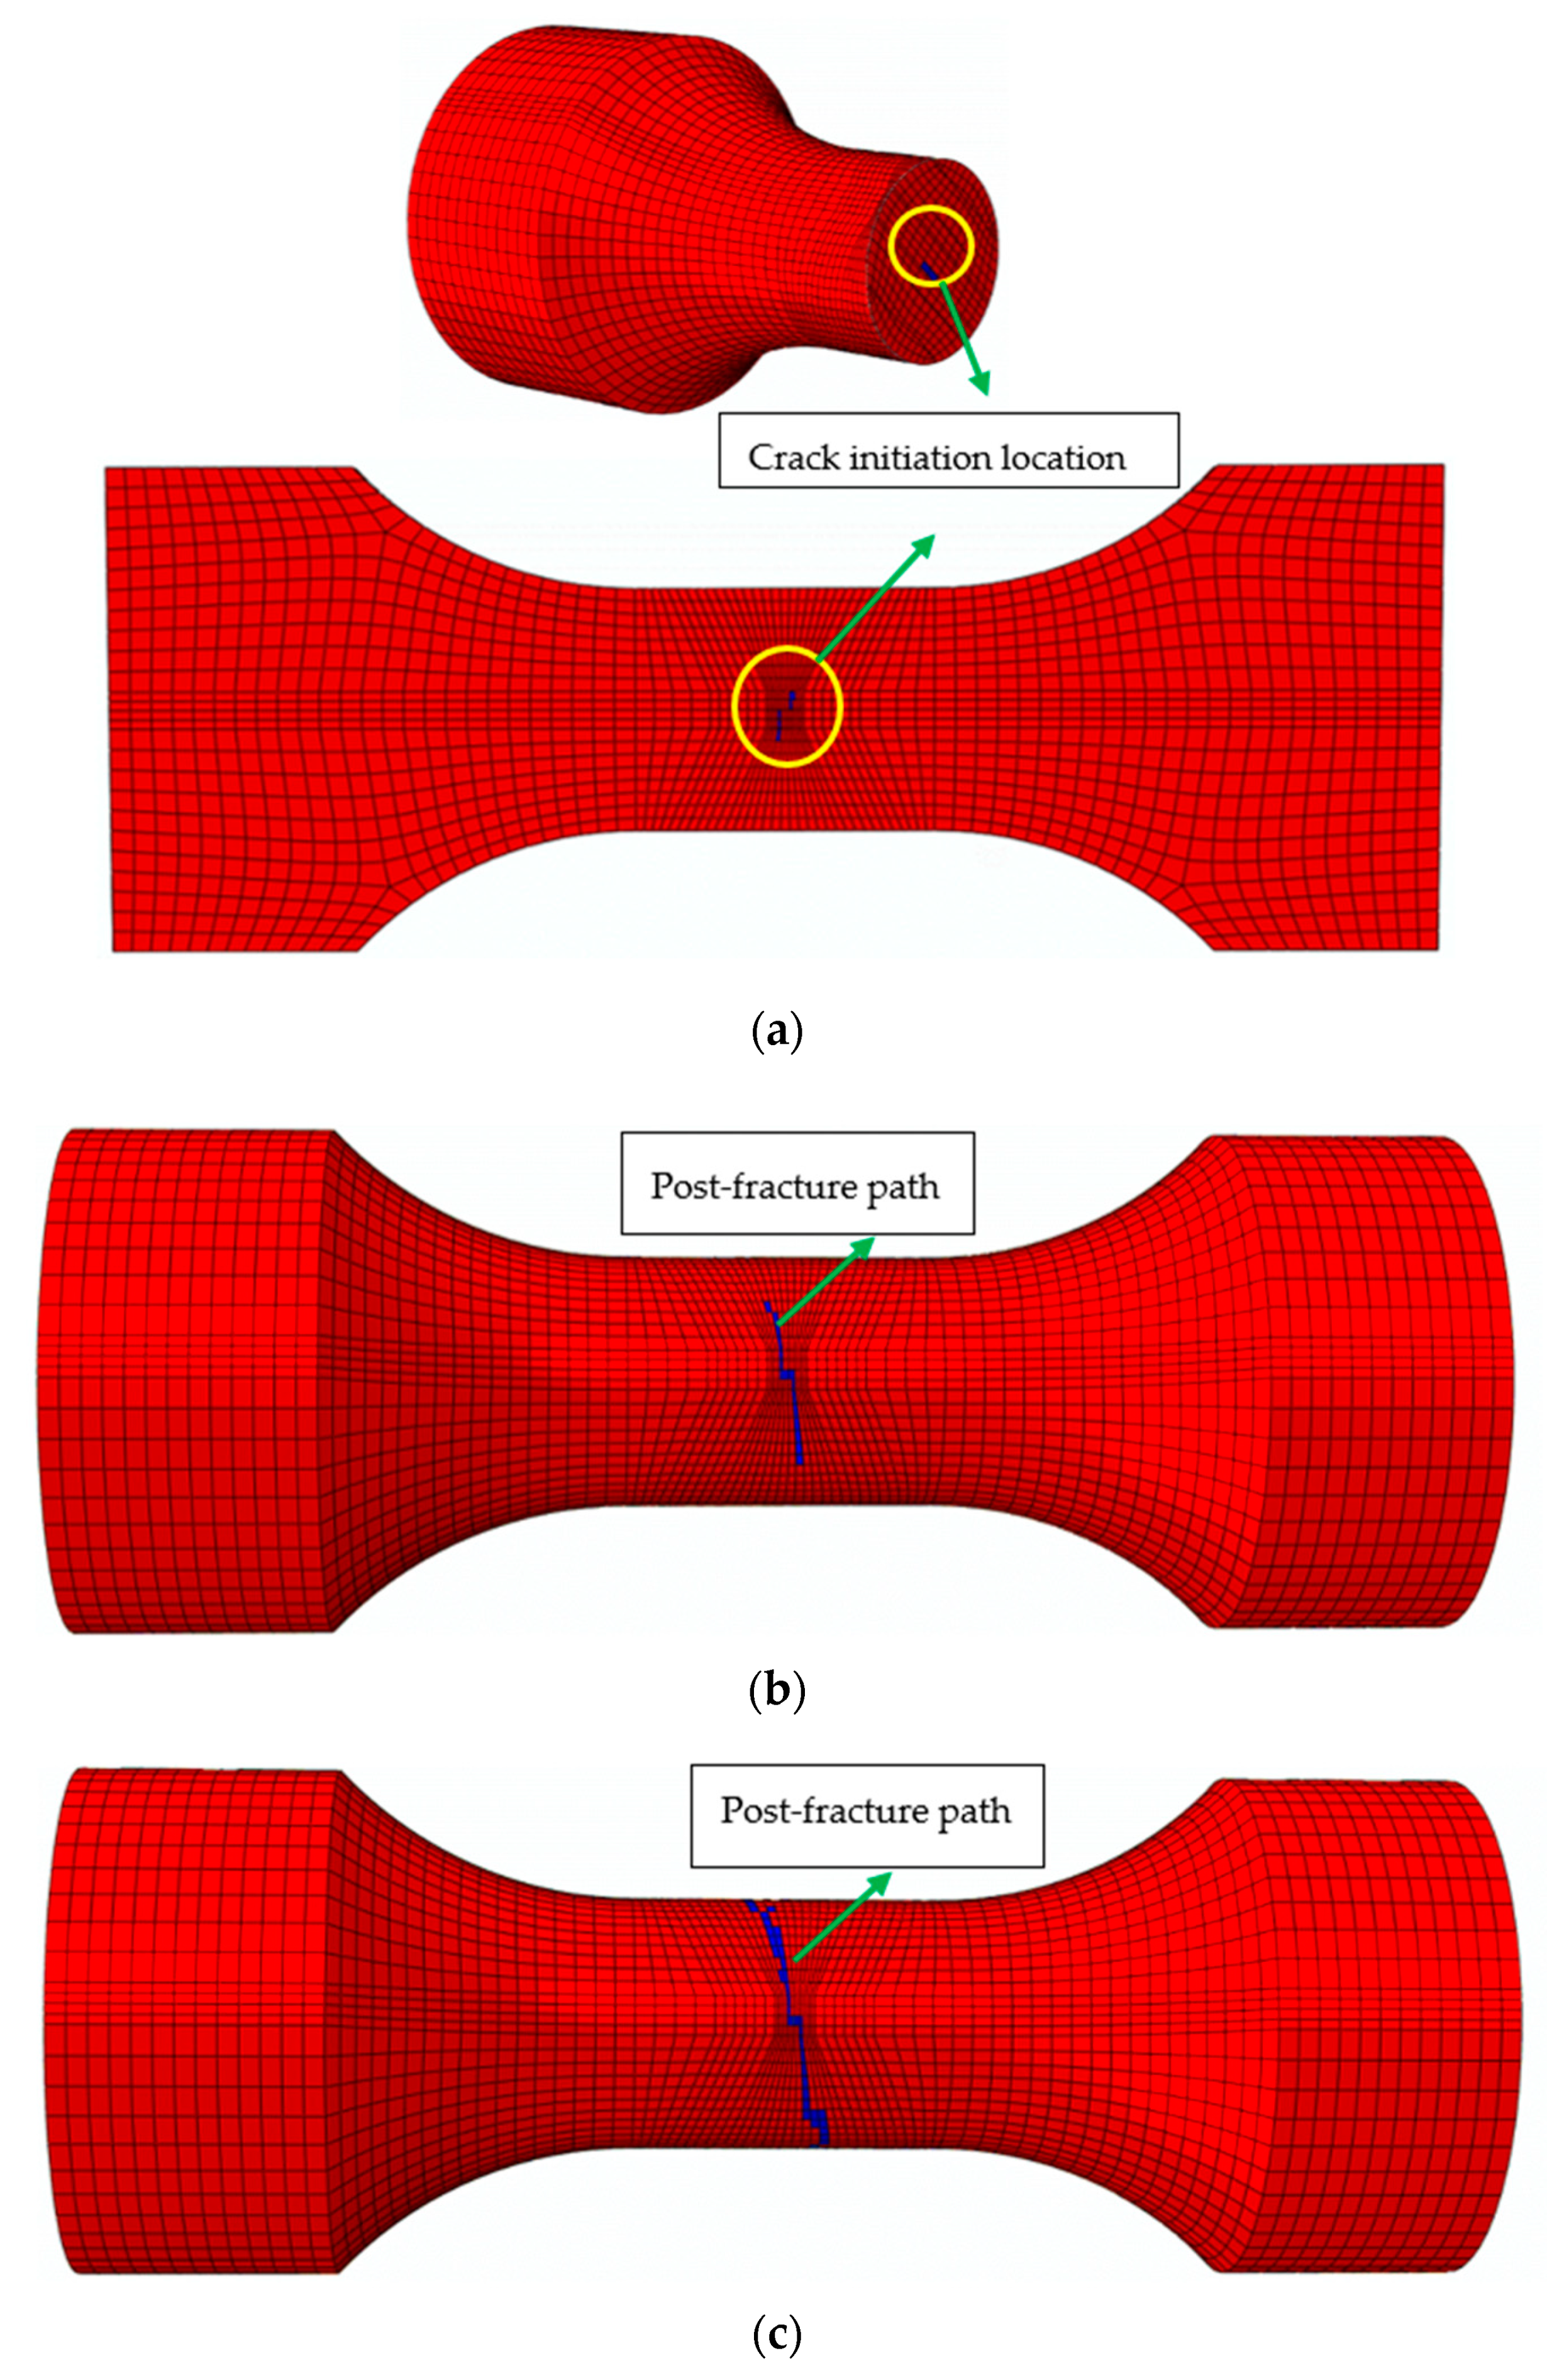
4.2.2. Fatigue Life Prediction Based on the CDM Model

Figure 12 and Figure 13 show the development of the damage variable D for the base metal and weld specimens with numerical simulation. When the cumulative uniaxial plastic strain ε is less than ε t h , the base metal and weld specimens are not damaged. Hence, D = 0 at the beginning of the cycle. When the cumulative uniaxial plastic strain ε is larger than ε t h , the base metal and weld specimen begin to generate damage. Because the damage of both specimens occurs only in the tension stage, and the material parameters are in the exponential position of Equation (29), D exponentially increases with a stepped pattern. At the same strain range, the D of the cross section centres of the base metal and weld specimens reach Dcr earlier than that of the corresponding cross section edges. The crack predicted by CDM originates from the cross section centre for the base metal and weld specimens. In addition, CDM can predict the number of cycles to initial damage N0. At the same strain range, the number of cycles to initial damage N0 at the cross section centres for the base metal and weld specimens is less than those at the corresponding cross section edges. As the total strain range increases, the fatigue life Nf and numbers of cycles to initial damage N0 of the base metal and welded specimens decrease gradually. According to Equation (29), the growth rate of the damage variable d D is proportional to the cumulative plastic strain increment d ε p + . Hence, a large total strain range leads to a large d D and d ε p + , which causes low N0 and Nf.
Comparison of the predicted crack initiation and fracture lives of the base metal and weld specimens with test results are shown in Table 5 and Table 6. N f , C P and N f , E P represent the predicted fatigue life at the cross section centre and edge, respectively. N f and N r represent the test fatigue and fracture life, respectively. As shown in Figure 12 and Figure 13, cracks appeared from the centre to the edge. Therefore N f , C P and N f , E P can be considered the predicted crack initiation life and predicted fracture, life respectively. Table 5 shows that the predicted values of the crack initiation and fracture lives of base metal specimens are less than the corresponding experimental values. The predicted errors of crack initiation life and fracture life decrease with increasing strain level. Indeed, the larger the strain range in the test, the more consistent the ULCF damage of the base metal specimens with ductile failure characteristics.
Table 6 compares the predicted crack initiation and fracture lives of weld specimens with test results. The table shows that the predicted fatigue and fracture lives of weld specimens are less than the corresponding test values. Errors in the predicted crack initiation and fracture lives of welded specimens decrease with increasing strain level.
The post-fracture path of base metal specimens at strain range of 7% under ULCF load are shown in Figure 14. As the cycle number increase, elements satisfying the fracture criterion (D = Dcr) are deleted individually. When the crack width reaches half the size of the specimen, the difference between cycle number and fracture life is very low at only two or three times. Hence, when the initial cracks generate, the cracks develop very fast. Cracks develop from the cross section centre to the edge, and their direction of development is perpendicular to the axis direction of the specimen. The fracture surface is relatively flat. In addition, the predicted post-fracture path is identical to the test result, as shown in Figure 9a.
The post-fracture path of weld specimens at a strain range of 7% are shown in Figure 15. Cracks in weld specimens appear at the cross section centre. With an increasing cycle number, cracks propagate from the cross section centre to the edge of the weld zone. Then, the cracks reach the narrow area of the weld zone on the specimen surface and then develop along the interface between the weld metal zone and HAZ. Finally, oblique cracks are formed, and the weld specimen completely fractures. The post-fracture path of weld specimens is demonstrated by the test results in Figure 9b.
According to the above analysis, CDM can successfully predict fatigue life, fracture life and post-fracture path, as well as the number of cycles to initial damage. The predicted crack initiation location and post-fracture path are similar to the results for weld metal specimens, but the predicted crack initiation location for the base metal specimen deviates from the test results to some extent. The possible reasons are as follows: (1) In the CDM model of ULCF, the material is assumed to have no defects; however, a few inclusions or defects in the specimens are generated in production stage; and (2) a CDM that is suitable for ULCF only considers the damage caused by tensile strain, thus neglecting effect of compressive strain on damage.

5. Conclusions

The CDM model is introduced in this paper to predict the ULCF damage of steel and its weld joints in serious earthquakes. Firstly, a CDM that is suitable for ULCF damage, extending from the case of monotonic tension, is proposed. The material parameters of the CDM model are then calibrated using uniaxial tensile tests. Moreover, finite element models based on the CDM model are established using ABAQUS to predict the fatigue life, fracture life, number of cycles to initial damage and post-fracture path of the specimens. The tests of ULCF for base metal and weld specimens to validate the accuracy of the CDM model. According to the above research, the following conclusions can be drawn:
(1) Considering that the fracture mechanisms of ULCF and monotonic tension are ductile fracture, the CDM model for ULCF damage is reasonably extended from the CDM model for monotonic tension. The CDM model for ULCF damage only considers the damage of tensile strain and ignores the damage of compressive strain.
(2) The uniaxial plastic strain threshold ε t h of Q345qC base metal, HAZ and weld metal is calibrated. Amongst the samples, the weld metal has the lowest ε t h , and HAZ has a slightly lower ε t h than the base metal. The weld metal is the most vulnerable to damage, followed by HAZ and the base metal.
(3) The poor uniformity of the weld metal and the quality of welding exert important effects on ε t h . In comparison with the ε t h of the base metal and HAZ, the weld metal specimen had the largest dispersion coefficient about ε t h .
(4) The development law of the damage variable D reveals exponential growth combined with a stepped pattern.
(5) The predicted crack initiation and fracture lives of the base metal specimens are lower than the corresponding experimental values. The predicted errors of crack initiation life and fracture life decrease with an increasing strain level. The CDM model can accurately predict the number of cycles to initial damage. In addition, as the strain range increases, the fatigue life, fracture life and number of cycles to initial damage decrease.
(6) The predicted crack initiation location in the weld specimen is the centre of the cross section, whilst the location of the test is the HAZ edge. The predicted crack initiation location in the base metal specimen is the centre of the cross section, whilst the location of the test is the edge. The predicted crack initiation location slightly differs from the location of the test. Two reasons may explain these results. Firstly, the CDM model assumes that no defects exist in the steel; however, a few inclusions or defects are generated in production stage. Secondly, the CDM of ULCF only considers the damage caused by tensile strain and neglects the effect of compressive strain.
(7) The direction of post-fracture path in the base metal specimen is perpendicular to the axis direction. The post-fracture path in the welded specimen occurs along the interface between the weld metal zone and HAZ, and oblique cracks are finally formed. The predicted post-fracture path is identical to the test results.

Author Contributions

Conceptualization, Q.T.; methodology, Q.T. and X.X.; software, Q.T.; validation, H.Z.; formal analysis, Q.T.; resources, X.X.; data curation, Q.T.; writing—original draft preparation, Q.T., H.Z. and X.X.; writing—review and editing, Q.T.; project administration, Q.T.; funding acquisition, Q.T. and X.X.

Funding

This research was funded by National Science Foundation for Young Scientists of Jiang Xi, grant number 20161BAB216113; Natural Science Foundation of Jiang Xi, grant number 20171BAB206050; and China Postdoctoral Science Foundation, grant number 2017M611993.

Conflicts of Interest

The authors declare no conflict of interest.

References

  1. Kawashima, K.; Unjoh, S. The damage of highway bridges in the 1995 Hyogo-Ken Nanbu earthquake and its impact on Japanese seismic design. J. Earthq. Eng. 1997, 3, 505–541. [Google Scholar] [CrossRef]
  2. Subcommittee on Investigation of Seismic Damage of Steel Structure. Investigation of causes of damage to steel structure on Hanshin-Awaji earthquake disaster. Proc. JSCE 2000, 64, 17–30. (In Japanese) [Google Scholar]
  3. Miller, D.K. Lessons learned from the Northridge earthquake. Eng. Struct. 1998, 20, 249–260. [Google Scholar] [CrossRef]
  4. Goto, Y.; Ebisawa, T.; Lu, X.L. Local buckling restraining behavior of thin-walled circular CFT columns under seismic loads. J. Struct. Eng. 2014, 140, 1–14. [Google Scholar] [CrossRef]
  5. Wang, Z.F.; Toshitaka, Y. Ultimate strength and ductility of stiffened steel tubular bridge piers. Int. J. Steel Struct. 2011, 11, 81–90. [Google Scholar] [CrossRef]
  6. Usami, T.; Ge, H.B.; Saizuka, K. Behavior of partially concrete-filled steel bridge piers under cyclic and dynamic loading. J. Constr. Steel Res. 1997, 41, 121–136. [Google Scholar] [CrossRef]
  7. Tong, L.; Huang, X.; Zhou, F.; Chen, Y. Experimental and numerical investigations on extremely-low-cycle fatigue fracture behavior of steel welded joints. J. Constr. Steel Res. 2016, 119, 98–112. [Google Scholar] [CrossRef]
  8. Pereira, J.; De Jesus, A.M.; Fernandes, A. A new ultra-low cycle fatigue model applied to the X60 piping steel. Int. J. Fatigue 2016, 93, 201–213. [Google Scholar] [CrossRef]
  9. Kuwamura, H.; Takagi, N. Similitude law of prefracture hysteresis of steel members. J. Struct. Eng. 2004, 130, 752–761. [Google Scholar] [CrossRef]
  10. Bleck, W.; Dahl, W.; Nonn, A.; Amlung, L.; Feldmann, M.; Schafer, D.; Eichler, B. Numerical and experimental analyses of damage behavior of steel moment connection. Eng. Fract. Mech. 2009, 76, 1531–1547. [Google Scholar] [CrossRef]
  11. Zhou, H.; Wang, Y.Q.; Shi, Y.J.; Xiong, J.; Yang, L. Extremely low cycle fatigue prediction of steel beam-to-column connection by using a micro-mechanics based fracture model. Int. J. Fatigue 2013, 48, 90–100. [Google Scholar] [CrossRef]
  12. Mendes, L.A.; Castro, L.M. A simplified reinforcing steel model suitable for cyclic loading including ultra-low-cycle fatigue effects. Eng. Struct. 2014, 68, 155–164. [Google Scholar] [CrossRef]
  13. Nip, K.H.; Gardner, L.; Davies, C.M. Extremely low cycle fatigue tests on structural carbon steel and stainless steel. J. Constr. Steel Res. 2010, 66, 96–110. [Google Scholar] [CrossRef]
  14. Huang, X.W.; Tong, L.W.; Zhou, F. Prediction of fracture behavior of beam-to-column welded joints using micromechanics damage model. J. Constr. Steel Res. 2013, 85, 60–72. [Google Scholar] [CrossRef]
  15. Kuwamura, H. Transition between fatigue and ductile fracture in steel. J. Struct. Eng. 1997, 123, 864–870. [Google Scholar] [CrossRef]
  16. Kermajani, M.; Malek Ghaini, F.; Miresmaeili, R.; Aghakouchak, A.A.; Shadmand, M. Effect of weld metal toughness on fracture behavior under ultra-low cycle fatigue loading (earthquake). Mater. Sci. Eng. A 2016, 668, 30–37. [Google Scholar] [CrossRef]
  17. Zhang, Q.B.; Zhang, J.X.; Zhao, P.F.; Huang, Y.; Yu, Z.H.; Fang, X.Y. Low-cycle fatigue behaviors of a new type of 10% Cr martensitic steel and welded joint with Ni-based weld metal. Int. J. Fatigue 2016, 88, 78–87. [Google Scholar] [CrossRef]
  18. Song, F.Y.; Xie, X. Effect analysis of corrosion on low cycle fatigue behavior of structural steel. J. Zhejiang Univ. 2018, 52, 1–10. [Google Scholar]
  19. Ge, H.B.; Ohashi, M.; Tajima, R. Experimental study on ductile crack initiation and its propagation in steel bridge piers of thick-walled box sections. J. Struct. Eng. JSCE 2007, 53, 493–502. (In Japanese) [Google Scholar]
  20. Xue, L. A unified expression for low cycle fatigue and extremely low cycle fatigue and its implication for monotonic loading. Int. J. Fatigue 2008, 30, 1691–1698. [Google Scholar] [CrossRef]
  21. Kuwamura, H.; Akiyama, H. Brittle fracture under repeated high stresses. J. Constr. Steel Res. 1994, 29, 5–19. [Google Scholar] [CrossRef]
  22. Tateishi, K.; Hanji, T.; Minami, K. A prediction model for extremely low cycle fatigue strength of structural steel. Int. J. Fatigue 2007, 29, 887–896. [Google Scholar] [CrossRef]
  23. Coffin, L.F.J. A study of the effects of cyclic thermal stresses on a ductile metal. Trans. ASME 1954, 76, 931–950. [Google Scholar]
  24. Manson, S.S. Behavior of Materials under Conditions of Thermal Stress; University of Michigan: Ann Arbor, MI, USA, 1953; pp. 1–37. [Google Scholar]
  25. Kuroda, M. Extremely low cycle fatigue life prediction based on a new cumulative fatigue damage model. Int. J. Fatigue 2002, 24, 699–703. [Google Scholar] [CrossRef]
  26. Kanvinde, A.M.; Deierlein, G.G. Cyclic void growth model to assess ductile fracture initiation in structural steels due to ultra low cycle fatigue. J. Eng. Mech. 2007, 133, 701–712. [Google Scholar] [CrossRef]
  27. Liao, Y.H.; Xie, X.; Tang, Z.Z. Low cycle fatigue properties and fracture mechanism of Q345qC steel and its welded joint. J. Zhejiang Univ. 2018, 52, 73–81. [Google Scholar]
  28. Rice, J.R.; Tracey, D.M. On the ductile enlargement of voids in triaxial stress fields. J. Mech. Phys. Solids 1969, 17, 201–217. [Google Scholar] [CrossRef] [Green Version]
  29. Hancock, J.W.; Mackenzie, A.C. On the mechanics of ductile failure in high-strength steel subjected to multi-axial stress-states. J. Mech. Phys. Solids 1976, 24, 147–169. [Google Scholar] [CrossRef]
  30. Adasooriya, N.D.; Siriwardane, S.C.; Ohga, M. A simplified approach to predict the failure of steel members under interaction effect of fracture and fatigue. Int. J. Fatigue 2013, 47, 161–173. [Google Scholar] [CrossRef]
  31. Xing, J.H.; Guo, C.L.; Li, Y.Y.; Chen, A.G. Damage coefficient identification of micromechanical fracture prediction models for steel Q235B. J. Harbin Inst. Technol. 2017, 49, 184–188. (In Chinese) [Google Scholar]
  32. Li, S.L.; Xie, X.; Liao, Y.H. Improvement of cyclic void growth model for ultra-low cycle fatigue prediction of steel bridge piers. Materials 2019, 12, 1615. [Google Scholar] [CrossRef] [PubMed] [Green Version]
  33. Bonora, N. A nonlinear CDM model for ductile failure. Eng. Fract. Mech. 1997, 58, 11–28. [Google Scholar] [CrossRef]
  34. Girão Coelho, A.M. Rotation capacity of partial strength steel joints with three-dimensional finite element approach. Comput. Struct. 2013, 116, 88–97. [Google Scholar] [CrossRef]
  35. Cheng, G.; Zuo, J.; Lou, Z. Continuum damage model of low-cycle fatigue and fatigue damage analysis of welded joint. Eng. Fract. Mech. 1996, 55, 155–161. [Google Scholar] [CrossRef]
  36. Liao, F.F.; Wang, W.; Chen, Y.Y. Extremely low cycle fatigue fracture prediction of steel connections under cyclic loading. J. Tongji Univ. Nat. Sci. Ed. 2014, 42, 539–546. [Google Scholar]
  37. Bataille, J.; Kestin, J. Irreversible process and physical interpretation of rational thermodynamics. J. Non-Equilib. Thermodyn. 1979, 4, 229–258. [Google Scholar] [CrossRef]
  38. Wang, B.; Hu, N.; Kurobane, Y.; Makino, Y.; Lie, S.T. Damage criterion and safety assessment approach to tubular joints. Eng. Struct. 1998, 22, 424–434. [Google Scholar] [CrossRef]
  39. Dhar, S.; Dixit, P.M.; Sethuraman, R. A continuum damage mechanics model for ductile fracture. Int. J. Press. Vessel. Pip. 2000, 77, 335–344. [Google Scholar] [CrossRef]
  40. Wang, T.J. A continuum damage model for ductile fracture of weld heat affected zone. Eng. Fract. Mech. 1991, 40, 1075–1082. [Google Scholar] [CrossRef]
Figure 1. Designed size of notched round bar specimens with notch radii of (a) R = 4.25 mm, (b) R = 3.0 mm, and (c) R = 1.5 mm.
Materials 12 04014 g001
Figure 2. Schematic of the loading and measurement procedures for notched round bar specimens.
Materials 12 04014 g002
Figure 3. Load–deformation curves of notched round bar specimens at the gauge segment with notch radii of (a) R = 4.25 mm, (b) R = 3.0 mm, and (c) R = 1.5 mm.
Materials 12 04014 g003
Figure 4. Two-dimensional axisymmetric finite element model of a notched round bar specimen. (a) Integral finite element diagram of a notched round bar specimen. (b) Local finite element diagram of a notched round bar specimen.
Materials 12 04014 g004
Figure 5. Stress triaxiality and fracture-accumulated plastic strain nephograms of the base metal with notch radii of (a) R = 4.25 mm and (b) R = 1.5 mm.
Materials 12 04014 g005aMaterials 12 04014 g005b
Figure 6. Schematic of the extraction of the weld metal specimen (unit: mm).
Materials 12 04014 g006
Figure 7. Size of specimens for ULCF (unit: mm). (a) Base metal specimen and (b) weld specimen.
Materials 12 04014 g007
Figure 8. Characteristic curve of cyclic responses at strain ranges of (a) 7.0%, (b) 8.0%, (c) 9.0% and (d) 10.0%.
Materials 12 04014 g008
Figure 9. Post-fracture path of ULCF: (a) Base metal specimen and (b) weld specimen.
Materials 12 04014 g009
Figure 10. Axisymmetric finite element model of the base metal specimen: (a) Integral finite element model and (b) local finite element model.
Materials 12 04014 g010
Figure 11. 3D finite element model of the weld specimen.
Materials 12 04014 g011
Figure 12. Development of the damage variable D of the base metal specimen at strain ranges of (a) 7%, (b) 8%, (c) 9% and (d) 10%.
Materials 12 04014 g012
Figure 13. Development of the damage variable D of the weld specimen at strain ranges of (a) 7%, (b) 8%, (c) 9% and (d) 10%.
Materials 12 04014 g013
Figure 14. Development of cracks in the base metal specimen (strain range: 7%).
Materials 12 04014 g014
Figure 15. Development of cracks in the weld specimen (strain range, 7%). (a) N = 27, (b) N = 35 and (c) N = 38.
Materials 12 04014 g015
Table 1. Number and measured size of notched round bar specimens.
MaterialNotch Radius (mm)NumberClamping Segment
Diameter (mm)
Gauge Segment
Diameter (mm)
Intermediate Segment
Length (mm)
Notch Root Diameter (mm)
Base metal4.25BLM-115.9511.9635.986.04
BLM-215.9511.9236.096.04
3.0BMM-115.9911.9435.735.97
BMM-216.0211.9535.796.04
1.5BSM-115.9411.936.029.08
BSM-215.9711.8935.909.04
Heat affected zone4.25HLM-115.9912.0136.165.85
HLM-215.9711.9736.185.79
3.0HMM-115.9912.0035.946.40
HMM-215.9511.9335.896.24
1.5HSM-115.9912.0136.379.35
HSM-216.0411.9635.999.35
Weld metal4.25WLM-115.9612.0236.026.33
WLM-216.0011.9136.536.25
3.0WMM-115.9711.9236.036.24
WMM-215.9411.9136.376.29
1.5WSM-115.9912.0436.409.43
WSM-216.0511.9636.279.36
Table 2. Calibration results of material parameters for CDM.
MaterialR (mm)Numberδf (mm) ε f T ε f p ε t h
Base metal4.25BLM-12.240 1.31860.83100.88930.5047
BLM-22.262 1.31860.83370.91190.5387
3.0BMM-11.876 1.31860.89160.78820.4210
BMM-21.917 1.31860.89200.81530.4541
1.5BSM-13.543 1.31861.0890.66340.3895
BSM-23.477 1.31861.0960.63660.3648
Average0.4455
Standard deviation0.0613
Dispersion coefficient (Standard deviation / Average)13.75%
Heat affected zone4.25HLM-12.098 1.30840.82050.82620.4179
HLM-21.934 1.30840.81450.73800.3111
3.0HMM-11.895 1.30840.88620.79630.4310
HMM-21.922 1.30840.88650.80870.4464
1.5HSM-13.808 1.30841.05720.77600.5035
HSM-24.009 1.30841.05700.77680.5044
Average0.4357
Standard deviation0.0649
Dispersion coefficient (Standard deviation / Average)14.91%
Weld metal4.25WLM-11.821 0.98820.86290.78130.5736
WLM-21.672 0.98820.85950.71090.4591
3.0WMM-11.371 0.98820.94300.62210.3790
WMM-21.306 0.98820.94700.59040.3419
1.5WSM-12.593 0.98821.20700.45400.2805
WSM-22.264 0.98821.20820.33290.1700
Average0.3673
Standard deviation0.1280
Dispersion coefficient (Standard deviation / Average)34.84%
Table 3. Relationship between fatigue and fracture lives in the test.
Δεt/%NumberNfNrNf/Nr
7BMC01788492.9%
BMC03768193.8%
BMC21788097.5%
WMC04434693.5%
WMC12404295.2%
WMC13293485.3%
8BMC05515789.5%
BMC08555796.5%
BMC22727596.0%
WMC15323591.4%
WMC18323397.0%
WMC21333691.7%
9BMC04475192.2%
BMC17414591.1%
BMC18454893.8%
WMC03242692.3%
WMC06293193.5%
WMC07242596.0%
10BMC15414493.2%
BMC16303196.8%
BMC19333594.3%
WMC01171989.5%
WMC08252792.6%
WMC20212584.0%
Table 4. Test results for ULCF.
Δεt/%NumberCrack initial locationFatigue life Nf Average
Nf
Standard deviationDispersion coefficient
7.0BMC01Section edge78770.940.01
BMC03Section edge76
BMC21Section edge78
WMC04HAZ edge43376.020.16
WMC12HAZ edge40
WMC13HAZ edge29
8.0BMC05Section edge51599.100.15
BMC08Section edge55
BMC22Section edge72
WMC15HAZ edge32320.470.01
WMC18HAZ edge32
WMC21HAZ edge33
9.0BMC04Section edge47442.490.06
BMC17Section edge41
BMC18Section edge45
WMC03HAZ edge24252.360.09
WMC06HAZ edge29
WMC07HAZ edge24
10.0BMC15Section edge41344.640.13
BMC16Section edge30
BMC19Section edge33
WMC01Weld edge17213.270.16
WMC08Weld edge25
WMC20HAZ edge21
Table 5. Comparison of the predicted crack initiation and fracture lives of base metal specimens with test results.
Δεt % N f , C P   ( Predicted ) Nf (Test)Relative Error (%) N f , E P   ( Predicted ) Nr (Test)Relative Error (%)
7.06077−22.16482−21.9
8.04759−20.35063−20.6
9.03844−13.64148−14.6
10.03135−11.43337−10.8
Table 6. Comparison of the predicted crack initiation and fracture lives of weld specimens with test results.
Δεt % N f , C P   ( Predicted ) Nf (Test)Relative error (%) N f , E P   ( Predicted ) Nr (Test)Relative error (%)
7.02737−27.03841−7.3
8.02632−18.83335−5.7
9.02126−19.22627−3.7
10.01721−19.02324−4.2

