Experimental Investigation on the Impact Resistance of Carbon Fibers Reinforced Coral Concrete

 and
and
Abstract
:1. Introduction
2. Materials and Methods
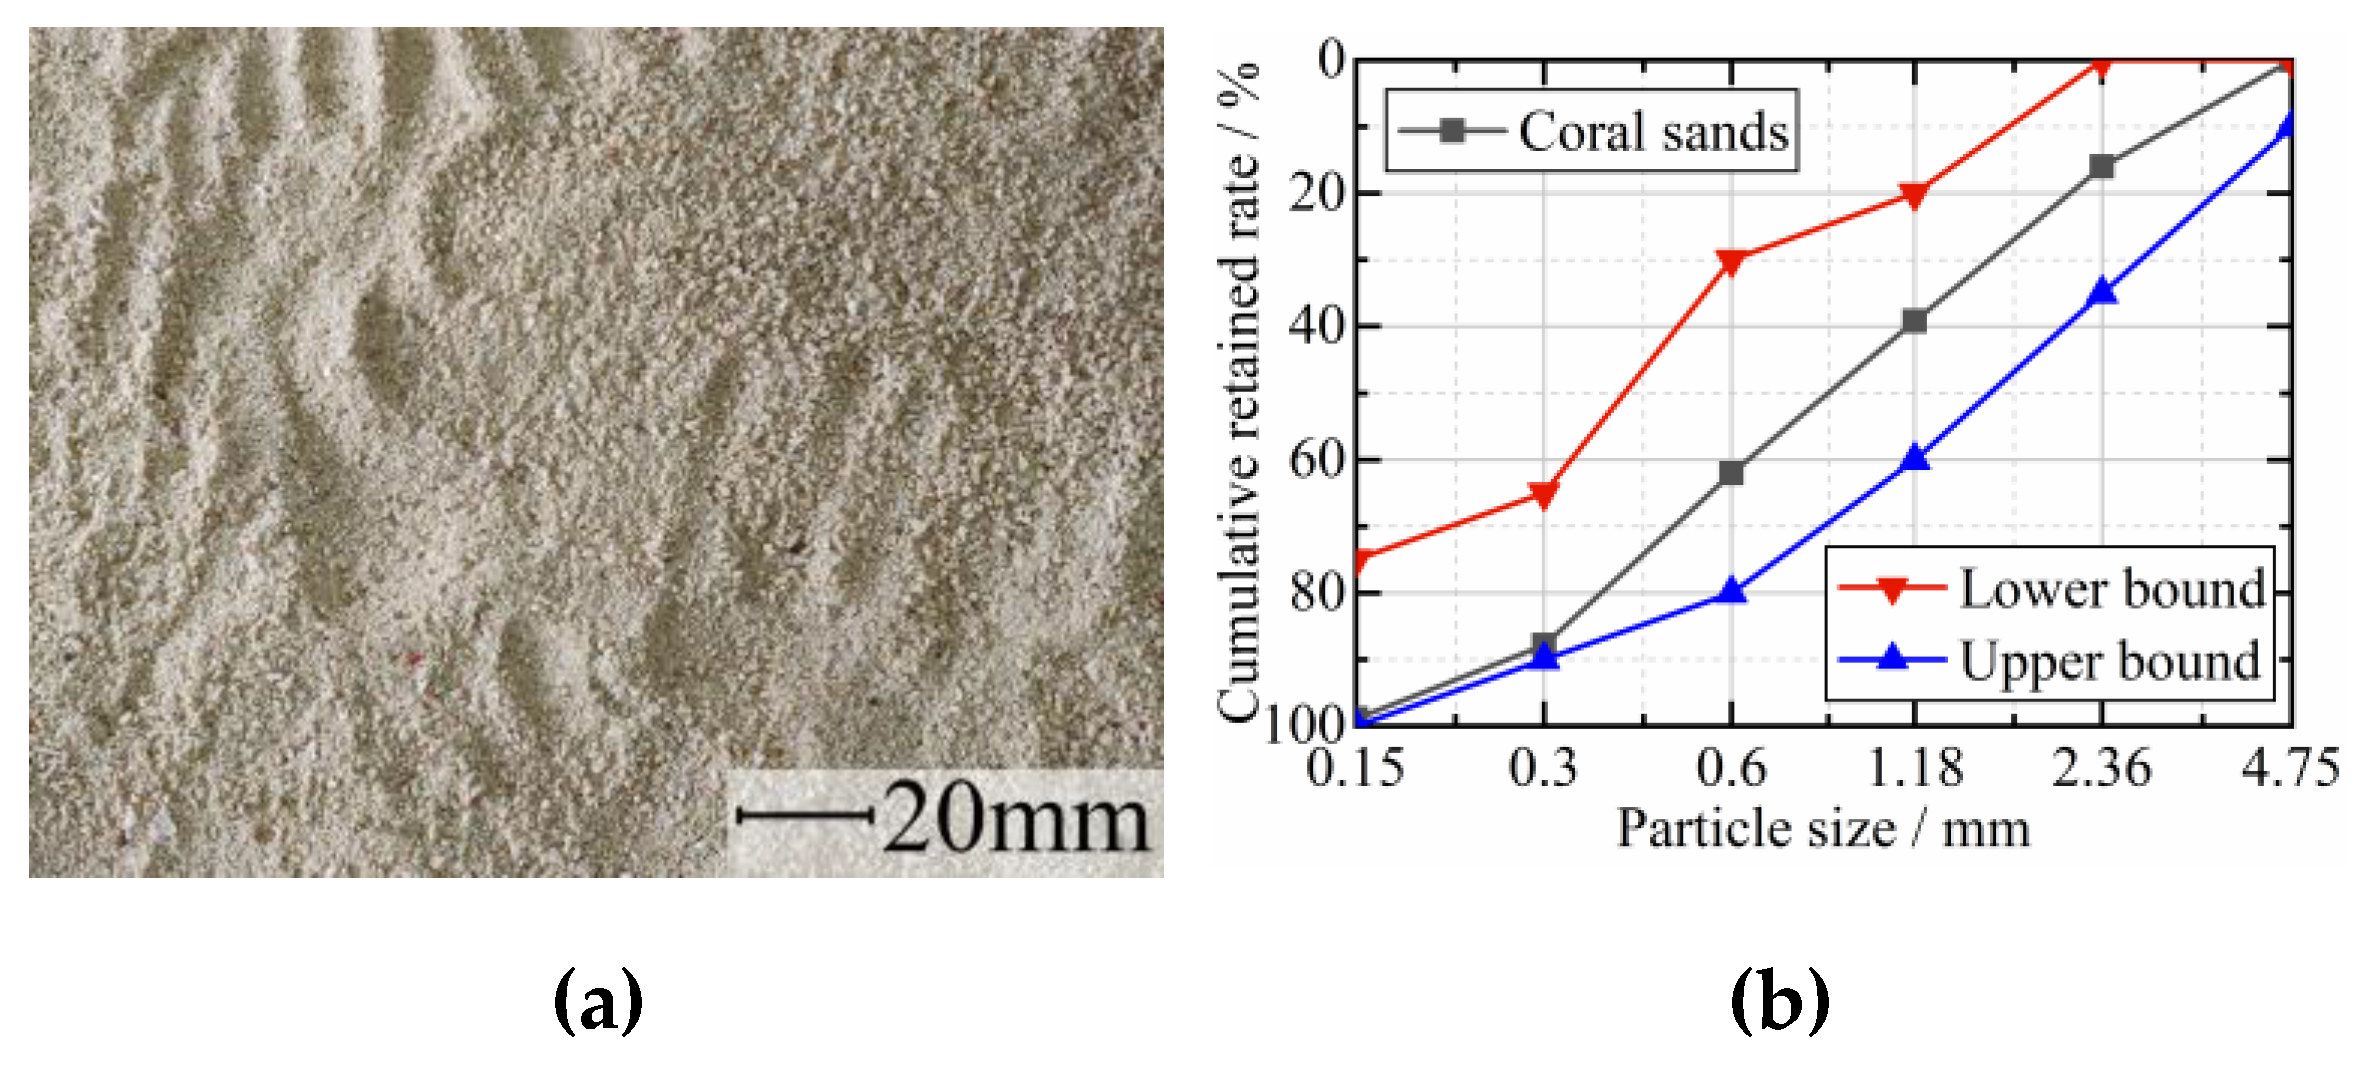
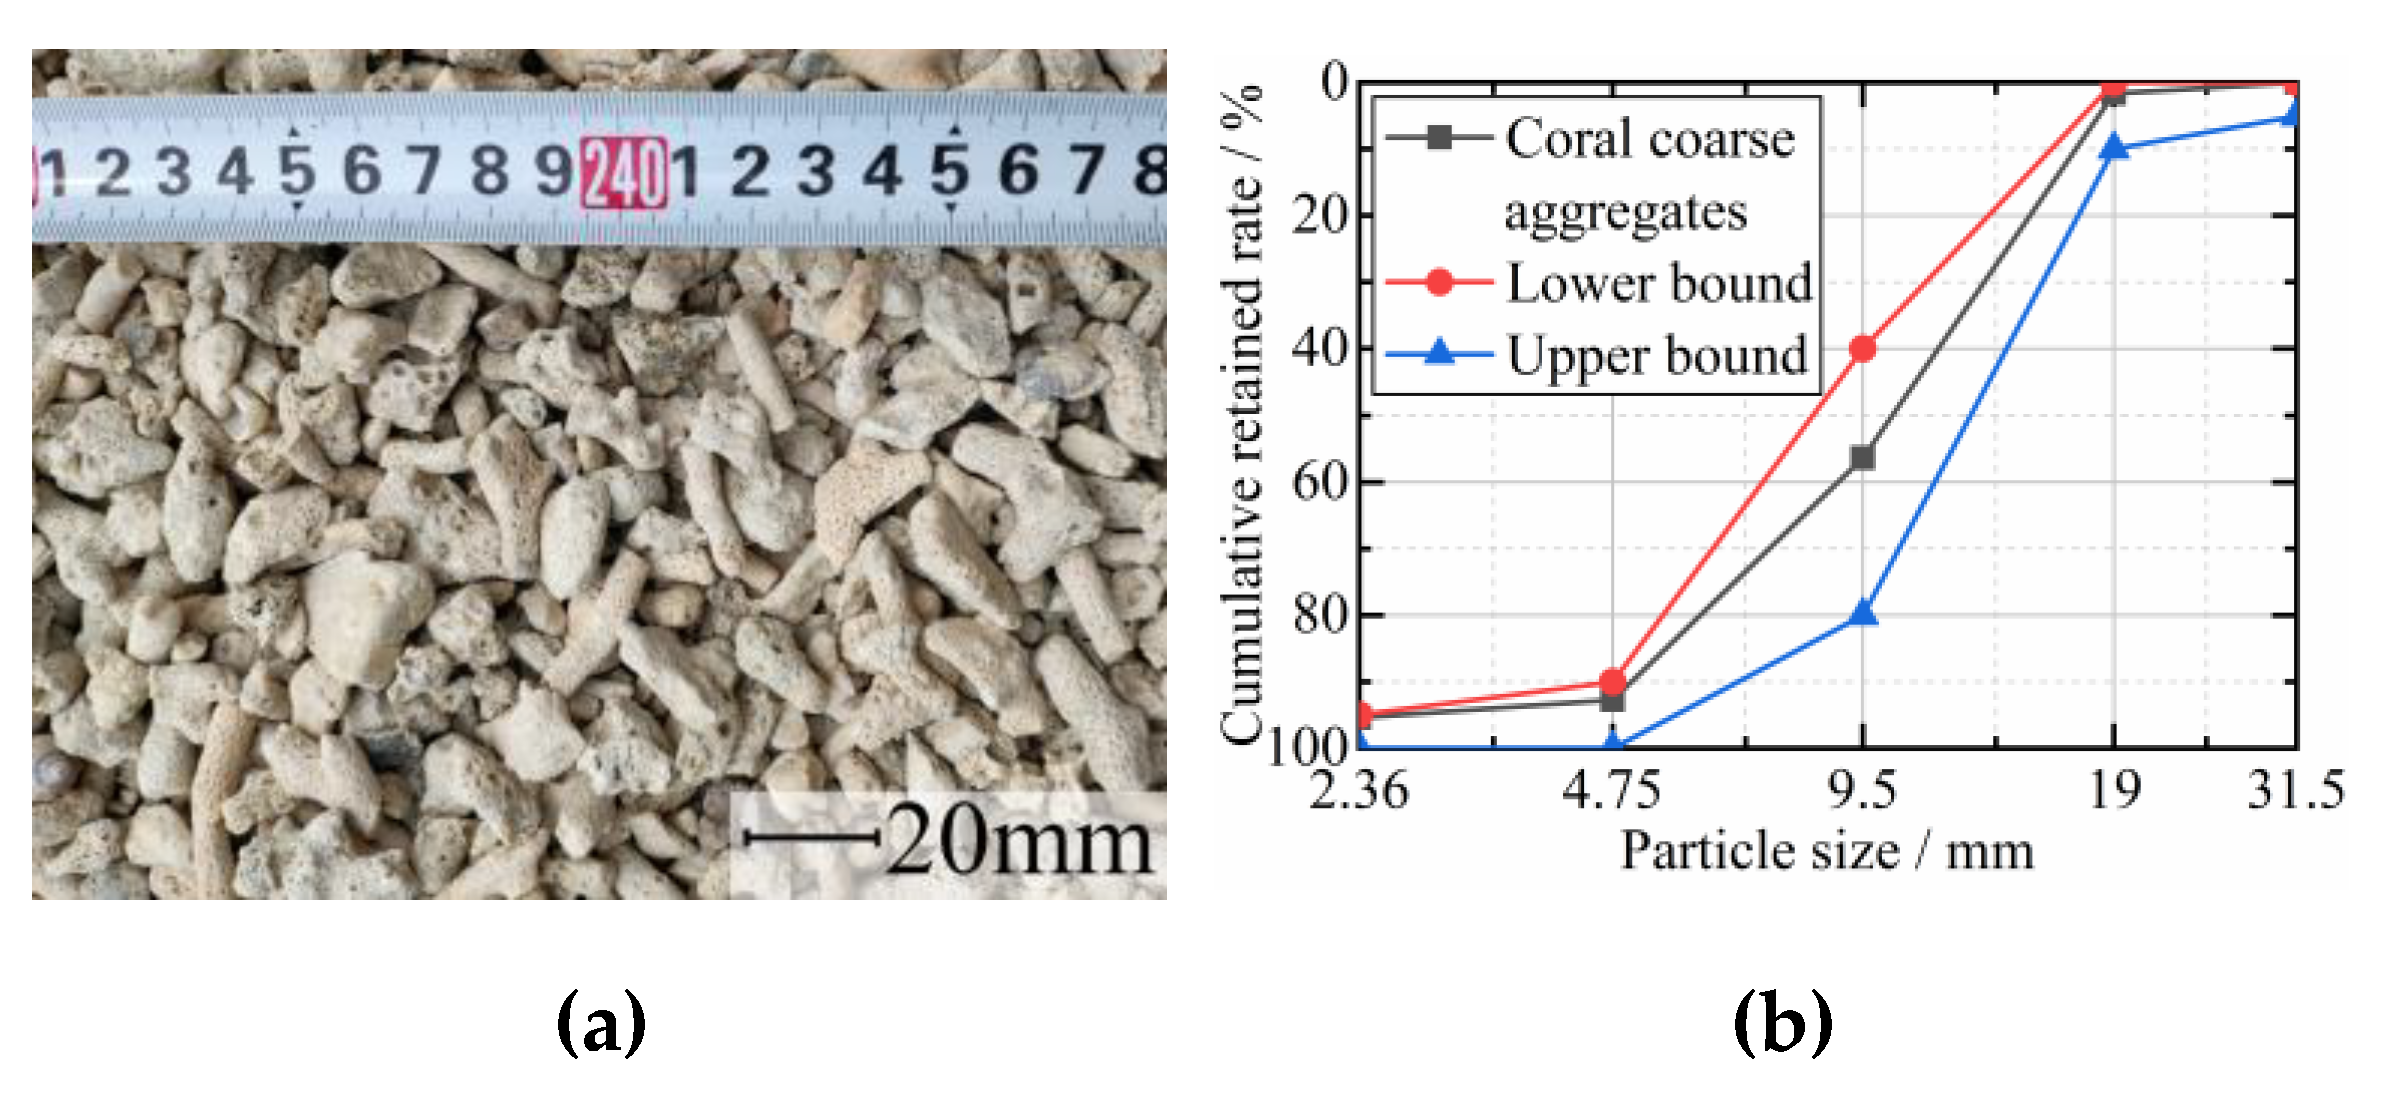
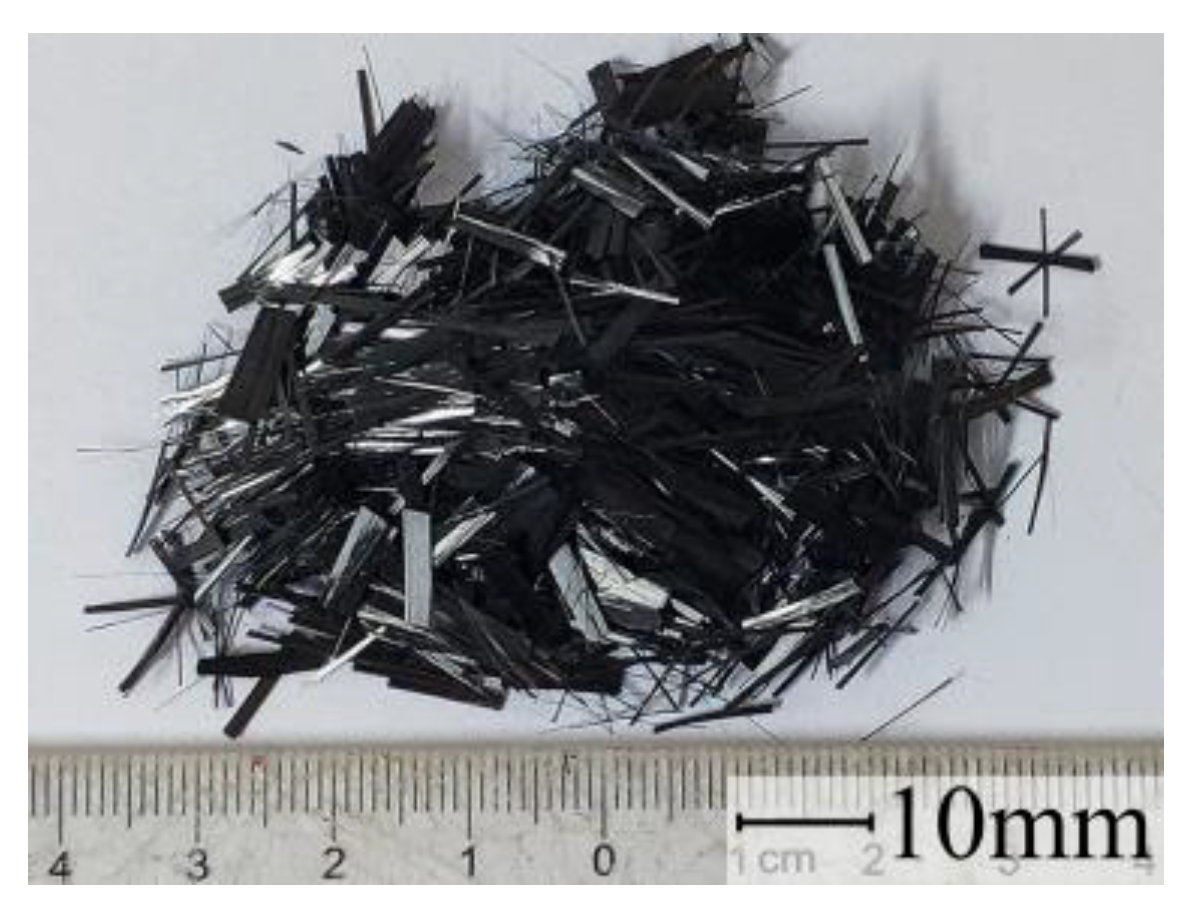
2.1. Raw Materials
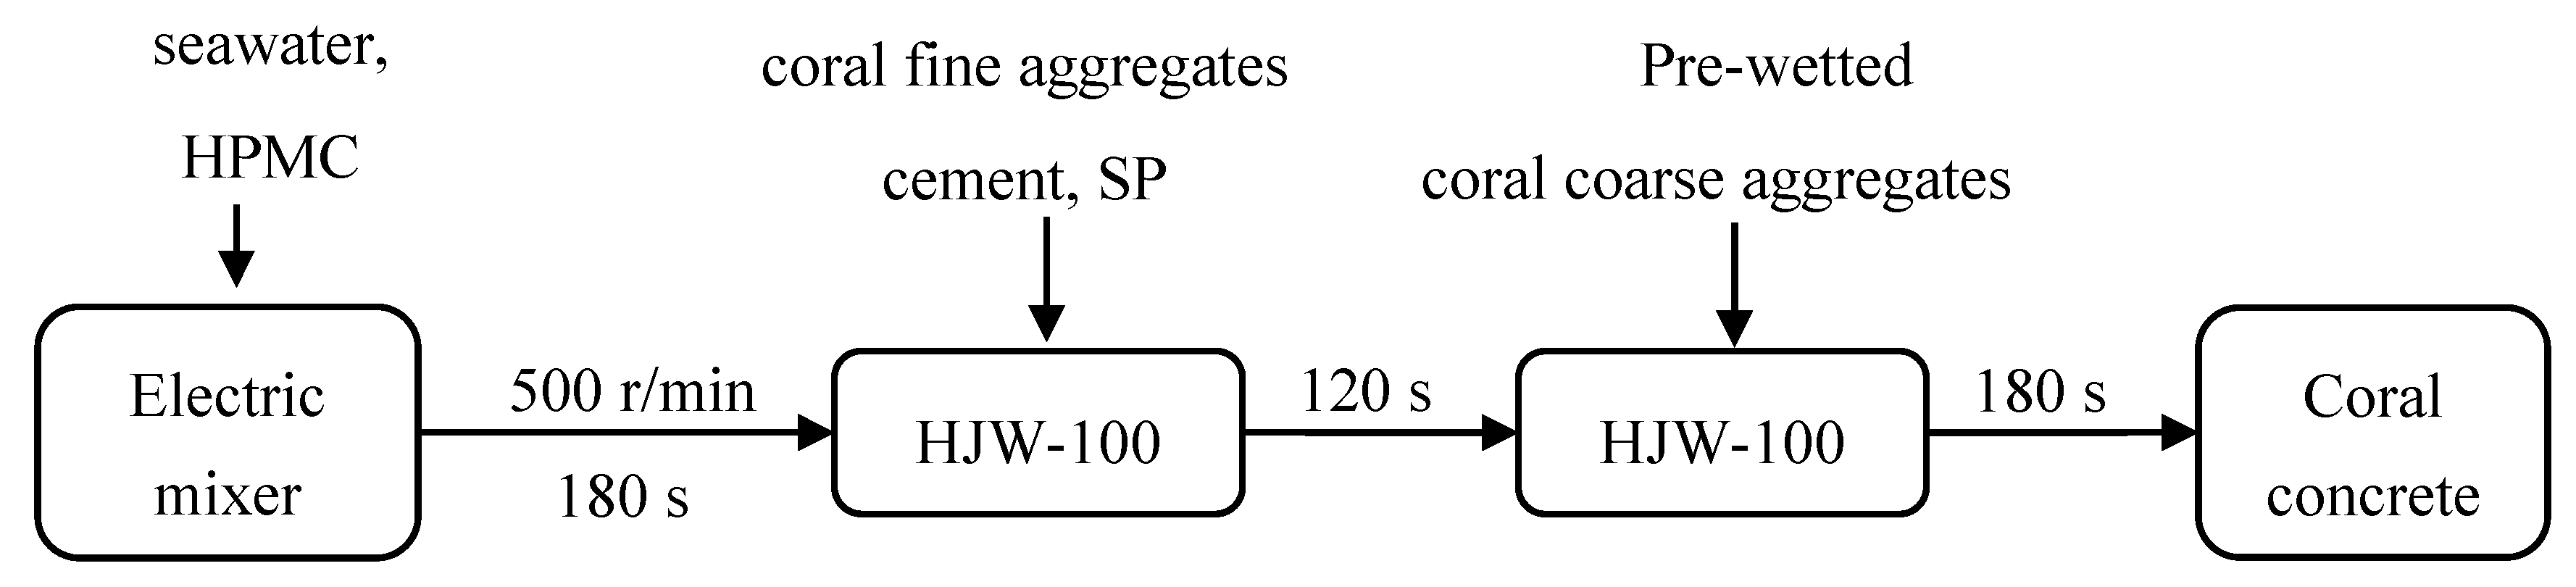
2.2. Mix Proportions and Specimen Preparation
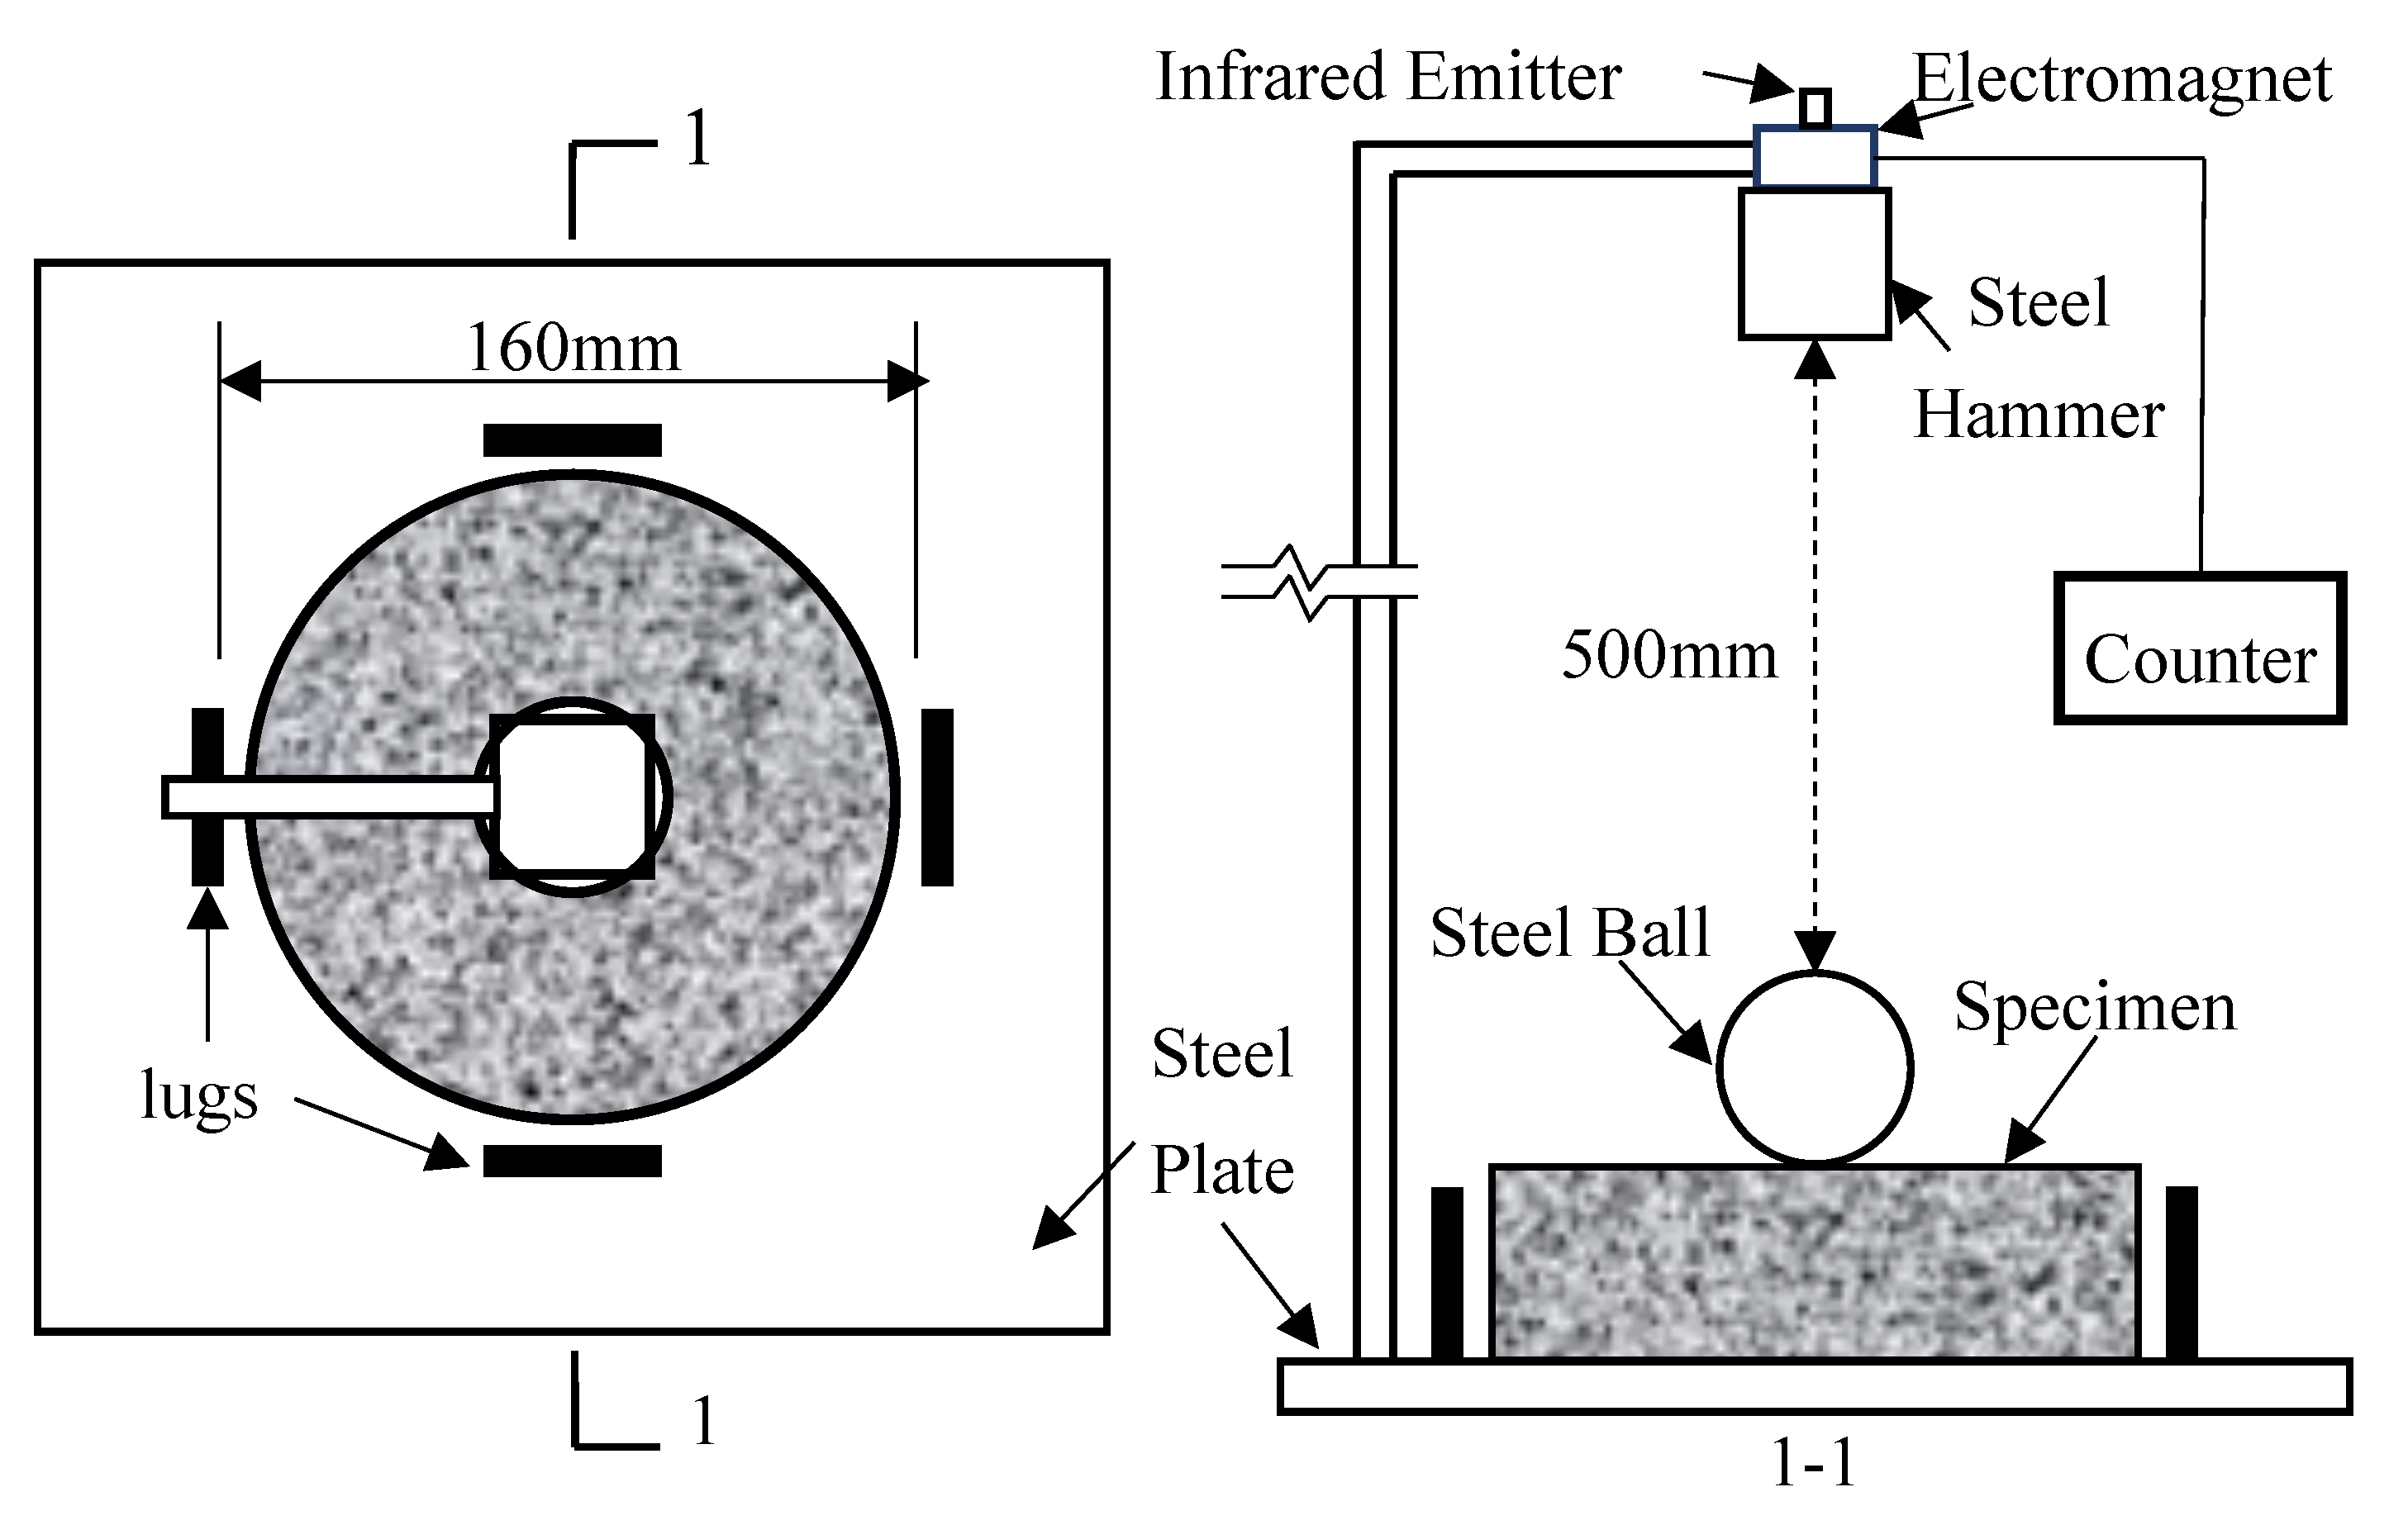
2.3. Impact Tests
3. Results and Discussion
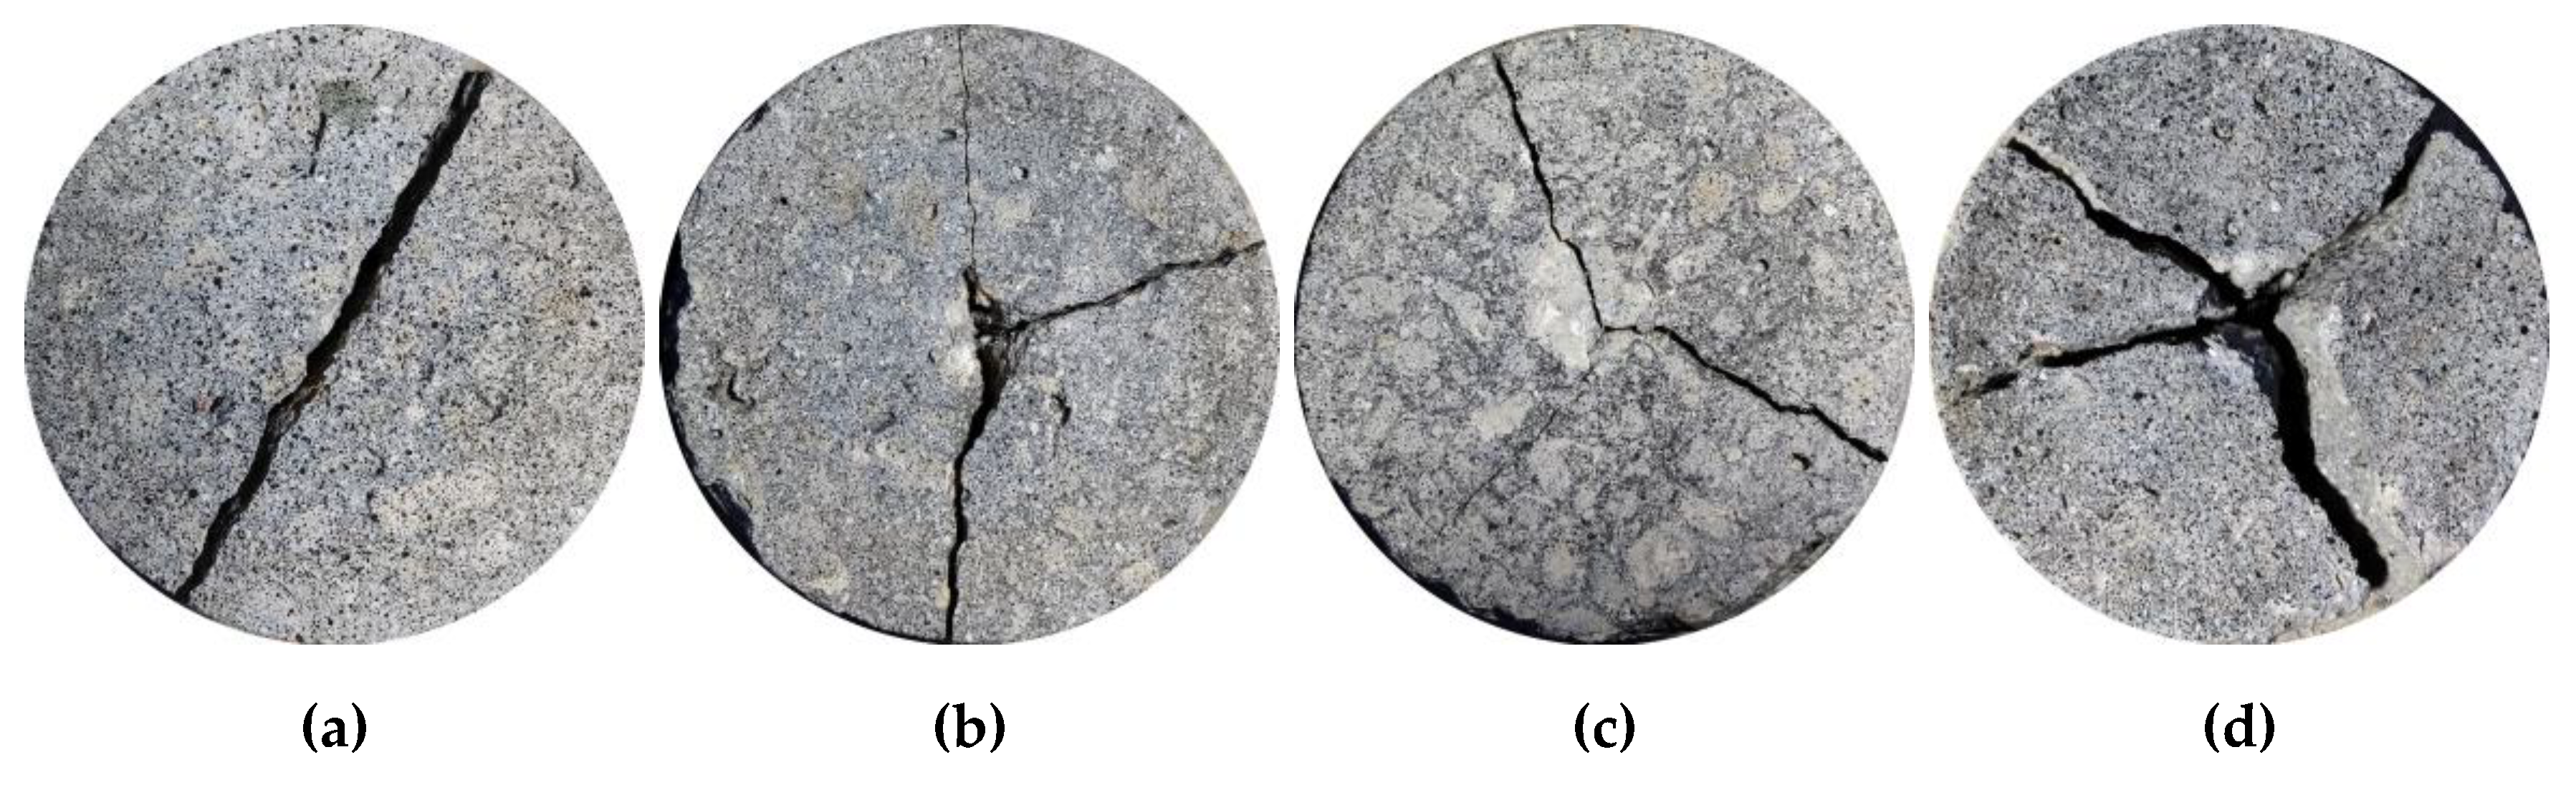
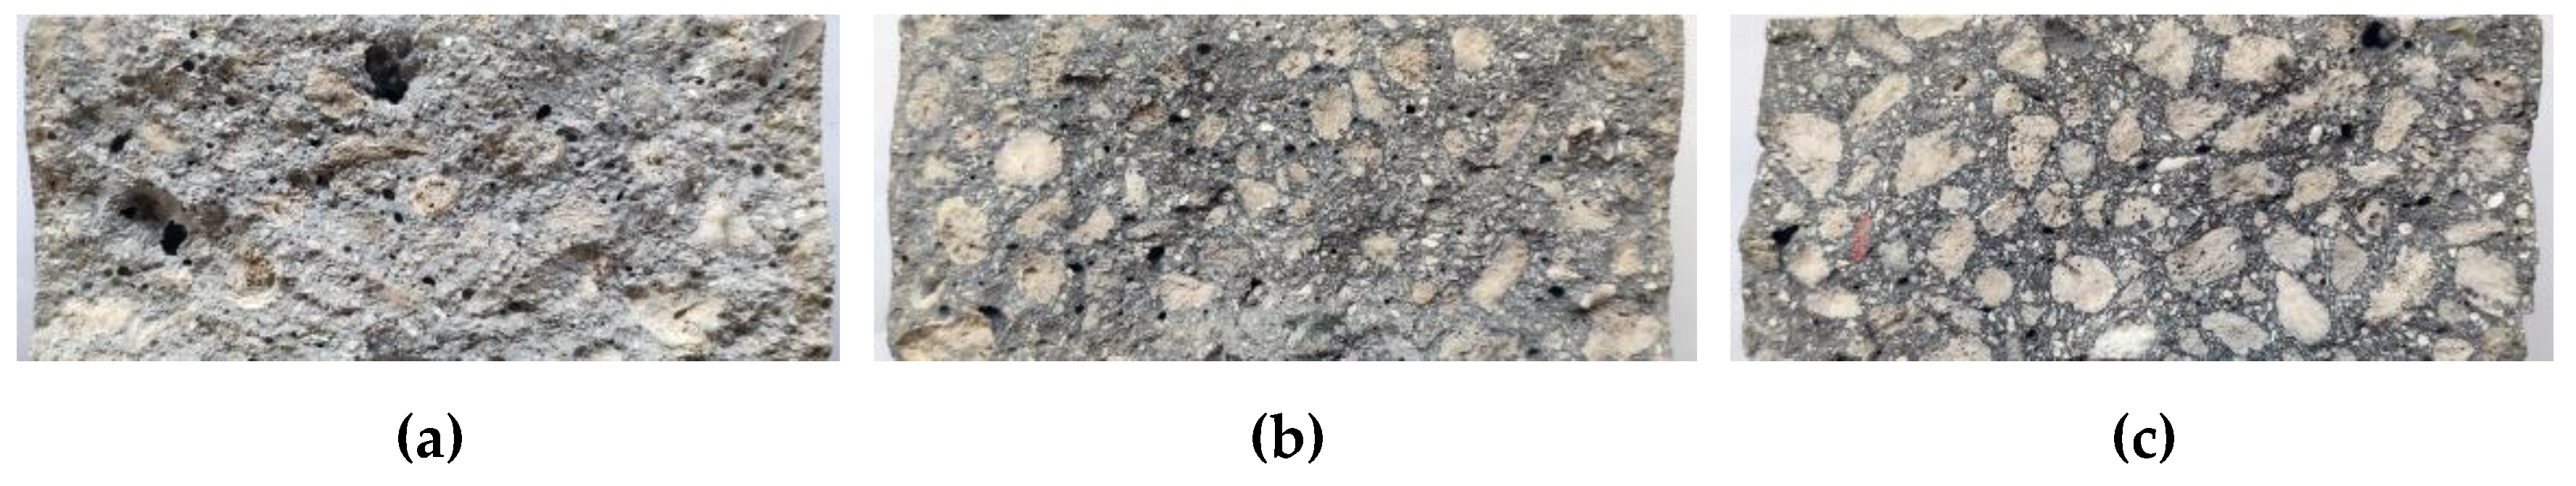
3.1. Failure Patterns under Impact
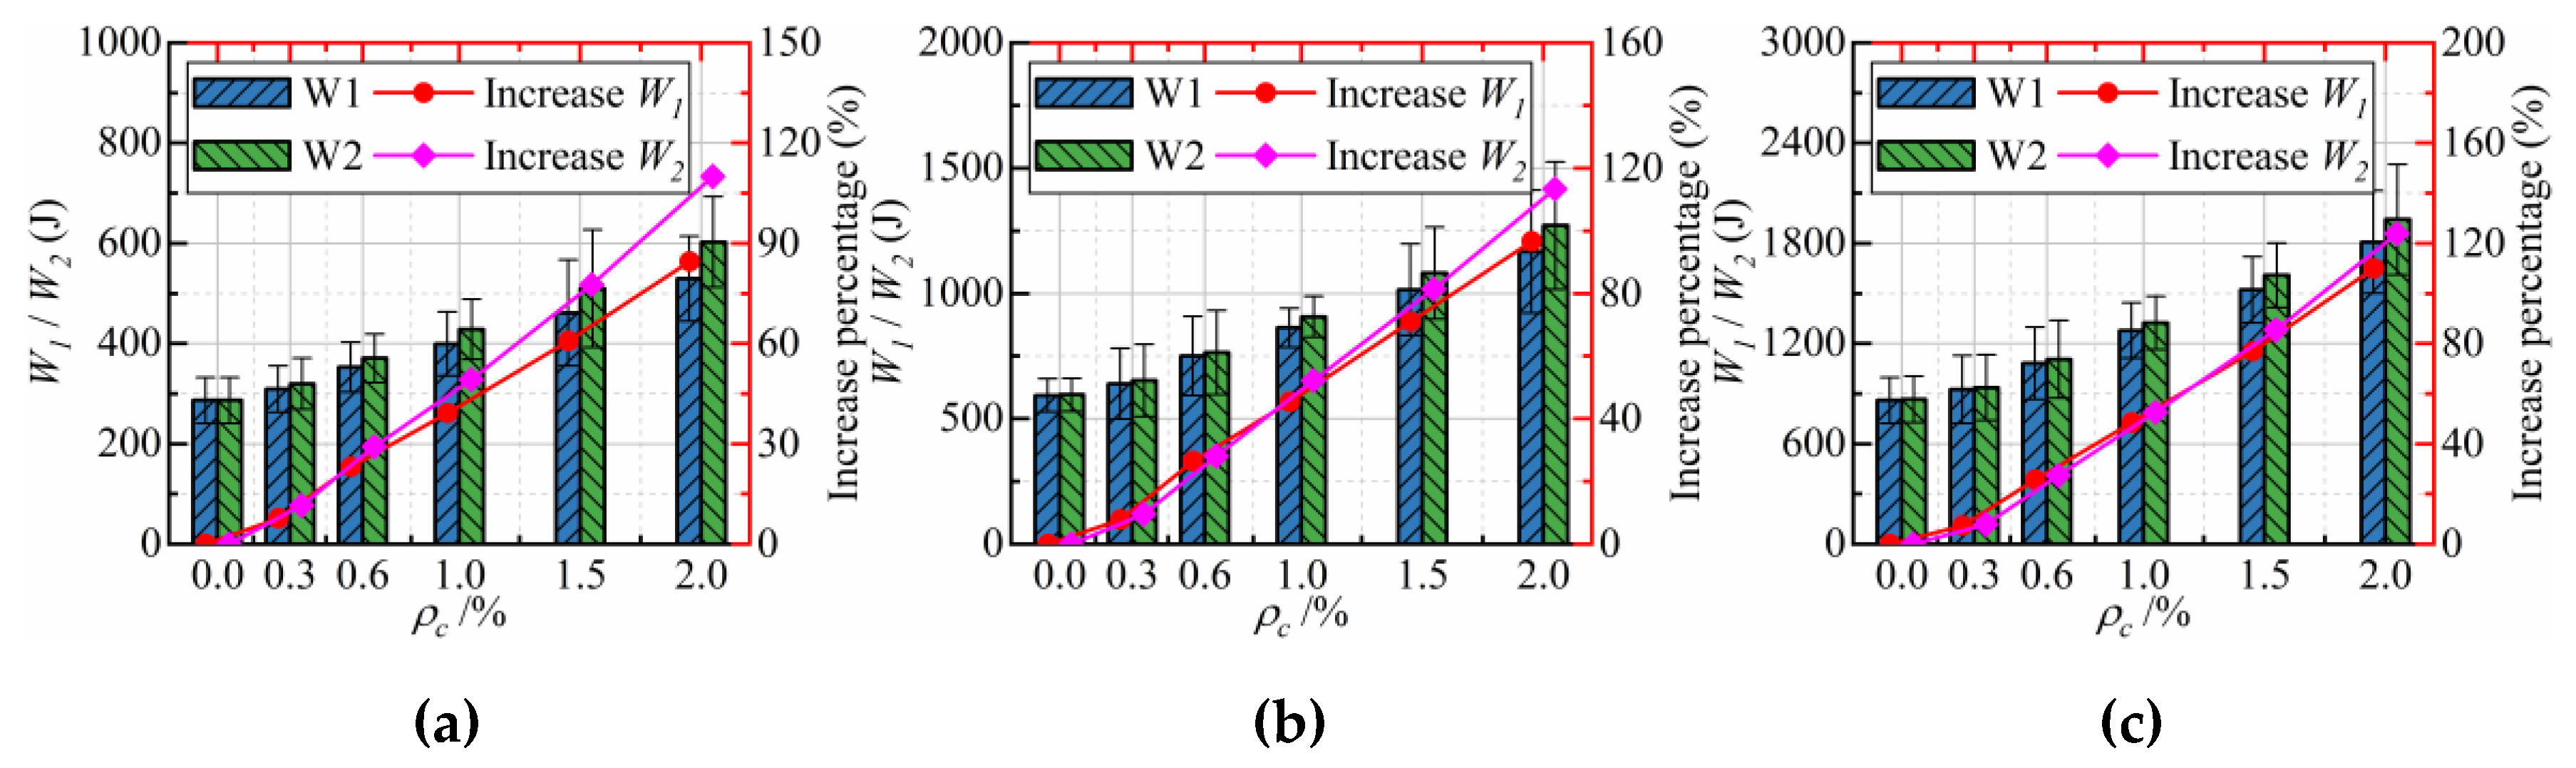
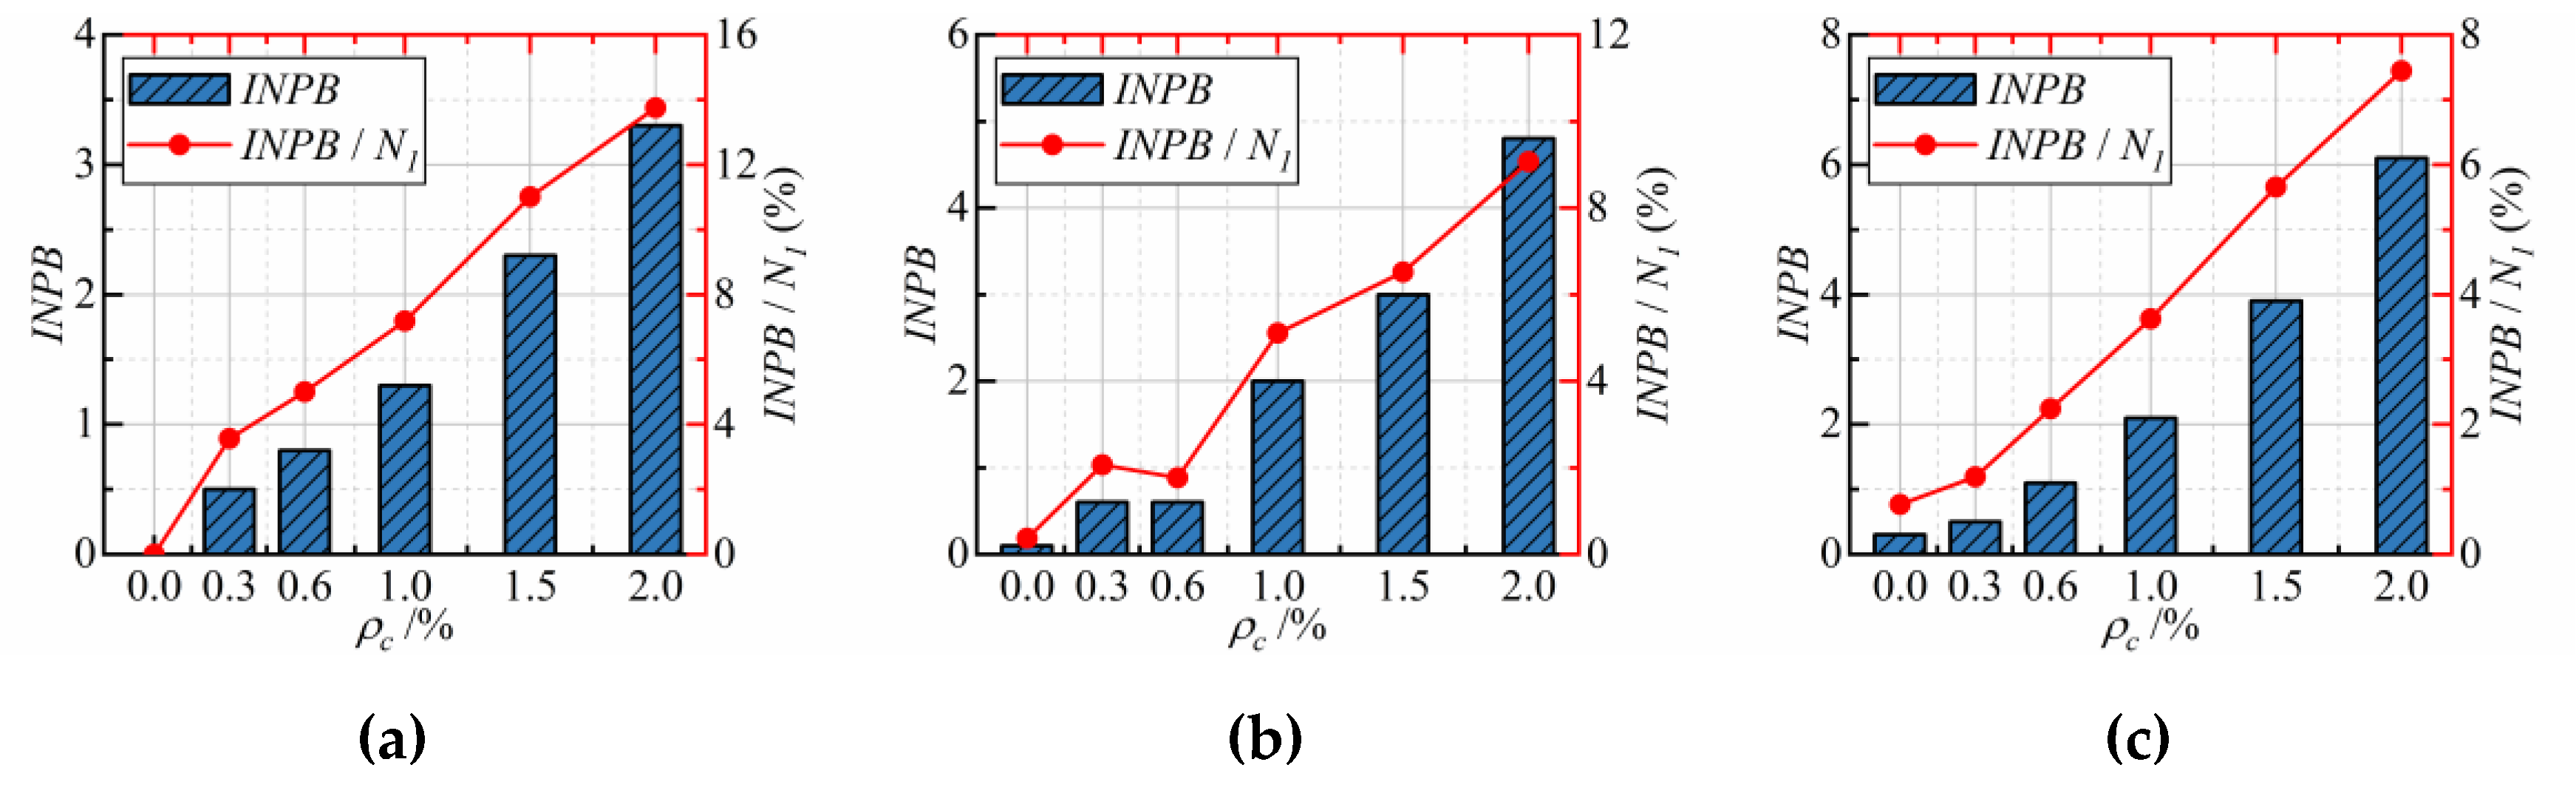
3.2. Effect of CFs on the Impact Resistance
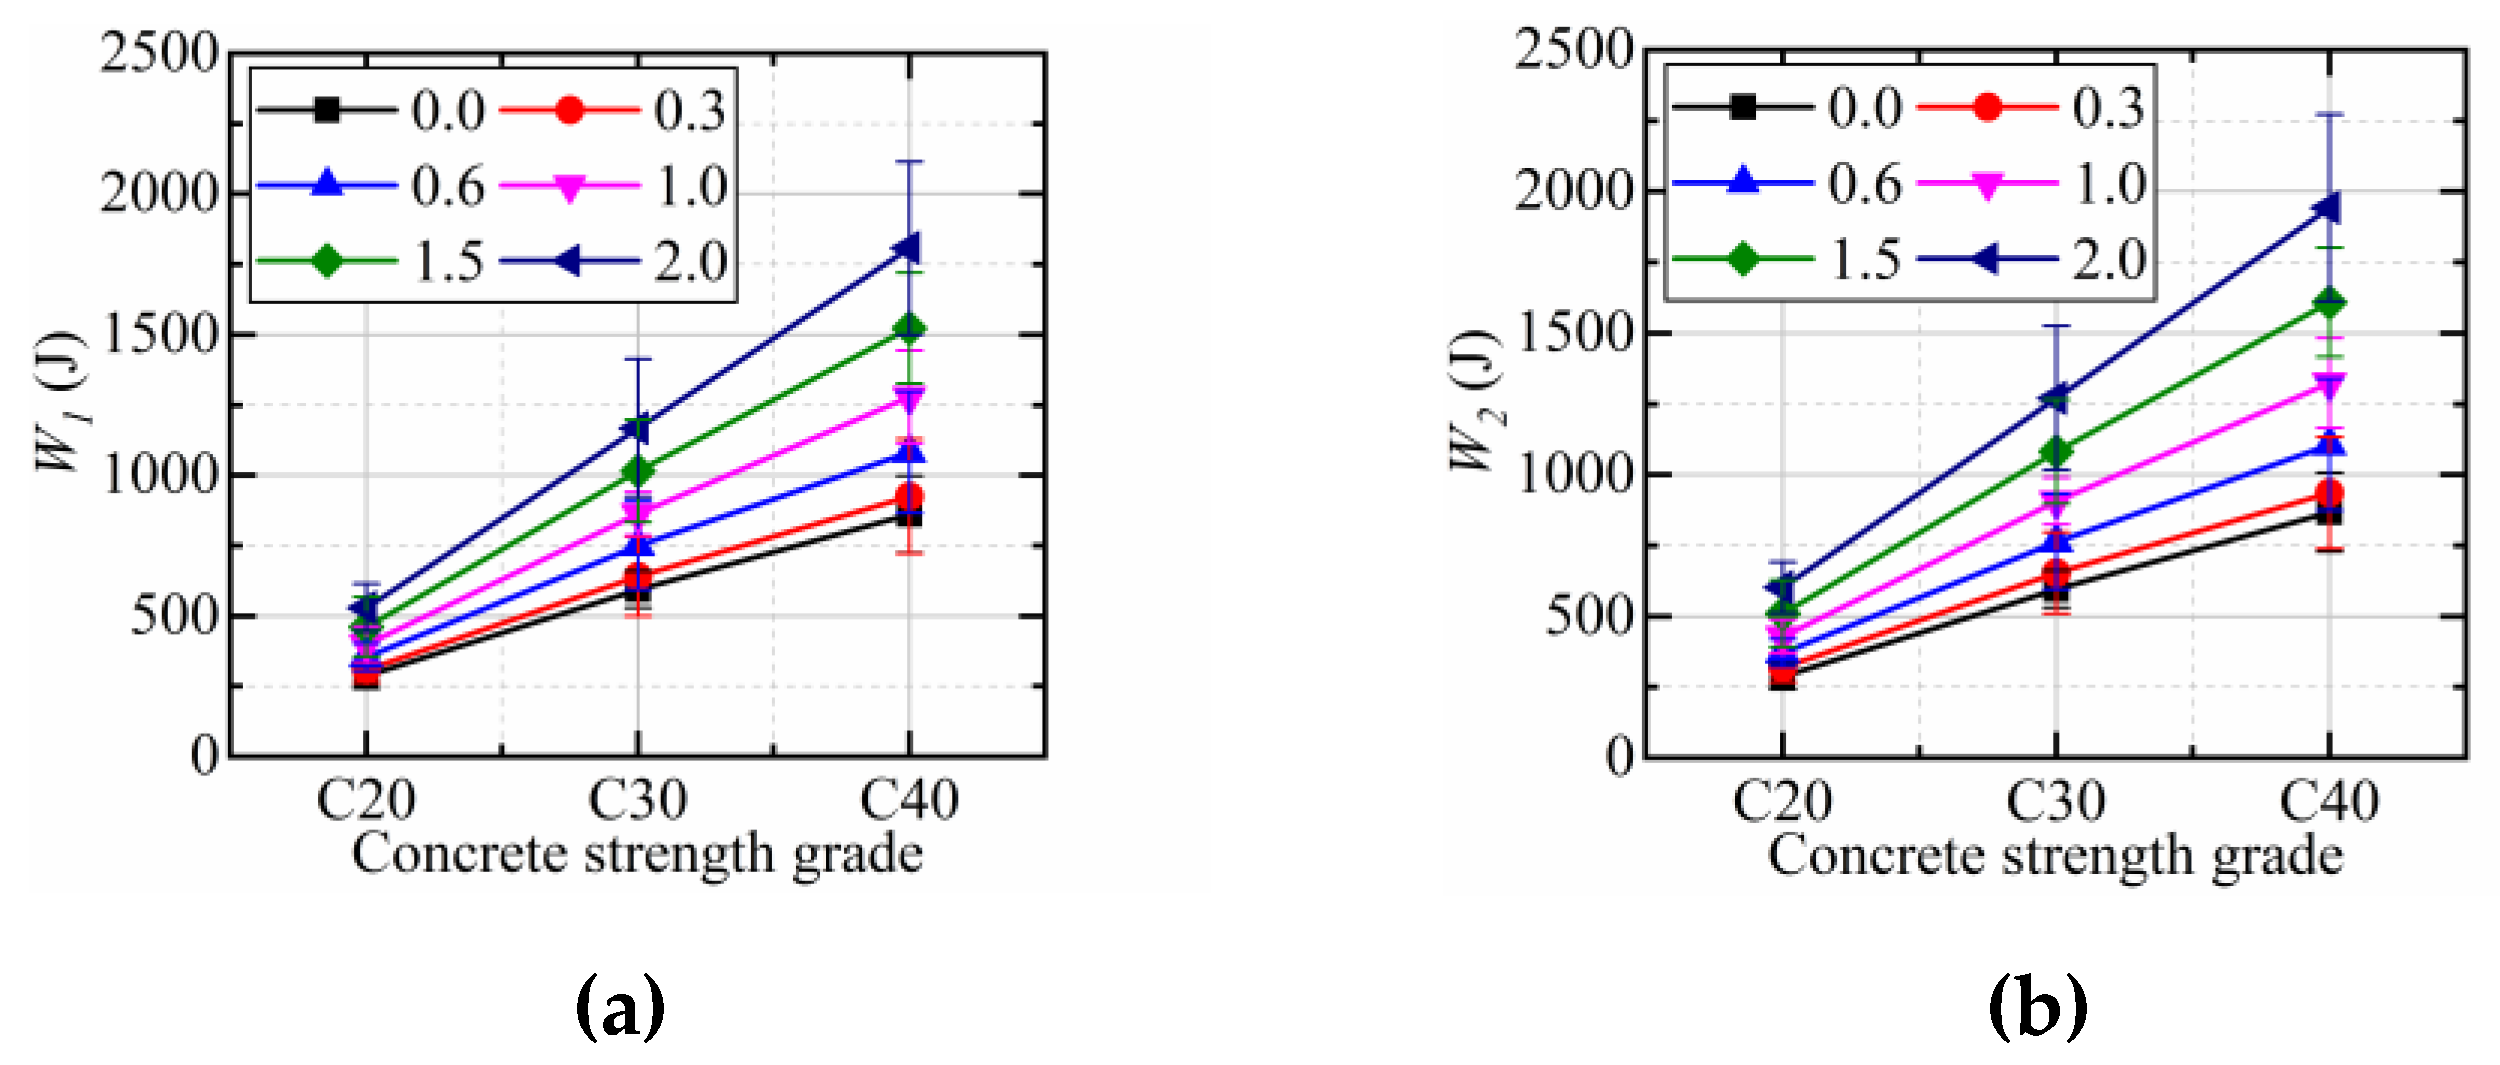
3.3. Effect of Concrete Strength Grade on the Impact Resistance
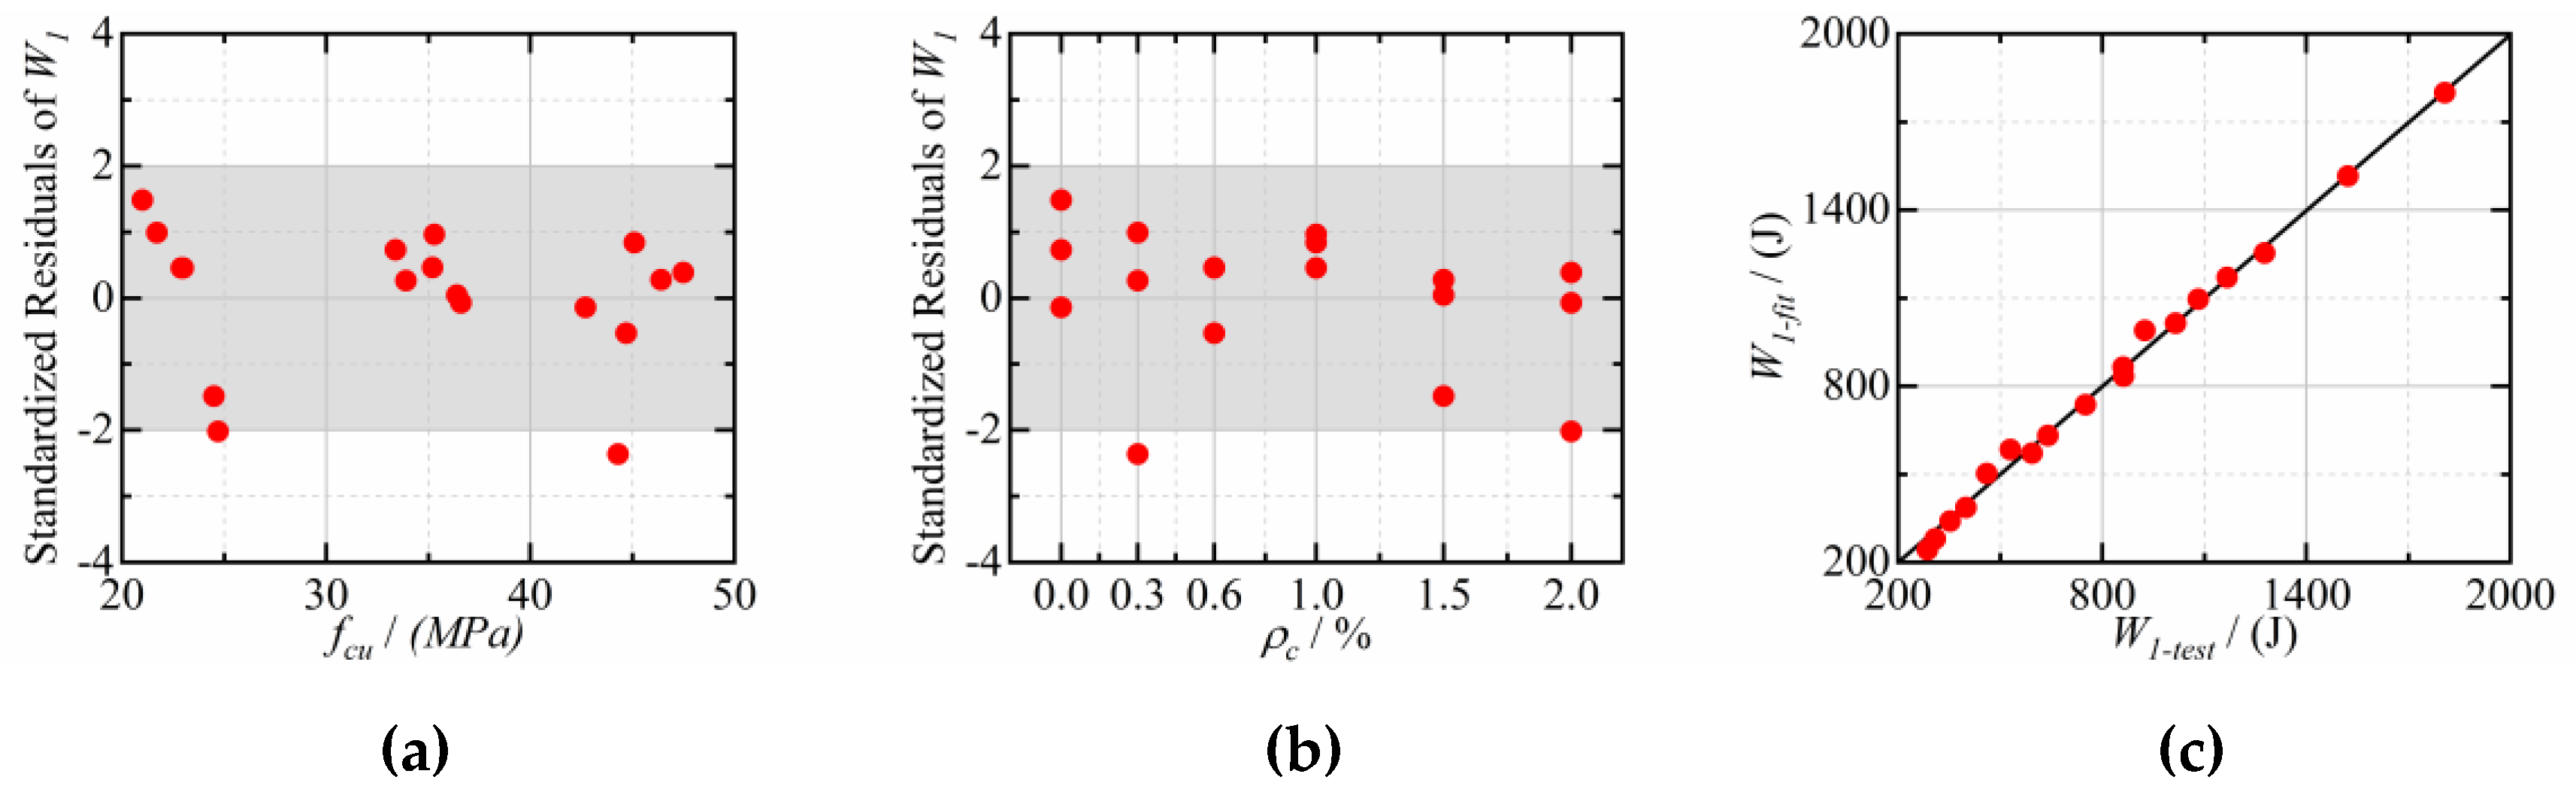
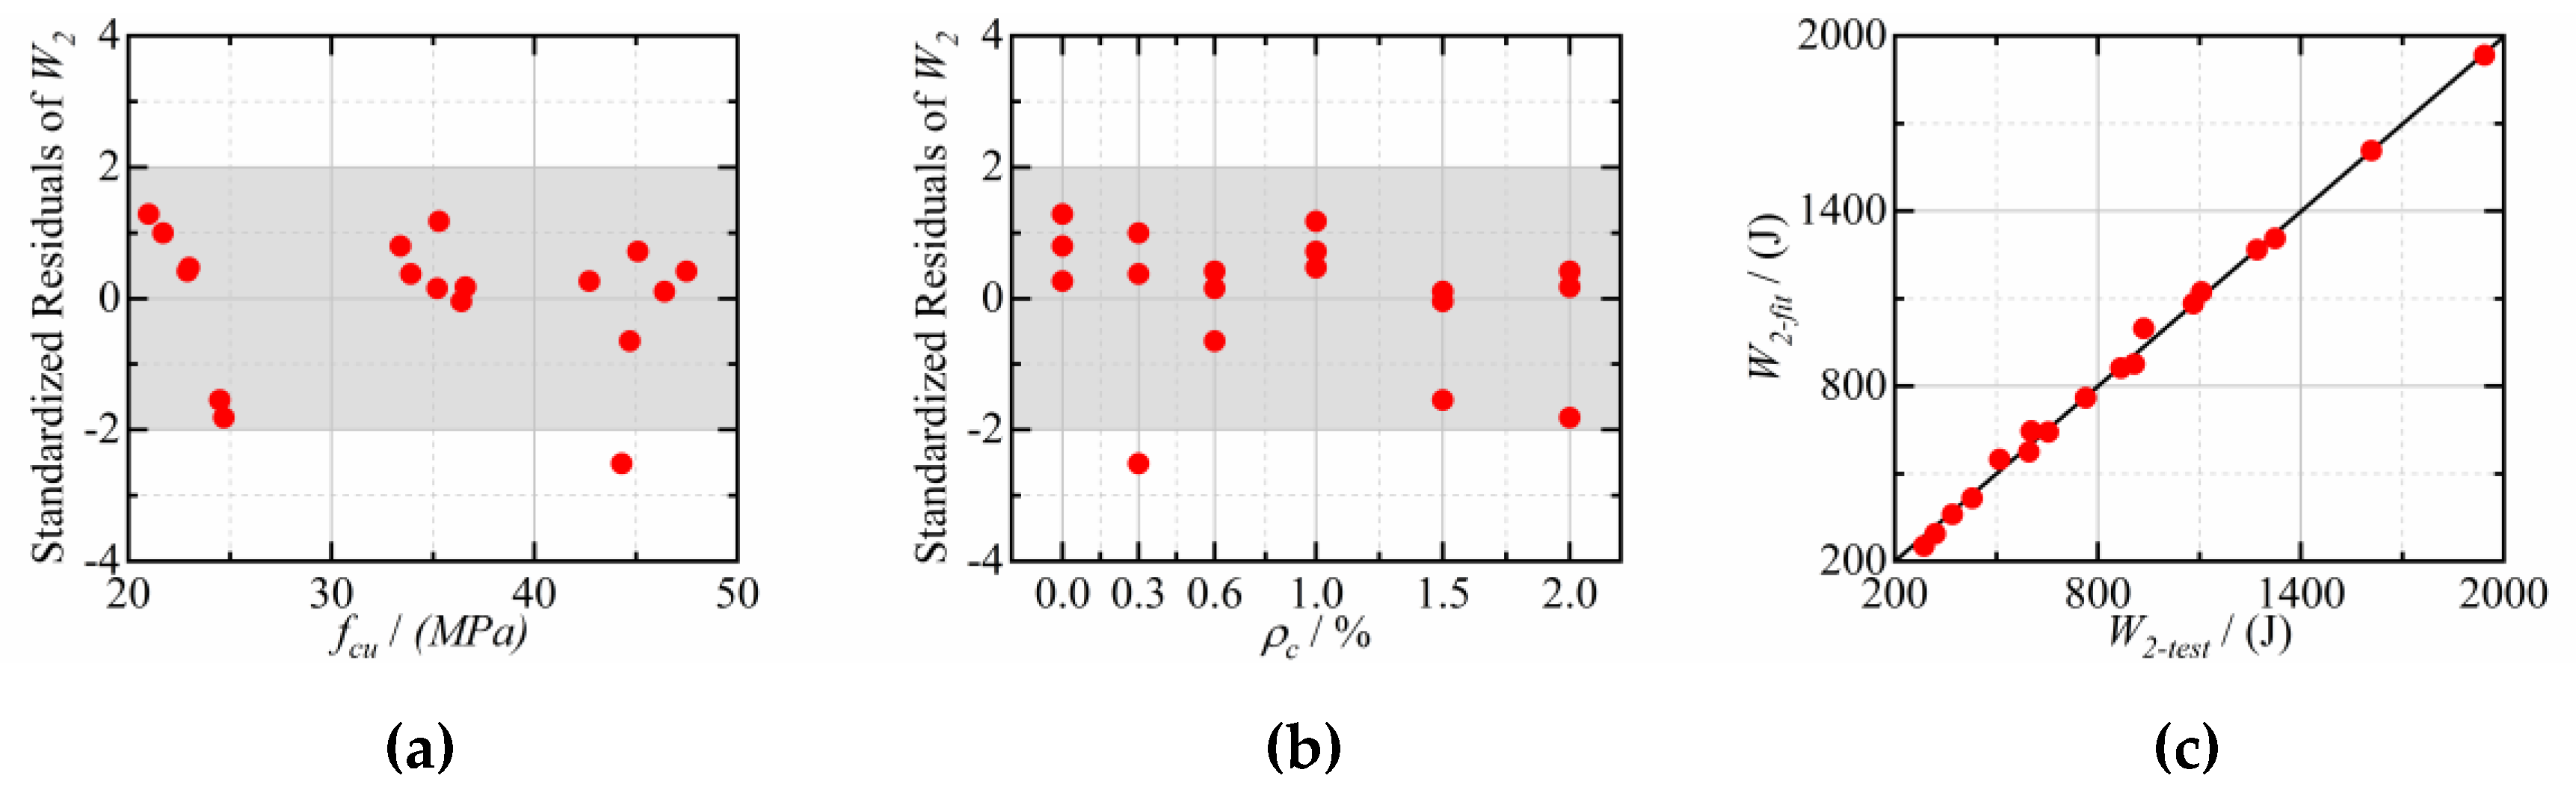
3.4. Correlation between Cube Compressive Strength, CFs Dosage, and Impact Energy
4. Distribution of Impact Resistance Factors
5. Conclusions
- (1)
- The addition of CFs into coral concrete changed the failure pattern of coral concrete specimens under impact loading from obvious brittleness to relatively good ductility.
- (2)
- CF addition can improve the impact resistance at initial crack and final failure of coral concrete. Still, the improvement of the impact resistance after initial cracking due to the addition of CFs is not as significant as steel fibers.
- (3)
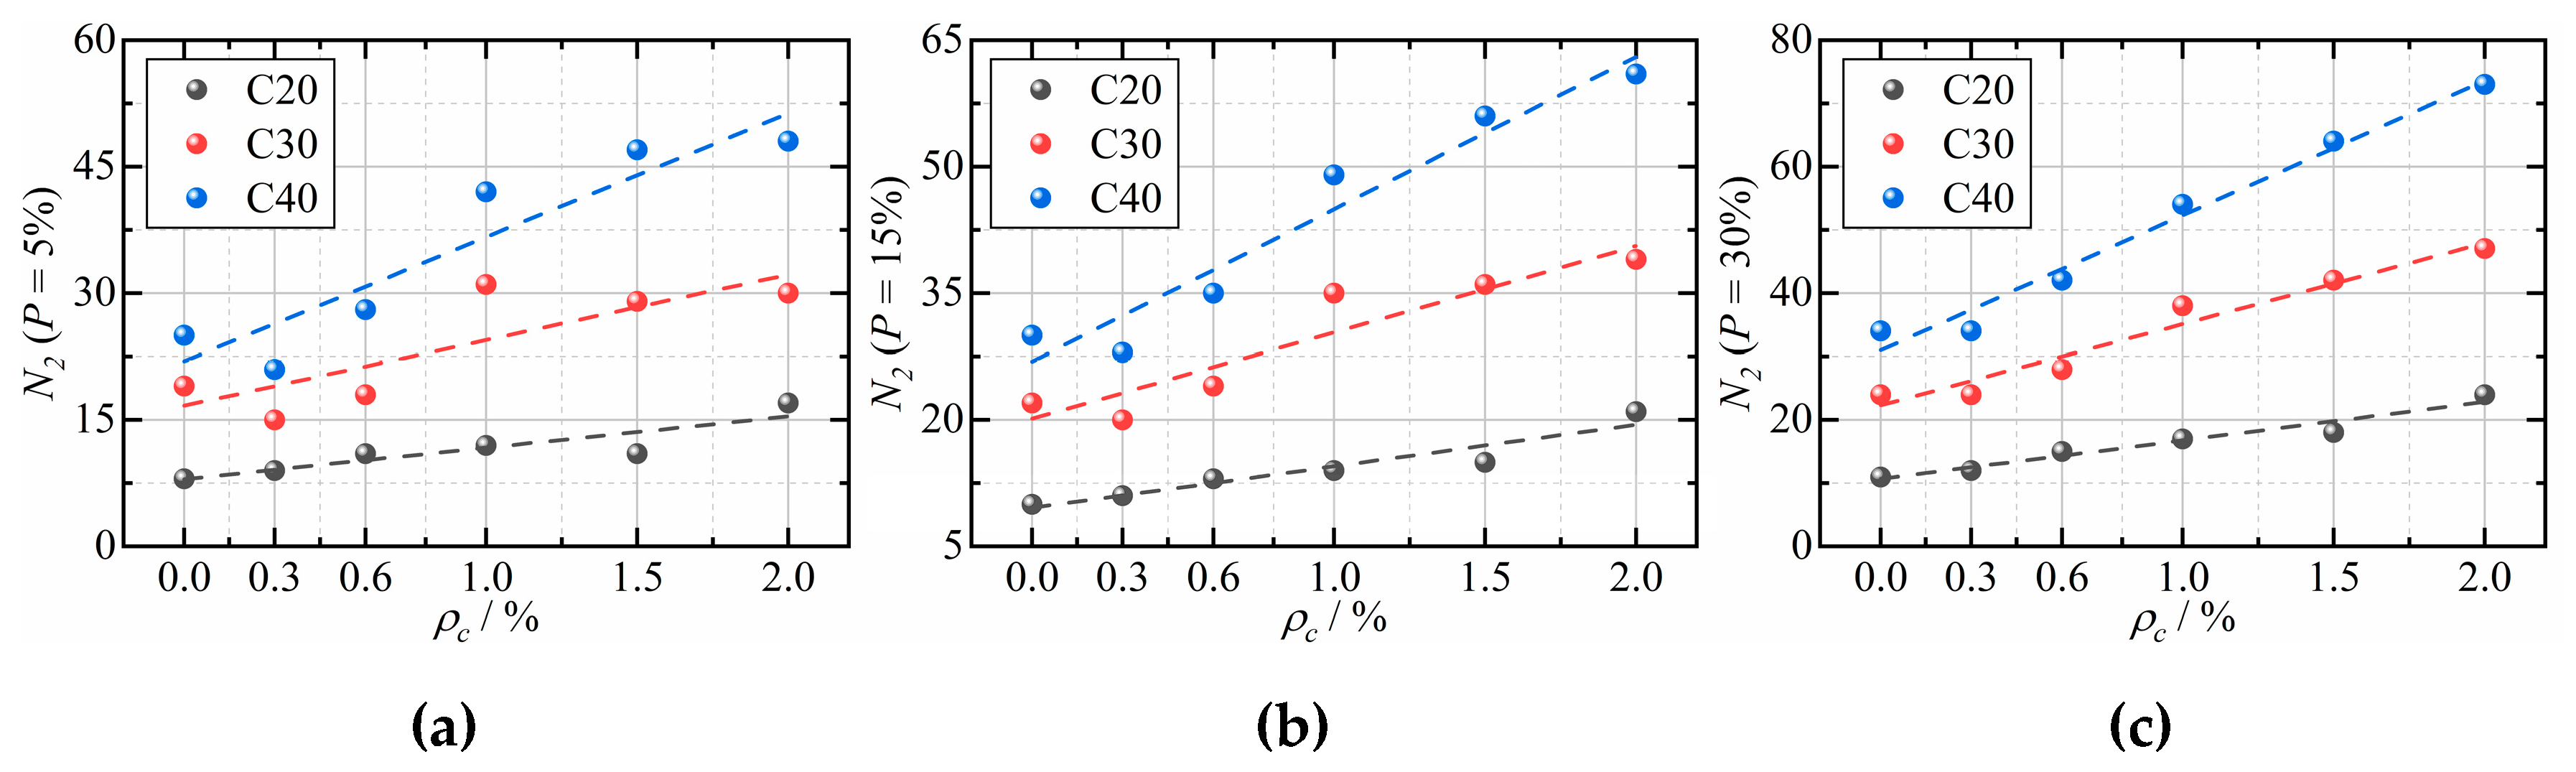
- The impact resistance of CFRCC increases with the increase of CF dosage and concrete strength grade.
- (4)
- The impact energy (W1, and W2) of CFRCC can be evaluated by the cube compressive strength and CFs dosage using Equation (3).
- (5)
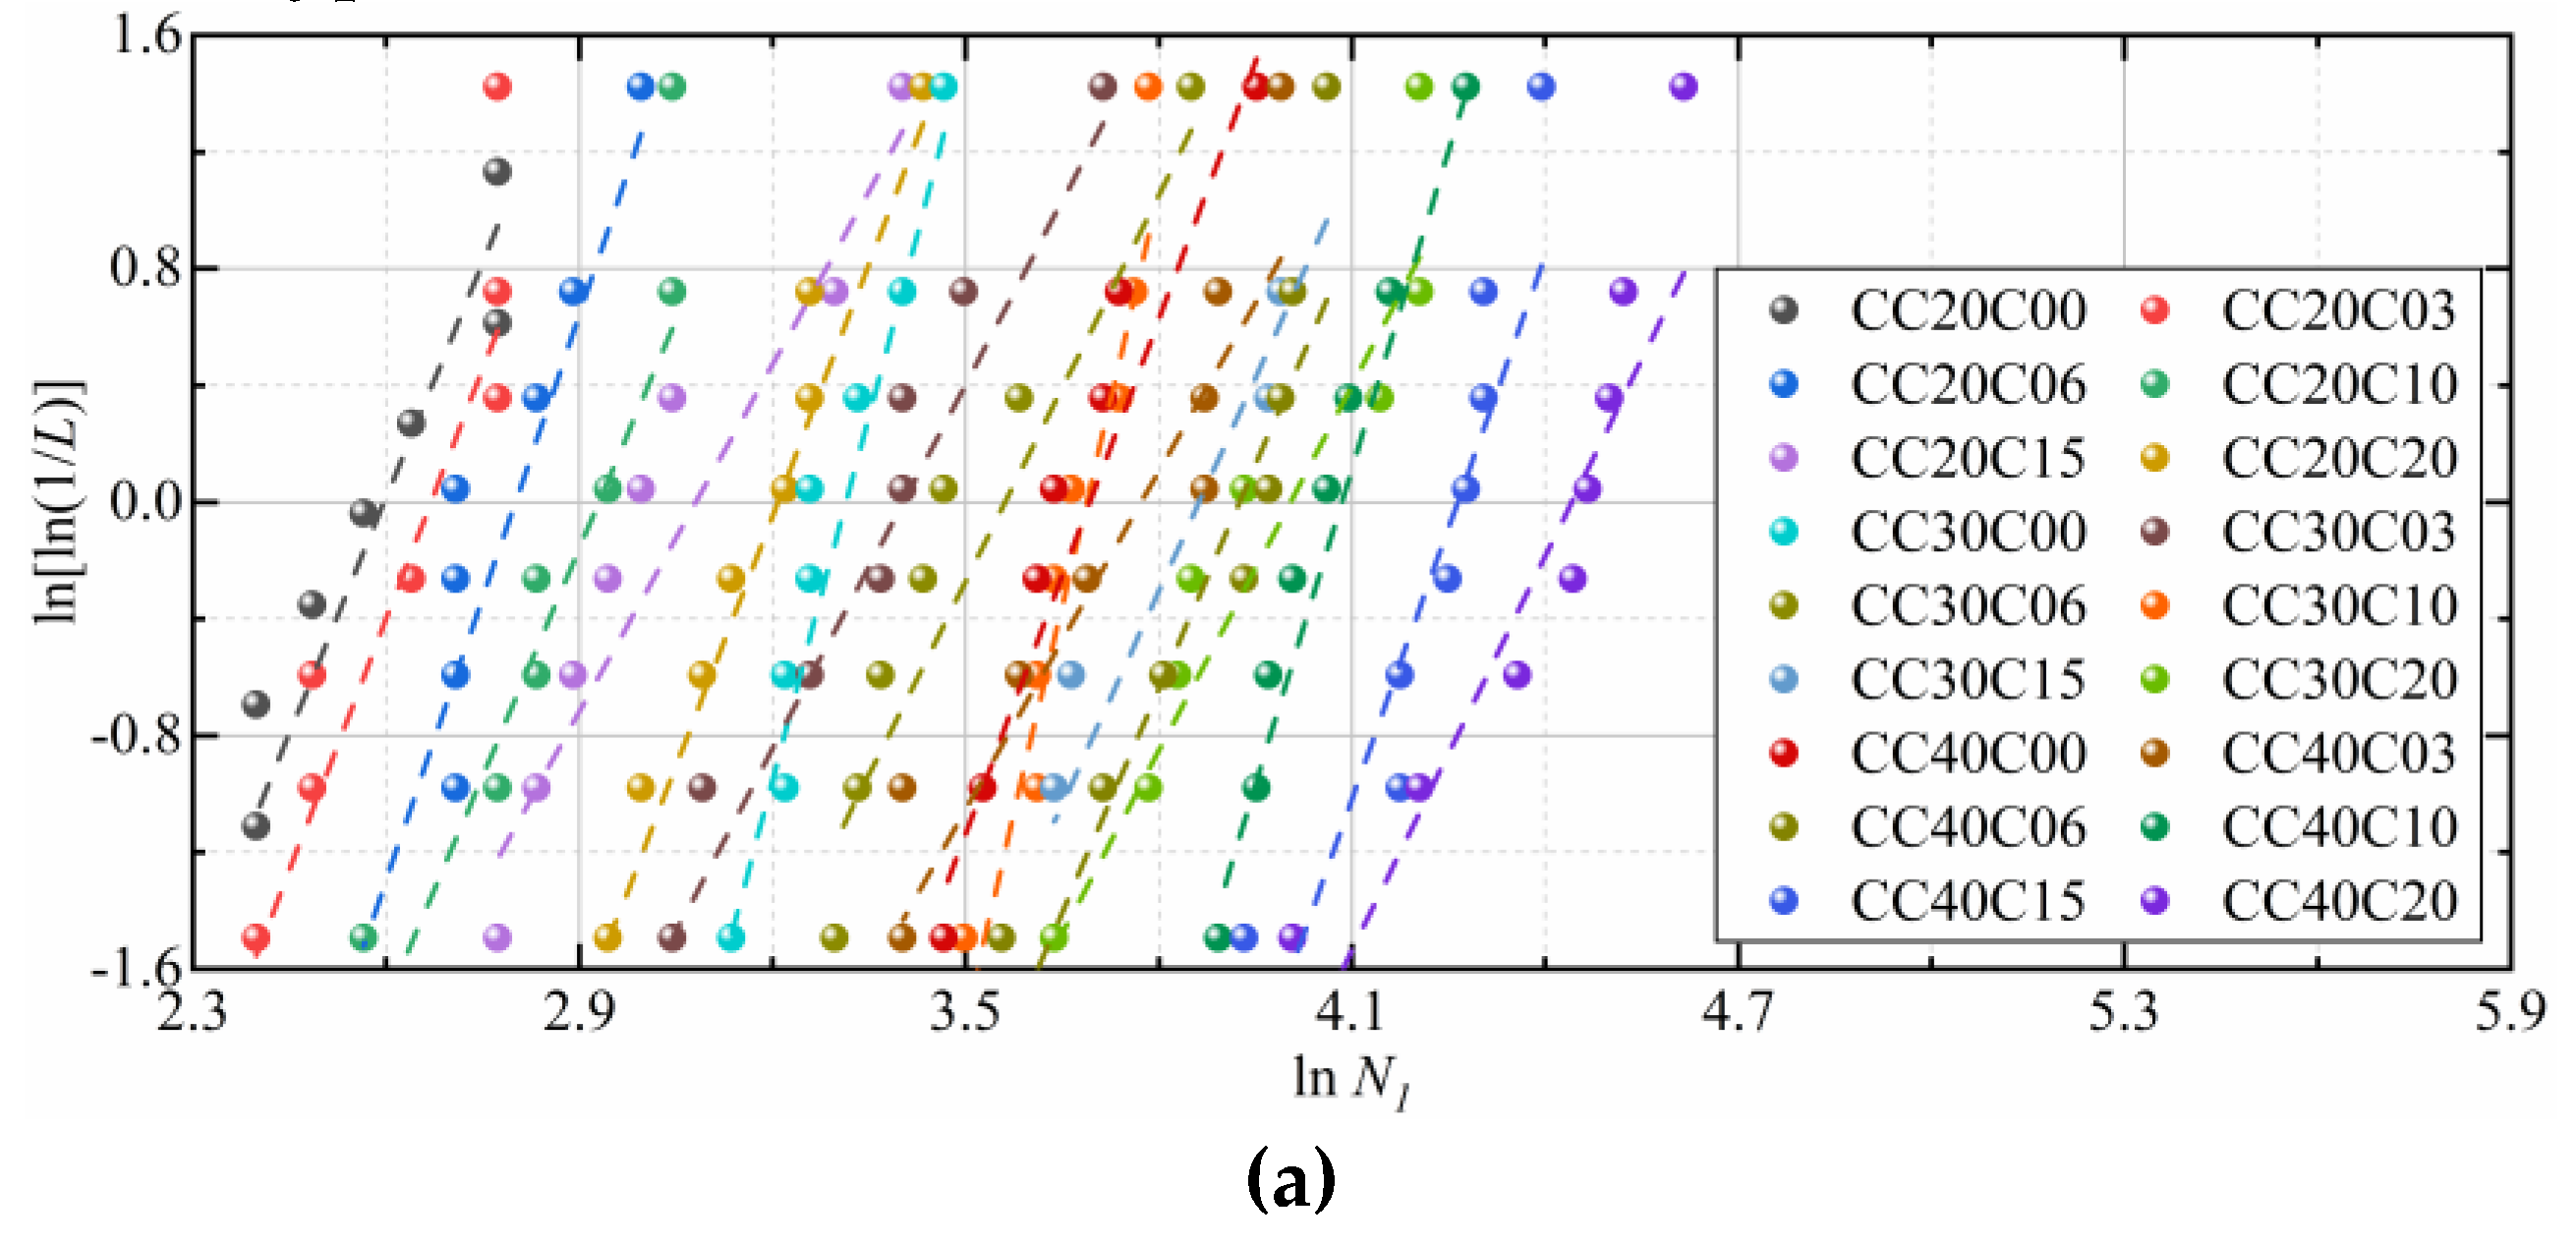
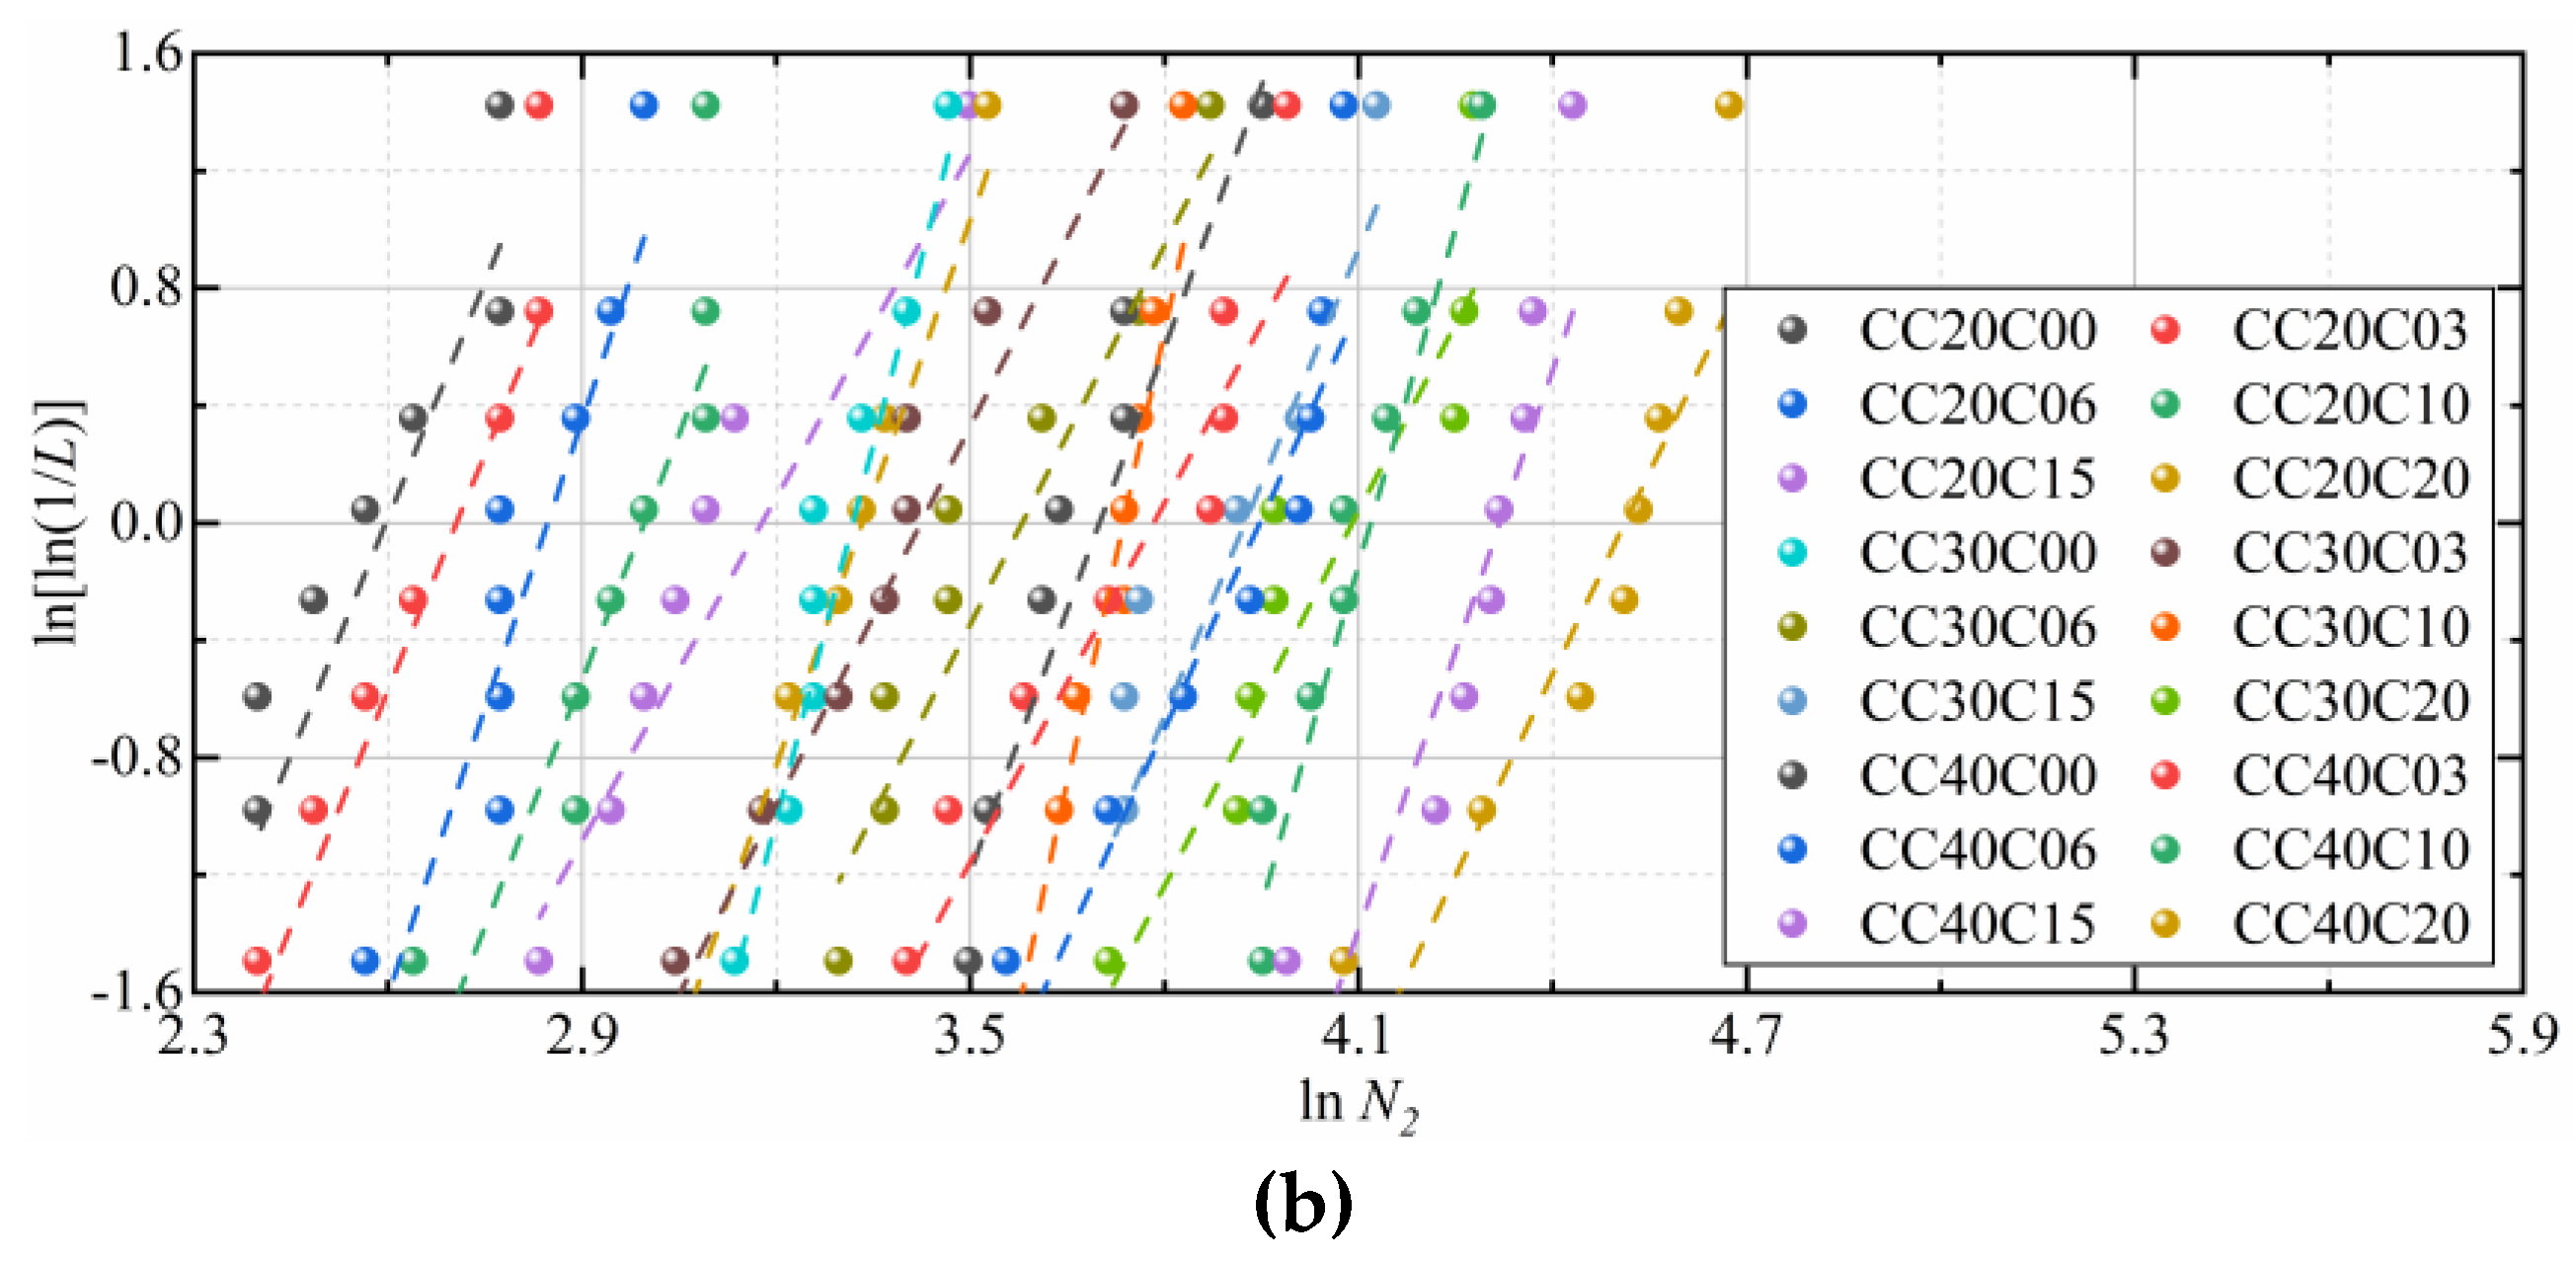
- The two-parameter Weibull distribution theory is proved capable of adequately representing the impact test results, and these developed reliability curves through the two-parameter Weibull distribution theory can be considered a useful tool to investigate the impact resistance of CFRCC quickly.
Author Contributions
Funding
Conflicts of Interest
Appendix A

| No. | 1 | 2 | 3 | 4 | 5 | 6 | 7 | 8 | Mean | Standard Deviation | Coefficient of Variation | |
|---|---|---|---|---|---|---|---|---|---|---|---|---|
| CC20C00 | 11 | 12 | 16 | 11 | 16 | 14 | 11 | 13 | 13.0 | 2.14 | 0.16 | |
| 11 | 12 | 16 | 11 | 16 | 14 | 11 | 13 | 13.0 | 2.14 | 0.16 | ||
| 0 | 0 | 0 | 0 | 0 | 0 | 0 | 0 | 0.0 | 0.00 | 0.00 | ||
| CC20C03 | 16 | 11 | 16 | 16 | 12 | 12 | 14 | 15 | 14.0 | 2.07 | 0.15 | |
| 16 | 11 | 17 | 17 | 12 | 13 | 14 | 16 | 14.5 | 2.33 | 0.16 | ||
| 0 | 0 | 1 | 1 | 0 | 1 | 0 | 1 | 0.5 | 0.79 | 1.59 | ||
| CC20C06 | 13 | 17 | 15 | 20 | 15 | 15 | 15 | 18 | 16.0 | 2.20 | 0.14 | |
| 13 | 18 | 16 | 20 | 16 | 16 | 16 | 19 | 16.8 | 2.19 | 0.13 | ||
| 0 | 1 | 1 | 0 | 1 | 1 | 1 | 1 | 0.8 | 0.45 | 0.60 | ||
| CC20C10 | 13 | 17 | 17 | 19 | 21 | 21 | 21 | 16 | 18.1 | 2.90 | 0.16 | |
| 14 | 19 | 18 | 20 | 22 | 22 | 22 | 18 | 19.4 | 2.77 | 0.14 | ||
| 1 | 2 | 1 | 1 | 1 | 1 | 1 | 2 | 1.3 | 0.34 | 0.27 | ||
| CC20C15 | 18 | 18 | 18 | 19 | 17 | 27 | 30 | 20 | 20.9 | 4.85 | 0.23 | |
| 20 | 20 | 20 | 21 | 18 | 30 | 33 | 23 | 23.1 | 5.41 | 0.23 | ||
| 2 | 2 | 2 | 2 | 1 | 3 | 3 | 3 | 2.3 | 1.26 | 0.56 | ||
| CC20C20 | 22 | 26 | 19 | 25 | 20 | 23 | 26 | 31 | 24.0 | 3.85 | 0.16 | |
| 25 | 29 | 21 | 28 | 24 | 27 | 30 | 34 | 27.3 | 3.99 | 0.15 | ||
| 3 | 3 | 2 | 3 | 4 | 4 | 4 | 3 | 3.3 | 0.84 | 0.26 | ||
| CC30C00 | 32 | 28 | 30 | 25 | 25 | 23 | 26 | 26 | 26.9 | 2.95 | 0.11 | |
| 32 | 28 | 30 | 25 | 26 | 23 | 26 | 26 | 27.0 | 2.88 | 0.11 | ||
| 0 | 0 | 0 | 0 | 1 | 0 | 0 | 0 | 0.1 | 0.28 | 2.26 | ||
| CC30C03 | 33 | 29 | 26 | 22 | 30 | 30 | 41 | 21 | 29.0 | 6.37 | 0.22 | |
| 34 | 29 | 27 | 24 | 30 | 30 | 42 | 21 | 29.6 | 6.39 | 0.22 | ||
| 1 | 0 | 1 | 2 | 0 | 0 | 1 | 0 | 0.6 | 0.77 | 1.22 | ||
| CC30C06 | 28 | 42 | 32 | 36 | 29 | 27 | 31 | 47 | 34.0 | 7.17 | 0.21 | |
| 29 | 43 | 32 | 37 | 29 | 27 | 32 | 48 | 34.6 | 7.46 | 0.22 | ||
| 1 | 1 | 0 | 1 | 0 | 0 | 1 | 1 | 0.6 | 0.81 | 1.29 | ||
| CC30C10 | 33 | 42 | 37 | 44 | 43 | 38 | 37 | 39 | 39.1 | 3.68 | 0.09 | |
| 35 | 43 | 38 | 46 | 44 | 42 | 39 | 42 | 41.1 | 3.56 | 0.09 | ||
| 2 | 1 | 1 | 2 | 1 | 4 | 2 | 3 | 2.0 | 0.95 | 0.48 | ||
| CC30C15 | 39 | 38 | 38 | 58 | 54 | 40 | 53 | 48 | 46.0 | 8.23 | 0.18 | |
| 42 | 41 | 42 | 62 | 57 | 43 | 55 | 50 | 49.0 | 8.18 | 0.17 | ||
| 3 | 3 | 4 | 4 | 3 | 3 | 2 | 2 | 3.0 | 0.70 | 0.23 | ||
| CC30C20 | 51 | 44 | 38 | 67 | 46 | 63 | 67 | 47 | 52.9 | 11.26 | 0.21 | |
| 53 | 51 | 41 | 72 | 50 | 71 | 70 | 53 | 57.6 | 11.71 | 0.20 | ||
| 2 | 7 | 3 | 5 | 4 | 8 | 3 | 6 | 4.8 | 2.58 | 0.54 | ||
| CC40C00 | 36 | 38 | 32 | 42 | 52 | 41 | 34 | 37 | 39.0 | 6.21 | 0.16 | |
| 36 | 38 | 33 | 42 | 52 | 42 | 34 | 37 | 39.3 | 6.11 | 0.16 | ||
| 0 | 0 | 1 | 0 | 0 | 1 | 0 | 0 | 0.3 | 0.36 | 1.46 | ||
| CC40C03 | 48 | 30 | 54 | 40 | 49 | 48 | 30 | 36 | 41.9 | 9.20 | 0.22 | |
| 48 | 32 | 54 | 41 | 49 | 49 | 30 | 36 | 42.4 | 8.93 | 0.21 | ||
| 0 | 2 | 0 | 1 | 0 | 1 | 0 | 0 | 0.5 | 0.48 | 0.96 | ||
| CC40C06 | 28 | 55 | 51 | 49 | 41 | 55 | 55 | 58 | 49.0 | 9.99 | 0.20 | |
| 28 | 57 | 52 | 50 | 42 | 56 | 57 | 59 | 50.1 | 10.47 | 0.21 | ||
| 0 | 2 | 1 | 1 | 1 | 1 | 2 | 1 | 1.1 | 1.12 | 1.00 | ||
| CC40C10 | 72 | 58 | 55 | 53 | 64 | 60 | 49 | 52 | 57.9 | 7.43 | 0.13 | |
| 73 | 59 | 59 | 56 | 66 | 63 | 52 | 52 | 60.0 | 7.17 | 0.12 | ||
| 1 | 1 | 4 | 3 | 2 | 3 | 3 | 0 | 2.1 | 1.09 | 0.51 | ||
| CC40C15 | 74 | 51 | 72 | 81 | 74 | 70 | 65 | 65 | 69.0 | 8.94 | 0.13 | |
| 78 | 54 | 75 | 84 | 79 | 74 | 68 | 71 | 72.9 | 9.08 | 0.12 | ||
| 4 | 3 | 3 | 3 | 5 | 4 | 3 | 6 | 3.9 | 1.26 | 0.33 | ||
| CC40C20 | 92 | 83 | 67 | 87 | 85 | 90 | 96 | 55 | 81.9 | 13.88 | 0.17 | |
| 99 | 91 | 73 | 93 | 91 | 96 | 102 | 59 | 88.0 | 14.59 | 0.17 | ||
| 7 | 8 | 6 | 6 | 6 | 6 | 6 | 4 | 6.1 | 1.83 | 0.30 | ||
References
- Lyu, B.; Wang, A.; Zhang, Z.; Liu, K.; Xu, H.; Shi, L.; Sun, D. Coral aggregate concrete: Numerical description of physical, chemical and morphological properties of coral aggregate. Cem. Concr. Compos. 2019, 100, 25–34. [Google Scholar] [CrossRef]
- Yang, S.; Yang, C.; Huang, M.; Liu, Y.; Jiang, J.; Fan, G. Study on bond performance between frp bars and seawater coral aggregate concrete. Constr. Build. Mater. 2018, 173, 272–288. [Google Scholar] [CrossRef]
- Wang, Q.; Li, P.; Tian, Y.; Chen, W.; Su, C. Mechanical properties and microstructure of portland cement concrete prepared with coral reef sand. J. Wuhan Univ. Technol. Mat. Sci. Ed. 2016, 31, 996–1001. [Google Scholar] [CrossRef]
- Ma, L.; Li, Z.; Liu, J.; Duan, L.; Wu, J. Mechanical properties of coral concrete subjected to uniaxial dynamic compression. Constr. Build. Mater. 2019, 199, 244–255. [Google Scholar] [CrossRef]
- Wang, Y.; Zhang, S.; Niu, D.; Su, L.; Luo, D. Effects of silica fume and blast furnace slag on the mechanical properties and chloride ion distribution of coral aggregate concrete. Constr. Build. Mater. 2019, 214, 648–658. [Google Scholar] [CrossRef]
- Ehlert, R. Coral Concrete at Bikini Atoll. Concr. Int. 1991, 13, 19–24. [Google Scholar]
- Tang, J.; Cheng, H.; Zhang, Q.; Chen, W.; Li, Q. Development of properties and microstructure of concrete with coral reef sand under sulphate attack and drying-wetting cycles. Constr. Build. Mater. 2018, 165, 647–654. [Google Scholar] [CrossRef]
- Wang, Y.; Shui, Z.; Gao, X.; Huang, Y.; Yu, R.; Li, X.; Yang, R. Utilizing coral waste and metakaolin to produce eco-friendly marine mortar: Hydration, mechanical properties and durability. J. Clean. Prod. 2019, 219, 763–774. [Google Scholar] [CrossRef]
- Liu, J.; Ou, Z.; Peng, W.; Guo, T.; Deng, W.; Chen, Y. Literature review of coral concrete. Arab. J. Sci. Eng. 2018, 43, 1529–1541. [Google Scholar] [CrossRef]
- Howdyshell, P.A. The Use of Coral as an Aggregate for Portland Cement Concrete Structures; No. CERL-TR-M-88; Construction Engineering Research Lab (Army): Champaign, IL, USA, June 1974. [Google Scholar]
- Dempsey, G. Coral and salt water as concrete materials. J. Proc. 1951, 48, 157–166. [Google Scholar]
- Da, B.; Yu, H.; Ma, H.; Tan, Y.; Mi, R.; Dou, X. Chloride diffusion study of coral concrete in a marine environment. Constr. Build. Mater. 2016, 123, 47–58. [Google Scholar] [CrossRef]
- Arumugam, R.A.; Ramamurthy, K. Study of compressive strength characteristics of coral aggregate concrete. Mag. Concr. Res. 1996, 48, 141–148. [Google Scholar] [CrossRef]
- Shen, J. Experimental study on compressive strength of coral aggregate concrete mixed with seawater. Soil Eng. Found. 2016, 30, 524–526. [Google Scholar]
- Wei, Z.; Li, Z.; Shen, J. Research on the influencing factors of performance of coral concrete and its early mechanical property. Ind. Constr. 2017, 47, 130–136. [Google Scholar]
- Mi, R.J.; Yu, H.F.; Ma, H.Y.; Da, B.; Yuan, Y.F.; Zhang, X.P.; Zhu, H.W.; Dou, X.M. Study on the mechanical property of coral concrete. Ocean Eng. 2016, 34, 47–54. [Google Scholar]
- Da, B.; Yu, H.; Ma, H.; Tan, Y.; Mi, R.; Dou, X. Experimental investigation of whole stress-strain curves of coral concrete. Constr. Build. Mater. 2016, 122, 81–89. [Google Scholar] [CrossRef]
- Li, Y.; Zhou, L.; Zhang, Y.; Cui, J.; Shao, J. Study on long-term performance of concrete based on seawater, sea sand and coral sand. Adv. Mater. Res. 2013, 706, 512–515. [Google Scholar] [CrossRef]
- Lei, W.; Zujing, X.; Cunkeng, L.; Quanlong, L. Mechanical property tests of coral concrete with polypropylene fiber. Concrete 2014, 7, 96–99. [Google Scholar]
- Cheng, S.; Shui, Z.; Sun, T.; Yu, R.; Zhang, G. Durability and microstructure of coral sand concrete incorporating supplementary cementitious materials. Constr. Build. Mater. 2018, 171, 44–53. [Google Scholar] [CrossRef]
- Gold, E.; Chao, L.; Lei, W. Experimental study on shock resistance of polypropylene fiber reinforced coral concrete. Sci. Technol. Eng. 2019, 19, 244–248. [Google Scholar]
- Zhang, M.H.; Li, L.; Paramasivam, P. Flexural toughness and impact resistance of steel-fibre-reinforced lightweight concrete. Mag. Concr. Res. 2004, 56, 251–262. [Google Scholar] [CrossRef]
- Agostinacchio, M.; Ciampa, D.; Olita, S. The vibrations induced by surface irregularities in road pavements—A matlab ® approach. Eur. Transp. Res. Rev. 2014, 6, 267–275. [Google Scholar] [CrossRef]
- Naraganti, S.R.; Pannem, R.M.R.; Putta, J. Impact resistance of hybrid fibre reinforced concrete containing sisal fibres. Ain Shams Eng. J. 2019, 10, 297–305. [Google Scholar] [CrossRef]
- Mahakavi, P.; Chithra, R. Impact resistance, microstructures and digital image processing on self-compacting concrete with hooked end and crimped steel fiber. Constr. Build. Mater. 2019, 220, 651–666. [Google Scholar] [CrossRef]
- Feng, J.; Sun, W.; Zhai, H.; Wang, L.; Dong, H.; Wu, Q. Experimental study on hybrid effect evaluation of fiber reinforced concrete subjected to drop weight impacts. Materials 2018, 11, 2563. [Google Scholar] [CrossRef]
- Mastali, M.; Dalvand, A.; Sattarifard, A. The impact resistance and mechanical properties of the reinforced self-compacting concrete incorporating recycled cfrp fiber with different lengths and dosages. Compos. Part B Eng. 2017, 112, 74–92. [Google Scholar] [CrossRef]
- Han, B.; Zhang, L.; Zhang, C.; Wang, Y.; Yu, X.; Ou, J. Reinforcement effect and mechanism of carbon fibers to mechanical and electrically conductive properties of cement-based materials. Constr. Build. Mater. 2016, 125, 479–489. [Google Scholar] [CrossRef]
- Rodin, H.I.; Rangelov, M.; Nassiri, S.; Englund, K. Enhancing mechanical properties of pervious concrete using carbon fiber composite reinforcement. J. Mater. Civ. Eng. 2018, 30, 040180123. [Google Scholar] [CrossRef]
- Li, M.; Yang, Y.; Liu, M.; Guo, X.; Zhou, S. Hybrid effect of calcium carbonate whisker and carbon fiber on the mechanical properties and microstructure of oil well cement. Constr. Build. Mater. 2015, 93, 995–1002. [Google Scholar] [CrossRef]
- Han, B.; Wang, Y.; Dong, S.; Zhang, L.; Ding, S.; Yu, X.; Ou, J. Smart concretes and structures: A review. J. Intell. Mater. Syst. Struct. 2015, 26, 1303–1345. [Google Scholar] [CrossRef]
- Bentur, A.; Mindess, S. Fibre Reinforced Cementitious Composites; CRC Press: Boca Raton, FL, USA, 2006. [Google Scholar]
- Banyhussan, Q.S.; Yıldırım, G.; Anıl, Ö.; Erdem, R.T.; Ashour, A.; Şahmaran, M. Impact resistance of deflection-hardening fiber reinforced concretes with different mixture parameters. Struct. Concr. 2019, 20, 1036–1050. [Google Scholar] [CrossRef]
- Standardization, C.A.F.E. Standard Test Methods for Fiber Reinforced Concrete; China Planning Press: Beijing, China, 2009. [Google Scholar]
- Pu, W.; Zhen, H.; Dai, Z.; Dong, W.X.; Chang, Z. Impact mechanical properties of concrete reinforced with hybrid carbon fibers. J. Vib. Shock 2012, 31, 14–18. [Google Scholar]
- Ding, Y.; Li, D.; Zhang, Y.; Azevedo, C. Experimental investigation on the composite effect of steel rebars and macro fibers on the impact behavior of high performance self-compacting concrete. Constr. Build. Mater. 2017, 136, 495–505. [Google Scholar] [CrossRef]
- China, S.A.O.T. Common Portland Cement; China Architecture& Building Press: Beijing, China, 2007. [Google Scholar]
- China, S.A.O.T. Lightweight Aggregates and its Test methods—Part 2: Test Methods for Lightweight Aggregates; China Architecture& Building Press: Beijing, China, 2010. [Google Scholar]
- China, M.O.C.O. Standard for Technical Requirements and Test Method of Sand and Crushed Stone (or Gravel) for Ordinary Concrete; China Architecture& Building Press: Beijing, China, 2006. [Google Scholar]
- China, M.O.C.O. Technical Specification for Lightweight Aggregate Concrete; China Architecture& Building Press: Beijing, China, 2002. [Google Scholar]
- Cheng, S.; Shui, Z.; Yu, R.; Sun, T.; Zhang, X. Multiple influences of internal curing and supplementary cementitious materials on the shrinkage and microstructure development of reefs aggregate concrete. Constr. Build. Mater. 2017, 155, 522–530. [Google Scholar] [CrossRef]
- Chen, F.; Zhang, G.; Ding, S.; Qing, M. Half-dry coral sand concrete preparation technology under natural conditions. China Harb. Eng. 2017, 37, 68–72. [Google Scholar]
- China, M.O.C.O. Standard for Test Method of Mechanical Properties on Ordinary Concrete; China Architecture& Building Press: Beijing, China, 2002. [Google Scholar]
- ACI Committee 544. Measurement of Properties of Fiber Reinforced Concrete. Materials Journal 1988, 85, 583–593.
- Li, D.; Tao, J.; Jia, B. Experimental study on the effect of impact resistance of basalt fiber reinforced concrete. New Build. Mater. 2012, 39, 47–51. [Google Scholar]
- Ali, M.A.E.M.; Soliman, A.M.; Nehdi, M.L. Hybrid-fiber reinforced engineered cementitious composite under tensile and impact loading. Mater. Des. 2017, 117, 139–149. [Google Scholar] [CrossRef]
- Wang, J.; Feng, P.; Hao, T.; Yue, Q. Axial compressive behavior of seawater coral aggregate concrete-filled FRP tubes. Constr. Build. Mater. 2017, 147, 272–285. [Google Scholar] [CrossRef]
- Zhang, W.; Chen, S.; Liu, Y. Effect of weight and drop height of hammer on the flexural impact performance of fiber-reinforced concrete. Constr. Build. Mater. 2017, 140, 31–35. [Google Scholar] [CrossRef]
- Rahmani, T.; Kiani, B.; Shekarchi, M.; Safari, A. Statistical and experimental analysis on the behavior of fiber reinforced concretes subjected to drop weight test. Constr. Build. Mater. 2012, 37, 360–369. [Google Scholar] [CrossRef]
- Murali, G.; Asrani, N.P.; Ramkumar, V.R.; Siva, A.; Haridharan, M.K. Impact resistance and strength reliability of novel two-stage fibre-reinforced concrete. Arab. J. Sci. Eng. 2019, 44, 4477–4490. [Google Scholar] [CrossRef]
- AbdelAleem, B.H.; Ismail, M.K.; Hassan, A.A.A. The combined effect of crumb rubber and synthetic fibers on impact resistance of self-consolidating concrete. Constr. Build. Mater. 2018, 162, 816–829. [Google Scholar] [CrossRef]
- Chen, X.Y.; Ding, Y.N.; Azevedo, C. Combined effect of steel fibres and steel rebars on impact resistance of high performance concrete. J. Cent. South Univ. 2011, 18, 1677–1684. [Google Scholar] [CrossRef] [Green Version]
- Arora, S.; Singh, S.P. Analysis of flexural fatigue failure of concrete made with 100% coarse recycled concrete aggregates. Constr. Build. Mater. 2016, 102, 782–791. [Google Scholar] [CrossRef]
- Nataraja, M.C.; Dhang, N.; Gupta, A.P. Statistical variations in impact resistance of steel fiber-reinforced concrete subjected to drop weight test. Cem. Concr. Res. 1999, 29, 989–995. [Google Scholar] [CrossRef]
- Song, P.S.; Wu, J.C.; Hwang, S.; Sheu, B.C. Assessment of statistical variations in impact resistance of high-strength concrete and high-strength steel fiber-reinforced concrete. Cem. Concr. Res. 2005, 35, 393–399. [Google Scholar] [CrossRef]
- Badr, A.; Ashour, A.F.; Platten, A.K. Statistical variations in impact resistance of polypropylene fibre-reinforced concrete. Int. J. Impact Eng. 2006, 32, 1907–1920. [Google Scholar] [CrossRef] [Green Version]


| Bulk Density (kg/m3) | Apparent Density (kg/m3) | Void Content (%) | Water Content (%) | Tube Compressive Strength (MPa) | Dust Content (%) | Particle Shape Factor | ||
|---|---|---|---|---|---|---|---|---|
| 1 h | 24 h | |||||||
| 915 | 1841 | 50 | 8.5 | 11.0 | 2.6 | 3.1 | 2.9 | 2.4 |
| Bulk Density (kg/m3) | Apparent Density (kg/m3) | Graduation | Fineness Modulus | Water | Dust Content | |
|---|---|---|---|---|---|---|
| 1296 | 2707 | II | 3.0 | 2.9 | 3.7 | 0.5 |
| Strength Grade | Cement (kg) | Net W/C1 | Net Water (kg) | Additional Water (kg) | Coral Coarse Aggregates (kg) | Coral Sand (kg) |
|---|---|---|---|---|---|---|
| CC20C00 | 380 | 0.53 | 200 | 5.8 | 774 | 674 |
| CC30C00 | 480 | 0.38 | 180 | 5.8 | 774 | 674 |
| CC40C00 | 650 | 0.28 | 180 | 5.8 | 774 | 674 |
| No. | Average (MPa) | Standard Deviation | Coefficient of Variation |
|---|---|---|---|
| CC20C00 | 21.0 | 3.08 | 0.15 |
| CC20C03 | 21.7 | 1.83 | 0.08 |
| CC20C06 | 22.9 | 1.34 | 0.06 |
| CC20C10 | 23.0 | 2.02 | 0.09 |
| CC20C15 | 24.5 | 2.12 | 0.09 |
| CC20C20 | 24.7 | 0.42 | 0.02 |
| CC30C00 | 33.4 | 0.91 | 0.03 |
| CC30C03 | 33.9 | 2.52 | 0.07 |
| CC30C06 | 35.2 | 3.56 | 0.10 |
| CC30C10 | 35.3 | 1.56 | 0.04 |
| CC30C15 | 36.4 | 1.39 | 0.04 |
| CC30C20 | 36.6 | 4.69 | 0.13 |
| CC40C00 | 42.7 | 4.91 | 0.11 |
| CC40C03 | 44.3 | 2.16 | 0.05 |
| CC40C06 | 44.7 | 1.04 | 0.02 |
| CC40C10 | 45.1 | 2.03 | 0.05 |
| CC40C15 | 46.4 | 2.77 | 0.06 |
| CC40C20 | 47.5 | 2.59 | 0.05 |
| No. | Average Number of Blows | Standard Deviation | Coefficient of Variation | ||||||||
|---|---|---|---|---|---|---|---|---|---|---|---|
| CC20C00 | 13.0 | 13.0 | 0.0 | 2.14 | 2.14 | 0.00 | 0.16 | 0.16 | 0.00 | 287 | 287 |
| CC20C03 | 14.0 | 14.5 | 0.5 | 2.07 | 2.33 | 0.79 | 0.15 | 0.16 | 1.59 | 309 | 320 |
| CC20C06 | 16.0 | 16.8 | 0.8 | 2.20 | 2.19 | 0.45 | 0.14 | 0.13 | 0.60 | 353 | 371 |
| CC20C10 | 18.1 | 19.4 | 1.3 | 2.90 | 2.77 | 0.34 | 0.16 | 0.14 | 0.27 | 400 | 428 |
| CC20C15 | 20.9 | 23.1 | 2.3 | 4.85 | 5.41 | 1.26 | 0.23 | 0.23 | 0.56 | 461 | 510 |
| CC20C20 | 24.0 | 27.3 | 3.3 | 3.85 | 3.99 | 0.84 | 0.16 | 0.15 | 0.26 | 530 | 603 |
| CC30C00 | 26.9 | 27.0 | 0.1 | 2.95 | 2.88 | 0.28 | 0.11 | 0.11 | 2.26 | 594 | 596 |
| CC30C03 | 29.0 | 29.6 | 0.6 | 6.37 | 6.39 | 0.77 | 0.22 | 0.22 | 1.22 | 640 | 653 |
| CC30C06 | 34.0 | 34.6 | 0.6 | 7.17 | 7.46 | 0.81 | 0.21 | 0.22 | 1.29 | 750 | 764 |
| CC30C10 | 39.1 | 41.1 | 2.0 | 3.68 | 3.56 | 0.95 | 0.09 | 0.09 | 0.48 | 863 | 907 |
| CC30C15 | 46.0 | 49.0 | 3.0 | 8.23 | 8.18 | 0.70 | 0.18 | 0.17 | 0.23 | 1015 | 1082 |
| CC30C20 | 52.9 | 57.6 | 4.8 | 11.26 | 11.71 | 2.58 | 0.21 | 0.20 | 0.54 | 1168 | 1271 |
| CC40C00 | 39.0 | 39.3 | 0.3 | 6.21 | 6.11 | 0.36 | 0.16 | 0.16 | 1.46 | 861 | 867 |
| CC40C03 | 41.9 | 42.4 | 0.5 | 9.20 | 8.93 | 0.48 | 0.22 | 0.21 | 0.96 | 925 | 936 |
| CC40C06 | 49.0 | 50.1 | 1.1 | 9.99 | 10.47 | 1.12 | 0.20 | 0.21 | 1.00 | 1082 | 1106 |
| CC40C10 | 57.9 | 60.0 | 2.1 | 7.43 | 7.17 | 1.09 | 0.13 | 0.12 | 0.51 | 1278 | 1324 |
| CC40C15 | 69.0 | 72.9 | 3.9 | 8.94 | 9.08 | 1.26 | 0.13 | 0.12 | 0.33 | 1523 | 1609 |
| CC40C20 | 81.9 | 88.0 | 6.1 | 13.88 | 14.59 | 1.83 | 0.17 | 0.17 | 0.30 | 1808 | 1942 |
| Dependent Variable | a | b | c | d | Adjusted R2 |
|---|---|---|---|---|---|
| −32.035 | 1.306 | 2.601 | 0.848 | 0.995 | |
| −26.791 | 1.326 | 2.510 | 0.975 | 0.996 |
| Specimen No. | N1 | N2 | ||||
|---|---|---|---|---|---|---|
| k | λ | Adjusted R2 | Adjusted R2 | |||
| CC20C00 | 5.382 | 13.420 | 0.853 | 5.382 | 13.420 | 0.853 |
| CC20C03 | 5.723 | 14.437 | 0.874 | 5.375 | 14.964 | 0.926 |
| CC20C06 | 6.468 | 16.454 | 0.865 | 6.514 | 17.227 | 0.864 |
| CC20C10 | 5.190 | 18.730 | 0.884 | 5.593 | 20.001 | 0.841 |
| CC20C15 | 3.971 | 21.779 | 0.881 | 3.910 | 23.983 | 0.894 |
| CC20C20 | 5.736 | 24.720 | 0.962 | 6.196 | 28.027 | 0.982 |
| CC30C00 | 8.318 | 27.497 | 0.924 | 8.507 | 27.615 | 0.919 |
| CC30C03 | 4.173 | 30.040 | 0.946 | 4.302 | 30.667 | 0.950 |
| CC30C06 | 4.410 | 35.203 | 0.888 | 4.298 | 35.869 | 0.885 |
| CC30C10 | 9.444 | 39.945 | 0.940 | 10.241 | 41.929 | 0.956 |
| CC30C15 | 4.874 | 47.590 | 0.849 | 5.302 | 50.598 | 0.858 |
| CC30C20 | 4.179 | 54.810 | 0.912 | 4.259 | 59.766 | 0.869 |
| CC40C00 | 5.878 | 40.164 | 0.895 | 5.954 | 40.420 | 0.871 |
| CC40C03 | 3.862 | 43.493 | 0.908 | 4.071 | 43.957 | 0.927 |
| CC40C06 | 5.112 | 50.648 | 0.902 | 4.783 | 51.757 | 0.897 |
| CC40C10 | 7.251 | 59.354 | 0.942 | 7.689 | 61.472 | 0.938 |
| CC40C15 | 6.201 | 71.067 | 0.848 | 6.363 | 75.026 | 0.837 |
| CC40C20 | 4.503 | 84.860 | 0.902 | 4.579 | 91.076 | 0.885 |
| Specimen No. | N1 | N2 | ||||
|---|---|---|---|---|---|---|
| k | λ | Adjusted R2 | λ | k | Adjusted R2 | |
| NC | 1.243 | 11.674 | 0.927 | 1.243 | 11.674 | 0.927 |
| PP4 | 2.187 | 15.109 | 0.712 | 2.726 | 30.833 | 0.865 |
| PP6 | 6.892 | 21.914 | 0.958 | 5.357 | 38.456 | 0.952 |
| SF20 | 1.134 | 22.016 | 0.943 | 1.352 | 41.712 | 0.958 |
| SF35 | 0.860 | 19.937 | 0.988 | 1.389 | 45.208 | 0.899 |
© 2019 by the authors. Licensee MDPI, Basel, Switzerland. This article is an open access article distributed under the terms and conditions of the Creative Commons Attribution (CC BY) license (http://creativecommons.org/licenses/by/4.0/).
Share and Cite
Liu, B.; Zhou, J.; Wen, X.; Guo, J.; Zhang, X.; Deng, Z.; Wang, H. Experimental Investigation on the Impact Resistance of Carbon Fibers Reinforced Coral Concrete. Materials 2019, 12, 4000. https://doi.org/10.3390/ma12234000
Liu B, Zhou J, Wen X, Guo J, Zhang X, Deng Z, Wang H. Experimental Investigation on the Impact Resistance of Carbon Fibers Reinforced Coral Concrete. Materials. 2019; 12(23):4000. https://doi.org/10.3390/ma12234000
Chicago/Turabian StyleLiu, Bing, Jingkai Zhou, Xiaoyan Wen, Jianhua Guo, Xuanyu Zhang, Zhiheng Deng, and Huailiang Wang. 2019. "Experimental Investigation on the Impact Resistance of Carbon Fibers Reinforced Coral Concrete" Materials 12, no. 23: 4000. https://doi.org/10.3390/ma12234000