Article

Hot Deformation Behavior of Q345 Steel and Its Application in Rapid Shear Connection

1
School of Materials Science and Engineering, Hebei University of Science and Technology, Shijiazhuang 050018, Hebei, China
2
Hebei Key Laboratory of Material Near-Net Forming Technology, Hebei University of Science and Technology, Shijiazhuang 050018, Hebei, China
3
School of Mechanical Engineering, Yanshan University, Qinhuangdao 066004, Hebei, China
*
Author to whom correspondence should be addressed.
Materials 2019, 12(13), 2186; https://doi.org/10.3390/ma12132186
Submission received: 28 May 2019 / Revised: 1 July 2019 / Accepted: 2 July 2019 / Published: 7 July 2019
(This article belongs to the Special Issue Development of the Rolling Process in Metallic Materials)

Abstract

:
The high-temperature deformation behavior of Q345 steel is detected by a Gleeble-3800 thermal simulator. The Arrhenius constitutive equation for high-temperature flow stress and the dynamic recrystallization model are constructed. With the secondary development technology, customized modifications are made on existing Deform-3D software. The constructed constitutive model and dynamic recrystallization model are embedded into Deform-3D to realize the secondary development of Deform-3D. The grain size and volume percentage distribution of dynamic recrystallization are obtained by simulating the shear connection process at high temperature and high speed. The results show that the constitutive equation and the dynamic recrystallization model constructed in this paper can be used to predict the evolution of the microstructure. The difference between the prediction results and the experimental data is about 3%. The accuracy of Arrhenius constitutive equation, dynamic recrystallization model and the feasibility of software secondary development are verified.

1. Introduction

As an important technical method for material connection, the solid metal connection technology of metal sheets becomes a necessary step for materials to be converted into usable parts and structures, which can realize the direct connection of metal sheets [1]. At present, the mature solid-state connection technologies mainly include accumulative roll-bonding (ARB) [2], superplastic forming/diffusion bonding [3], mechanical bonding [4,5], and friction stir welding (FSW) [6,7]. Shear connection is one of the promising solid-state connection technologies because of its innovative technology, good process and low relative cost.
At present, shear connection technology is mainly applied to the connection of intermediate sheet in endless rolling. A new solid-state connection technology based on the plastic deformation connection process, which was applied to the endless rolling intermediate blank shear connection process, was developed by Posco (Pohang) and Hitachi (Hitachi) Co. Ltd. [8,9,10,11,
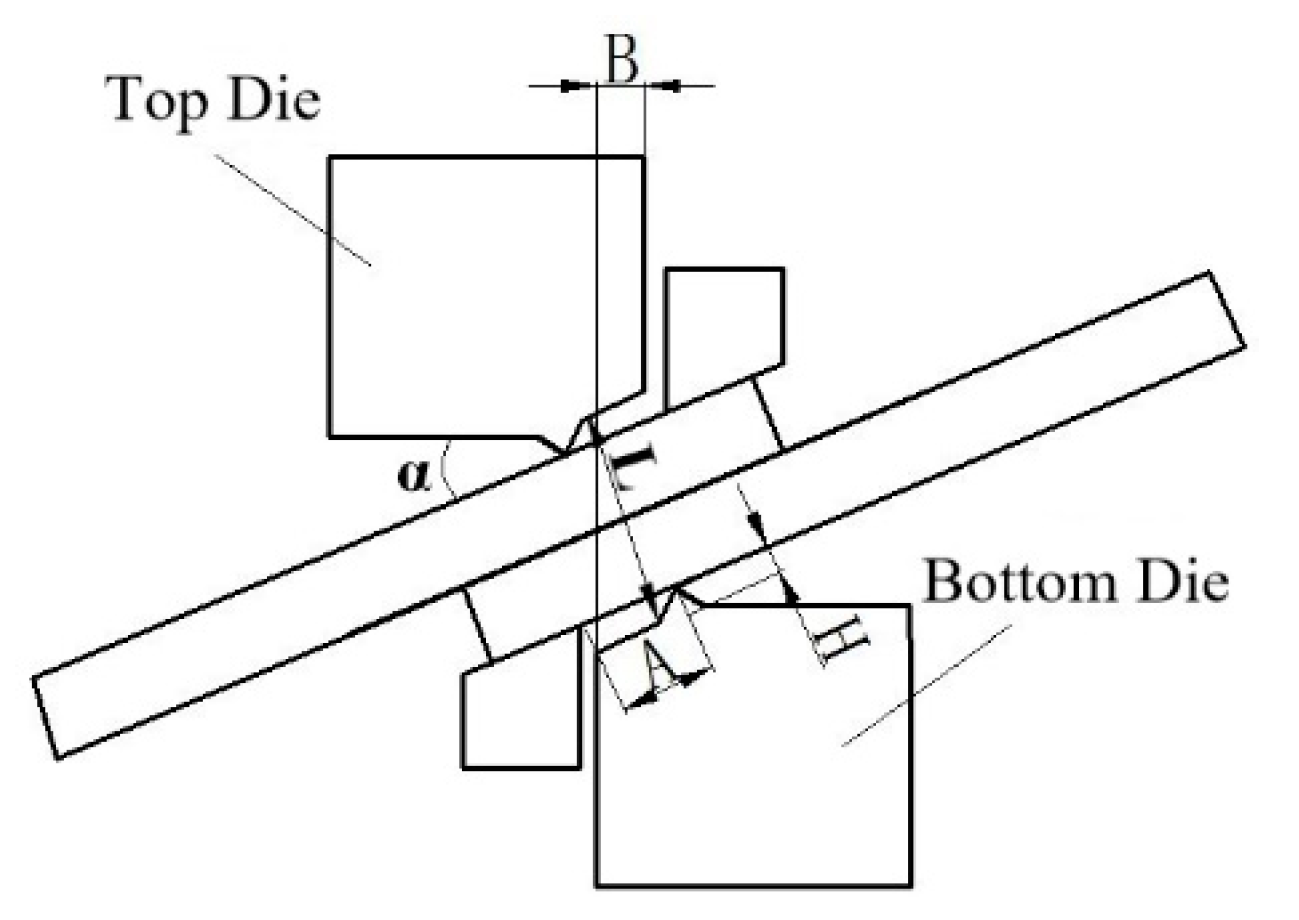
12]. Relevant papers and reports show that the company mainly studies the connection technology and equipment, and obtains the minimum temperature of effective connection of sheet metal is 980 °C and the thickness of blank is 29–120 mm. The effects of process parameters such as overlap (B), the tilt angle of the sheet (α) and pressure amount (L) and material parameters such as carbon content and oxide content on the interface closure of the joint in Figure 1 are analyzed [12,13,14]. The strength of the connection is proved. Researchers at Hebei University of Science and Technology carried out basic research on the rapid shear connection technology of endless rolling intermediate blanks, and designed the dynamic and static connection mechanism [15,16], which is a relatively simple six-bar and one-slide mechanism, and derived the motion function. Optimization of this mechanism is employed using a genetic algorithm (GA) and the optimization parameters of this mechanism are obtained; the kinematics analysis show that the connection time is less than 0.1 s and the connection thickness is more than 80% of the thickness of the solid-state metal. The change of material structure in the joint zone was analyzed, the dynamic recrystallization is the main driving force for grain refinement is concluded, and the greater the pressure amount, the more intense the dynamic recrystallization and the higher the grain refinement degree. Interfacial bonding is formed by three-stage theory, the increase of the pressure amount, the narrowing of the bonding band, the decrease of voids, the gradual disappearance of the interface and a large number of common grains are formed [17]. The key parameters affecting the rapid shear-extrusion bonding of metals are determined as follows: the overlap (B), the pressure amount (L), the width of the shear edge (A) and the tilt angle of the shear edge (a). Among them, the overlap ranges from 3 mm to 15 mm, the pressure amount ranges from 0.5 to 1.5 times the material thickness, the width of the shear edge from 20 mm to 40 mm, and the tilt angle of the shear edge from 12° to 14° [18,19].
The study of the microstructure evolution of the steel material during hot-working process has great engineering significance. A hardening process caused by plastic deformation and softening process caused by dynamic recovery (DRV) and dynamic recrystallization (DRX) are concomitant in the hot-working process. In particular, dynamic recrystallization behavior has important effects on flow tress and microstructure evolution. It determines the macroscopic mechanical properties of the metal materials [20]. Dynamic recrystallization is an important microstructure evolution behavior during shear connection. Dynamic recrystallized grain size and volume percentage affect the mechanical properties of the connection and its parts. Although many scholars have carried out basic research on shear connection technologies and obtained certain research results, research on the microstructure evolution and dynamic recrystallization process of shear connection has not been reported. Therefore, it is necessary to obtain the grain size and volume percentage of dynamic recrystallization by establishing the constitutive and recrystallization equation of Q345 and the secondary development of Deform-3D. This is of great significance to the optimization of process parameters and the prediction of workpiece performance for the shear connection of endless rolling intermediate blank. This paper aims to obtain the true stress-strain curves of typical carbon steel by the thermal compression test, and construct the Arrhenius constitutive and dynamic recrystallization model. In this paper, the dynamic recrystallization model is put into a user subroutine based on the second development of finite element (FE) software. By the simulation of shear connection process, the dynamic recrystallized grain size and volume percentage at each stage are obtained, and compared with experimental results.

2. Arrhenius Constitutive Equation and Dynamic Recrystallization Model

2.1. Plastic Deformation Behavior

The experimental material is low alloy steel Q345, which is widely used in industry. Table 1 is the chemical composition of Q345.
The experimental equipment is a Gleeble-3800 thermal simulator developed by DSI Company in the United States (Kansas City, MO, USA), which has the function of thermal dynamic simulation. It can be widely used in the performance analysis of materials in the process of continuous casting, pressure processing, heat treatment, welding and so on. The main parameters are shown in Table 2.
The specific process flow chart is shown in Figure 2. The compression tests are implemented on a Gleeble-3800 thermal simulation machine at different deformation temperatures of 900, 950, 1000, 1050 and 1100 °C, with strain rates of 0.01, 0.1, 1.0 and 10 s−1. The specimen size is 10 mm in diameter and 15 mm in height. Each surface of the specimen is covered with the tantalum foil to minimize friction. The specimens are initially heated to the deformation temperature and then held for 5 min to homogenize the temperature. The true strain reached to 0.6. After the compression test, the compressed specimen is quickly quenched into cold water to keep the microstructure. The quenched specimens are sliced along the axial section, and then polished and etched with a saturation picric for the observation of austenite grain boundaries. Based on the isothermal compression tests, the true stress–strain curves of Q345 steel are plotted, as shown in Figure 3 [21,22]. The deformation behavior of Q345 steel is coincident with the typical rules of low-carbon steel.
From Figure 3, it can be seen that the true stress increases with the increase of true strain at different temperatures at the same strain rate, and the true stress-strain curves have the same trend at different strain rates. At the initial stage of deformation, the true stress value increases sharply with the increase of true strain. With the increase of deformation degree, the increasing trend of flow stress tends to be stable [23]. Under the test condition of strain rate 10 s−1, the true stress-strain curves show zigzag changes. The reason for this phenomenon might be that dynamic softening and work hardening alternately lose balance at higher strain rates [24].

2.2. Arrhenius Constitutive Equation

The Arrhenius equation is used to describe the relationship between the corresponding flow stress σ, temperature T and strain rate ε ˙ at any strain level of low carbon alloy steel, especially at high temperatures [25,26,27,28,29]. The expression is shown in Equation (1).
ε ˙ = A 1 g ( σ ) exp ( Q R T ) g ( σ ) = { σ n 1 exp ( β σ ) [ sinh ( α σ ) ] n α σ < 0.8 α σ > 1.2 f o r a l l σ
where ε ˙ is the strain rate, A1 is the material constant, g(σ) is a function of the flow stress, Q is the deformation activation energy (J/mol), R is the gas constant, 8.314 J/(mol·K), and T is the thermodynamic temperature (K), A, n, n1, α and β are the material-dependent thermal deformation constants, and α = β/n1 is satisfied.
In isothermal deformation, the true stress–strain relationship is affected by the deformation temperature and strain rate. The combined effect is usually expressed by the Zener–Hollomon parameter. The Equation (2) is the Z-parametric expression and the material constitutive equation for high-temperature flow stress [30].
{ Z = ε ˙    exp [ Q / ( R T ) ] σ = 1 / α ln { ( Z / A ) 1 / n + [ ( Z / A ) 2 / n + 1 ] 1 / 2 }
The mathematical derivation of Equations (1) and (2) is performed. According to the experimental results of true stress-strain data and by linear regression of ln ε ˙ ln σ , ln ε ˙ σ , ln ε ˙ ln [ sinh ( α σ ) ] , ln [ sin h ( α σ ) ] 1 / T and ln Z ln [ sin h ( α σ ) ] , the relevant parameters in the flow stress model with ε = 0.3 are obtained as follows: n1 = 5.4488, β = 0.0163, α = 0.0113, n = 4.5368, Q = 328645.0625, A = 1.13251012. The linear fitting of correlation coefficients is shown in Figure 4.

2.3. Dynamic Recrystallization Model

2.3.1. Kinetic Model

During thermal deformation, dynamic recrystallization begins when ε = εc. Different materials have different εc at different deformation temperatures and strain rates. They are not only related to the deformation temperature and strain rate, but also related to the grain size and activation energy before deformation. At present, the dynamic recrystallization critical strain model is expressed by the Sellars model shown in Equation (3) [31,32,33].
{ ε p = a 1 Z m 1 = a 1 [ ε ˙ exp ( Q 1 R T ) ] m 1 ε c = a 2 ε p
where εp is the peak strain (s−1), εc is the critical strain (s−1), Q1 is dynamic recrystallization activation energy (J/mol), Z is the thermal deformation parameter of the thermal deformation process, T is the thermodynamic temperature (K), a1, a2, and m1 are the material-dependent thermal deformation constants.
The critical conditions for dynamic recrystallization to occur are shown in Equation (4).
ε c = 2 ln θ ε 2
where θ indicates the work hardening rate (MPa), θ = dσ/dε.
The results of Mirzadeh and Najafizadeh [34] show that the critical conditions of dynamic recrystallization can be obtained by fitting the relationship between Inθ and ε, shown as follows:
Inθ = A3ε3 + A2ε2 + A1ε + A0
The dynamic recrystallization critical strain expression can be derived mathematically, as shown below:
ε c = 2 ln θ ε 2 = A 2 3 A 3 ( 0 ε ε p )
When ε = εc, the microstructure change enters the dynamic recrystallization softening stage. As the strain increases, the flow stress gradually reaches its maximum value, and the work hardening rate become zero, shown as follows:
{ θ = σ ε = 0 ε p = ε
According to the experimental true stress-strain data, εc and εp are obtained by the cubic polynomial nonlinear fitting curves of Inθ-ε and θ-ε. The dynamic recrystallization critical strain and peak strain value are fitted to the fitting curve, as shown in Figure 5. The values of the critical strain εc and the peak strain εp are shown in Table 3.
The natural logarithm of Equation (3) is taken and Equation (8) is obtained as follows:
ln ε p = ln a 1 + m 1 ln ε ˙ + m 1 Q 1 R T
When the deformation temperature σ s and the strain rate ε ˙ are constant values, respectively, linear regression is used to obtain m1, m1Q1/R, a1 and a2, as shown in Figure 6.
Solved by using linear regression, the parameters of the Sellars critical strain model are as follows: m1 = 0.1749, Q1 = 340963.2594, a1 = 0.0014 and a2 = 0.4969.

2.3.2. Kinematic Model

The dynamic recrystallization Kinematics model is generally expressed in the Avrami equation [35,36], as shown below:
{ X D r e x = 0 ( 0 ε ε c ) X D r e x = 1 exp [ β d ( ε ε c ε 0.5 ) k ] ( ε ε c ) ε 0.5 = a 3 ε ˙ m 2 exp ( Q 2 R T )
where XDrex is the dynamic recrystallization volume percentage, ε0.5 is the strain value when the dynamic recrystallization volume percentage is 50%, Q2 is the activation energy (J/mol) when the dynamic recrystallization volume percentage is 50%, βd, k, α3 and m2 are the thermal deformation constants associated with the material.
Sellars proposed a method for obtaining the dynamic recrystallization volume percentage by a mathematical model, the expression of which is shown in Equation (10) [37].
X D r e x = σ W H σ σ s σ s s ( ε ε c )
where σWH, σ are the dynamic stress curve and the dynamic recrystallization curve flow stresses (MPa), respectively, σs is the dynamic recovery curve steady state stress (MPa), σss is the dynamic recrystallization curve steady state stress (MPa). Among these parameters, σss and σ can be directly obtained from the dynamic recrystallization curve, while σWH and σs can be directly obtained from the dynamic recovery curve.
The dynamic response curve derived using the method proposed by Sellars is shown in Equation (11).
σ W H σ 0.2 σ s σ 0.2 = [ 1 exp ( b ε ) ] c
where σ0.2 is the flow stress when the compressive deformation is 0.2%, b and c are constants related to material properties. Equation (12) can be derived mathematically from Equation (11).
σ = a 4 [ 1 exp ( b ε ) ] c
According to the experimental true stress–strain data, the nonlinear data fitting of Equation (12) is obtained, and it is obtained that: a4 = 48.6483, b = 6.4622, c = 0.4164. Figure 7 shows the dynamic recovery and dynamic recrystallization curves.
By combining Equation (10) with Equation (12), the dynamic recrystallization volume fraction can be expressed as follows:
X D r e x = σ W H σ σ s σ s s = a [ 1 exp ( b ε ) ] c + σ 0.2 σ σ s σ s s
According to Equation (13), the strain value ε0.5 is obtained when the dynamic recrystallization volume percentage is 50%. And the strain values, when the dynamic recrystallization volume percentage is 50% under different test conditions, are shown in Table 4.
When εεc, the natural logarithm of Equation (11) is taken and Equations (14) and (15) are obtained:
ln [ ln ( 1 X D r e x ) ] = ln β d + k ln [ ( ε ε c ) / ε 0.5 ] ( ε ε c )
ln ε 0.5 = ln a 3 + m 2 ln ε ˙ + Q 2 / ( R T )
By the linear regression for ln[−ln(1−XDrex)]-ln[(ε−εc)/ε0.5], lnε0.5-ln ε ˙ , lnε0.5-1/T, the dynamic recrystallization kinematic model parameters are obtained as follows: k = 4.3829, β = 3.2731, Q2 = 49840.7094, m2 = 0.1520, a3 = 0.0042.

2.3.3. Dynamic Recrystallization Grain Size Model

The Gleeble-3800 compression test piece is cut in the radial direction, and the dynamic recrystallized grain size is obtained by etching the sample with a supersaturated picric acid aqueous solution and a small amount of an alkaline reagent, as shown in Table 5.
The deformation temperature and strain rate affect the dynamic recrystallized grain size, and Equation (16) is used to describe the dynamic recrystallized grain size change.
d D R X = a 5 ε ˙ m 3 exp [ Q 3 / ( R T ) ]
where dDRX is the dynamic recrystallization grain size (μm), a5 and m3 are the material correlation coefficients, Q3 is the grain growth activation energy.
The logarithm of the two sides of Equation (16) is taken and Equation (17) is obtained.
ln d D R X = ln a 5 + m 3 ln ε ˙ + Q 3 / ( R T )
The linear regression of ln ε ˙ -lndDRX and 1/T-lndDRX is performed on the two relations, and the relationship is obtained as shown in Figure 8. Finally, the parameters are calculated as: m3 = −0.1434, Q3 = −44330.25. Substituting m3 and Q3 into Equation (17), and result obtained was a5 = 981.7866.

3. Finite Element (FE) Analysis of Shear Connection Process

Development of Deform-3D (Version: Deform6.01) Software Developed by SFTC Company in USA (Santa Fe, NM, USA), and the established Arrhenius constitutive equation and dynamic recrystallization model are placed into the user subroutine. The core codes of user subroutines are written in FORTRAN language and stored in Deform-3D V6_0 User Routine def_usr. In this paper, the constructed constitutive model and dynamic recrystallization model are embedded in the DEF_SIM folder of Deform. The grain size and volume percentage of dynamic recrystallization can be obtained by simulating the shear connection process. The effects of different shear connection conditions on the structure evolution, especially the dynamic recrystallization process, were discussed, and the appropriate shear connection parameters were found. The simulated shear connection process is shown in Figure 9. The upper crop shear is descending, and the shear edge contacts the blank to plastically deform the blank. Then the edge bites into the blank, and the blank undergoes severe deformation under the action of the cutting edge to achieve a quick shear connection. The degree of shear connection is characterized by the pressure amount L, the expression of which is shown in Equation (18).
L = 2 t L t × 100 %
where t is the thickness of a single sheet, L′ is the thickness of the sheet after shearing.
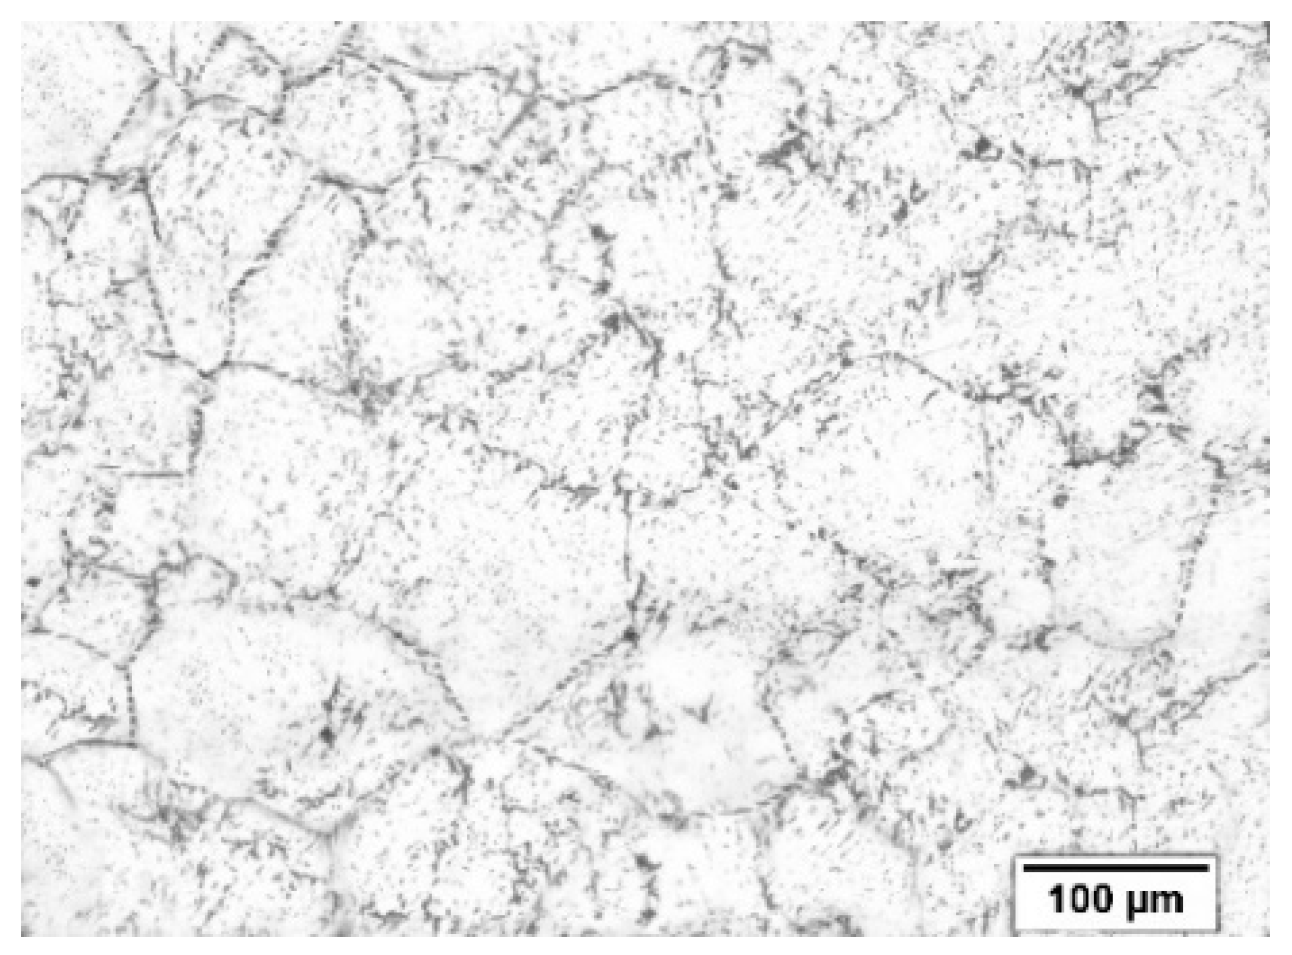
The prior austenite grain size of about 120 μm is obtained by using a supersaturated picric acid aqueous solution plus a small amount of an alkaline reagent, as shown in Figure 10. Based on Deform-3D with rigid-plastic model, the FE model of the shear connection is established to explore the dynamic recrystallization degree and temperature change during the shear connection. The detailed parameters of the FE model are listed in Table 6. Element type, tetrahedron; element number, 20,000; node number, 4085; and min mesh size, 1.66 mm.
During the shearing connection process, the blank first contact the upper and lower shear edges, and slight plastic deformation occurs. As the upper shear descends, the pressure amount increases, and the blank undergoes plastic deformation by the action of the shear edge. With the increase of the pressure amount, the plastic deformation gradually extends to the overlapping surfaces of the two blanks along the line connecting the two cutting edges. The plastic deformation area of the upper and lower blanks merges, and the joint surface is gradually formed. As the shear connection continues, the dynamic recrystallization behavior of the plastic deformation area continues to expand.
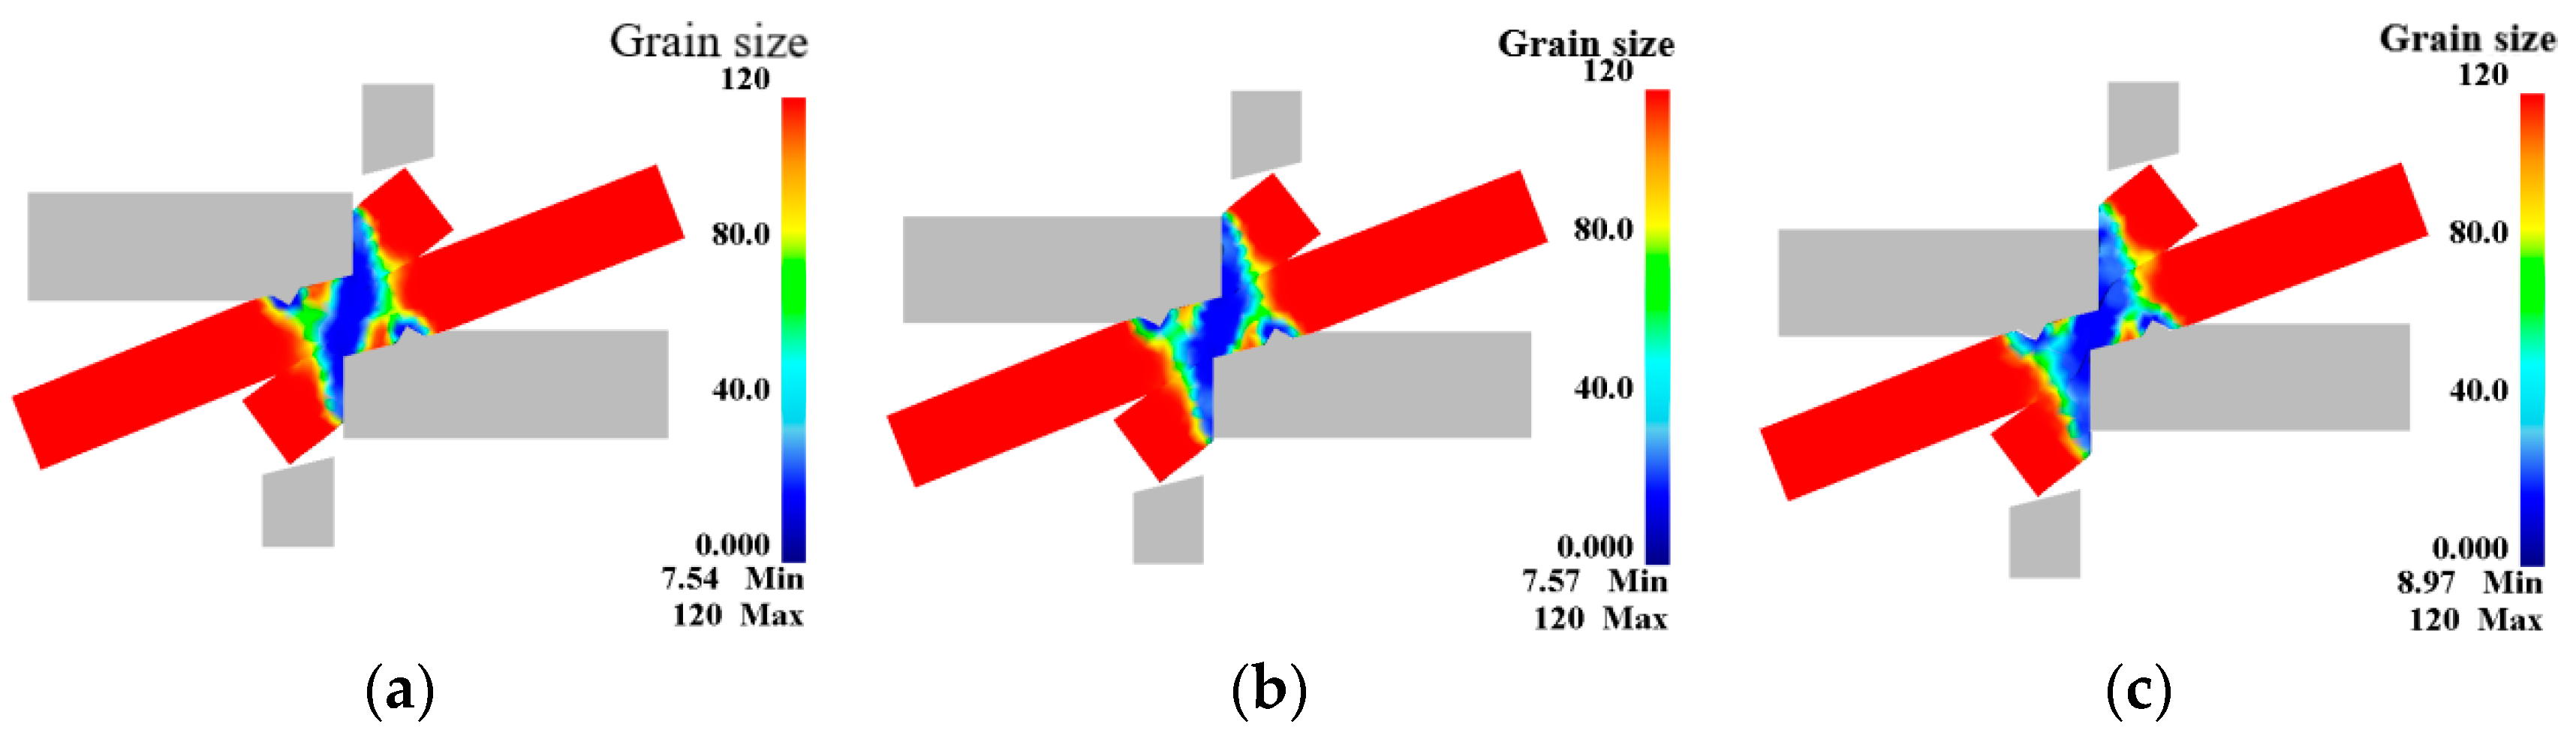
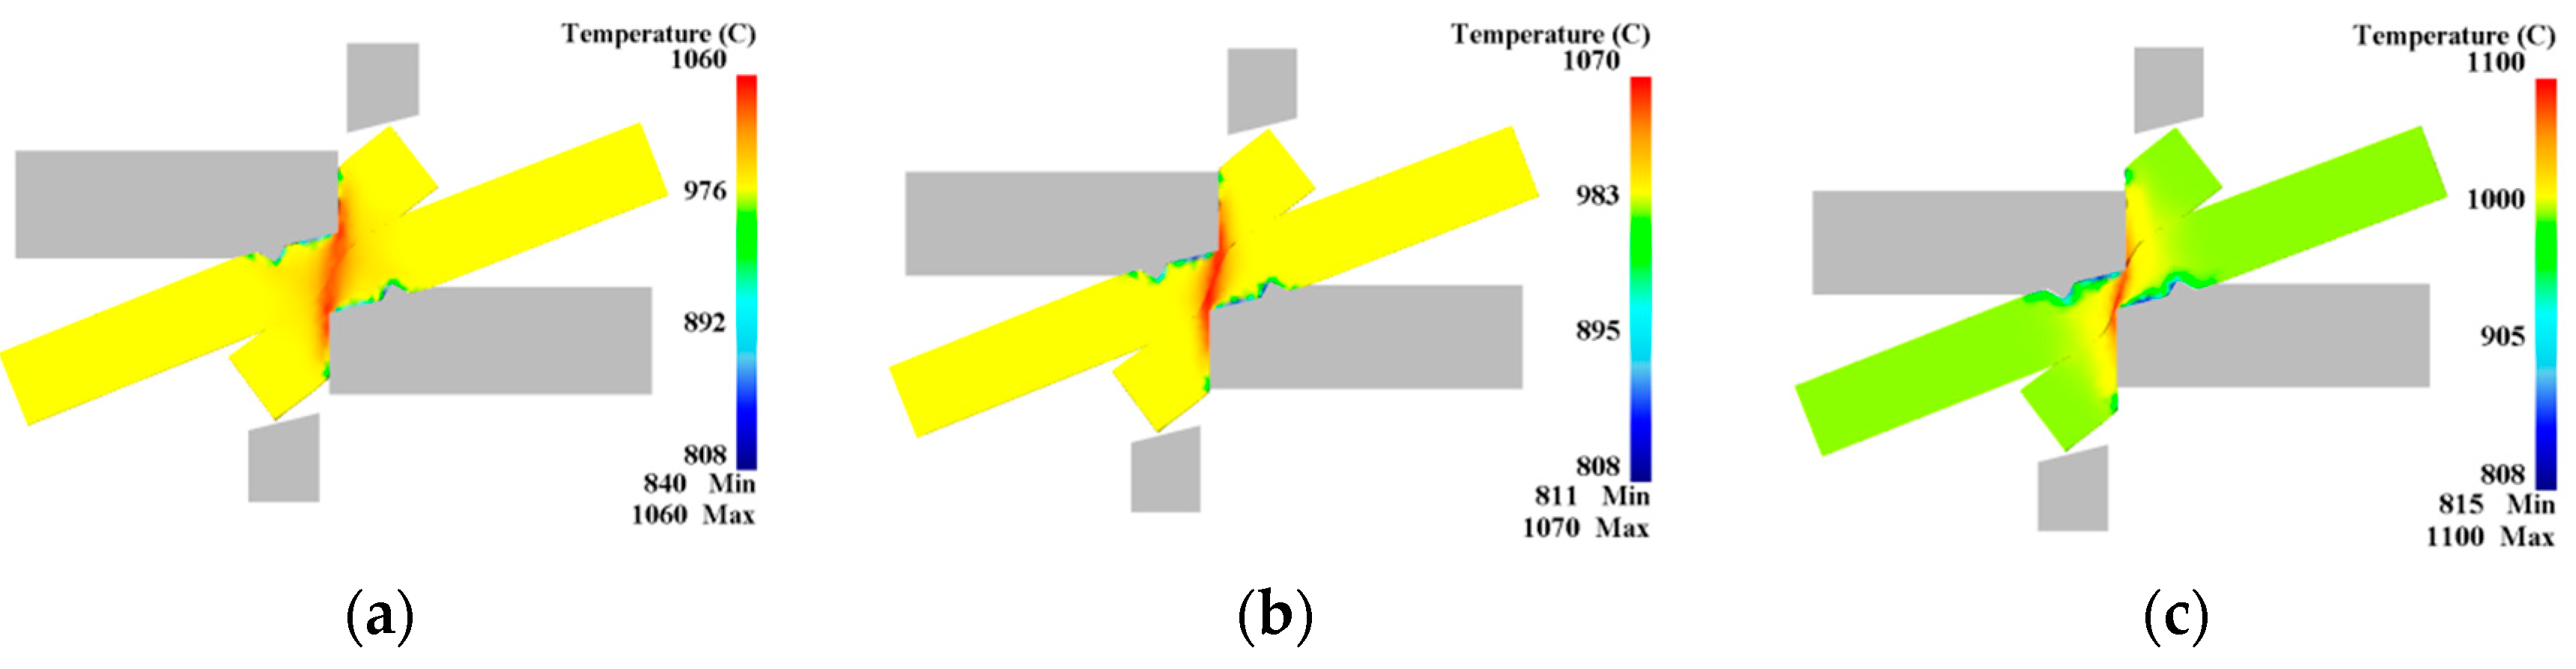
Figure 11 and Figure 12 show the simulation results. The blank is undeformed at both ends and no dynamic recrystallization occurs (the dynamic recrystallization volume percentage is 0%). The center of the shearing action (blue color area in Figure 11) is a large deformation area, and significant dynamic recrystallization occurs in this area with the grains refined. The reason for this phenomenon is that the shearing edge undergoes severe plastic deformation and a large amount of slip and dislocation is produced under the friction at the interface of the blank, which induces a large amount of dynamic recrystallization. The remaining area (light green area in Figure 11) is a small deformation area. Only upsetting-like deformation occurs in this region, and dynamic recrystallization is insufficient.
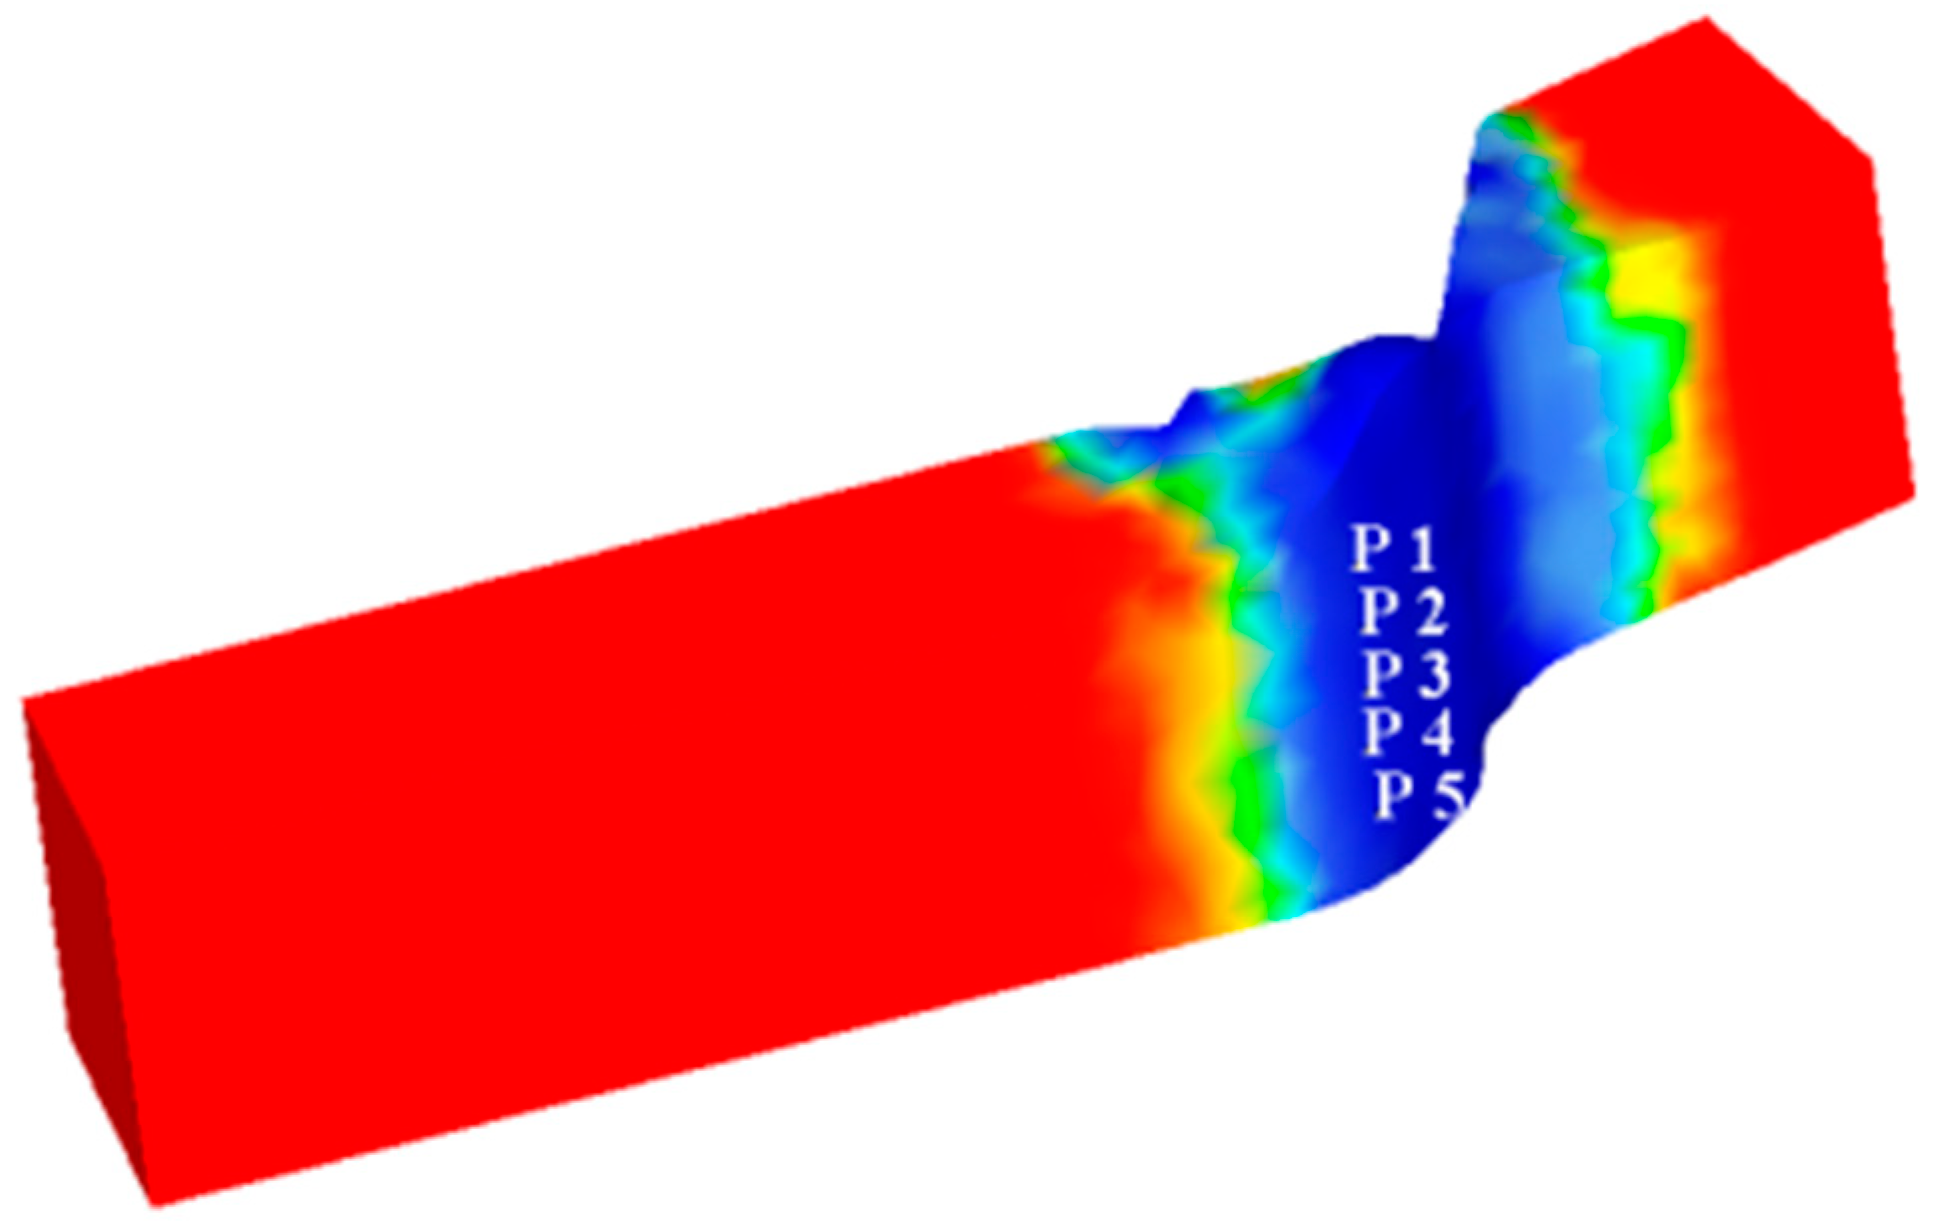
The point tracking method is used and five tracking points are taken near the blank connection surface in the direction perpendicular to the width of the blank, as shown in Figure 13. The changes of dynamic recrystallized grain size and volume percentage during the shear connection of the five tracking points are acquired.
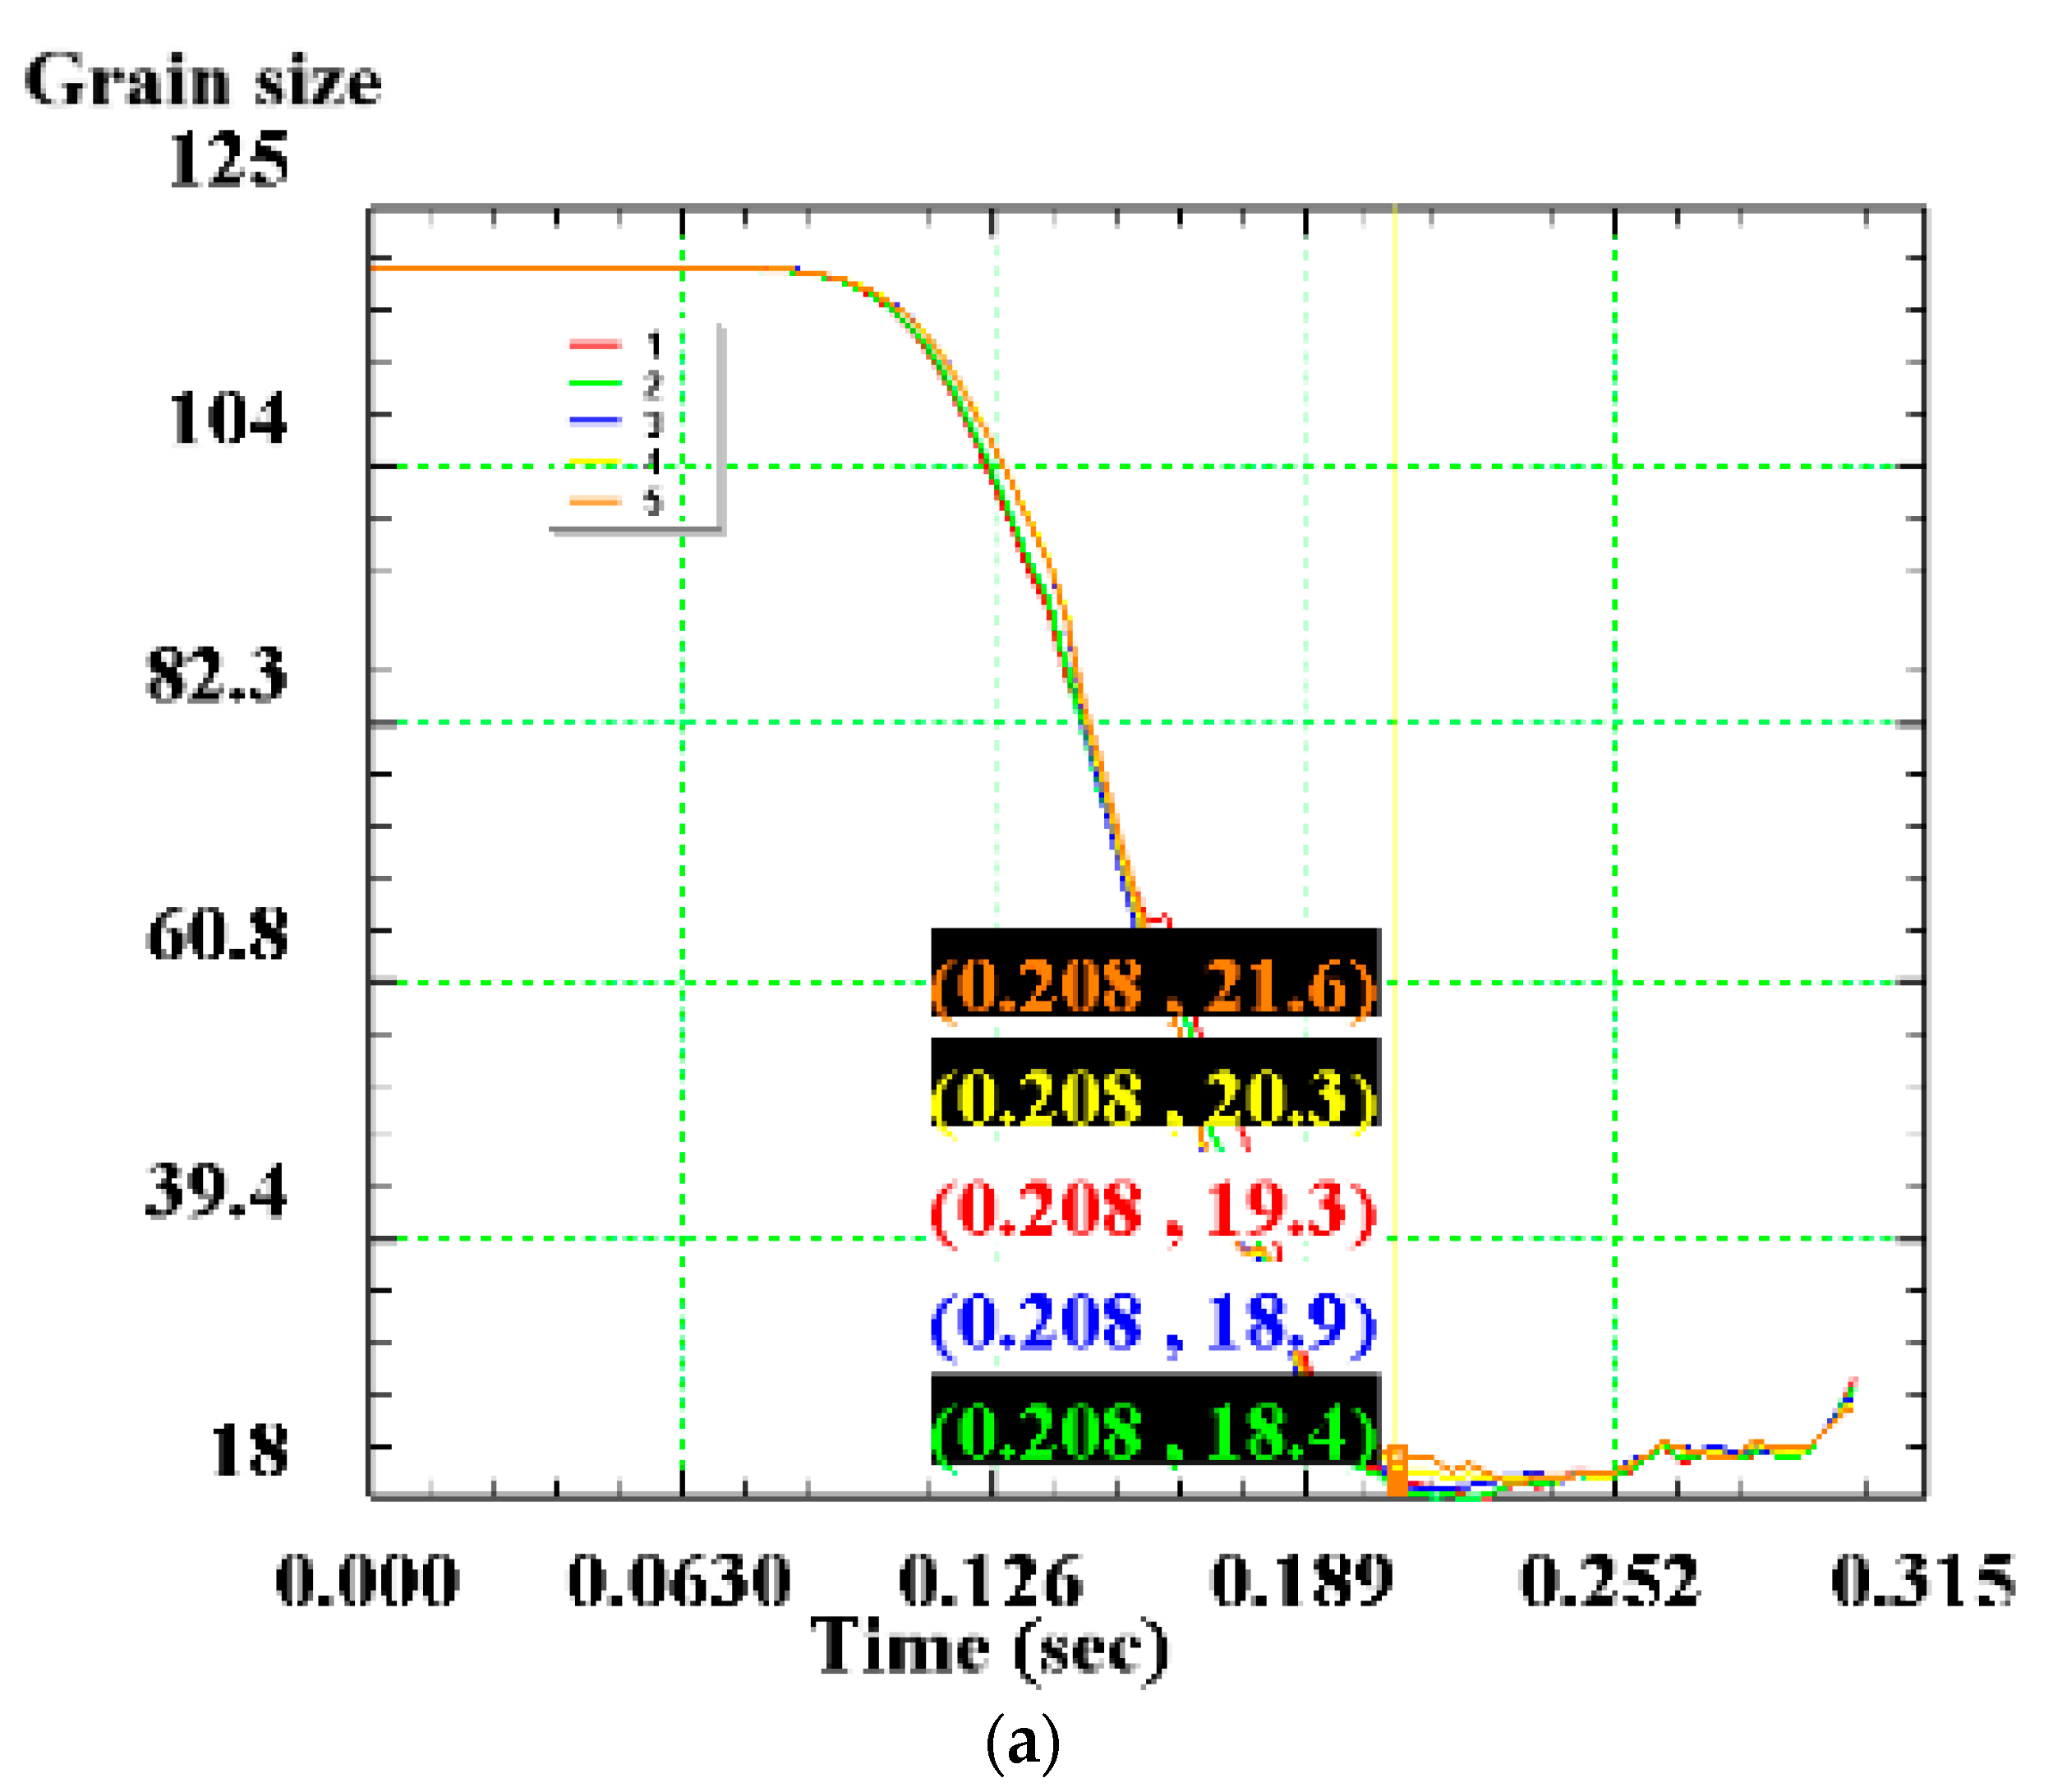
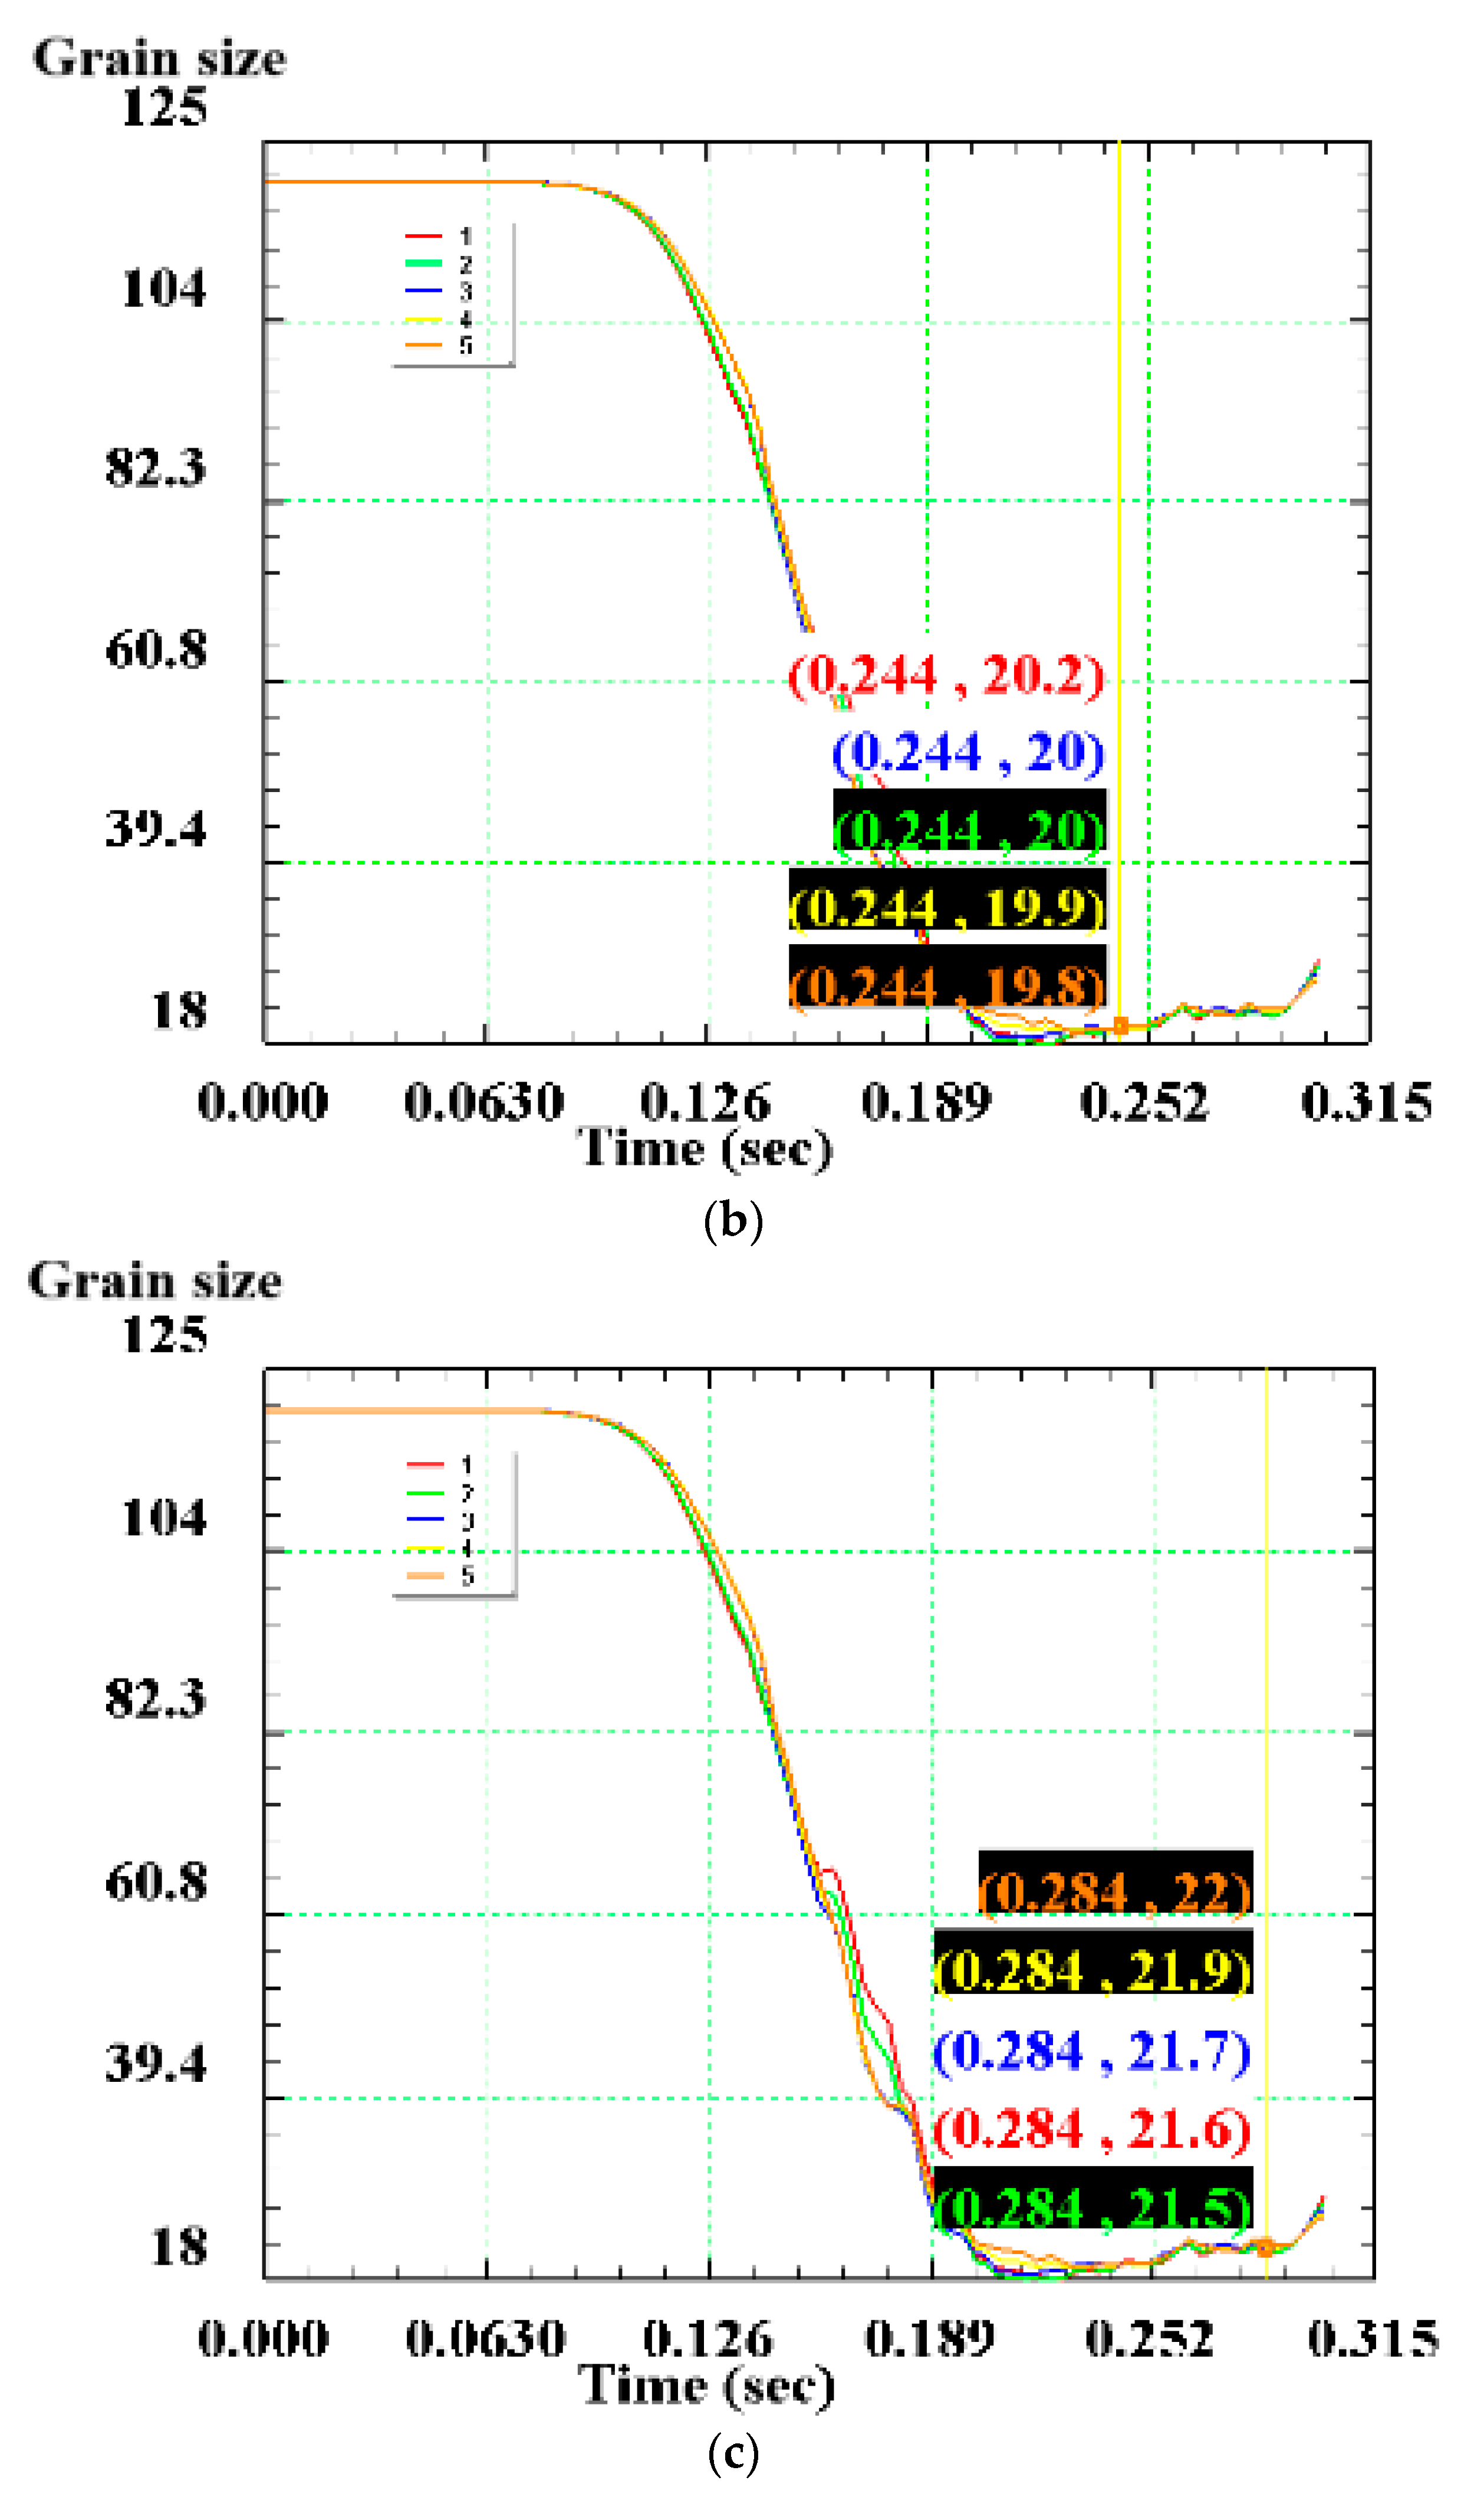
The relationship between the dynamic recrystallized grain size, volume percentage and the pressure amount in the large deformation area of the blank is shown in Figure 14 and Figure 15. The change of grain size with the shear pressure amount is reflected: the grain size gradually decreases with the increase of the pressure amount, but after the pressure amount reaches 100%, the grain size increases slightly. The reason for this might be that part of the distortion energy inside the grain is converted into heat (see Figure 16), and the remaining distortion energy is insufficient to maintain the formation of new fine grains of recrystallization.
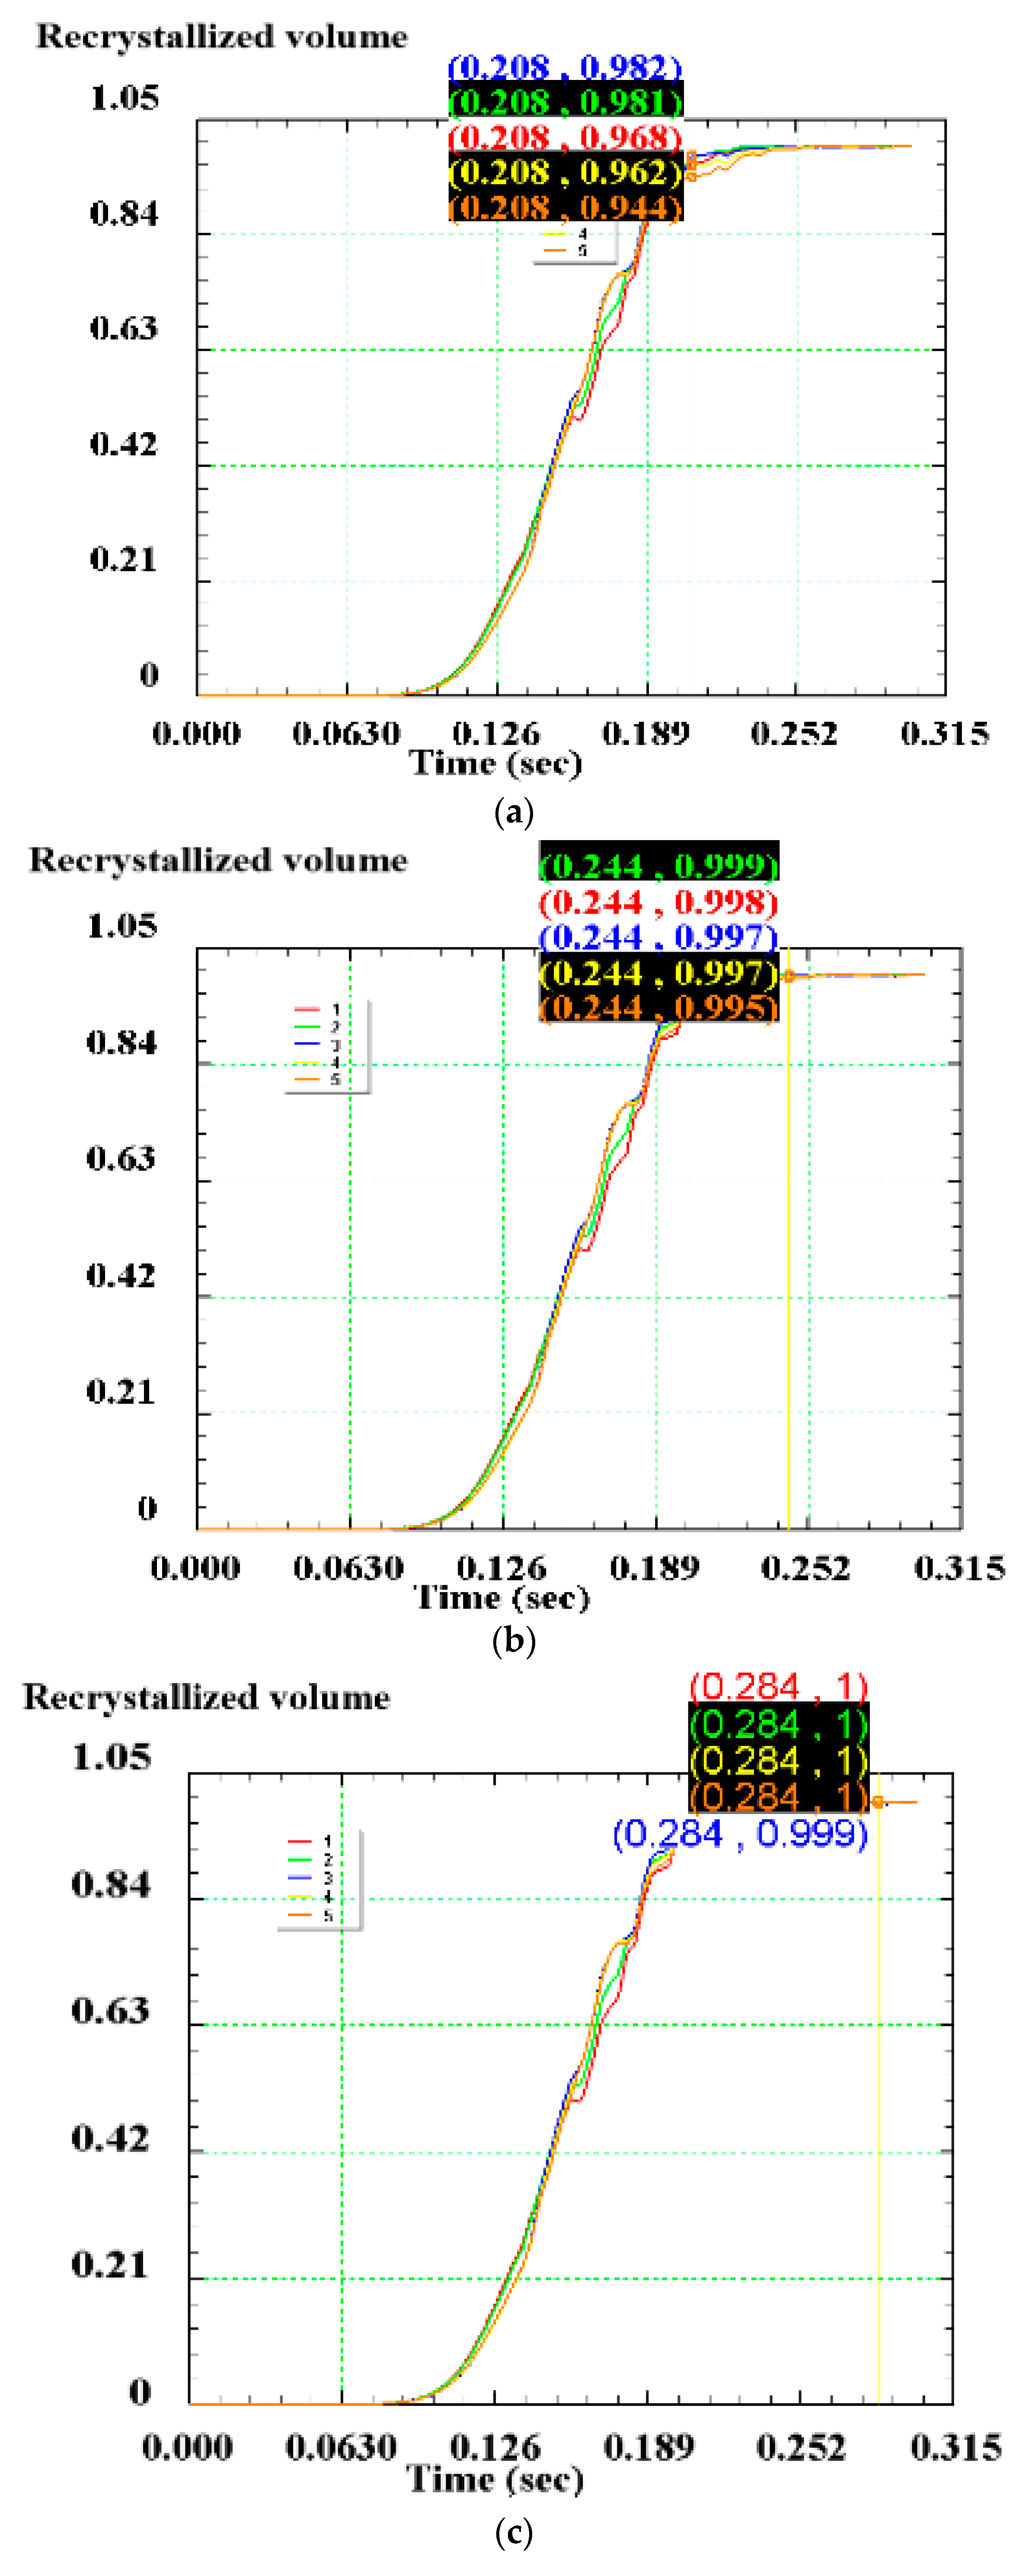
The dynamic recrystallization volume fraction changes with the pressure amount: as the pressure amount increases, the dynamic recrystallization volume percentage also increases, and the curve of the dynamic recrystallization volume percentage with the pressure amount also gradually converges to 100%. This is because as the pressure amount increases, the dynamic recrystallized grains continue to grow, and new recrystallized grains are continuously formed, eventually causing the matrix structure to be stable in an equiaxed state. At this time, the dynamic recrystallization volume percentage is 100%. When L = 100%, the volume percentage reaches 96.74%, the grain size is refined to 19.7 μm; when L = 125%, the volume percentage reaches 99.72%, the grain size is 19.98 μm; when L = 150%, the volume percentage reached 100%, and complete dynamic recrystallization is achieved with a grain size of 21.74 μm. The specific values are shown in Table 7.

4. Shear Connection Experiment

In this experiment, a 315 t hydraulic press was used and the shear connection experiment is carried out under the physical simulation experimental conditions. The microscopic state under different pressure amounts is analyzed to verify the accuracy of the model. 
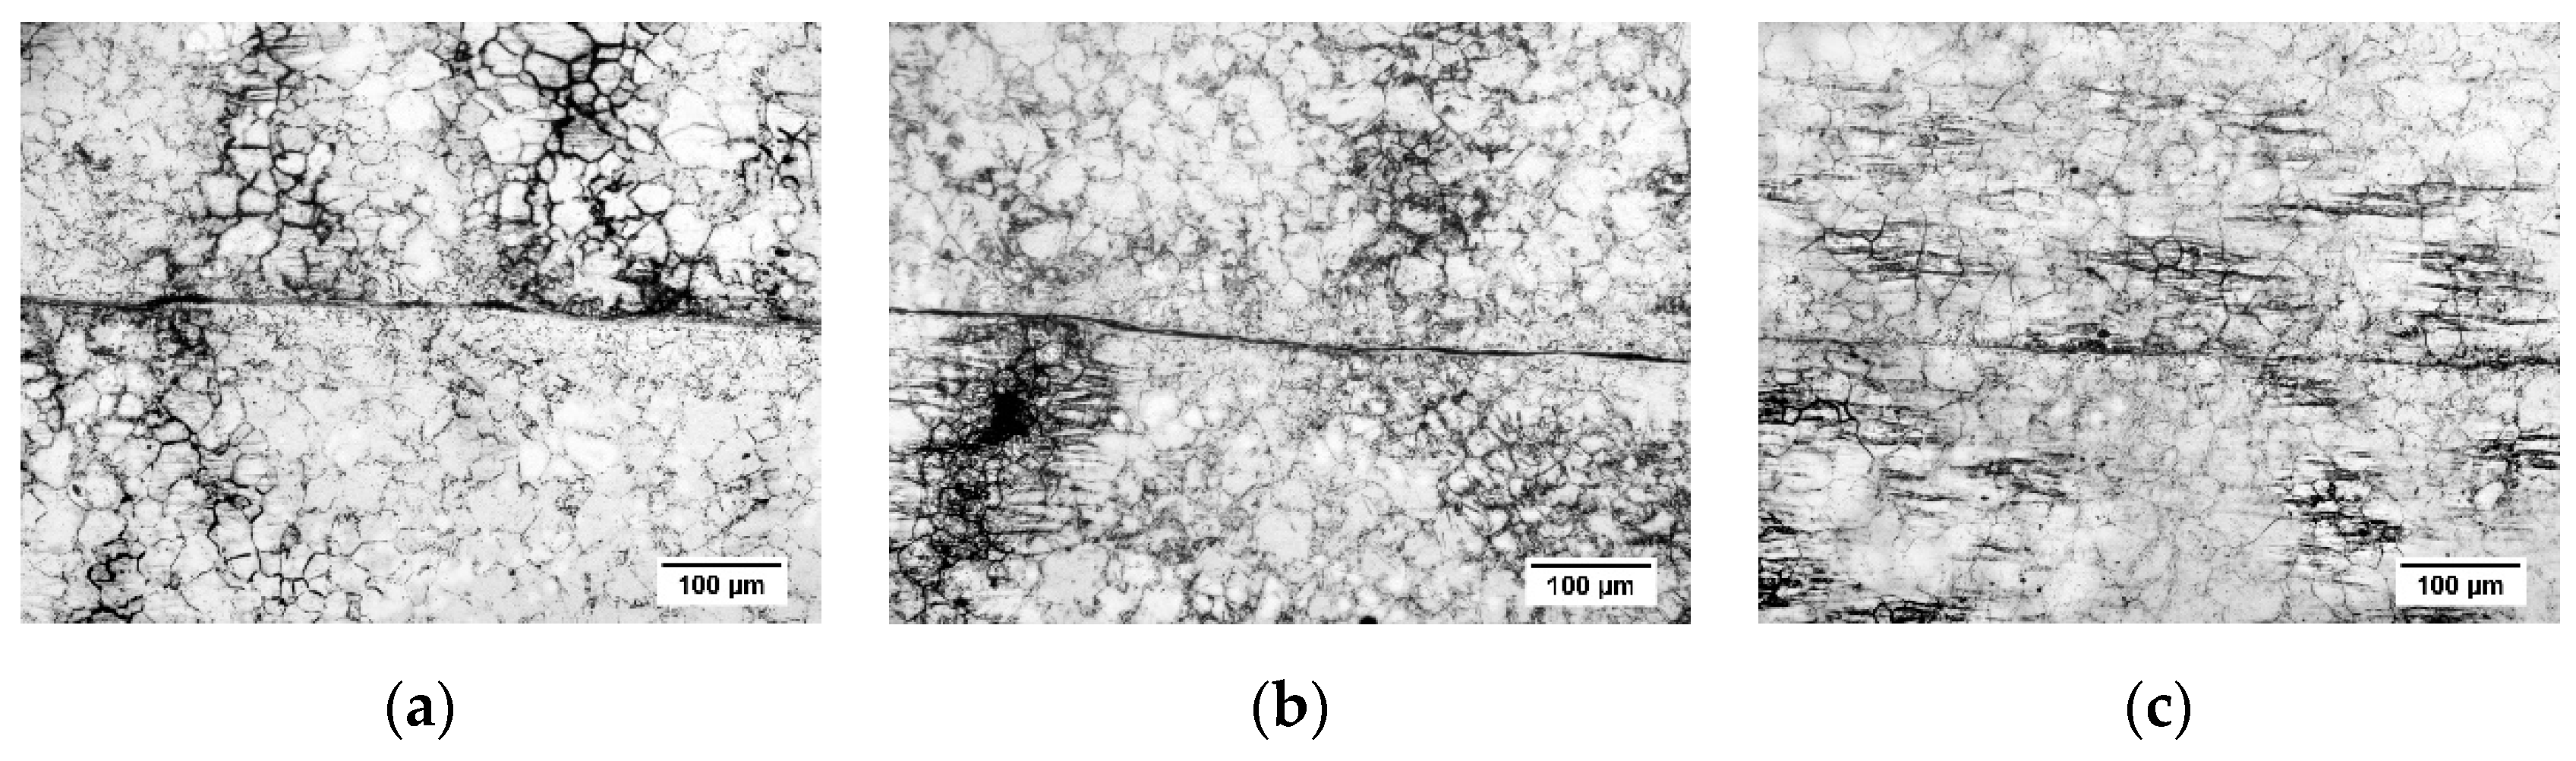
Figure 17 shows the microstructure of the large deformation area when the pressure amount is 100%, 125% and 150%, respectively. With the increase of the pressure amount, the grain size is refined remarkably, which is consistent with the simulation trend. This is because of the early stage of the shear connection process, the plastic deformation process at high temperature causes dynamic recrystallization of grains, severe shear and friction of overlapped sheets, and energy input to the sheets, which further increases the energy. With the shear deformation process, oxide scales and other impurities continue to break up, forming fine particles, which provides a nucleation site for dynamic recrystallization. Therefore, the grain size is refined continuously during shear connection. After the pressure amount reaches 100%, the grain size increases slightly. The reason for this might be that part of the distortion energy inside the grain is converted into heat (see Figure 16), and the remaining distortion energy is insufficient to maintain the formation of new fine grains of recrystallization. At this time, driven by temperature, atoms diffuse and grains grow relatively.
The dynamic recrystallization grain size is measured by using composite grid method according to the ASTM standard. The results of the shear connection experiment and numerical simulation of austenite grain size are shown in Table 8. When the pressure amount is 100%, 125%, 150%, respectively, the grain size is about 19.16 μm, 20.25 μm, 22.21 μm, respectively. From these results, it is found that the grain size obtained by the experiment and the simulation are basically the same, and the average error is less than 3%, indicating the constitutive and dynamic recrystallization model established in this paper has high accuracy.

5. Conclusions

(1) In this paper, the true stress–strain curve of the material is obtained by the thermal compression simulation test, and the constitutive equation for high-temperature flow stress and the dynamic recrystallization model are constructed.
The high-temperature flow stress constitutive model is shown as follows:
{ σ = 1 / 0.0113 ln {    ( Z / 1.1325 × 10 12 ) 1 / 4.5368 + [ ( Z / 1.1325 × 10 12 ) 2 / 4.5368 + 1 ] 1 / 2 } Z = ε ˙ exp [ 328645.0625 / ( R T ) ]
The dynamic recrystallization kinetics model is shown as follows:
{ ε p = 0.0014 Z 0.1749 = 0.0014 [ ε ˙ exp ( 340963.2594 R T ) ] 0.1749 ε c = 0.4969 ε p
The dynamic recrystallization kinematic model is shown as follows:
{ X D r e x = 0 ( 0 ε ε c ) X D r e x = 1 exp [ 2.4630 ( ε ε c ε 0.5 ) 4.1332 ] ( ε ε c ) ε 0.5 = 0.0042 ε ˙ 0.1520 exp ( 49840.7094 R T )
The dynamic recrystallization grain size model is shown as follows:
d D R X = 981.7866 ε ˙ 0.1434 exp ( 44330.25 R T )
(2) The finite element simulation results show that the shear connection process is divided into three areas, namely the large deformation area, small deformation area and undeformed area. The dynamic recrystallization volume percentage increases with the increase of the pressure amount. When the pressure amount is 100%, 125% and 150%, respectively, the grain size is 19.7 μm, 19.98 μm, 21.74 μm, respectively, and the volume percentage is 96.74%, 99.72%, 100%, respectively.
(3) The experiment shows that when the pressure amount is 100%, 125% and 150%, respectively, the grain size is 19.2 μm, 20.3 μm and 22.2 μm, respectively.
By comparison, it is found that the experimental results are consistent with those of the numerical simulation, and the average error is less than 3%.

Author Contributions

Conceptualization, S.M.; Software, M.W.; Validation, W.W.; Formal Analysis, S.M. and H.Y.; Investigation, Q.L.; Data Curation, H.Y.; W.W. and M.W.; Writing—Original Draft Preparation, M.W.; Writing—Review & Editing, S.Z.; Supervision, S.Z.; Project Administration, Q.L.

Funding

This research was funded by Key Research and Development Program of Hebei Province (No. 18211812D), National Natural Science Foundation of China (No. 51475139) and Natural Science Foundation of Hebei Province (No. E2015208105).

Acknowledgments

We thank the National Natural Science Foundation of China (Project No. 51475139), the Natural Science Foundation of Hebei Province (Project No. E2015208105) and the Key Research and Development Program of Hebei Province (Project No. 18211812D) for their financial support.

Conflicts of Interest

The authors declare no conflict of interest.

References

  1. Marx, L.; Liewald, M.; Riedmüller, K.R. Basic Investigations on Joining of Metal and Fibre Components Based on the Semi-Solid Forming Process. Key Eng. Mater. 2015, 651–653, 1445–1450. [Google Scholar] [CrossRef]
  2. Saito, Y.; Utsunomiya, H.; Tsuji, N.; Sakai, T. Novel ultra-high straining process for bulk materials—Development of the accumulative roll-bonding (ARB) process. Acta Mater. 1999, 47, 579–583. [Google Scholar] [CrossRef]
  3. Du, Z.H.; Jiang, S.S.; Zhang, K.F.; Lu, Z.; Li, B.Y.; Zhang, D.L. The structural design and superplastic forming/diffusion bonding of Ti2AlNb based alloy for four-layer structure. Mater. Des. 2016, 104, 242–250. [Google Scholar] [CrossRef]
  4. Roux, E.; Bouchard, P.-O. Kriging metamodel global optimization of clinching joining processes accounting for ductile damage. J. Mater. Process Technol. 2013, 7, 1038–1047. [Google Scholar] [CrossRef]
  5. Coppieters, S.; Lava, P.; Baes, S. Analytical method to predict the pull-out strength of clinched connections. Thin Wall Struct. 2012, 52, 42–52. [Google Scholar] [CrossRef]
  6. Prater, T. Friction Stir Welding of Metal Matrix Composites for use in aerospace structures. Acta Astronaut. 2014, 93, 366–373. [Google Scholar] [CrossRef]
  7. Mira-Aguiar, T.; Verdera, D.; Leitao, C.; Rodrigues, D.M. Tool assisted friction welding: A FSW related technique for the linear lap welding of very thin steel plates. J. Mater. Process Technol. 2016, 238, 73–80. [Google Scholar] [CrossRef]
  8. Zhang, X.L.; Fu, C.G. Development and application of endless rolling technology. Hebei Metall. 2012, 3–7. [Google Scholar]
  9. Kang, Y.L.; Zhu, G.M. Hot strip endless rolling technology. Iron Steel 2012, 47, 1–6. [Google Scholar]
  10. Kang, Y.L.; Zhou, C. Technological Analysis on Endless Hot Rolling of Steel Sheets and its Application Progress. Shandong Metall. 2004, 5, 1–5. [Google Scholar]
  11. Agarwala, K.; Shivpuri, R.; Zhu, Y.; Chang, T.-S.; Huang, H. Process knowledge based multi-class support vector classification (PK-MSVM) approach for surface defects in hot rolling. Expert Syst. Appl. 2011, 38, 7251–7262. [Google Scholar] [CrossRef]
  12. Arvedi, G.; Mazzlari, F.; Liu, Y.H. Achievements of the first set of thin slab endless casting and rolling. Sichuan Metall. 2011, 33, 71–74. [Google Scholar]
  13. Yusof, F.; Yukio, M.; Yoshiharu, M.; Shukor, M.H.A. Effect of anodizing on plused Nd:YAG laser joining of polyethylene terephthalate (PET) and aluminium alloy (A5052). Mater. Des. 2012, 37, 410–415. [Google Scholar] [CrossRef]
  14. Park, J.-W.; Yang, C.-W.; Kang, Y.-H.; Lee, J.-S. The effect of alloy compositions on the joint strength of carbon steels welded by the extended hot-rolling process. Mater. Sci. Eng. A 2012, 558, 319–325. [Google Scholar] [CrossRef]
  15. Zhang, S.J.; Yao, Y.F.; Li, L.C.; Wang, L.J.; Li, J.X.; Li, Q. Kinematics Analysis and Optimization of the Fast Shearing extrusion Joining Mechanism for Solid-state Metal. Chin. J. Mech. Eng. 2015, 6, 123–1131. [Google Scholar] [CrossRef]
  16. Yao, Y.F.; Li, L.C.; Zhang, S.J.; Li, J.X.; Li, Q. Characteristic Analysis and Optimization of Fast Shearing extrusion joining Mechanism for Intermediate Billet. Mech. Des. 2016, 33, 85–89. [Google Scholar]
  17. Ma, S.B.; Hou, R.D.; Shao, M.J.; Zhang, S.J.; Sun, C.F. Microstructure and interface evolution of solid metal shear bonding. J. Plasticity Eng. 2017, 24, 204–211. [Google Scholar]
  18. He, Y. Study on Key Parameters of Metal Rapid Shear Extrusion Connection. Master’s Thesis, Hebei University of Science and Technology, Shijiazhuang, China, 20 December 2015. [Google Scholar]
  19. Zhang, S.J.; Li, Y.X.; Ma, S.B.; Yan, H.J.; Mao, H.E. Optimization of key parameters for metal deformation of rapid shear extrusion bonding. J. Plasticity Eng. 2017, 24, 69–77. [Google Scholar]
  20. Wang, W.; Zhao, J.; Zhai, R.X.; Ma, R. Arrhenius-Type Constitutive Model and Dynamic Recrystallization Behavior of 20Cr2Ni4A Alloy Carburizing Steel. Steel Res. Int. 2016, 88. [Google Scholar] [CrossRef]
  21. Li, D.; Xu, L.; Huang, X.; Dai, G. Investigation on Critical Strain of Dynamic Recrystallization for 7A04 Aluminum Alloy. J. Mater. Eng. 2013, 3, 23–27. [Google Scholar]
  22. Tong, X.S.; Peng, J.; Shi, D.W.; Pan, F.S.; Peng, Y. Characterization of hot deformation behavior and critical conditions of dynamic recrystallization of ZM21 and ZM61 alloys. Chin. J. Nonferrous Met. 2013, 23, 2069–2076. [Google Scholar]
  23. Saadatkia, S.; Mirzadeh, H.; Cabrera, J.-M. Hot deformation behavior, dynamic recrystallization, and physically-based constitutive modeling of plain carbon steels. Mater. Sci. Eng. A 2015, 636, 196–202. [Google Scholar] [CrossRef] [Green Version]
  24. Wang, M.H.; Chen, M.L.; Wang, R.; Wang, G.T. High Temperature Flow Stress Model and Thermal Processing of 2Cr12NiMo1W1V Supercritical Steel. J. Cent. South Univ. (Nat. Sci. Ed.) 2016, 3, 741–748. [Google Scholar]
  25. Mosleh, A.O.; Mikhaylovskaya, A.V.; Kotov, A.D.; Portnoy, V.K. Arrhenius-Type Constitutive Equation Model of Superplastic Deformation Behaviour of Different Titanium Based Alloys. Defect Diffus. Forum 2018, 385, 45–52. [Google Scholar] [CrossRef]
  26. Gang, C.; Wei, C.; Li, M.; Guo, A.Z.; Lv, J.; Zhang, Z.M.; Zheng, S.Q. Strain-Compensated Arrhenius-Type Constitutive Model for Flow Behavior of Al-12Zn-2.4Mg-1.2Cu Alloy. Rare Metal Mater. Eng. 2015, 44, 2120–2125. [Google Scholar] [CrossRef]
  27. Zhao, J.W.; Ding, H.; Zhao, W.H.; Huang, M.L.; Wei, D.B.; Jiang, Z.Y. Modelling of the hot deformation behaviour of a titanium alloy using constitutive equations and artificial neural network. Comput. Mater. Sci. 2014, 92, 47–56. [Google Scholar] [CrossRef]
  28. Bobbili, R.; Madhu, V. Constitutive modeling and fracture behavior of a biomedical Ti–13Nb-13Zr alloy. Mater. Sci. Eng. A 2017, 700, 82–91. [Google Scholar] [CrossRef]
  29. Bobbili, R.; Ramudu, B.V.; Madhu, V. A physically-based constitutive model for hot deformation of Ti-10-2-3 alloy. J. Alloy Compd. 2017, 696, 295–303. [Google Scholar] [CrossRef]
  30. He, A.; Wang, X.-T.; Xie, G.-L.; Yang, X.-Y.; Zhang, H.-L. Modified Arrhenius-type Constitutive Model and Artificial Neural Network-based Model for Constitutive Relationship of 316LN Stainless Steel during Hot Deformation. J. Iron Steel Res. Int. 2015, 8, 721–729. [Google Scholar] [CrossRef]
  31. Chen, T.A.; Chen, X.W.; Zhou, H.J.; Zhu, M.L. Dynamic Recrystallization Model for 45Cr4NiMoV Steel. Hot Work Tech. 2015, 44, 50–53. [Google Scholar]
  32. Solhjoo, S. Determination of flow stress and the critical strain for the onset of dynamic recrystallization using a hyperbolic tangent function. Mater. Des. 2014, 54, 390–393. [Google Scholar] [CrossRef]
  33. Yang, Z.Q.; Liu, Y.; Tian, B.H.; Zhang, Y. Model of critical strain for dynamic recrystallization in 10%TiC/Cu-Al2O3 composite. J. Cent. South Univ. 2014, 21, 4059–4065. [Google Scholar] [CrossRef]
  34. Mirzadeh, H.; Najafizadeh, A. Prediction of the critical conditions for initiation of dynamic recrystallization. Mater. Des. 2010, 31, 1174–1179. [Google Scholar] [CrossRef]
  35. Zhao, B.C.; Zhao, T.; Li, G.Y.; Lu, Q. The kinetics of dynamic recrystallization of a low carbon vanadium-nitride microalloyed steel. Mater. Sci. Eng. A 2014, 604, 117–121. [Google Scholar] [CrossRef]
  36. Fang, B.; Ji, Z.; Liu, M.; Tian, G.F.; Jia, C.C.; Zeng, T.T.; Hu, B.F.; Chang, Y.H. Critical strain and models of dynamic recrystallization for FGH96 superalloy during two-pass hot deformation. Mater. Sci. Eng. A 2014, 593, 8–15. [Google Scholar] [CrossRef]
  37. Jonas, J.J.; Quelennec, X.; Jiang, L.; Martin, E. The Avrami kinetics of dynamic recrystallization. Acta Mater. 2009, 57, 2748–2756. [Google Scholar] [CrossRef]
Figure 1. Shear connection diagram.
Materials 12 02186 g001
Figure 2. Technological process.
Materials 12 02186 g002
Figure 3. True stress-strain relationship curves of Q345 steel: (a) ε ˙ = 0.01 s−1; (b) ε ˙ = 0.1 s−1; (c) ε ˙ = 1.0 s−1; (d) ε ˙ = 10 s−1.
Materials 12 02186 g003
Figure 4. Correlation coefficient fitting: (a) In ε ˙ -Inσ; (b) In ε ˙ -σ; (c) In ε ˙ -In[sinh(ασ)]; (d) In[sinh(ασ)]-1/T; (e) InZ-In[sinh(ασ)].
Materials 12 02186 g004
Figure 5. Critical strain and peak strain solution curve: (a) Inθ-ε ( ε ˙ = 0.01 s−1); (b) Inθ-ε ( ε ˙ = 0.1 s−1); (c) Inθ-ε ( ε ˙ = 0.01 s−1); (d) Inθ-ε ( ε ˙ = 0.1 s−1).
Materials 12 02186 g005
Figure 6. Material constant linear regression solution: (a) Inεp-In ε ˙ ; (b) Inεp-1/T; (c) εp-Zm1.
Materials 12 02186 g006
Figure 7. Dynamic recovery and dynamic recrystallization curve. (a) Dynamic recovery curve; (b) Dynamic recrystallization curve.
Materials 12 02186 g007
Figure 8. Linear regression results of dynamic recrystallization equation: (a) lnεp-ln ε ˙ ; (b) lnεp-1/T.
Materials 12 02186 g008
Figure 9. Process of cut connection: (a) before cutting the connection; (b) after cutting the connection.
Materials 12 02186 g009
Figure 10. Q345 steel prior austenite structure.
Materials 12 02186 g010
Figure 11. Dynamic recrystallized grain size: (a) L = 100%; (b) L = 125%; (c) L = 150%.
Materials 12 02186 g011
Figure 12. Dynamic recrystallization volume percentage: (a) L = 100%; (b) L = 125%; (c) L = 150%.
Materials 12 02186 g012
Figure 13. Tracking point location.
Materials 12 02186 g013
Figure 14. Dynamic recrystallized grain size at each tracking point: (a) L = 100%; (b) L = 125%; (c) L = 150%.
Materials 12 02186 g014aMaterials 12 02186 g014b
Figure 15. Dynamic recrystallization volume percentage of each tracking point: (a) L = 100%; (b) L = 125%; (c) L = 150%.
Materials 12 02186 g015
Figure 16. Temperature changes during the shear connection process: (a) L = 100%; (b) L = 125%; (c) L = 150%.
Materials 12 02186 g016
Figure 17. Microscopic morphology at different pressure amounts: (a) L = 100%; (b) L = 125%; (c) L = 150%.
Materials 12 02186 g017
Table 1. Chemical component of Q345.
Chemical ElementCMnSCrNiSiFe
Element Content (wt %)0.180.420.00980.0060.0130.147Bal.
Table 2. Main parameters of Gleeble-3800 thermal simulator.
Main ParametersValue
Maximum Heating Rate10000 °C/s
Maximum Quenching Rate1000 °C/s
Maximum Stroke100 mm
Maximum Stroke Rate2000 mm/s
Maximum Compression Tonnage20 t
Maximum Tensile Tonnage10 t
Maximum Sample SizeΦ20 mm
Temperature Rangeroom temperature~1700 °C
Resolving Power1 °C
Table 3. Critical strain and peak strain.
ε ˙ (s−1)T (°C)εcεp
0.019000.13020.2804
0.019500.10300.2178
0.0110000.08610.1832
0.0110500.06230.1305
0.0111000.06080.1250
0.1010000.14750.2822
0.1010500.09450.1919
0.1011000.08930.1848
Table 4. ε0.5 values under different test conditions.
ε ˙ (s−1)T (°C)ε0.5
0.019000.3352
0.019500.2945
0.0110000.2364
0.0110500.1809
0.0111000.1653
0.1010000.3419
0.1010500.2284
0.1011000.2455
Table 5. Dynamic recrystallized grain size under various deformation conditions.
ε ˙ (s−1) T (°C)dDRX (μm)
0.0190019.6
0.0195023.6
0.01100028.1
0.01105032.9
0.01110038.2
0.10100020.2
0.10105023.7
0.10110027.4
Table 6. Detailed parameters of finite element (FE) model.
ParameterBlank TemperatureBlank SizeShear Speedλ1λ2
Value1000 °C120 × 29 × 21.75 mm150 mm/s0.45 N/(s·mm·C)5 N/(s·mm·C)
λ1 is the friction coefficient of deformation. λ2 is the heat transfer coefficient between the blank and the die.
Table 7. Tracking point dynamic recrystallization grain size and volume percentage average.
Shear Pressure Amount (%)Average Grain Size d0 (μm)Average Volume Percentage XDrx (%)
10019.796.74
12519.9899.72
15021.74100
Table 8. Grain size during shear connection process.
Shear Pressure Amount (%)Experimental Average Grain Size d (μm)Simulated Grain Average Size d0 (μm)Average Error (%)
10019.219.72.6
12520.319.981.1
15022.221.742.1

