Figure 1.
Some applications of Rene 65 in jet engine [
4].
Figure 1.
Some applications of Rene 65 in jet engine [
4].
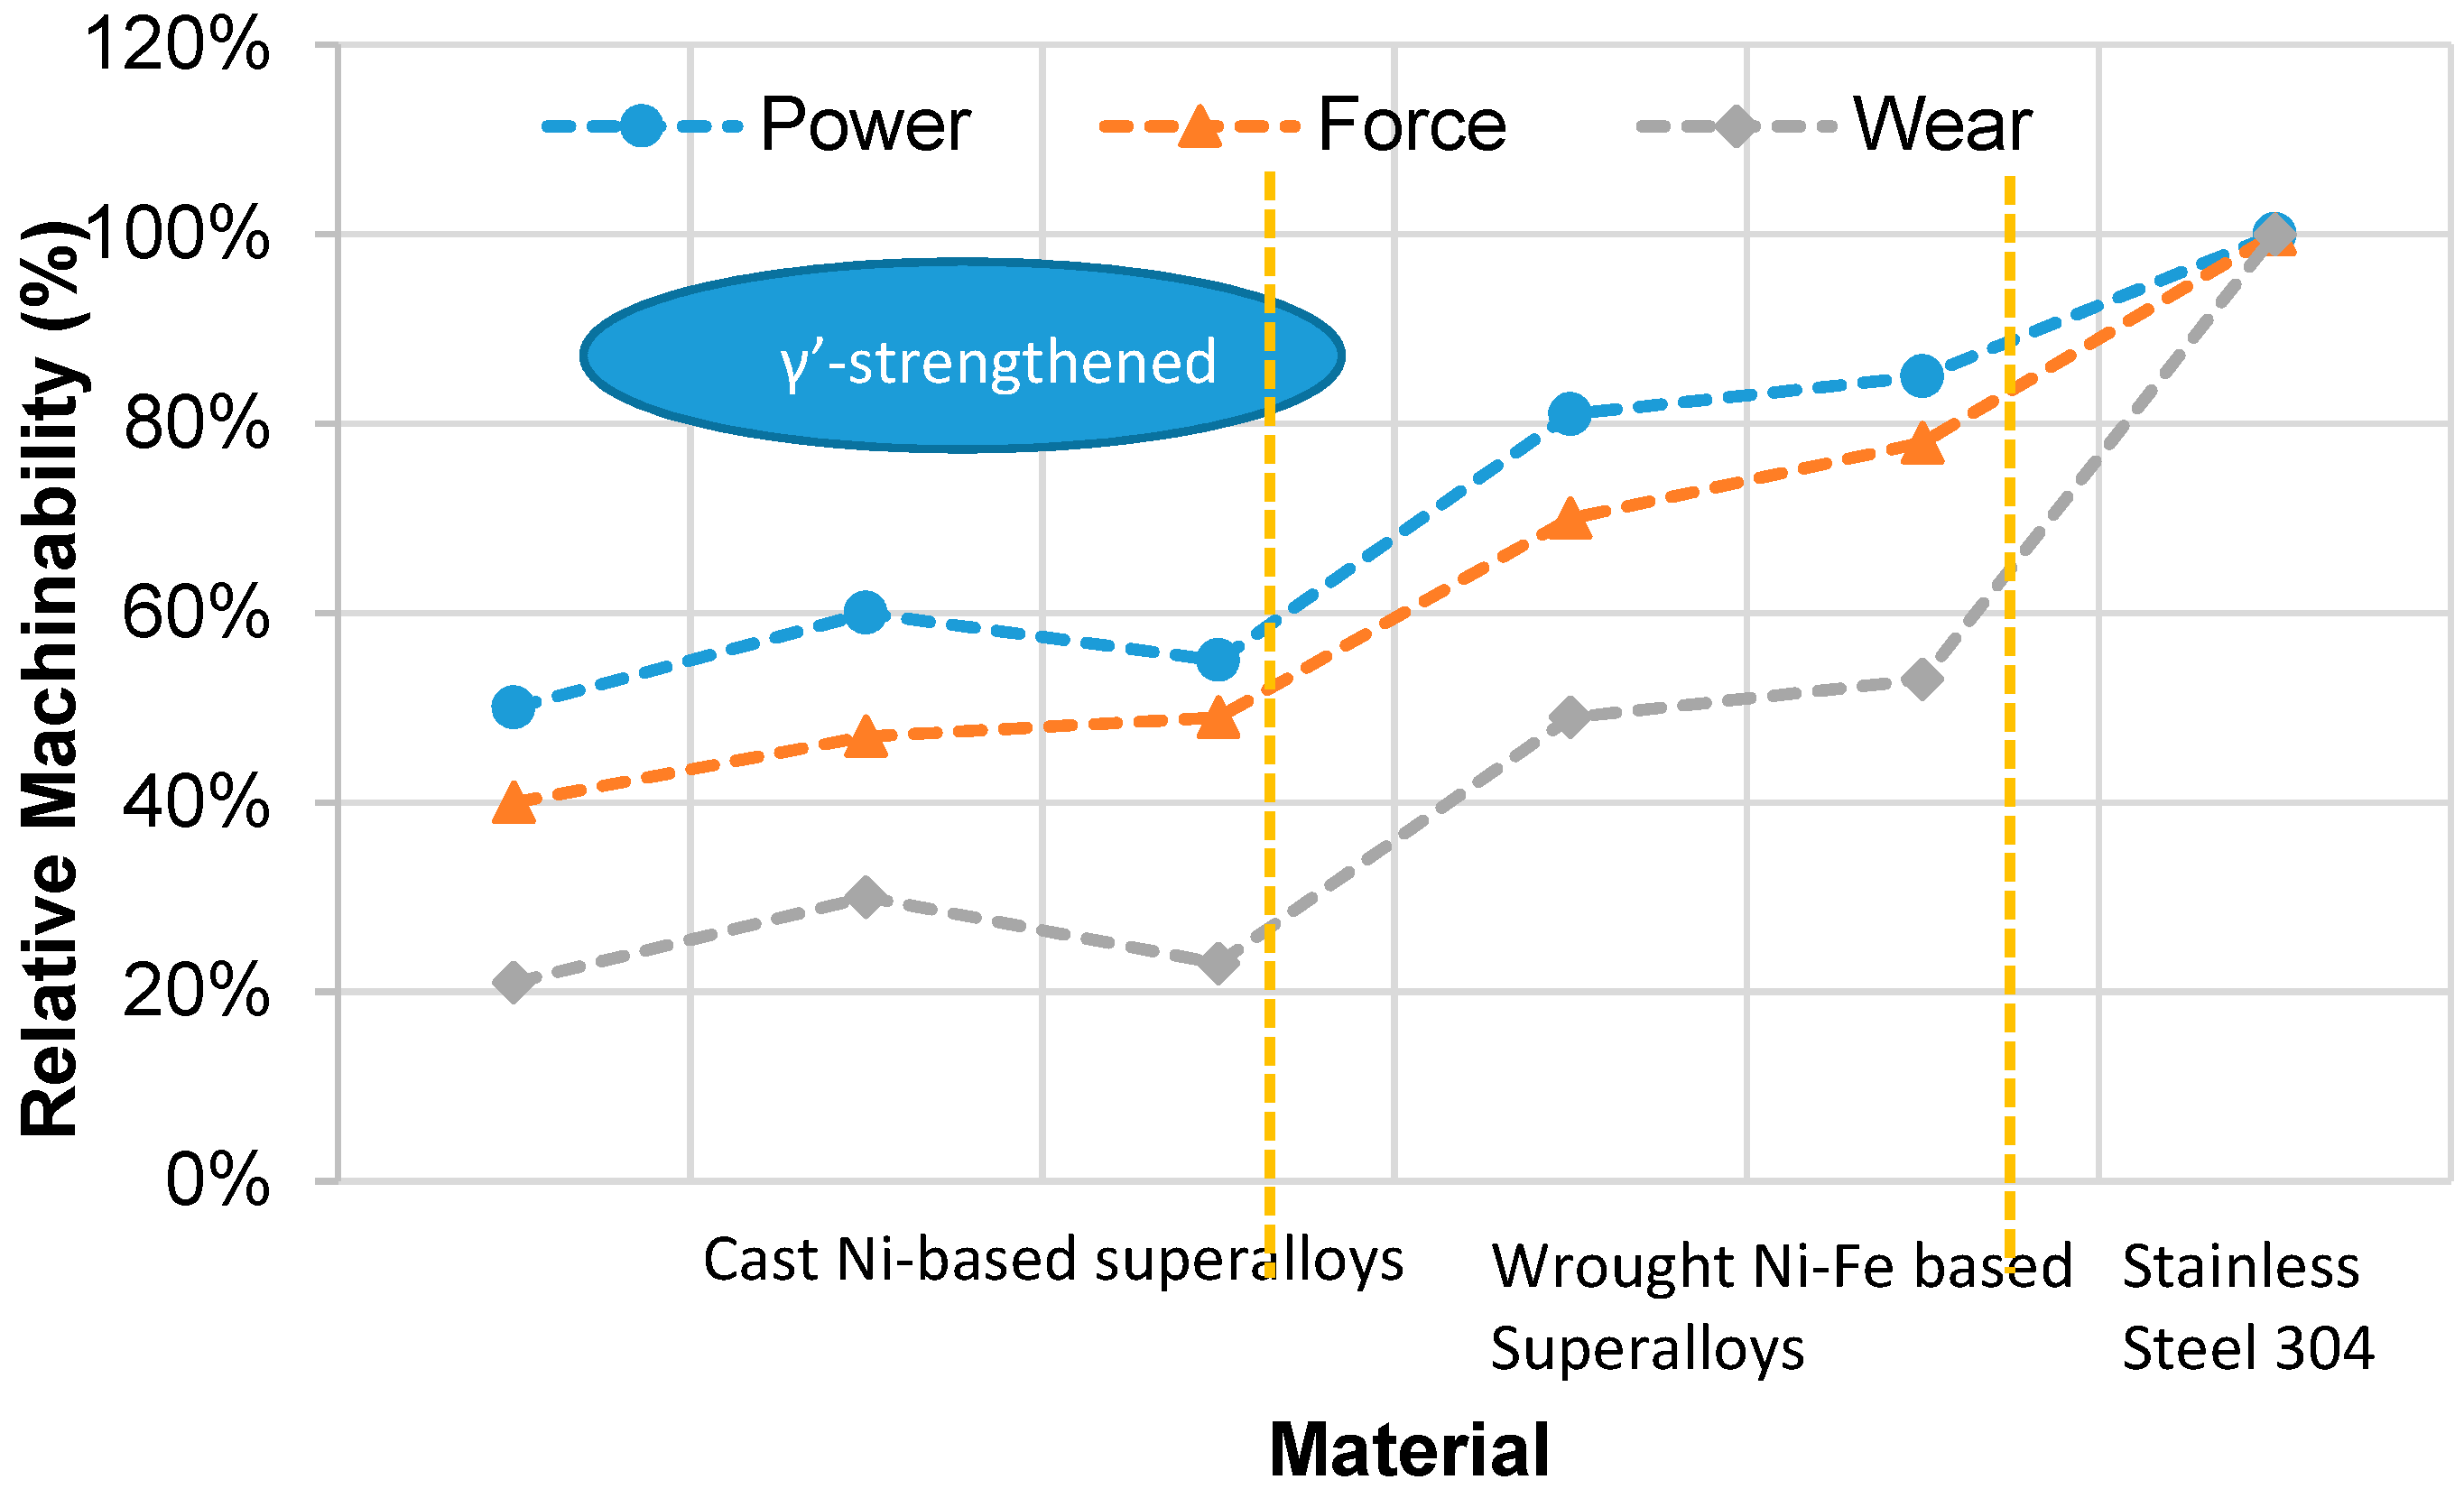
Figure 2.
Machinability rankings for two classes of nickel-based superalloys relative to stainless steel 304 [
10].
Figure 2.
Machinability rankings for two classes of nickel-based superalloys relative to stainless steel 304 [
10].
Figure 3.
Microstructures of Rene 65 (a) Scanning electron microscopy (SEM) image showing the primary, secondary and tertiary γ′ precipitates, (b) Optical image of γ′ precipitates along grain boundaries.
Figure 3.
Microstructures of Rene 65 (a) Scanning electron microscopy (SEM) image showing the primary, secondary and tertiary γ′ precipitates, (b) Optical image of γ′ precipitates along grain boundaries.
Figure 4.
MAZAK NEXUS 410A CNC vertical milling machine.
Figure 4.
MAZAK NEXUS 410A CNC vertical milling machine.
Figure 5.
Drilling tools used. (a) Coating Grade: K30F (A3293TTP-3); (b) Coating Grade: WJ30RE (DC150-03).
Figure 5.
Drilling tools used. (a) Coating Grade: K30F (A3293TTP-3); (b) Coating Grade: WJ30RE (DC150-03).
Figure 6.
Box-Behnken experiment design.
Figure 6.
Box-Behnken experiment design.
Figure 7.
Mitutoyo profilometer and the setup for the roughness acquisitions.
Figure 7.
Mitutoyo profilometer and the setup for the roughness acquisitions.
Figure 8.
Tool setup: (a). Tool and tool holder (b). Mounted workpiece on force dynamometer.
Figure 8.
Tool setup: (a). Tool and tool holder (b). Mounted workpiece on force dynamometer.
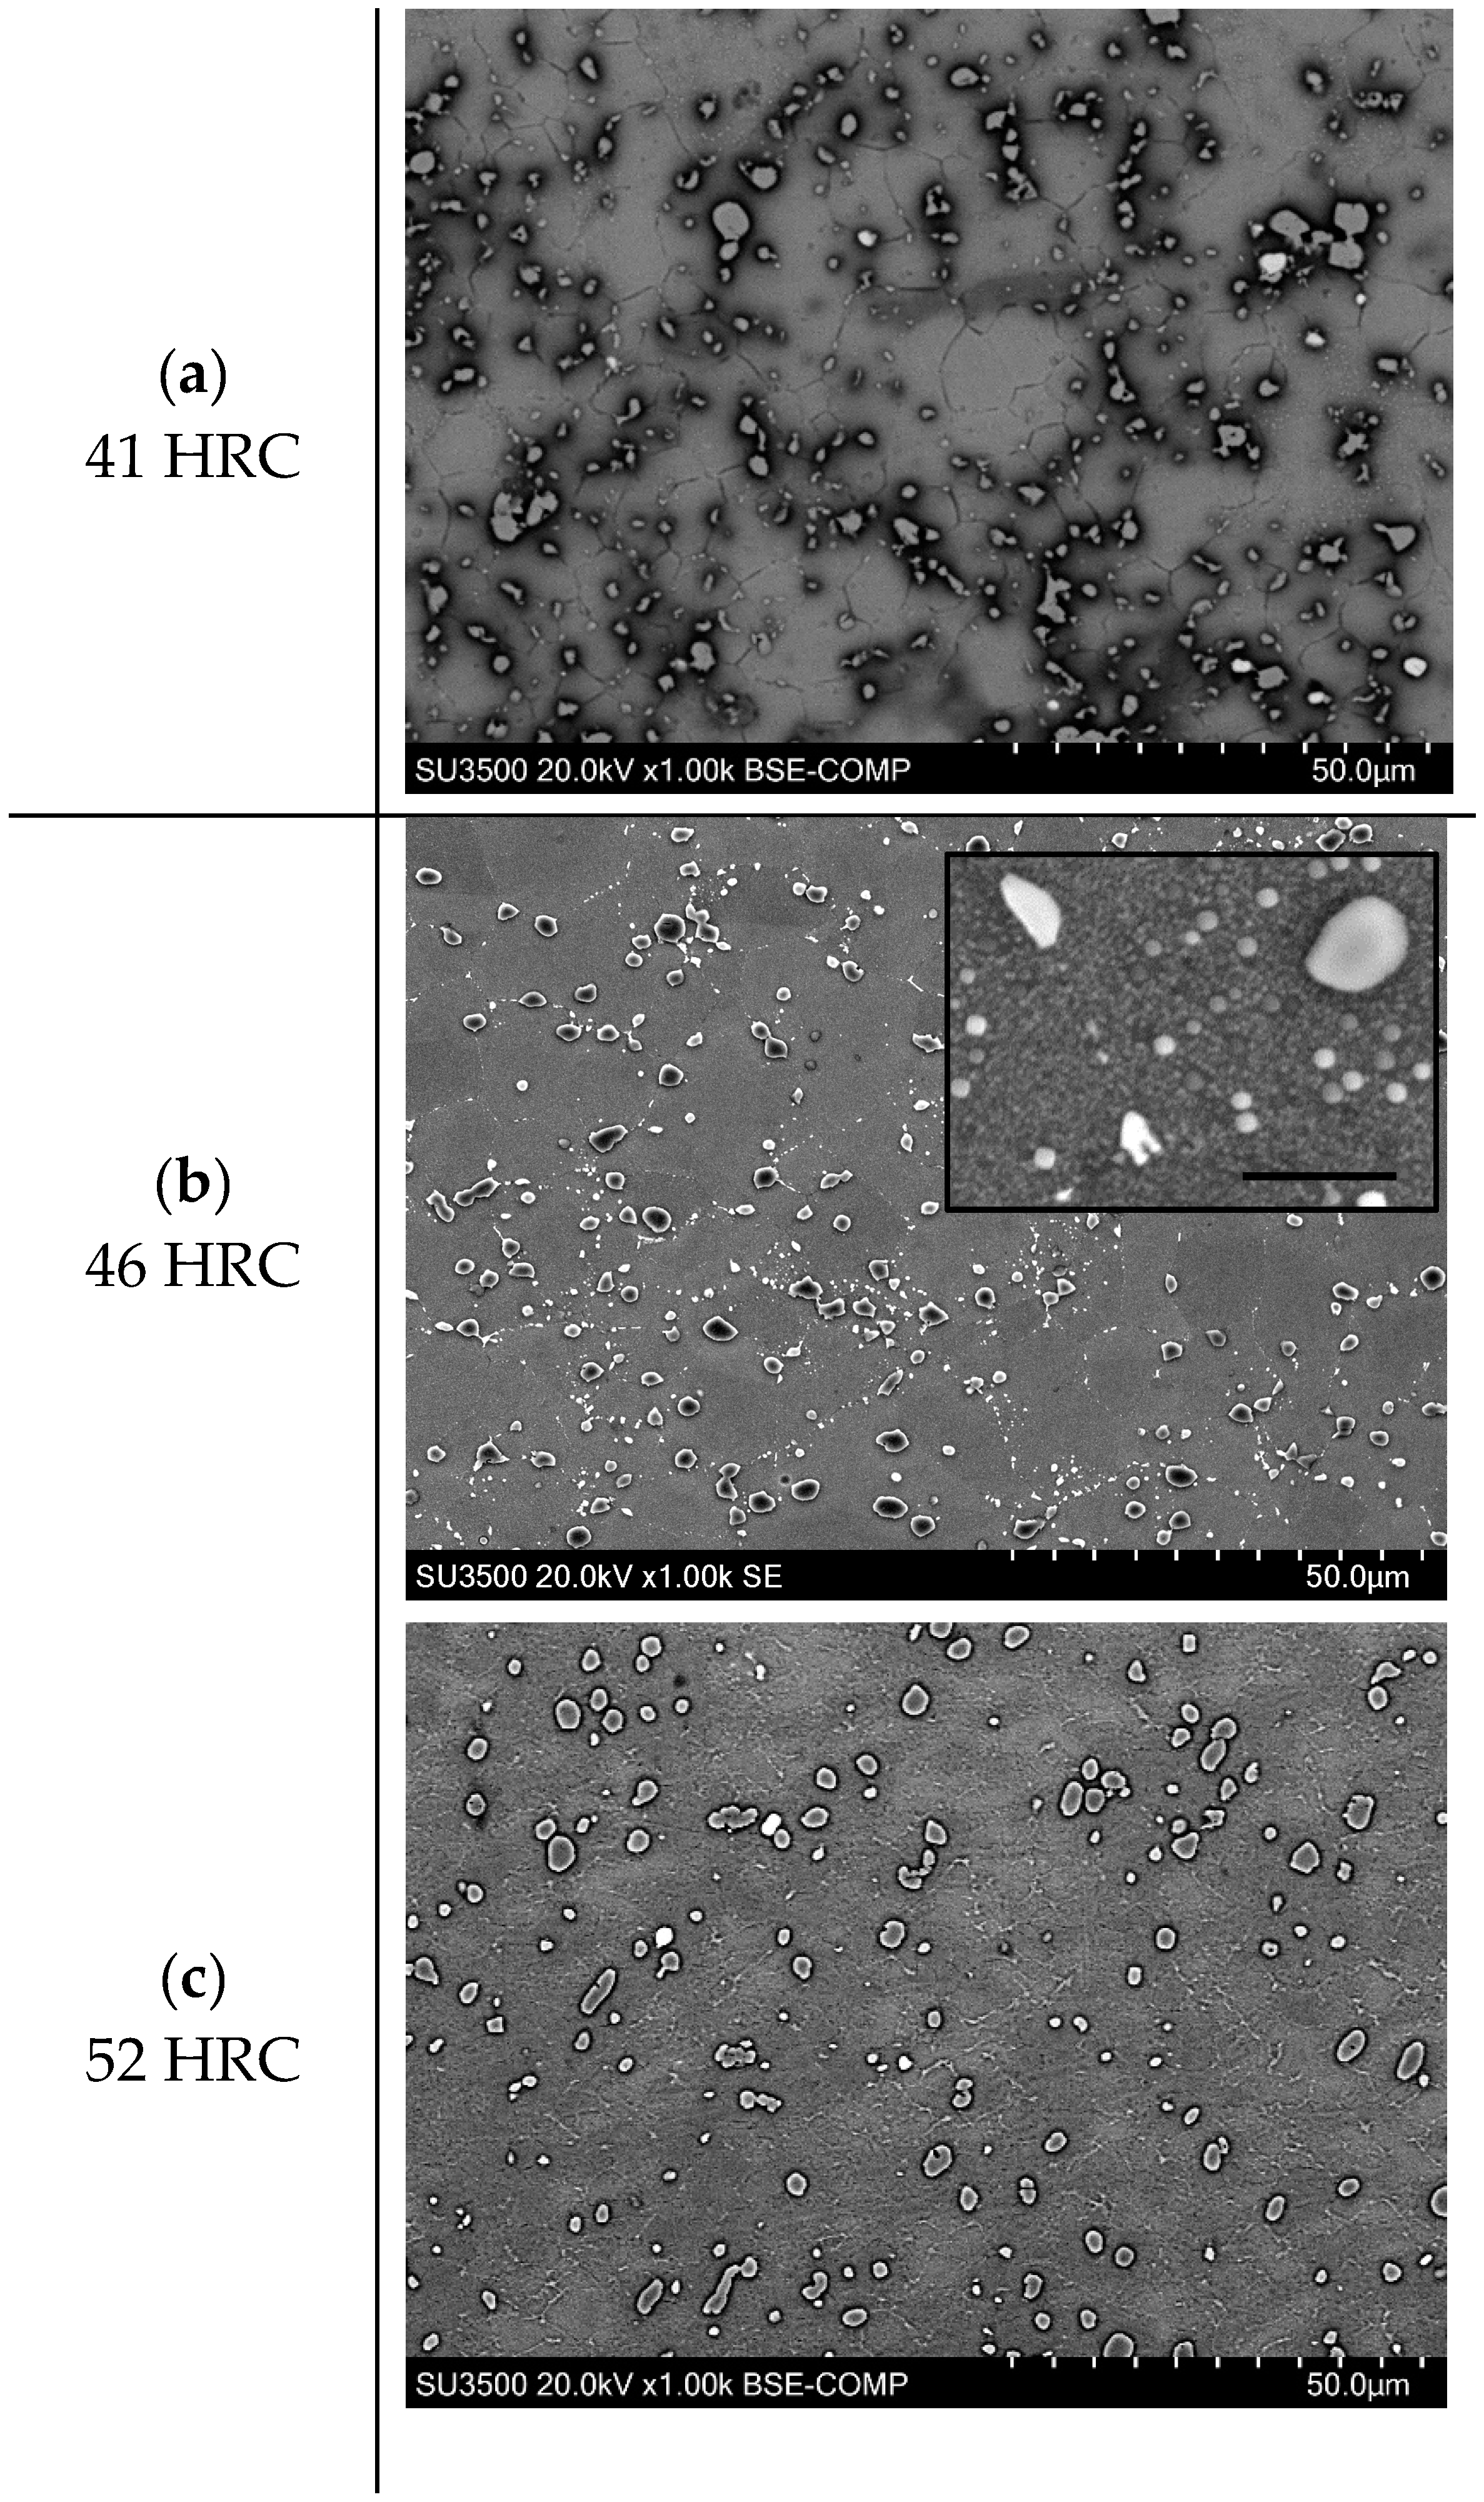
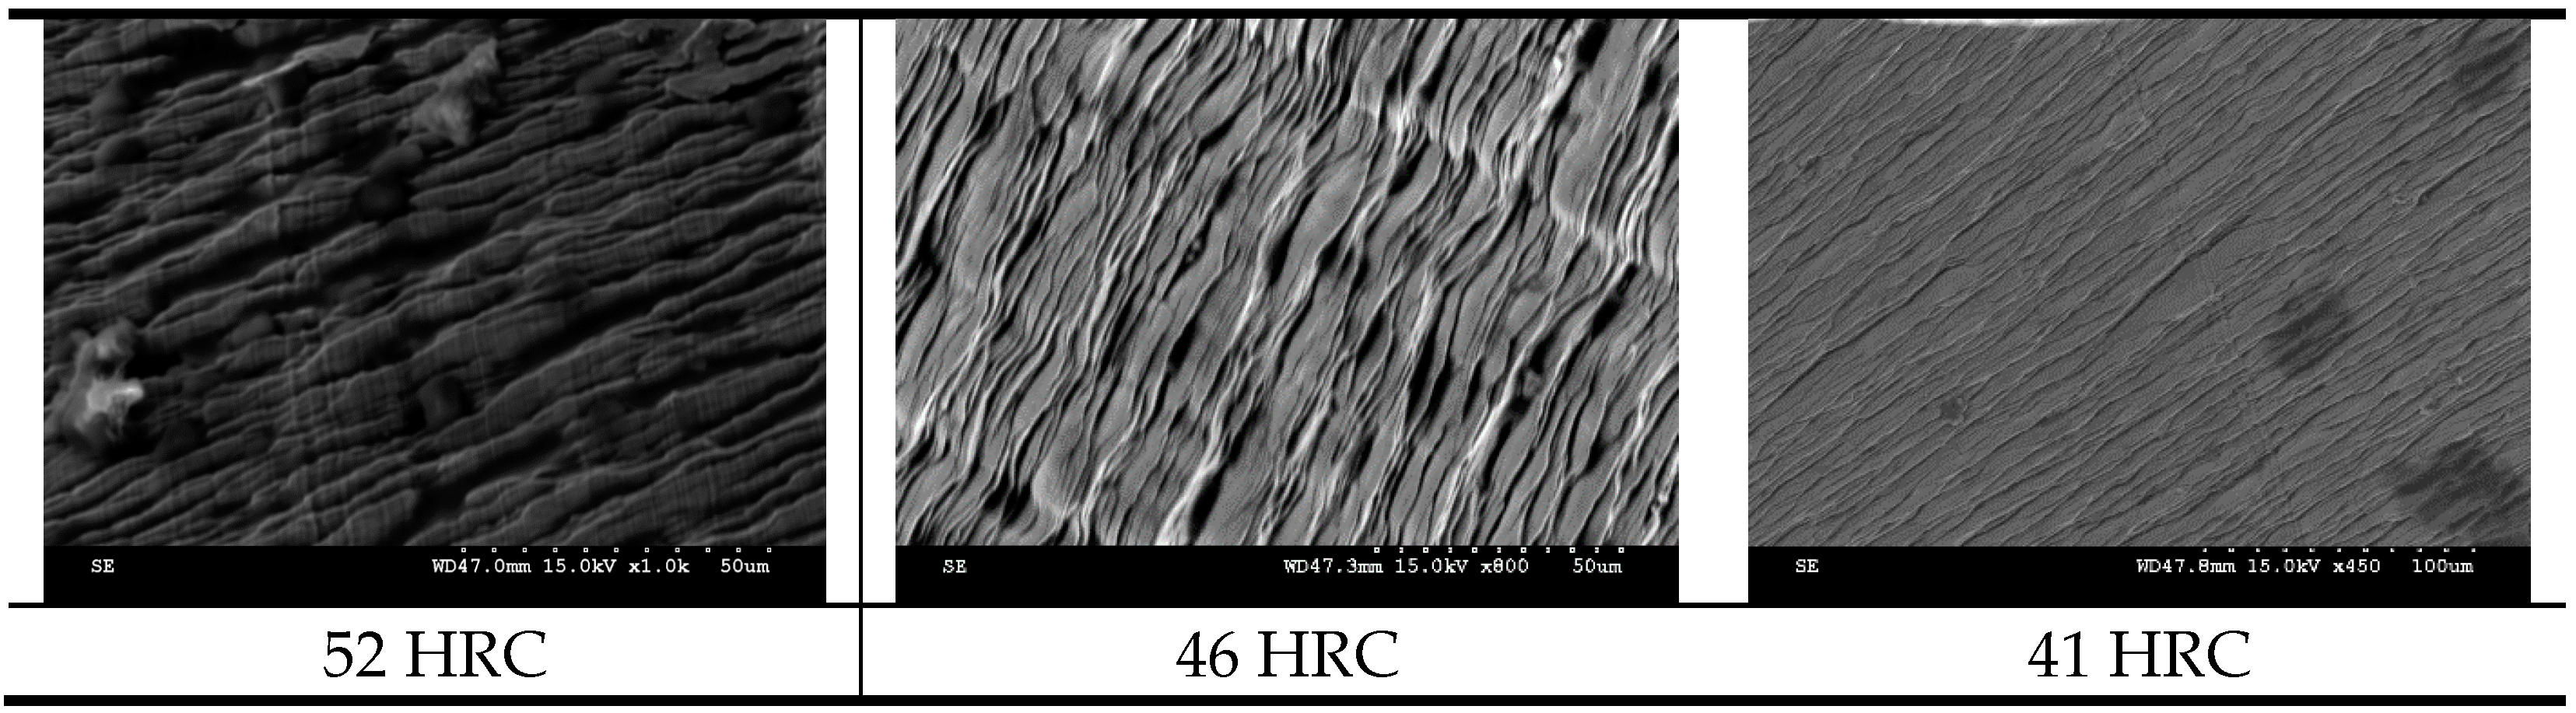
Figure 9.
Rene 65 Microstructure at: (a). 41 HRC (b) 46 HRC (c) 52 HRC.
Figure 9.
Rene 65 Microstructure at: (a). 41 HRC (b) 46 HRC (c) 52 HRC.
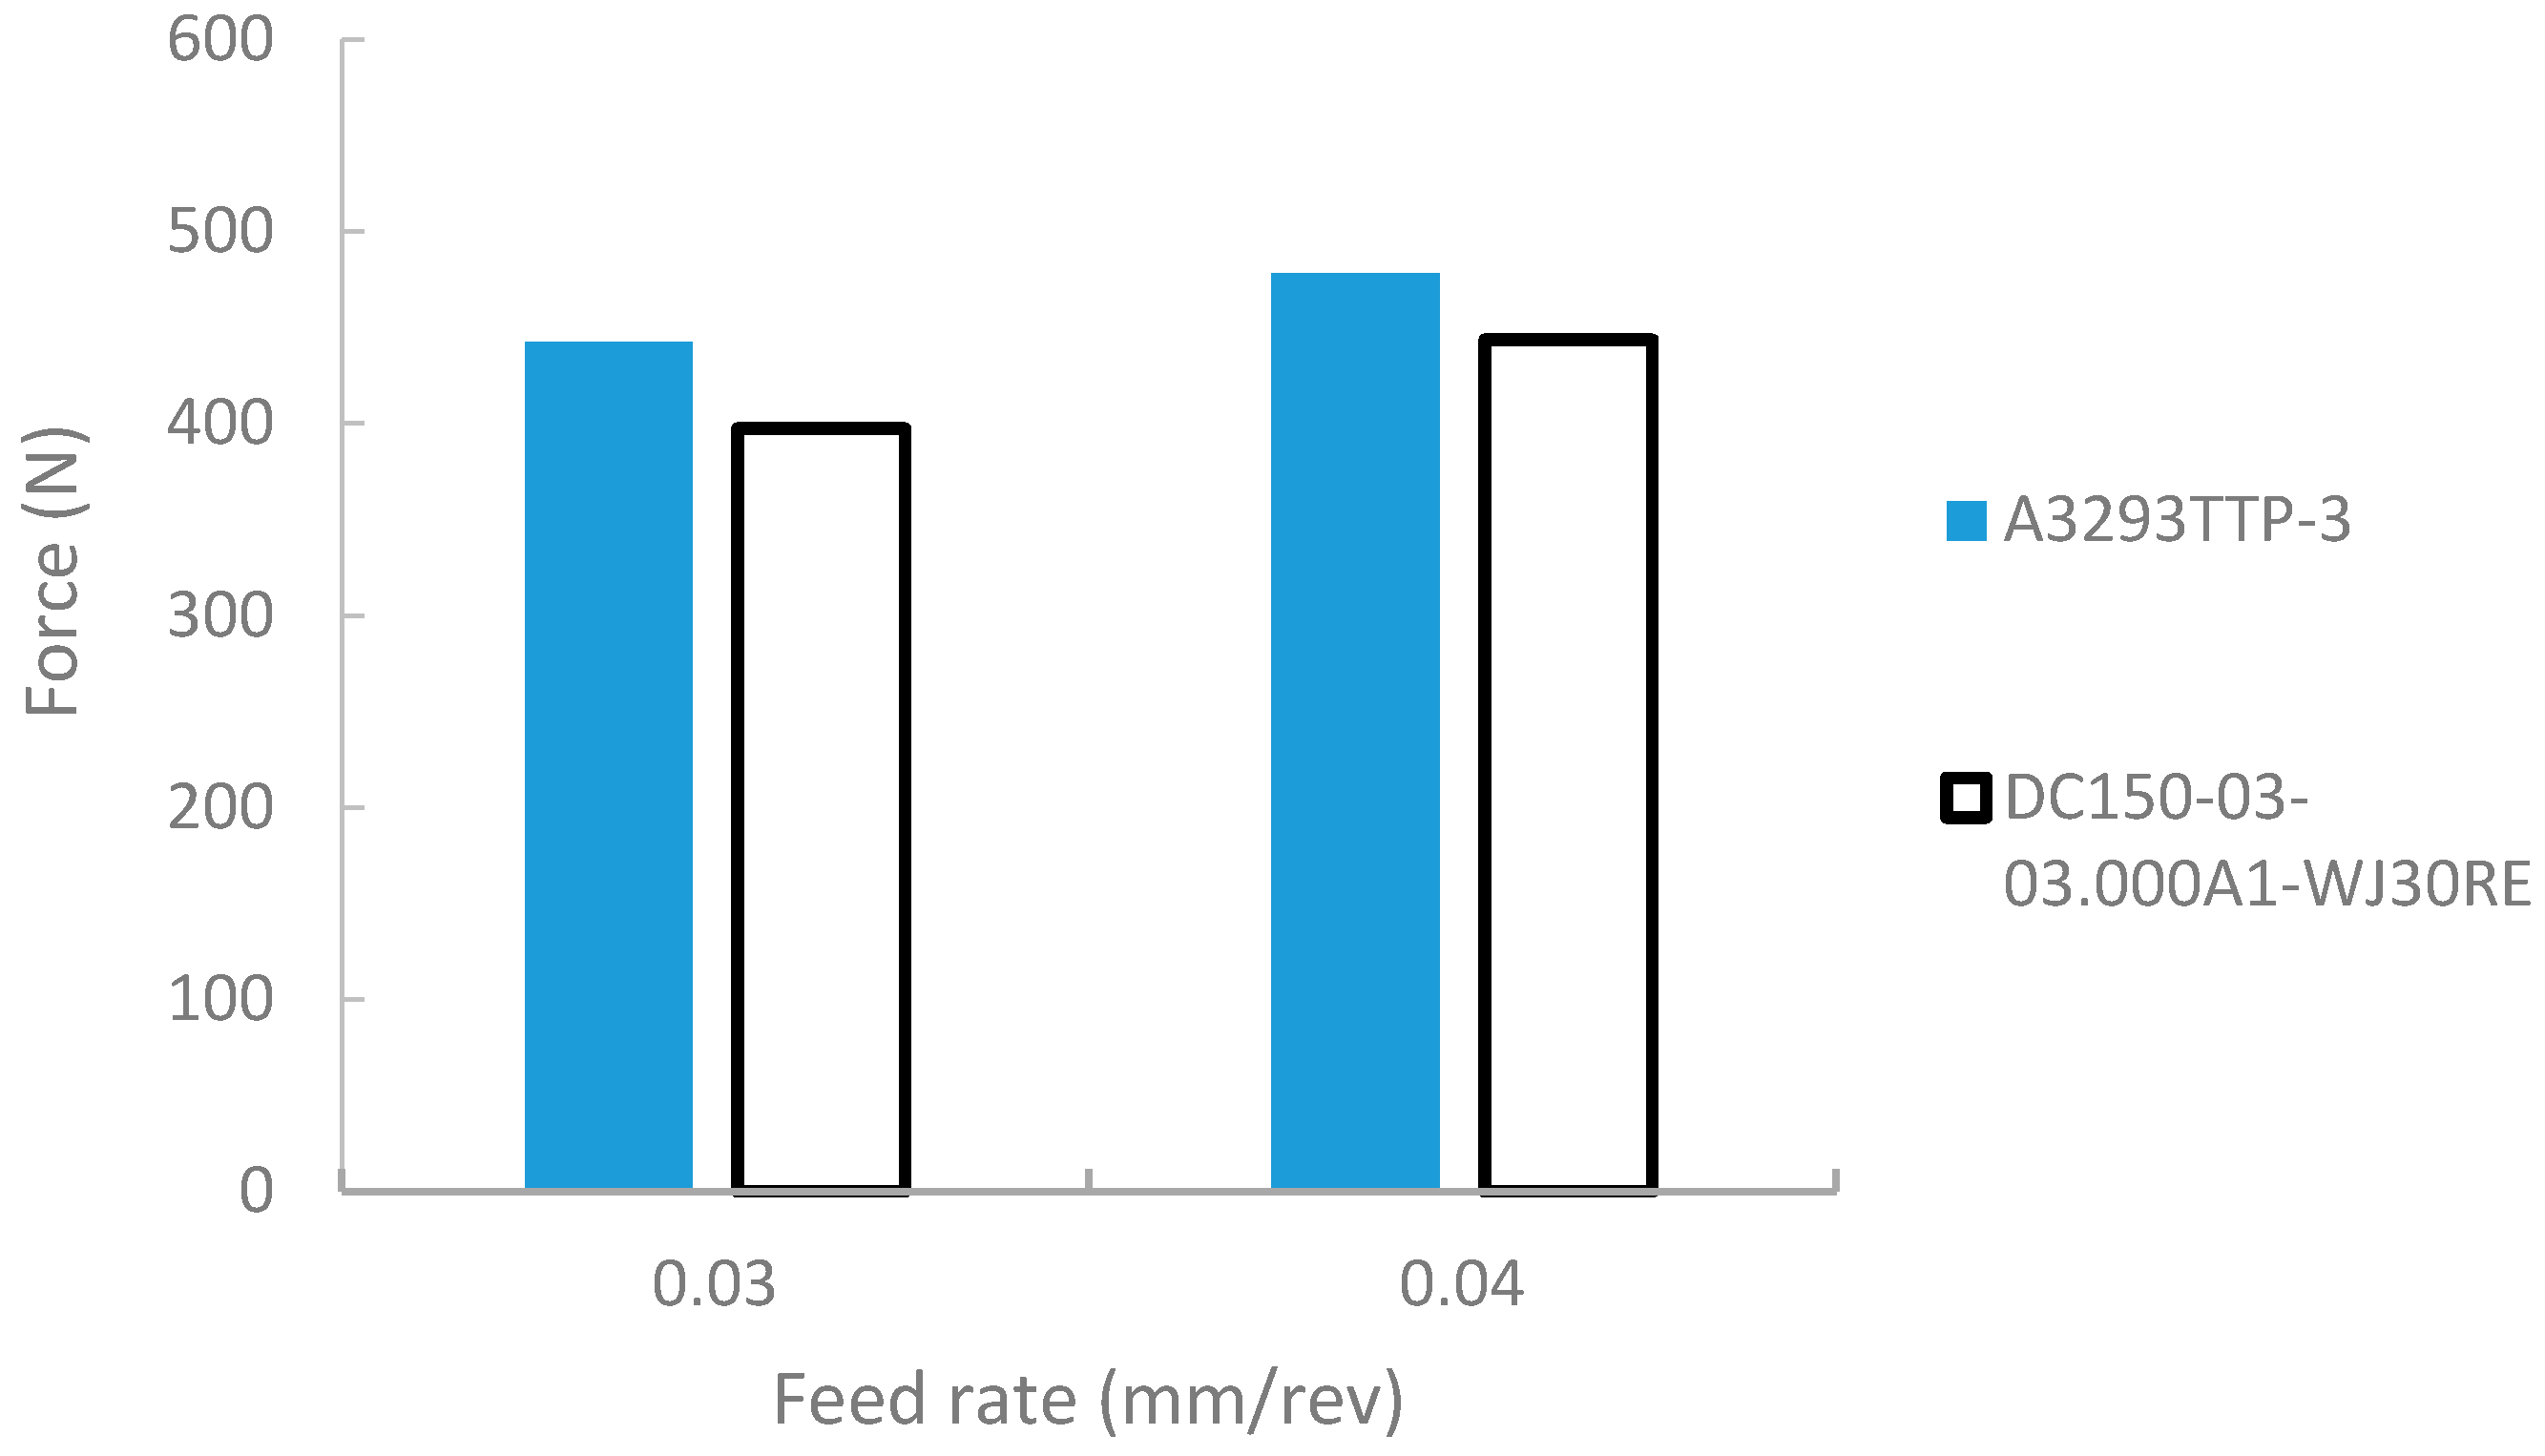
Figure 10.
Effect of cutting tool coating grade on cutting force.
Figure 10.
Effect of cutting tool coating grade on cutting force.
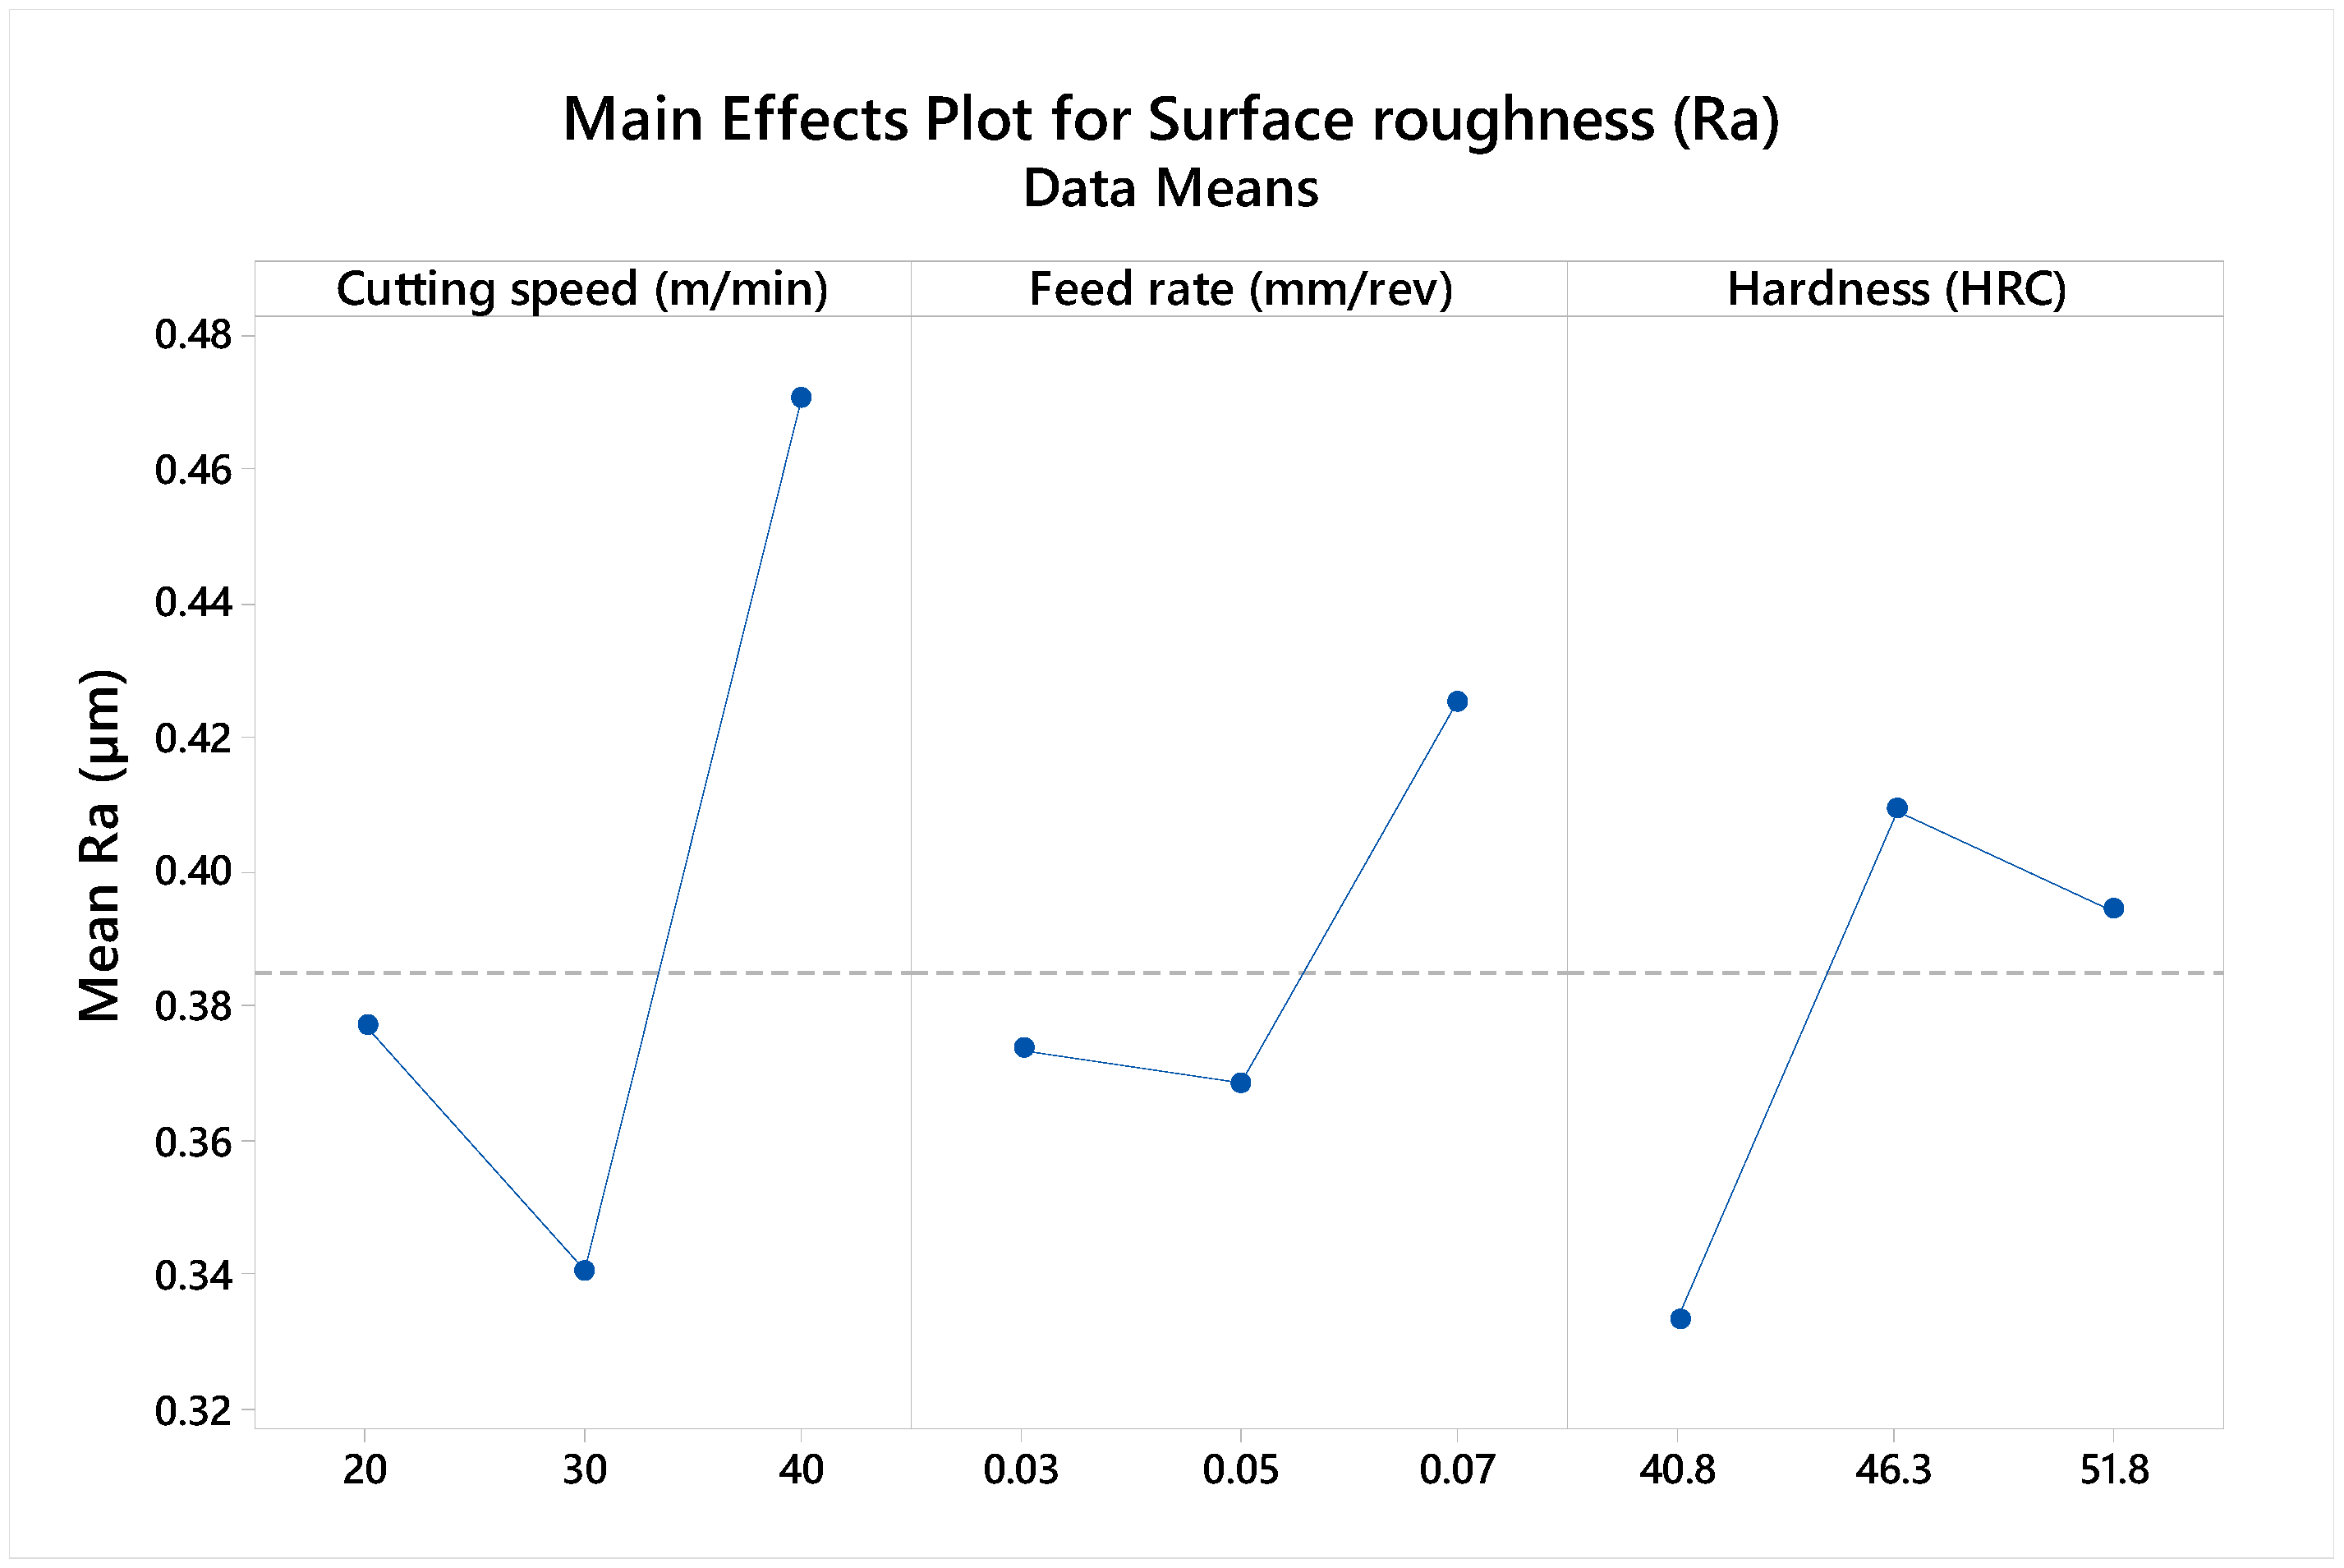
Figure 11.
Main effect plot of Ra (μm) to cutting parameters.
Figure 11.
Main effect plot of Ra (μm) to cutting parameters.
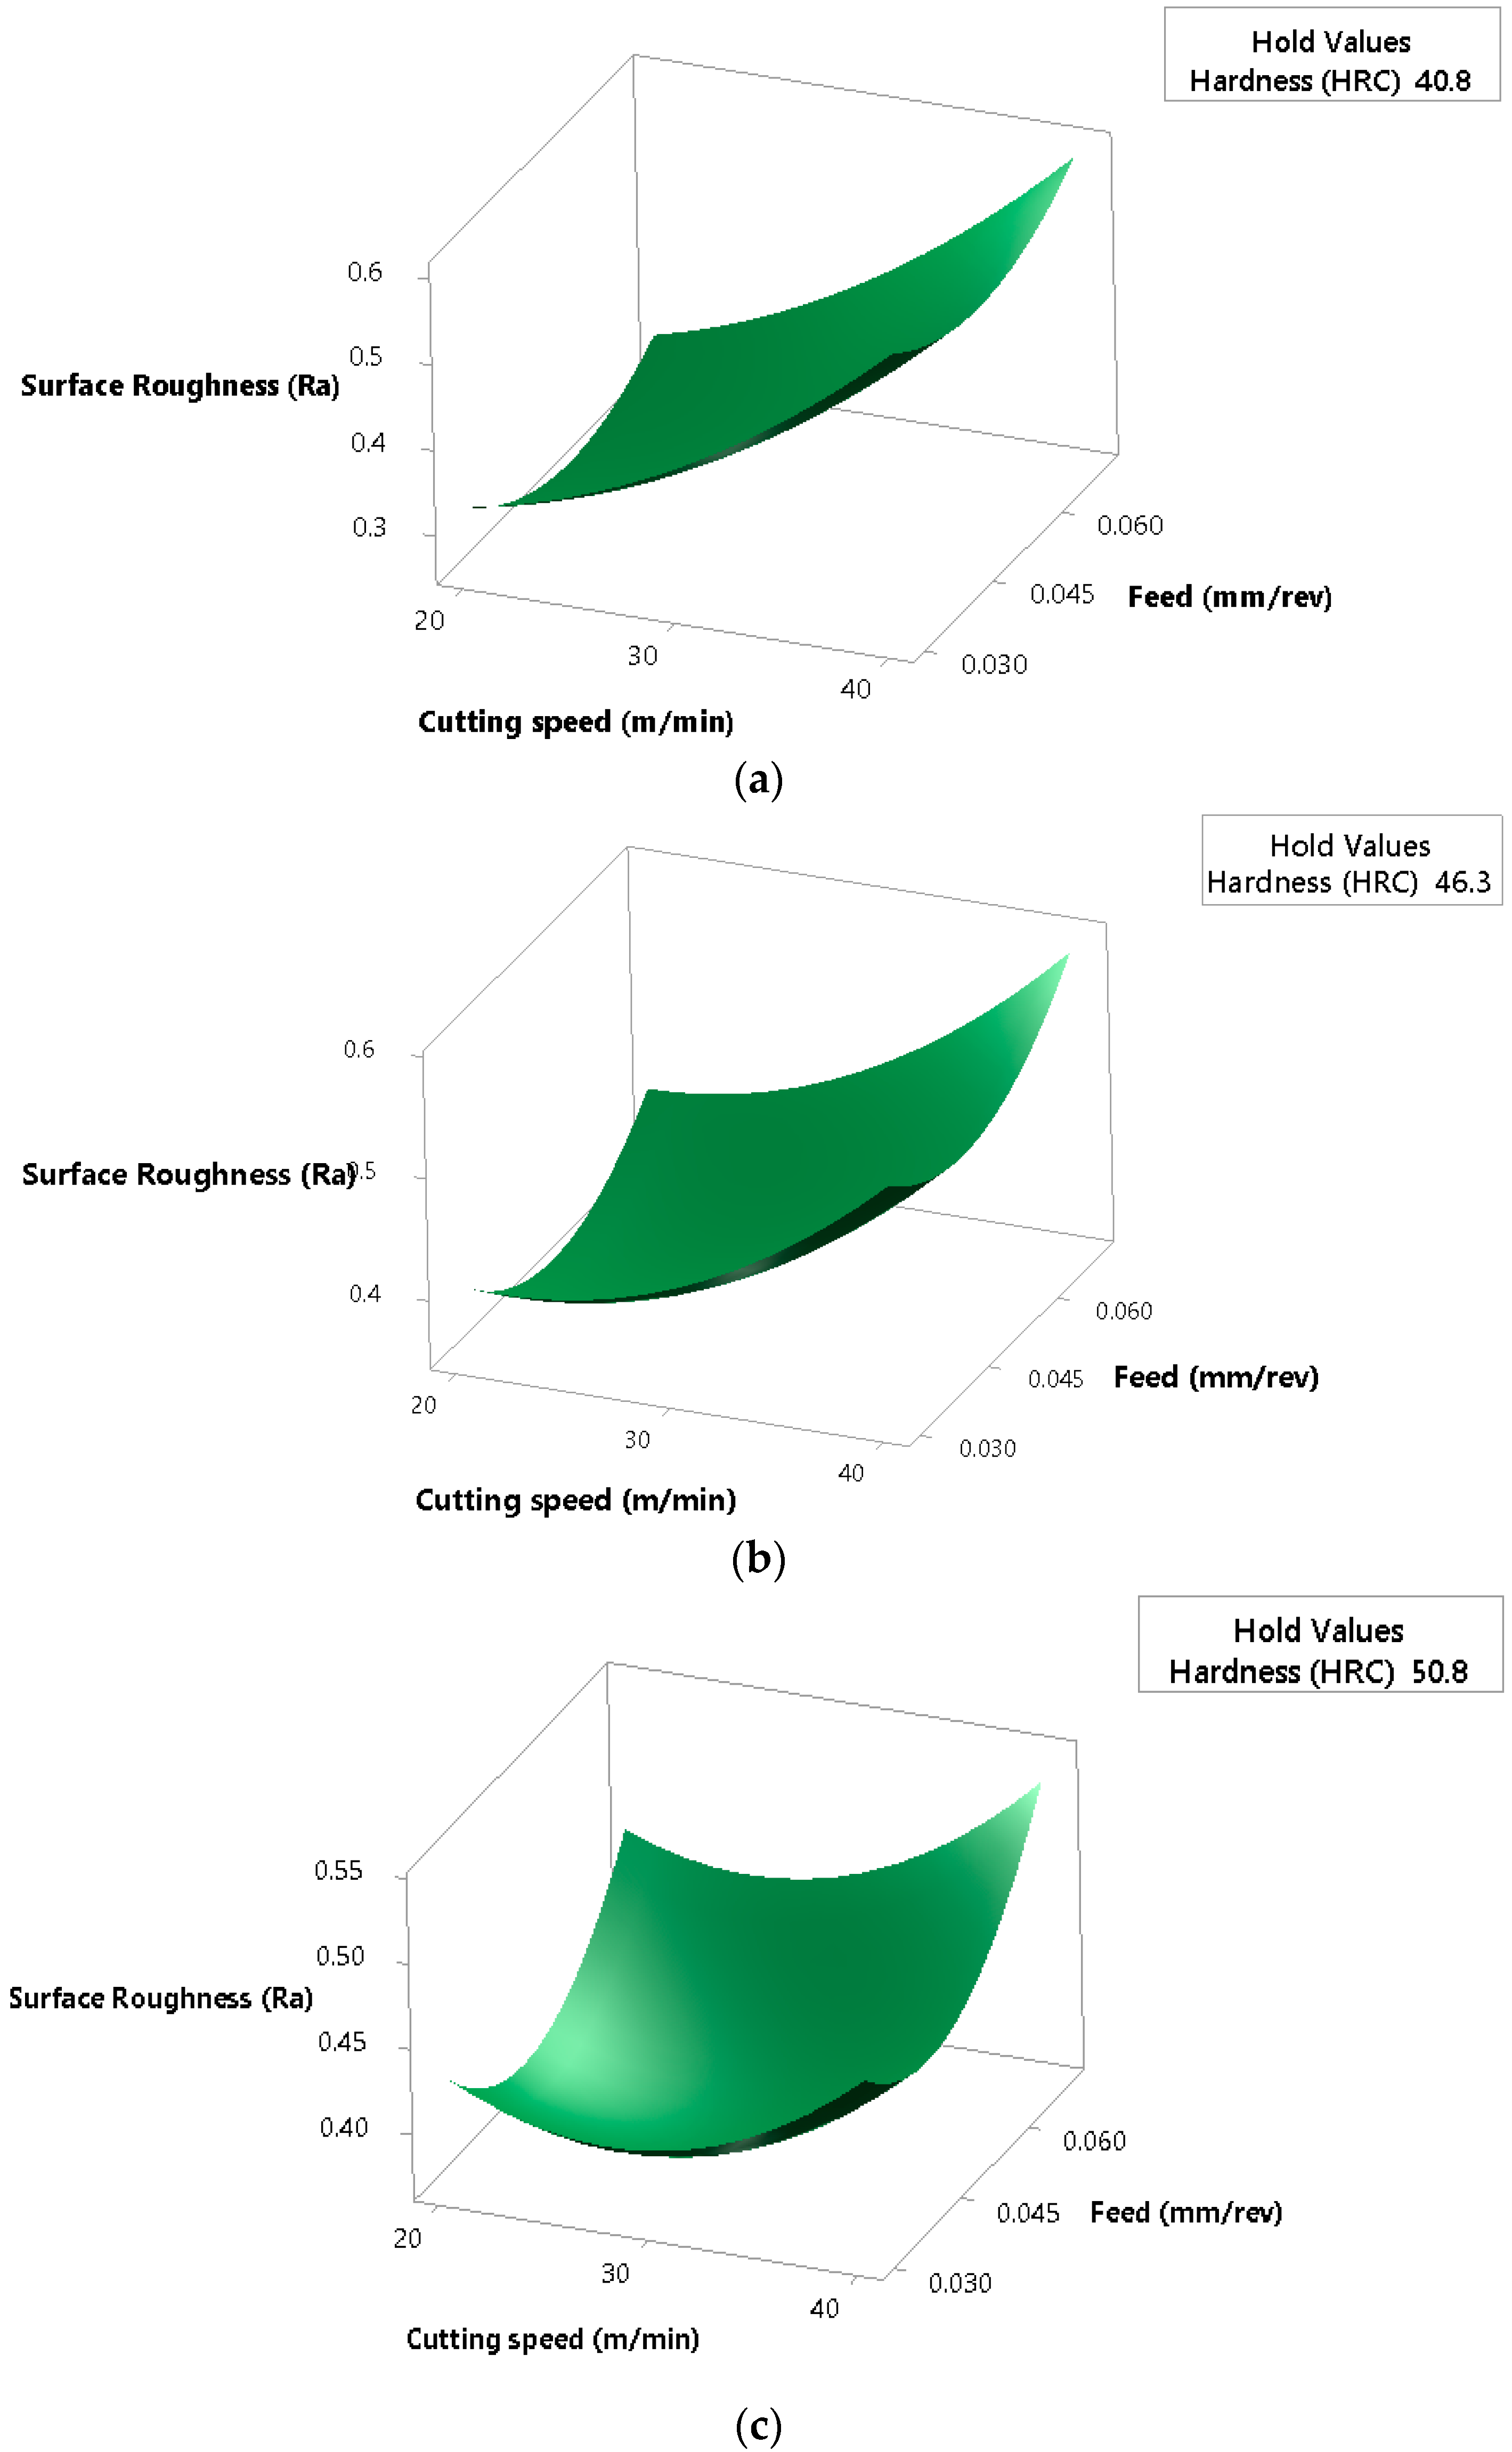
Figure 12.
Surface plots of roughness (Ra) versus cutting speed and feed rate at hardness values of: (a) 41 HRC (b) 46 HRC and (c) 52 HRC.
Figure 12.
Surface plots of roughness (Ra) versus cutting speed and feed rate at hardness values of: (a) 41 HRC (b) 46 HRC and (c) 52 HRC.
Figure 13.
Main effect plot of cutting force to cutting parameters.
Figure 13.
Main effect plot of cutting force to cutting parameters.
Figure 14.
Comparison of modeling technique on the effect of change in feed rate on cutting forces.
Figure 14.
Comparison of modeling technique on the effect of change in feed rate on cutting forces.
Figure 15.
Discoloration of cutting tool tip due to high generated temperatures at the edges.
Figure 15.
Discoloration of cutting tool tip due to high generated temperatures at the edges.
Figure 16.
Cutting forces profiles during dry drilling test of Rene 65.
Figure 16.
Cutting forces profiles during dry drilling test of Rene 65.
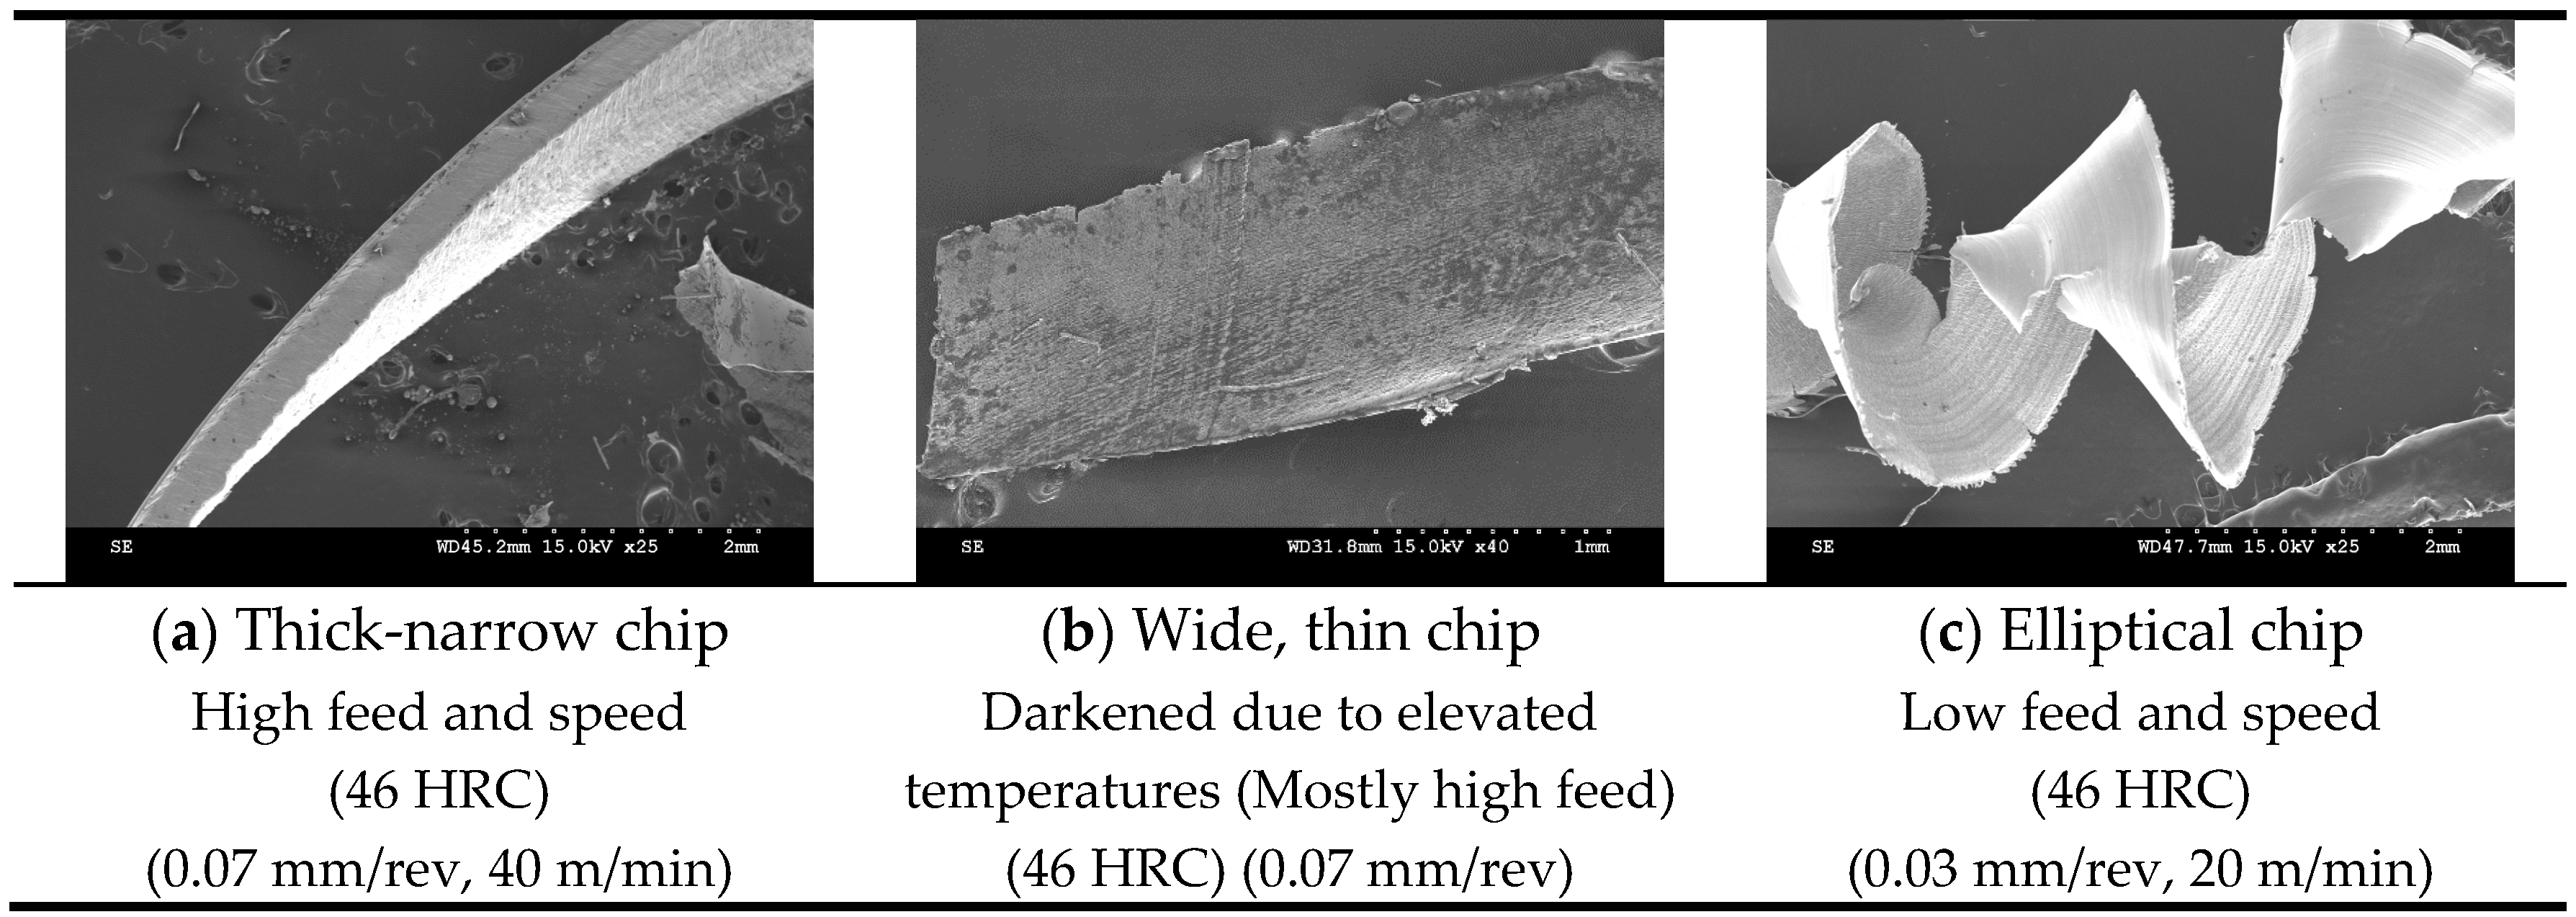
Figure 17.
Different types of chip morphology observed. (a) Thick-narrow chip; (b) Wide, thin chip; (c) Elliptical chip.
Figure 17.
Different types of chip morphology observed. (a) Thick-narrow chip; (b) Wide, thin chip; (c) Elliptical chip.
Figure 18.
Surface microstructure and chip color due to elevated temperature in the drilled holes.
Figure 18.
Surface microstructure and chip color due to elevated temperature in the drilled holes.
Figure 19.
Cutting tool chips of 41 HRC Rene 65 samples at: (a) low feed, (b) high feed.
Figure 19.
Cutting tool chips of 41 HRC Rene 65 samples at: (a) low feed, (b) high feed.
Figure 20.
Cutting tool chips of 51 HRC Rene 65 samples at: (a) low feed, (b) high feed.
Figure 20.
Cutting tool chips of 51 HRC Rene 65 samples at: (a) low feed, (b) high feed.
Figure 21.
Cutting tool chips of the 51 HRC samples (0.05 mm/rev, 40 m/min).
Figure 21.
Cutting tool chips of the 51 HRC samples (0.05 mm/rev, 40 m/min).
Figure 22.
Microstructure of chips obtained at tested hardnesses.
Figure 22.
Microstructure of chips obtained at tested hardnesses.
Table 1.
Ni-based alloy materials with composition (wt.%) adapted from [
2,
13].
Table 1.
Ni-based alloy materials with composition (wt.%) adapted from [
2,
13].
| Materials ID | Rene65 | AD730 | In.718 | Wasp | PER72 |
|---|
| Chemical Composition |
|---|
| Nickel (Ni) | Bal. | Bal. | Bal. | Bal. | Bal. |
| Iron (Fe) | 1 | 4.00 | 18.00 | - | 0.138 |
| Cobalt (Co) | 13 | 8.50 | - | 13.25 | 14.5 |
| Chrome (Cr) | 16 | 15.70 | 18.1 | 19.4 | 16.06 |
| Molybdenum (Mo) | 4 | 3.1 | 2.9 | 4.25 | 2.88 |
| Tungsten (W) | 4 | 2.7 | - | - | 1.21 |
| Aluminum (Al) | 2.1 | 2.25 | 0.45 | 1.3 | 2.57 |
| Titanium (Ti) | 3.7 | 3.4 | 1.00 | 3 | 5.07 |
| Niobium (Nb) | 0.7 | 1.1 | 5.4 | - | - |
| Boron (B) | 0.016 | 0.01 | - | 0.006 | 0.016 |
| Carbon (C) | - | 0.015 | - | - | 0.017 |
| Zirconium | 0.05 | 0.03 | - | 0.05 | - |
Table 2.
Tested materials’ composition and hardness.
Table 2.
Tested materials’ composition and hardness.
| Drill Bit Material | Solid Carbide | Number of Flutes | 2 |
| Drill Bit Point Angle | 140 Degrees | Diameter Size | 3 mm |
| Drill Bit Finish | TiNAl | Coolant Through | Yes |
| A3293 | DC150 |
| Flute Length (A3293) | 26 mm | Flute Length (DC150) | 20 mm |
| Point Type (A3293) | Self-centering | Point Type (DC150) | Split point |
| Grade | K30F | Grade | WJ30RE |
| Extreme Inox—Extremely high performance in stainless steels | Walter Titex DC15—Versatile and highly wear resistant |
Table 3.
Factors and levels for testing Rene 65 drilling tests.
Table 3.
Factors and levels for testing Rene 65 drilling tests.
| Factor | Level 1 | Level 2 | Level 3 |
|---|
| Cutting Speed (m/min) | 20 | 30 | 40 |
| Feed Rate (mm/rev) | 0.03 | 0.05 | 0.07 |
| Hardness (HRC) | 41 | 46 | 52 |
Table 4.
Heat treatment processes for the distinct workpiece samples.
Table 4.
Heat treatment processes for the distinct workpiece samples.
| Hardness of Workpiece Material | Heat Treatment Process |
|---|
| Temperature | Time | Cooling |
|---|
| 41 HRC | 1095 °C | 30 min | Water quench |
| 46 HRC | 1095 °C | 30 min | Air cool |
| 788 °C | 4 h | |
| 788 °C | 2 h | |
| 52 HRC | No treatment |
Table 5.
Analysis of variance (ANOVA) for the lowest surface roughness.
Table 5.
Analysis of variance (ANOVA) for the lowest surface roughness.
| Source | DF | ADJ SS | ADJ MS | F | P |
|---|
| Model | 9 | 0.085467 | 0.009496 | 5.93 | 0.032 |
| LINEAR | 3 | 0.048963 | 0.016321 | 10.20 | 0.014 |
| A: Speed (m/min) | 1 | 0.047278 | 0.047278 | 29.54 | 0.003 |
| B: Feed (mm/tooth) | 1 | 0.001485 | 0.001485 | 0.93 | 0.380 |
| C: Hardness (HRC) | 1 | 0.000200 | 0.000200 | 0.12 | 0.738 |
| Square | 3 | 0.020869 | 0.006956 | 4.35 | 0.074 |
| Speed × Speed | 1 | 0.006500 | 0.006500 | 4.06 | 0.100 |
| Feed × Feed | 1 | 0.010950 | 0.010950 | 6.84 | 0.047 |
| Hardness × Hardness | 1 | 0.002955 | 0.002955 | 1.85 | 0.232 |
| 2-way Interaction | 3 | 0.015635 | 0.005212 | 3.26 | 0.118 |
| Speed × Feed | 1 | 0.000210 | 0.000210 | 0.13 | 0.732 |
| Speed × Hardness | 1 | 0.014641 | 0.014641 | 9.15 | 0.029 |
| Feed × Hardness | 1 | 0.000784 | 0.000784 | 0.49 | 0.515 |
| Error | 5 | 0.008002 | 0.001600 | | |
| Lack-of-fit | 3 | 0.003081 | 0.001027 | 0.42 | 0.761 |
| Pure Error | 2 | 0.004921 | 0.002460 | | |
| Total | 14 | 0.093469 | | | |
Table 6.
ANOVA for linear model solution.
Table 6.
ANOVA for linear model solution.
| Source | DF | ADJ SS | ADJ MS | F | P |
|---|
| Model | 3 | 43,011.6 | 14,337.2 | 92.17 | 0.000 |
| LINEAR | 3 | 43,011.6 | 14,337.2 | 92.17 | 0.000 |
| A: Speed (m/min) | 1 | 464.0 | 464.0 | 2.98 | 0.112 |
| B: Feed (mm/tooth) | 1 | 42,291.4 | 42,291.4 | 271.87 | 0.000 |
| C: Hardness (HRC) | 1 | 256.1 | 256.1 | 1.65 | 0.226 |
| Error | 11 | 1711.1 | 155.6 | | |
| Lack-of-Fit | 9 | 1684.0 | 187.1 | 13.80 | 0.069 |
| Pure Error | 2 | 27.1 | 13.6 | | |
| Total | 14 | 44,722.8 | | | |
Table 7.
ANOVA for full quadratic equation.
Table 7.
ANOVA for full quadratic equation.
| Source | DF | ADJ SS | ADJ MS | F | P |
|---|
| Model | 9 | 44,159.3 | 4906.6 | 43.54 | 0.000 |
| LINEAR | 3 | 43,011.6 | 14,337.2 | 127.23 | 0.000 |
| A: Speed (m/min) | 1 | 464.0 | 464.6 | 4.12 | 0.098 |
| B: Feed (mm/tooth) | 1 | 42,291.4 | 42,294.4 | 375.30 | 0.000 |
| C: Hardness (HRC) | 1 | 256.1 | 256.1 | 2.27 | 0.192 |
| Square | 3 | 445.6 | 148.5 | 1.32 | 0.366 |
| Speed × Speed | 1 | 368.6 | 368.6 | 3.27 | 0.130 |
| Feed × Feed | 1 | 18.6 | 18.6 | 0.17 | 0.701 |
| Hardness × Hardness | 1 | 57.8 | 57.8 | 0.51 | 0.506 |
| 2-way Interaction | 3 | 702.2 | 234.1 | 2.08 | 0.222 |
| Speed × Feed | 1 | 7.1 | 7.1 | 0.06 | 0.812 |
| Speed × Hardness | 1 | 564.1 | 564.1 | 5.01 | 0.075 |
| Feed × Hardness | 1 | 131.0 | 131.0 | 1.16 | 0.330 |
| Error | 5 | 563.4 | 112.7 | | |
| Lack-of-Fit | 3 | 536.3 | 178.8 | 13.18 | 0.071 |
| Pure Error | 2 | 27.1 | 13.6 | | |
| Total | 14 | 44,722.8 | | | |
Table 8.
ANOVA for with stepwise regression of alpha 0.1.
Table 8.
ANOVA for with stepwise regression of alpha 0.1.
| Source | DF | ADJ SS | ADJ MS | F | P |
|---|
| Regression | 1 | 42,291.4 | 42,291.4 | 226.13 | 0.000 |
| Feed (mm/rev) | 1 | 42,291.4 | 42,291.4 | 226.13 | 0.000 |
| Error | 13 | 2431.3 | 187.0 | | |
| Lack-of-Fit | 11 | 2404.2 | 218.6 | 16.12 | 0.060 |
| Pure Error | 2 | 27.1 | 13.6 | | |
| Total | 14 | 44,722.8 | | | |


