Article

Realizing the Intended Nationally Determined Contribution: The Role of Renewable Energies in Vietnam

1
Regional Centre of Expertise on Education for Sustainable Development in Southern Vietnam, International University—Vietnam National University Ho Chi Minh City, Quarter 6, Linh Trung Ward, Thu Duc District, Ho Chi Minh City 700000, Vietnam
2
National Institute for Environmental Studies, 16-2 Onogawa, Ibaraki, Tsukuba 305-8506, Japan
*
Author to whom correspondence should be addressed.
Energies 2016, 9(8), 587; https://doi.org/10.3390/en9080587
Submission received: 21 March 2016 / Revised: 20 July 2016 / Accepted: 20 July 2016 / Published: 27 July 2016
(This article belongs to the Special Issue Energy Policy and Climate Change 2016)

Abstract

:
This study contributes to the realization of intended nationally determined contributions (INDCs) by analyzing their implications for the energy production system and the economy, and determines the role of renewable energies (RE) in reducing the challenge of committing to the INDCs. The Asia-Pacific Integrated Model/Computable General Equilibrium (AIM/CGE) model was used to assess seven scenarios having the same socioeconomic development but different shares of RE in power generation. By comparing different relative reductions caused by the emission constraints vis-a-vis the business-as-usual (BaU) scenario, the mitigation costs can be estimated. Results show that the economic impact could be reduced by around 55% in terms of welfare loss (from 6.0% to 2.7%) and by around 36% in terms of gross domestic product (GDP) loss (from 3.4% to 2.1%) through the incorporation of high levels of renewable energy. Furthermore, the additional double deployment of wind and SPV to 5.4% and 12.0%, respectively, which currently comprise 43.1% of the renewable energies used in electricity generation, could reduce the GDP loss from 2.1% to 1.9% and reduce the welfare loss from 2.7% to 1.5% in order to achieve a 25.0% GHG emissions reduction. These losses are less than those in the pricing-only scenario (2.1% and 2.3%, respectively).

Graphical Abstract

1. Introduction

On 12 December 2015, the Conference of Parties 21 (COP21) in Paris achieved a so-called “historic” or “universal” agreement to combat climate change and unleash actions and investment towards a low carbon, resilient, and sustainable future. Under this agreement, 195 countries were brought together for the first time to tackle a cause based on their historic, current, and future responsibilities. The main aim was to keep the global temperature rise in this century well below 2 °C, and aim for an even more ambitious limit of 1.5 °C. The intended nationally determined contributions (INDCs) is the latest pledge for the climate negotiation [1,2] that brings several concerns [3]. First, most of the discussions focus on the political negotiation and financial supports, rather than the possibility of bridging the gap between current emission pathways and the 2 °C target [4]. Second, targeting greenhouse gas (GHG) emission reduction may compromise national energy security [5], especially in developing countries where conventional energies are still the main sources [6].
Thus, it is not the issue of one single country to determine, between INDCs target and energy security, which one is more important. In developing countries, the priority would be on energy security in which the country uses the existing domestic conventional energy sources to ensure the economic development. As a result, it is necessary to have an integrated assessment of national climate change mitigation target and energy policy, especially renewables [7]. Particularly, the controversial concerns across nations are on the renewable energy’s technology [8,9] and investment [10]. With regard to climate mitigation in Vietnam, in September 2012, the Vietnamese government approved the national green growth strategy (NGGS) [11]. The GHG emissions reduction target in NGGS was 10% to 20% of the projected 2030 emissions under the business-as-usual (BaU) scenario. In September 2015, the Vietnamese government submitted their INDCs to the United Nations Framework Convention on Climate Change (UNFCCC), in which the target was to reduce GHG emissions in 2030 by 8% to 25% relative to the BaU scenario [12]. The former target is unconditional, while the latter is conditional on receiving international support.
The INDCs target is more ambitious than the NGGS target, and thus more risky to the nation’s energy security [13], with the country still being very dependent on traditional fossil fuels [14]. Therefore, to support the achievement of the INDCs’ target, in November 2015 the Vietnamese government approved the renewable energy development strategy (REDS) [15]. Compared to previous energy development plans such as the national energy development strategy (NEDS) [16] and power development plan 7 (PDP7) [17], published in 2007 and 2012, respectively, the contribution of renewable energies (RE) in the REDS was increased, and included more deployment of biomass, solar photovoltaic (SPV) and wind power. Previous studies have also identified the potential of renewable energies in Vietnam, either for final consumption or for power generation [18], highlighting the economic benefit [19] of sustainable development [20]. The role of renewable energies in climate change mitigation has been assessed, especially biomass [21], SPV [22,23], and wind [24,25]. However, GHG emissions reduction generally has a cost and sometimes is not small enough to ignore, especially in developing country like Vietnam [26]. For example, Mittal et al. [27] reported that the cost involved depends on the strength of the emissions reduction and renewable energy policy.
Considering the above backgrounds, this study contributes to the realization of Vietnam’s INDCs by analyzing its implication to energy production system and economy, and determined the role of renewable energies in reducing the challenge of committing to the INDCs. To achieve this goal, the Asia-Pacific Integrated Model/Computable General Equilibrium (AIM/CGE) model was used, and seven scenarios (BaU and six mitigation scenarios with different emissions targets and renewable energy policies) were assessed. The remaining part of this paper is structured as follows: Section 2 describes the methodology and the design of scenarios. Section 3 analyzes the main results, with a focus on the energy supply and demand changes. Some additional issues related to this study are discussed in Section 4. Finally, the main findings of this study are provided in Section 5.

2. Materials and Methods

2.1. AIM/CGE Model

The AIM/CGE model has been widely used for assessing global climate change mitigation and adaptation policies [28,29,30,31,32,33]. It is a recursive-dynamic general equilibrium model, extended from the “standard CGE model” [34], in which industry is classified into 42 sectors (shown in the Appendix A). Details of the model structure and mathematical formulas are described in Fujimori and Masui [35]. The model is specified and solved as a pure mixed complementary problem (MCP). This model has a national version, which was applied in previous studies [27,36,37,38], and thus we used the national version in this study.
As with most energy technology-rich CGE models, parameters such as population, gross domestic product (GDP), energy efficiency improvement, the extraction cost of fossil fuels, and the availability and cost of renewable energy were exogenously input into the model. The model outputs were energy demand and supply structure, GHG emissions, and prices for energy and carbon emissions. More technically, the production sectors were assumed to maximize profits subject to multi-nested constant elasticity substitution (CES) functions and the relative prices of inputs. Household expenditures on each commodity were described by a linear expenditure system (LES) function. The savings were the source of domestic and foreign direct investment. They were exogenously inputted as a proportion of the change in GDP relative to the base year. To balance the saving account, the saving rate was treated as an endogenous variable. Moreover, the capital formation of each good was determined by a fixed coefficient of total investment. The Armington assumption was used for international trade, and the current account was assumed to be balanced. In addition to energy-related CO2 emissions, CO2 from other sources, CH4, and N2O (including changes resulting from land use and non-energy related emissions) were also considered.
The constraint on the GHG emissions was specified based on the mitigation target. Once the emission constraint was added, the carbon tax became a complementary variable to the emission constraint and determined the marginal mitigation cost. In this emission-constrained scenario, the carbon tax increased the price of the fossil fuel consuming goods, which resulted in an energy saving and substitution of fossil fuels with lower emission energy sources. The carbon tax also acted as an incentive to reduce non-energy-related emissions. GHGs other than CO2 were weighted by their global warming potential and summed to estimate total GHG emissions in terms of CO2 equivalent. Households were assumed to receive the revenue from the carbon tax. In the power sector, the fired power plants had an option to see carbon capture and storage (CCS). We assumed a maximum annual penetration rate for CCS technology. The maximum annual penetration rate differed over time. More specifically, in the early stages new installations were limited (if the share of CCS was under 10%, 2% per annum was the maximum); but as the technology matured, the rate of penetration increased (if the share of CCS was over 10%, 4% per annum was the maximum). Although the model had this CCS option, in this analysis it was found that CCS did not penetrate much because the carbon price did not reach a critical level.
The costs of the wind and solar technology were assumed as in the IEA energy technology perspective report [39]. We changed the input coefficients in the corresponding production function. Because the output prices of these technologies were endogenously determined, they were not exactly the same as those reported by the IEA [39], but they were close enough. As a reference, the solar and wind power output prices for the baseline scenario are shown in Figure A1 in the Appendix A.
The energy source share is determined by Logit function with two parameters, one determines base share and the other represents price elasticity [35]. Price includes tax and carbon emission tax which is formulated as multiplying energy use ratio and emission coefficient associated with carbon tax rate.

2.2. Scenario Settings

Seven scenarios were developed, with the detailed assumptions shown in Table 1. All scenarios had the same socio-economic assumption, in which we adjusted the GDP growth rate targeted in the national socio-economic development plan (SEDP) [40] based on the actual development status of Vietnam, and the subsequent population was estimated using this plan. Specifically, the annual average growth rates (AAGRs) during the 2005–2030 period of population growth and GDP were 0.9% and 6.2%, respectively.
The BaU and low renewables (LowRE; LowRE-LowINDC and LowRE-HighINDC) scenarios had the same assumed power generation mix. The power generation assumption was based on the NEDS [16] and PDP7 [17], which were formerly disclosed. In addition to fossil fuels, nuclear contributed 10.1% of the total power generation in 2030, followed by hydro (9.3%), SPV (2.5%), wind (2.4%), and biomass (1.1%). On the other hand, in the HighRE scenarios (HighRE-LowINDC and HighRE-HighINDC), the shares of biomass, SPV, and wind increased to 6.3%, 6.0%, and 2.7%, respectively, while the shares of nuclear and hydro were the same as in the previous three scenarios. This assumption was based on the REDS [15], which is more renewable-aggressive than the NEDS [16] and PDP7 [17]; therefore, we referred to these scenarios as HighRE. Moreover, the additional double deployment of wind and SPV was also assessed to determine the role of renewable energies in reducing the impacts of climate change policy (AddRE-HighINDC). The increased deployment of renewable technologies in HighRE scenarios and the AddRE scenario substituted for the decline of coal-fired power plants. These scenarios indicated how much the economic burden could be reduced if the government considered a more ambitious renewable target in its energy development plan. In contrast to the six scenarios above, where the RE share is fixed exogenously, we developed the FreeRE-HighINDC scenario, in which the share of RE in power generation is not fixed but rather is driven by the energy price. This was compared with other scenarios to clearly understand the impact of energy policy targets.
The BaU scenario has no GHG emissions reduction target, while the targets for the other scenarios were assumed to follow the INDCs [12]. The LowRE-LowINDC and HighRE-LowINDC scenarios aimed to reduce at least 8.0% of 2030’s BaU emissions as an unconditional target, while the LowRE-HighINDC, HighRE-HighINDC, AddRE-HighINDC, and FreeRE-HighINDC aimed to reduce 25.0% of 2030’s BaU emissions as a conditional target.
In policy-based scenarios, the total amount of power generation is assumed following the national power development plan (PDP7), and the energy mix for power generation is assumed following the targeted shares in PDP7 and renewable energy policy. Particularly, the contribution amount of natural gas and nuclear is assumed to be the same in all scenarios. The share of other renewable energies (wind, biomass, and solar power) increases as assumed in the scenario settings, in corresponding with the reduction of hydro and coal.
The assumption on the solar and wind power generation cost is basically following the IEA energy technology perspective. The input coefficients are changed in order to represent the cost decrease. Since the current model assumption is that the power generation price is endogenously determined given the capital and intermediate inputs prices, the outcomes are not exactly same as the IEA but we think that they are almost similar.
Figure 1 shows an outline of the seven scenarios according to the share of different renewable energies (%) in the power generation mix (X axis) and the GHG emissions reduction target (Y axis), with six comparisons made. The first comparison (① in Figure 1) was made between the LowRE-LowINDC and BaU scenarios, to determine the implication of an 8% reduction in total GHG emissions on the energy supply and demand in Vietnam. The second comparison (② in Figure 1) was made between the LowRE-HighINDC and BaU scenarios, and indicated that under a more stringent GHG emissions reduction target (25% of BaU), there was a greater challenge to the energy generation system and economy of Vietnam. In the third comparison (③ in Figure 1), the HighRE-LowINDC and LowRE-LowINDC scenarios were compared to determine the contribution of renewable energies in achieving the 8% reduction target. The final three comparisons (④, ⑤, and ⑥ in Figure 1), among the AddRE-HighINDC, HighRE-HighINDC, LowRE-HighINDC and FreeRE-HighINDC scenarios, assessed the impact of different energy policy and pricing-only scenario, indicated that the role of renewable energies became even more important to achieve the most stringent target in Vietnam’s INDCs, with less impact on the economy.

3. Results

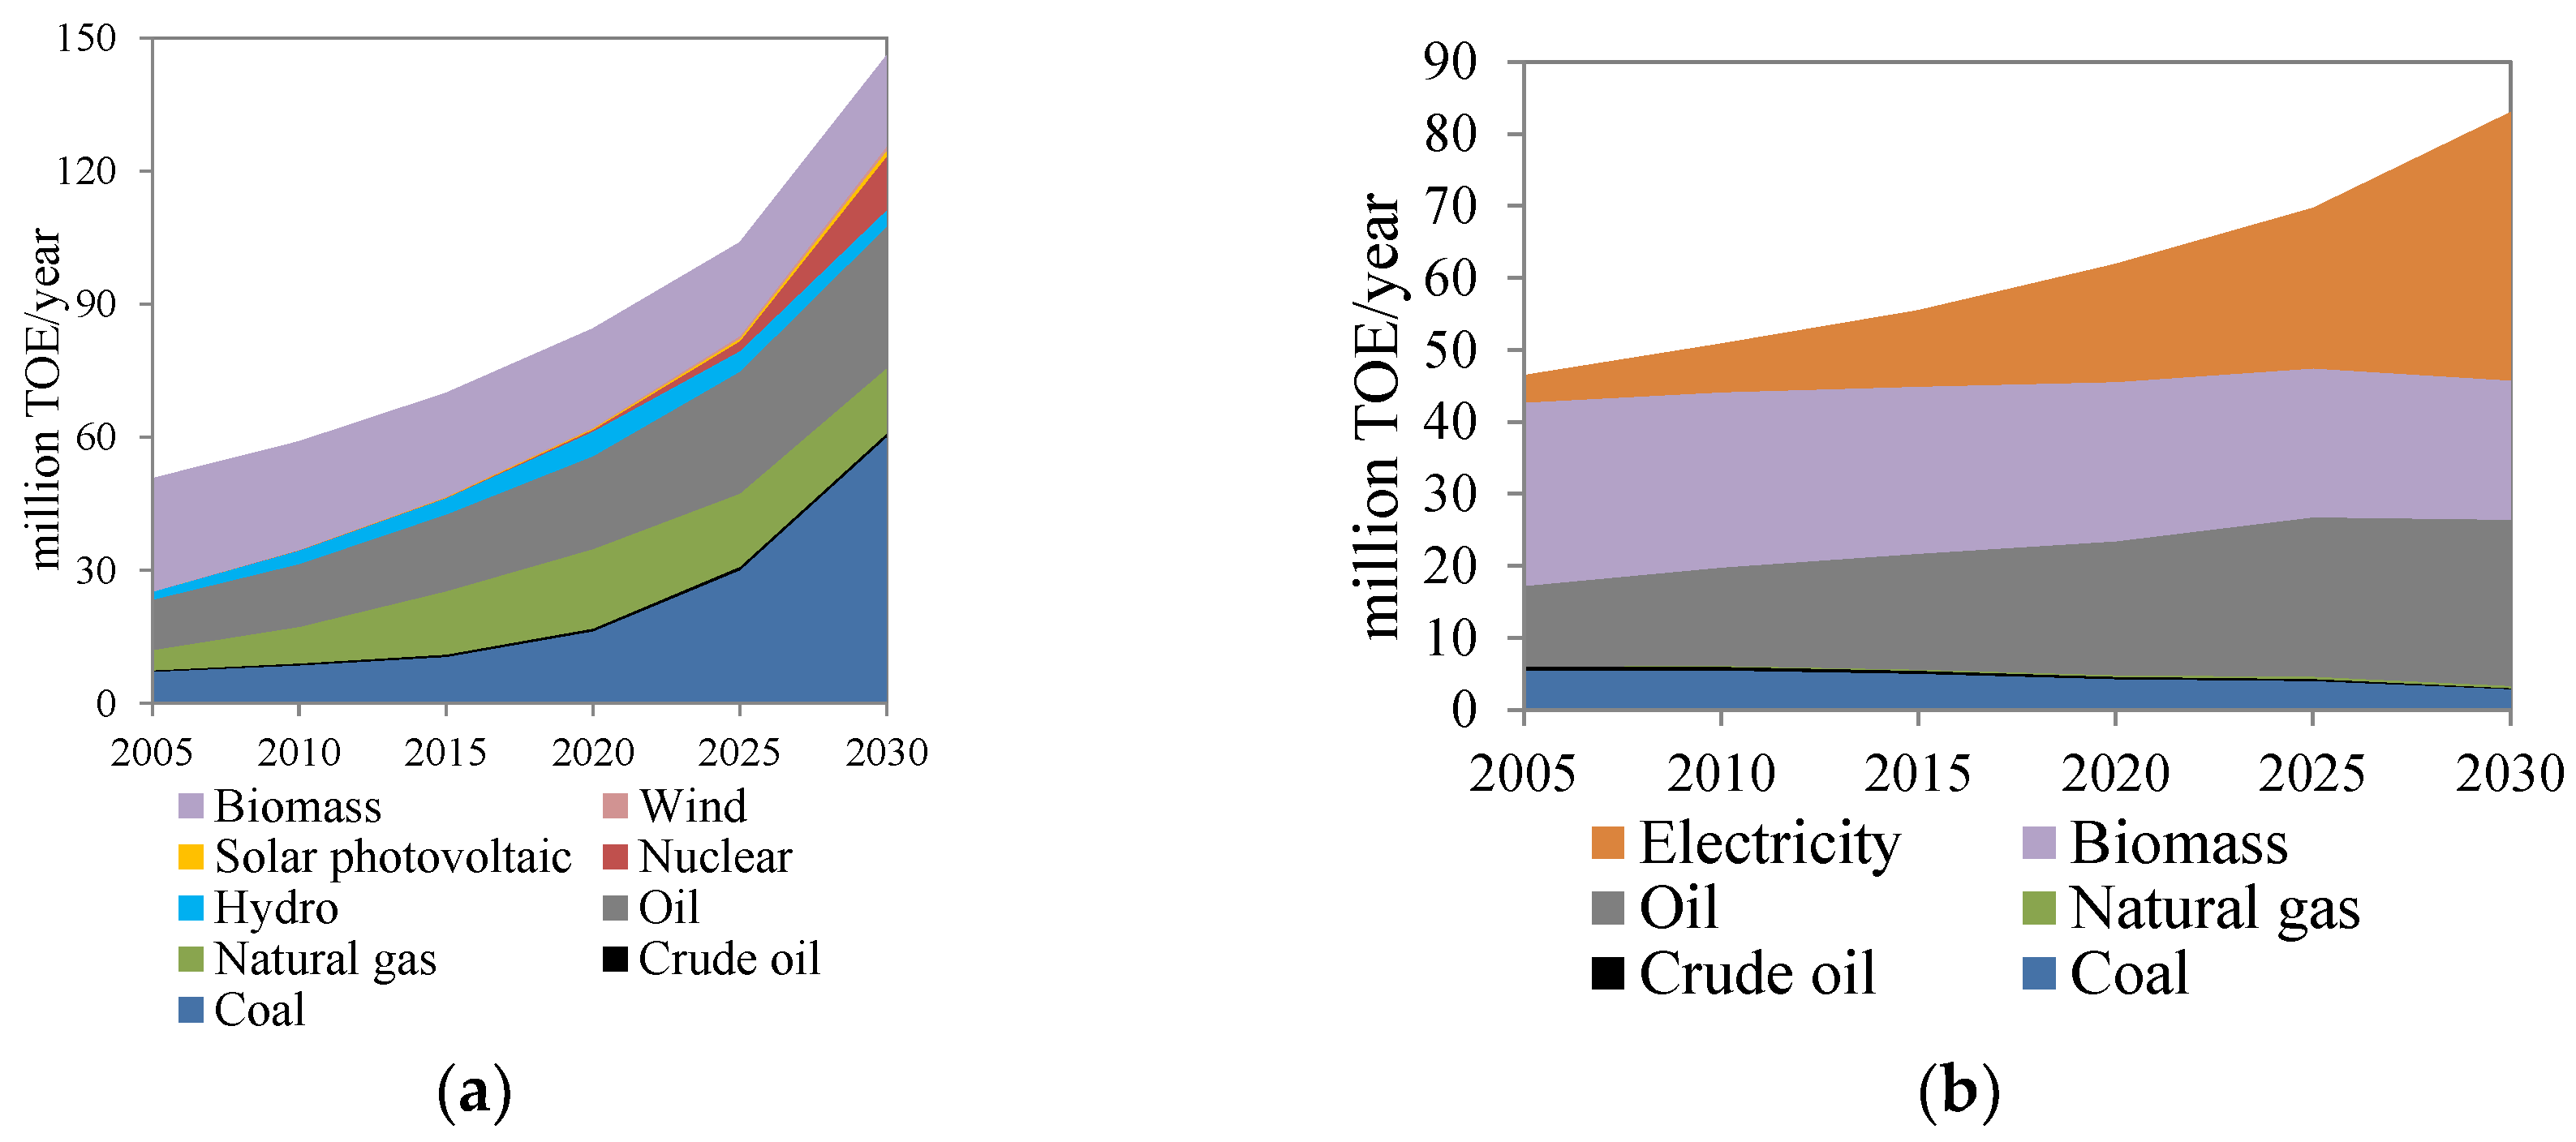
3.1. Outlook for Vietnam in 2030—The Base Scenario

Following the assumed socio-economic development shown in Table 1, the population and GDP of Vietnam increased by 1.2 and 4.5 times in 2030 compared to 2005, respectively. Thus, the population in 2030 was 102.9 million people and the GDP was around 236.6 billion USD (2005 market exchange rate; MER), resulting in the GDP per capita increasing by 3.6 times, from 638.0 USD in 2005 to nearly 2300.0 USD in 2030 (2005 MER). Under these driving forces, the final energy demand increased 1.8 times, with an AAGR of 2.0% per year, reaching 83.0 million tonnes of oil equivalent (TOE). The primary energy supply increased 2.9 times (AAGR was 3.9% per year) to 146.0 million TOE; and there was a rapid increase in power generation of 9.0 times (AAGR was 9.2% per year) to 42.2 million TOE. The increasing supply and demand of energy resulted in an increase in GHG emissions of 2.4 times, with an AAGR of 3.3% per year (Figure 2).

3.1.1. Primary Energy Supply

The primary energy supply increased from 50.7 million TOE in 2005 to 160.0 million TOE in 2030, which was a bit higher than the projection in the Asia Pacific Energy Research Centre (APERC) report (150.0 million TOE in 2030) [40]. Currently, Vietnam is a coal exporter; however, the actual trend, and even the PDP7, show that Vietnam will become an energy importer in the next few years, as a result of its high growth in energy demand and the limitations on available energy resources (particularly coal, oil, and electricity). Among the energy carriers, coal and nuclear have experienced a rapid increase due to the demand for these energy types in power generation since 2020. In 2030, the expected coal supply contributed 41.2% of total primary energy supply, followed by oil (21.8%), biomass (13.9%), natural gas (10.1%), nuclear (8.3%), and other renewable energies (hydro, wind, and solar—4.1%) (Figure 2a). The primary energy intensity was projected to be reduced from 937.8 TOE per unit of GDP to 585.6 TOE per unit of GDP (37.6% reduction). This projection is consistent with the APERC report, where the primary energy intensity is projected to reduce from 286.0 TOE per 2005 USD million purchasing power parity (PPP) in 2005 to 164.0 TOE per 2005 USD million PPP in 2035 [40].

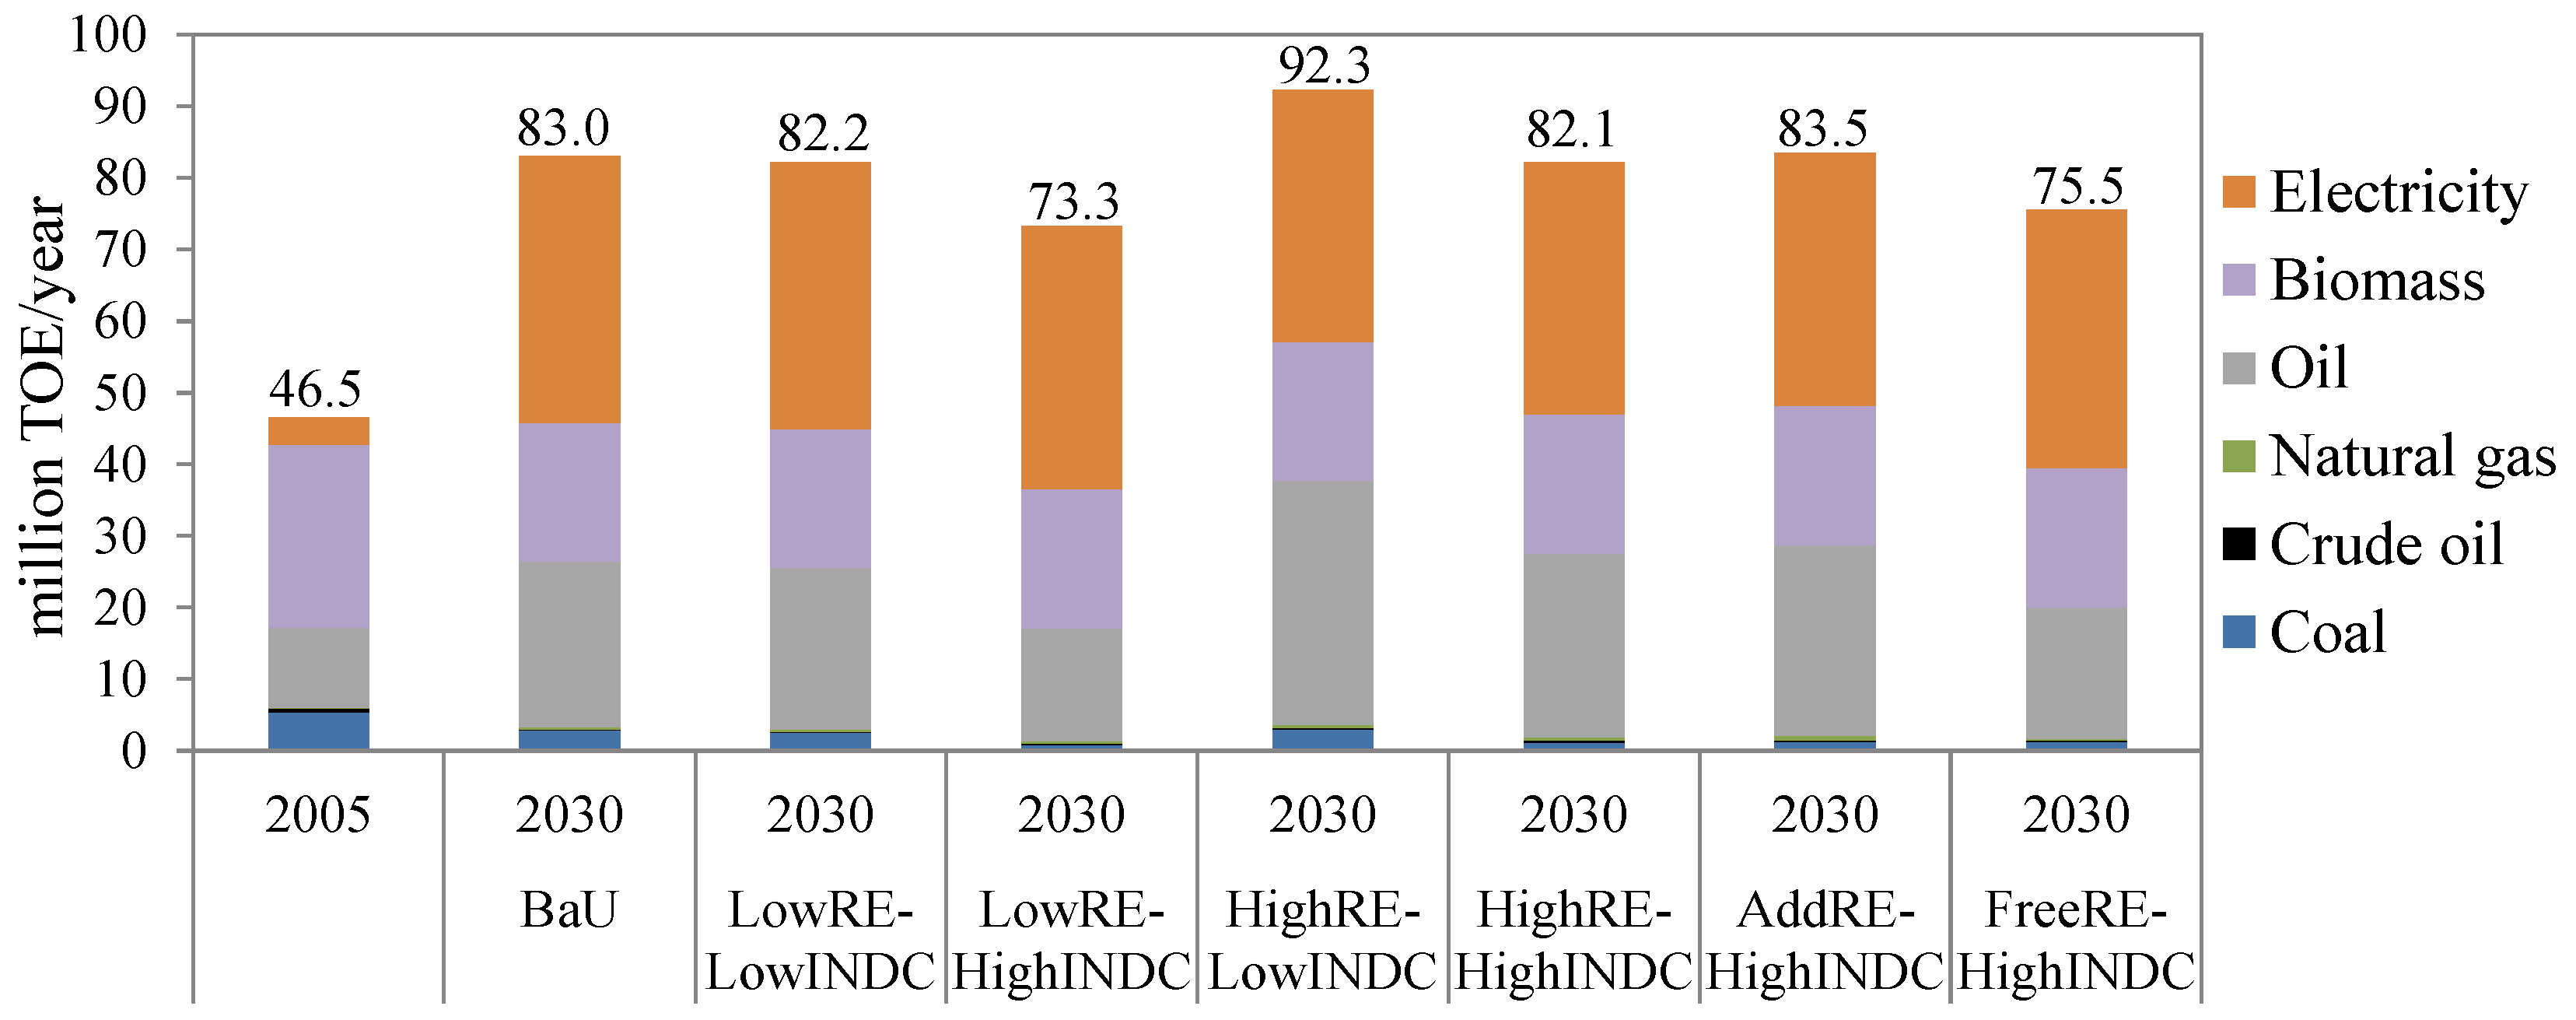
3.1.2. Final Energy Demand

The final energy demand increased from 46.5 million TOE in 2005 to 83.0 million TOE in 2030, with the main consumers being the industry (40.6%) and residential sector (36.5%). This projection was less than in the APERC report (nearly 120.0 million TOE in 2030) [41]. The total demand for oil and biomass would be the same (51.1%) as in the base year, in which their shares were 27.8% and 23.3%, respectively (Figure 2b). Meanwhile, the demand for electricity increased nearly 9.9 times, contributing to 44.9% of the total final energy demand. The final energy intensity was expected to decline by about 60.0% between 2005 and 2030—from 876.1 TOE per unit of GDP (in 2005 USD million MER) to 350.9 TOE per unit of GDP. This reduction was slightly higher than the 52.0% reduction projected in the APERC report [41].
In the baseline scenario, industry is the main energy consumer (37.7 million TOE), with a rapid increase in electricity consumption (72.7%), followed by oil (18.4%), coal (7.5%), natural gas (0.9%), and crude oil (0.4%). The increasing consumption of electricity in industry is mainly due to the assumption that power generation follows the power development plan.

3.1.3. Electricity Generation

The total electricity generation and the electricity generation mix were assumed to follow the NEDS [16] and the PDP7 [17], in which, the total electricity generation was expected to increase rapidly from 4.4 million TOE in 2005 to 42.2 million TOE in 2030. The amount generated covered 97.0% of the total electricity demand, with the additional 3.0% being imported. Within the 42.2 million TOE generated, 53.3% was produced by coal-fired plants and 13.6% was gas-fired generation. Renewable energies contributed 24.8% of total electricity generation; in which nuclear accounted for 9.6%, followed by hydro, SPV, wind, and biomass with 8.8%, 3.1%, 2.3%, and 1.0%, respectively (Figure 2c). This projection was very different from the APERC report [41], where the shares of coal and natural gas were 39.0% and 30.0% respectively, followed by 15.0% from hydro, 14.0% from nuclear, and the remainder being imported.

3.1.4. GHG Emissions

The GHG emissions per capita of Vietnam in 2005 were about 3.1 tonnes of CO2 equivalent (tCO2eq), which is one of the lowest values in the Asia-Pacific region [41]. With the rapid increase of socio-economic development and energy consumption, the total GHG emissions increased from 257.1 million tCO2eq in 2005 to 614.9 million tCO2eq in 2030. This projection is consistent with Vietnam’s industrialization vision, in which the economy uses more carbon-intensive energy sources, and in particular is dependent on coal-fired power plants. The increase in GHG emissions in 2030 was caused by a three-fold increase of CO2 emissions due to energy-related activities, while the increases in N2O and CH4 emissions were relatively modest. The emission intensity was expected to be reduced by half, from 4.8 tCO2eq per 2005 USD thousand MER in 2005 to 2.6 tCO2eq per 2005 USD thousand MER in 2030 (Figure 2d).

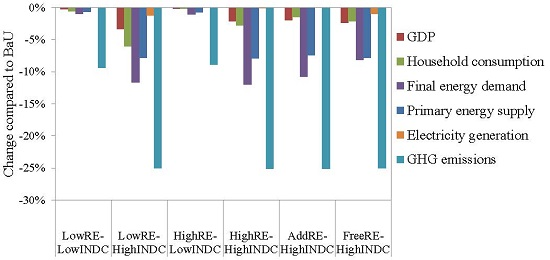
3.2. Implication of Vietnam’s INDC and the Role of Renewable Energies

Figure 3 summarizes the socio-economic, energy and GHG emissions changes in the six climate mitigation scenarios compared to the BaU scenario in 2030. In LowRE scenarios where the share of renewable energies in electricity generation was around 24.8% (6.4% biomass-SPV-wind, 8.8% hydro, and 9.6% nuclear), the GHG emissions reduction potential of Vietnam in 2030 was 9.4%. This 9.4% reduction in GHG emissions was achievable through reductions of 1.0% in the final energy demand and 0.7% in the primary energy supply, as well as no effect on electricity generation, causing a welfare loss of 0.5% and a GDP loss of 0.3% (LowRE-LowINDC). For the same situation with regard to renewable energies, to achieve the 25.0% GHG emissions reduction, a much greater reduction in energy demand and supply was required.
In particular, the final energy demand was reduced by 11.7%, the primary energy supply was reduced by 7.9%, and the electricity generation was reduced by 1.2%. These reductions would affect the development of Vietnam’s economy and were projected to cause a welfare loss of 6.0% as well as a GDP loss of 3.4% (LowRE-HighINDC). In HighRE scenarios, where the share of renewable energies in electricity generation increased to 34.4% (15.0% biomass-SPV-wind, 9.3% hydro, and 10.1% nuclear), it was possible to achieve the GHG emissions reduction target, with less effect on the energy system compared to the LowRE scenarios. In particularly, the GHG emissions reduction potential of Vietnam was 8.9%, leading to a 1.1% reduction in final energy demand, a 0.7% reduction in primary energy supply, no effect to the electricity generation, and with a welfare loss of 0.2% and GDP loss of 0.1% (HighRE-LowINDC). Furthermore, the GHG emissions potential of Vietnam was increased to 25.0%, resulting in a welfare loss of 2.7% and GDP loss of 2.1%, in addition to a 12.0% reduction in final energy demand, a 7.4% reduction in primary energy supply, and no effect to the electricity generation (HighRE-HighINDC).
In the AddRE-HighINDC scenario, where the share of wind and SPV increased two-fold compared to the HighRE scenarios, the contribution of renewable energies in the power generation mix increased to 43.1% (23.7% biomass-SPV-wind, 9.3% hydro, and 10.1% nuclear). An 8.7% increase from SPV and wind substituted for the same reduction in the amount of coal consumed for electricity generation. In this scenario, there was a 1.9% GDP loss and a 1.5% welfare loss, with the potential to reduce total GHG emissions by 25.0%. The effect on the energy system was a 10.8% reduction in final energy demand, a 7.4% reduction in primary energy supply, and no effect to the electricity generation (AddRE-HighINDC).
On the other hand, in the FreeRE-HighINDC scenario, where the RE share is driven by the energy price rather by than following the policy, the contribution of RE in the power generation mix was only 26.7% (9.6% biomass-SPV-wind, 16.4% hydro, and 0.7% nuclear). This low contribution caused an 8.2% reduction in the final energy demand, a 7.8% reduction in primary energy supply, and a 0.9% reduction in electricity generation, leading to a 2.1% welfare loss and a 2.4% GDP loss to achieve the 25.0% GHG emissions reduction target. The sub-sections below describe the effect of the different INDC scenarios on the energy system and economy of Vietnam in more detail.

3.2.1. Change in Primary Energy Supply

Similar to the final energy demand, Figure 4 shows that a very small reduction (nearly 0.7%) in the primary energy supply was required to achieve the less stringent GHG emissions reduction target. However, a 7.9% reduction of primary energy supply, corresponding to a 12.0% reduction of final energy demand, was required to achieve a 25.0% reduction in GHG emissions.
The total primary energy supply was reduced from 146.0 million TOE in the BaU scenario to 135.0 million TOE in the LowRE-HighINDC scenario. The supply of other energies was retained, except for the reduction in the oil supply from 31.8 million TOE in BaU to 23.2 million TOE in LowRE-HighINDC. Coal was still the main primary energy source due to the dependence on coal-fired power generation in Vietnam. Under the low INDC scenarios, the increasing contribution of renewable energies helped to secure the total primary energy supply compared to the BaU scenario; from a 0.6% reduction in the LowRE-LowINDC scenario to an 1.4% increase in the HighRE-LowINDC scenario. Moreover, the supply of coal was reduced by around 14.3% and was replaced by renewable energies, especially the increase of biomass, SPV, and wind. Similarly, in high INDC scenarios, renewable energies would enable the energy system to become less dependent on coal.
Different from the results of policy-based scenario, the pricing-only scenario (FreeRE-HighINDC) showed the domination of natural gas in the total primary energy supply rather than the deployment of renewable energies. The total primary energy supply in this pricing-only scenario was reduced 14.4% compared to the BaU scenario that may challenge the energy security of the country.

3.2.2. Change in Final Energy Demand

As shown in Figure 5, under the low GHG emissions reduction target, the total final energy demand was slightly reduced from 83.0 to 82.2 million TOE. This small reduction in the final energy demand in the LowRE-LowINDC scenario was due to a reduction in oil consumption, while other energy sources were the same as in the BaU scenario. To achieve a more stringent GHG emissions reduction target, the total final energy demand was more significantly reduced (by about 11.7%) to reach 73.3 million TOE in the LowRE-HighINDC scenario. This reduction was mainly due to the reduction of oil consumption, from 34.6 million TOE in the BaU scenario to 15.7 million TOE in the LowRE-HighINDC scenario. The reduction of oil consumption was distributed across all energy-related sectors in the economy, including residential and commercial, industry, and transport. It was expected that the consumption of electricity would dominate the final energy demand, due to the increasing use of electrical appliances and machines.
However, with a greater deployment of renewable energies, especially the double contribution of biomass, the pressure on energy consumption under the high INDC scenarios was reduced. Instead of reducing 11.7% of its final energy demand, Vietnam might not need to reduce its final energy consumption in order to achieve the 25.0% GHG emissions reduction target (HighRE-HighINDC).
Moreover, when the contribution of wind and SPV increased two-fold, the final energy consumption was maintained at 83.5 million TOE (AddRE-HighINDC). This lesser reduction in the final energy demand, compared to BaU, would enable some industries to retain the use of their oil-consuming production machinery; thus, there was less pressure for them to fully switch to new or advanced technology in the medium term. On the other hand, in the FreeRE-HighINDC scenario, the final energy consumption was reduced to 75.7 million TOE, with the energy mix is similar to LowRE-HighINDC scenario.

3.2.3. Change in Electricity Generation

In the LowRE scenarios, the total amount of electricity generation is not largely affected by the GHG emissions reduction targets, because the main primary source (coal-fired generation) was almost the same due to the contribution of CCS technology in power plants that consumed fossil fuels (Figure 6). Compared to the LowRE scenarios, the total electricity generation in HighRE scenarios was reduced by 0.5%, from 42.2 to 39.9 million TOE. This reduction was due to the 14.5% decline in coal-fired power generation, which was substituted for by the increasing contribution (a nearly six-fold increase) of biomass generation and nearly two-fold increase of SPV. In addition, there was also a small share of electricity generation using CCS technology in thermal power generation.
Moreover, in the AddRE scenario, the amount of wind and SPV was twice that in the HighRE scenarios, which helped to reduce the coal consumed in electricity generation from 22.5 to 15.4 million TOE. Similar to the change in total primary energy supply, in FreeRE-HighINDC the electricity generation is mainly from natural gas (52.9%), followed by hydro (16.4) due to the effect of energy price.
The share of RE (wind, biomas, and SPV) in power generation increases from 6.4% in BaU scenario to 6.5% in LowRE-HighINDC and reaches 15.0% and 23.4% in HighRE-HighINDC and AddRE-HighINDC, respectively. However, in the FreeRE-HighINDC, this share is only 8.2%.

3.2.4. Welfare Loss and GDP Loss

The economic implication of Vietnam’s INDC was shown through the reduction of household consumption (welfare loss) and GDP (GDP loss). These losses are calculated by deriving the mitigation cost through the difference between mitigation scenarios and their respective BaU scenario, i.e., the respective scenario without emissions target but same electricity system configuration. Under the less stringent GHG emissions reduction target, the welfare loss was reduced from 0.5% in the LowRE-LowINDC scenario to 0.2% in the HighRE-LowINDC scenario. When the GHG emissions reduction target was more stringent, the welfare loss increased significantly to 6.0% in the LowRE-HighINDC scenario and reduced to 2.7% in the HighRE-HighINDC scenario when the installed RE increases. Moreover, the whole economy was also expected to experience a loss of GDP when GHG emission reduction was considered. A similar situation was observed in the consumption reduction: Vietnam experienced the highest GDP loss of 3.4% in the LowRE-HighINDC scenario, which was reduced to 2.1% in the HighRE-HighINDC scenario, and reached 0.1% and 0.3% in the HighRE-LowINDC and LowRE-LowINDC scenarios, respectively. Additionally, the double deployment of biomass, wind, and SPV (AddRE-HighINDC) minimized the GDP loss to 1.9% when the most stringent target was achieved, and 1.5% of welfare loss. Moreover, the pricing-only scenario with no fixed share of renewable energy (FreeRE-HighINDC) showed a 2.1% welfare loss and a 2.4% GDP loss in order to achieve the most stringent target. This implies that the economy would be damaged when the INDC was committed to; however, the increasing deployment of renewable energies could reduce the losses.

3.2.5. Carbon Price

There were a wide range of GHG abatement costs in Vietnam among the different scenarios. In the LowINDC scenarios, there was a very small abatement cost of less than 5.0 USD per tCO2eq (4.3 USD per tCO2eq in the LowRE-LowINDC scenario and 3.6 USD per tCO2eq in the HighRE-LowINDC scenario). The HighINDC target placed much more pressure on the economy to reduce the GHG emissions, causing the abatement costs to become 89.2 USD per tCO2eq in the LowRE-HighINDC scenario and 77.6 USD per tCO2eq in the HighRE-HighINDC scenario. In both INDC target scenarios, the higher installed RE capacity helped to reduce around 12.0% to 16.0% of the GHG abatement costs. Furthermore, the double deployment of wind and SPV reduced the GHG abatement cost to 65.8 USD per tCO2eq in the AddRE-HighINDC scenario. Besides, the GHG abatement cost in FreeRE-HighINDC was around 47.5 USD per tCO2eq.

4. Discussion

4.1. Implications

There are several implications and interpretations of these modeling results that are discussed in this section. First, the more stringent the GHG emissions reduction target that a country commits to, the more challenges will be faced by the energy system and economy of the country. In particular, the primary energy supply might be reduced, and thus final energy consumption and electricity consumption could decline, with subsequent effects on the development of the economy. However, an appropriate energy policy, with strong deployment of renewable energies, could lessen the challenges and make climate change policy more feasible. This was obvious in Vietnam when the AddRE-HighINDC, FreeRE-HighINDC, and LowRE-HighINDC scenarios were compared. The macroeconomic loss was almost completely diminished by the large renewable energy deployment. The price distortion caused by the carbon price can be substantially reduced and the energy demand would not be largely affected. Thus, we suggest that policymakers give more consideration to developing a national energy development plan, especially when it is necessary to reduce the dependence on coal-fired power plants.
Second, the rapid increase in electricity demand could be met when the contribution of renewable energies in the power generation mix was significantly increased. This could encourage both public and private sectors to invest more in the deployment of renewable energies, especially when the potential of biomass, wind, and solar photovoltaic is very large. The comparisons made in this study showed that the greater the deployment of renewable energies, the more likely it would be to achieve energy security and maintain the 7.0% economic growth target in the next period for Vietnam. It is not an obligation, but if Vietnam could start GHG emissions reduction as soon as possible after 2020, and could achieve its INDCs as considered in this study, then there is a strong possibility that the country could maintain the reduction trend and achieve the target of a 45.0% emissions reduction from energy production in 2050, as discussed in the latest REDS. For this to happen, the energy development plan and policy should be integrated with the actual socio-economic situation, and should consider environmental targets as well as a vision for sustainable development.
Third, it is obvious that there may be some reduction in economic development due to the reduction of GHG emissions. This cost should not be interpreted independently. This study did not take into account any climate impacts, such as increased flooding, agricultural damage, and other issues. Achieving the ultimate climate mitigation goal (2 °C target) reaffirmed in the Paris Agreement more or less avoids such climate change impacts. The mitigation cost should be compared with the impacts of such climate change. Therefore, there should be some benefits of avoiding climate change, such as a reduction in investment for climate change adaptation and resilience, and the cost of resource losses, which are uncertain until the impacts actually happen. Nonetheless, a greater deployment of renewable energies and a more stringent GHG emissions reduction target can be achieved, with little economic loss or less mitigation efforts. This predictable economic loss could reassure policymakers and encourage them to implement climate change mitigation actions to manage controllable risks. Furthermore, the health benefits associated with the reduction in air pollution were ignored in this study. This is also one of the benefits of GHG emissions reduction and the deployment of renewable energies.
Finally, the price-based selection of an energy option might allow the energy system to choose the cheapest energy sources. However, it might not encourage the deployment of REs in the primary energy supply as well as the power generation option, because previous studies have shown the importance of early investment in low-carbon infrastructure to avoid carbon lock-in [42].

4.2. Limitations

We considered the contribution of CCS technology in power generation. In reality, CCS is still at the pilot project stage and its potential in Vietnam is still being evaluated due to political and financial barriers. On the other hand, the carbon price in this study was not high enough to implement large scale CCS, and so this would not significantly affect the main implications of the study.
Another concern pertains to the carbon price, which was calculated in the model as a carbon tax to be borne by the economy. In reality, it might be impossible for Vietnamese policymakers to implement the carbon tax in the country, because there is no such market for carbon in Vietnam yet. Even in high income countries (e.g., Japan) there have been ongoing discussions about the implementation of a carbon tax, and it is not likely to be easy to implement [43].
In terms of economic development, it might be perceived that the final coal consumption for energy production is small. There are three reasons for this. First, the base year coal consumption for power generation is small and the CES function is calibrated from that data. The industrial sector remains that characteristics for the future scenario, in which the coal consumption is very small. The reason we kept the exogenous trajectories for the share or efficiency parameters is because in the model we are lack of information to predict the change of these parameters in final energy demand for the case of Vietnam. Second, the power generation assumption shows a strong increase in the future, which would force the model to indicate a large final share of electricity consumption in the industrial sector. Third, large amounts of heavy industrial goods are imported in the base year and that tendency is also calibrated in the trade functions. We might be able to change the parameters arbitrarily to increase the coal consumption in industrial sectors but this treatment requires many parameter adjustments. The development of more realistic economic development scenarios would be a very useful research area, but this was beyond the scope of this study. This topic should be investigated in future studies.

5. Conclusions

One discussion point in free power generation scenario (freeRE) is that, the mitigation cost is high but high renewable energy is not selected. This is because logit is not a cost minimizing function, and parameters representing energy security concerns or preferences in power generation sources other than direct cost measures remain in the future simulation. Thus, the mitigation cost is not necessarily low in free power scenario. On the other hand, the primary goal of this paper is to clarify the mitigation cost of INDC emissions given the alternative renewable energy policies and assess the renewable policy consistency with the climate policy in Vietnam. In that sense, we have stylized the study that has almost fixed power generation scenarios. As a result, the most important implication was that high renewable energy can reduce the mitigation efforts in energy demand side and finally macroeconomic loss can be lower and logit formulation itself did not affect so much to the conclusion.
The primary goal of this paper is to clarify the mitigation cost of INDC emissions given the alternative renewable energy policies and assess the renewable policy consistency with the climate policy in Vietnam. In that sense, we have been stylized the study that has almost fixed power generation scenarios. As results, the most important implication was that high renewable energy can reduce the mitigation efforts in energy demand side and finally macroeconomic loss can be lower.
We assessed the Vietnamese 2030 emissions target set by the INDCs in conjunction with several renewable energy policy options [16] using the AIM/CGE model. The socio-economic assumptions behind these assessments were based on the actual developmental situation of Vietnam, which enabled us to make appropriate simulations. This paper implies that if all nations are willing to put efforts and accept the predictable implications of achieving the most ambitious INDCs target, then it might be possible to bridge the gap between emissions pathways and the limitation of no more than 2 °C above pre-industrial levels [44]. Particularly, developing countries should invest more on renewable energies and implement the renewable energy policy as early as possible to avoid a carbon-intensive lock-in that makes the 2050 target too expensive to reach [45,46].
Overall, the higher contribution of renewable energies, especially biomass and SPV technologies in the Vietnam energy system, will help the country to achieve the more stringent GHG emissions reduction target with less impact on the economy and energy production. This higher level of deployment of renewable energies can be considered as an additional effort made by Vietnam to achieve its INDCs targets. In addition to the assessment of the latest REDS, this paper also proposes an additional scenario in which the deployment of wind and SPV is double that of the current strategy. The results of this scenario indicated that the mitigation costs were dramatically reduced and it would be less challenging for Vietnam to achieve the most stringent GHG emissions reduction target if the country started to utilize the highest potential of renewable energies as early as possible. In summary, the mitigation costs can be substantially reduced through a portfolio of energy policy instruments. However, mitigation costs may be still significant and the costs tend to rise with more stringent levels of atmospheric stabilization.
The development of power generation should be integrated with the actual energy demand of the economy (reasonable GDP growth), and the increase in energy production should be planned and implemented in advance (i.e., no sudden increase from previous levels). This applies for the case of the PDP7 in Vietnam, in which the target for power generation does not increase rapidly.
Following the finding in this paper, showing the 2050’s low carbon visions is expected as one of the extension of the study in the future since the Vietnam latest renewable energy development strategy [15] mentions the target of reducing 45% GHG emissions from energy sector in 2050 towards the sustainable development.

Acknowledgments

This work was supported by JSPS KAKENHI Grant Number JP16K18177, Japan.

Author Contributions

Thanh Tu Tran operated the model simulation and wrote the manuscript. Shinichiro Fujimori supported the modification and improvement of this paper. Toshihiko Masui provided the research funding.

Conflicts of Interest

The authors declare no conflict of interest.

Appendix A

Table A1. Industrial classifications of the AIM/CGE model.
Agricultural SectorsEnergy Supply SectorsOther Production Sectors
RiceCoal miningMineral mining and other quarrying
WheatOil miningFood products
Other grainsGas miningTextiles and apparel and leather
Oil seed cropsPetroleum refineryWood products
Sugar cropsCoal transformationPaper, paper products and pulp
Other cropsBiomass transformation (first generation)Chemical, plastic and rubber products
Ruminant livestockBiomass transformation (second generation with energy crop)Iron and steel
Raw milkBiomass transformation (second generation with residue)Nonferrous products
Other livestock and fisheryGas manufacture distributionOther manufacturing
ForestryCoal-fired powerConstruction
Oil-fired powerTransport and communications
Gas-fired powerOther service sectors
Nuclear powerCarbon capture service
Hydroelectric power
Geothermal power
Photovoltaic power
Wind power
Waste biomass power
Figure A1. Solar and wind power price.
Energies 09 00587 g007

References

  1. Jacoby, H.D.; Chen, Y.H. Expectations for a New Climate Agreement; MIT Joint Program for the Science and Policy of Global Change: Cambridge, MA, USA, 2014. [Google Scholar]
  2. Levin, K.; Rich, D.; Bonduki, Y.; Comstock, M.; Tirpak, D.; Mcgray, H.; Noble, I.A.N.; Mogelgaard, K.; Waskow, D. Designing and Preparing the Intended Nationally Determined Contributions (INDCs); World Resources Institute: Washington, DC, USA, 2015. [Google Scholar]
  3. Höhne, N.; Ellermann, C.; Li, L. Intended Nationally Determined Contributions under the UNFCCC; Discussion Paper; Ecofys: Utrecht, The Netherlands, 2014. [Google Scholar]
  4. United Nations Environment Programme (UNEP). The Emissions Gap Report 2015 A UNEP Synthesis Report; UNEP: Nairobi, Kenya, 2015. [Google Scholar]
  5. Turton, H.; Barreto, L. Long-term security of energy supply and climate change. Energy Policy 2006, 34, 2232–2250. [Google Scholar] [CrossRef]
  6. Tran, T.T.; Fujimori, S.; Matsuoka, Y. Changes of energy consumption and the CO2 emissions structure in Vietnam from 1986 to 2005. Environ. Syst. Res. 2010, 38, 289–299. [Google Scholar]
  7. Mathiesen, B.V.; Lund, H.; Karlsson, K. 100% Renewable energy systems, climate mitigation and economic growth. Appl. Energy 2011, 88, 488–501. [Google Scholar] [CrossRef]
  8. Ludig, S.; Haller, M.; Schmid, E.; Bauer, N. Fluctuating renewables in a long-term climate change mitigation strategy. Energy 2011, 36, 6674–6685. [Google Scholar] [CrossRef]
  9. Luderer, G.; Krey, V.; Calvin, K.; Merrick, J.; Mima, S.; Pietzcker, R.; Van Vliet, J.; Wada, K. The role of renewable energy in climate stabilization: Results from the EMF27 scenarios. Clim. Chang. 2014, 123, 427–441. [Google Scholar] [CrossRef] [Green Version]
  10. Fuss, S.; Szolgayová, J.; Khabarov, N.; Obersteiner, M. Renewables and climate change mitigation: Irreversible energy investment under uncertainty and portfolio effects. Energy Policy 2012, 40, 59–68. [Google Scholar] [CrossRef]
  11. Vietnam-Prime Minister. Decision No. 1393/QD-TTg Dated 25 September 2012 on the Approval of the National Green Growth Strategy for Vietnam; Vietnamese Government: Hanoi, Vietnam, 2012.
  12. Vietnam-Prime Minister. Intended Nationally Determined Contribution of Vietnam; Vietnamese Government: Hanoi, Vietnam, 2015; pp. 1–11.
  13. Karki, S.K.; Mann, M.D.; Salehfar, H. Energy and environment in the ASEAN: Challenges and opportunities. Energy Policy 2005, 33, 499–509. [Google Scholar] [CrossRef]
  14. England, S.B.; Kammen, D.M. Energy Resources and Development in Vietnam. Annu. Rev. Energy Environ. 1993, 18, 137–167. [Google Scholar] [CrossRef]
  15. Vietnam-Prime Minister. Decision No. 2068/QD-TTg dated 25 November 2015 on the Approval of “Renewable Energy Development Strategy of Vietnam up to 2030 with Vision to 2050”; Vietnamese Government: Hanoi, Vietnam, 2015.
  16. Vietnam-Prime Minister. Decision No. 1855/QD-TTg Dated 27 December 2007, on the Approval of “Vietnam’s National Energy Development Strategy up to 2020, with Vision to 2050”; Vietnamese Government: Hanoi, Vietnam, 2007.
  17. Vietnam-Prime Minister. Decision No. 1208/QD-TTg Dated 21 July 2011 on the Approval of “National Master Plan on Power Development (PDP7) for the 2011–2020 Period with Vision to 2030”; Vietnamese Government: Hanoi, Vietnam, 2011.
  18. Universit, O.; Erlangung, Z.; Nguyen, Q.K.; Korreferent, W.P.; Welsch, H. Long Term Optimization of Energy Supply and Demand in Vietnam with Special Reference to the Potential of Renewable Energy; University of Oldenburg: Oldenburg, Germany, 2005. [Google Scholar]
  19. Nguyen, N.T.; Ha-Duong, M. Economic potential of renewable energy in Vietnam’s power sector. Energy Policy 2009, 37, 1601–1613. [Google Scholar] [CrossRef] [Green Version]
  20. Hai, L.D.; Lien, N.T.H. Renewable Energy Policies for Sustainable Development in Vietnam. J. Sci. Earth Sci. 2009, 25, 133–142. [Google Scholar]
  21. Kumar, A.; Bhattacharya, S.; Pham, H. Greenhouse gas mitigation potential of biomass energy technologies in Vietnam using the long range energy alternative planning system model. Energy 2003, 28, 627–654. [Google Scholar] [CrossRef]
  22. Polo, J.; Bernardos, A.; Navarro, A.A.; Fernandez-peruchena, C.M.; Ramírez, L.; Guisado, M.V. Solar resources and power potential mapping in Vietnam using satellite-derived and GIS-based information. Energy Convers. Manag. 2015, 98, 348–358. [Google Scholar] [CrossRef]
  23. Dung, T.Q. P.V technology and success of solar electricity in Vietnam. In Proceedings of the Conference Record of the Twenty-Sixth IEEE on Photovoltaic Specialists Conference, Anaheim, CA, USA, 29 September–3 October 1997; pp. 1309–1312.
  24. Nguyen, K.Q. Impacts of wind power generation and CO2 emission constraints on the future choice of fuels and technologies in the power sector of Vietnam. Energy Policy 2007, 35, 2305–2312. [Google Scholar] [CrossRef]
  25. Nguyen, K.Q. Wind energy in Vietnam: Resource assessment, development status and future implications. Energy Policy 2007, 35, 1405–1413. [Google Scholar] [CrossRef]
  26. Tran, T.T.; Fujimori, S.; Matsuoka, Y. Potential of GHG emission reduction in Vietnam and its implications. Glob. Environ. Eng. Res. 2011, 19, 161–169. [Google Scholar]
  27. Mittal, S.; Dai, H.; Fujimori, S.; Masui, T. Bridging greenhouse gas emissions and renewable energy deployment target: Comparative assessment of China and India. Appl. Energy 2016, 166, 301–313. [Google Scholar] [CrossRef]
  28. Fujimori, S.; Masui, T.; Matsuoka, Y. Gains from emission trading under multiple stabilization targets and technological constraints. Energy Econ. 2015, 48, 306–315. [Google Scholar] [CrossRef]
  29. Hasegawa, T.; Fujimori, S.; Shin, Y.; Tanaka, A.; Takahashi, K.; Masui, T. Consequence of Climate Mitigation on the Risk of Hunger. Environ. Sci. Technol. 2015, 49, 7245–7253. [Google Scholar] [CrossRef] [PubMed]
  30. Hasegawa, T.; Fujimori, S.; Shin, Y.; Takahashi, K.; Masui, T.; Tanaka, A. Climate Change Impact and Adaptation Assessment on Food Consumption Utilizing a New Scenario Framework. Environ. Sci. Technol. 2014, 48, 438–445. [Google Scholar] [CrossRef] [PubMed]
  31. Fujimori, S.; Masui, T.; Matsuoka, Y. Development of a global computable general equilibrium model coupled with detailed energy end-use technology. Appl. Energy 2014, 128, 296–306. [Google Scholar] [CrossRef]
  32. Fujimori, S.; Kainuma, M.; Masui, T.; Hasegawa, T.; Dai, H. The effectiveness of energy service demand reduction: A scenario analysis of global climate change mitigation. Energy Policy 2014, 75, 379–391. [Google Scholar] [CrossRef]
  33. Dai, H.; Silva Herran, D.; Fujimori, S.; Masui, T. Key factors affecting long-term penetration of global onshore wind energy integrating top-down and bottom-up approaches. Renew. Energy 2016, 85, 19–30. [Google Scholar] [CrossRef]
  34. Lofgren, H.; Harris, R.L.; Robinson, S.; Institute, I.F.P.R. A Standard Computable General Equilibrium (CGE) Model in Gams; International Food Policy Research Institute: Washington, DC, USA, 2002. [Google Scholar]
  35. Fujimori, S.; Masui, T.; Matsuoka, Y.; Center for Social and Environmental Systems Research. N.I.E.S.AIM/CGE [Basic] Manual; National Institute Environmental Studies: Tsukuba, Japan, 2012; pp. 1–87. [Google Scholar]
  36. Namazu, M.; Fujimori, S.; Shukla, P.R.; Matsuoka, Y. Two Low-Carbon Development Pathways in India. Glob. Environ. Res. 2013, 17, 119–128. [Google Scholar]
  37. Namazu, M.; Fujimori, S.; Jiang, K.; Matsuoka, Y. Feasibility of Low-Carbon Development in China. Glob. Environ. Res. 2013, 17, 109–118. [Google Scholar]
  38. Hasegawa, T.; Fujimori, S.; Masui, T.; Matsuoka, Y. Introducing detailed land-based mitigation measures into a computable general equilibrium model. J. Clean. Prod. 2016, 114, 233–242. [Google Scholar] [CrossRef]
  39. International Energy Agency. Energy Technology Perspectives 2012; International Energy Agency: Paris, France, 2012. [Google Scholar]
  40. Vietnam-Prime Minister. Vietnam’s Socio-Economic Development Strategy for the Period of 2011–2020; Vietnamese Government: Hanoi, Vietnam, 2011.
  41. APERC. APEC Energy Demand and Supply Outlook, 5th ed.; Energy Working Group: Singapore, 2013. [Google Scholar]
  42. Erickson, P.; Kartha, S.; Lazarus, M.; Tempest, K. Assessing carbon lock-in. Environ. Res. Lett. 2015, 10, 84023. [Google Scholar] [CrossRef]
  43. Jenkins, J.D. Political economy constraints on carbon pricing policies: What are the implications for economic efficiency, environmental efficacy, and climate policy design? Energy Policy 2014, 69, 467–477. [Google Scholar] [CrossRef]
  44. Boyd, R.; Turner, J.C.; Ward, B. Intended Nationally Determined Contributions: What Are the Implications for Greenhouse Gas Emissions in 2030; Policy Paper October 2015 ESRC; Centre for Climate Change Economics and Policy: London, UK, 2015. [Google Scholar]
  45. Bertram, C.; Luderer, G.; Pietzcker, R.C.; Schmid, E.; Kriegler, E.; Edenhofer, O. Complementing carbon prices with technology policies to keep climate targets within reach. Nat. Clim. Chang. 2015, 5, 235–239. [Google Scholar] [CrossRef]
  46. Vogt-Schilb, A.; Hallegatte, S. Marginal abatement cost curves and the optimal timing of mitigation measures. Energy Policy 2014, 66, 645–653. [Google Scholar] [CrossRef] [Green Version]
Figure 1. Outline of scenario setting and the subsequent analysis. GHG, greenhouse gas; RE, renewable energies; BaU, business-as-usual; INDC, intended nationally determined contributions.
Energies 09 00587 g001
Figure 2. Future development of Vietnam in the BaU scenario. GHG, greenhouse gas; BaU, business-as-usual. (a) Primary energy supply; (b) Final energy demand; (c) Electricity generation; (d) GHG emissions and GHG intensity.
Energies 09 00587 g002aEnergies 09 00587 g002b
Figure 3. Energy and economic changes under different INDC scenarios in 2030. GHG, greenhouse gas; RE, renewable energies; BaU, business-as-usual; INDC, intended nationally determined contribution.
Energies 09 00587 g003
Figure 4. Change in primary energy supply. RE, renewable energies; BaU, business-as-usual; INDC, intended nationally determined contribution.
Energies 09 00587 g004
Figure 5. Change in final energy demand. RE, renewable energies; BaU, business-as-usual; INDC, intended nationally determined contribution.
Energies 09 00587 g005
Figure 6. Change in electricity generation. CCS, carbon capture and storage; RE, renewable energies; BaU, business-as-usual; INDC, intended nationally determined contribution.
Energies 09 00587 g006
Table 1. Main assumptions and greenhouse gas (GHG) emissions reduction targets.
IndicatorsBaULowRE-LowINDCLowRE-HighINDCHighRE-LowINDCHighRE-HighINDCAddRE-HighINDCFreeRE-HighINDC
Socio-economic development (%/year) (Source: SEDP [40])PeriodPopulation growthGDP growth
2006–20191.17.0
2010–20201.06.0
2021–20300.66.0
2005–20300.96.2
Share of renewables in power generation (%)Energy20202030202020302030No exogenous setting of RE share
Nuclear2.19.62.110.110.1
Hydro18.38.819.69.39.3
Biomass0.61.03.06.36.3
SPV3.13.13.56.012.0
Wind0.72.31.02.75.4
TOTAL RE24.824.829.234.443.1
(Source: NEDS [16], PDP7 [17])(Source: REDS [15])(Source: REDS [15] and assumption)
GHG emissions reductionin 2030 compared to BaU (%) (Source: Vietnam INDC [12])NoneAt least 825At least 8252525
Notes: BaU, business-as-usual; RE, renewable energies; INDC, intended nationally determined contribution; SEDP, socio-economic development plan; SPV, solar photovoltaic; GDP, gross domestic product; NEDS, national energy development strategy; PDP7, power development plan 7; REDS, renewable energy development strategy; GHG, greenhouse gas.

