1. Introduction
Nuclear power in China has been developing continually and is expected to grow substantially in the coming decades [
1,
2,
3,
4]. Owing to the high capacity and high safety requirements, large disturbances in electric systems may seriously influence grids and nuclear power plants (NPPs). Thus, ensuring the safety and stability of power networks and NPPs is a critical issue [
5]. Numerous power outages at home and abroad indicate that the coordination between power plants and grids is a crucial factor in ensuring the safety and stability of power systems [
6,
7,
8,
9,
10,
11,
12]. Some major achievements have been made in the coordination of control and protection system between units and the grid in recent years [
13,
14,
15,
16,
17,
18,
19]. However, these studies have not addressed the particularities of NPPs. Simulation and analysis of the interactions between NPPs and grids are currently not considered in the design and operation of NPPs in China, and neither is the effect of protection systems on the safe operation of power grids.
To improve the performance of both units and grids under adverse conditions and to meet the overall reliability requirements, a precise understanding of the interactions between NPPs and grids is required to ensure coordination of their protection systems. For this purpose, it is important to develop a dynamic model with reasonable accuracy for NPPs. Early approaches for the modeling of NPP dynamics have been proposed. Among them, some are linear models [
20,
21,
22] based on the assumption that power disturbances, such as system frequency deviation, are small, while others are extended models that take some response of the plant control and protection systems into account and are applicable for large disturbances [
23,
24,
25]. The common problem of these models is the large computational complexity, which is not suitable for large-scale power system dynamic simulations. Hence, some more simplified models have been put forward [
26,
27,
28,
29]. However, because of their precision deficiency, these linearized models cannot be used for large disturbances. The bulk power system stability simulation of NPPs in China has to be based on models of thermal units rather than on NPP models because there are no appropriate NPP models, thus it does not address the particularities of NPPs.
On the other hand, NPPs are highly sensitive to fluctuations in voltage and frequency. Severe disturbances in voltage and frequency beyond the safety range of NPPs will actuate nuclear power unit relays and cause serious accidents. Because of their relatively large capacity, the tripping or load rejection of NPPs will cause a sudden substantial loss of active power and reactive power, which consequently affects system stability significantly. Reference [
30] studies the dynamic responses of an NPP to power grid faults and the influence of tripping an NPP on the power grid. Reference [
31] analyzes the NPP risk and grid instability in case of transmission system voltage excursions and discusses the interface requirements between NPPs and grids. Reference [
32] studies the characteristics of NPPs, along with their interactions and compatibility with grids of limited capacity, and investigates remedial measures based on NPP operational experience. To get a true picture of the performance of NPPs, the effects of their protection systems, which have usually been simplified or eliminated in previous studies, should be considered in the dynamic simulation. Although references [
23,
24,
25,
31,
32,
33,
34] do consider some protections of NPPs, the influences of NPP and grid protection systems have not been systematically taken into account. Thus, the interactions between NPPs and the grid cannot be accurately reflected.
This paper presents a new mathematical model of NPPs with high precision for the most widely used pressurized water reactors (PWRs) in China, so that the design and performance characteristics of NPPs can be well understood. Based on this detailed model, the interactions between NPPs and grids under the conditions of over-frequency, under-frequency, and under-voltage are analyzed in detail, with special stress applied to the effect of protection systems on both NPPs and power grids. The results show that incoordination between NPPs and grids could lead to serious consequences when the power system experiences adverse conditions. For instance, due to unreasonable settings of the under-frequency relay, tripping of some thermal plants will result in a faster decease in system frequency, which could trigger the under-speed relay of the main pump to shut down the reactor, and might even cause an unmanageable cascading reaction. Therefore, additional attention should be paid to the cooperation between NPPs and power systems.
Some coordinated control and protection principles for both NPPs and grids are proposed in this paper. The special protection systems of power systems, i.e., under-frequency load shed (UFLS), under-voltage load shed (UVLS) and over-frequency generator trip (OFGT), should be considered the primary measures to ensure the safety of NPPs in case of severe frequency and voltage excursions. In addition, the relays of NPPs can be the last resort to ensure unit safety when the situation is out of control. A system-wide regulation of grid-related relays concerned with frequency, such as under-frequency relays, over-frequency relays and over-speed protect controllers (OPCs), will contribute to the safe operation of NPPs. Moreover, some protections of conventional plants, for example, under-frequency relays and under-voltage relays, should be less conservative than those of NPPs. Otherwise, the operating conditions of NPPs in the case of under-frequency or under-voltage will be degraded. Furthermore, limiters and protections of NPPs should also try to support the system stability as long as possible without degrading their own safety.
The rest of this paper is organized as follows.
Section 2 proposes a new and accurate model of PWR NPP with reduced computational complexity. The effectiveness and accuracy of the model are verified in
Section 3. Based on this model,
Section 4 analyzes the interactions between NPPs and power grids and proposes the coordinated control principles and control schemes. In addition, case studies on a real 500 kV large-capacity power grid in China are performed in
Section 5. Finally, conclusions are drawn in
Section 6.
2. The Dynamic Model of a Pressurized Water Reactor Nuclear Power Plants
A new mathematical model of NPPs is developed in this section, which is applicable to the short, mid, and long-term dynamic simulation of large-scale power systems. It should be pointed out here that the terms of short, mid, and long-term dynamics are not strictly defined in the world. Normally, in China, the timescales of the short, mid, and long-term dynamics are approximately several seconds to 30 s, 30 s to 30 min, and 30 min to several hours, respectively.
2.1. Basic Modeling Considerations
Because of the complex mechanism, strong rigidity, severe nonlinearities and close coupling characteristic, a detailed simulation NPP model, such as a full-scope simulator, should be established to accurately reflect the dynamic performance of NPPs. However, a full-scope simulator is mainly used for NPP operator training and internal equipment failure simulations. Normally, a full-scope simulator includes more than 100 subsystems [
35,
36,
37,
38,
39,
40,
41,
42], and the order of the differential equations in its primary system model is more than 5000. In addition to the reactor kinetic model, reactor control system and thermal-hydraulic system, a full-scope simulator also simulates auxiliary systems, such as ventilation systems, feed water systems and spray systems. However, such an NPP model that is too complex would lead to an excessive amount of computation, and is definitely not suitable for the stability simulation of a large-scale power system, especially when NPPs account for a certain percentage of the grid.
In order to analyze the interaction between NPPs and large power grids, a simplified NPP model in this paper is put forward based on some existing models [
25,
26,
36,
37,
39,
40,
42]. To reduce the computational complexity, the modeling approach in this study is based on the lumped parameter model. Special attention is paid to the heat exchange process, which is simplified according to the Laws of Conversation of Energy and Conversation of Mass. While the subsystems or devices that have little effect on the short, mid, and long-term dynamics of power systems are ignored. Thus, the simulation scope and computational complexity of the simplified model is much smaller than that of the full-scope simulator.
2.1.1. Simplification of a Point Reactor
In a full-scope NPP simulator, fission power and decay power are calculated using detailed models with six groups of delayed neutrons and eleven groups of radionuclides, respectively [
42]. To achieve computational economy, an equivalent group of delayed neutrons and nuclear decay nuclides are used to calculate the reactor power without considering its three-dimensional distribution, which is also performed in a full-scope simulator. As far as the reactor core is concerned, the amount of calculation required for a simplified model is much less than that in a full-scope simulator.
To ensure adequate accuracy, the reactor response curves of the equivalent model and a detailed model in a full-scope simulator are analyzed under different operating situations, such as a generator trip, reactor shutdown, and load ramp increase and decrease. The tests demonstrate that the difference between the equivalent model and the detailed model is quite small with an error of less than 1% in most cases. In the generator tripping and net load rejection cases, the differences are relatively large, with the largest error in fission power of up to 7% and the maximum error in the decay heat of up to approximately 3%. Because the unit has been split with the grid in these cases, it does not affect the accuracy of power system dynamic simulation. Therefore, the equivalent model can simulate the system with relatively high calculation precision.
2.1.2. Ignoring the Pressurizer
The main function of the pressurizer is to maintain supercooling of the primary system to prevent departure from nucleate boiling. The pressurizer is not directly involved in the heat exchange, and, normally, it stabilizes at approximately 15.5 MPa. Even in the case of load rejection or scram, the primary circuit pressure can still be maintained within the control range, i.e., between 13.2 MPa and 16.45 MPa, due to the pressure and water level control system. The main factors that affect the heat transfer of the primary system are the coolant flow, density and specific heat. Compared with the change in coolant density caused by temperature, the density fluctuations of the coolant due to pressure changes in the above range can be neglected. Therefore, the physical property changes are mainly influenced by changes in temperature other than those in pressure. Thus, the pressure of the primary system can be simplified as a constant, which will cause little deviation of the simulation results.
2.1.3. Introduction of the Flow Rate, Specific Heat and Density of the Coolant
Most existing NPP models assume that the temperature and flow rate of the primary coolant remain unchanged, therefore, the coolant density and specific heat can be processed as constants. However, the coolant flow rate is directly affected by the voltage and frequency of the primary pump, while the density and specific heat have temperature-dependent features with the corresponding design range of the coolant temperature of 291–310 °C; thus, these variables cannot be simply processed as constants. Otherwise, they will result in an error of up to 10%–20% according to the field measurements and full-scope NPP simulations. Therefore, this paper introduces these important variables into the new NPP model.
2.1.4. Simplification of the Feed Water System
The steam generator (SG) is the energy exchange center between the primary system and the secondary system, where the PWR coolant transfers heat to the secondary system to drive the steam turbine through a U-shaped metal tube. The method by which the energy is exchanged between the primary system, and the secondary system is the main difference between a conventional unit and a nuclear power unit.
Among the variables in the feed water system [
41], the feed water flow rate and enthalpy have the largest influences on the heat transfer in the SG. During normal operation, the feed water flow can be assumed to be equal to the steam flow due to the SG water level control system. The feed water enthalpy is subject to the turbine steam extraction rate, which is closely linked to the unit power level. Thus, the feed water enthalpy can be set by the unit power level according to the unit heat balance diagram. The site measured data from the full scope simulator show that the error of this method is generally less than 1 percent, with the maximum error of less than 1.6 percent, which can be satisfied with the precision requirements of dynamic simulation.
2.1.5. Equivalence of the Thermodynamic Process in Turbine
Reference [
25] established a turbine model for PWR NPPs, but the complex model with large computational requirements is not suitable for the dynamic simulation of large-scale power grids. Compared with the turbines of thermal units, a PWR unit turbine has lower initial steam parameters and a larger volume flow rate; however, there are no significant differences between the secondary system of an NPP and that of conventional units. Therefore, in this work, the NPP secondary system, normally including an electrical generator, exciter, stabilizer, steam turbine and governor, is modeled based on on-site measuring data with reference to the thermal unit model [
43,
44].
Based on the principle of conservation of energy, the thermal power of the secondary system is calculated by multiplying the steam flow and the difference between the enthalpies of steam and feed water. In addition, the thermal efficiency of the steam flow should be considered during the process. On the premise of definite enthalpy, there is a good linear relationship between the turbine power and steam flow. Therefore, accurately simulating the governor and the bypass system, and hence calculating the steam flow according to the corresponding the valve opening, are the keys to accurately determining the turbine power. The results show that the turbine power error between the new model and that of the full-scope simulator is less than 0.6%.
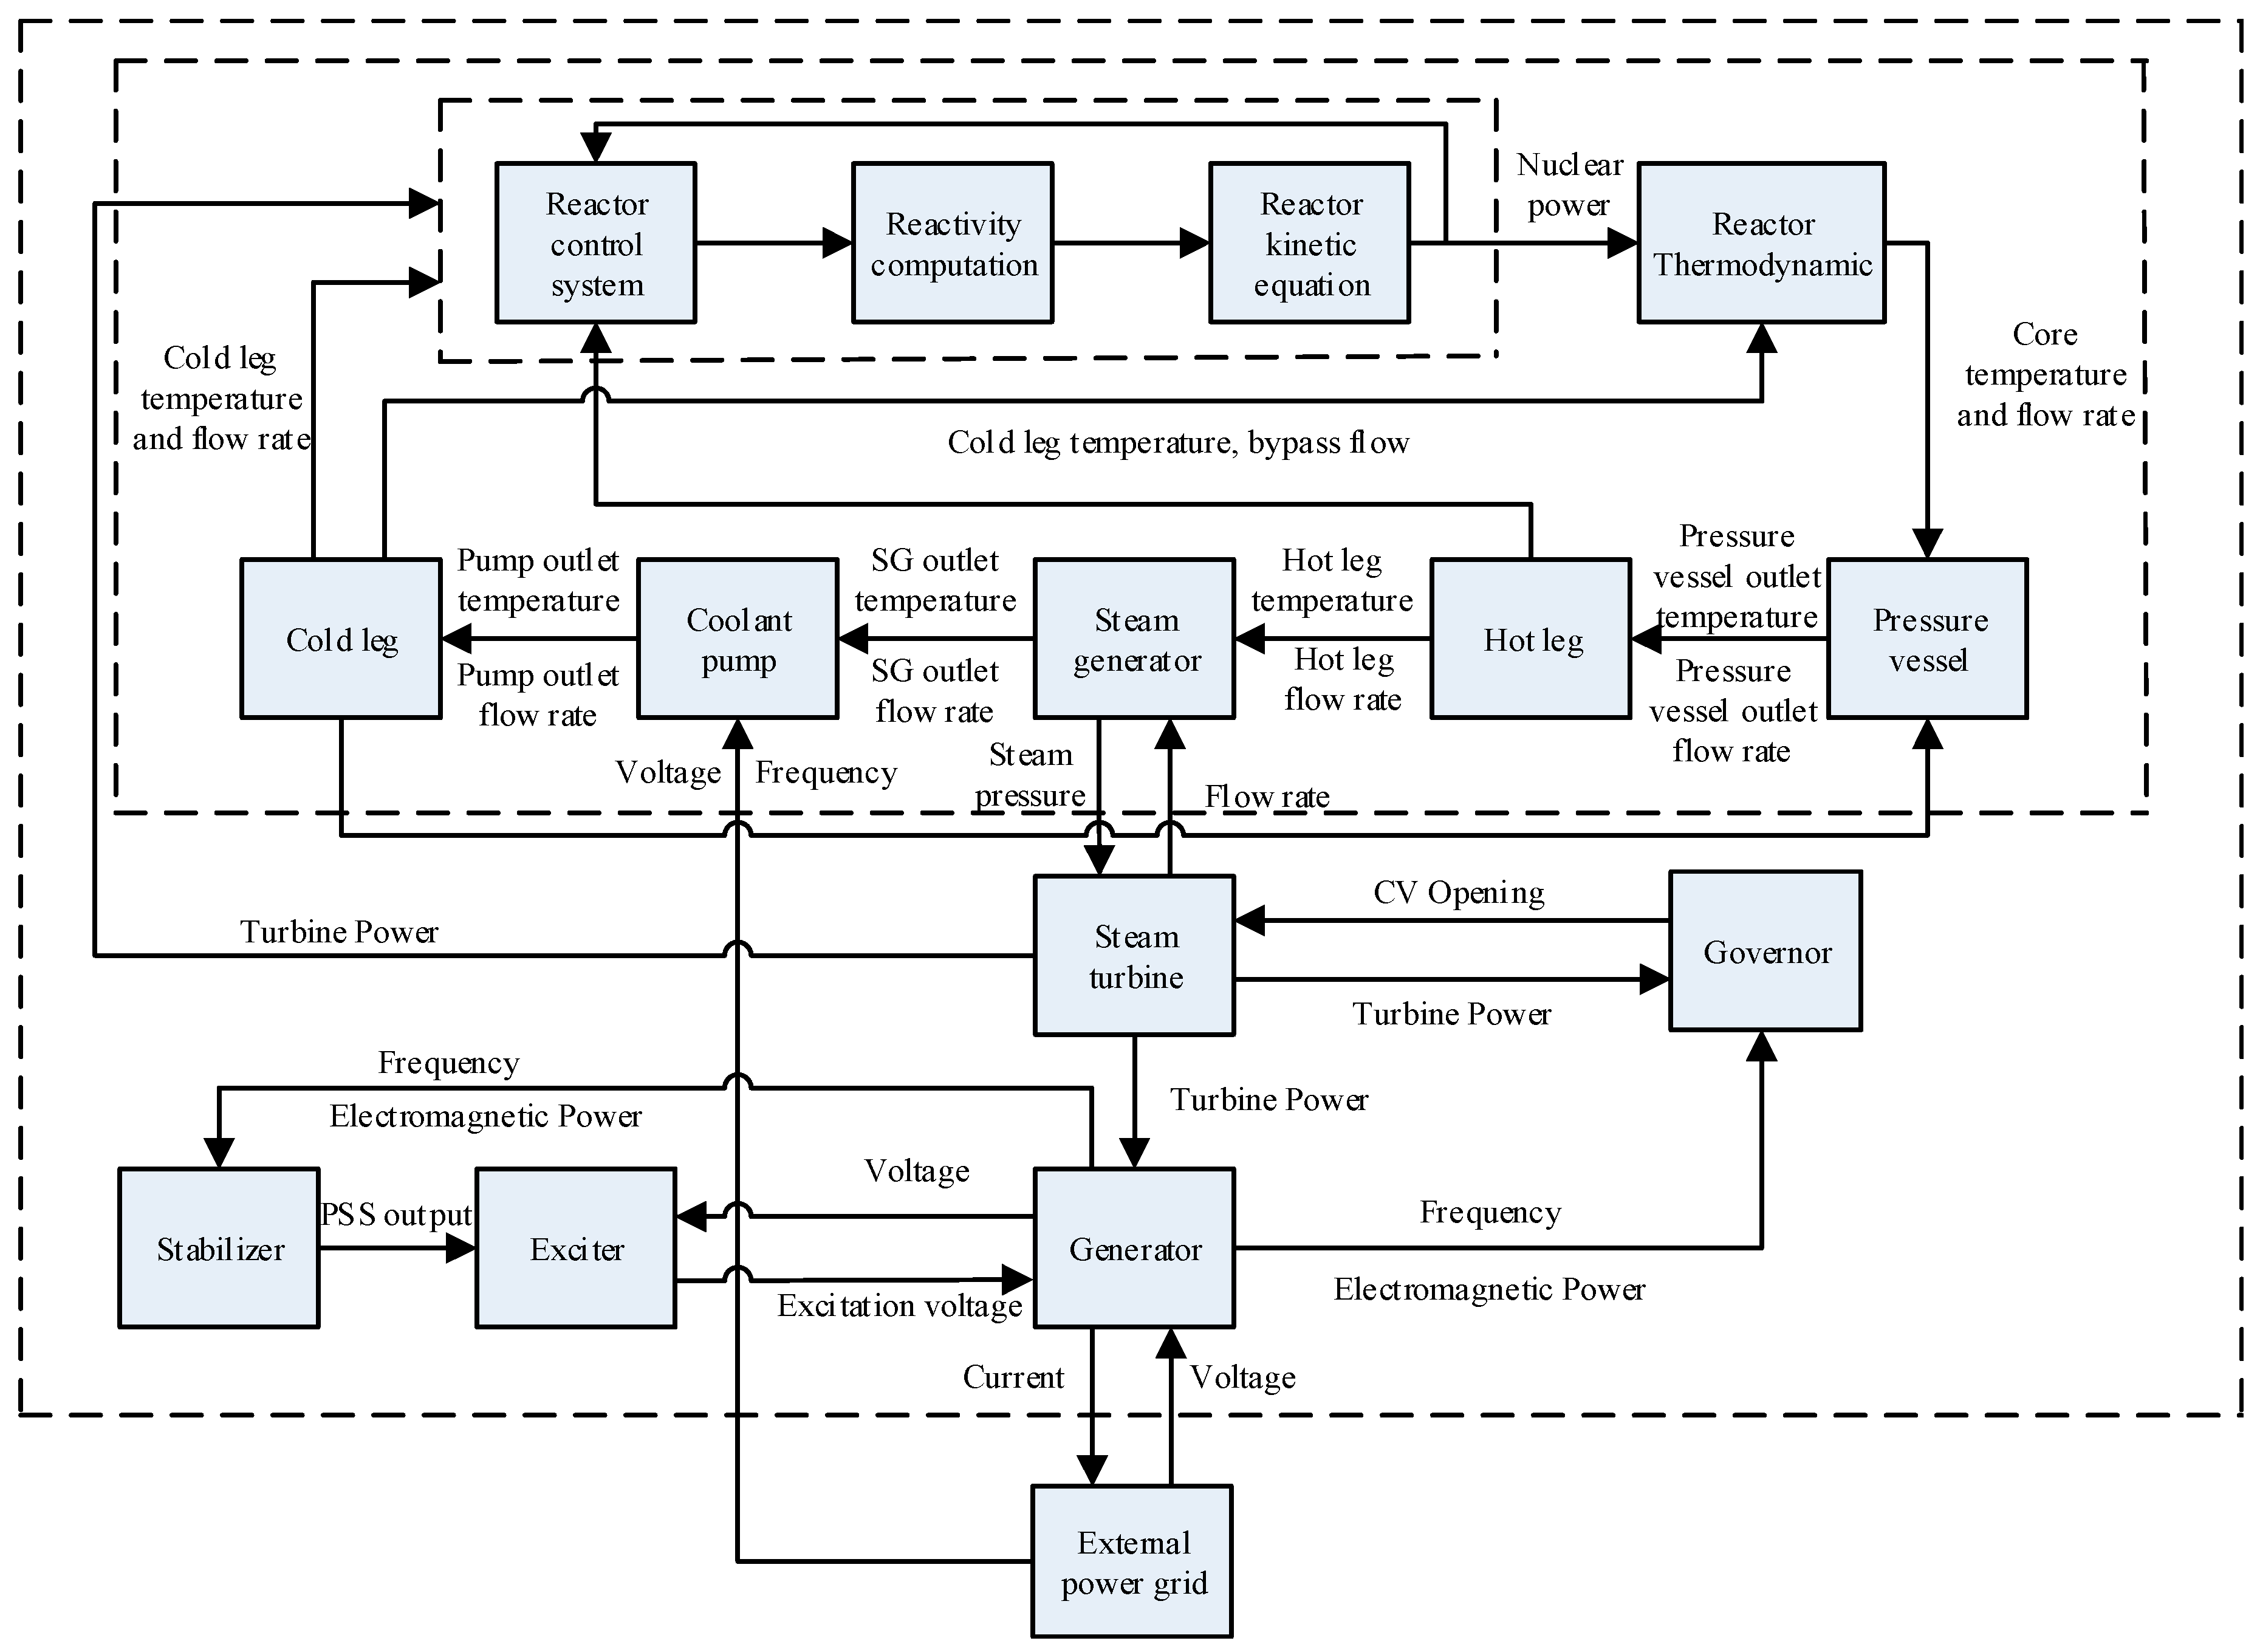
2.2. Model of a Pressurized Water Reactor Nuclear Power Plant
The PWR NPP model developed in this work consists of a reactor, primary system, secondary system and the corresponding protection system. This paper mainly discusses the primary system of the NPP depicted in
Figure 1 together with its protection system.
2.2.1. Point Reactor Kinetic Equation
As mentioned above, the point reactor model in a full-scope simulator is quite complicated [
42], which is not necessary in power system dynamic simulations. To reduce the computational complexity, the neutron kinetics should be simplified without considering the three-dimensional distribution. Nuclear power is proportionate to the neutron flux density. Thus, the dynamic characteristics of an NPP reactor can be modeled by the equivalent delayed neutrons as follows:
where
Pr,
Pf, and
Fd are the total reactor power, fission power and decay heat, respectively.
R is the reactivity, and β is the equivalent fraction of delayed neutrons. Λ is the neutron generation time, and
C is the neutron density. λ and λ
d are the equivalent decay constants of delayed neutron and decay heat, respectively.
The decay heat accounts for approximately 7.7% of the total reactor power. Because this value is relatively small, it is ignored in most power system stability research related to NPPs. However, it should be taken into account when considering large disturbances.
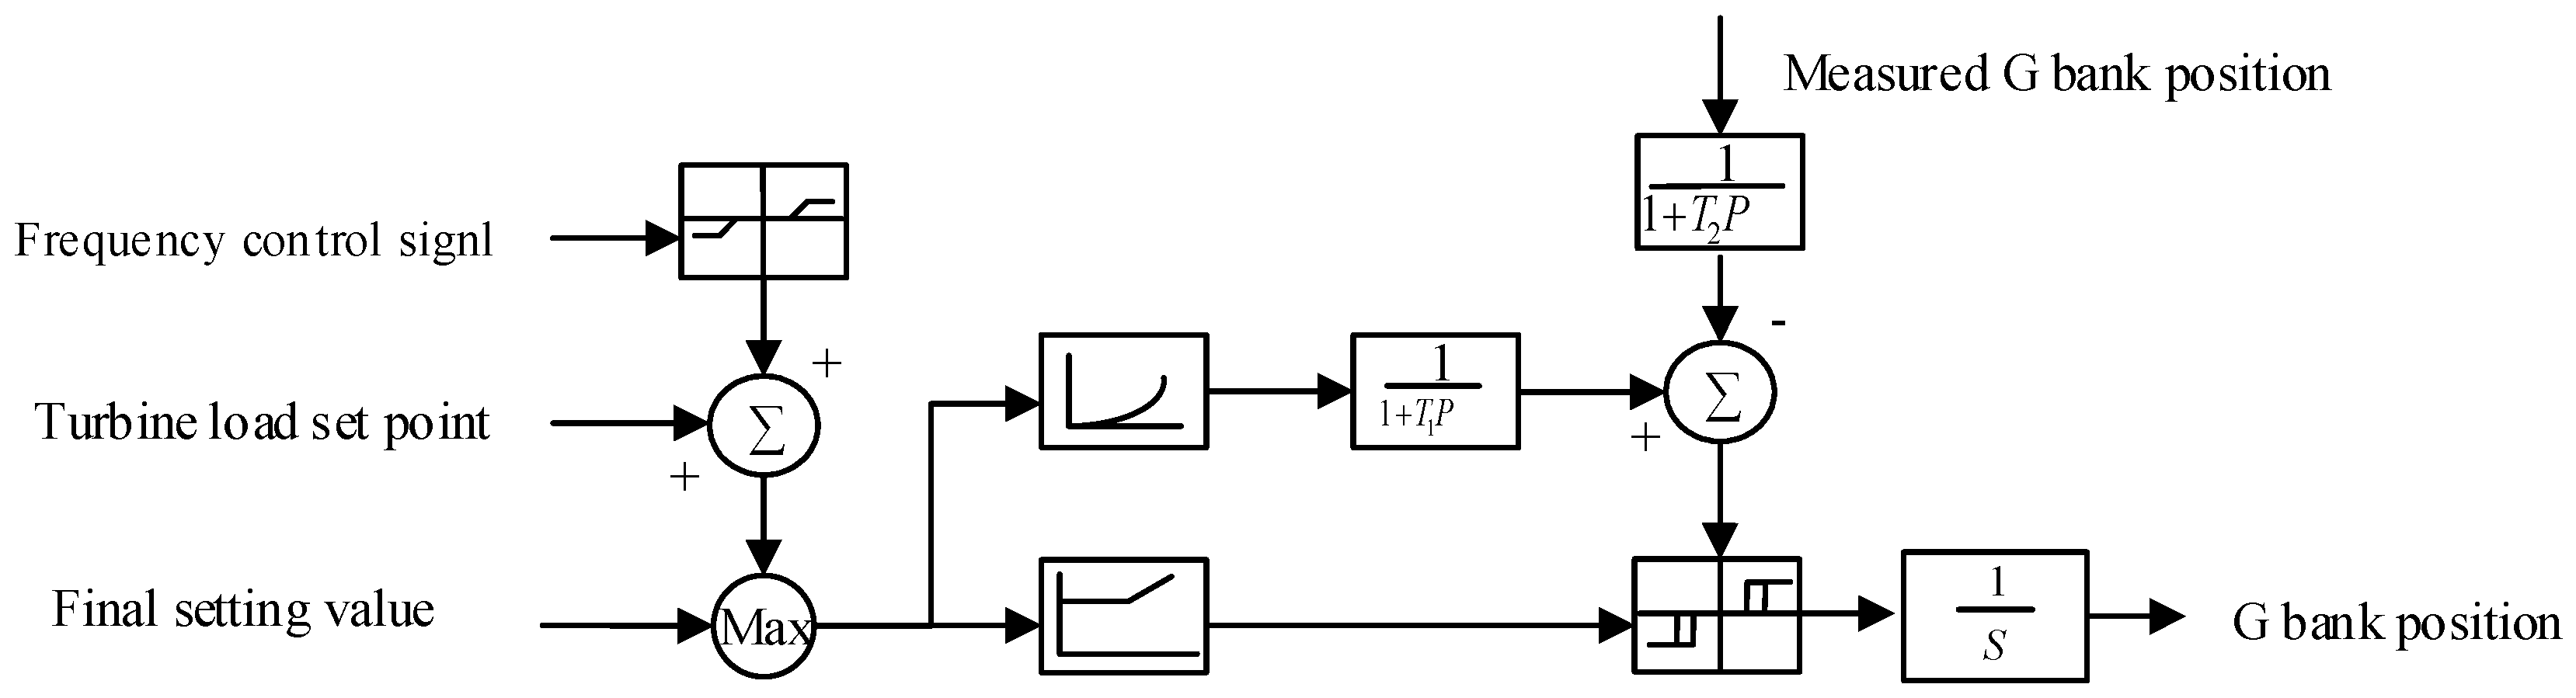
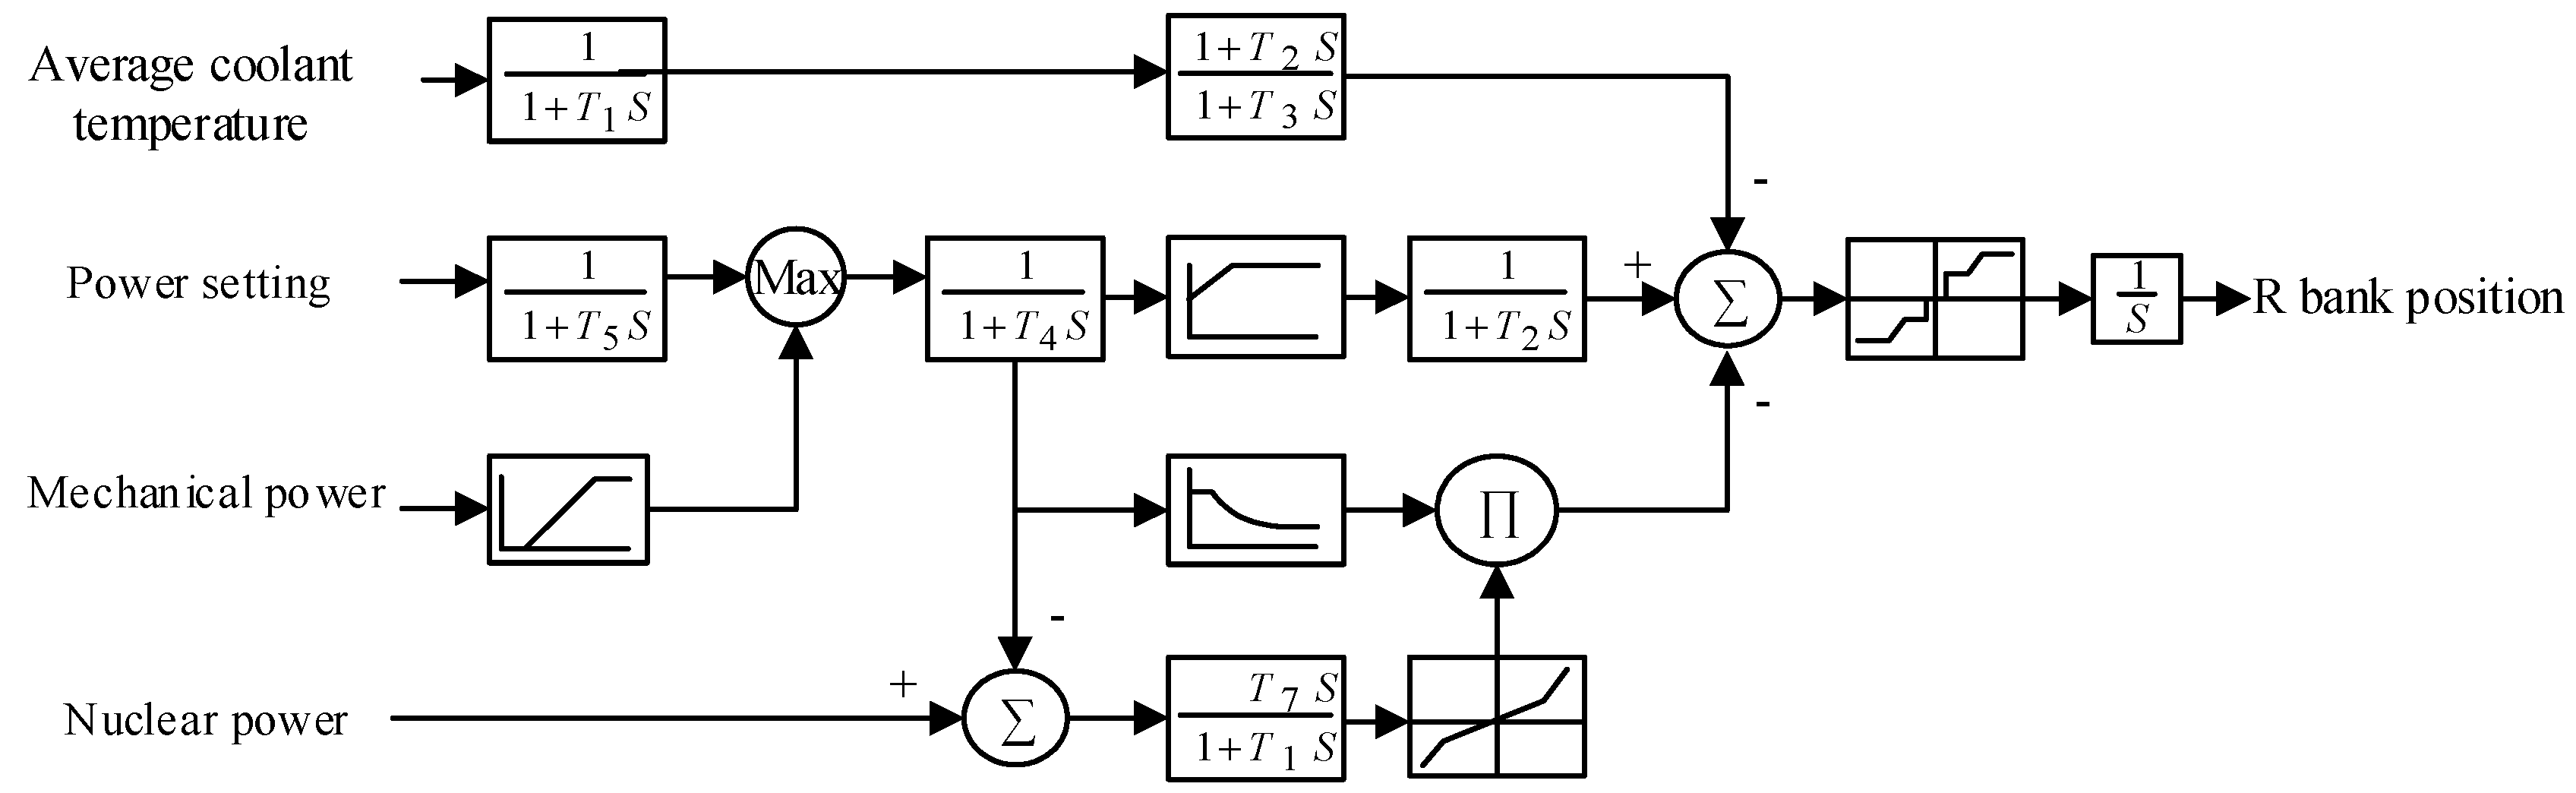
2.2.2. Reactor Control System
The reference NPP normally operates in the reactor-follow-turbine mode, which is realized by combining the power regulating system and temperature regulating system. The former is an open control system, which calculates the G bank position to determine the reactor power roughly according to the load set point and frequency control signal, and the latter is a closed control system, which calculates the R bank position to ensure the fine adjustment of the average temperature of the coolant according to the steady state program. On the basis of the reference [
39], the reactor control system is simplified according to the operation principles of the full-scope simulator. Functions unrelated to heat transfer are ignored, such as measurement, signal transfer and pressure control. Block diagrams of these control systems are shown in
Figure 2 and
Figure 3, respectively.
2.2.3. Reactor Thermodynamics
The reactor thermodynamics are simulated on the basis of reference [
25]. However, the flow rate, specific heat and density of the primary coolant in reference [
25] are processed as constants, which will result in an error of up to 10%–20%. To improve the simulation accuracy, these variables are introduced into the new model. A reactor thermodynamic model is employed to define the heat transfer in the reactor. The temperature of the fuel lump will increase when it absorbs fission energy. It will then transfer this energy to the coolant. According to the laws of conservation of energy and mass, the reactor thermodynamic model can be described as follows:
where
Tf,
Tac,
Taco and
Tcl are the temperatures of the fuel lump, core, outlet of the core, and cold leg, respectively.
Xc is the percentage of heat released by the fuel lump.
mf and
mc are the masses of the fuel and coolant, respectively.
Cpf and
Cpc are the specific heats of the fuel and coolant, respectively.
h and
A are the heat transfer coefficient and area, respectively.
uac is the mass flow rate in the core.
2.2.4. Reactor Coolant Pump
The reactor coolant pump [
26], which is one of the most important pieces of equipment in a PWR NPP, is the only component in the primary system directly affected by the grid state and the main channel for the reactor transients caused by power system disturbances. The changes in coolant flow caused by changes in the main pump speed are determined by the system frequency and voltage disturbances, which cause transients in the primary system. Therefore, the main coolant pump can be modeled with Equations (7) and (8) as follows.
where ω
p and ω
n are speed and rated speed of the coolant pump, respectively;
Me and
Mm are the electric and mechanical torque, respectively;
uv is the coolant flow rate; and
un is the rated coolant flow rate.
2.2.5. Steam Generator Model
The SG is the hub of energy exchange between the primary system and secondary system. The high-pressure and high-temperature coolant enters the SG through a U-shaped metal tube and transfers heat to the secondary system. Then, the feed water of the secondary system absorbs the heat and evaporates into saturated steam to drive the steam turbine. According to the law of conservation of energy, the primary side, the metal of the U-shaped tube and the secondary side can be modeled by Equations (9)–(11). By assuming that the water supply rate always equals the steam rate, the steam pressure can be calculated using the temperature of the secondary side.
where
m,
C and
T are the coolant mass, specific heat and temperature, and the subscripts p, m, and S denote the primary side, secondary side, and U-shaped tube, respectively;
Thl is the coolant temperature of the hot leg;
Tpo is the outlet coolant temperature of the SG on the primary side;
fstm is the steam flow rate of the inlet of the turbine;
hin and
hout are the water enthalpy of the secondary inlet and outlet of the SG.
2.2.6. Turbine Bypass System Model
Due to the limited adjustment ability of the reactor control system, the decreasing speed of the reactor power will be restricted even in a sudden large disturbance such as load rejection. To ensure the safety of the reactor, a steam dump system should be started to vent the excess hot vapor and to maintain the power balance between the reactor and turbine. The new turbine bypass system model is derived from Reference [
37]. To simplify the control logic, 15 by-pass valves are equivalent to two virtual valves. A principle diagram of the turbine bypass system is shown in
Figure 4.
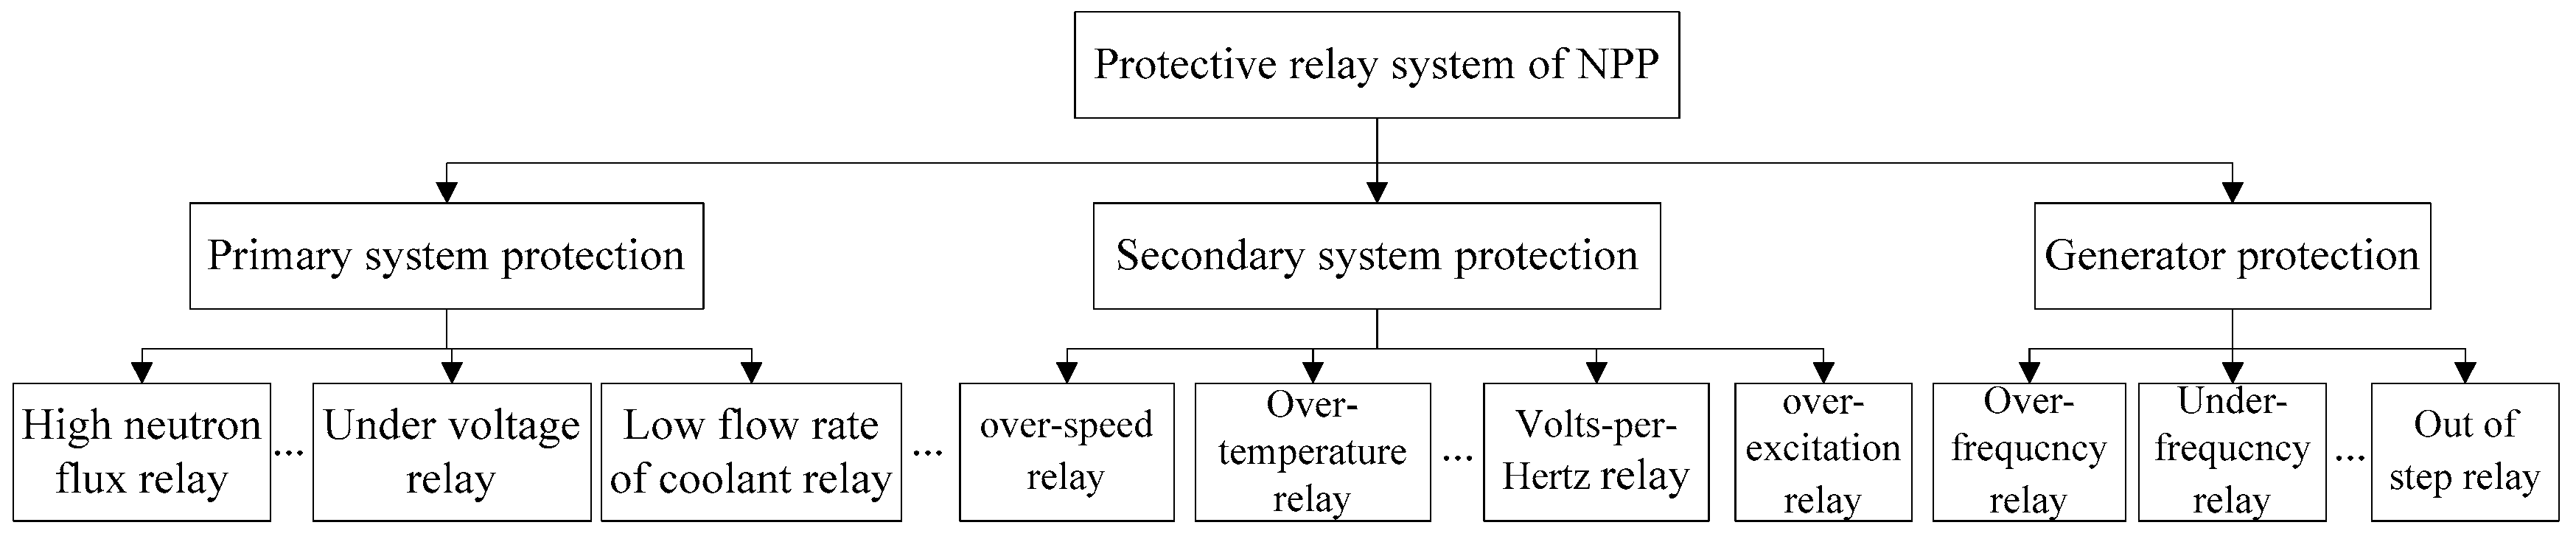
2.2.7. Protection System of a Nuclear Power Plants
Because of their high safety and reliability requirements, NPPs are equipped with complex and high-performance protection systems, including reactor protection, turbine protection, and generator protection. This paper focuses on the protective functions that prevent abnormal behaviors caused by the grid, such as changes in voltage or frequency, and does not consider relay behaviors caused by equipment failures, e.g., failures of the condenser, steam dump system, or water level regulation system. The protection system of the NPP studied in this paper is shown in
Figure 5.
3. Validation of the Pressurized Water Reactor Nuclear Power Plants Model
This model is introduced into the power system department full dynamic simulation program (PSD-FDS) by the China Electrical Power Research Institute, which is applicable to the simulation of power system short, mid, and long-term dynamics. The required data are taken from design and final safety analysis reports of the Fangjiashan (Haiyan, China) NPP. For safety reasons, it is infeasible to model NPPs based on field tests in China at present. To verify the effectiveness of the new model, the actual full-scope simulator of the Fangjiashan NPP is used as a reference in this paper, which can represent the nuclear reaction process and fluid thermal-hydraulic phenomena with high accuracy. Compared with the full-scope simulator, the change tendencies of the major variables during the transient process are consistent in both models with maximum transient errors of less than 10%, while the static errors of the main parameters of the simplified mode are less than 1%.
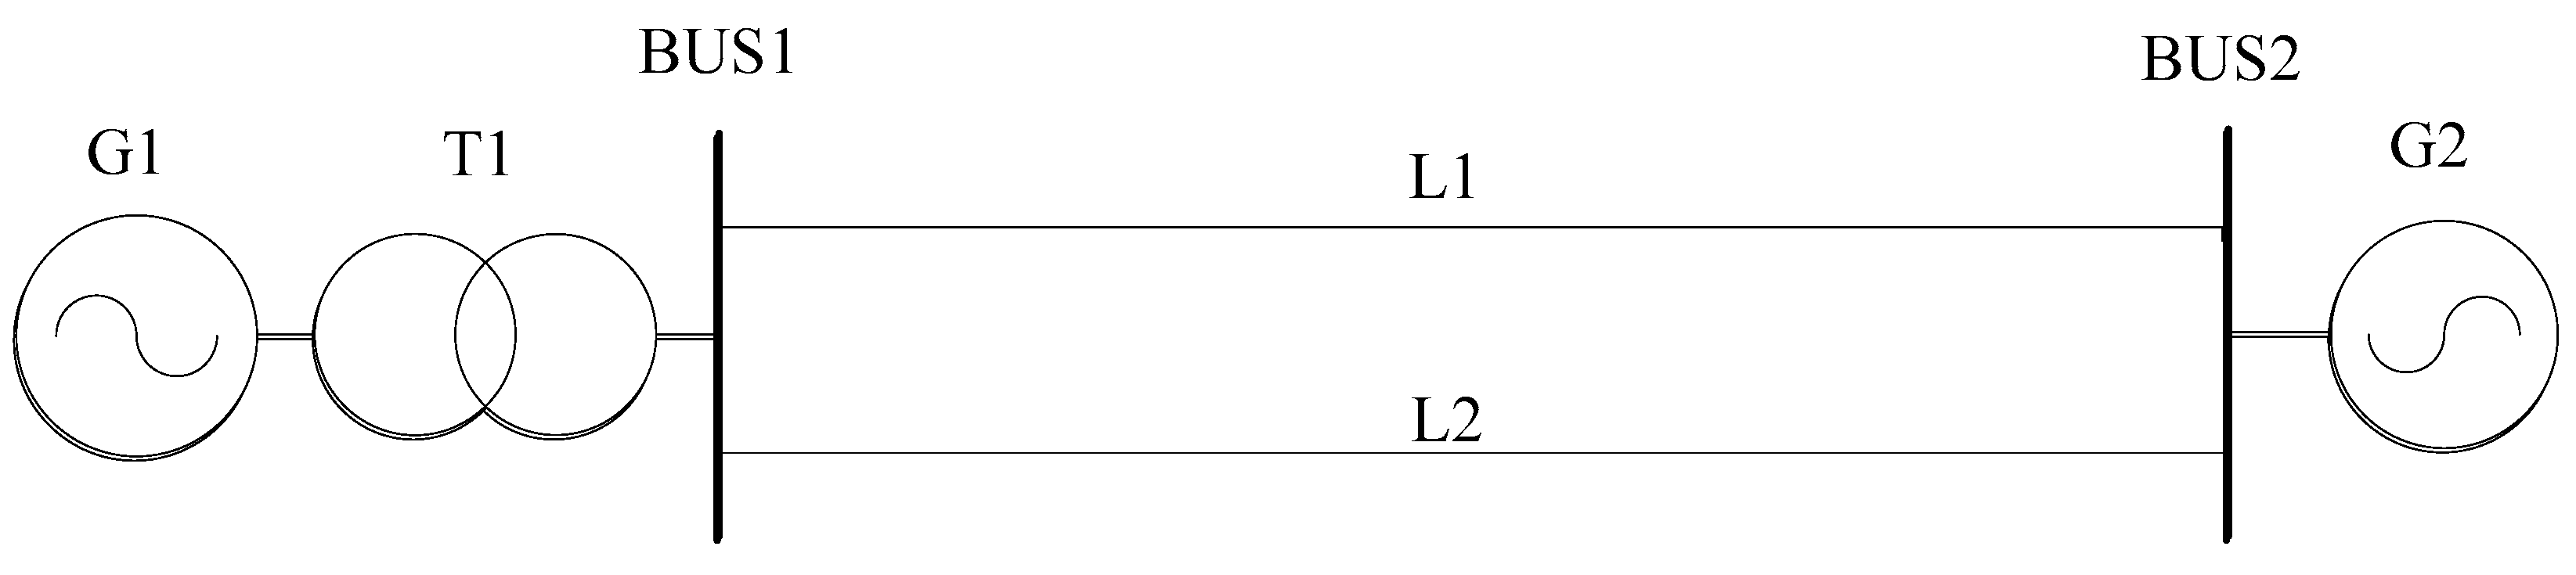
Figure 6 shows a schematic diagram of a single unit infinite system, in which NPP G1 with a capacity of 1089 MW is connected to the infinite system G2 through a step-up transformer T1 and 500 kV transmission lines. A comparison between the simulation results of this model and the observed responses of the main process parameters in the full-scope simulator shows that they are in satisfactory agreement. Due to limited space, this paper enumerates three typical working conditions including load ramp decrease, load step decrease and net load rejection.
3.1. Load Ramp Decrease
At 50.0 s, the generator load request begins to ramp from 100.0% full power (FP) to 50.0% FP at a rate of 50 MW/min. Owing to governor response, the control valves (CVs) begin to throttle down. Therefore, the steam flow through the turbine decreases, while the steam pressure and temperature in the SG increase. Thereby, the heat exchange between the primary side and the secondary side decreases, and the coolant temperature increases. During this process, the control rods insert into the reactor core smoothly. Finally, the reactor power stabilizes at 51.8% FP, and the turbine power steadily decreases to 50.0% FP at approximately 750 s.
Figure 7 shows that the turbine power can steadily track the load request, while the reactor power can smoothly follow the turbine power changes. There is no major oscillation and overshoot during the process. In addition, the dynamic characteristics agree well with the results of the actual unit.
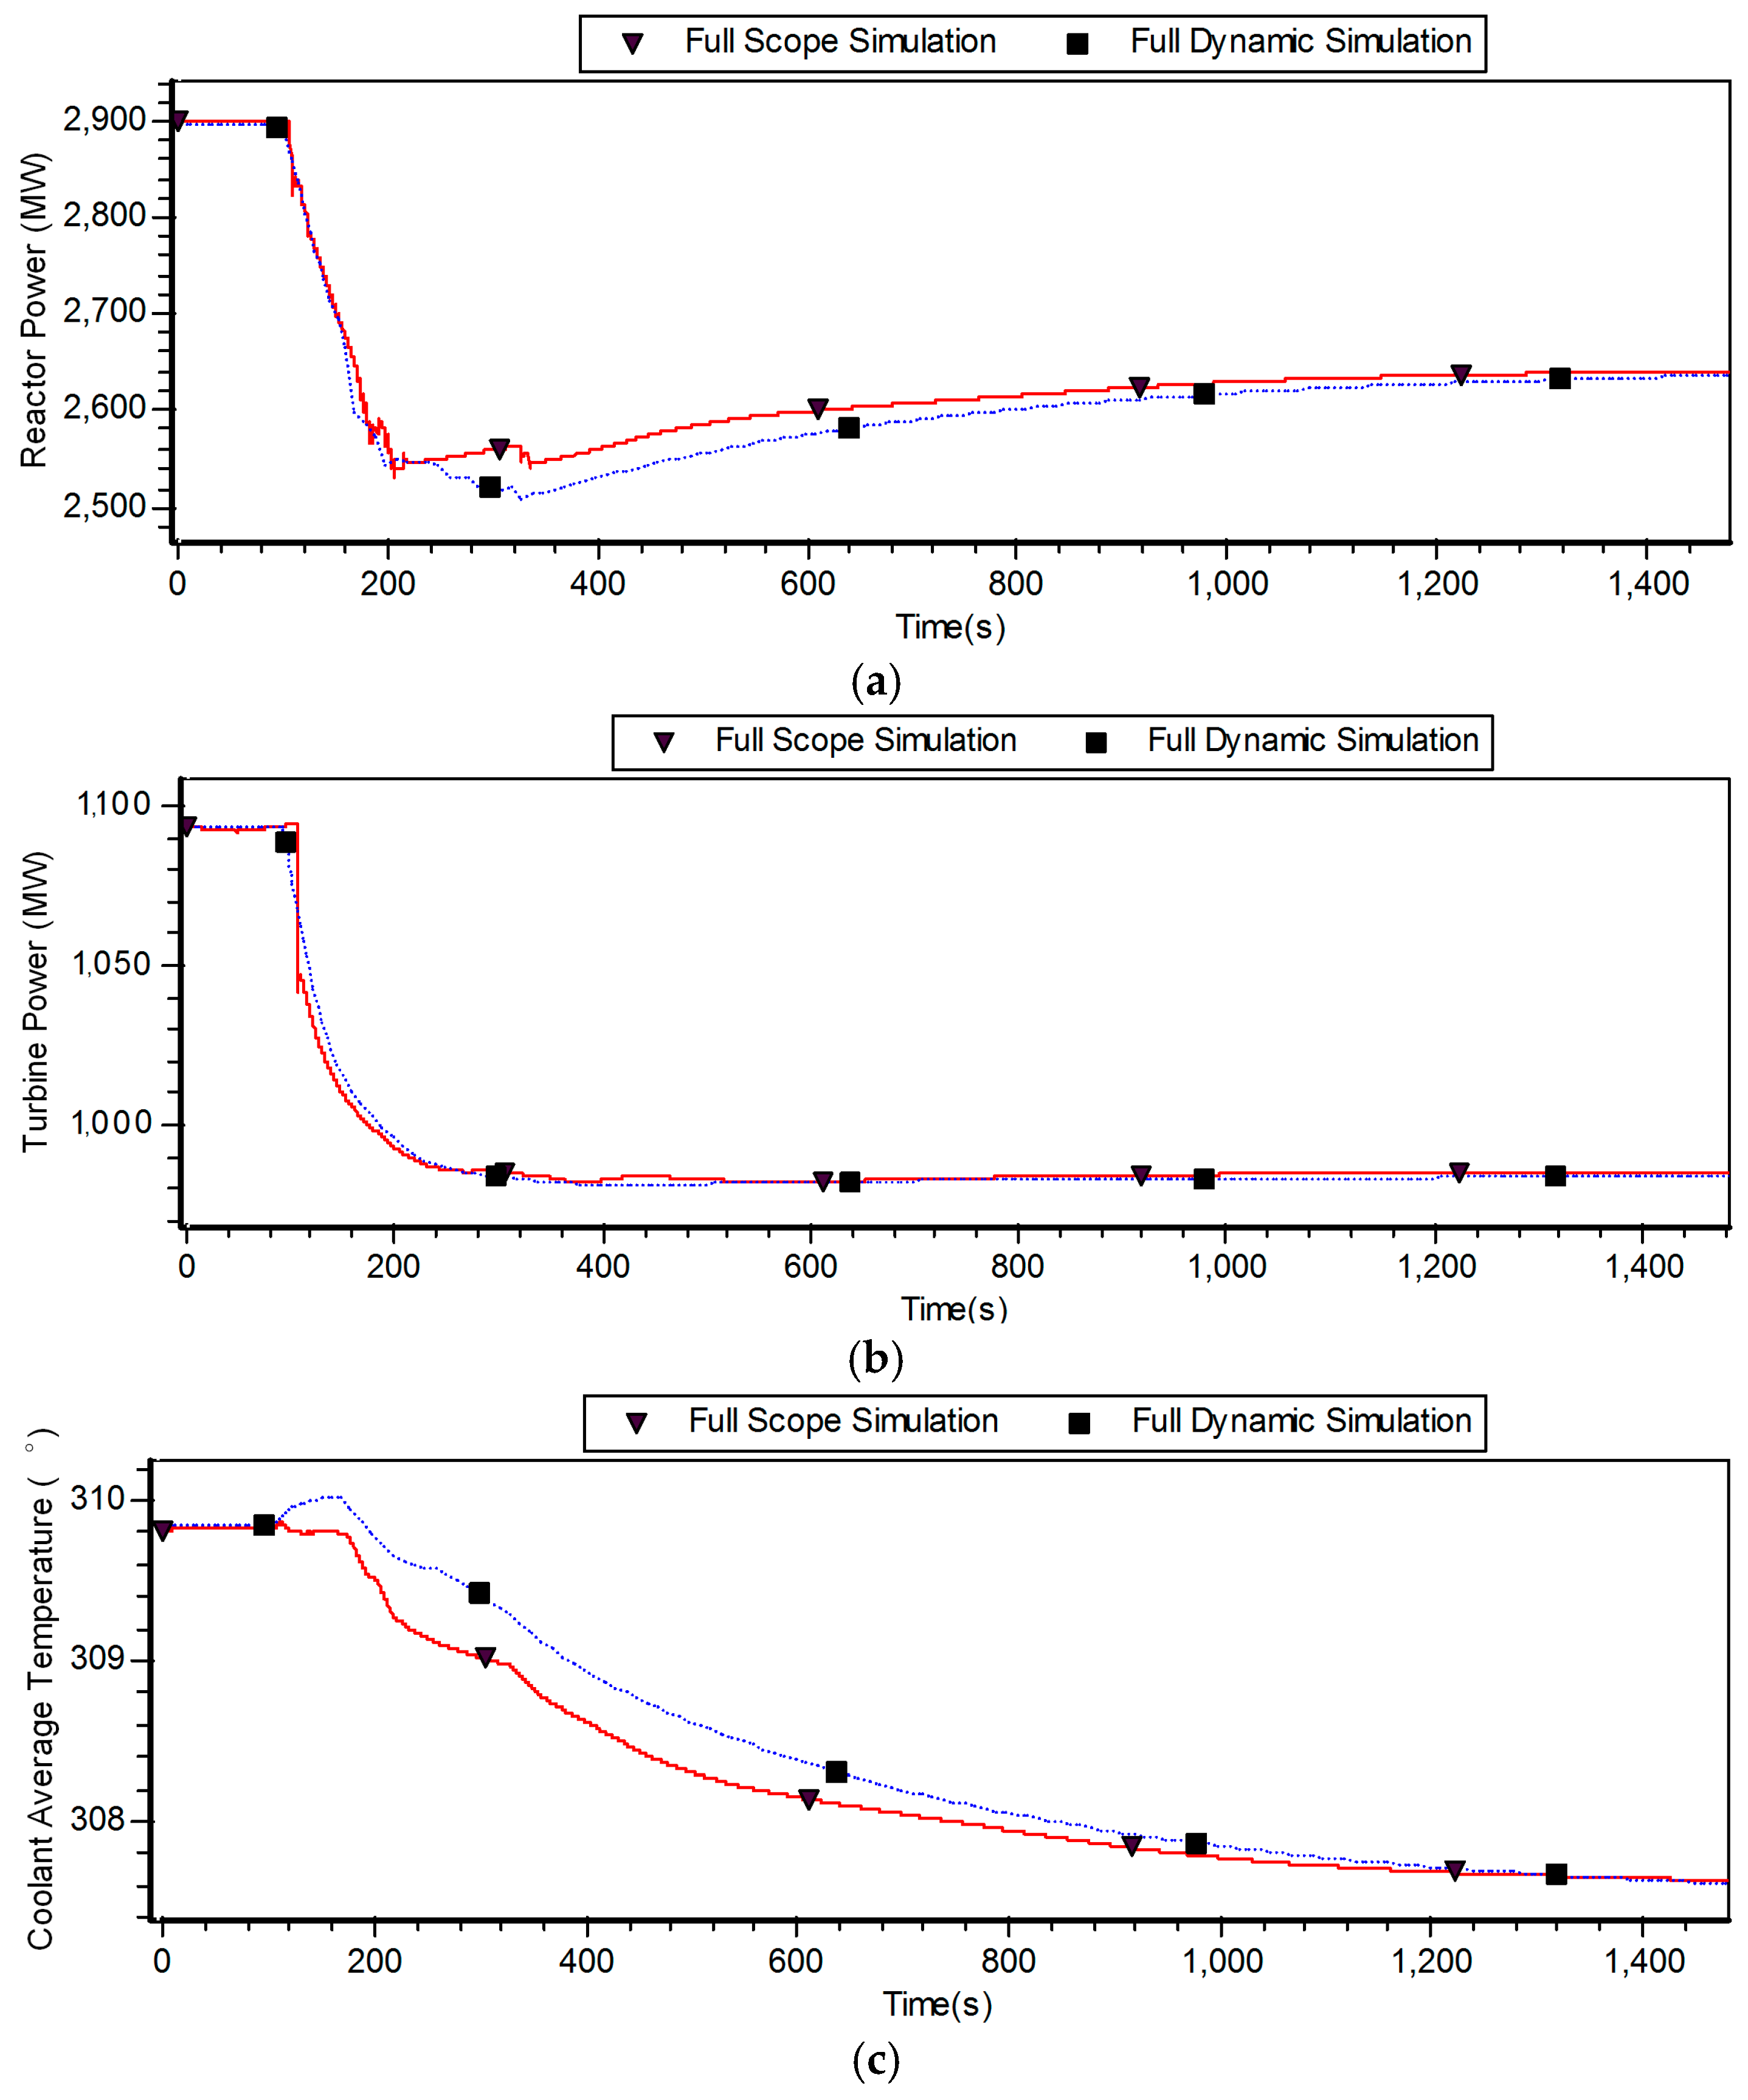
3.2. Load Step Decrease
At the beginning of the load step, which occurs at 85.0 s, the generator load request sharply decreases from 100% to 90% of nominal power. To follow this evolution, the CVs partly close to reduce the steam flow rate by 10%. Therefore, the steam pressure, SG temperature and coolant temperature increase, and the nuclear power begins to decrease because the reactor power set point of the reactor regulation system is determined by the load request. Meanwhile, the temperatures of the core fuel and the coolant will eventually decrease.
Compared with load ramp, load step has a similar response but at a faster rate. Moreover, the variation of the reactivity feedback introduced by the core fuel temperature, coolant temperature and reactor regulation system lags behind the change in the reactor power, which results in some overshoot. When the reactivity reverses from negative to positive, the reactor power will gradually increase and eventually remain stable at approximately 91.1% FP (
Figure 8).
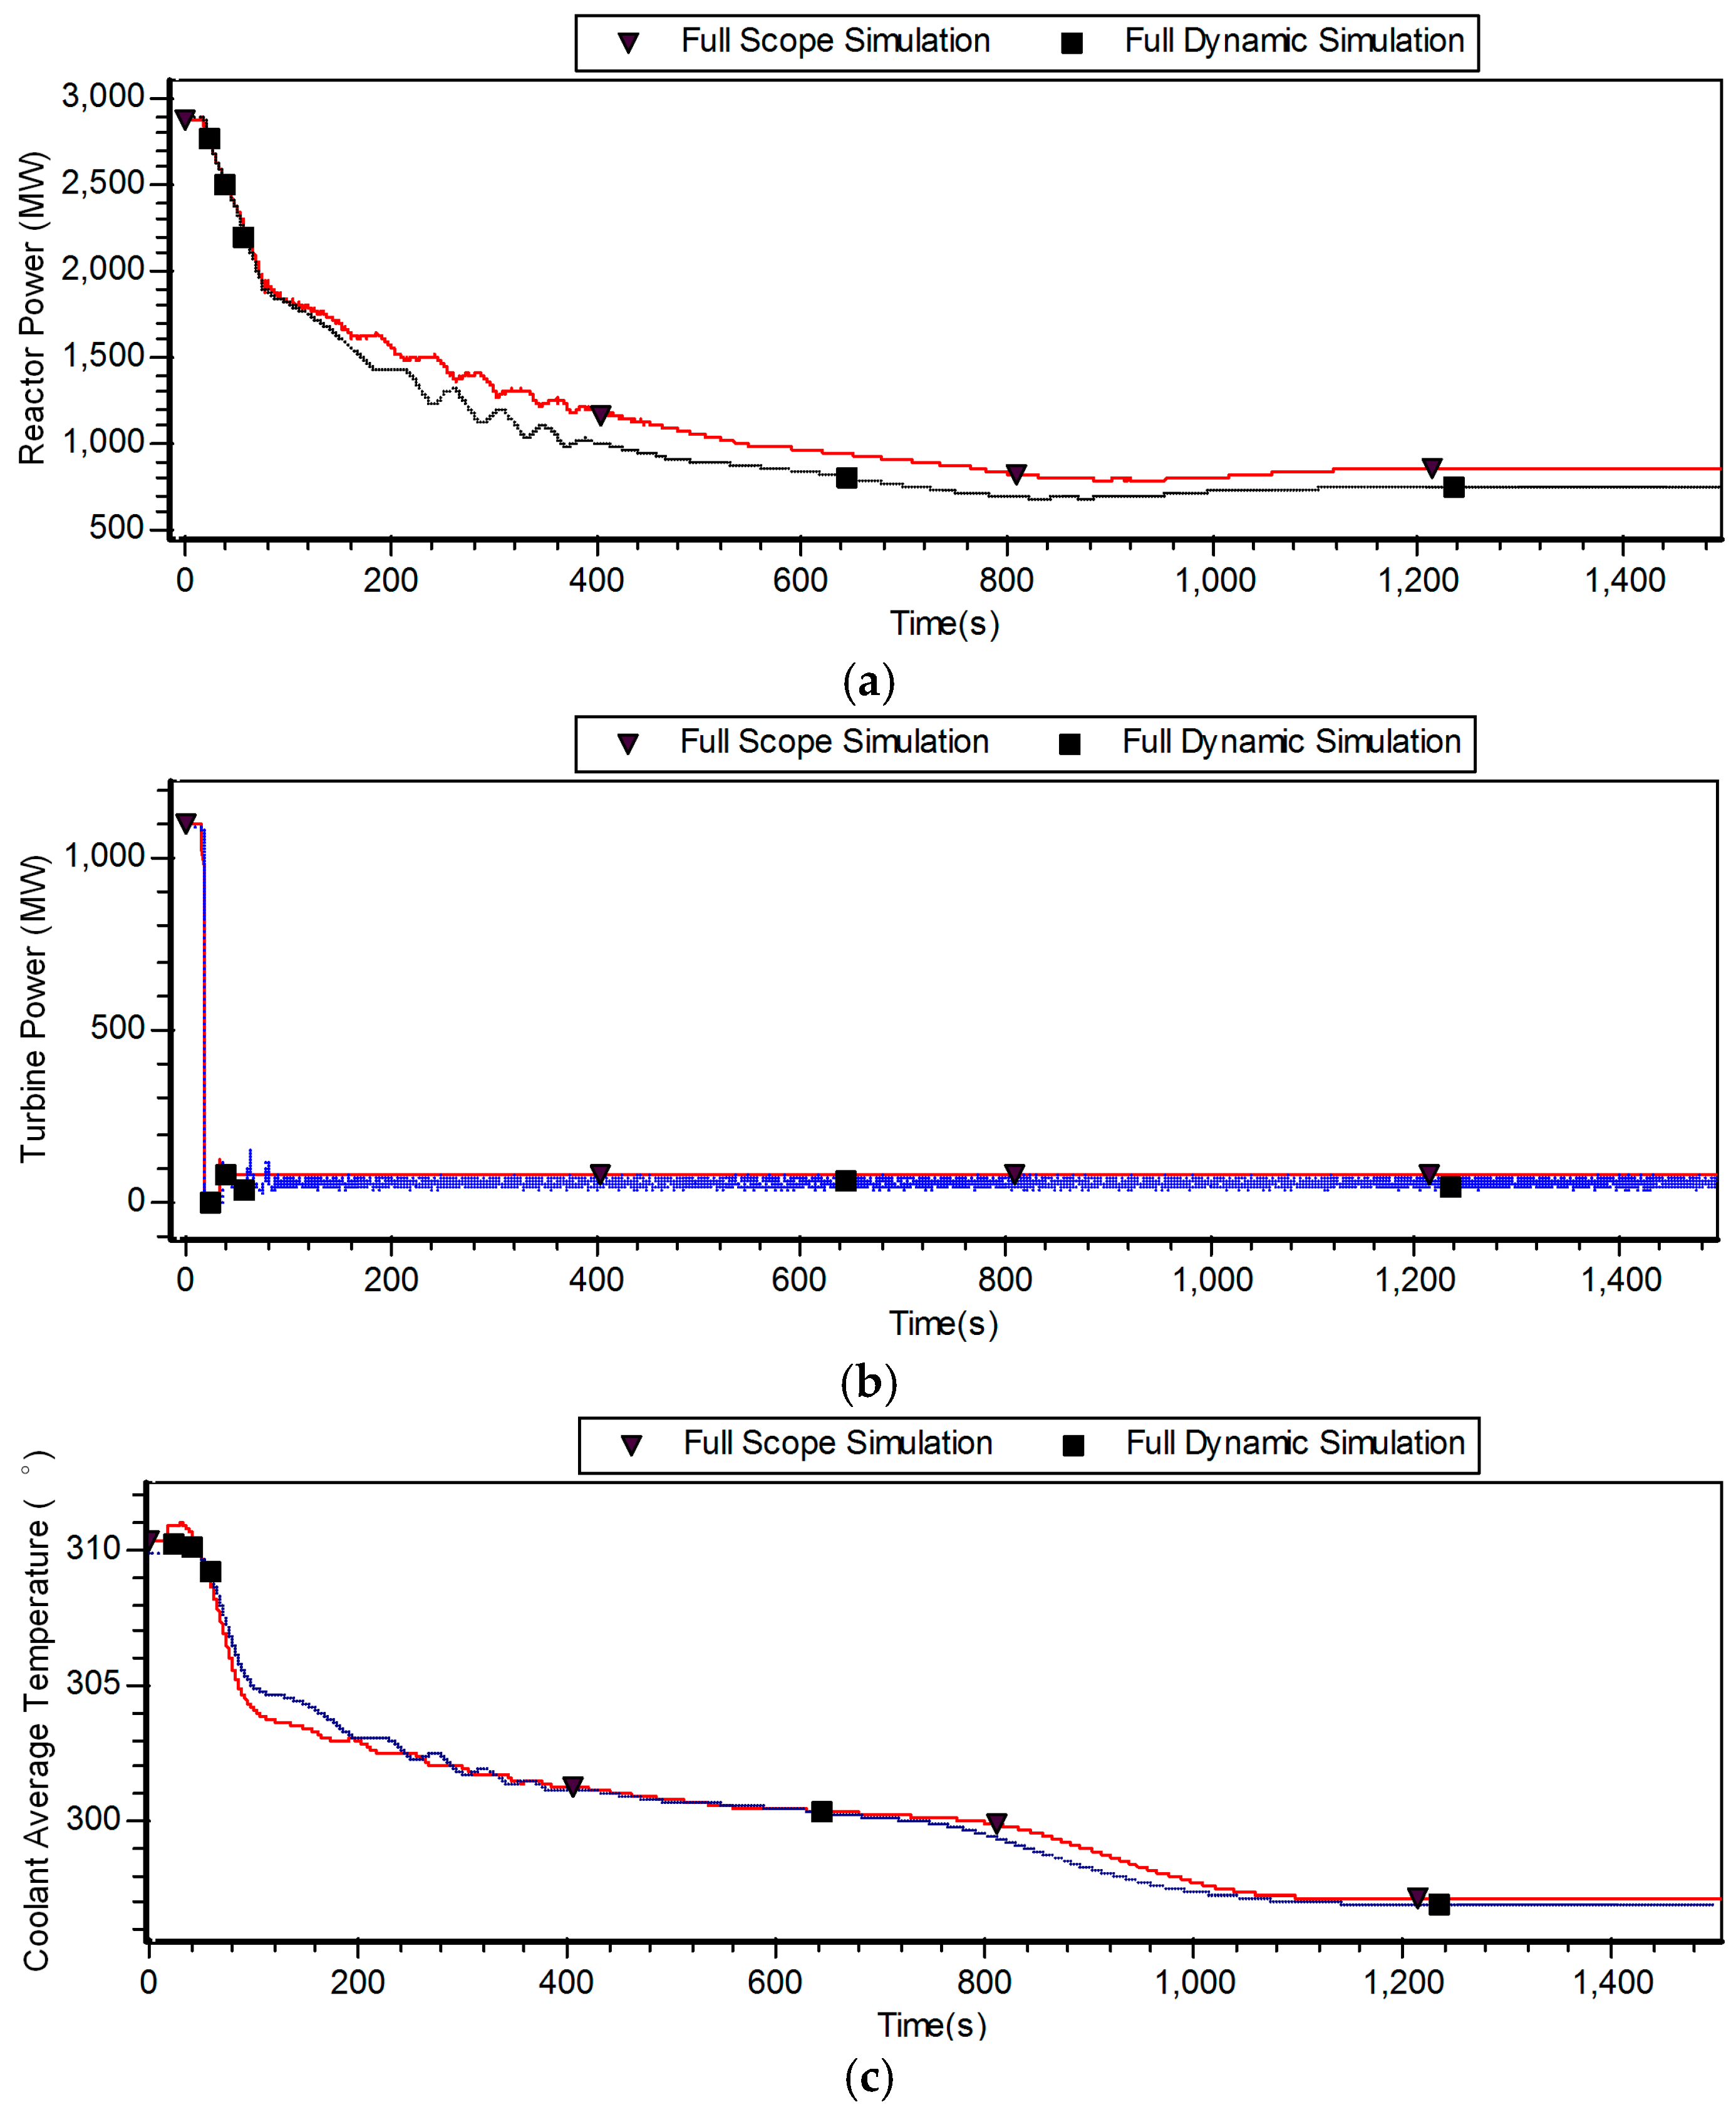
3.3. Net Load Rejection
NPP G1 turns to its house load from rated power when the high voltage circuit breaker trips suddenly at 15.0 s. Due to a sudden drop in the electromagnetic power, severe mismatch between the mechanical energy and electrical load will cause the turbine to speed up at the beginning. The excess input energy is cut off by closure of the CVs and intercept valves (IVs) actuated by the OPC at 16.08 s. This leads to sharp increases in steam pressure, primary coolant temperature and fuel temperature. Such an increase together with the insertion of control rods introduces negative reactivity feedback, which helps to reduce the reactor power.
Figure 9 shows the reactor power perfectly stabilizes at 30% FP in approximately 1000.0 s.
The mechanical power can rapidly decrease after the operation of the OPC, and the turbine bypass system can effectively limit the secondary system steam pressure to void the opening of safety valves. Thus, the NPP is able to withstand the large transients.
4. Interaction and Coordination among Nuclear Power Plants, Power Grids and Their Protection Systems
To investigate the coordination among NPPs, grids and their protection systems, an equivalent two-machine power system is used to analyze the dynamic performance under different types of disturbances. Actually, the mechanisms may also apply to large power systems. Although high voltages do harm transformers and large-capacity motors, compared with over-frequency, under-frequency and under-voltage, there is no substantial difference between the influence caused by over-voltage of NPPs and that of thermal power plants. Therefore, this paper will not discuss this situation in detail.
4.1. Under-Frequency
This subsection mainly analyzes the interaction between NPPs and grids under the condition of under-frequency, and proposes the corresponding coordinated control principles and schemes.
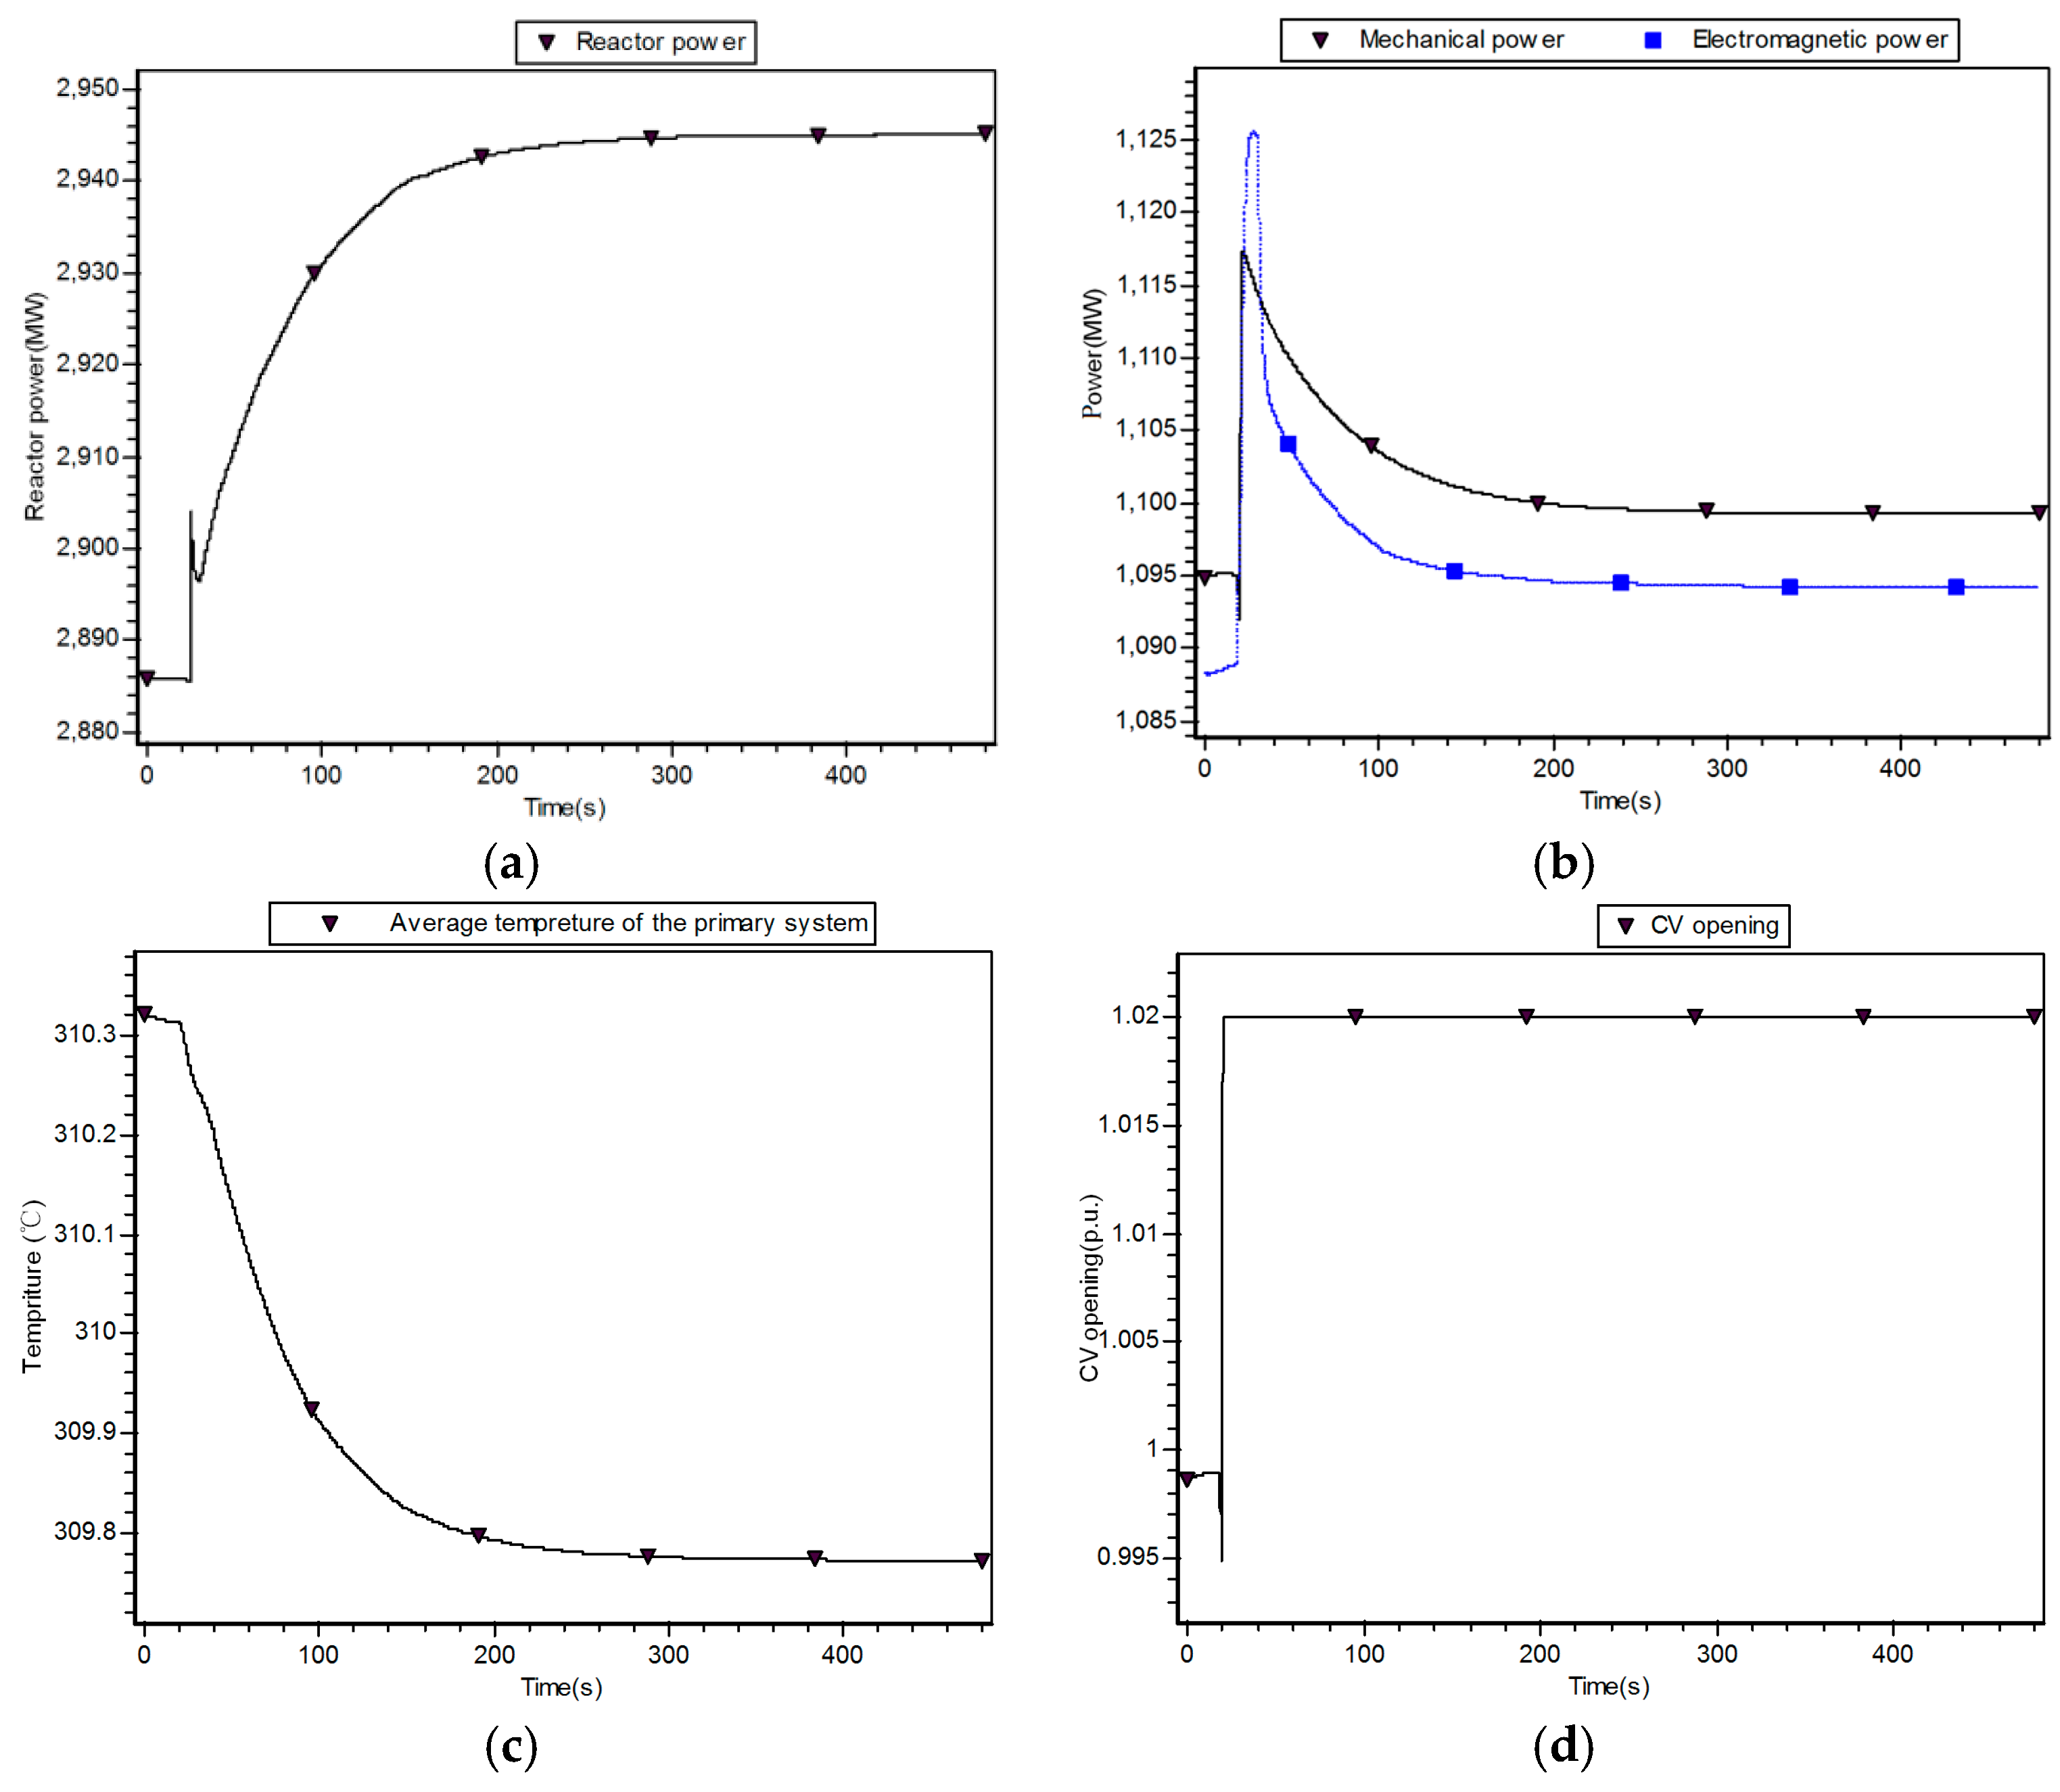
4.1.1. Dynamic Interaction with Decreasing Frequency
A decrease in frequency of the grid G2 leads to an increase in the electromagnetic power of NPP G1 and introduces a negative input to the proportional-integral-differential (PID) governing system, which turns down the CVs to reduce the mechanical power. Meanwhile, the coolant pump speed will slow down, causing the reactor coolant flow to decrease. Thus, energy exchange between the primary system and secondary system decreases and the core temperature increases, which may lead to negative reactivity feedback to decrease the reactor power.
When the governor extends beyond the dead zone, the PID input changes from negative to positive. Then, the mechanical power and nuclear power reverse to increase, and the frequency gradually recovers. During this process, there is no action taken by the reactor power control rods because they are limited by their upper bounder. Thereafter, the electromagnetic power and mechanical power decrease slowly, while the nuclear power is stabilized eventually at a point slightly higher than the rated power.
Figure 10 shows the simulation results of a drop in grid frequency at a rate of 1 Hz/min.
In some cases, the grid may sustain an off-nominal frequency for a long period, and the turbine blades may become damaged because of resonance. Such operations have cumulative effects and are permitted only for a specific period during the life of a unit. Therefore, if the frequency decreases below the set value, the under-frequency relay will separate the unit from the grid or possibly trip the reactor when the cumulative time reaches the predetermined value.
A sharp decrease in frequency distinctly affects the auxiliary equipment of an NPP. For example, if the main pump output flow decreases quickly, which should be maintained within trip limits to avoid the action of the primary system under-flow relay and main pump under-speed relay, the cooling capacity of the fuel assembly will rapidly decrease, possibly causing an emergency shutdown because of the burning down of the fuel elements. Low-frequency conditions may also initiate Volts-per-Hertz protections.
4.1.2. Coordination across Under-Frequency Relays, Under-Frequency Load Shed Relays and Main Pump Relays
When system frequency decreases, generator units should keep running in the grid to help it recover as long as possible to maintain their own safety. For the historical reason of plant-grid separation in China, generator protections are always set according to individual situations without coordinating between units and grids. Therefore, in terms of under-frequency relay settings, manufacturers and power plant utilities tend to be conservative to ensure the safety of units.
Restarting a nuclear power unit after a reactor trip or turbine trip normally has a considerably higher price than running at low frequency for a short time. Thus, the frequency settings of the under-frequency relays of NPPs are typically lower than those of other generators in China. When the system frequency decreases sufficiently, the under-frequency relay of some thermal power units may trip first, resulting in a faster decrease in system frequency, which could trigger the under-speed relay of the main pump and cause the tripping of the nuclear unit.
In cases of prolonged under-frequency conditions, the under-frequency relay may deteriorate the active power shortage and possibly trigger UFLS relays, thus causing an unmanageable cascading reaction. Therefore, an effective graded load shedding scheme should be determined based on the system frequency to prevent the NPP from tripping or becoming isolated.
Thus, UFLS can be considered the primary protection for turbo-generators to ensure the safe operation of power plants. The duration of under-frequency, as we recommend, can be approximately 5% less than the corresponding uptimes shown in
Table 1. In addition, under-frequency protection should be used as the last resort to prevent damage to the turbine. Its action time should be as long as possible on the premise of unit safety. Normally, it should be set at a value not less than 10 s with the operating value lower than 47.5 Hz and not less than 5 s with the operating value lower than 47.0 Hz. Last but not least, the under-frequency protection for thermal power plants cannot be set more conservatively than that of NPPs.
4.2. Over-Frequency
In this subsection, we discuss the interaction and coordination among NPPs, grids and their protection systems in the case of over-frequency.
4.2.1. Dynamic Interaction with Increasing Frequency
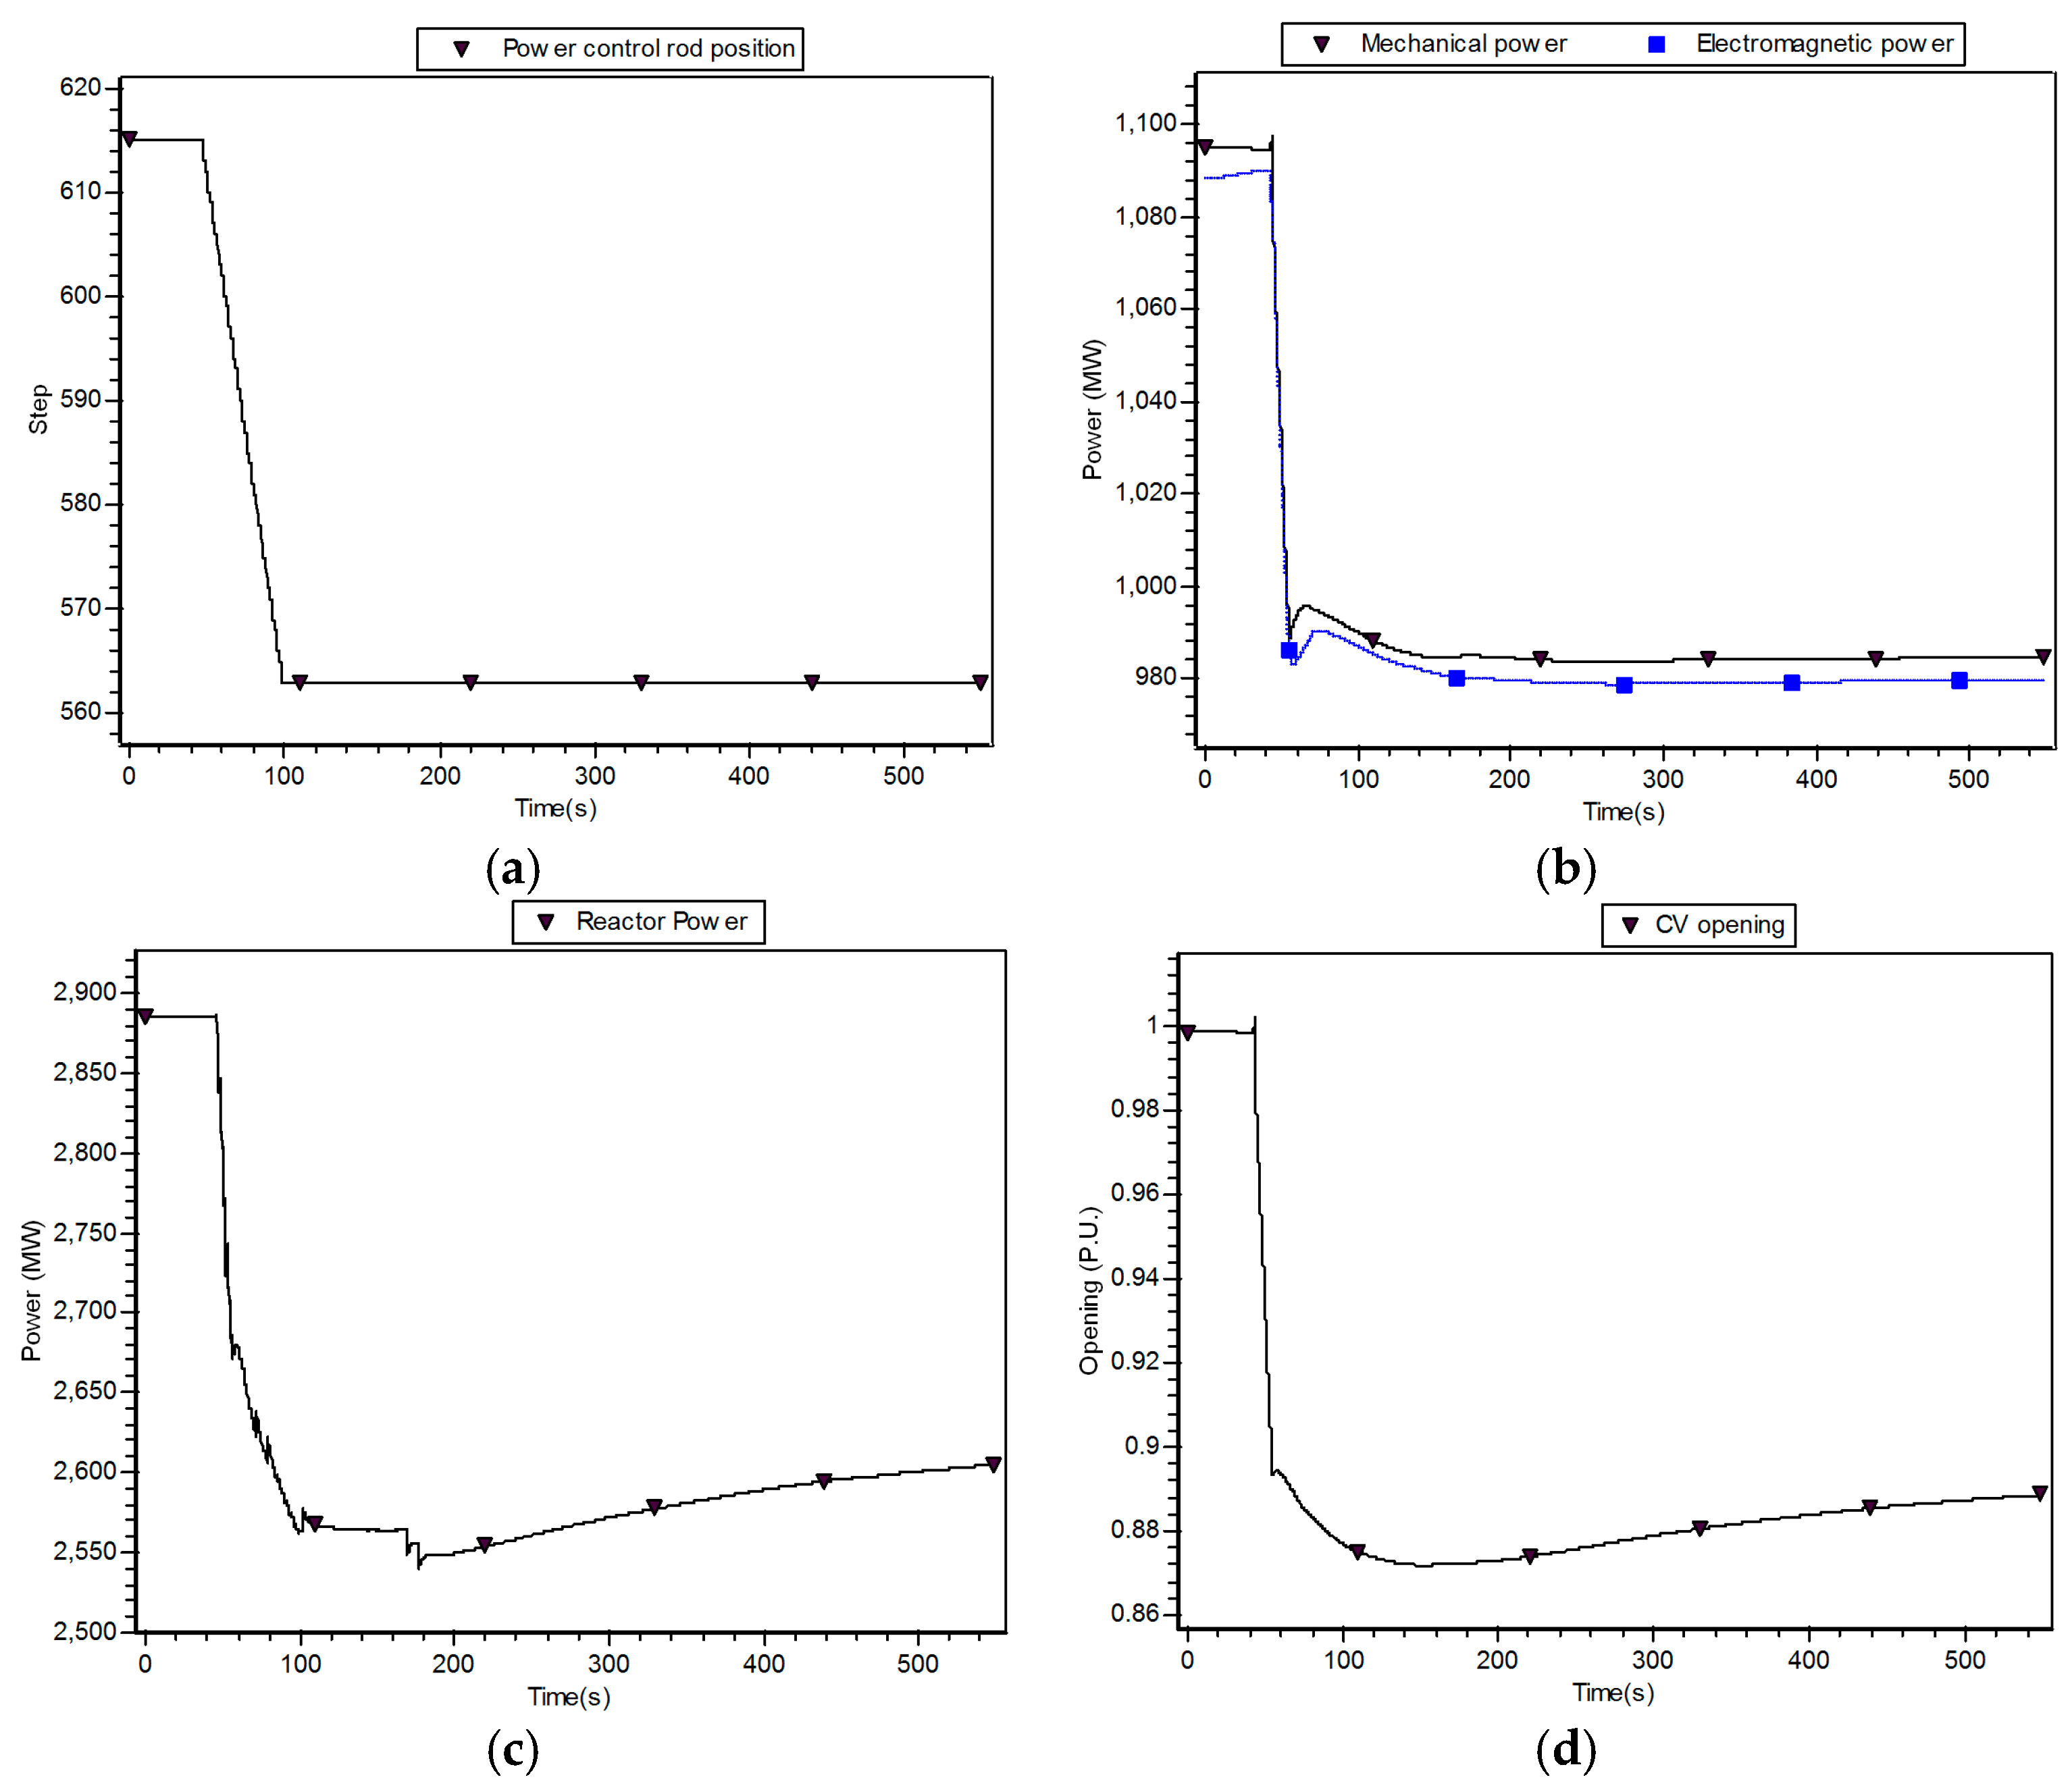
Conversely, an increase in grid frequency leads to a decrease in the electromagnetic power and an increase in mechanical power of NPP G1 (
Figure 6) at first. Meanwhile, such a frequency increase will also affect the primary coolant flow by accelerating the pump. After the governor overcomes the dead band, the mechanical power begins to decrease, and the control rods begin to insert into the core to reduce the reactor power.
The governor response, reactor control system, and reactivity feedback will work together to reduce the generation. The frequency will then gradually return to an acceptable level and eventually reach a new equilibrium point. The dynamic response of NPP G1 during the process of rise in grid frequency is shown in
Figure 11.
When a significant oversupply of active power exists in the grid, the grid cannot ensure that frequency remains within the normal operating range through the speed governor and reactor control system alone. Without appropriate measures, such as generation reduction, the grid will enter an over-frequency condition. To avoid severe accidents, NPPs should be locked from the power system by over-frequency relays and turned to house loads.
If the frequency rises to 1.03 times the rated value, an OPC must address this situation and reduce generation to prevent the turbine from over-speeding. However, during the transient process, the reactor power level remains unchanged, thus indicating a mismatch between the steam flow generated by the SG and the steam flow passing through the CVs and IVs. The excess steam is emptied into the steam dump condenser to avoid opening the safety valves of the SG. With its CVs and IVs closed, the nuclear power unit reduces its turbine speed gradually, and the opening of the bypass valve decreases until the turbine speed returns to normal.
4.2.2. Coordination across over-Frequency Relays, Over-Speed Protect Controllers and Over-Frequency Generator Trip Relays
Because of their relatively large capacities, NPPs more easily over-speed than conventional plants, particularly in islanded systems. Increases in the system frequency jeopardize the safe operation of an NPP and its auxiliary equipment. However, an OPC alone does not help reduce excess power because the power in the turbine remains essentially unchanged after the action of the OPC. Worse, the OPC may act repeatedly, causing fluctuations in the system frequency, which is harmful to system stability. Thus, we recommend blocking the OPC of an NPP when it is running in the power system and have it work properly only when it is stepped out of the grid.
To control the frequency of the power grid, initiatives such as generation reduction along with OFGT of thermal units or hydro units must be implemented. To ensure that OFGT acts before OPC, the first round of OFGT should be set at less than 51.5 Hz, for instance, a value of 51.4 Hz would be appropriate. The amount of power reduction should be carefully calculated to maintain the system frequency under 50.5 Hz. According to our study, a three-round OFGT scheme can be suitable for different situations of excessive active power to avoid significant changes in power flow.
In case of over-frequency, the over-frequency relay of conventional generators should be triggered before that of NPPs, and the disconnection of NPPs from the grid should be the last resort under severe conditions. Therefore, particular attention should be paid to the coordination between them. The safety of the NPP itself must be ensured if the system frequency is out of control. Moreover, plant trips caused by over-frequency lead to under-frequency, which will eventually result in cascading load shedding; this situation should be avoided.
In addition to the safety of NPPs, OPC schemes of thermal plants should also consider their influence on power grids. Although most units in China are equipped with OPCs, the control schemes of different units are actually uniform at present. In case of system-wide high frequency, the output of large-capacity units drops sharply at the same time, which may result in cascading accidents of under-frequency. Thus, the control schemes of OPC should be different for each unit. To achieve greater flexibility, we tend to maintain the OPC setting at 103%, although it can be set slightly greater than 103%, and to increase the action time of OPC to 1–3 s according to the vertiginous rate and stagnant rate of the speed governor system.
4.3. Under-Voltage
The dynamic interaction between NPPs and grids under the situation of under-voltage is studied in this subsection, and then the corresponding coordinated control principles and schemes between protection systems of NPPs and grids are also proposed.
4.3.1. Dynamic Interaction with Decreasing Voltage
A depression in grid voltage has an effect on the performance of NPPs mainly through the transients of generators, transformers and motors. For instance, low voltage may slow down the main pump speed to reduce coolant flow and will therefore set up transients in the primary system. In addition, a long time low voltage situation may also trigger relative limiters and protections, leading to serious consequences, such as load shedding and generator tripping.
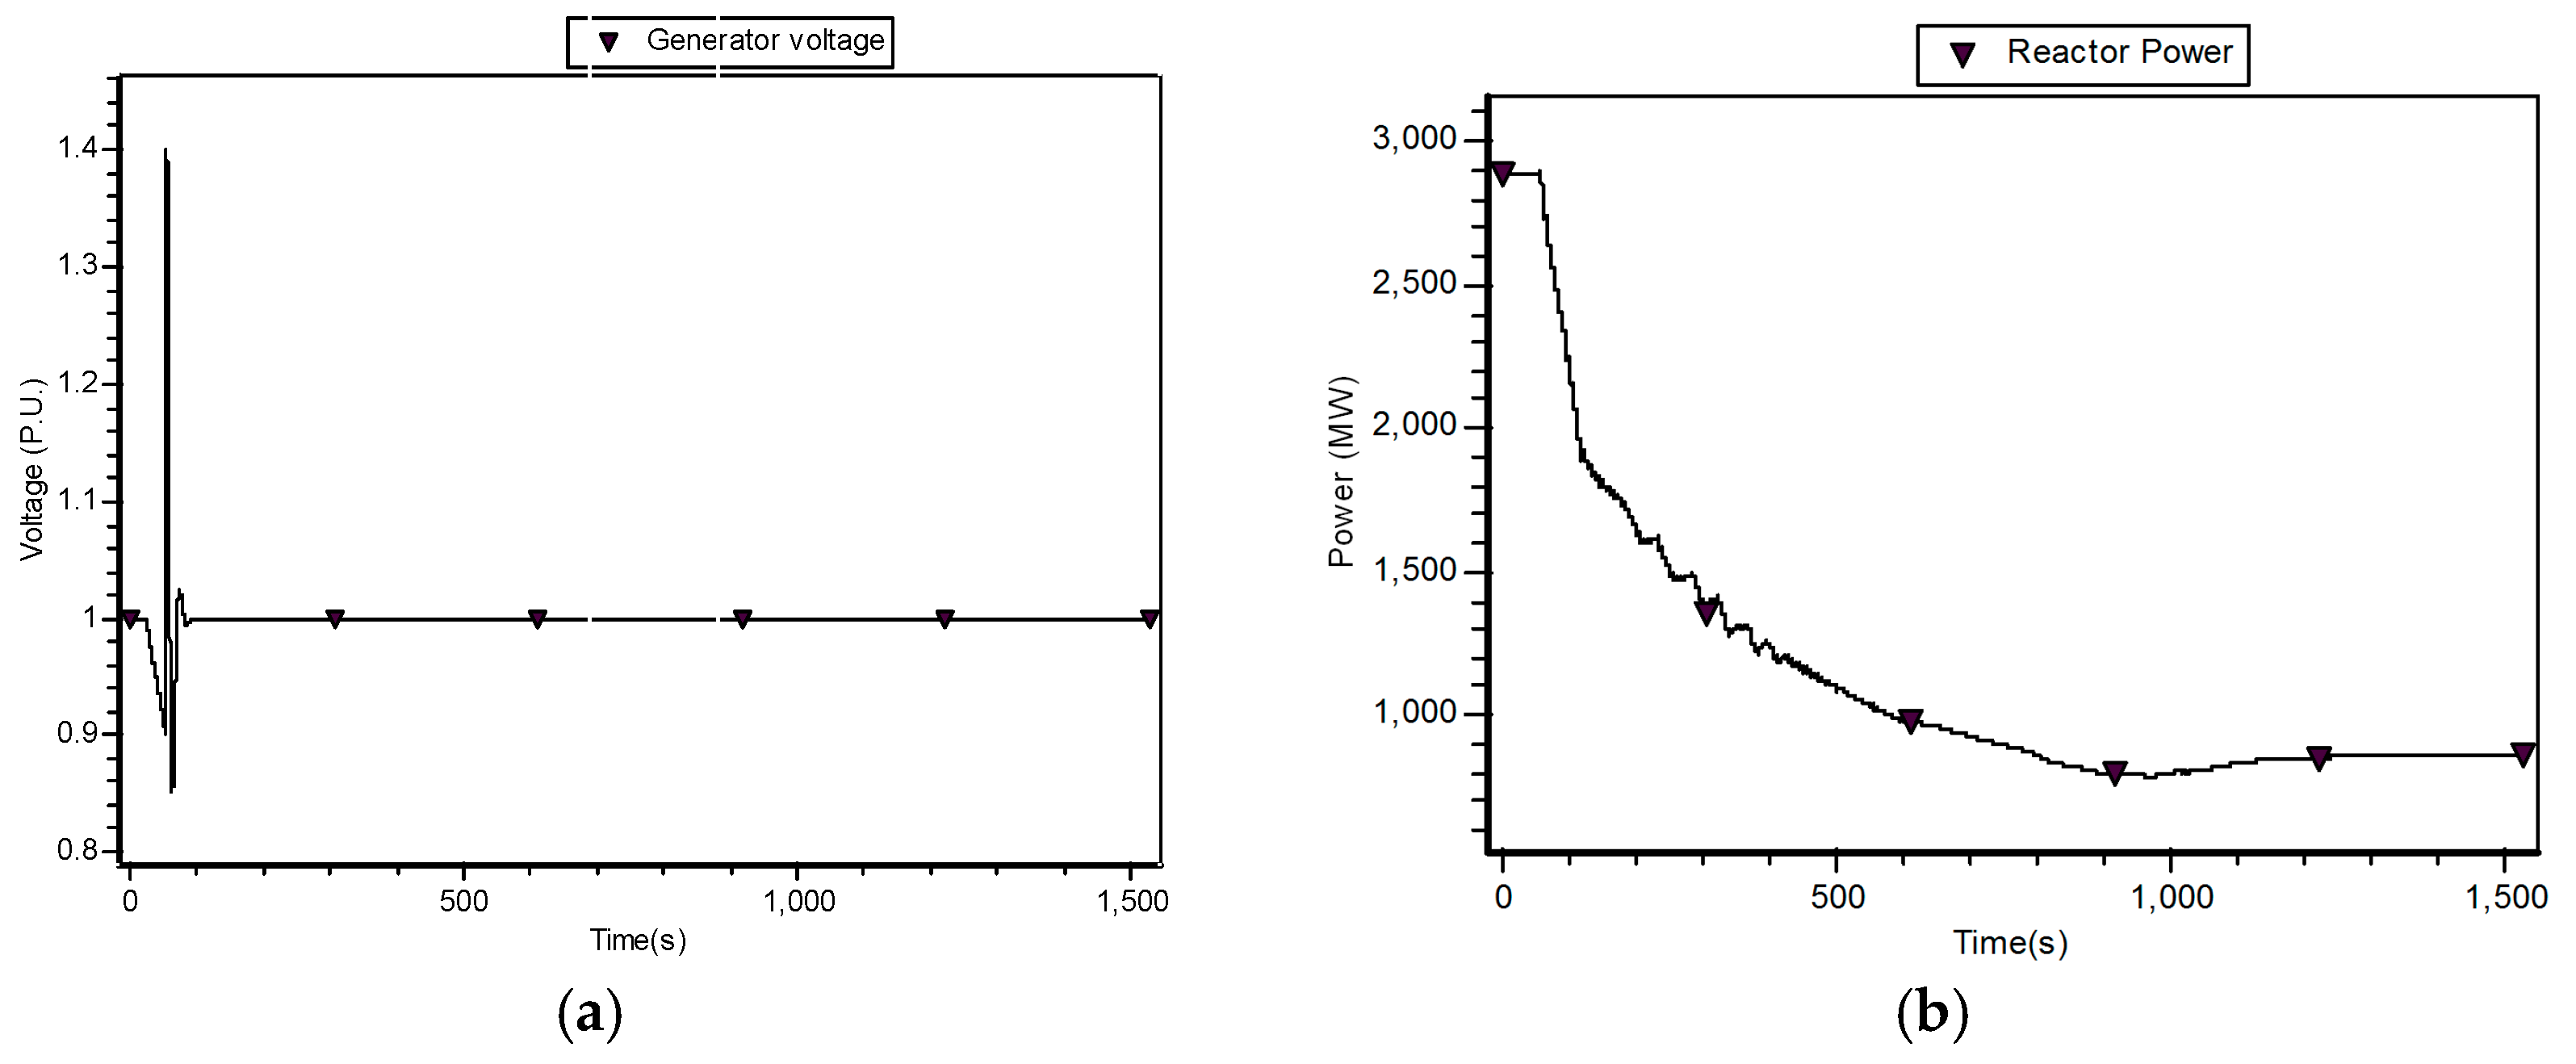
As an example,
Figure 12 shows the dynamic response of NPP G1 (
Figure 6) during the voltage dip process of BUS2 from 550.0 kV. When the voltage reaches 450.0 kV, the under-voltage relay of G1 trips the high voltage side of transformer T1, and NPP G1 turns to the house load. Although there is a sudden drop in the electromagnetic power, the mechanical power cannot be changed quickly. Thus, the turbine begins to accelerate. When the turbine speed reaches 1.03 times the rated value, the OPC acts to close the CVs, and the turbine power decreases rapidly. At the same time, the steam bypass system works as the outlet of reactor power. Therefore, reactor power can be reduced smoothly. Finally, it stabilizes at approximately 30% of the rated power.
In case of a voltage dip for a prolonged period, the automatic voltage regulator (AVR) equipment of the excitation system will increase the excitation current. To avoid overheating, generators are typically equipped with an over-excitation limiter (OXL) and protection.
If the set point of the field current is relatively low, e.g., slightly higher than the rated value, the OXL will decrease the field current to a preset value soon after the occurrence of an electric fault. Only when the generator field windings dissipate all of the accumulated heat, could the field current start to increase again. However, the set points of the OXL and over-excitation protection (OXP) of many NPPs in China are significantly lower than the national standard. For example, the per-unit field current setting of an OXL is often set to 1.05 with a delay time of 30 s, whereas the settings for an OXP are 1.1 and 2 s. The OXL will be triggered repeatedly if the set point is extremely low and may deny the stable operation of NPPs and grids, thus inducing mechanical fatigue in the control system and reducing the effective life of the unit.
The main pump will develop a low electromagnetic torque if the voltage decreases. Thus, the output flow of the main pump will also decrease, possibly causing a reactor trip on under-flow or under-speed. The higher the value to which the OXL is set, the longer the OXL will be required to act after a fault and to dissipate the accumulated heat of field winding. During this period, the excitation current will be limited to the predetermined value and will not respond to the decrease in voltage. Despite the system frequency remaining unchanged, a sustained decrease in voltage at this time may trigger the under-speed relay of the main pump and eventually cause significantly adverse consequences, such as generator trips or even reactor trips.
4.3.2. Coordination across Over-Excitation Limiters, Main Pump Relays and Under-Voltage Load Shed Relays
In case of low voltage, the excitation current should remain at a relative high value for an extended duration without degrading the safety of the NPPs. Suitable values for the OXL and protection are crucial for maintaining stable system voltage. Therefore, these values should be set carefully according to national standards.
The set point and delay time of the OXL and protection should be determined to ensure that the limiter acts before the protection to prevent rotor overheating. According to the “Specification for Excitation System for Large Turbine Generators” (China industry standard No. DL/T843), an OXL should be set at 2 times the rated current with a delay of 10 s. Settings that are too conservative will result in unnecessary action or an accidental tripping of the excitation system, while excessively high settings will harm the rotor winding.
In addition, if the voltage of the NPP cannot recover to its normal value after the operation of an OXL, the UVLS must be implemented to cut a certain amount of load several times to restore the voltage. Otherwise, a low voltage of 0.7 will definitely trigger the under-speed relay of the main coolant pump and trip the reactor. Thus, the characteristics of these relays should be taken into account in the setting of UVLS relays.
5. Case Studies
This research is performed on a real 500 kV bulk power grid in southeast China. Based on the above-mentioned new model, relatively accurate dynamic performances of the NPPs and power systems used in the case study can be calculated under the conditions of over-frequency, under-frequency and under-voltage, with special stress applied to the effects of protection systems on both NPPs and power grids. To ensure the safe operation of both NPPs and power grids and to improve their performances during adverse conditions, different control and protection schemes are discussed in this paper. The results show that the lack of coordination between the control and protection systems of NPPs and grids could lead to serious consequences in case of severe frequency and voltage excursions. Thus, additional attention should be paid to the cooperation between them.
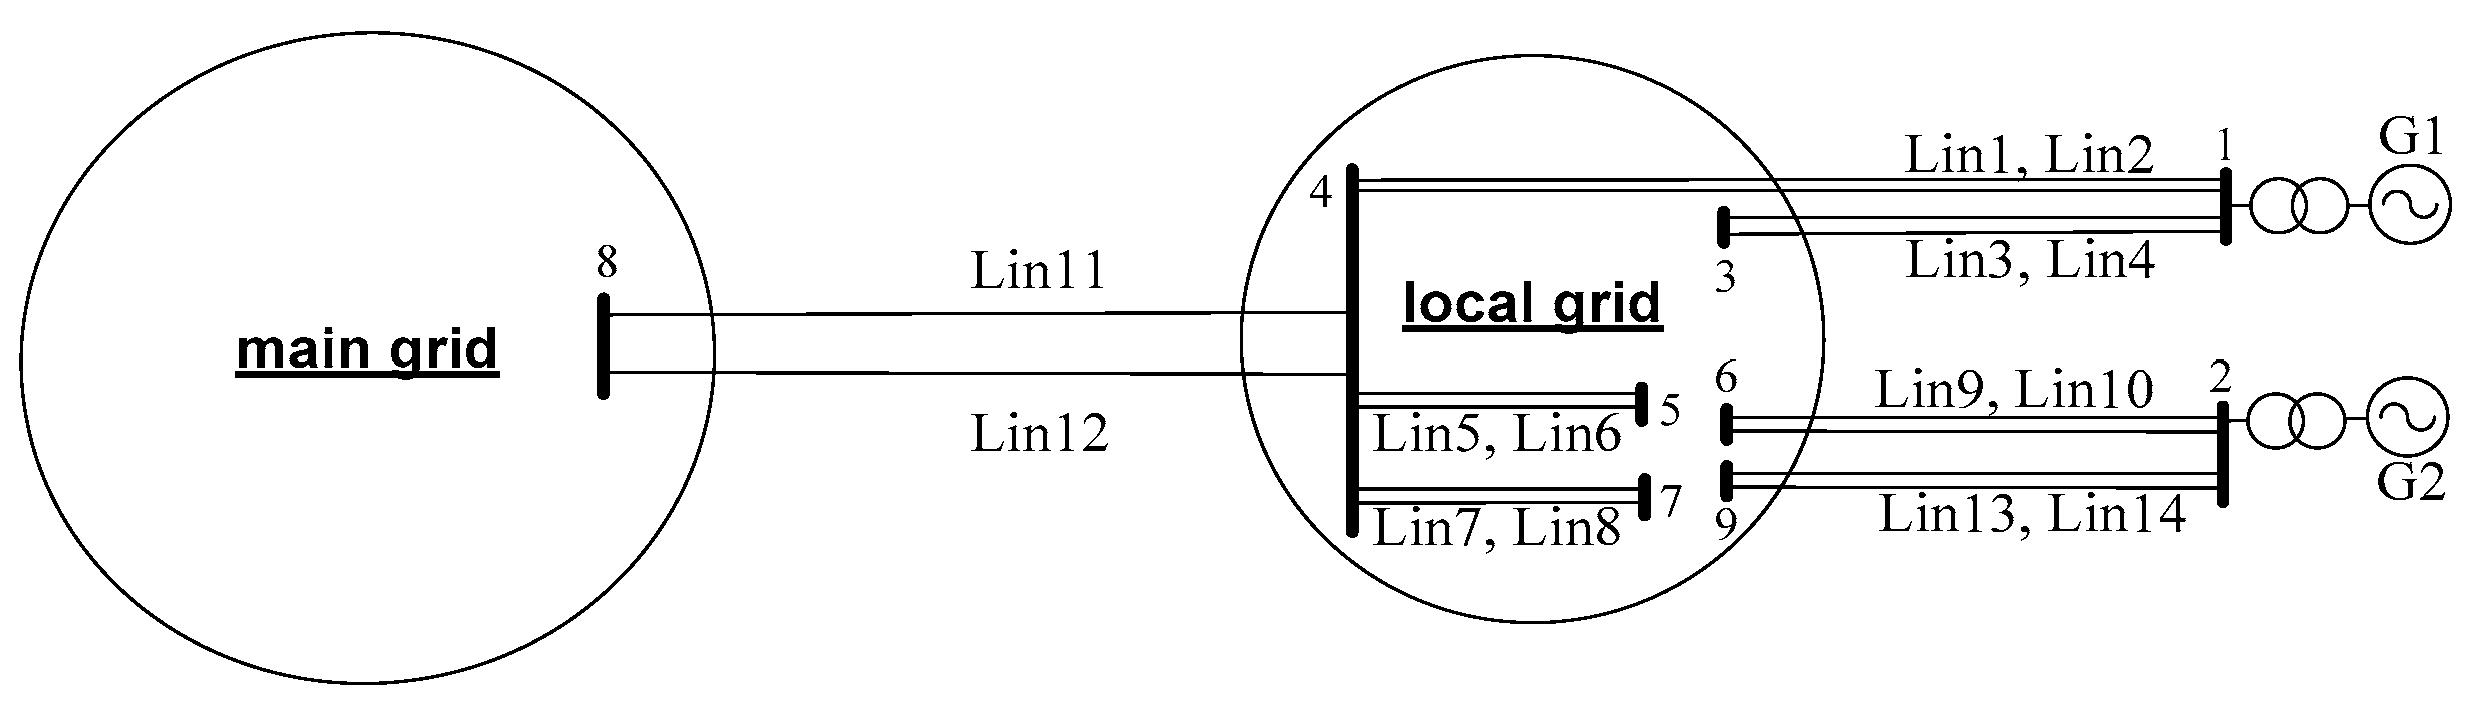
The local power grid is incorporated into a 500 kV main grid by 500 kV transmission lines Lin11 and Lin12 between substations 4 and 8 (
Figure 13). Generators G1 and G2 are NPPs with an installed capacity of 1089 MW and are connected to the local grid through 500 kV double-circuit lines. In addition to the 500 kV tie lines for NPPs, the main substations around the NPPs all have more than four 500 kV outlets and are closely interrelated with the local grid.
5.1. Under-Frequency Case
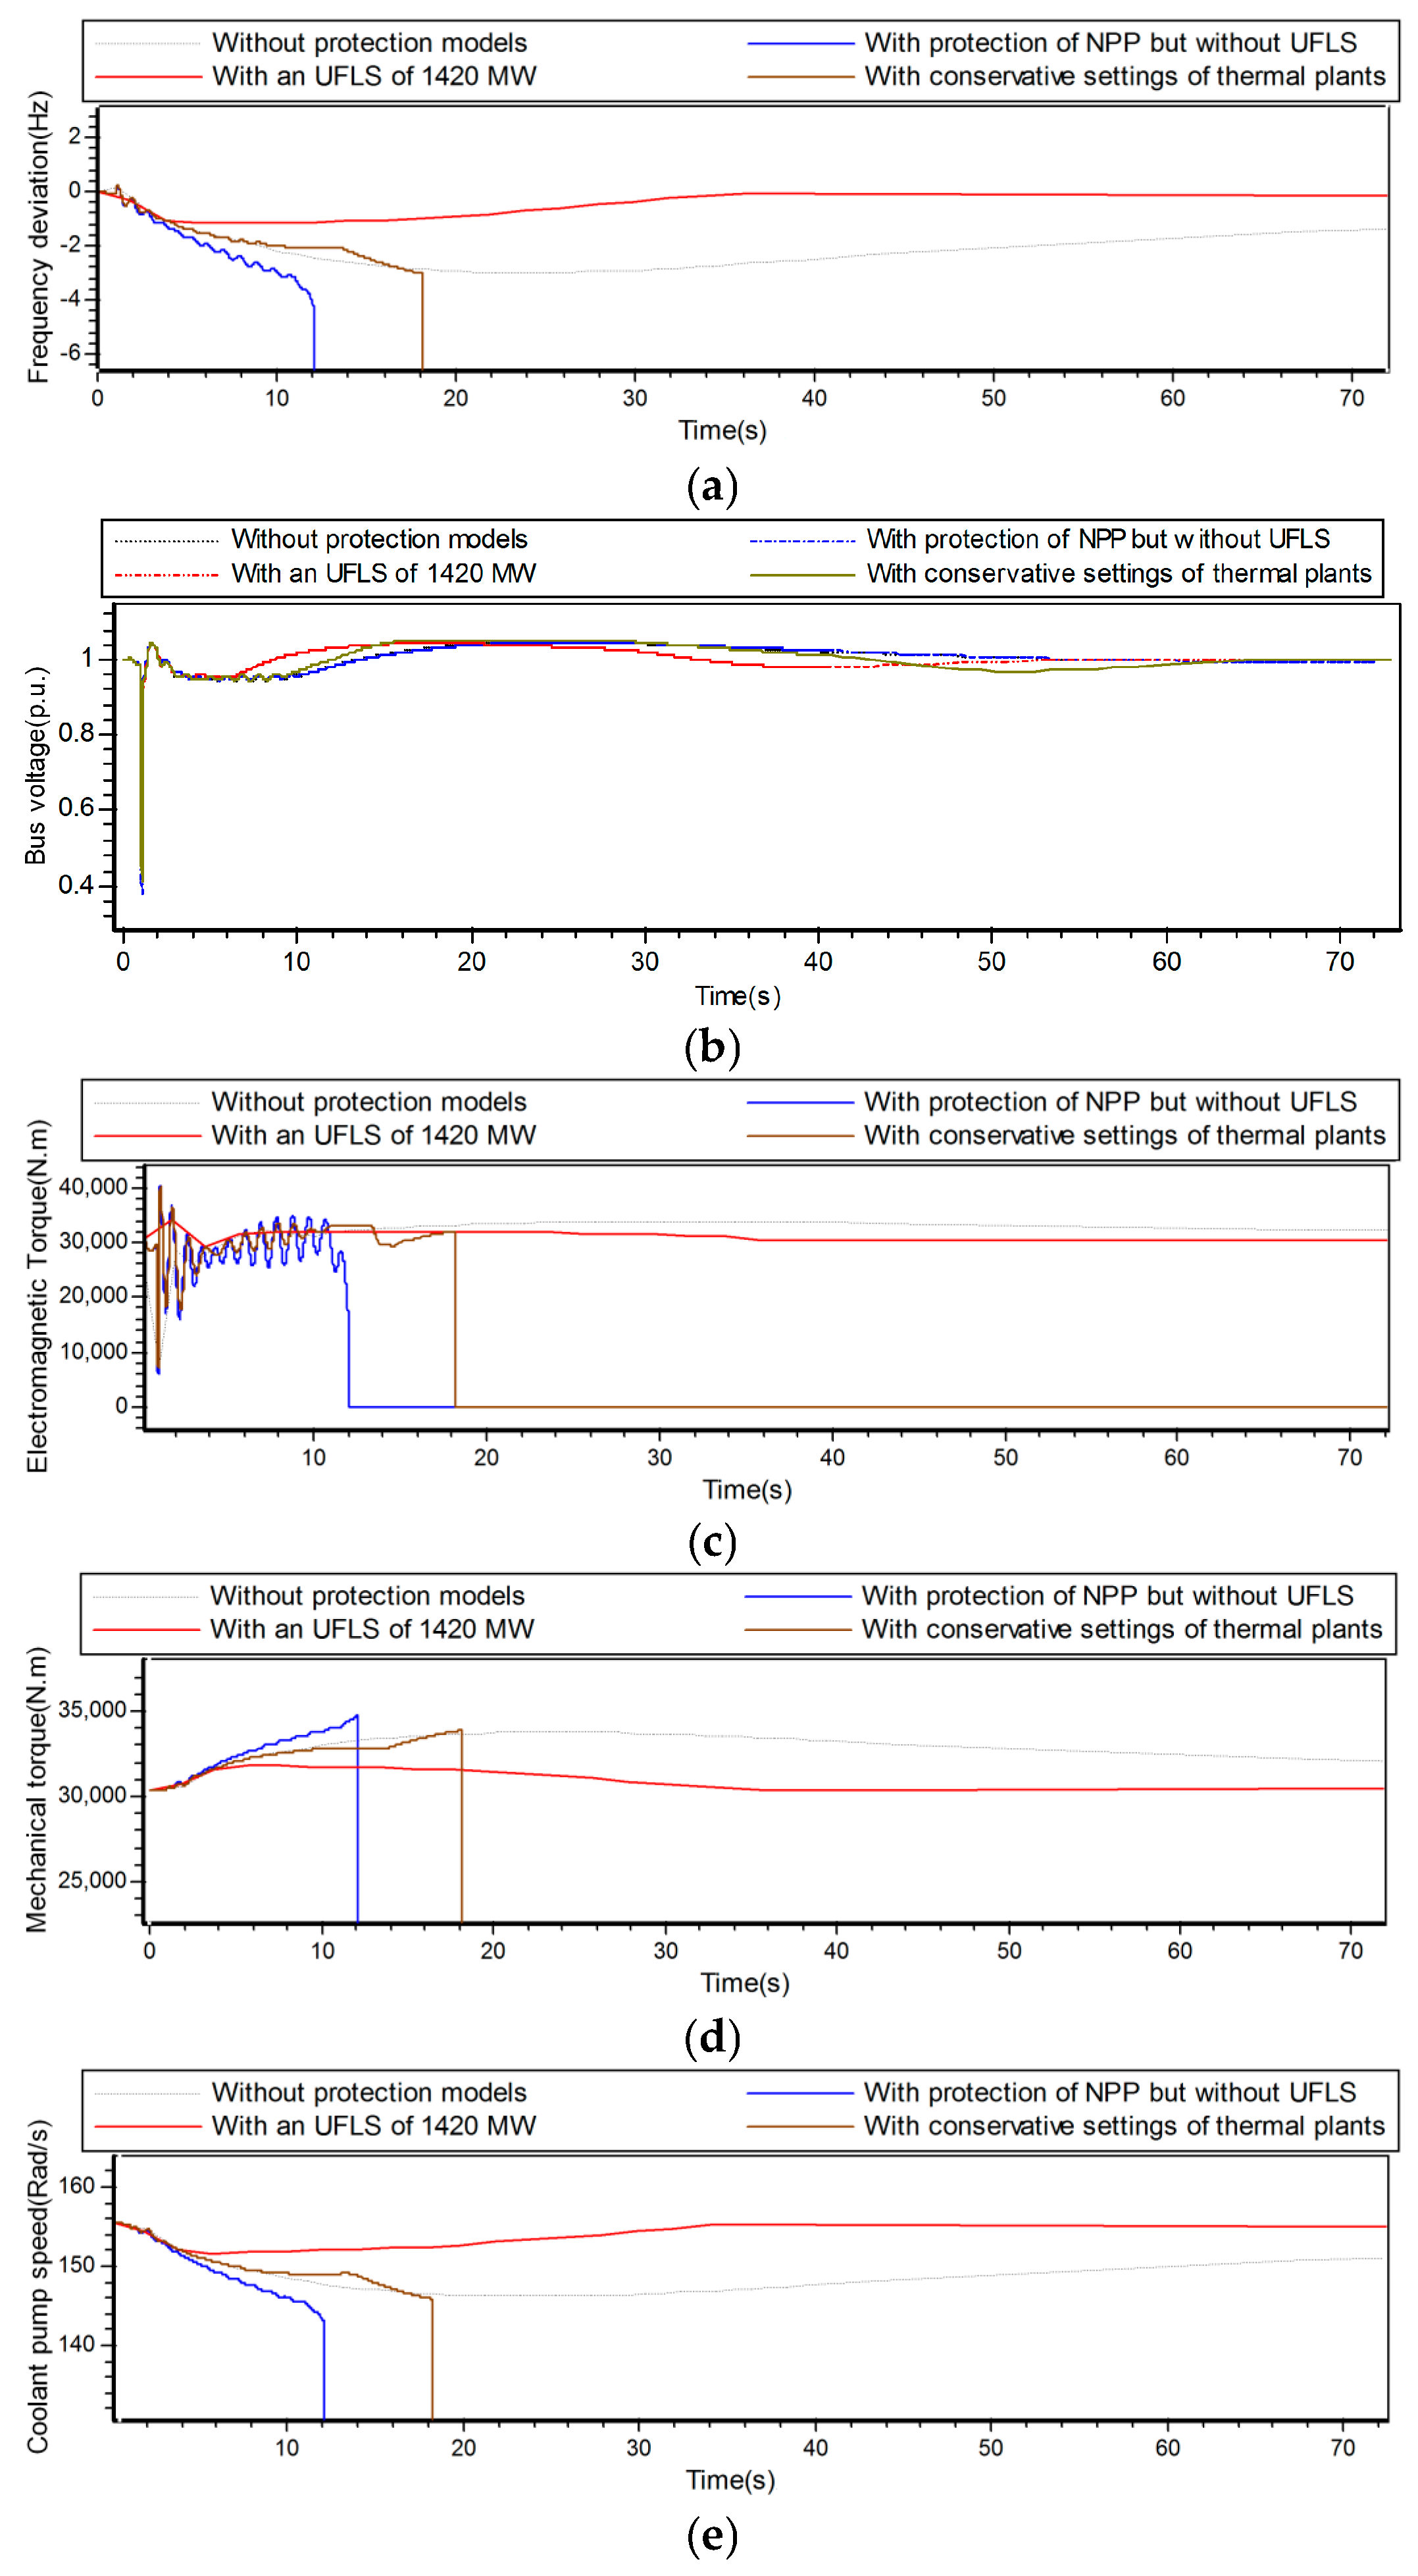
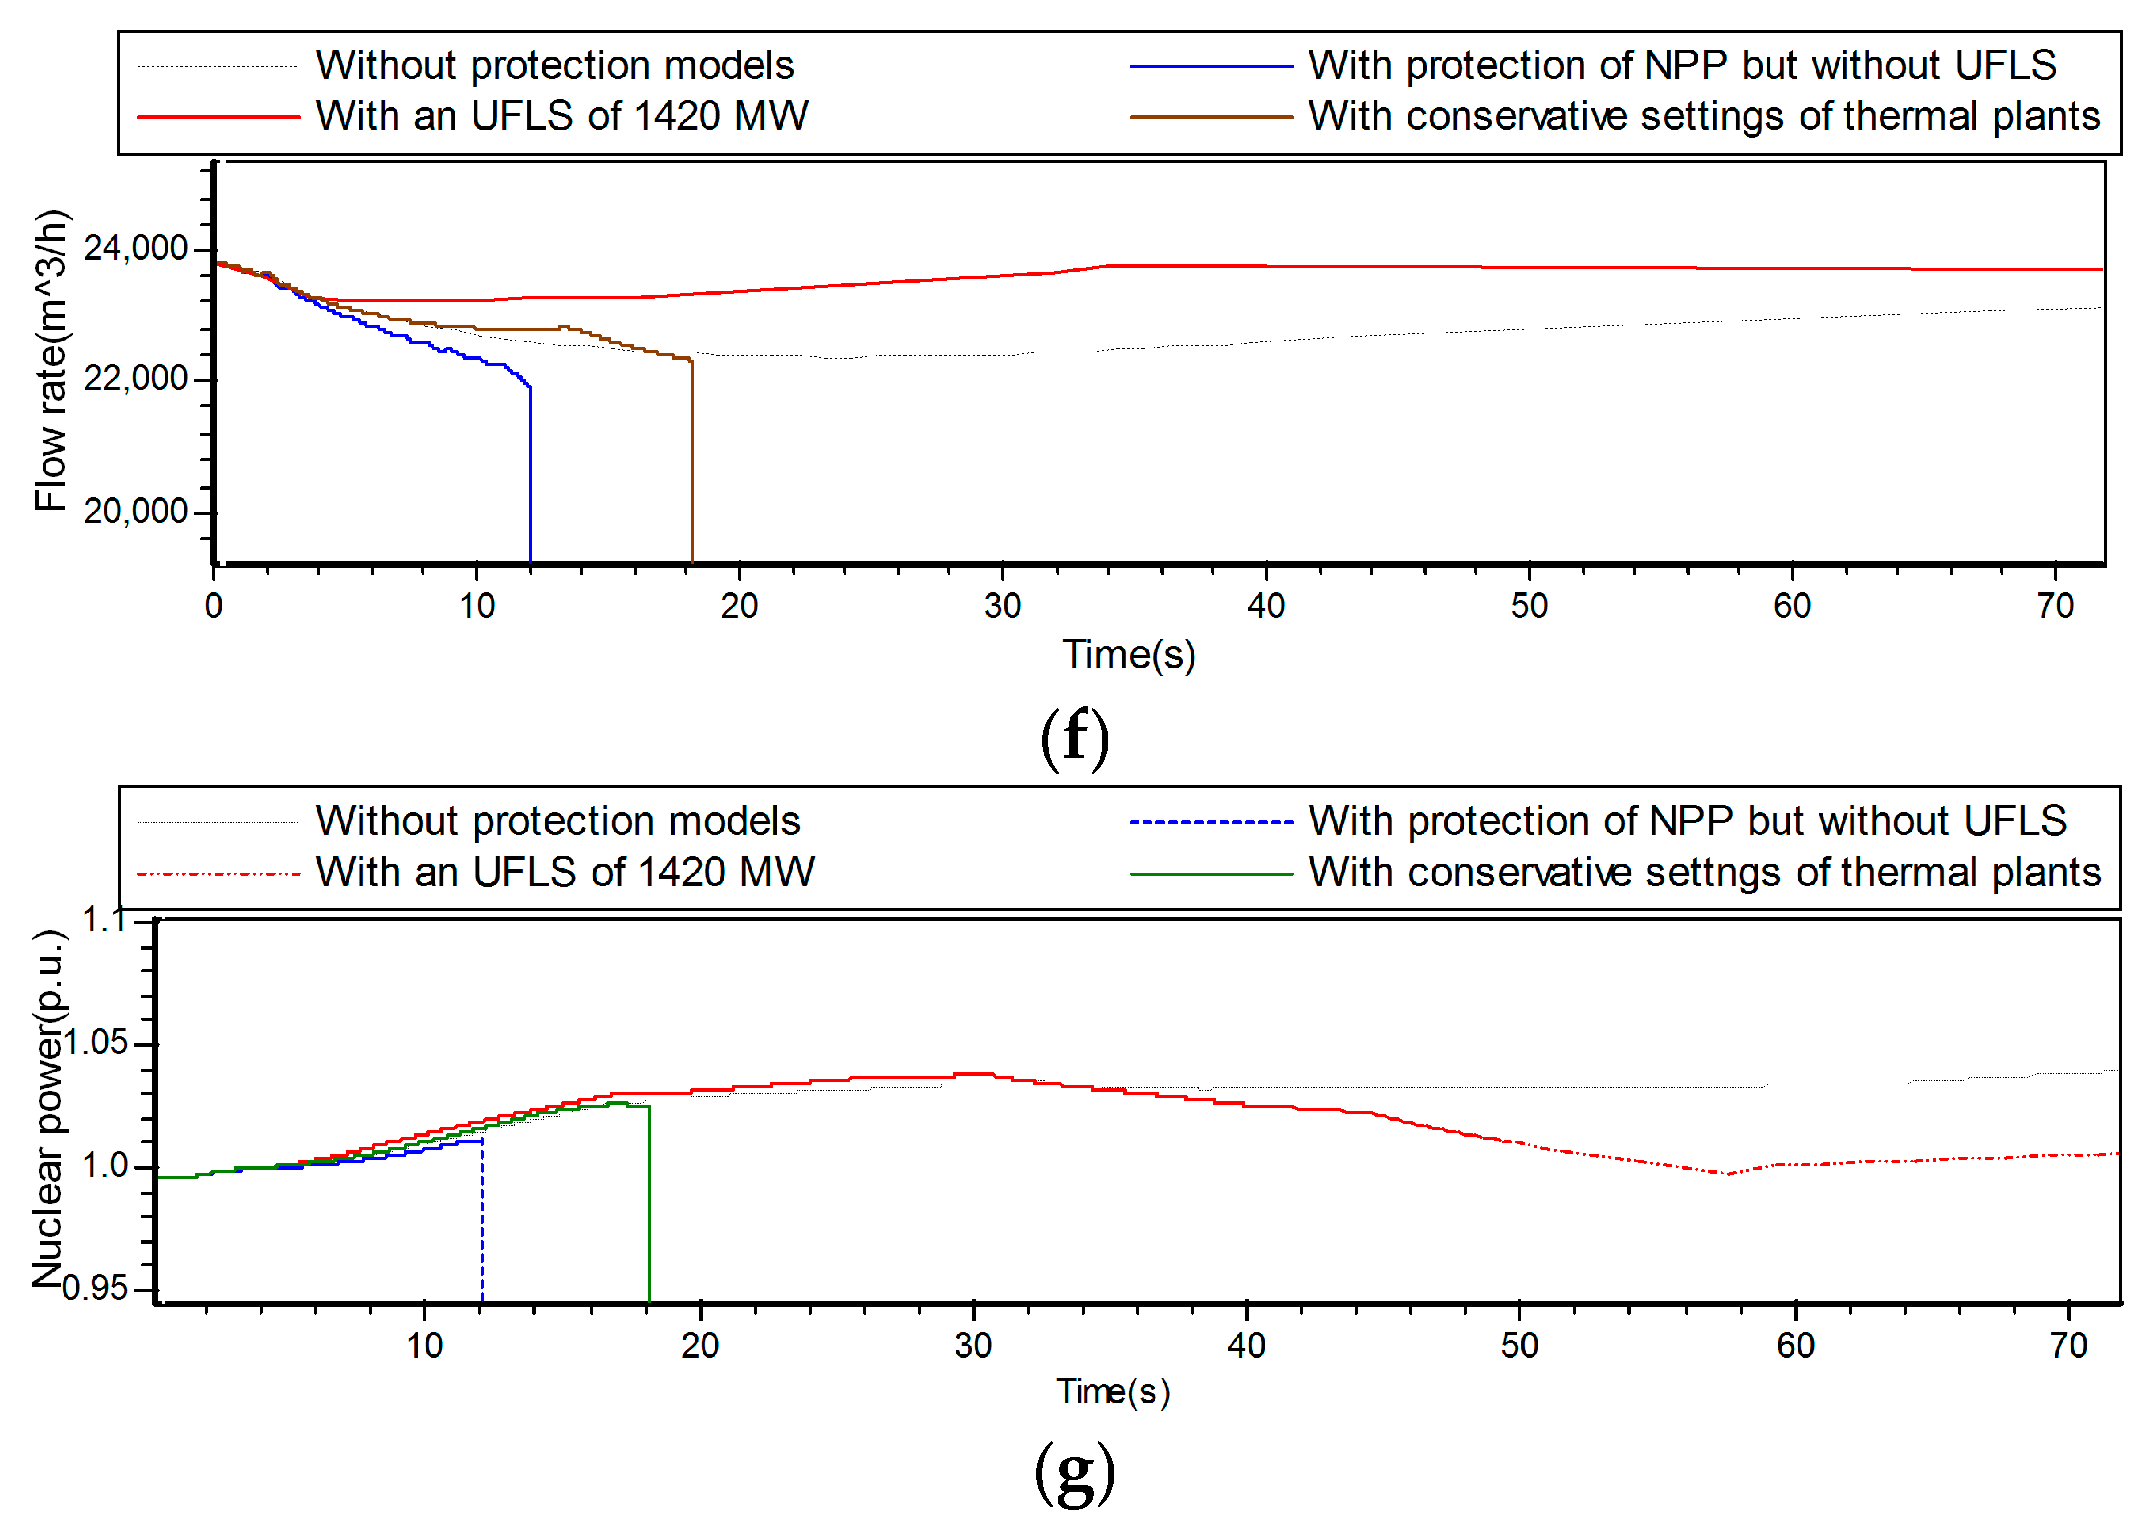
The local grid generates electrical energy of 16,430 MW, which cannot satisfy the load demand of 18,150 MW. The shortage is balanced by borrowing active power from the major system through transmission lines Lin11 and Lin12. If an N-2 fault occurs in Lin11 and Lin12, the parallel transmission lines are tripped, causing the local grid to become isolated. An active power shortage of 1700 MW would occur, and the frequency deviation would rise to approximately 3 Hz. The frequency of the islanded system eventually recovers to approximately 48.7 Hz, but it is nevertheless too low to maintain the long-term stable operation of the system.
If the under-frequency relays of thermal power plants are set too conservatively, they will be triggered to reduce the power generation by 3200 MW during the decrease in system frequency. This process speeds up the rate of frequency decrease. Because the rotation speed of the coolant pump is determined by the difference between the electromagnetic torque and the mechanical torque, which depend on the frequency and voltage of the auxiliary power bus, it declines rapidly as the frequency decreases. When the pump speed reaches the trip limit, it will trigger the under-speed relay of the main coolant pump of the NPP and cause serious accidents, such as reactor trips or system frequency collapses. To maintain the stability of the system frequency, such schemes as automatic load shedding based on frequency decreases must be used to eliminate the power shortage.
After a load shedding of 1420 MW, combined with frequency control and the load characteristics of the frequency, the frequency is gradually restored to approximately 49.8 Hz; thus, the pump speed also returns to normal, which satisfies the system requirements for long-term stable operation without initiating the under-frequency relay and other NPP relays. The dynamic response curves are shown in
Figure 14.
5.2. Over-Frequency Case
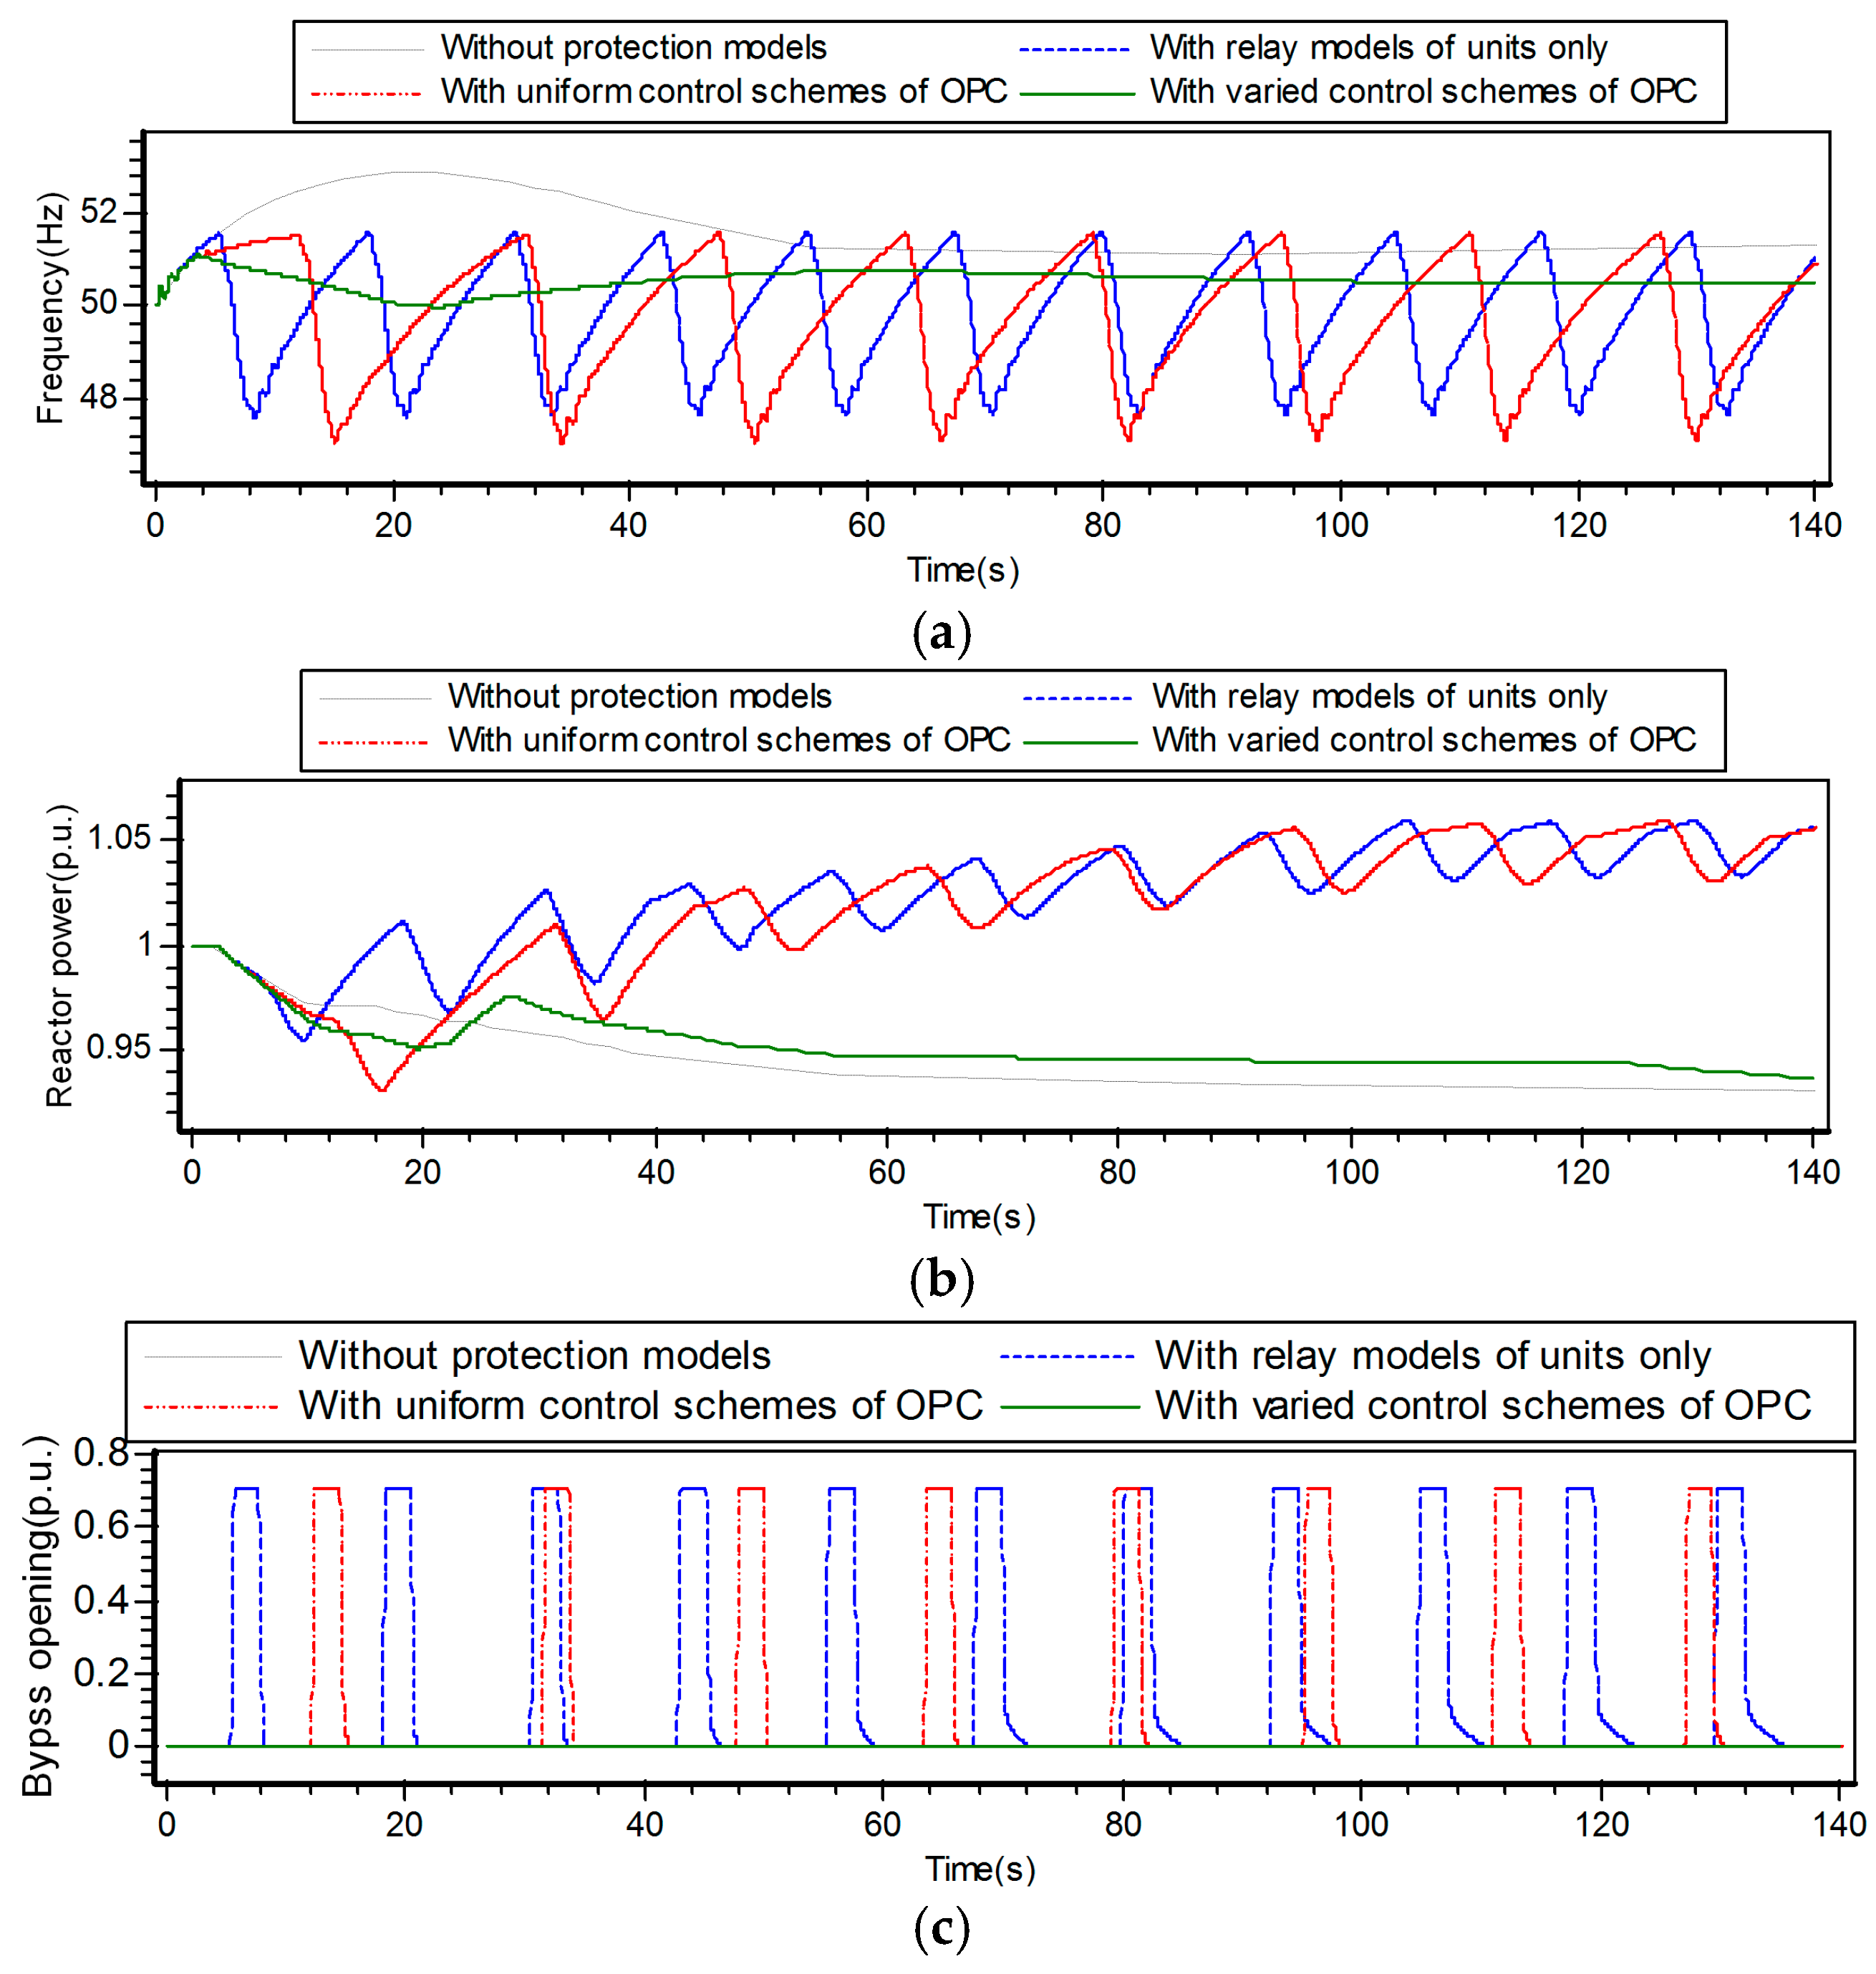
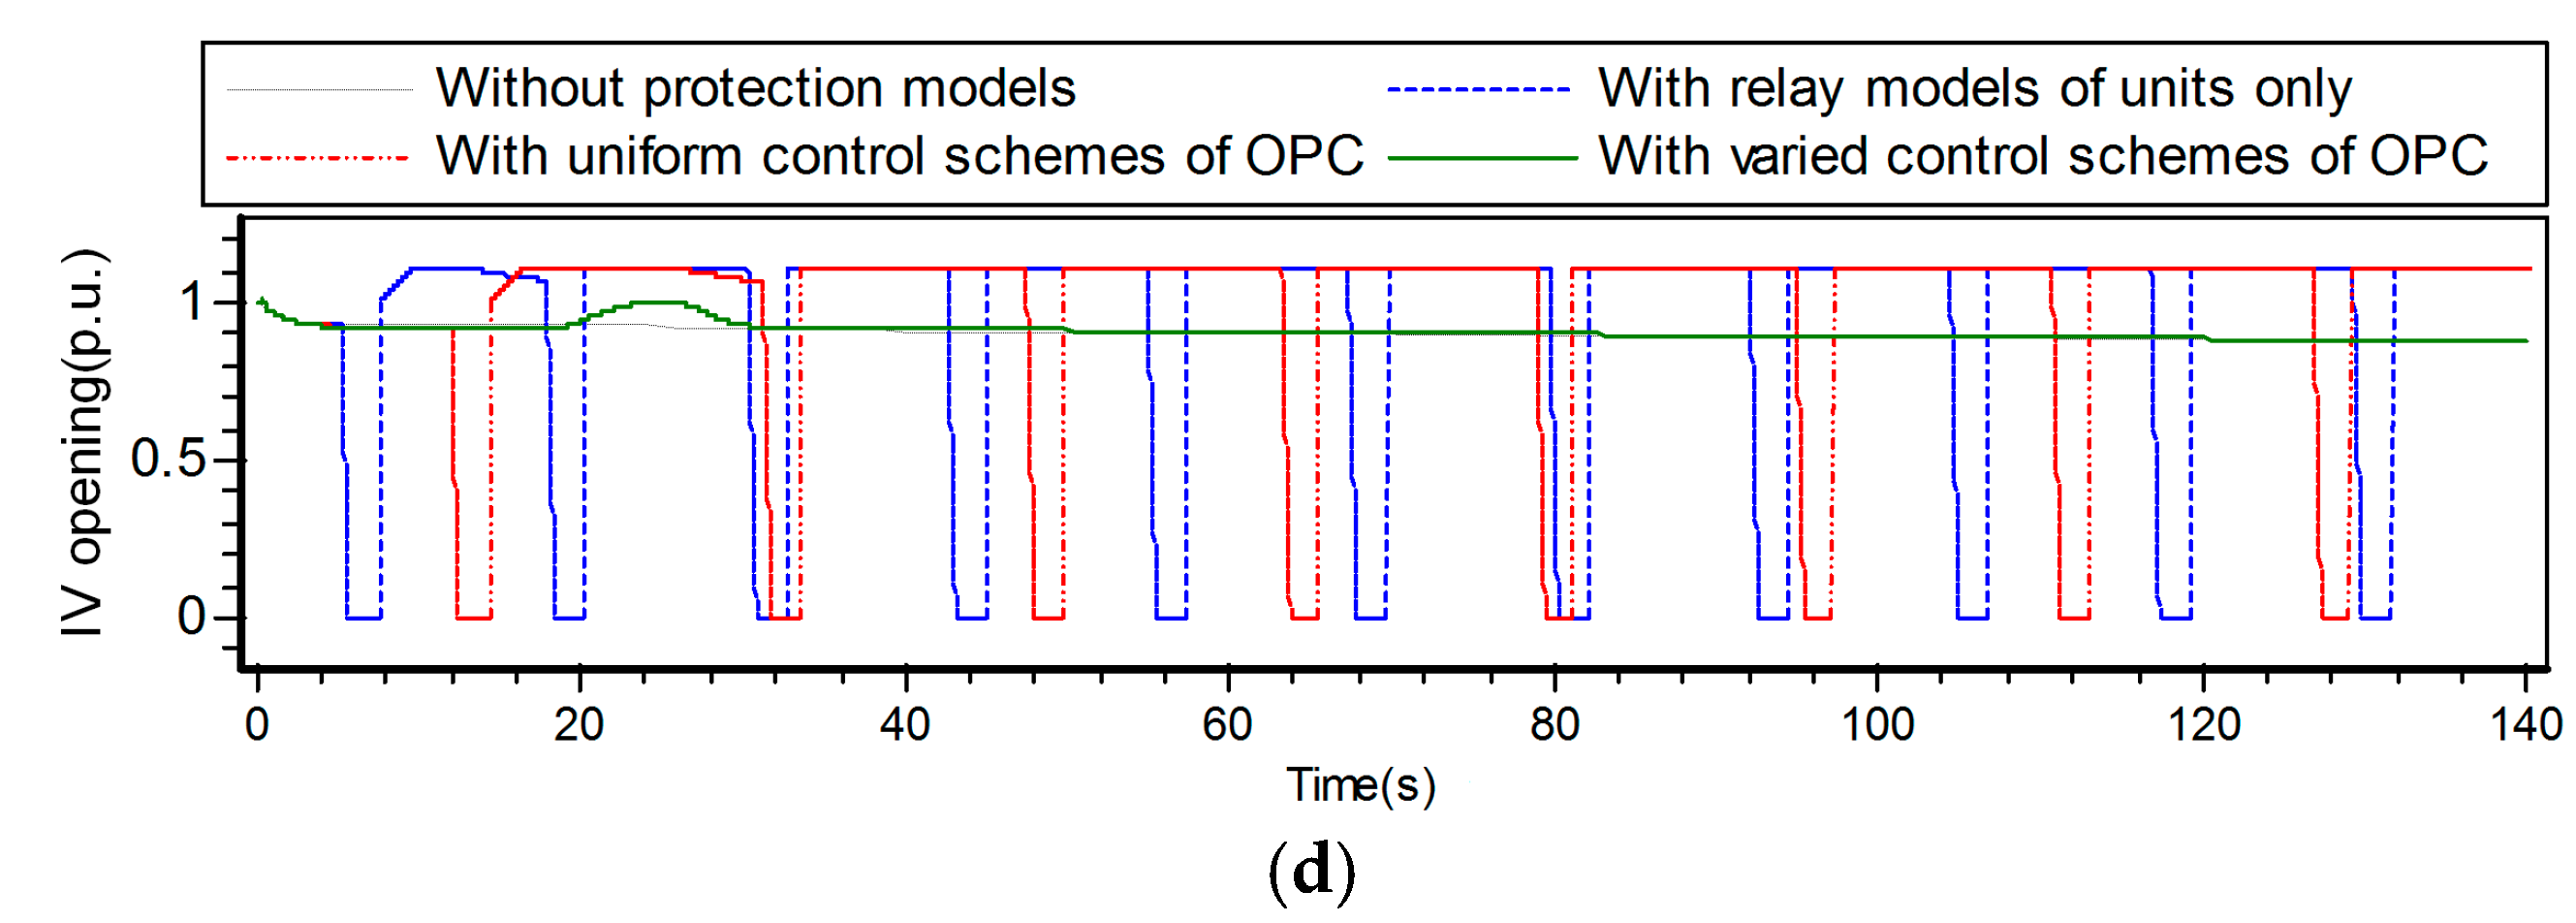
The generating capacity of the local grid is 21,300 MW with an estimated load of 18,700 MW. The local grid transports 2500 MW to the main power grid through 500 kV transmission lines Lin11 and Lin12. The local grid is separated from the major network by tripping 500 kV transmission lines Lin11 and Lin12 caused by an N-2 fault. If the generation is not reduced, the power grid would enter a condition of over-frequency, generating a surplus power of approximately 2500 MW.
The frequency curves are plotted in
Figure 15, corresponding to cases without protective relay models, with relay models for units only, with uniform OPC control schemes with a generation reduction of 957 MW, and with varied control OPC schemes with a generation reduction of 957 MW. The increase of frequency means there is surplus active power. Because NPPs normally operate in the reactor-follow-turbine mode, frequency changes will directly cause the reactor control system to change the position of the control rod bank to meet the power request. However, due to the limited adjustment ability of the reactor control system, once the frequency increase triggers the OPC, the steam dump system should be started to ensure the safety of the reactor, which is quite different from thermal units.
Apparently, the real dynamic characteristics of NPPs and power systems cannot be indicated without considering the protection models. When the frequency of the isolated grid increases to 51.5 Hz, the apparent excess of active power repeatedly triggers OPCs. To avoid any adverse effect on the stability of the system frequency, measures should be implemented. After a generation reduction of 957 MW, along with the governor systems of other generators, excessive power begins to decrease, and the frequency is restored to approximately 50.3 Hz, which can satisfy system requirements without trigging the NPPs.
Figure 15 shows that varied OPC control schemes other than uniform schemes can greatly help the frequency return smoothly to normal.
5.3. Under-Voltage Case
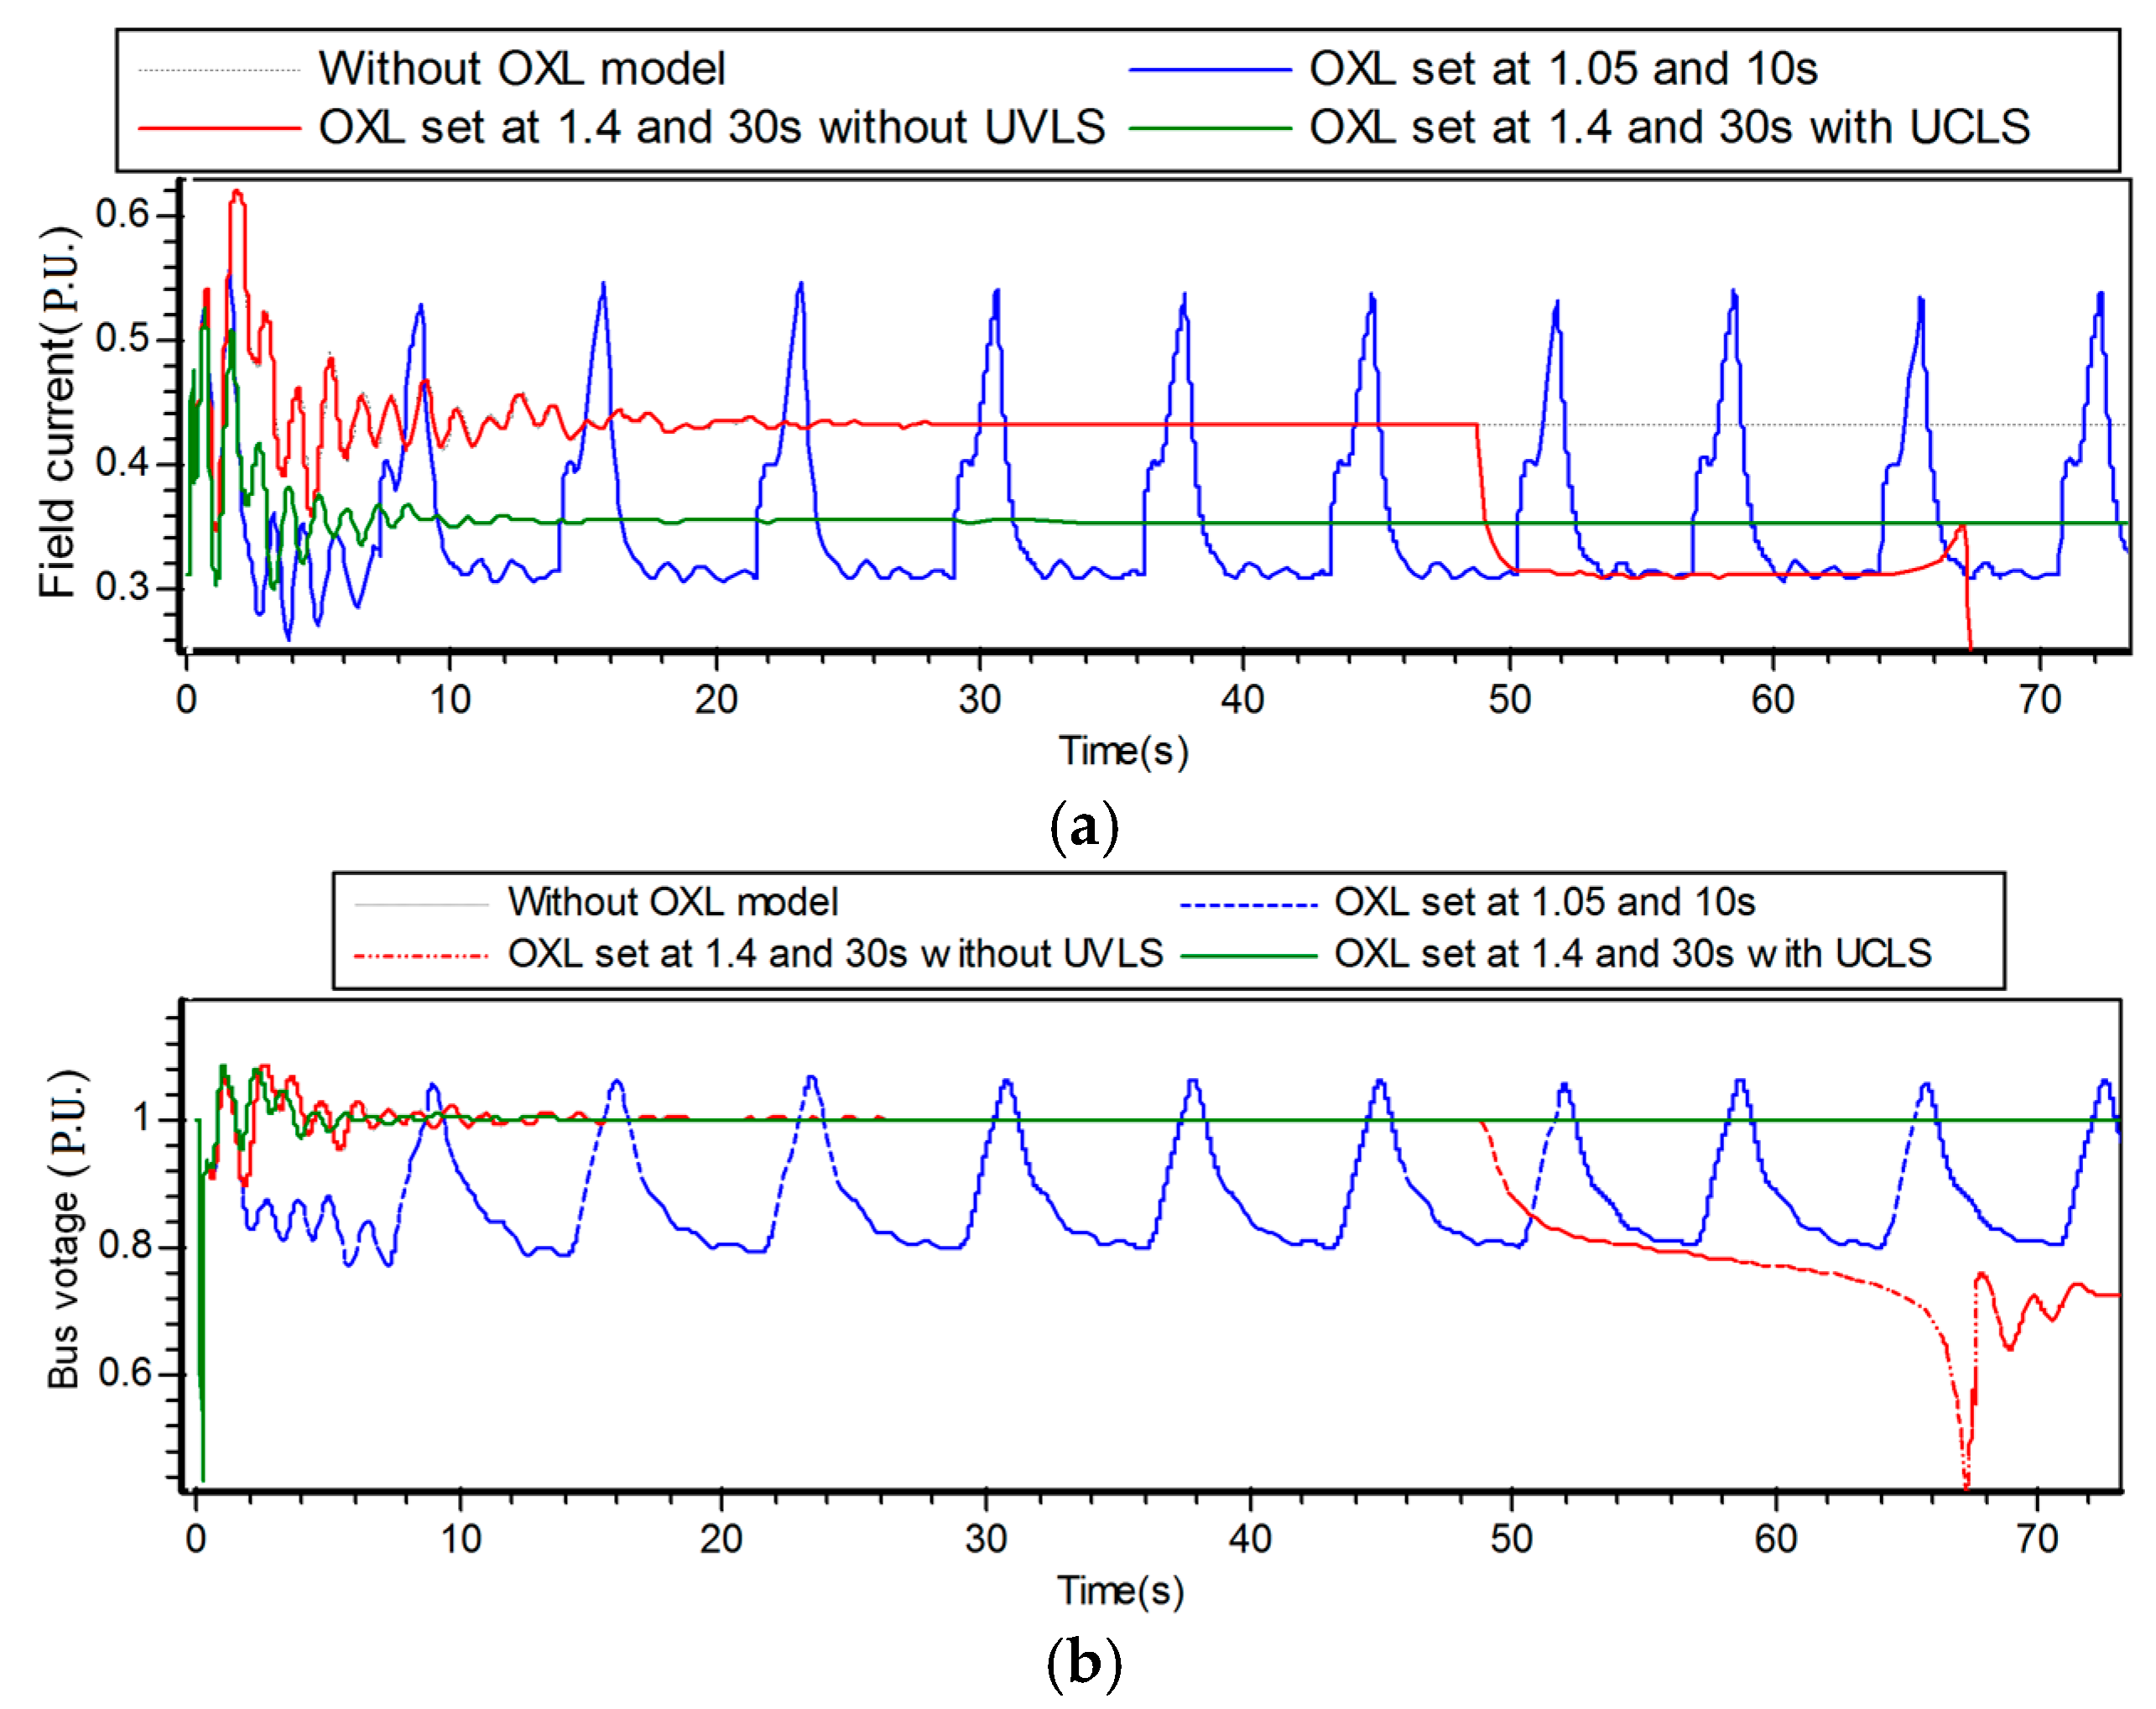
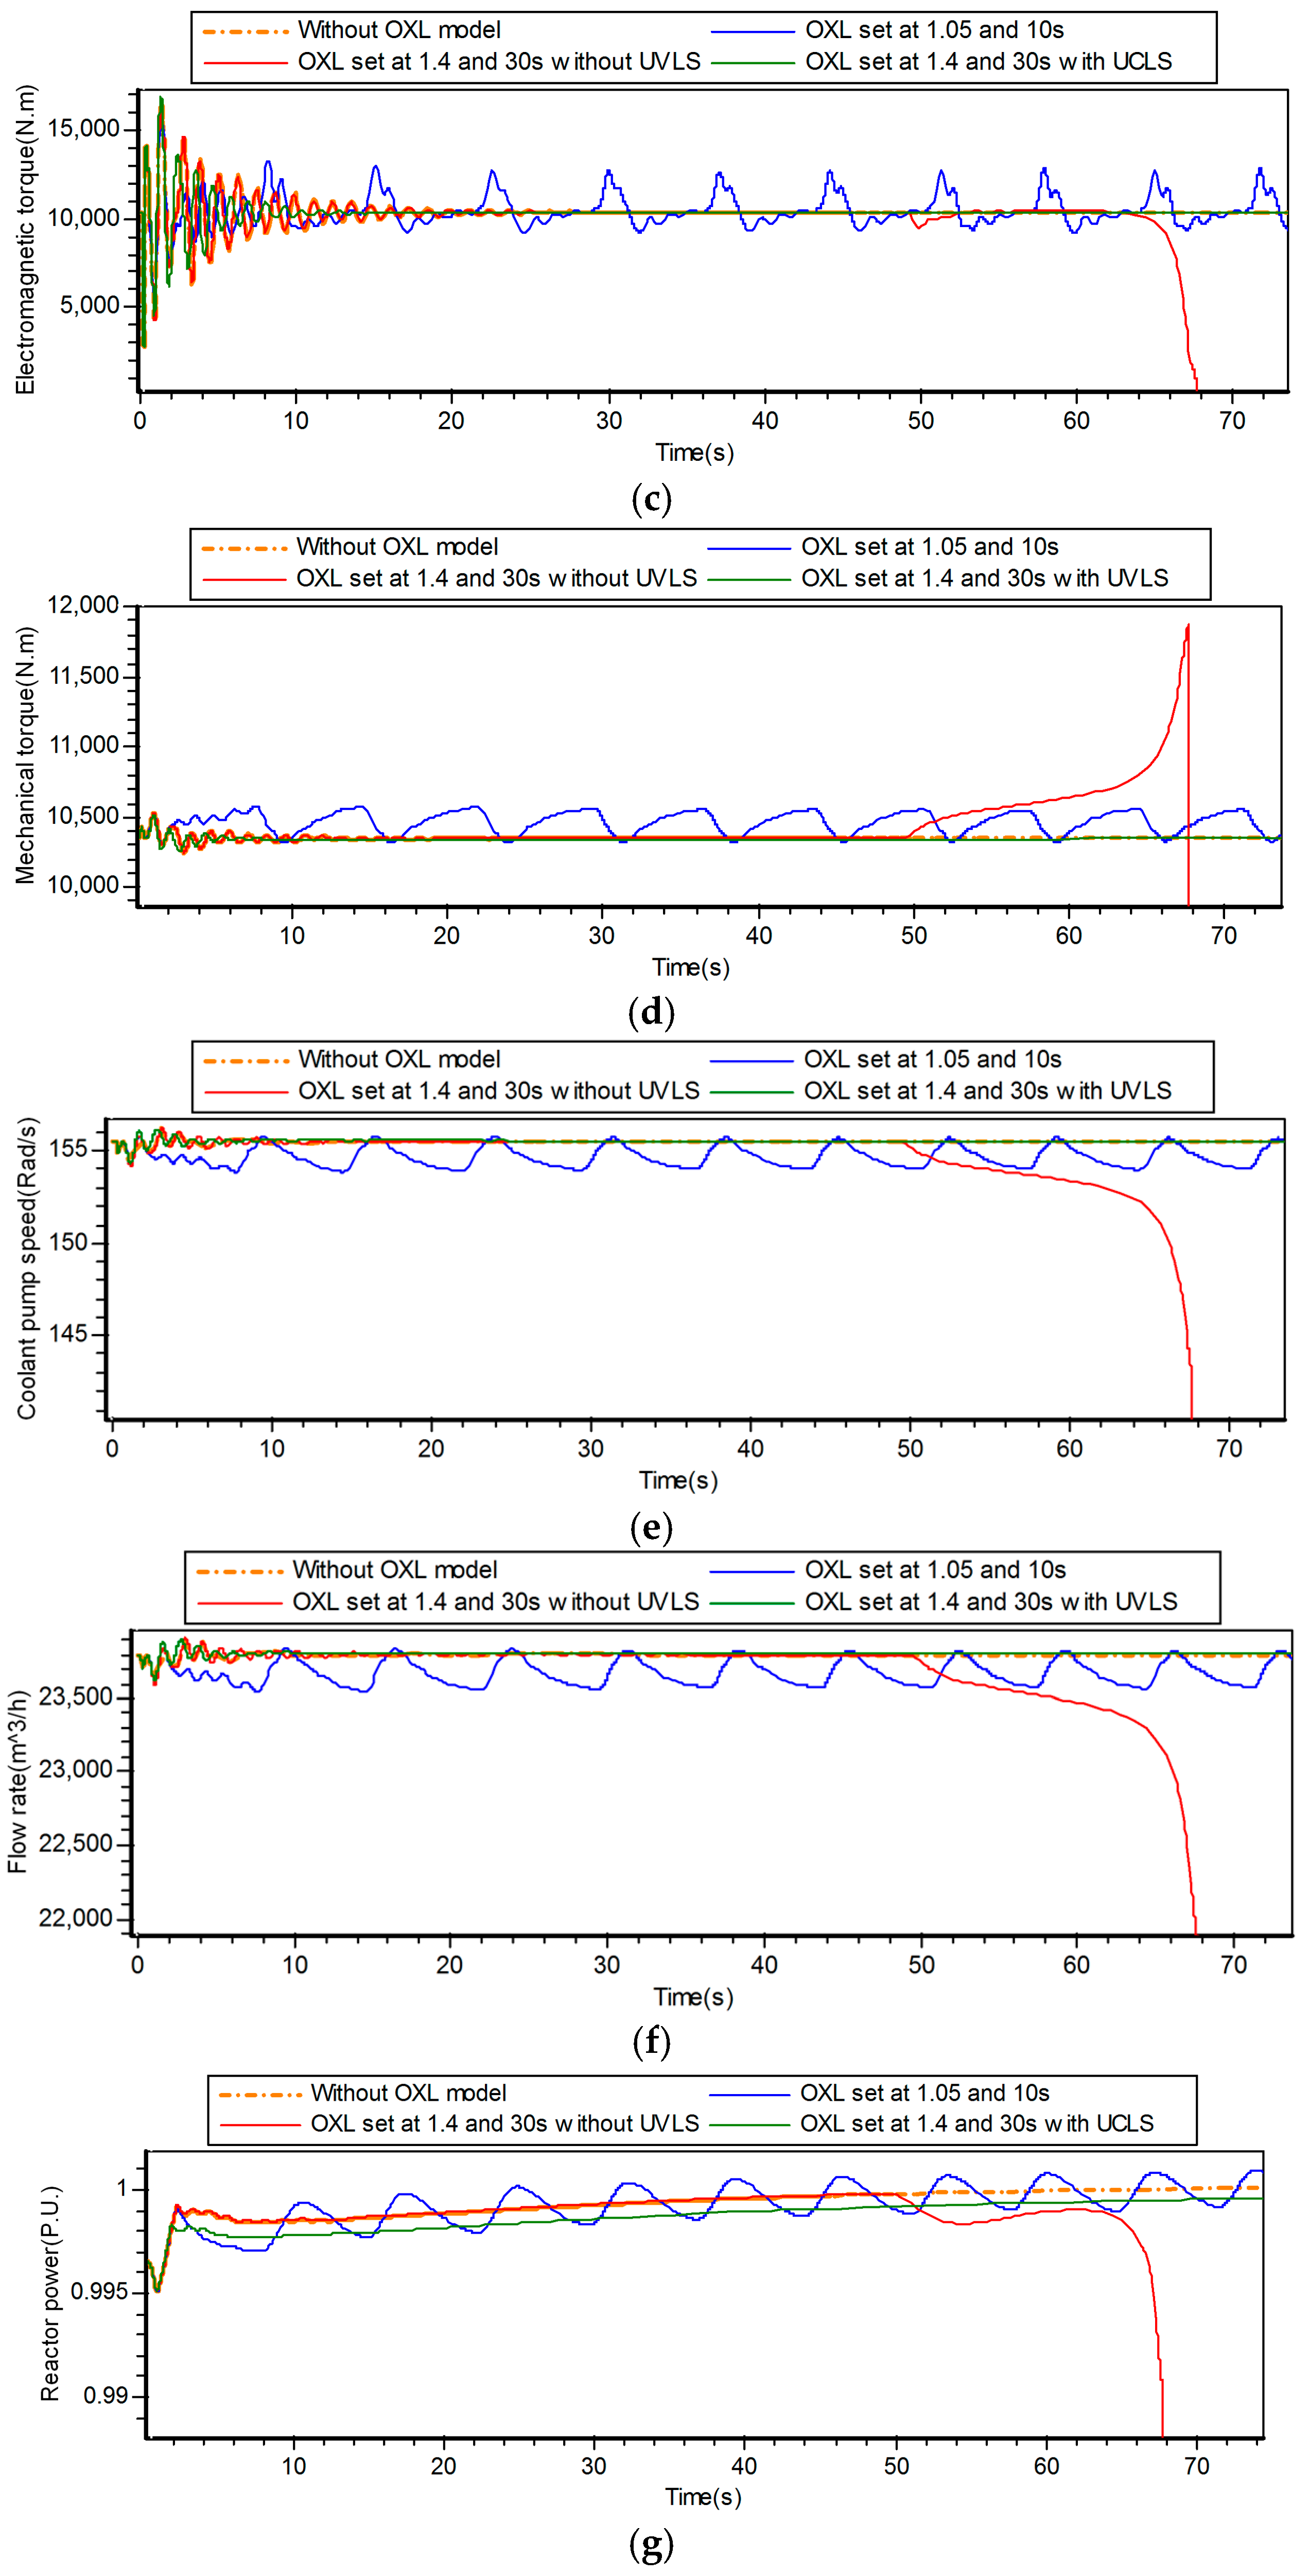
During the maintenance of parallel transmission lines Lin5 and Lin6, the total load demand of the grid is 26,430 MW, and its generating capacity is 25,650 MW. The local grid must extract active power from the major system to address the mismatch. The power angle, frequency, and voltage of the NPP remain stable after an N-2 fault occurs in Lin7 and Lin8. However, approximately 3300 MW of active power is transferred to Lin1, Lin2, Lin3, and Lin4, and the reactive power loss increases sharply. The voltages of other units, such as NPP G1, significantly decrease, which causes an obvious increase in the field current for a prolonged period and eventually activation of the OXL.
As shown in
Figure 16, the OXL will act repeatedly if its set point is too low, e.g., 1.05, which is likely to cause mechanical fatigue of the control system and instability of the NPPs. Meanwhile, the OXL will begin to operate until 48.5 s after the fault when the set point is increased from 1.05 to 1.4. The 500 kV bus voltage and the terminal voltage of NPP G1 decrease as the excitation current decreases. As mentioned above, the rotation speed of the main pump is mainly affected by the system frequency and bus voltage. Although the system frequency only fluctuates slightly, there is a relatively large drop of voltage, which increases the difference between the mechanical torque and the electromagnetic torque, and slows down the pump speed. These processes eventually initiate an under-speed relay of the main coolant pump at 67.7 s, consequently causing an emergency reactor trip. To avoid significant accidents, a load shedding of 1290 MW can be implemented by the receiving-end power grid to ensure that the voltage of NPP G1 stays within a reasonable range without initiating the OXL.


