Article

Influence of Droplet Size on Exergy Destruction in Flow of Concentrated Non-Newtonian Emulsions

Department of Chemical Engineering, University of Waterloo, Waterloo, ON N2L 3G1, Canada
Energies 2016, 9(4), 293; https://doi.org/10.3390/en9040293
Submission received: 26 January 2016 / Revised: 2 April 2016 / Accepted: 2 April 2016 / Published: 16 April 2016
(This article belongs to the Special Issue Exergy Analysis of Energy Systems)

Abstract

:
The influence of droplet size on exergy destruction rate in flow of highly concentrated oil-in-water emulsions was investigated experimentally in a cone and plate geometry. The oil concentration was fixed at 74.5% by volume. At this dispersed-phase (oil) concentration, two different droplet size emulsions were prepared: fine and coarse emulsions. The fine and coarse emulsions were mixed in different proportions to vary the droplet size distribution. Although the dispersed and matrix phases of the emulsions were Newtonian in nature, the emulsions exhibited a non-Newtonian (shear-thinning) behavior due to the high droplet concentration. The shear stress—shear rate data of the emulsions could be described adequately by a power law model. At low shear rates, the exergy destruction rate per unit volume of emulsion exhibited a minimum at a fine emulsion proportion of 35%. The results from the cone and plate geometry were used to simulate exergy loss in pipeline flow of emulsions. The pumping of emulsions becomes more efficient thermodynamically upon mixing of fine and coarse emulsions provided that the flow regime is maintained to be laminar and that the Reynolds number is kept at a low to moderate value. In the turbulent regime, the exergy loss generally increases upon mixing the fine and coarse emulsions.

1. Introduction

Emulsions are two-phase dispersions of oil and water [1,2,3]. One of the phases (oil or water) is dispersed as droplets in a continuum of the other phase. Thus, emulsions could be classified into two broad groups: (i) oil-in-water (abbreviated as O/W) emulsions where oil forms the dispersed droplets and water is the continuous phase; and (ii) water-in-oil (abbreviated as W/O) emulsions where water forms the dispersed droplets and oil is the continuous phase. The applications of emulsions are many. Numerous products of commercial importance are handled or sold in the form of emulsions. The industries where emulsions are frequently encountered in one form or the other include: petroleum, food, pharmaceutical, cosmetics, agriculture, explosives, lubricants, and paints [1,4,5,6,7,8,9,10,11,12,13].
The pumping of emulsions through pipelines and other process equipment is a common occurrence in industrial applications. For example, highly viscous heavy crude oils and bitumen are transported over long distances via pipelines in the form of O/W emulsions. As pumping systems consume a significant portion of the total electrical energy used in the process, it is important to quantify the extent to which exergy is destroyed due to irreversibilities in the process. It is equally important from a practical point of view to find ways to minimize the destruction of exergy and hence reduce the pumping costs.
The exergy of a system is defined as the maximum possible useful work that can be obtained from the system when the system is taken from its given state to the dead state where the system is in thermodynamic equilibrium with the environment. A system in thermodynamic equilibrium with its environment has zero exergy. Thus, exergy is a property that is associated with the state of the system and its environment [14]. The thermo-mechanical exergy of a closed system is given as follows on a unit mass basis:
ψ = ( u u o ) + P o ( v v o ) T o ( s s o ) + g z
where u, v, and s are specific internal energy, specific volume, and specific entropy of the system, respectively; uo, vo, and so are specific internal energy, specific volume, and specific entropy of the system in the dead state, respectively; Po and To are the environment pressure and temperature, respectively; g is acceleration due to gravity; and z is the elevation of the system. In Equation (1), it is assumed that the kinetic energy of the system is zero, that is, the system is stationary. The thermo-mechanical exergy associated with a fluid stream per unit mass is given as follows:
ψ = ( h h o ) T o ( s s o ) + V 2 2 + g z
where h is the specific enthalpy of the fluid in its current state, ho is the specific enthalpy of the fluid in the dead state, and V is the velocity of the fluid.
According to the Gouy-Stodola theorem, the amount of exergy destroyed in a process is directly proportional to the total rate of entropy generation in the system and the surroundings, that is:
Ψ ˙ d e s t r u c t i o n = T o S ˙ G , t o t a l
where Ψ ˙ d e s t r u c t i o n is the total rate of exergy destruction, and S ˙ G , t o t a l is the total rate of entropy generation. In the absence of any heat transfer between the system and the surroundings, that is, under adiabatic condition, the external irreversibility is eliminated and therefore, the exergy destruction is entirely due to internal irreversibilities and S ˙ G , t o t a l = S ˙ G where S ˙ G is the rate of entropy generation within the system or control volume boundary.
In order to improve the thermodynamic efficiency of the process, it is important to estimate the rate of exergy destruction in a process and to minimize it. One possible way to manipulate and control the rate of exergy destruction in emulsion flows is to vary the droplet size distribution. In the past, a number of studies have been published on emulsion rheology [8,9,11,13,15,16,17] and concurrent flow of oil and water in pipes [18,19,20,21,22,23,24,25,26,27,28,29,30,31,32,33,34]. However, the analysis and interpretation of influence of droplet size and droplet size distribution on exergy destruction in emulsion flows is lacking. In this article, exergy destruction in isothermal flow of emulsions is measured experimentally using a cone and plate geometry. The influence of droplet size distribution on exergy destruction is also determined. To our knowledge, this is the first study on the influence of droplet size distribution on exergy destruction in isothermal flow of emulsions.

2. Theoretical Background

When a fluid is sheared, entropy is generated and exergy is destroyed due to friction in the fluid. Consider a certain volume of incompressible fluid at a uniform temperature T. When this fluid is sheared, work is done on the fluid. Let the rate of work done on the fluid per unit volume basis be W ˙ . The work supplied to the fluid is dissipated in frictional heating of the fluid. In order to keep the temperature of the fluid uniform at T, let the rate of heat removal from the fluid to its surroundings at To be Q ˙ on a unit volume basis. The exergy balance on the fluid gives:
ψ ˙ D = W ˙ Q ˙ ( 1 T o T )
where ψ ˙ D is the exergy destruction rate per unit volume of the fluid. Note that both W ˙ and Q ˙ are treated as positive quantities as their directions are already specified. From the first law of thermodynamics, Q ˙ = W ˙ . Thus, Equation (4) reduces to:
ψ ˙ D = Q ˙ ( T o T )
The rate of energy dissipation in frictional heating of the fluid per unit volume of fluid is given as τ _ _ : V , where τ _ _ is the viscous stress tensor, V is the fluid velocity vector, “:” is the double dot product sign [35]. As Q ˙ is equal to τ _ _ : V , Equation (5) gives:
ψ ˙ D = T o T ( τ _ _ : V )
The entropy balance on the fluid gives:
S ˙ G v = ( Q ˙ T )
where S ˙ G v is the rate of entropy generation in the fluid on a unit volume basis. From Equations (5) to (7) it follows that:
ψ ˙ D = T o S ˙ G v = T o T ( τ _ _ : V )
In this work, the exergy destruction experiments are carried out in a cone-and-plate rheometer. A cone and plate rheometer is widely used to measure the viscosity and rheology of fluids. It consists of a flat circular plate which is held stationary. A cone rotates at the top of the plate with a known angular velocity. The apex of the cone just touches the bottom plate. The test liquid is placed in the narrow gap between the cone and plate. The angle between the cone and the plate is typically less than 5° (see Figure 1).

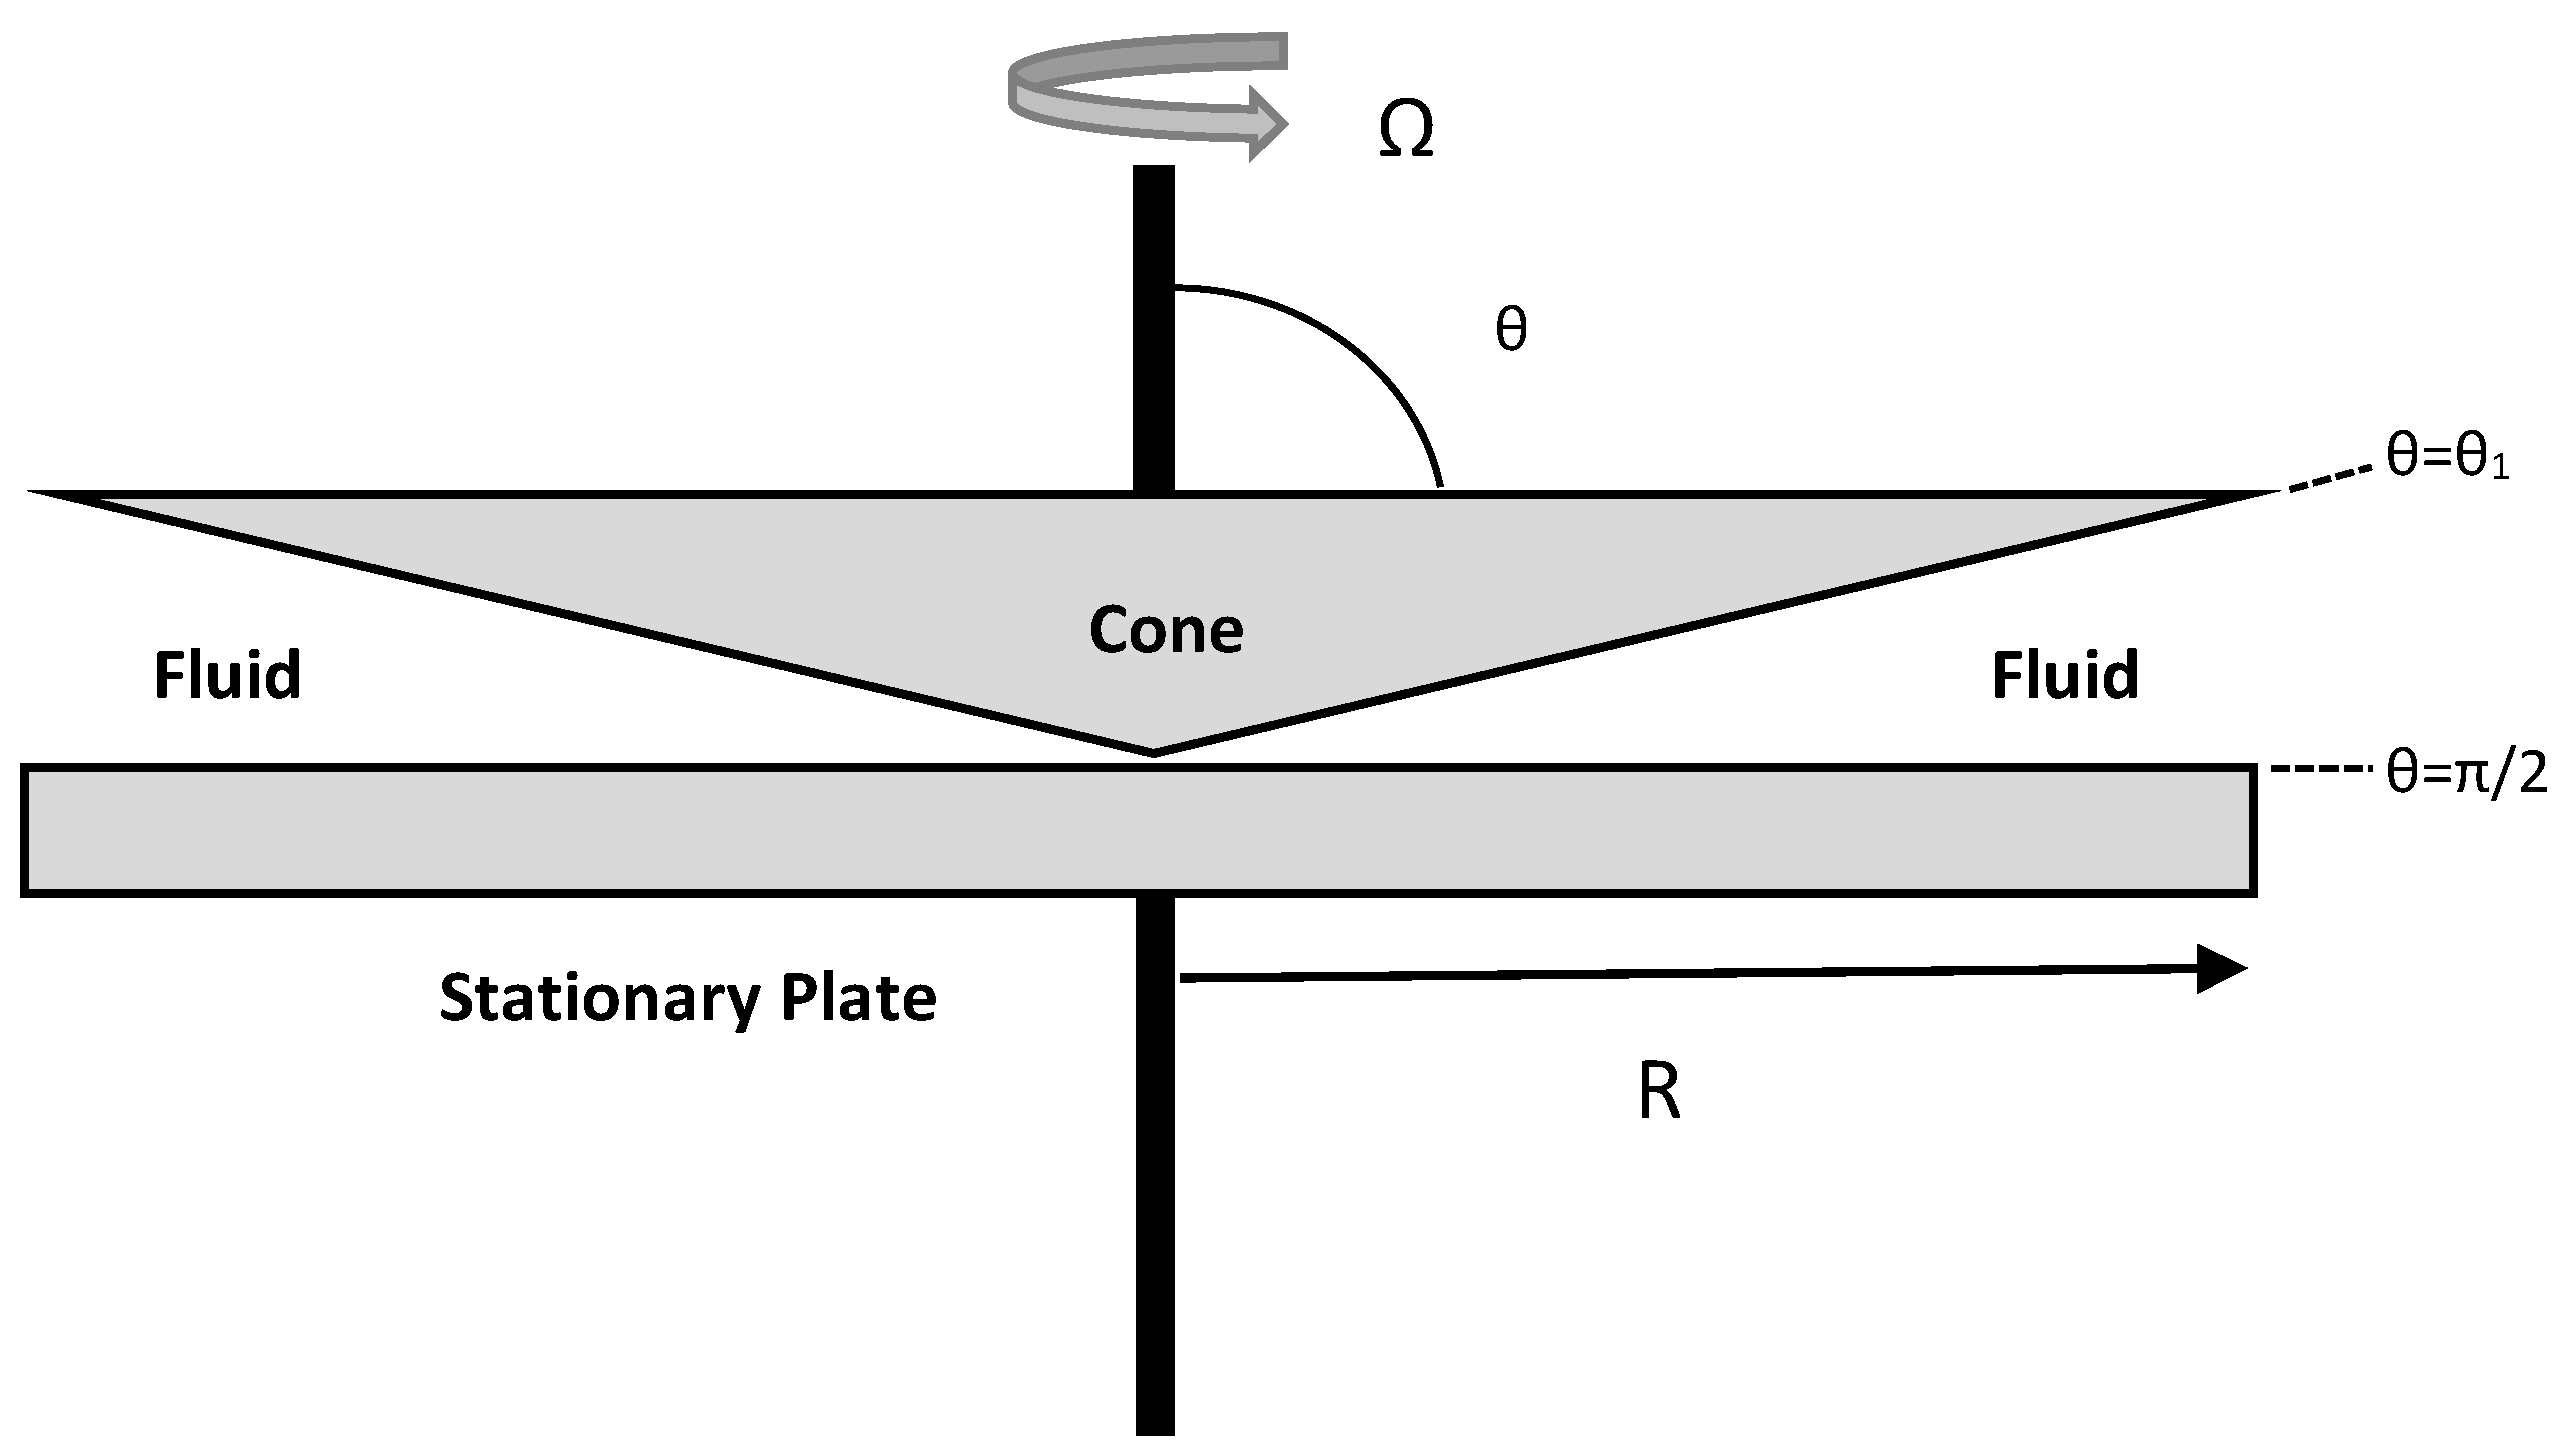
Exergy Destruction in a Cone-and-Plate Viscometer

The velocity distribution in a cone and plate viscometer is given as [36,37]:
V φ = Ω r sin θ 1 [ cot θ + sin θ 2 ln ( 1 + cos θ 1 cos θ ) cot θ 1 + sin θ 1 2 ln ( 1 + cos θ 1 1 cos θ 1 ) ]
As the motion is in ϕ -direction, only V ϕ is non-zero. The other two components of velocity (Vr and Vθ) are zero. Since θ 1 π 2 and θ π 2 , this expression of velocity simplifies to V φ = Ω r cos θ / cos θ 1 .
Using the velocity distribution and the symmetry of stress tensor, it can be readily shown that [36,37]:
τ _ _ : V = ( τ θ φ Ω cos θ 1 ) ( 1 sin θ ) ( τ θ φ Ω cos θ 1 )
Note that θ π 2 in a cone-and-plate viscometer. The shear rate in the cone-and-plate viscometer γ ˙ is given as [35]:
γ ˙ = ( Ω cos θ 1 ) ( 1 sin θ ) ( Ω cos θ 1 )
Combining Equations (10) and (11), we get:
τ _ _ :    V = ( τ θ φ ) γ ˙
where γ ˙ and τ θ φ are positive quantities.
The local exergy destruction rate per unit volume of the fluid given by Equation (8) can now be expressed for a cone-and-plate viscometer as:
ψ ˙ D = T o S ˙ G v = T o T ( τ _ _ : V ) = T o T ( τ γ ˙ )
where τ ( = τ θ φ ) is the shear stress measured through the torque transmitted to the bottom stationary plate and γ ˙ is the shear rate in the viscometer determined from the angular speed of rotation of the cone (see Equation (11)). It is important to note that the shear rate γ ˙ in a cone-and-plane viscometer is uniform in that it does not vary with the position in the flow field (space in between the rotating cone and stationary plate).

3. Experimental Section

The emulsions prepared were of O/W type, that is, oil droplets formed the dispersed-phase and water formed the continuous phase. The oil used was a petroleum oil of viscosity 5.8 mPa·s at 25 °C. The water used was deionized. A water-soluble non-ionic surfactant Triton X-100 was used to stabilize the emulsions. The concentration of the surfactant was kept 2 wt % based on the aqueous phase. The emulsions were prepared in batches of about 500 g using a variable speed homogenizer to provide the necessary shearing. The oil concentration (ϕ) was fixed at 74.5% by volume. At this dispersed-phase (oil) concentration, two different droplet size emulsions were prepared: fine and coarse emulsions. For the preparation of coarse emulsion, the shearing speed of the homogenizer was kept low and the emulsion was sheared for a small duration. A high shearing speed and increased duration of shearing were used for the preparation of fine emulsion. The fine and coarse emulsions produced were highly stable in nature. Several mixtures of fine and coarse emulsions were also prepared by mixing them in varying proportions using gentle stirring with a hand stirrer. The rheological and exergy destruction behaviors of the fine and coarse emulsions as well as their mixtures were studied at a fixed temperature of 25 °C using a controlled-stress rheometer with a cone-and-plate geometry. The plate was kept stationary and the cone was rotated at different angular speeds. The cone diameter was 40 mm and the plate diameter was 60 mm. The angle between the cone surface and stationary plate was 4° and the gap at the cone tip was 150 µm. The droplet sizes of emulsions were determined by taking photomicrographs with a Zeiss optical microscope equipped with a camera.

4. Results and Discussion

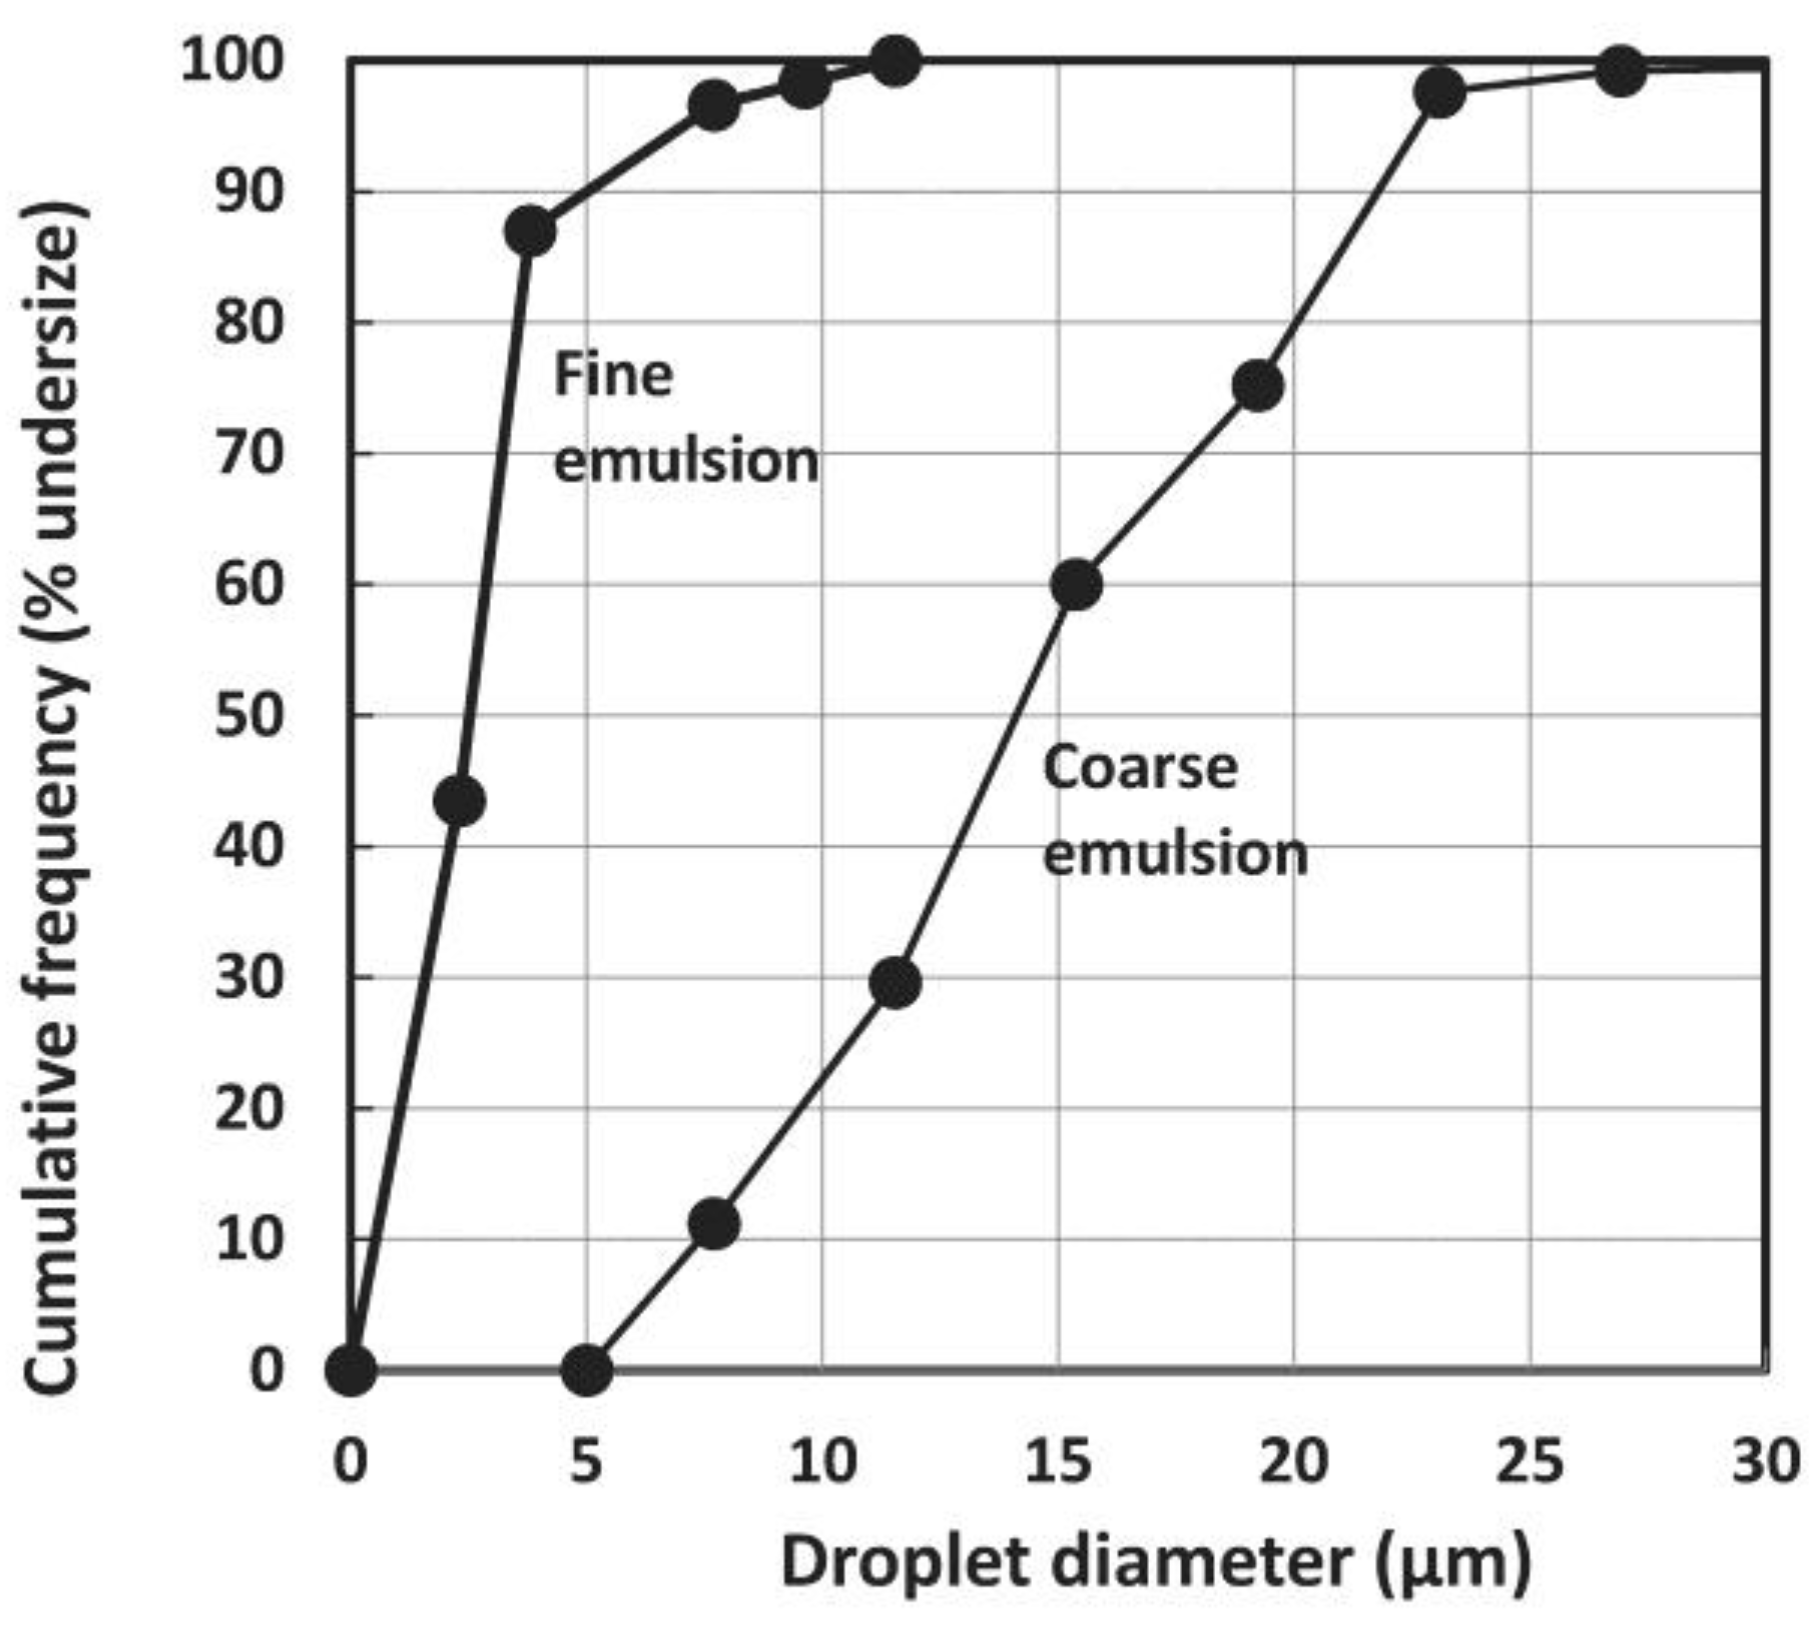
4.1. Droplet Size Distribution of Emulsions

The photomicrographs of fine and coarse O/W emulsions are shown in Figure 2. The comparison of the droplet size distributions of fine and coarse O/W emulsions is given in Figure 3. The fine emulsion is relatively more uniform in droplet size as compared with the coarse emulsion. The Sauter mean diameters of the fine and coarse emulsions are 6.3 and 20 µm, respectively. Thus, the coarse emulsion droplets are more than 3 times larger in size than the fine emulsion droplets.

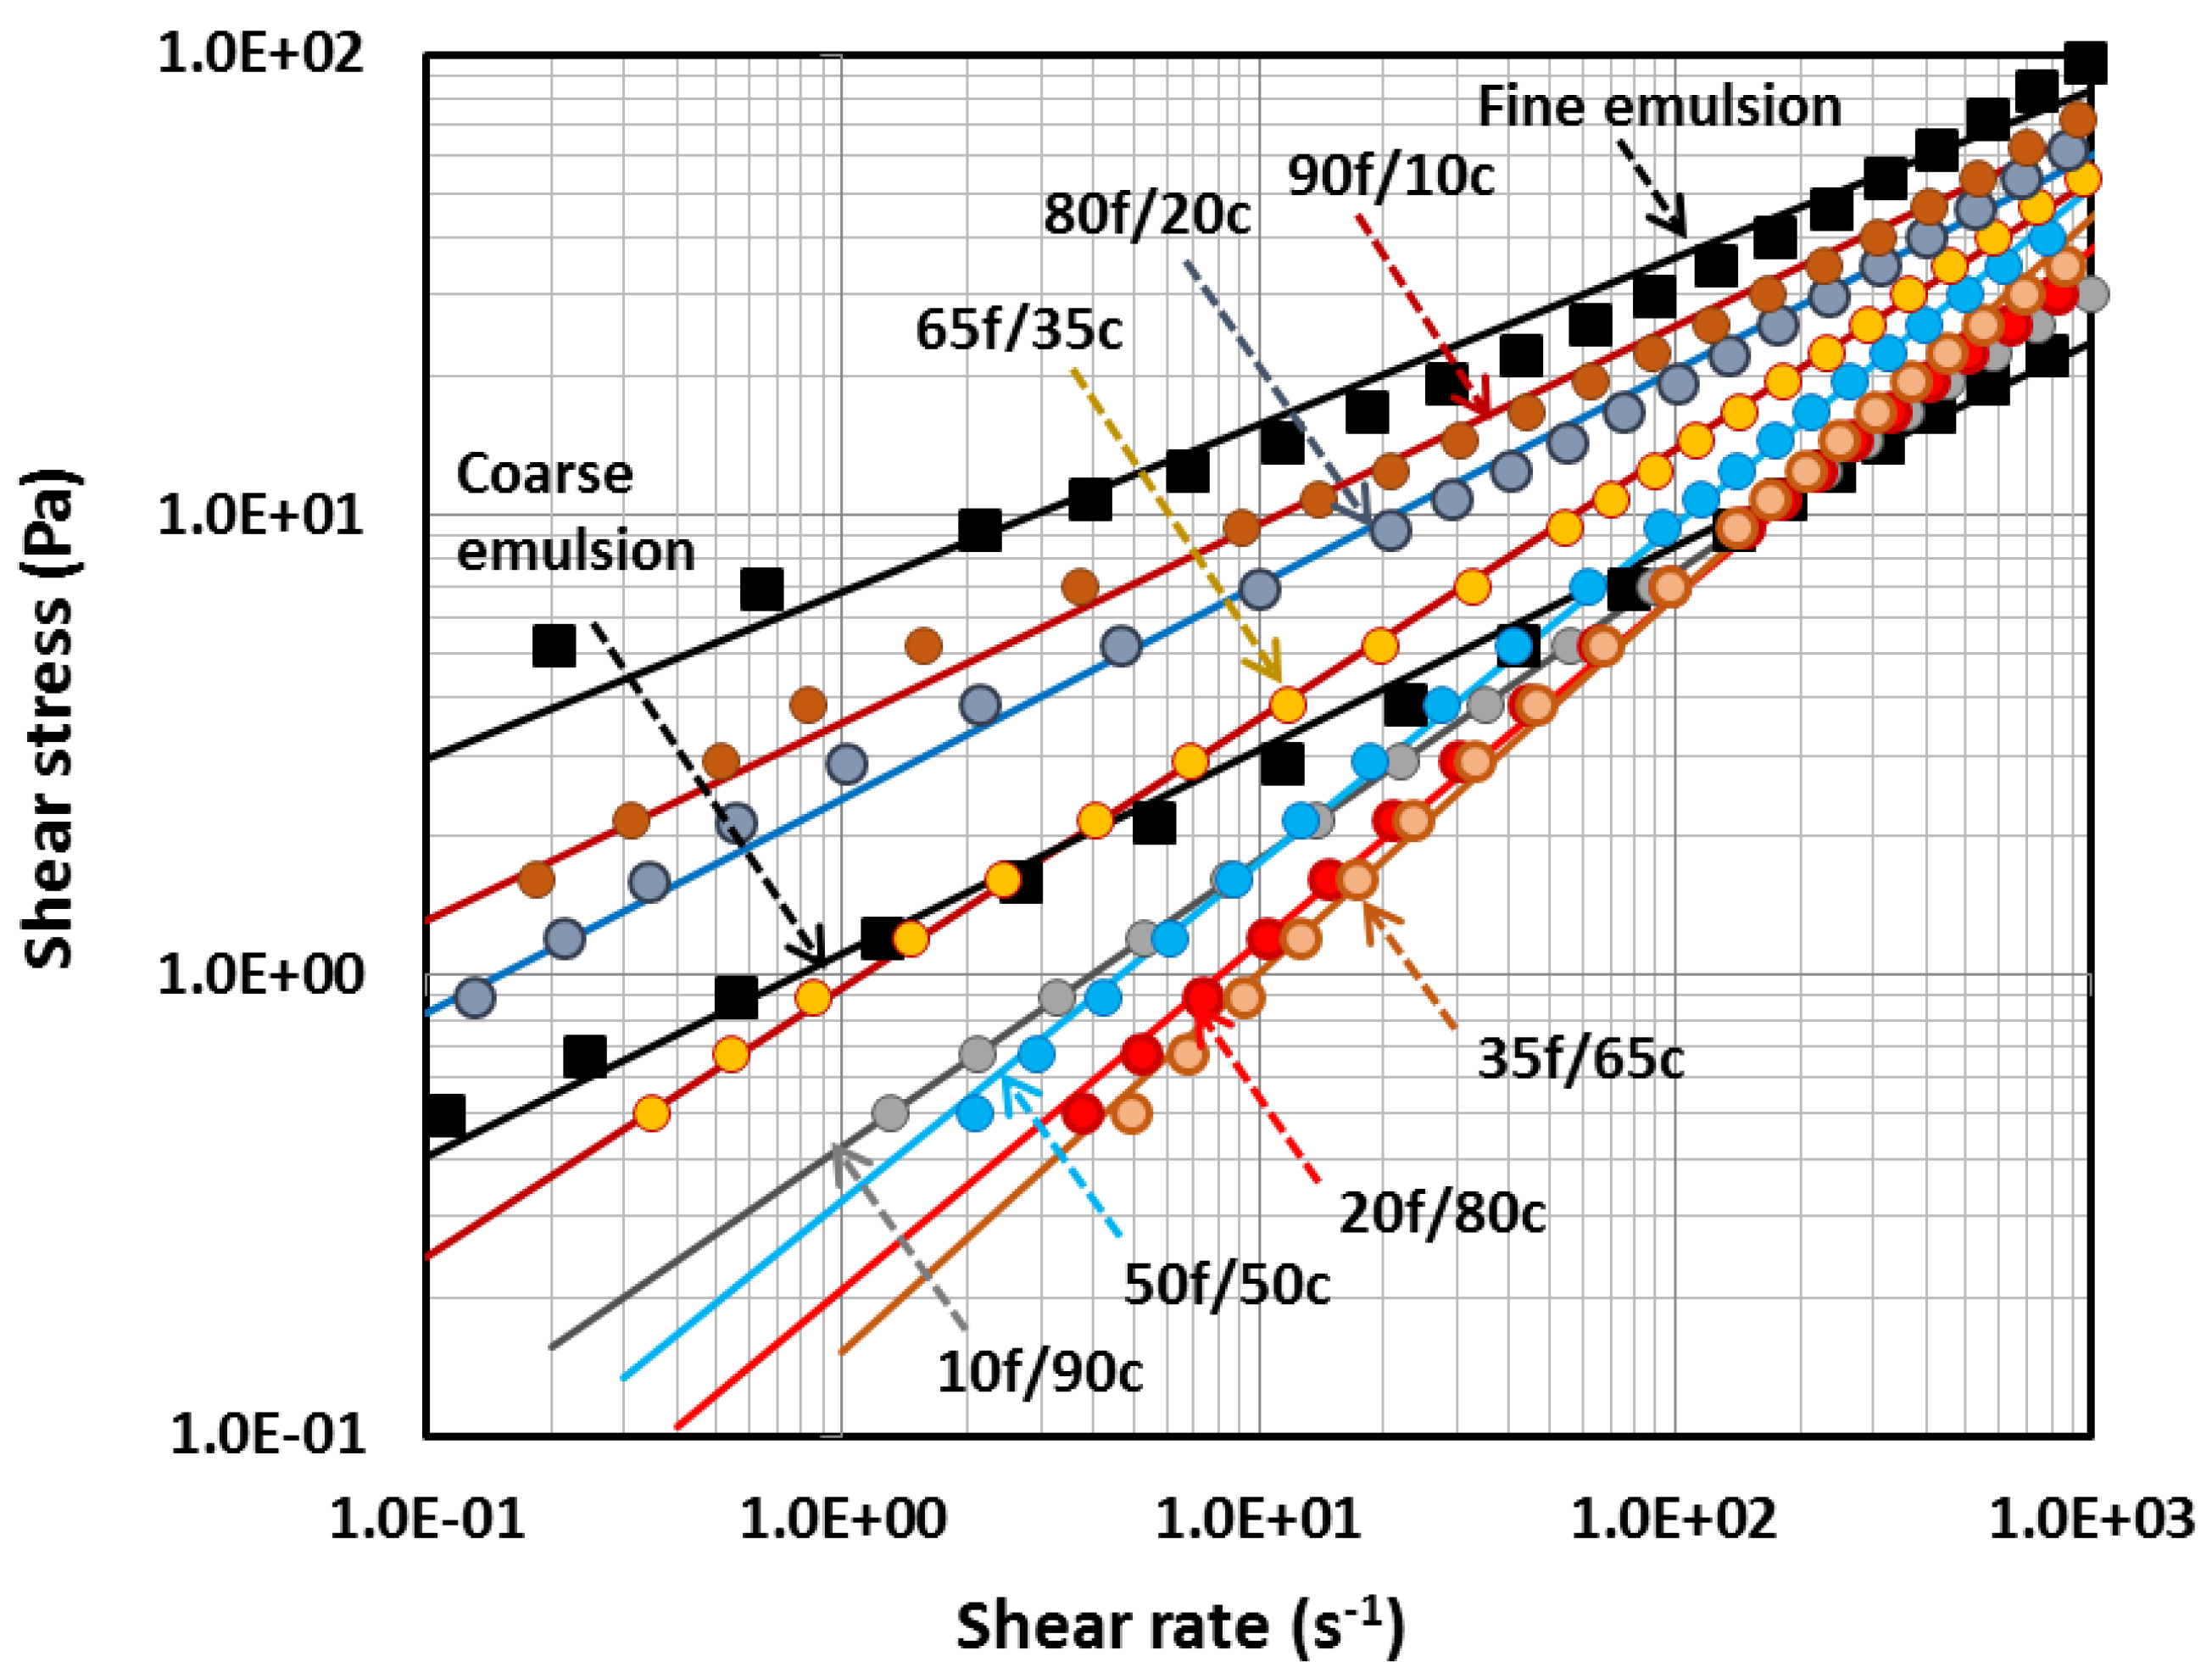
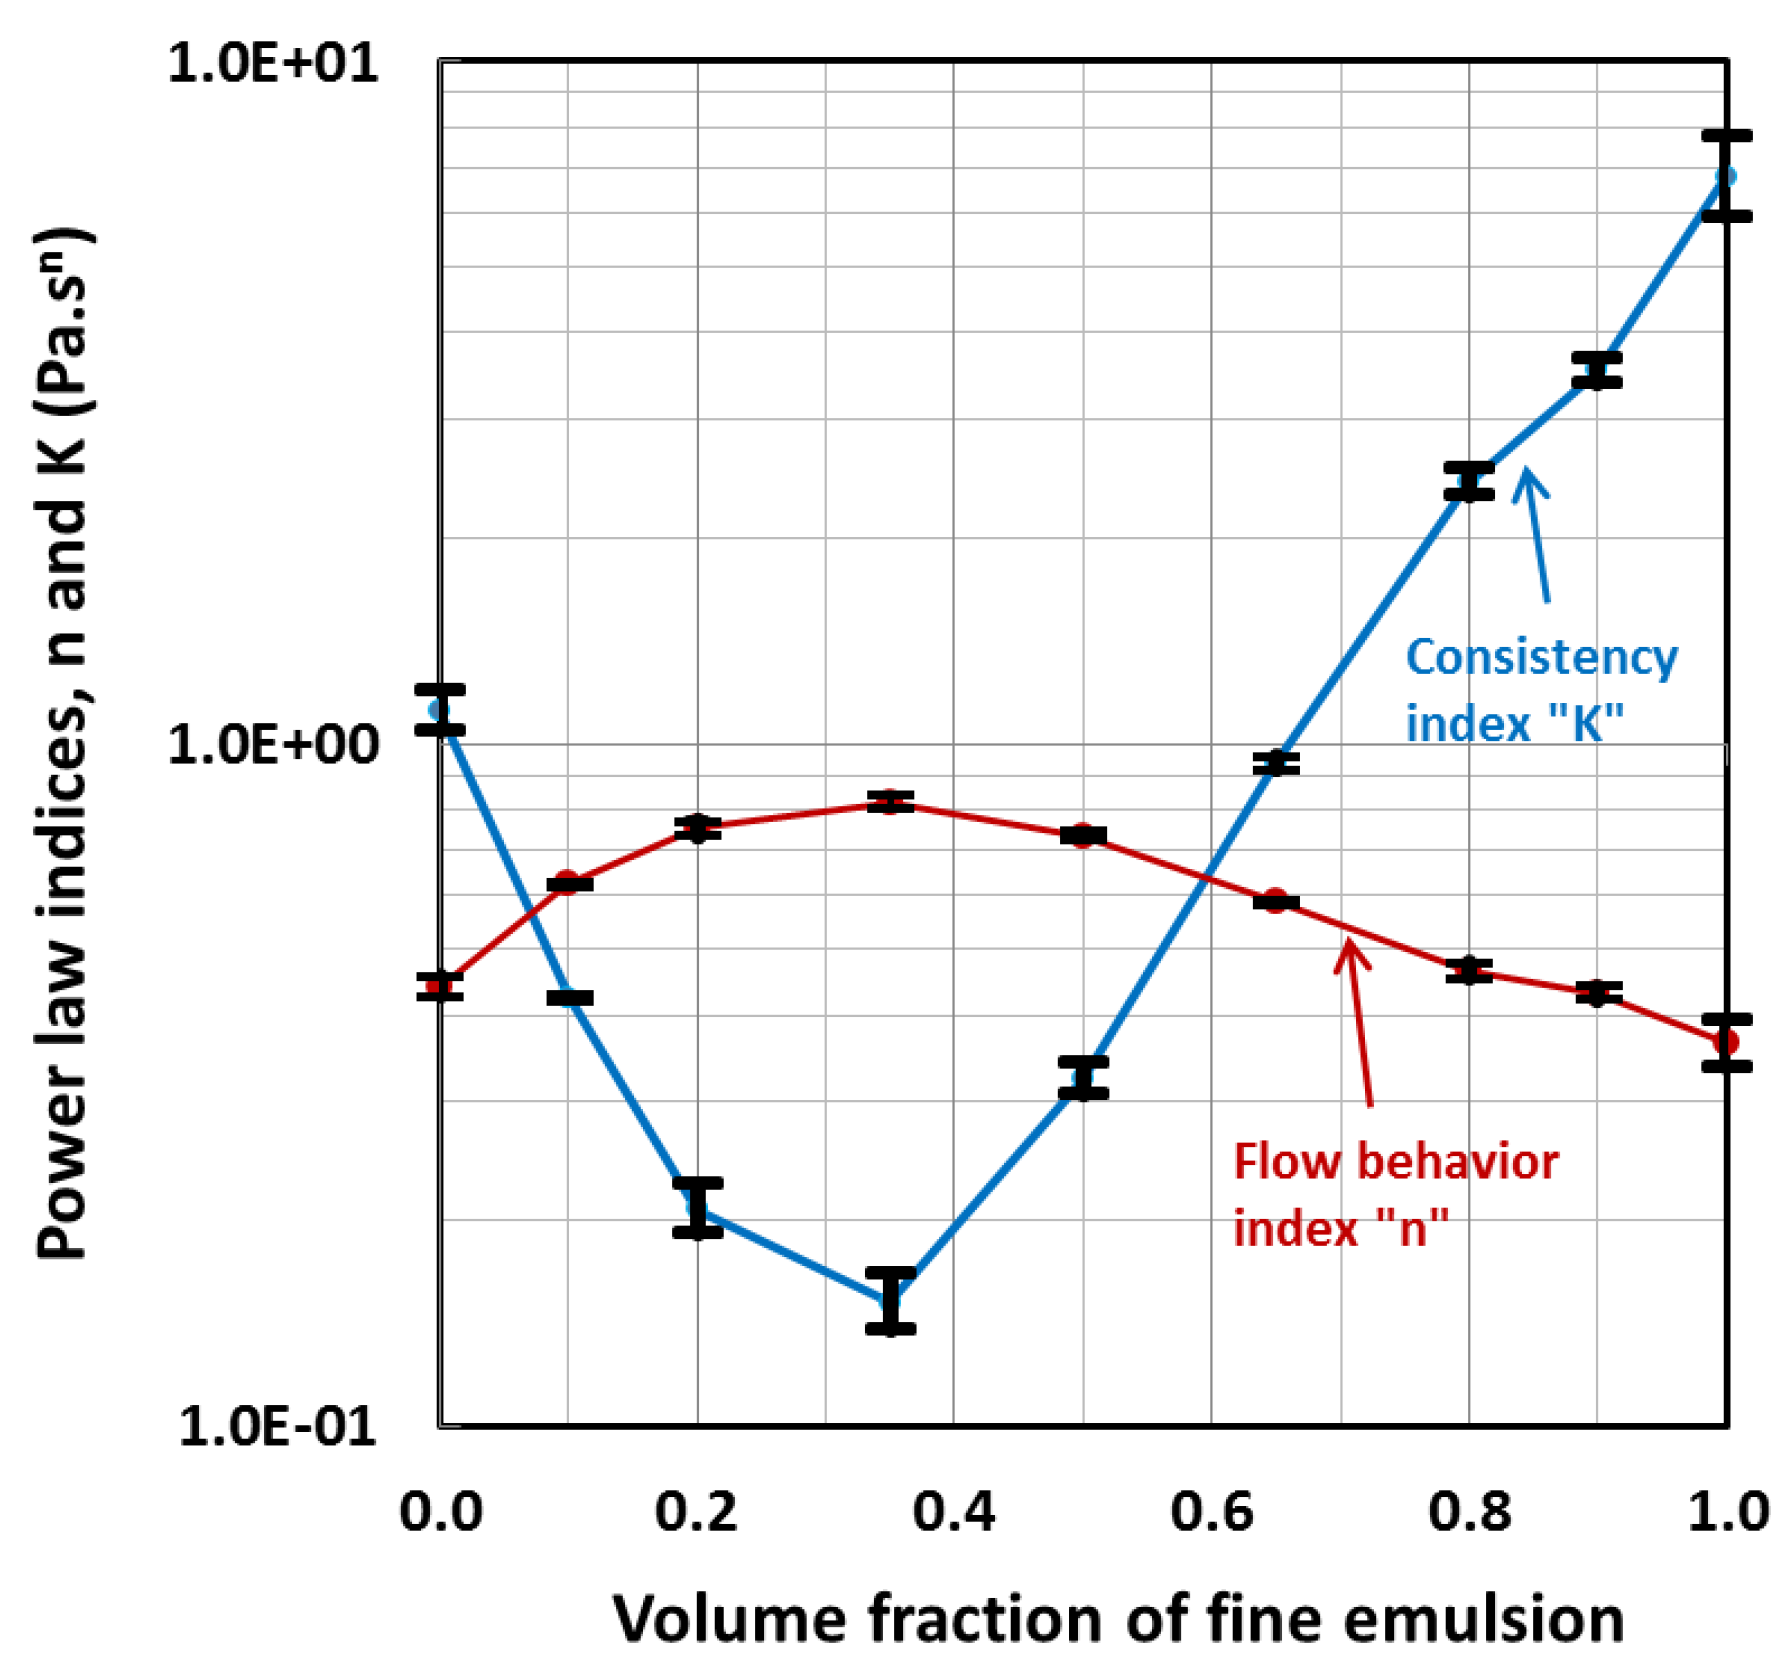
4.2. Rheology of Emulsions

Figure 4 shows the shear stress versus shear rate plots for fine and coarse emulsions and their mixtures, at a fixed ϕ (volume fraction of oil) of 0.745. The plots are almost linear on a log-log scale indicating that emulsions follow the power-law behavior:
τ = K γ ˙ n
where K and n are power-law constants. The slope of the plot, that is, n value, is 0.36 for the fine emulsion and 0.44 for the coarse emulsion. Thus, the coarse emulsion is less non-Newtonian or shear-thinning as compared with the fine emulsion. Table 1 summarizes the statistical information regarding the power-law fit of shear stress versus shear rate data for emulsions. Based on the information given in Table 1, it is clear that the power-law model is generally a reasonably good model to describe the shear stress—shear rate data of the emulsions shown in Figure 4. The only exception is the fine emulsion as in this case the power-law fits the data somewhat approximately.
An important point to note from Figure 4 is that the shear stress at any given shear rate is much higher for the fine emulsion indicating that the fine emulsion is much more viscous than the coarse emulsion. When the fine and coarse emulsions are mixed by adding fine emulsion progressively to the coarse emulsion, the slope of the shear stress versus shear rate increases initially with the increase in fine emulsion proportion of the mixed emulsion. For example, the n-value increases from 0.44 to 0.82 when the fine emulsion proportion of the mixed emulsion is increased from 0% to 35%. With further increase in fine emulsion content of the mixed emulsion, n decreases. The plots of power-law parameters (K and n) as functions of fine emulsion proportion of the mixed emulsion are shown in Figure 5. The power-law index “n” exhibits a maximum whereas the consistency index “K” exhibits a minimum at a fine emulsion proportion of 35%.

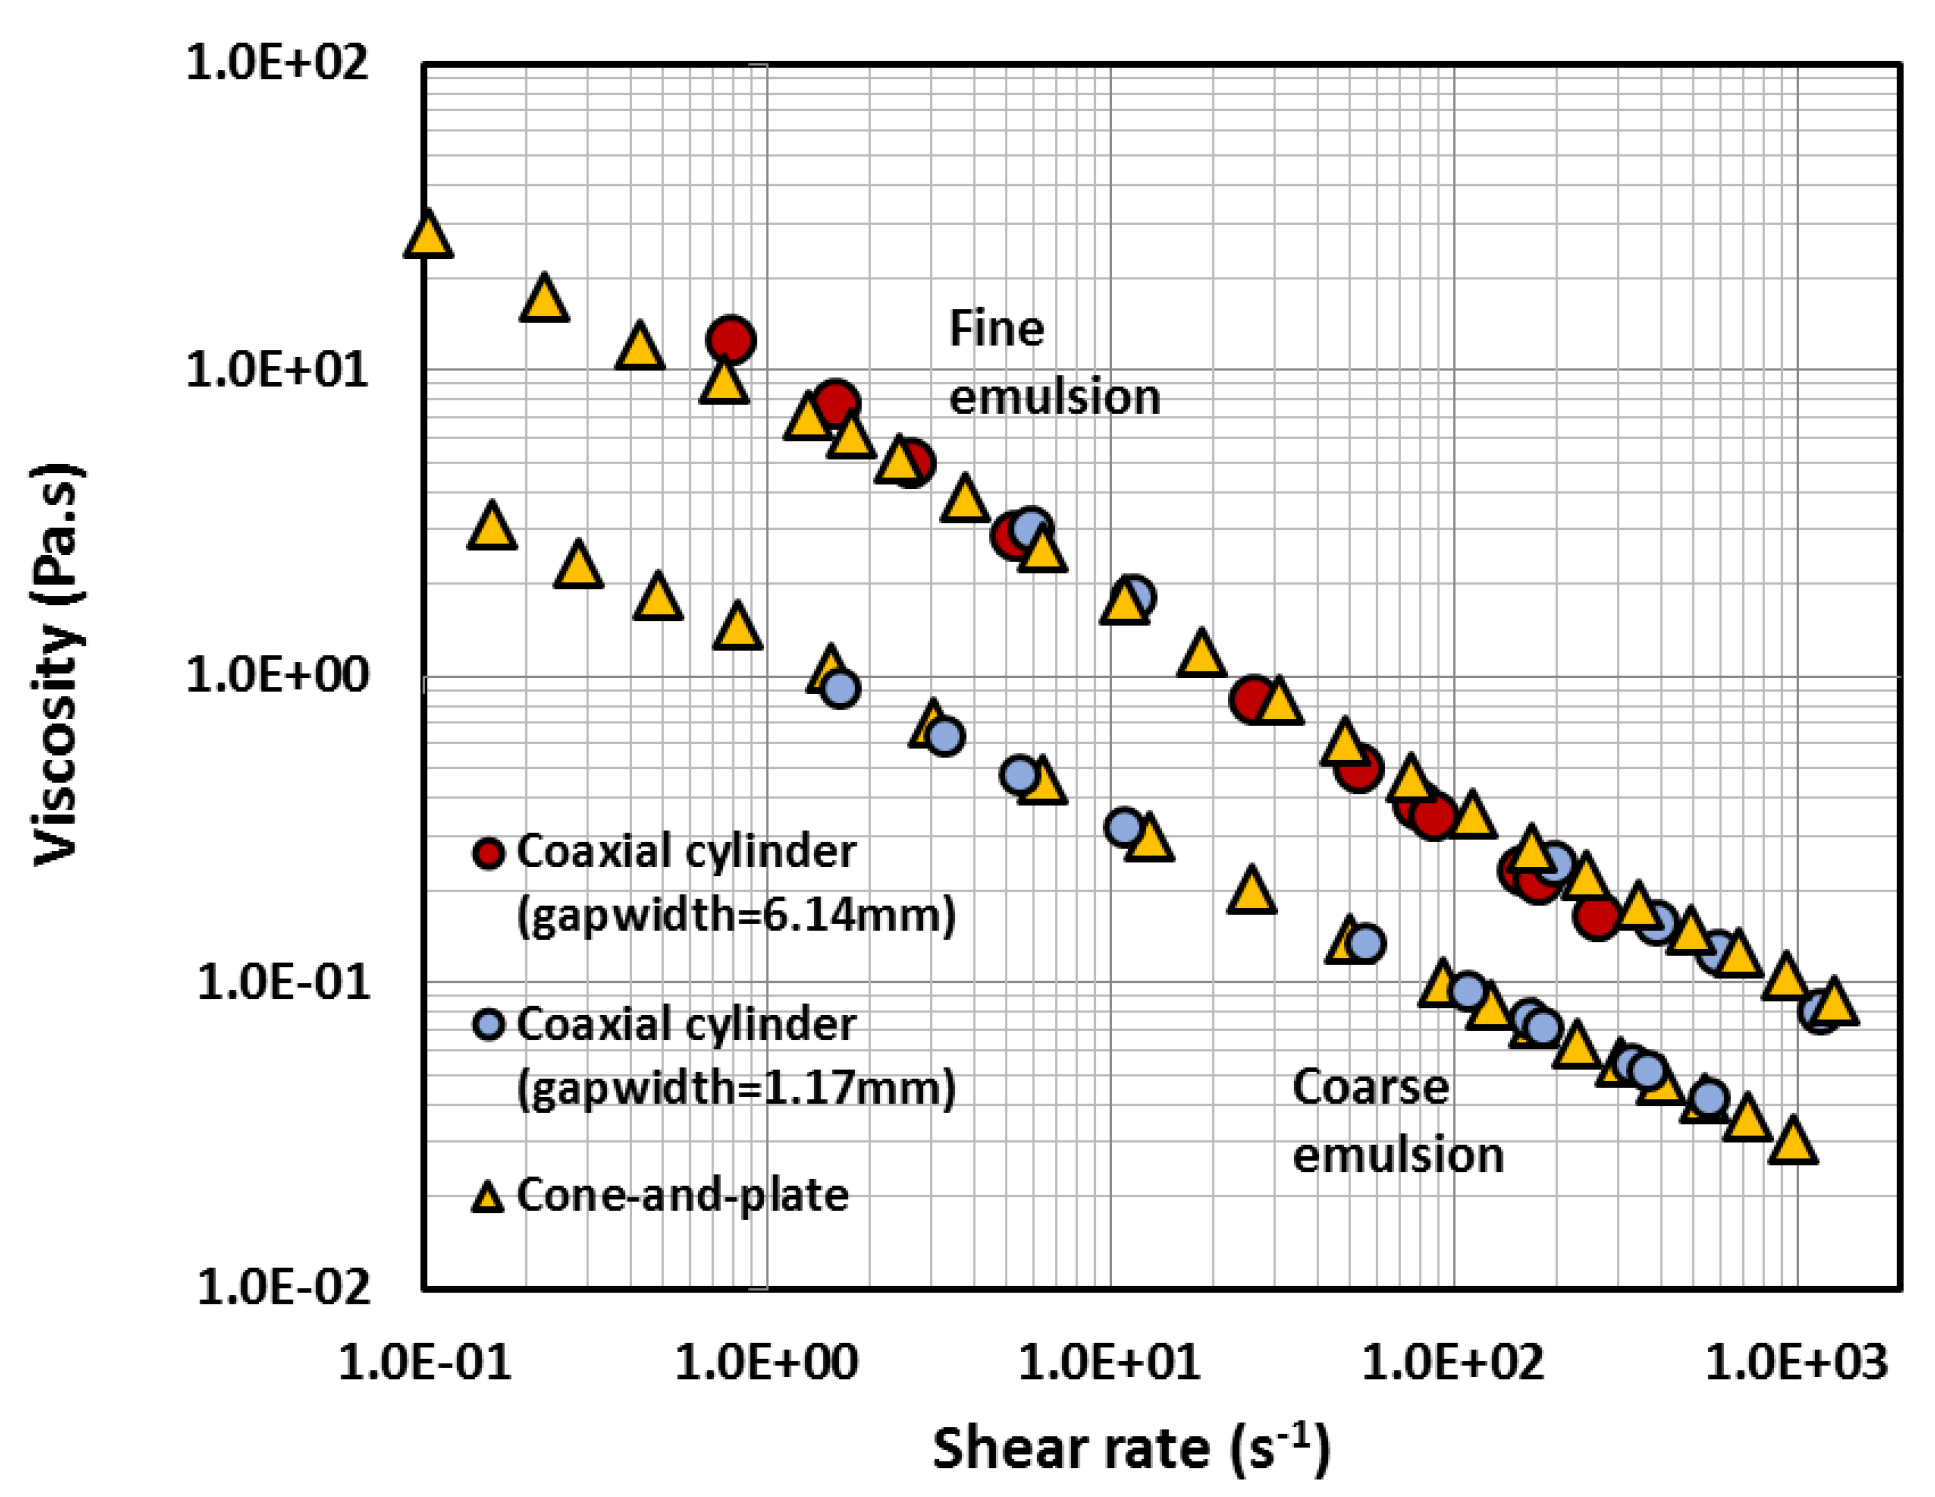
4.3. Reliability of Rheological Measurements

To check the reliability of the rheological measurements carried out in a cone and plate viscometer, some measurements were carried out in a co-axial cylinder viscometer as well. The same emulsion was tested in a cone-and-plate and co-axial cylinder viscometer. Figure 6 compares the rheological data obtained for the fine and coarse emulsions using different instruments. The data obtained from coaxial cylinder viscometer using two different gap-widths almost overlaps with the data obtained from the cone-and-plate viscometer. Thus, the rheological data obtained from the cone-and-plate viscometer are reliable.

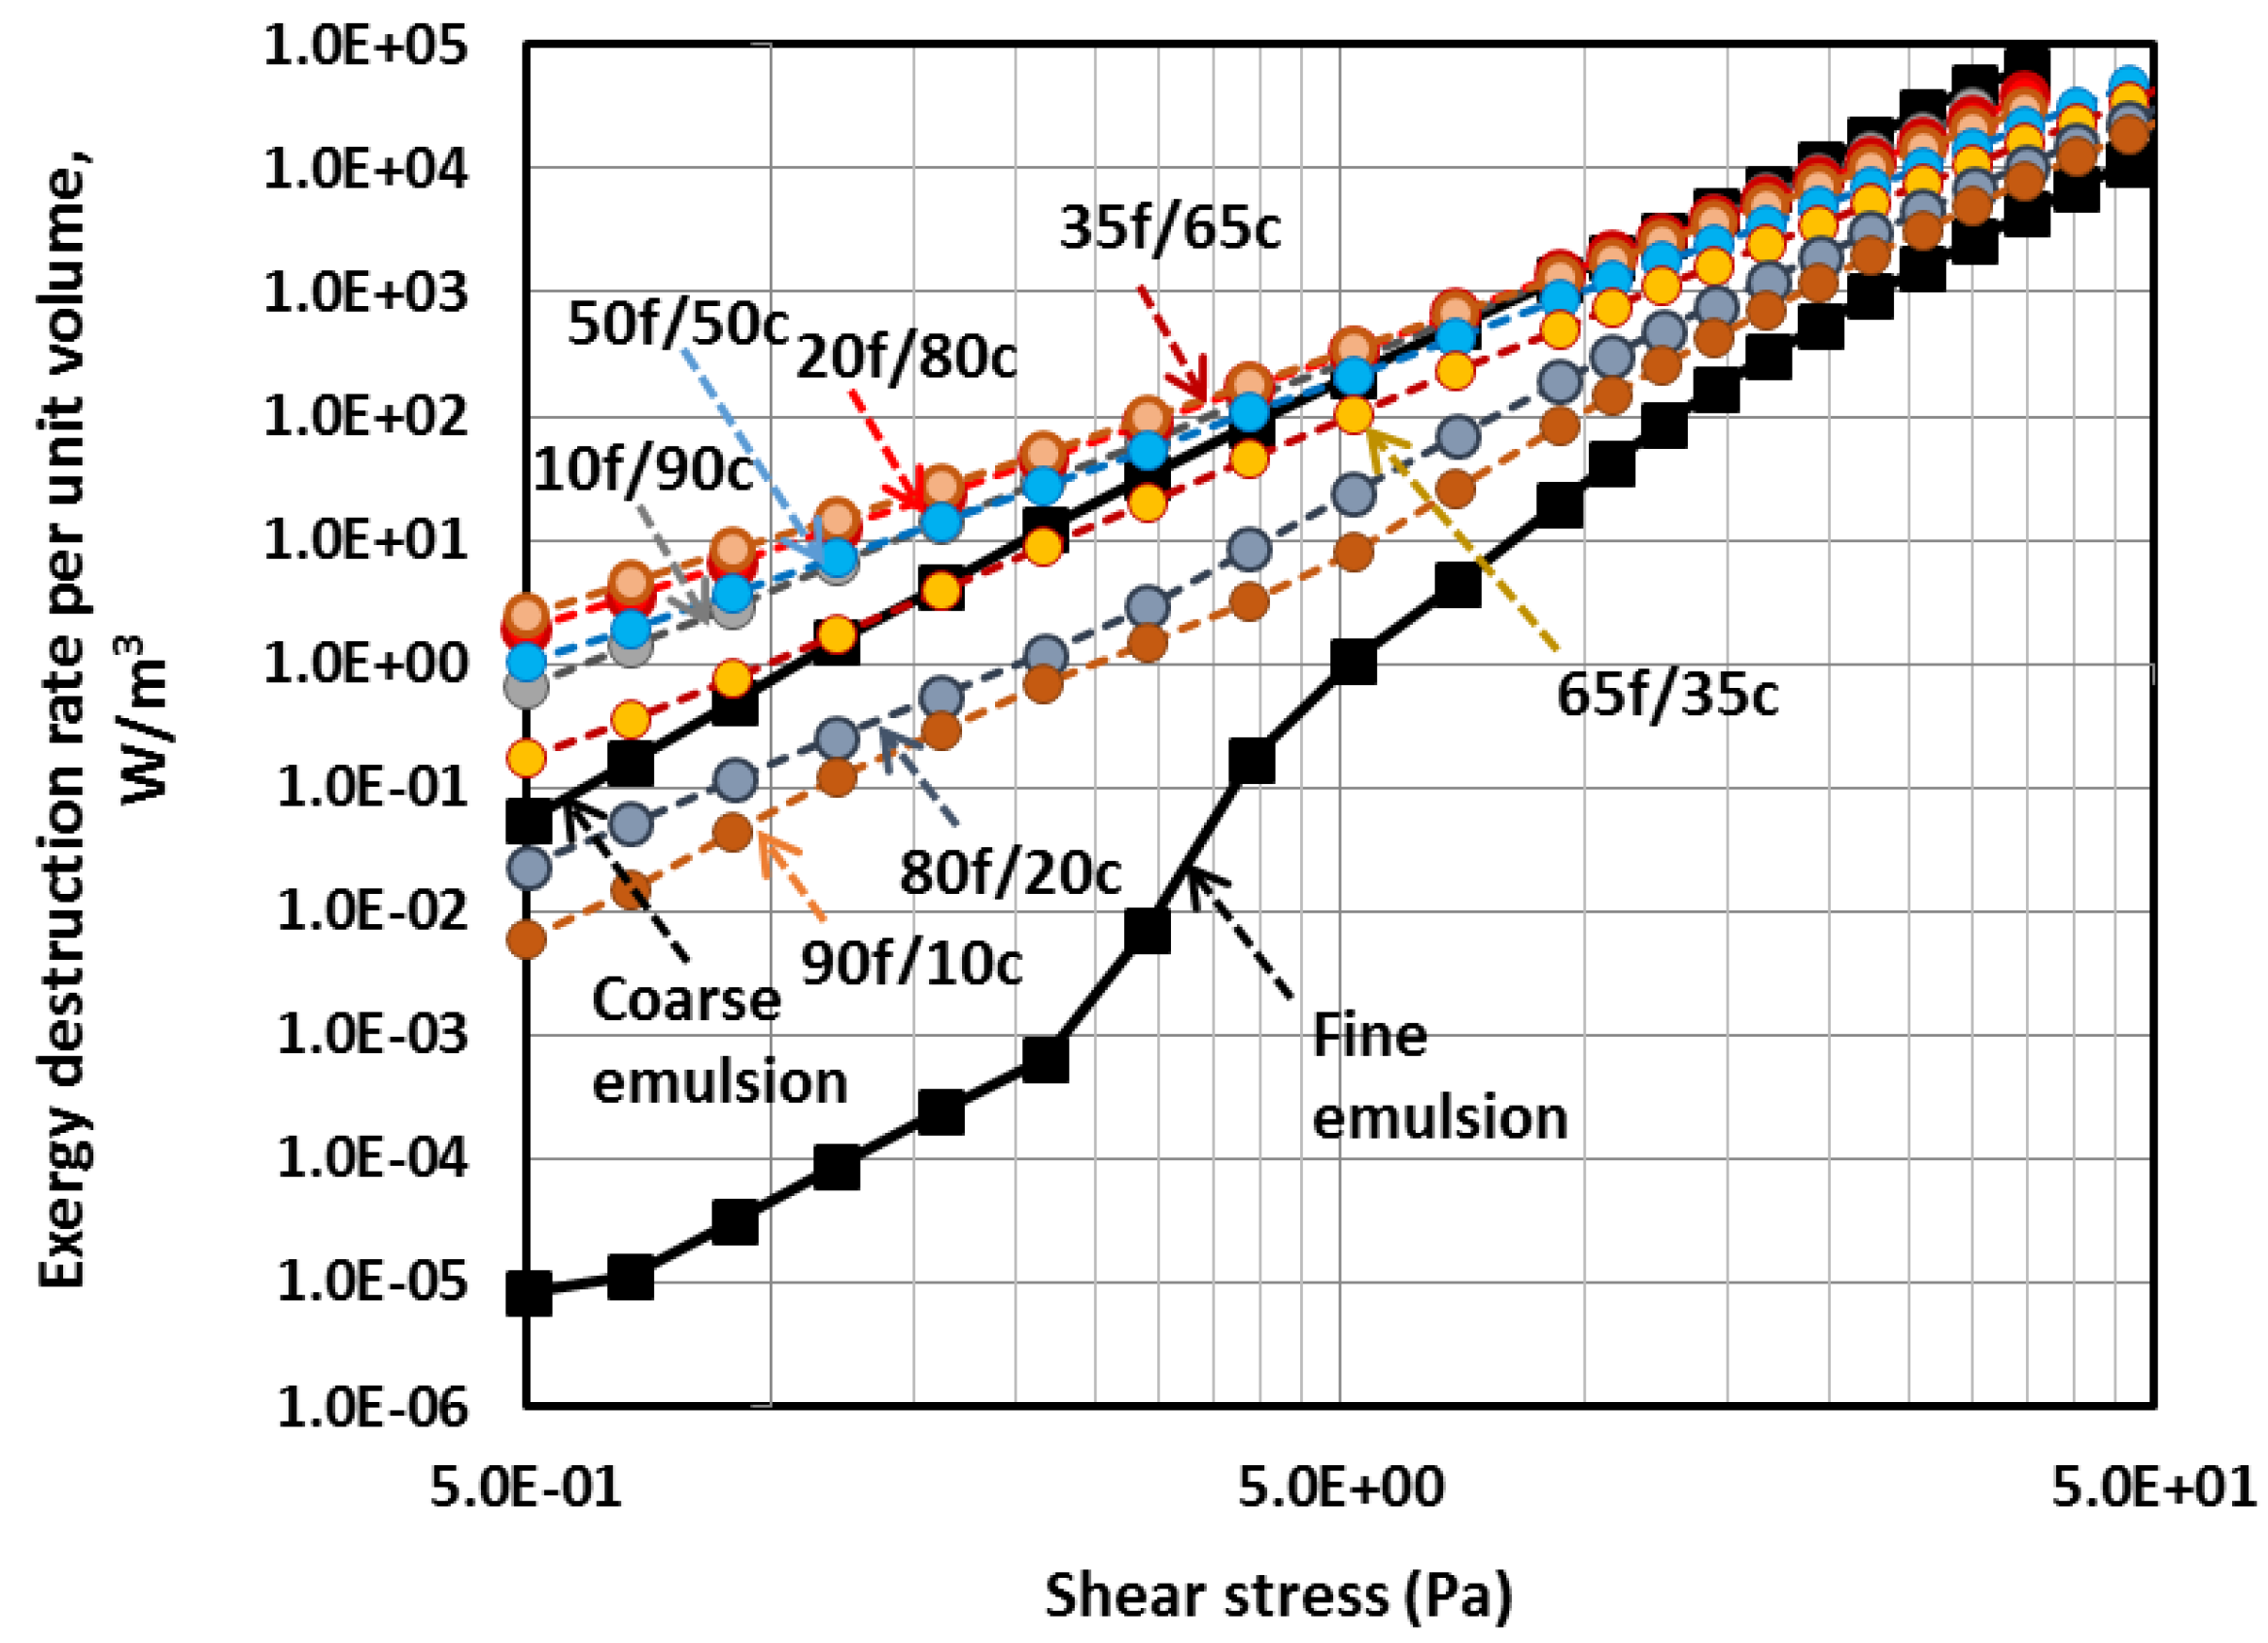
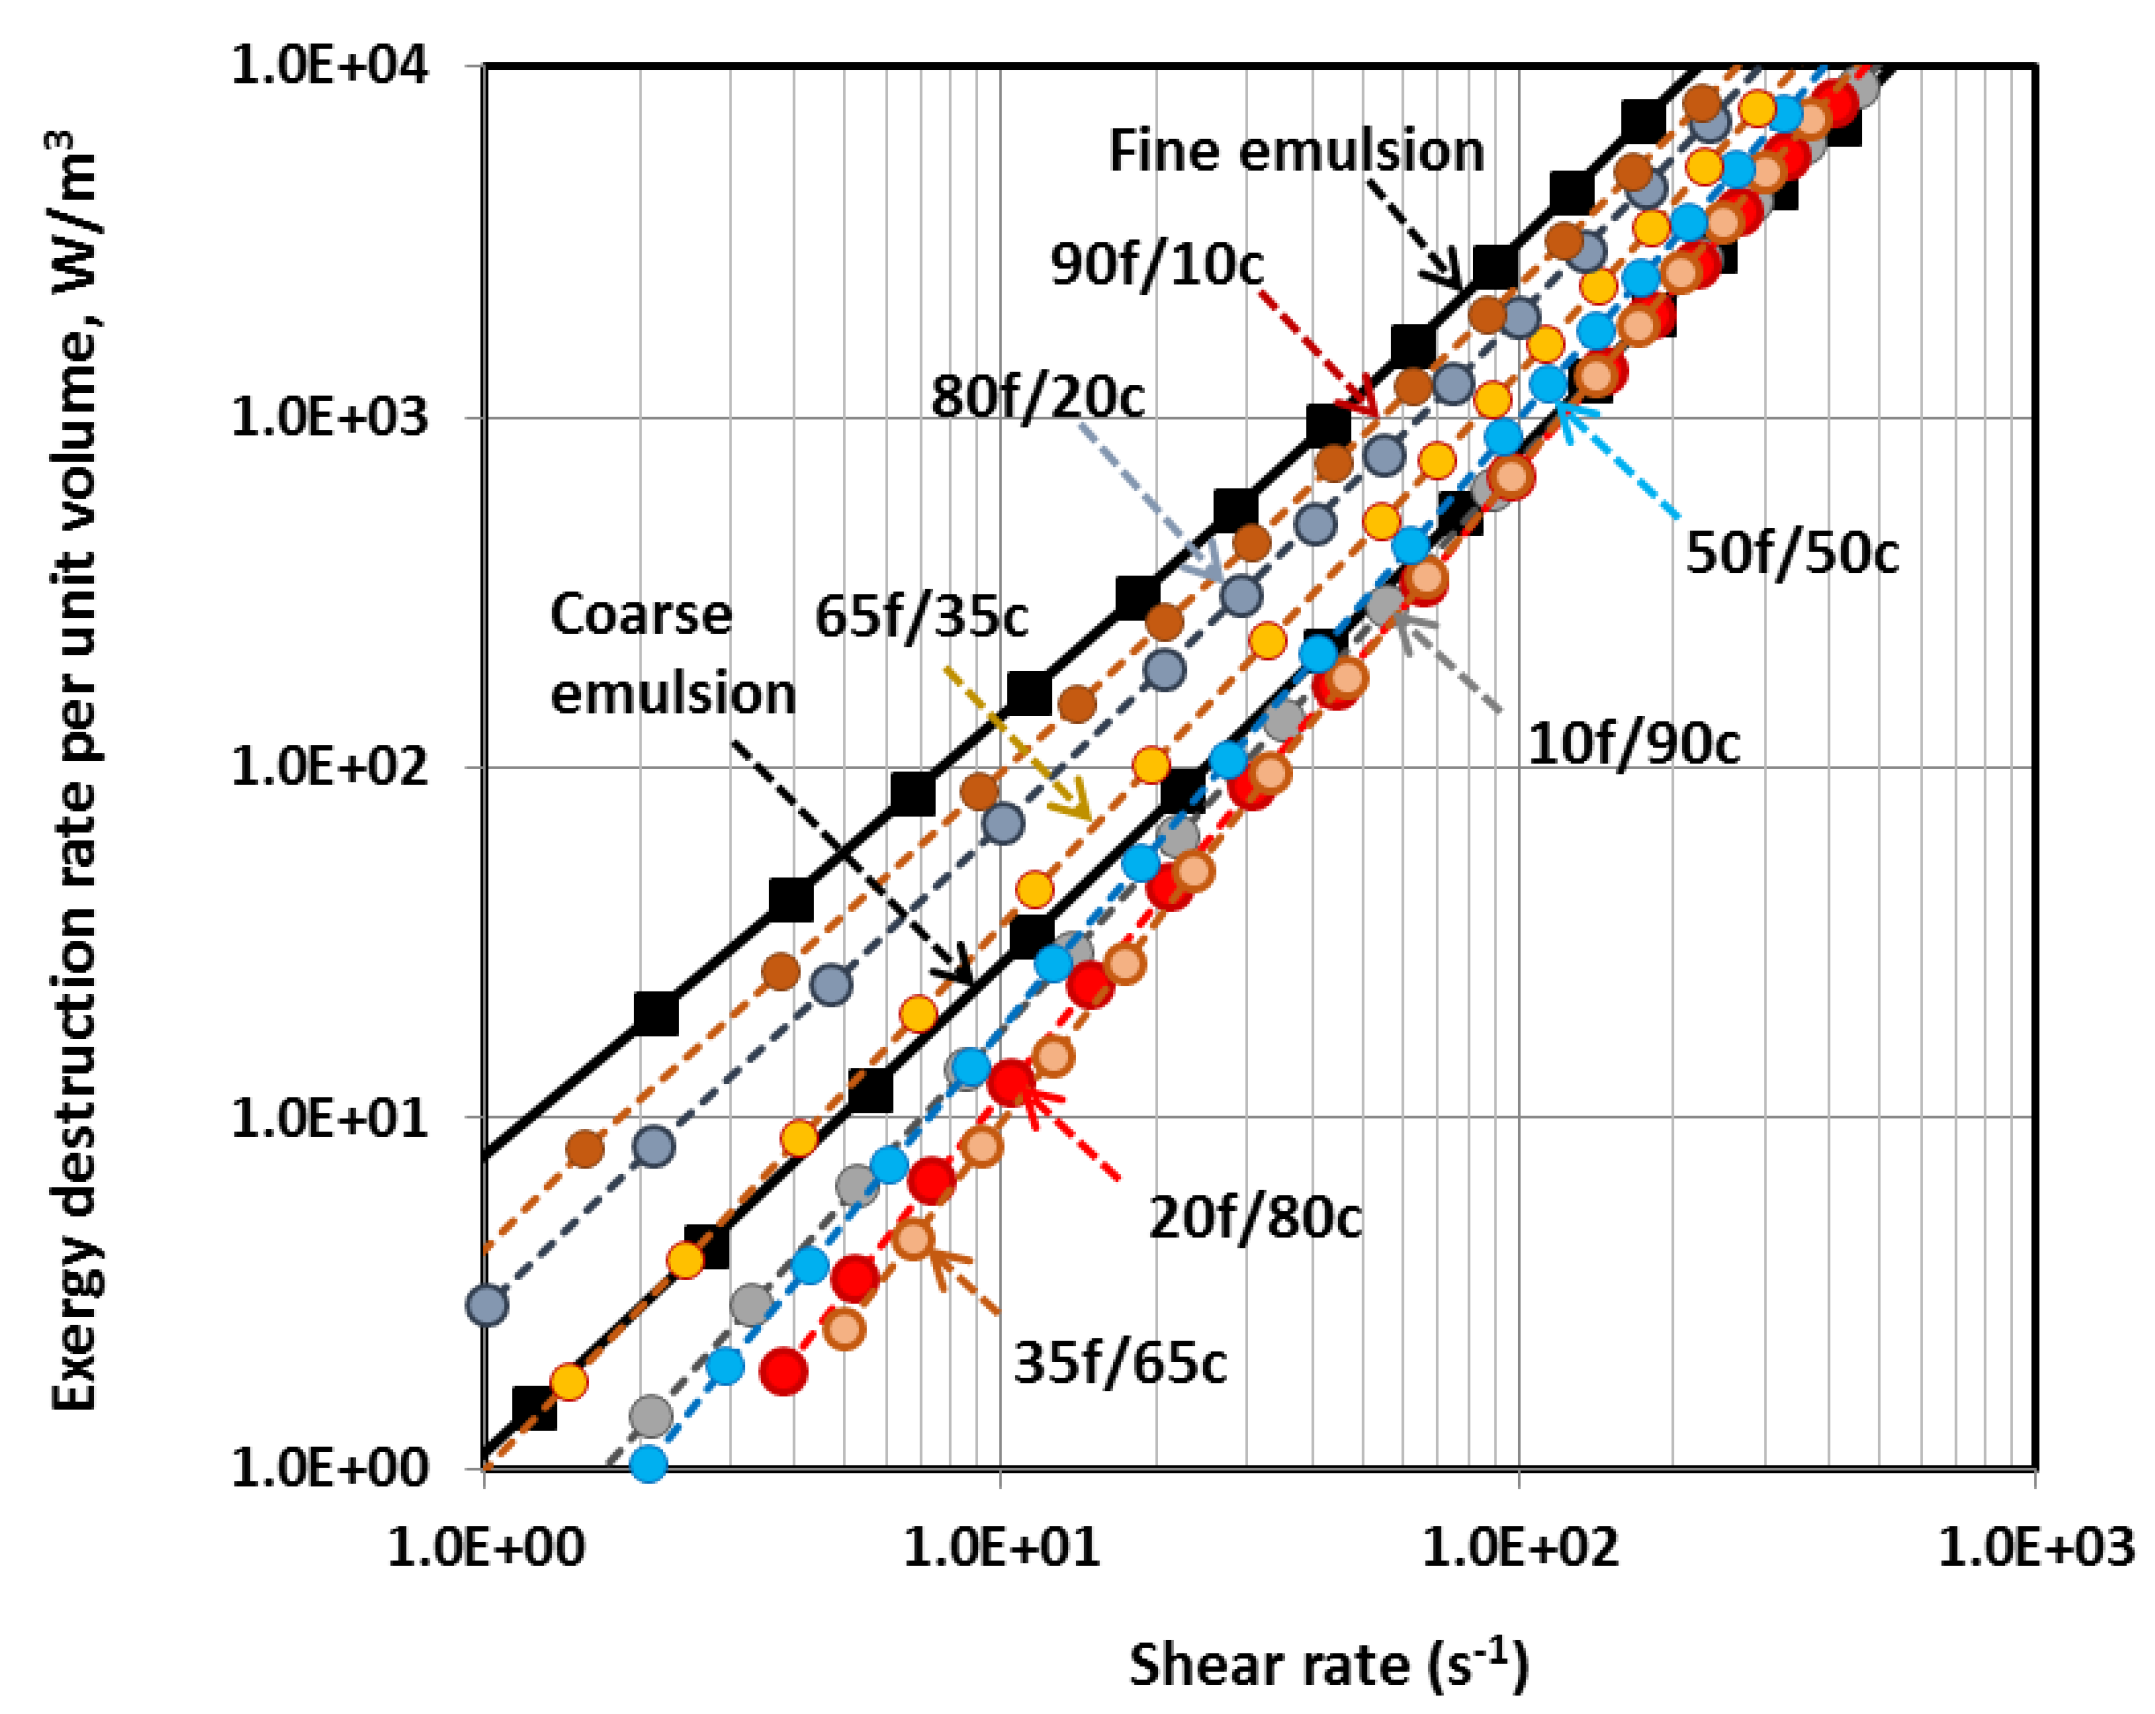
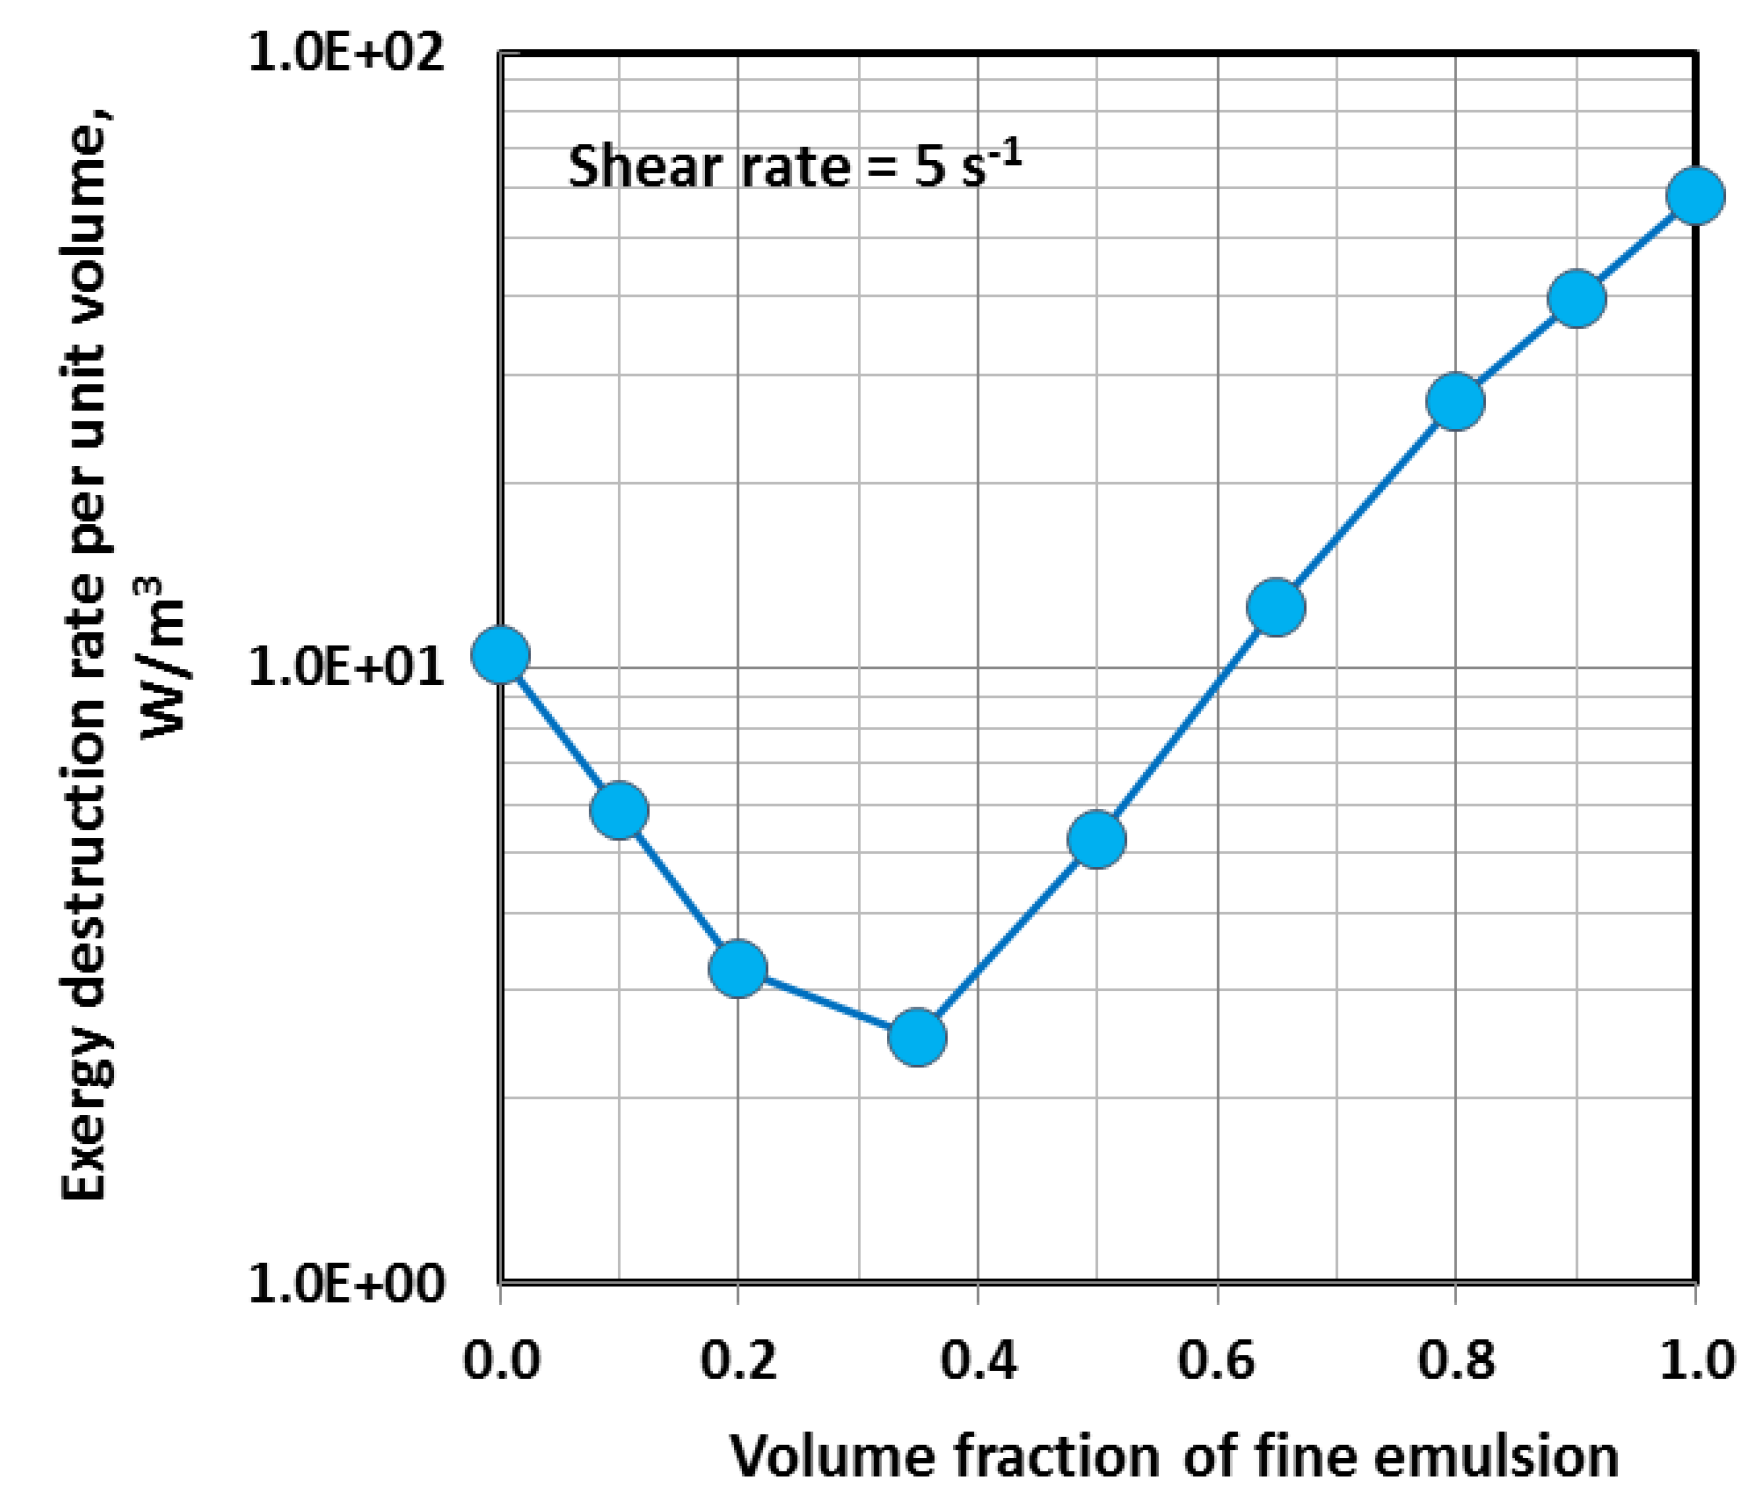
4.4. Exergy Destruction in Emulsions

The exergy destruction rate per unit volume of the emulsion, that is, ψ ˙ D , is calculated from shear stress-shear rate data using Equation (13). In the present work, the surroundings temperature is taken to be 25 °C, that is, T = To = 298.15 K. Figure 7 shows the plots of exergy destruction rate per unit volume of emulsion ( ψ ˙ D ) as functions of shear stress. For any given shear stress, the exergy destruction rate is the lowest in fine emulsion. The exergy destruction rate is much higher in the case of coarse emulsion. This appears to be counter-intuitive as fine emulsion is much more viscous and energy dissipative in comparison with the coarse emulsion. The main reason for this apparent contradiction is that the shear rate in coarse emulsion is much higher than that in the fine emulsion when comparison is made at the same shear stress. Therefore it is more appropriate to compare exergy destruction rates in different emulsions at the same shear rate (instead of the same shear stress). To that end, the data of Figure 7 are re-plotted in Figure 8 as ψ ˙ D versus shear rate. Now the exergy destruction rate in fine emulsion is the highest as expected.
In terms of pumping of emulsion through a pipeline, it can be stated that for the same pressure drop (that is, same shear stress), the flow rate of coarse emulsion will be much higher than that of the fine emulsion. As exergy destruction rate represents the product of pressure drop and flow rate, the exergy destruction rate is therefore expected to be much higher in the case of the coarse emulsion as exhibited in Figure 7. When the comparison is made at the same flow rate (that is, same shear rate), the fine emulsion is expected to give a much higher pressure drop, and hence a much higher rate of exergy destruction, as compared with the coarse emulsion as indicated in Figure 8.
Figure 9 shows the plots of shear rate and exergy destruction rate for mixed fine and coarse emulsions at a fixed shear stress of 0.5 Pa. Both shear rate and exergy destruction rate reach a maximum value at a fine emulsion proportion of about 35%. It should be noted that the shear rate and exergy destruction rate in coarse emulsion are higher than the corresponding values for the fine emulsion at a given stress (0.5 Pa), as pointed out earlier. However, when comparison is made at the same shear rate as shown in Figure 10, the exergy destruction rate in fine emulsion is higher than that in the coarse emulsion. Furthermore, a minimum (instead of maximum) in exergy destruction rate is observed at a fine emulsion proportion of about 35% when comparison is made at the same shear rate.

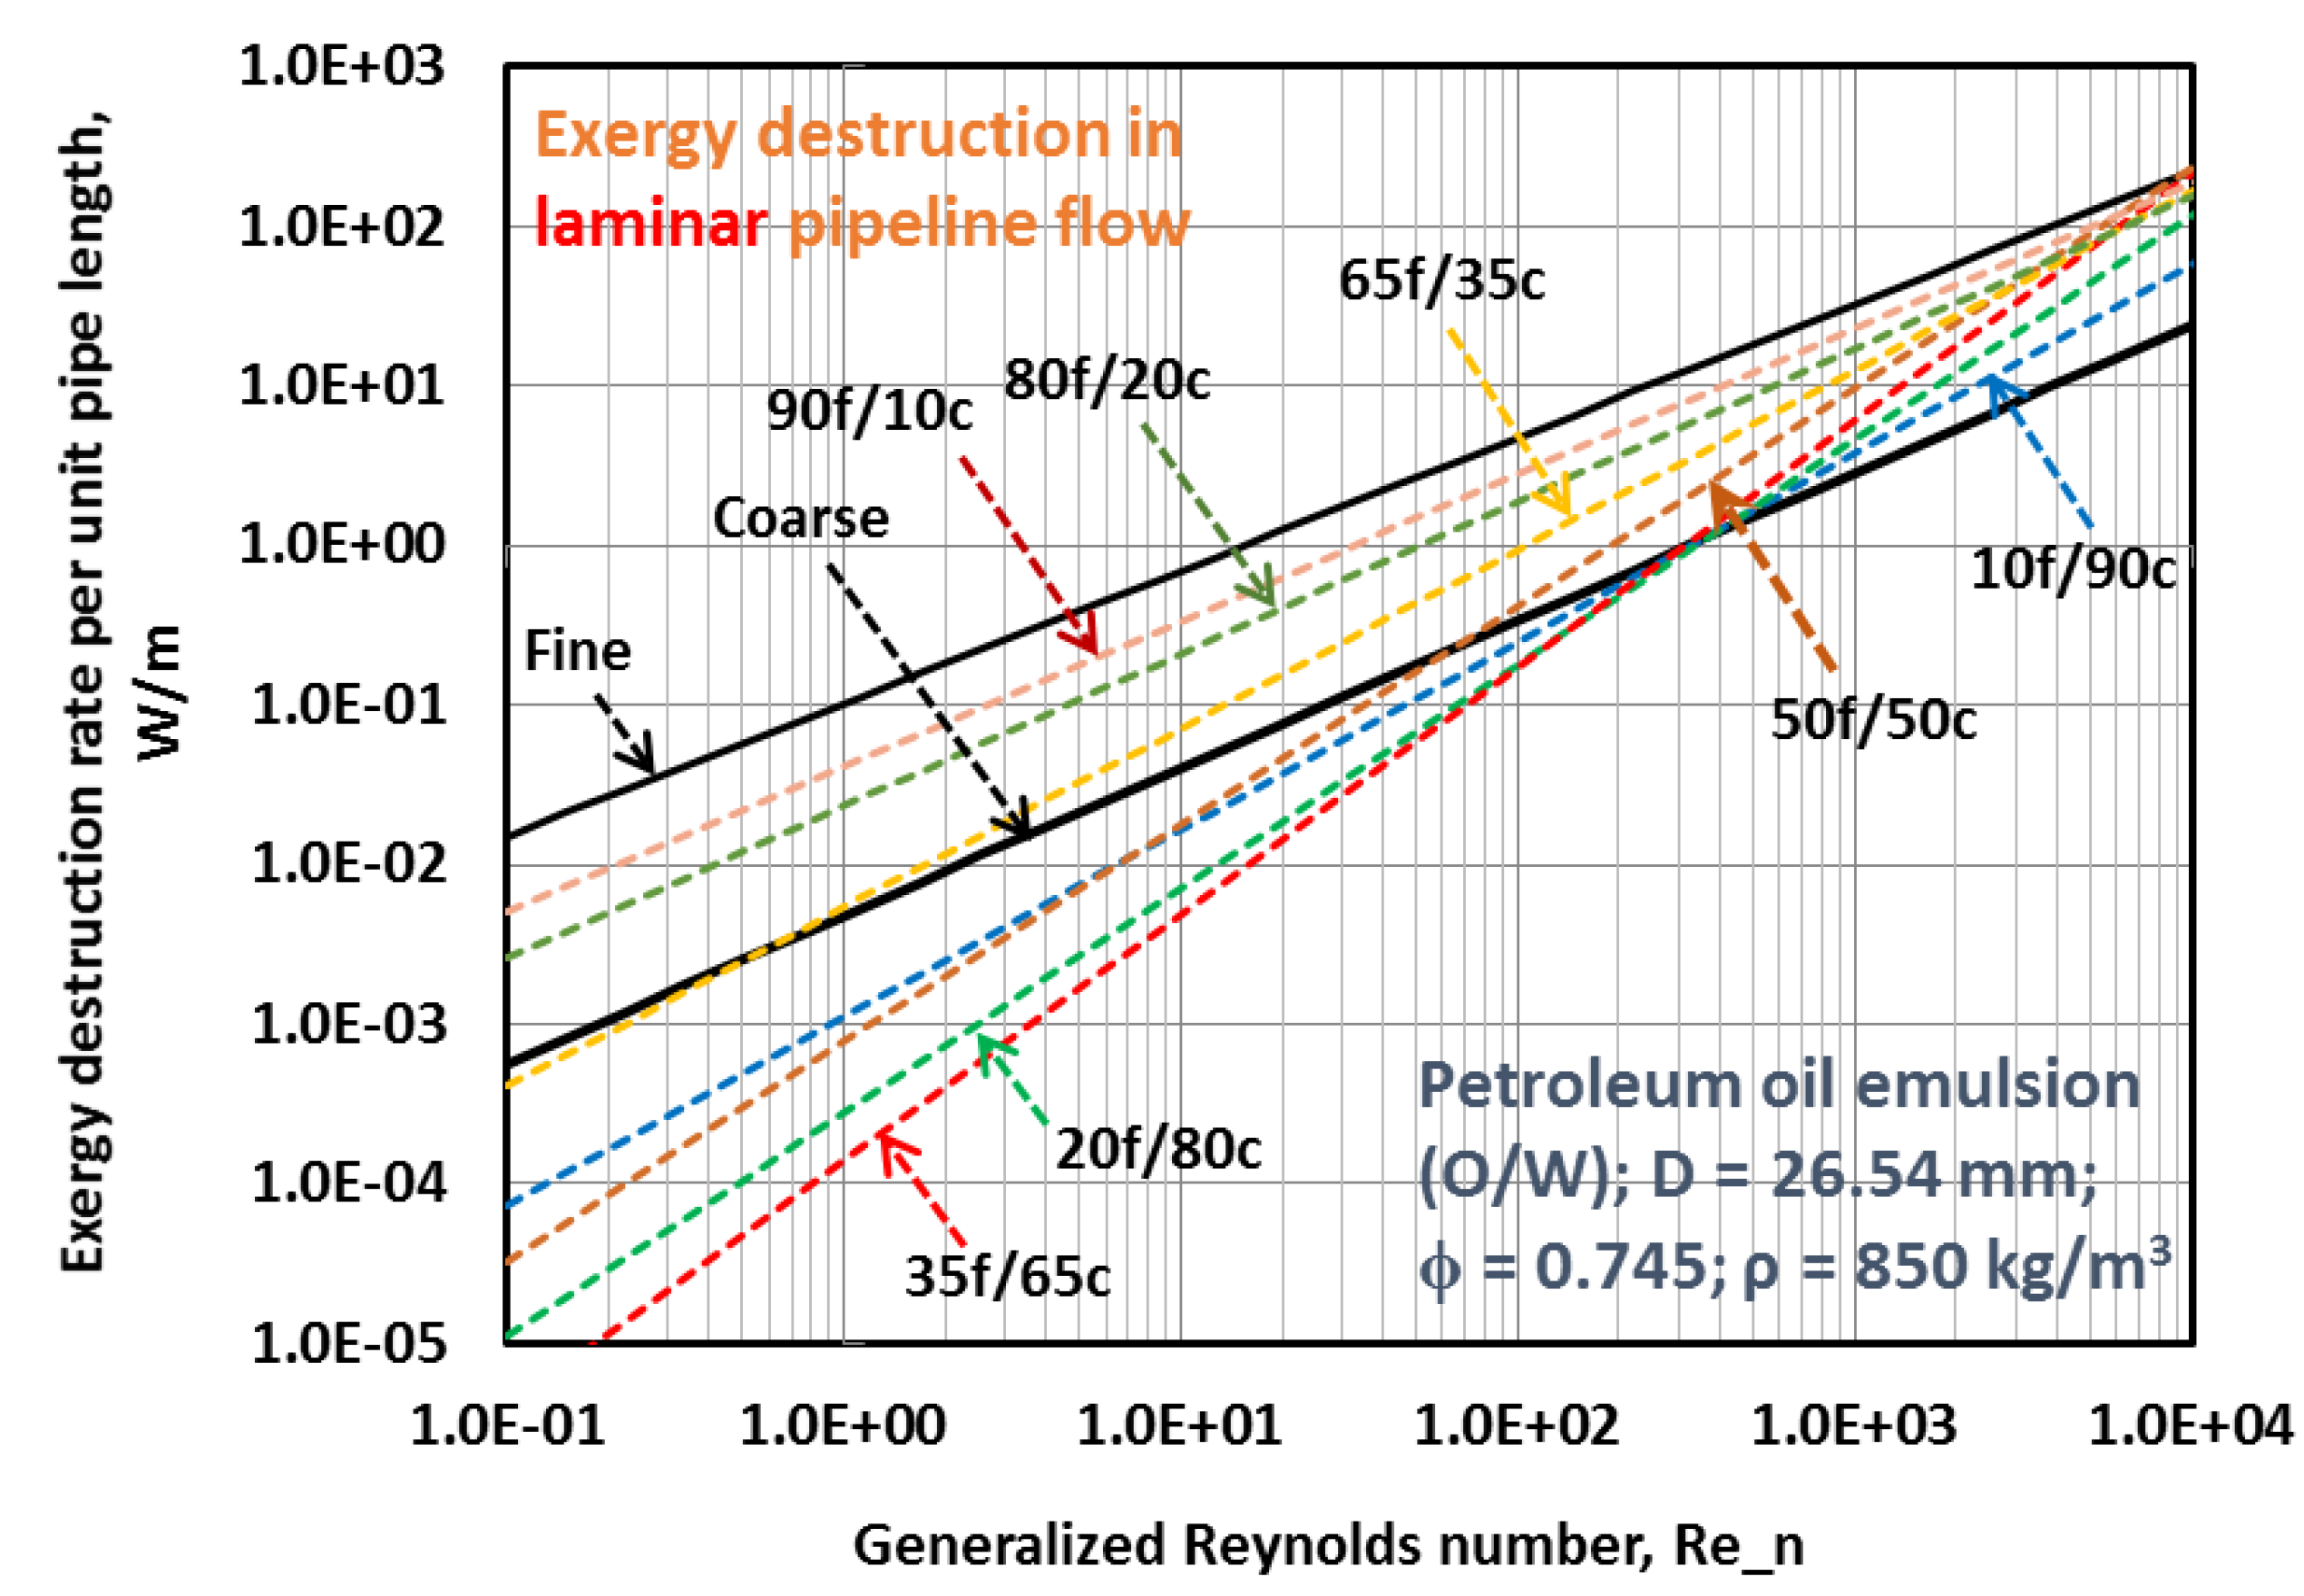
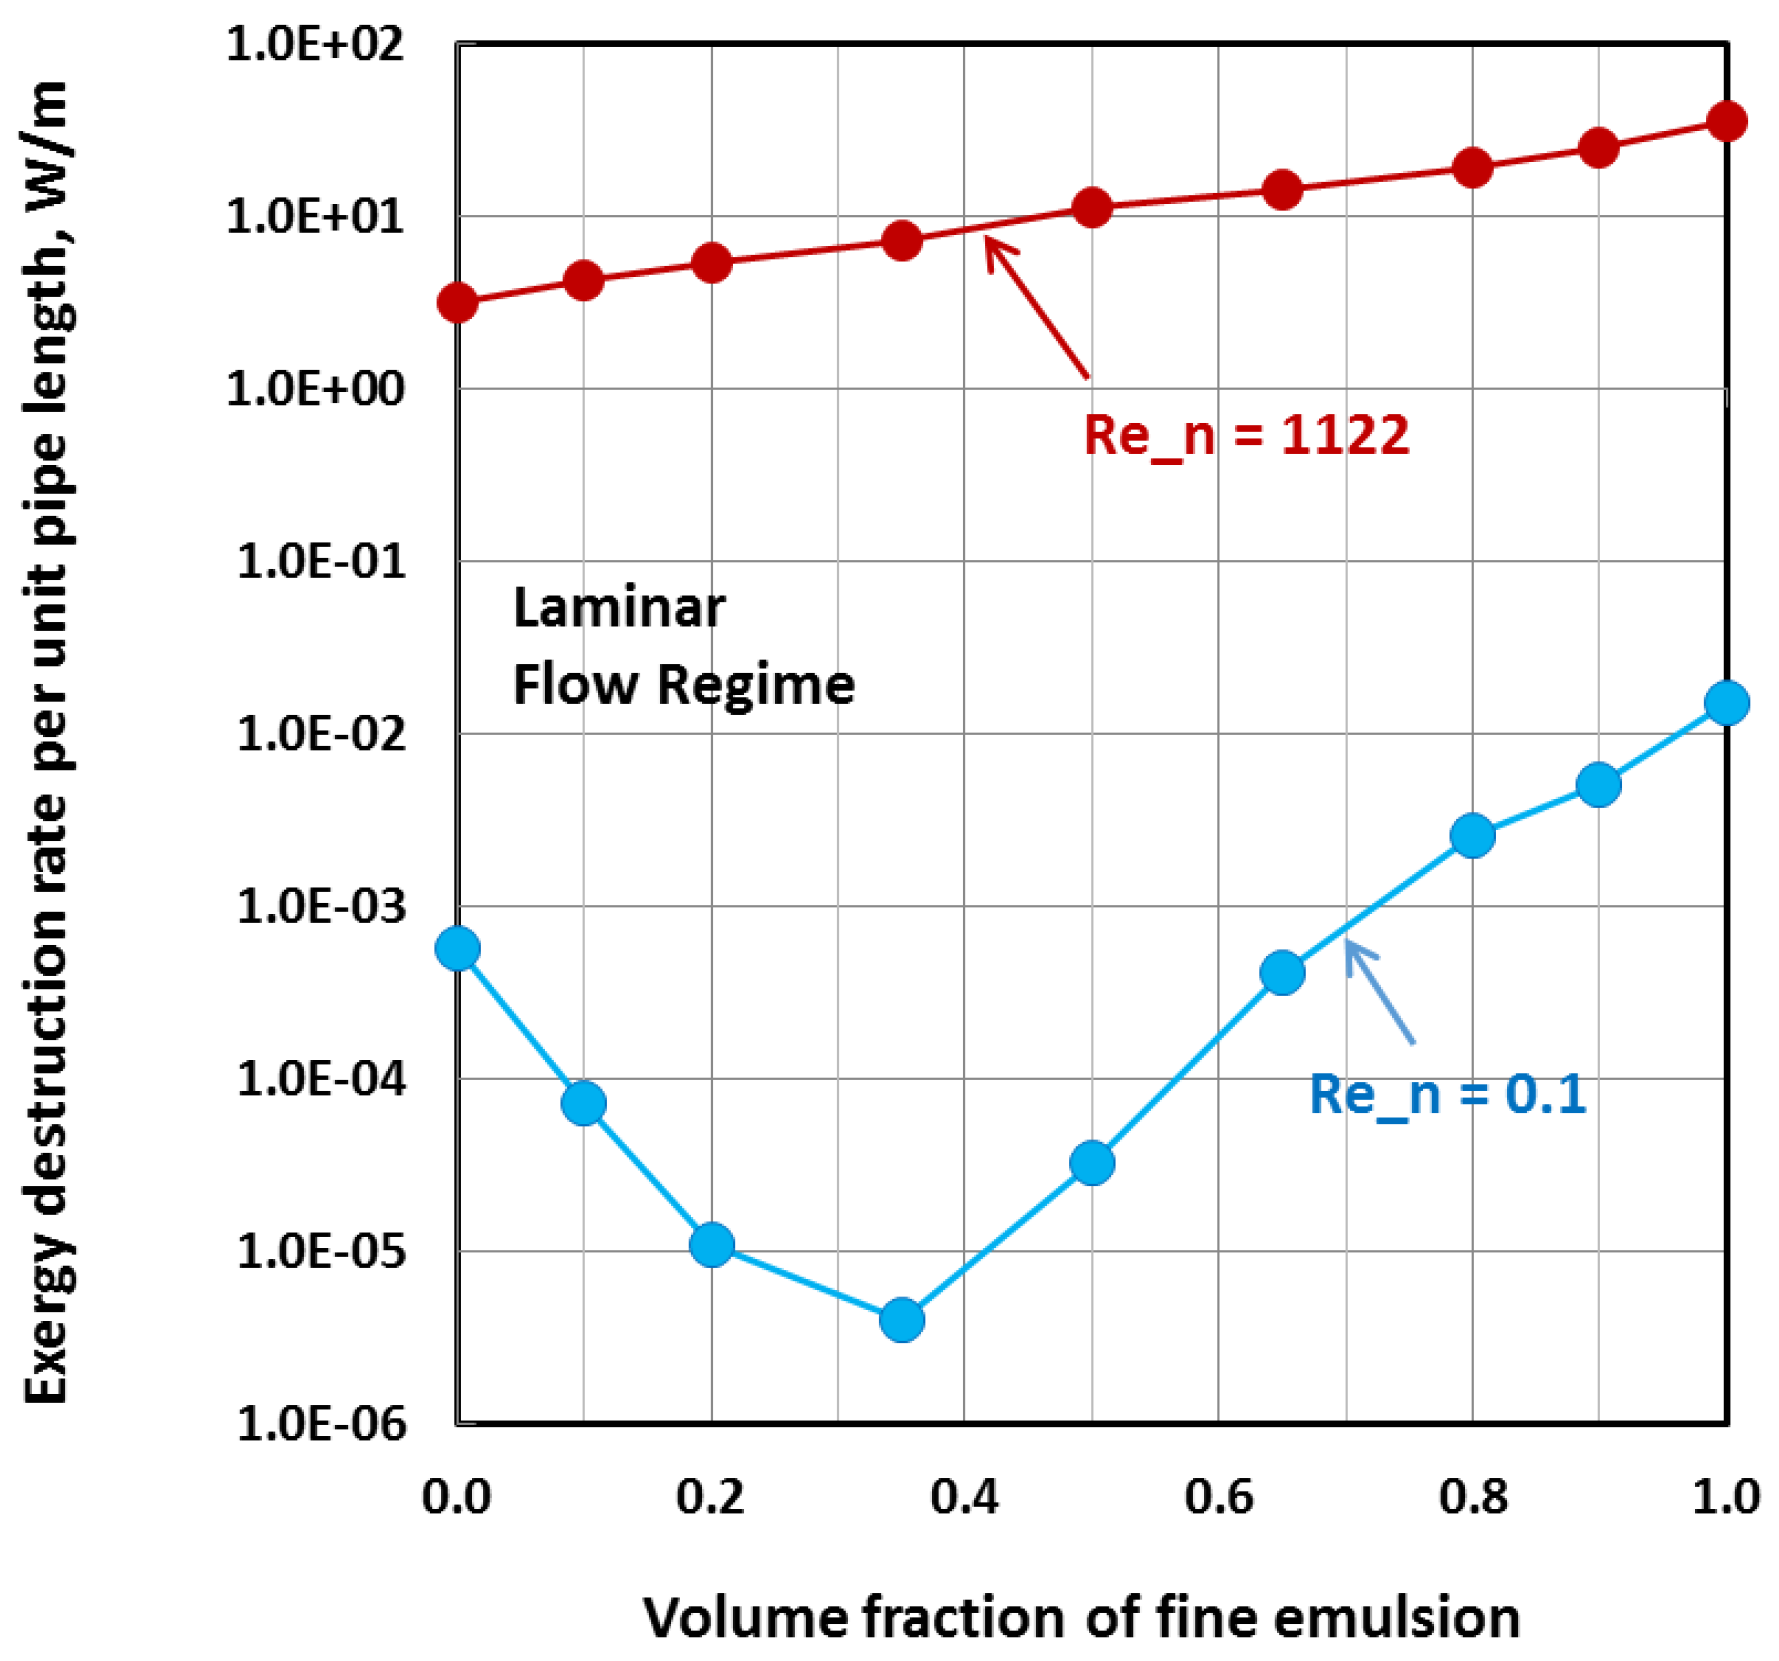
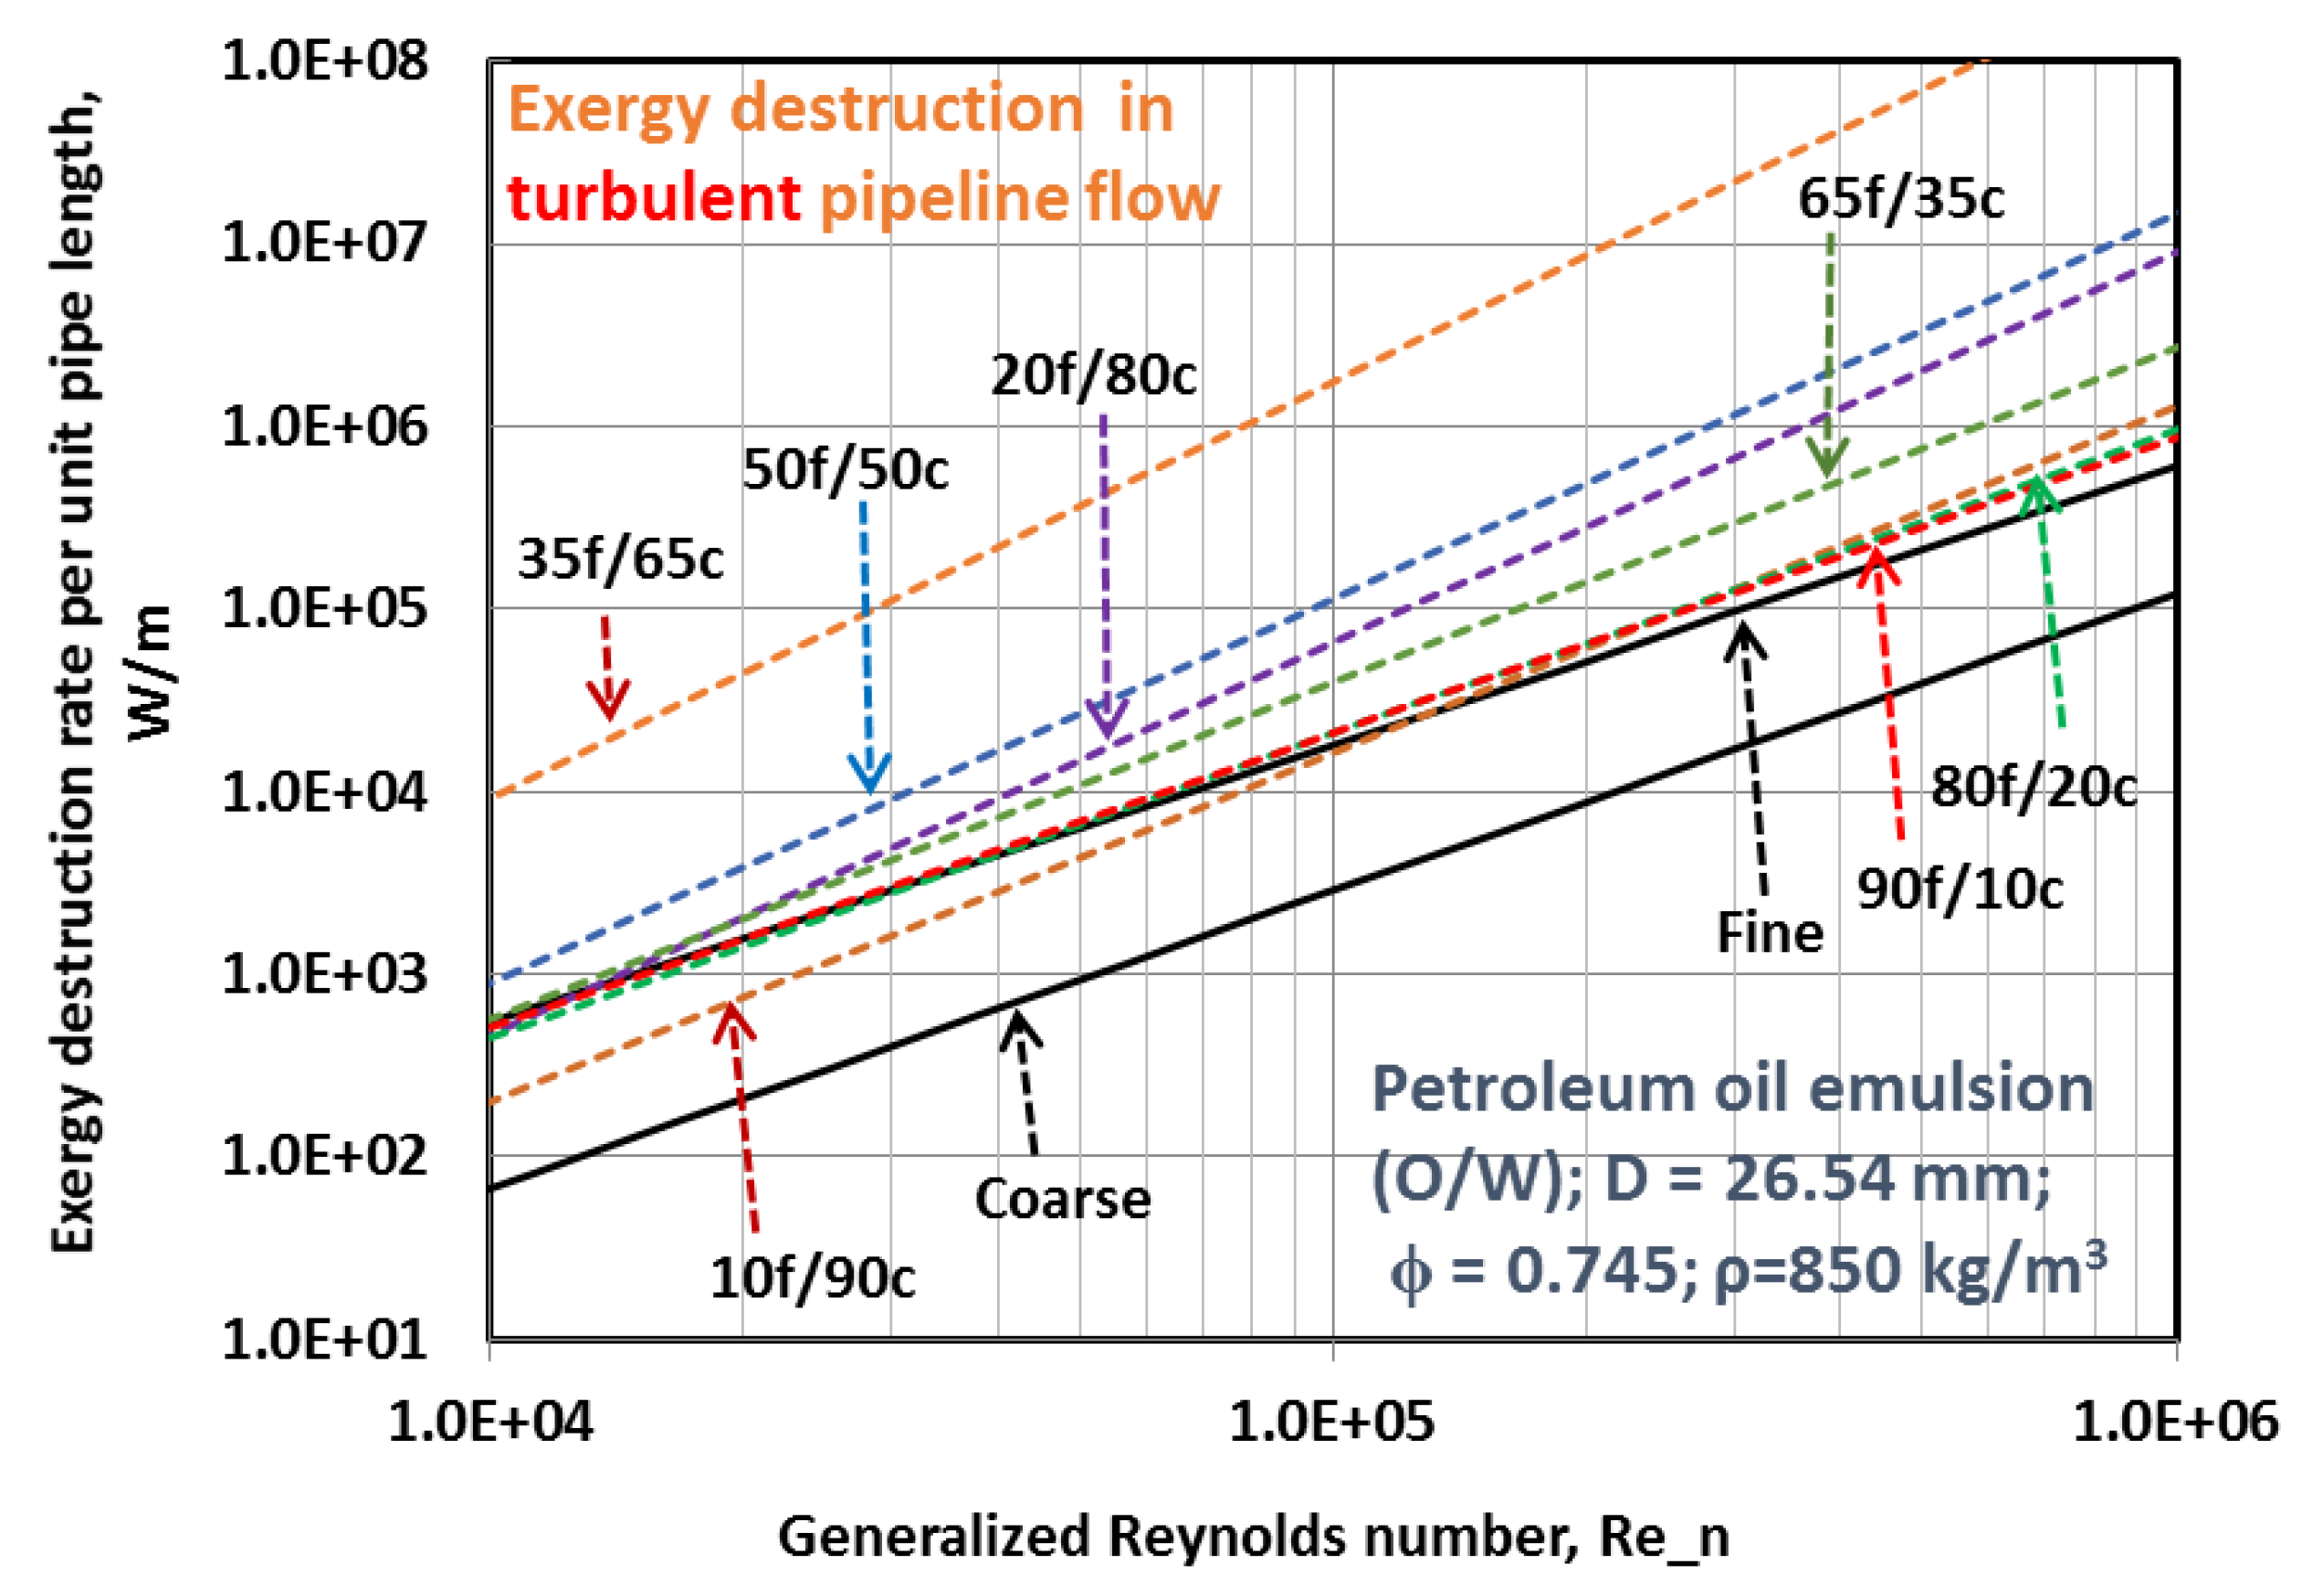
5. Simulation of Exergy Destruction in Pipeline Flow of Emulsions

One important application of this study is in the pipeline transportation of emulsions. Thus, it is important to simulate the influence of droplet size distribution on exergy destruction rate in pipeline flow of emulsions. In a recent study, Pal [38] has proposed the following expressions for entropy production in adiabatic and nearly isothermal pipeline flow of non-Newtonian power-law fluids:
S ˙ G = ( 8 π T ) [ ( a n ) 3 / ( 2 n ) ρ ( 1 + n ) / ( 2 n ) D ( 4 n 2 ) / ( 2 n ) ] ( Re _ n ) ( 1 + n ) / ( 2 n )         laminar flow
S ˙ G = ( π 2 T ) [ ( a n ) 3 / ( 2 n ) ρ ( 1 + n ) / ( 2 n ) D ( 4 n 2 ) / ( 2 n ) ] α n ( Re _ n ) ( 3 / ( 2 n ) ) β n     turbulent flow
where S ˙ G is the rate of entropy production per unit length of pipe, Re _ n is the generalized Reynolds number, D is the pipe diameter, T is the fluid temperature, ρ is the fluid density, and a n , α n , β n are given as follows:
a n = K 8 n 1 [ 3 n + 1 4 n ] n
α n = 0.0077 ln ( n ) + 0.078
β n = 0.25 ( n ) 0.22
Note that the generalized Reynolds number for power-law fluids is defined as:
Re _ n = ρ D n V ¯ 2 n K 8 n 1 [ 3 n + 1 4 n ] n
where K and n are power-law constants, defined in Equation (14).
Using the Gouy-Stodola theorem, Equation (3), the entropy production equations, Equations (15) and (16), could be re-cast in terms of exergy destruction rate per unit length of pipe as:
ψ ˙ D = 8 π ( T o T ) [ ( a n ) 3 / ( 2 n ) ρ ( 1 + n ) / ( 2 n ) D ( 4 n 2 ) / ( 2 n ) ] ( Re _ n ) ( 1 + n ) / ( 2 n )     laminar flow
ψ ˙ D = π 2 ( T o T ) [ ( a n ) 3 / ( 2 n ) ρ ( 1 + n ) / ( 2 n ) D ( 4 n 2 ) / ( 2 n ) ] α n ( Re _ n ) ( 3 / ( 2 n ) ) β n     turbulent flow
where ψ ˙ D is the exergy destruction rate per unit pipe length in adiabatic pipeline flow of non-Newtonian power-law fluids and To is the surroundings temperature. Equations (21) and (22) are used to simulate the influence of droplet size on ψ ˙ D in adiabatic pipeline flow of power-law O/W emulsions. The influence of droplet size on ψ ˙ D enters the analysis through the power-law parameters K and n, which are dependent on the droplet size distribution of emulsion (see Figure 5).
Figure 11 shows the exergy destruction plots for adiabatic laminar flow of mixtures of fine and coarse O/W emulsions in a pipeline of diameter 26.54 mm. The plots are generated using Equation (21) and the power law constants for mixtures of fine and coarse emulsions shown in Figure 5.
The exergy destruction rate in fine emulsion is substantially higher than that in the coarse emulsion over the full range of Re_n. Upon mixing the fine emulsion with the coarse emulsion in moderate amounts (fine emulsion proportion less than 50%), the exergy destruction rate falls well below that of the coarse emulsion at low to moderate values of the generalized Reynolds number Re_n. When fine emulsion proportion of the mixed emulsion is larger than 50%, the exergy destruction rates fall in between those of the coarse and fine emulsions. At high values of Re_n, the exergy loss rates for mixed emulsions always fall in between those of the coarse and fine emulsions, regardless of the proportion of the fine emulsion. Figure 12 clearly shows the effect of Re_n on exergy loss in mixed emulsions. At a low Re_n value of 0.1, the exergy destruction rate exhibits a minimum at a fine emulsion proportion of about 35%. However, at a high Re_n value of 1122 the exergy destruction rate increases linearly with the fine emulsion content of the mixed emulsion. Thus, it can be concluded that the influence of droplet size distribution in improving the thermodynamic efficiency of pumping of emulsions is restricted to modest values of Re_n.
The mitigation of exergy loss in pipeline flow of mixtures of fine and coarse emulsions at high dispersed-phase concentration ( ϕ = 0.745 in the present study) is due to the fact that fine droplets can easily fit into the voids created by close packing of large droplets. As a result, the mixed emulsion of small and large droplets is less densely packed and hence less dissipative in nature as compared with an emulsion of uniform size droplets.
Figure 13 shows the exergy destruction plots for adiabatic turbulent flow of mixtures of fine and coarse O/W emulsions in a pipeline of diameter 26.54 mm. The plots are generated using Equation (22) and the power law constants for mixtures of fine and coarse emulsions shown in Figure 5. The exergy destruction rate in fine emulsion is substantially higher than that in the coarse emulsion over the full range of Re_n, as expected due to more dissipative nature of the fine emulsion. However, upon mixing the fine emulsion with the coarse emulsion, the exergy destruction rates generally fall above those of the coarse and fine emulsions. This can be seen more clearly in Figure 14. Interestingly, the exergy destruction rate in mixed emulsions also exhibits a maximum at a fine emulsion proportion of about 35%.
According to Equation (22), the plot of exergy destruction rate ψ ˙ D versus Reynolds number Re_n is dependent on the power-law parameters K and n. With the increase in K, the emulsion becomes more dissipative in nature and therefore the plot shifts upward reflecting an increase in exergy loss. With the increase in the power law index n, and hence a decrease in the degree of pseudo-plasticity of emulsion, the slope of ψ ˙ D versus Re_n increases indicating a larger increase in exergy loss with the increase in Reynolds number. When fine emulsion is mixed with a coarse emulsion, the power law index n increases as shown in Figure 5. The power-law index also exhibits a maximum at a fine emulsion proportion of about 35%. Thus, the increase in the exergy destruction rate when fine and coarse emulsions are mixed, as observed in Figure 13 and Figure 14, is dominated by an increase in n.

6. Conclusions

Based on the analysis and experimental work presented in this article, the following conclusions can be made:
  • The shear-stress τ versus shear rate γ ˙ behavior of concentrated oil-in-water emulsions (fine, coarse, and their mixtures) investigated in this work can be described satisfactorily by a power-law model τ = K γ ˙ n . The power-law parameters K and n vary with the droplet size and droplet size distribution of emulsions. When fine emulsion (small droplet size) is mixed with the coarse emulsion (large droplet size), keeping the dispersed-phase concentration fixed, the consistency index K goes through a minimum and the power-law index n goes through a maximum at a certain proportion of fine emulsion content of the mixed fine and coarse emulsion.
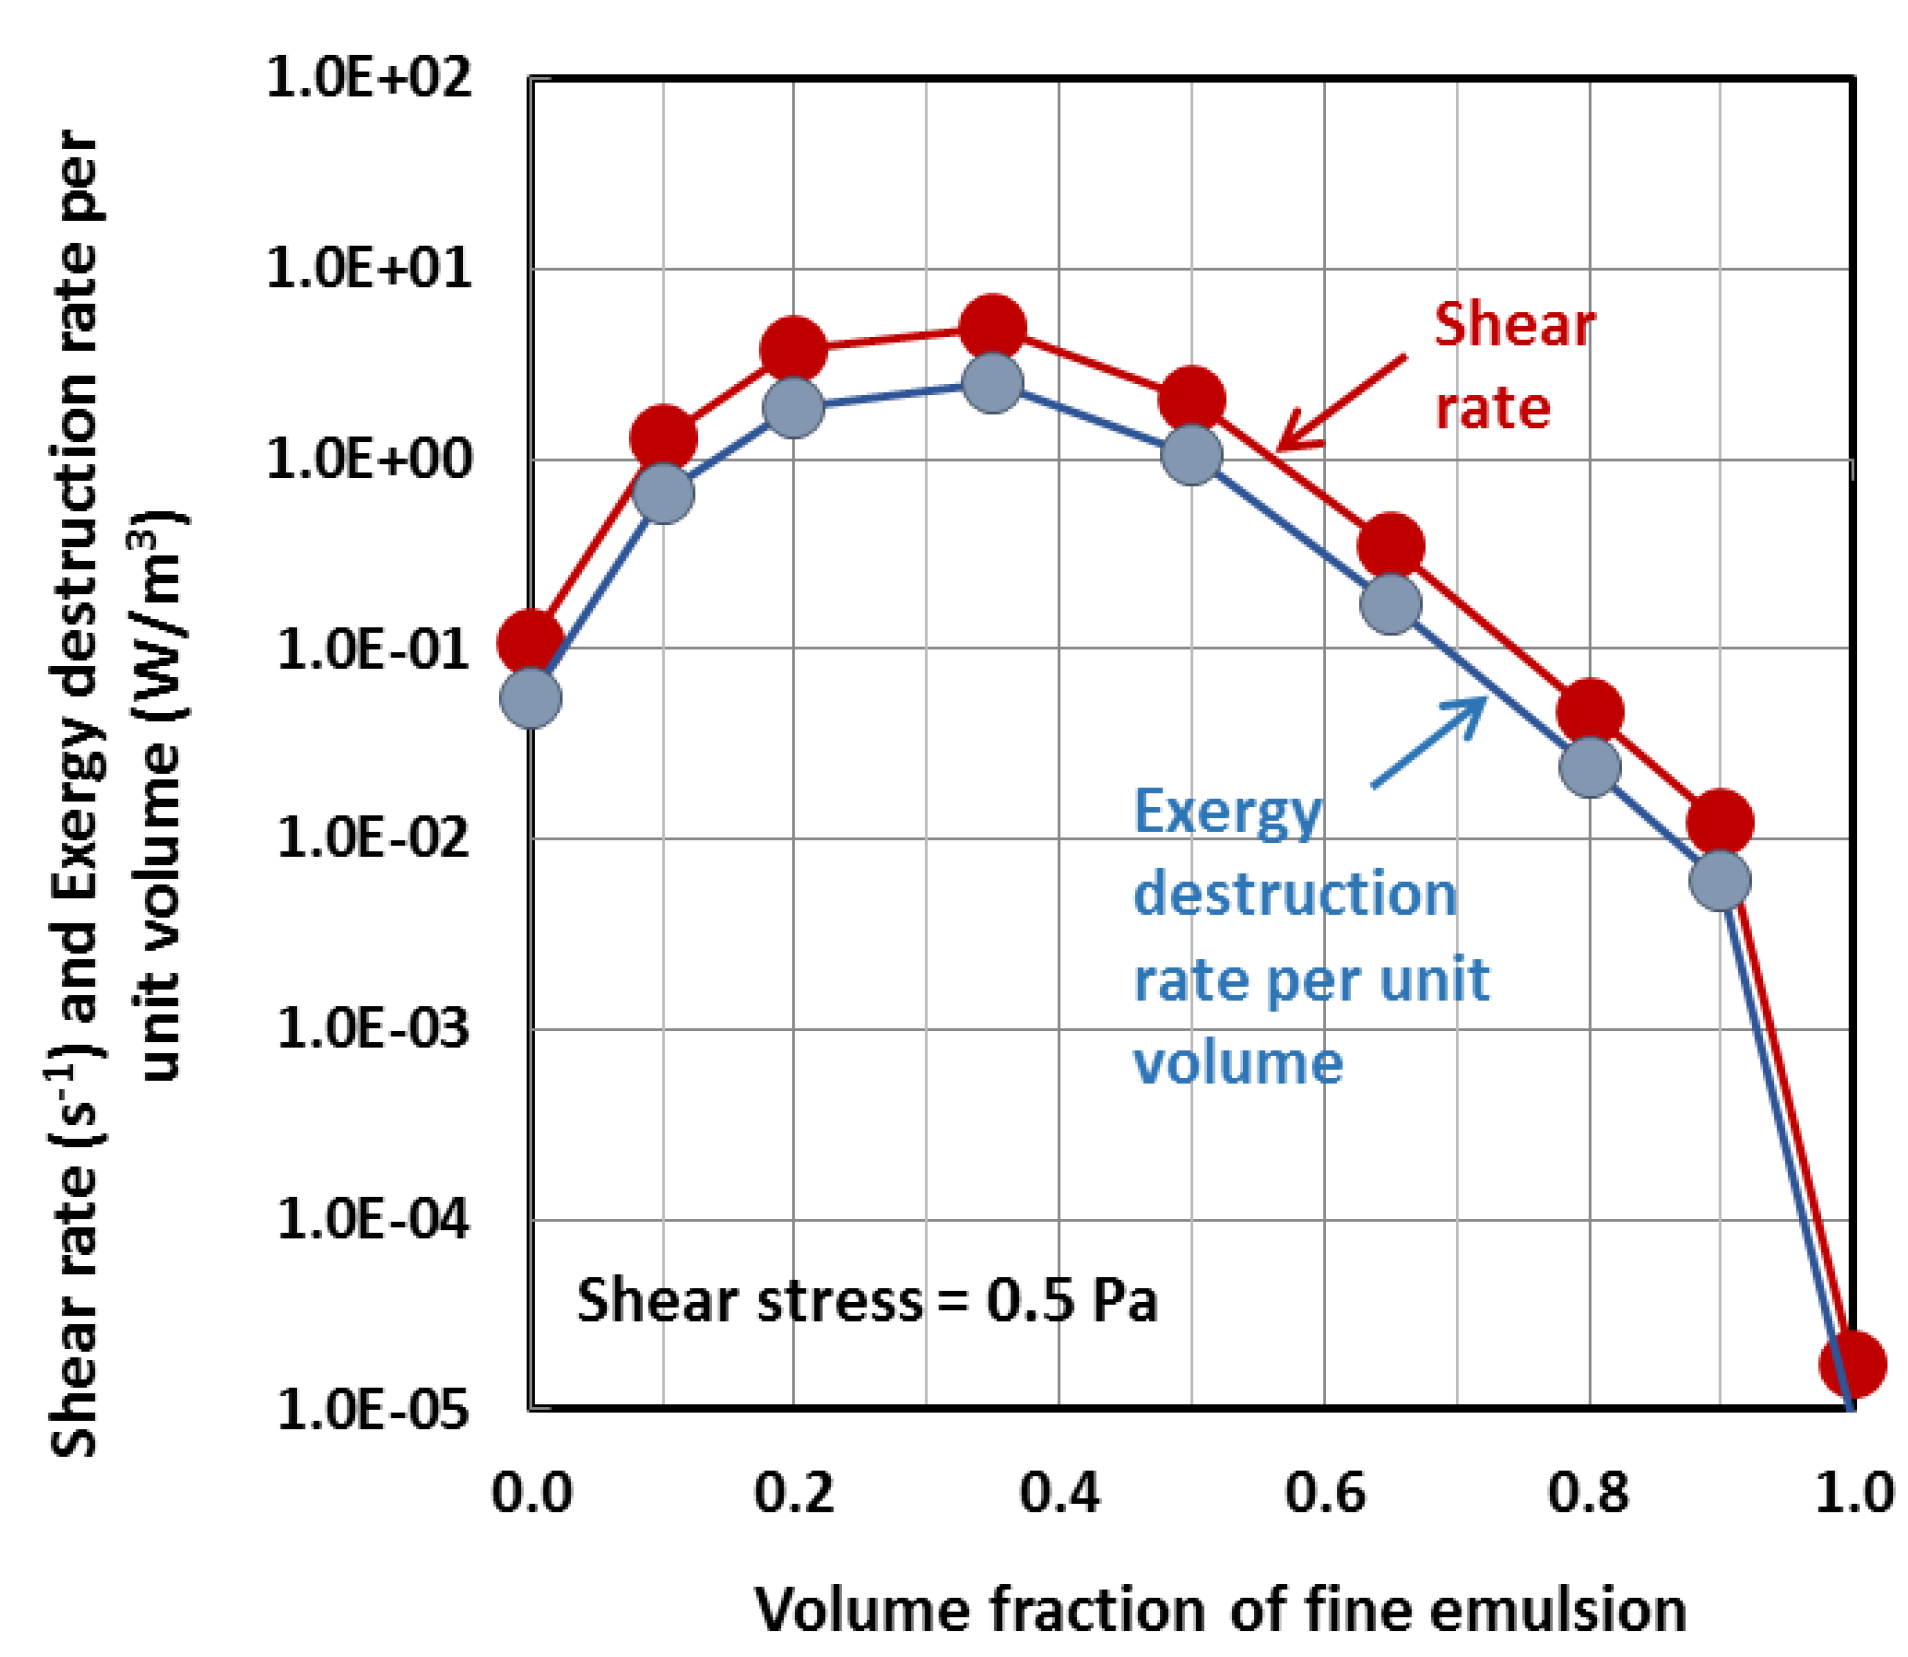
  • The exergy destruction rate per unit volume of emulsion exhibits a minimum when fine emulsion is mixed with the coarse emulsion. The minimum in exergy destruction rate is observed at low shear rates around the fine emulsion proportion of 35%.
  • The thermodynamic efficiency of pumping emulsion through a pipeline increases when fine emulsion is mixed with the coarse emulsion provided that the flow regime is laminar and that the Reynolds number is not high (less than about 100).
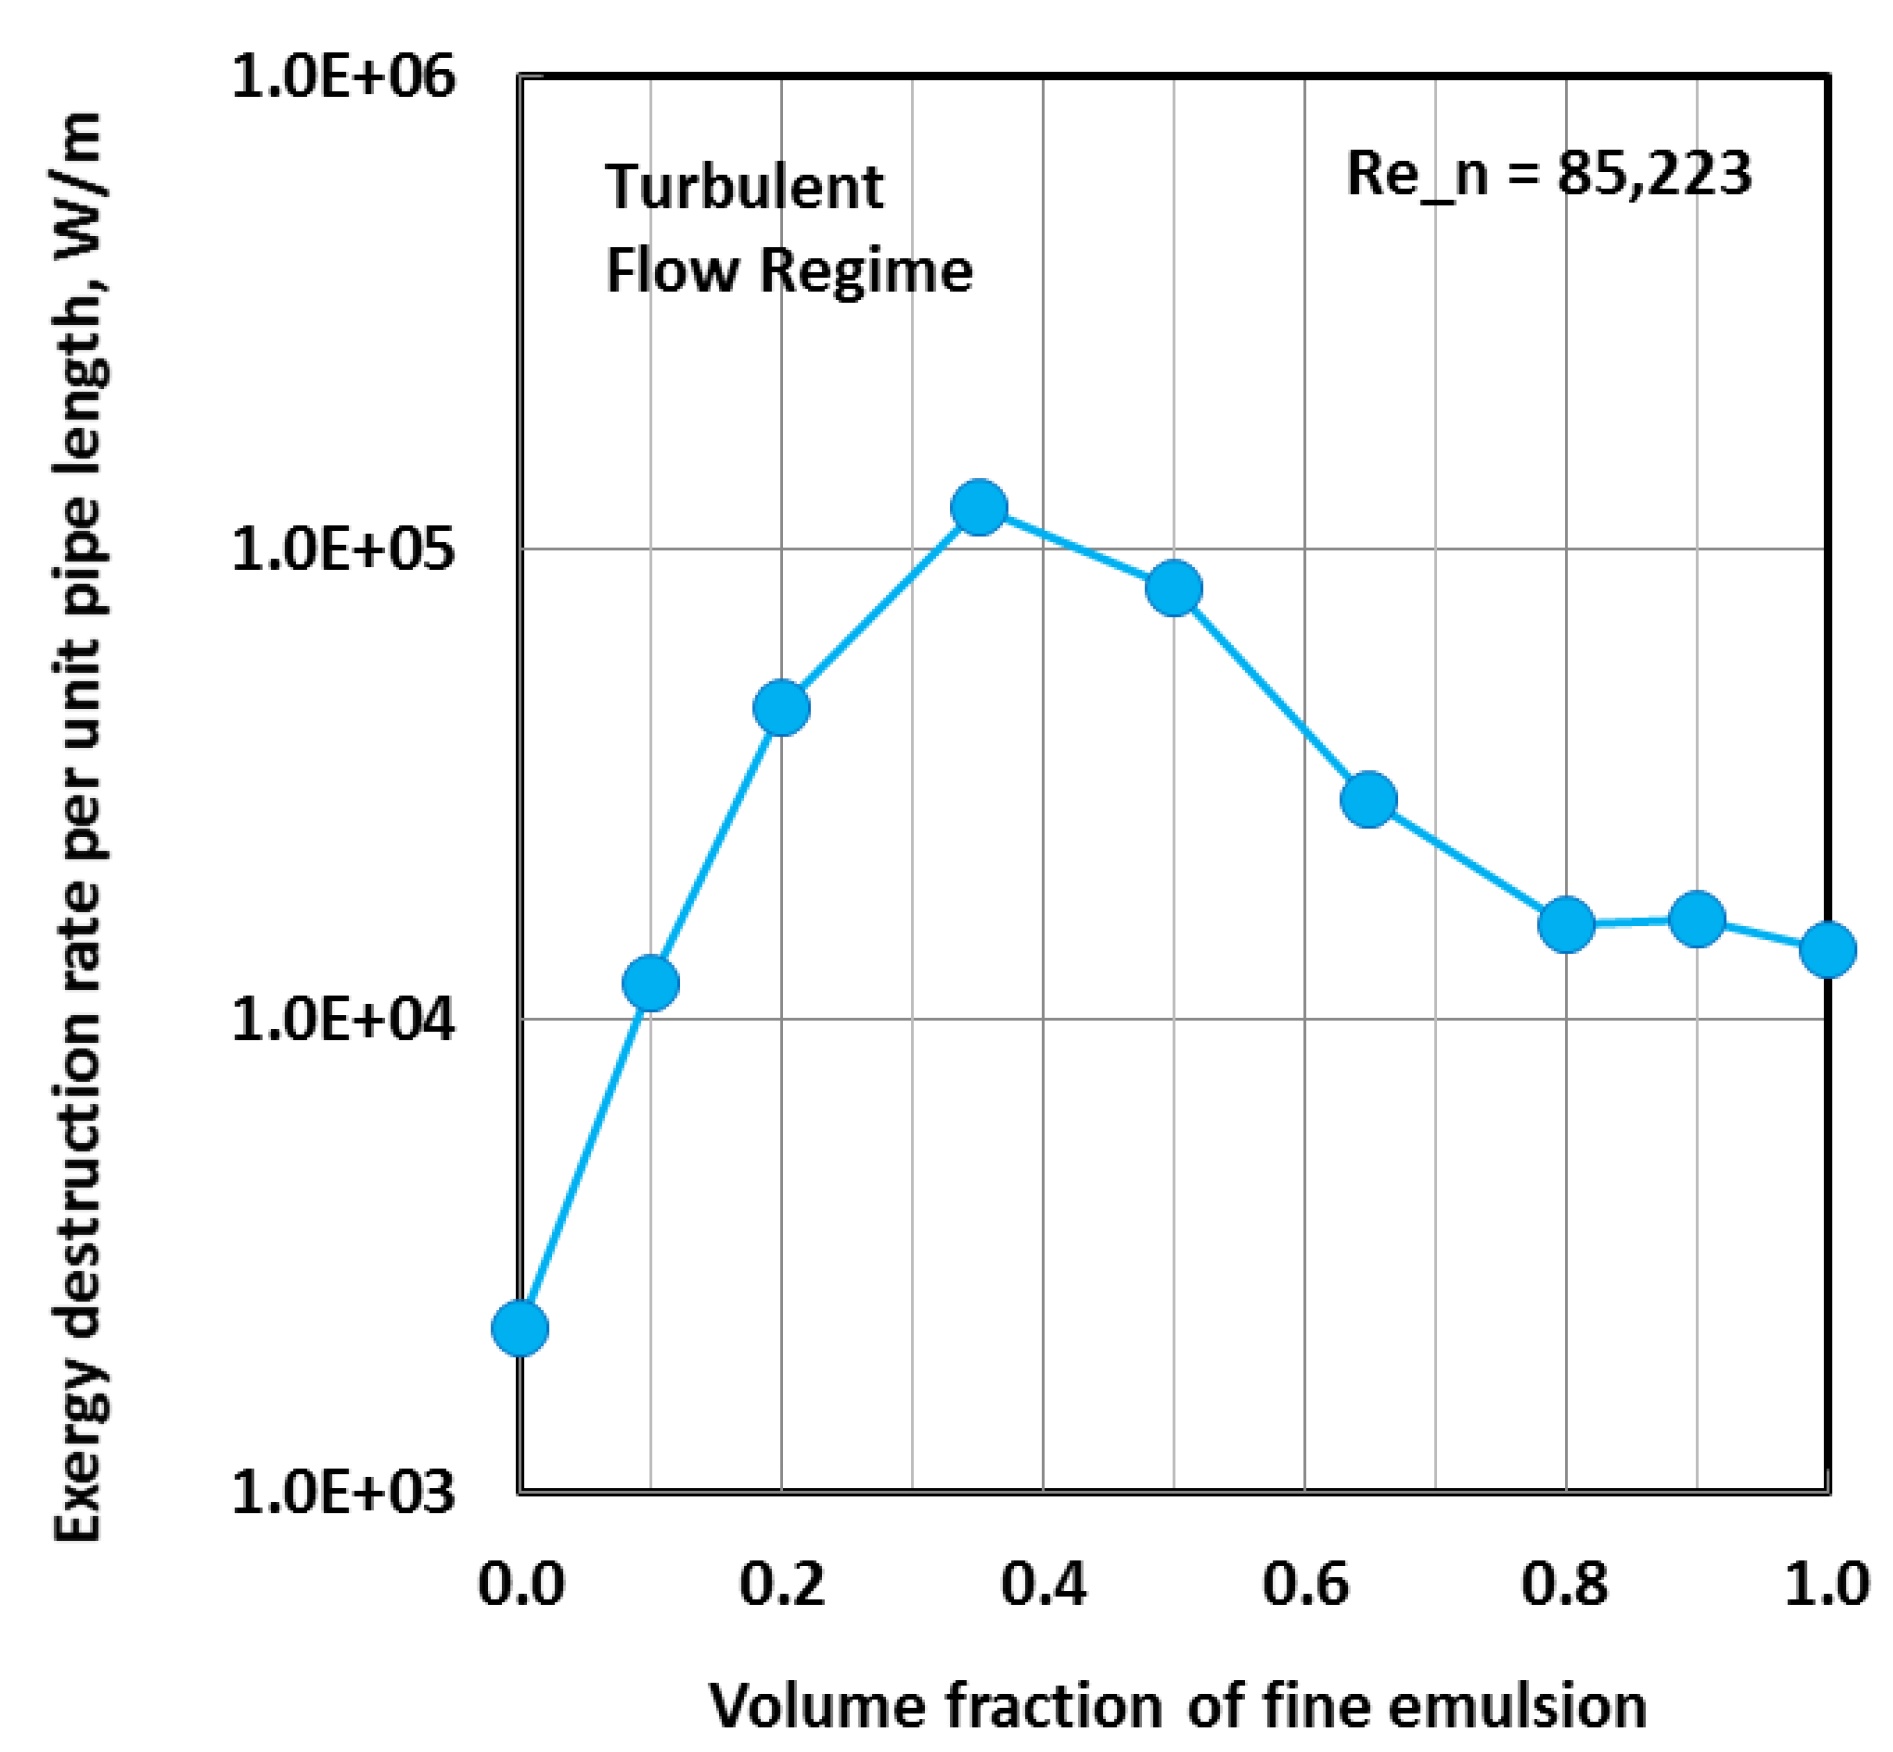
  • At high Reynolds number in the turbulent regime, the exergy loss in pipeline flow of emulsion increases upon mixing fine emulsion with the coarse emulsion, keeping the dispersed-phase concentration fixed. The increase in exergy loss upon increasing the droplet size distribution is due an increase in the flow behavior index n (a decrease in pseudo-plasticity).

Acknowledgments

Financial support from the Natural Sciences and Engineering Research Council of Canada (NSERC) is appreciated.

Conflicts of Interest

The author declares no conflict of interest.

References

  1. Becher, P. Emulsions: Theory and Practice, 3rd ed.; Oxford University Press: Oxford, UK, 2001. [Google Scholar]
  2. Walstra, P. Formation of emulsions. In Encyclopedia of Emulsion Technology; Becher, P., Ed.; Dekker: New York, NY, USA, 1983; Chapter 2; Volume 1. [Google Scholar]
  3. Lucassen-Reynders, E.H. Dynamic interfacial properties in emulsification. In Encyclopedia of Emulsion Technology; Becher, P., Ed.; Dekker: New York, NY, USA, 1996; Chapter 2; Volume 4. [Google Scholar]
  4. Mason, T.G.; Krall, A.H.; Gang, H.; Bibette, J.; Weitz, D.A. Monodisperse emulsions: Properties and uses. In Encyclopedia of Emulsion Technology; Becher, P., Ed.; Dekker: New York, NY, USA, 1996; Chapter 6; Volume 4. [Google Scholar]
  5. Davis, S.S.; Hadgraft, J.; Palin, K.J. Medical and Pharmaceutical Applications of Emulsions. In Encyclopedia of Emulsion Technology; Becher, P., Ed.; Dekker: New York, NY, USA, 1985; Chapter 3; Volume 2. [Google Scholar]
  6. Davis, B.W. Applications in the petroleum industry. In Encyclopedia of Emulsion Technology; Becher, P., Ed.; Dekker: New York, NY, USA, 1988; Chapter 8; Volume 3. [Google Scholar]
  7. Bampfield, H.A.; Cooper, J. Emulsion explosives. In Encyclopedia of Emulsion Technology; Becher, P., Ed.; Dekker: New York, NY, USA, 1988; Chapter 7; Volume 3. [Google Scholar]
  8. Pal, R. Rheology of Particulate Dispersions and Composites; CRC Press: Boca Raton, FL, USA, 2007. [Google Scholar]
  9. Pal, R. Effect of droplet size on the rheology of emulsions. AIChE J. 1996, 42, 3181–3190. [Google Scholar] [CrossRef]
  10. Pal, R. Pipeline flow of unstable and surfactant-stabilized emulsions. AIChE J. 1993, 39, 1754–1764. [Google Scholar] [CrossRef]
  11. Pal, R. Rheology of simple and multiple emulsions. Curr. Opin. Colloid Interface Sci. 2011, 16, 41–60. [Google Scholar] [CrossRef]
  12. Pal, R. Techniques for measuring the composition (oil and water content) of emulsions—A state of the art review. Colloids Surf. A 1994, 84, 141–193. [Google Scholar] [CrossRef]
  13. Pal, R. Rheology of double emulsions. J. Colloid Interface Sci. 2007, 307, 509–515. [Google Scholar] [CrossRef] [PubMed]
  14. Cengel, Y.; Boles, M. Thermodynamics: An Engineering Approach, 7th ed.; McGraw-Hill: New York, NY, USA, 2011; Chapter 8. [Google Scholar]
  15. Doi, M.; Ohta, T. Dynamics and rheology of complex interfaces. J. Chem. Phys. 1991, 95, 1242–1248. [Google Scholar] [CrossRef]
  16. Mason, T.G. New fundamental concepts in emulsion rheology. Curr. Opin. Colloid Interface Sci. 1999, 4, 231–238. [Google Scholar] [CrossRef]
  17. Larson, R.G. The Structure and Rheology of Complex Fluids; Oxford University Press: New York, NY, USA, 1999. [Google Scholar]
  18. Ngan, K.H.; Ioannou, K.; Rhyne, L.D.; Wang, W.; Angeli, P. A methodology for predicting phase inversion during liquid-liquid dispersed pipeline flow. Chem. Eng. Res. Des. 2009, 87, 318–324. [Google Scholar] [CrossRef]
  19. Liu, L.; Matar, O.K.; Lawrence, C.J.; Hewitt, G.F. Laser-induced fluorescence (LIF) studies of liquid-liquid flows. Part I: Flow structures and phase inversion. Chem. Eng. Sci. 2006, 61, 4007–4021. [Google Scholar] [CrossRef]
  20. Brauner, N.; Ullmann, A. Modeling of phase inversion phenomenon in two-phase pipe flows. Int. J. Multiph. Flow 2008, 28, 1177–1204. [Google Scholar] [CrossRef]
  21. Piela, K.; Delfos, R.; Ooms, G.; Westerweel, J.; Oliemans, R.V.A.; Mudde, R.F. Experimental investigation of phase inversion in an oil-water flow through a horizontal pipe loop. Int. J. Multiph. Flow 2006, 32, 1087–1099. [Google Scholar] [CrossRef]
  22. Piela, K.; Delfos, R.; Ooms, G.; Westerweel, J.; Oliemans, R.V.A. On the phase inversion process in an oil-water flow. Int. J. Multiph. Flow 2008, 34, 665–677. [Google Scholar] [CrossRef]
  23. Xu, J.Y.; Li, D.H.; Guo, J.; Wu, Y.X. Investigations of phase inversion and frictional pressure gradient in upward and downward oil-water flow in vertical pipes. Int. J. Multiph. Flow 2010, 36, 930–939. [Google Scholar] [CrossRef]
  24. Simmons, M.J.H.; Azzopardi, B.J. Drop size distribution in dispersed liquid-liquid pipe flow. Int. J. Multiph. Flow 2001, 27, 843–859. [Google Scholar] [CrossRef]
  25. Angeli, P.; Hewitt, G.F. Drop size distributions in horizontal oil-water dispersed flows. Chem. Eng. Sci. 2000, 55, 3133–3143. [Google Scholar] [CrossRef]
  26. Wang, W.; Cheng, W.; Duan, J.; Gong, J.; Hu, B.; Angeli, P. Effect of dispersed holdup on drop size distribution in oil-water dispersions: Experimental observations and population balance modeling. Chem. Eng. Sci. 2014, 105, 22–31. [Google Scholar] [CrossRef]
  27. Liao, Y.; Lucas, D. A literature review of theoretical models for drop and bubble breakup in turbulent dispersions. Chem. Eng. Sci. 2009, 64, 3389–3406. [Google Scholar] [CrossRef]
  28. Jana, A.K.; Das, G.; Das, P.K. Flow regime identification of two-phase liquid-liquid upflow through vertical pipe. Chem. Eng. Sci. 2006, 61, 1500–1515. [Google Scholar] [CrossRef]
  29. Angeli, P.; Hewitt, G.F. Flow structure in horizontal oil-water flow. Int. J. Multiph. Flow 2000, 26, 1117–1140. [Google Scholar] [CrossRef]
  30. Lum, J.Y.L.; Al-Wahaibi, T.; Angeli, P. Upward and downward inclination oil-water flows. Int. J. Multiph. Flow 2006, 32, 413–435. [Google Scholar] [CrossRef]
  31. Lovick, J.; Angeli, P. Experimental studies on the dual continuous flow pattern in oil-water flows. Int. J. Multiph. Flow 2004, 30, 139–157. [Google Scholar] [CrossRef]
  32. Lu, Y.; He, L.; He, Z.; Wang, A. A study of pressure gradient characteristics of oil-water dispersed flow in horizontal pipe. Energy Procedia 2012, 16, 1111–1117. [Google Scholar] [CrossRef]
  33. Al-Wahaibi, T. Pressure gradient correlation for oil-water separated flow in horizontal pipes. Exp. Therm. Fluid Sci. 2012, 42, 196–203. [Google Scholar] [CrossRef]
  34. Angeli, P.; Hewitt, G.F. Pressure gradient in horizontal liquid-liquid flows. Int. J. Multiph. Flow 1998, 24, 1183–1203. [Google Scholar] [CrossRef]
  35. Bird, R.B.; Armstrong, R.C.; Hassager, O. Dynamics of Polymeric Liquids; Wiley & Sons: New York, NY, USA, 1987; Volume 1. [Google Scholar]
  36. Slattery, J.C. Advanced Transport Phenomena; Cambridge University Press: New York, NY, USA, 1999; Chapter 3. [Google Scholar]
  37. Bird, R.B.; Stewart, W.E.; Lightfoot, E.N. Transport Phenomena; John Wiley & Sons: New York, NY, USA, 1960; Chapter 3. [Google Scholar]
  38. Pal, R. Entropy generation in flow of highly concentrated non-Newtonian emulsions in smooth tubes. Entropy 2014, 16, 5178–5197. [Google Scholar] [CrossRef]
Figure 1. Schematic diagram of a cone-and-plate viscometer.
Energies 09 00293 g001
Figure 2. Photomicrographs of fine (a) and coarse (b) O/W emulsions.
Energies 09 00293 g002
Figure 3. Comparison of droplet size distributions of fine and coarse O/W emulsions.
Energies 09 00293 g003
Figure 4. Shear stress versus shear rate plots for mixtures of fine and coarse O/W emulsions. In the figure “f” refers to proportion of fine emulsion and “c” refers to proportion of coarse emulsion.
Energies 09 00293 g004
Figure 5. Power law parameters (K and n) with error bars for mixtures of fine and coarse O/W emulsions.
Energies 09 00293 g005
Figure 6. Comparison of viscosity data of fine and coarse emulsions obtained from different instruments.
Energies 09 00293 g006
Figure 7. Exergy destruction rate versus shear stress for mixtures of fine and coarse O/W emulsions.
Energies 09 00293 g007
Figure 8. Exergy destruction rate versus shear rate for mixtures of fine and coarse O/W emulsions.
Energies 09 00293 g008
Figure 9. Shear rate and exergy destruction rate for mixtures of fine and coarse O/W emulsions at a fixed shear stress of 0.5 Pa.
Energies 09 00293 g009
Figure 10. Exergy destruction rate per unit volume for mixtures of fine and coarse O/W emulsions at a fixed shear rate of 5 s−1.
Energies 09 00293 g010
Figure 11. Exergy destruction rate per unit pipe length in adiabatic laminar flow of mixtures of fine and coarse O/W emulsions.
Energies 09 00293 g011
Figure 12. The effect of Re_n on exergy loss in adiabatic pipeline flow of mixtures of fine and coarse O/W emulsions.
Energies 09 00293 g012
Figure 13. Exergy destruction rate per unit pipe length in adiabatic turbulent flow of mixtures of fine and coarse O/W emulsions.
Energies 09 00293 g013
Figure 14. Exergy destruction rate in adiabatic turbulent flow of mixtures of fine and coarse O/W emulsions at a fixed Re_n of 85,223.
Energies 09 00293 g014
Table 1. Goodness of fit of power-law model and confidence intervals for the power-law parameters.
Emulsion CompositionRegression Correlation Coefficient, R2Flow Behavior Index, nConsistency Index, K (Units of Pa·sn)95% Confidence Interval of n95% Confidence Interval of K
Coarse (0f/100c)0.99560.4421.12[0.427, 0.456][1.044, 1.199]
10f/90c0.99990.6220.425[0.619, 0.625][0.420, 0.430]
20f/80c0.99750.7530.208[0.734, 0.771][0.191, 0.227]
35f/65c0.99760.8220.152[0.802, 0.841][0.138, 0.167]
50f/50c0.99890.7330.323[0.722, 0.744][0.307, 0.340]
65f/35c0.99960.5850.937[0.580, 0.591][0.916, 0.959]
80f/20c0.99660.4662.418[0.454, 0.478][2.303, 2.539]
90f/10c0.99730.4313.522[0.422, 0.441][3.383, 3.667]
Fine (100f/0c)0.97450.3646.777[0.336, 0.392][5.927, 7.749]

