Article

Study on the System Design of a Solar Assisted Ground Heat Pump System Using Dynamic Simulation

1
Department of Architectural Engineering, Pusan National University, 2 Busandaehak-ro 63, Geomjeong-gu, Busan 609-735, Korea
2
Research Institute of Industrial Science & Technology, Incheon 406-840, Korea
3
Department of Architecture, Kookmin University, Seoul 501-759, Korea
*
Author to whom correspondence should be addressed.
Energies 2016, 9(4), 291; https://doi.org/10.3390/en9040291
Submission received: 2 February 2016 / Revised: 6 April 2016 / Accepted: 13 April 2016 / Published: 16 April 2016

Abstract

:
Recently, the use of hybrid systems using multiple heat sources in buildings to ensure a stable energy supply and improve the system performance has gained attention. Among them, a heat pump system using both solar and ground heat was developed and various system configurations have been introduced. However, establishing a suitable design method for the solar-assisted ground heat pump (SAGHP) system including a thermal storage tank is complicated and there are few quantitative studies on the detailed system configurations. Therefore, this study developed three SAGHP system design methods considering the design factors focused on the thermal storage tank. Using dynamic energy simulation code (TRNSYS 17), individual performance analysis models were developed and long-term quantitative analysis was carried out to suggest optimum design and operation methods. As a result, it was found that SYSTEM 2 which is a hybrid system with heat storage tank for only a solar system showed the highest average heat source temperature of 14.81 °C, which is about 11 °C higher than minimum temperature in SYSTEM 3. Furthermore, the best coefficient of performance (COP) values of heat pump and system were 5.23 and 4.32 in SYSYEM 2, using high and stable solar heat from a thermal storage tank. Moreover, this paper considered five different geographical and climatic locations and the SAGHP system worked efficiently in having high solar radiation and cool climate zones and the system COP was 4.51 in the case of Winnipeg (Canada) where the highest heating demand is required.

1. Introduction

In recent years, the use of renewable energy systems in buildings to reduce energy consumption and restrict fossil fuel use has gained attention. However, there are concerns about the reliability of the system performance because a single energy source such as solar energy works intermittently. The renewable energy system functions as an independent system in the building and for the energy production it is important to supply stable energy to the building load.
From this viewpoint, a new renewable multi-source system has been developed in order to solve several problems caused by the use of a single energy source. A solar-assisted ground heat pump system (SAGHP) has been suggested recently to be a solution to using solar systems and ground heat pump systems individually. In terms of the solar system, a SAGHP system can resolve several problems such as irregular solar energy production or mismatch between the sunshine duration and operation time. Moreover, it can prevent the ground temperature drop which happens when a ground heat pump system is used continuously and excessively [1]. By utilizing multiple heat sources simultaneously at peak load, the ground temperature can remain stable. Furthermore, it is possible to save on investment costs and space since hybrid system can reduce the capacity needed by each energy source system.
Several studies have been conducted recently to use this hybrid energy system more efficiently. According to the International Energy Agency (IEA) Task 44 and Annex 38, more than 100 heat pump systems using both solar and ground heat source were examined and they have been classified into four categories, which are parallel concept, serial concept, regenerative concept and complex concept [2]. Some of them have been demonstrated by applications [3] and there are lots of studies on performance assessment utilizing hybrid systems [3,4,5,6,7,8,9,10,11,12,13]. In order to prove the feasibility compared with the conventional ground source heat pump system, Girard et al. [4] showed higher performance and greater operation cost savings from the SAGHP system in 19 different locations. In addition, Bakirci et al. [5] conducted a performance test using a ground heat pump system with solar energy and figured out that the hybrid system could be applied for heating by obtaining sufficient coefficients of performance (COPs) ranging from 3.0 to 3.4 and from 2.7 to 3.0.
Considering the operation modes, Dai et al. [6] performed an experimental study on six-operation modes of a SAGHP system. Through experiments, they found that the thermal storage tank could be used to operate the hybrid system stably and the system which is connected with a ground heat exchanger (GHE) in series showed the highest performance. Likewise, Si et al. [7] compared two solar-ground source heat pump system operation strategies and optimized the system components by increasing the system performance from the normal design. In addition, Emmi et al. [8] implemented a study on the control strategies of the SAGHP system in order to find the highest energy efficiency. On the other hand, Reda et al. [9] assessed solar systems with ground source heat pump systems in different Italian locations. Following their study, the usage of solar energy saved energy consumption, especially in Southern cities with a significant solar irradiance. Unlike the studies performed extensively on the operation modes and different locations, the analysis of comparative superiority among the system designs was not sufficient according to design variables. For applications, one needs to design an optimum system configuration considering the operation schedule and location based on a quantitative analysis. In this study, in order to develop the optimum design and operation strategy for the SAGHP system, performance prediction was conducted using dynamic energy simulation code (TRNSYS 17). Three types of simulation models were developed for different configurations and control strategies. Performance analysis and the economic feasibility studies were carried out to determine the comparative superiority under various conditions such as locations and operation schedules.

2. Overview of System Configuration and Operation Strategy

2.1. System Summary

Figure 1 represents a basic schematic diagram of the SAGHP system which is composed of a solar heat collector, a GHE, a heat pump and circulation pumps based on the previous study [14]. All the systems are connected by water-loop piping and use three way valves and ON/OFF switches for control.

2.2. Description of the System Configuration and Operation Strategy

In this study, three SAGHP system concepts are discussed. SYSTEM 1 is a basic model in parallel without a water tank but SYSTEM 2 and SYSTEM 3 additionally utilized a thermal storage tank (300 L) in order to supply energy efficiently, especially to solve difference between solar collection and heating operation. Detailed storage tank design methods have been described in a previous study [14]. Moreover, the operation strategy was developed respectively based on each system configuration to use a more effective heat source. Figure 2 describes each system diagram and the detailed design and operation method are explained as follows.

2.2.1. SYSTEM 1

In SYSTEM 1, the solar heat collector and GHE are connected with the heat pump in parallel. In heating mode, the heat pump system operates depending on the room temperature (T). If T > 26 °C, the heat pump system stops temporarily. Then, the heat pump starts again when T < 22 °C. After a preset time, the heat pump shuts down completely. By this control strategy, the heat pump uses the higher heat source between solar and ground heat. If Ts > Tg, solar the heat source mode keeps V1 and V2 using solar energy and turns P1 and P2 on, so that the heat pump uses the solar heat source. When Ts < Tg, the ground heat source mode changes V1 and V2 to utilize the ground heat.

2.2.2. SYSTEM 2

SYSTEM 2, which is known as a regenerative concept, has an additional thermal storage tank located on the solar heat source side for solar heat collection. When the outlet temperature of the solar panel is over 15 °C, the solar energy is stored in the storage tank by operating P1. Unlike SYSTEM 1, the higher heat source is chosen between the ground heat and stored solar heat in the storage tank. Therefore, the solar heat source mode is operational when the average temperature of the storage tank (Tst) is higher than the ground heat source. The rest of the operation strategy is as same as SYSTEM 1.

2.2.3. SYSTEM 3

In SYSTEM 3, an additional thermal storage tank is placed on the load side which combines the solar collector and ground source heat pump system in parallel. The system works depending on the average temperature of the storage tank, which is set to be 60 °C. If Tst < 60 °C, the ground source heat pump system operates and the solar collector stores the solar heat energy when Ts > 60 °C. In heating mode, the building load is controlled by emitting the heat energy from thermal storage tank.

3. Simulation Introduction

3.1. Description of Simulation Model and Estimation Method

In this study, three SAGHP system performance prediction models were created and analyzed using TRNSYS 17, which is a dynamic energy simulation program with a modular structure. Every component in the system fulfills a specific function under the description language and mathematical models which are given for the components with the ordinary differential or algebraic equations [16]. With regard to building modelling, TRNBuild was used considering the structural condition of building which has been simplified into one zone [17].
In the SAGHP system, a flat plate serpentine tube solar collector model was adopted for the solar collection and a vertical U-tube GHE model was used for the ground heat extraction. The solar collector model is possible to analyze using the theoretical efficiency method which is explained in [18]. From this model, the useful solar heat (Qs) is calculated as follows:
Qs = c × m × (Ts,outTs,in)
The heat supply from the thermal storage tank (Qst) can be determined by:
Qst = c × m × (Tst,outTst,in)
On the other hand, the GHE model was assumed to be placed within a storage volume of ground, so that the conductive heat transfer generates through the pipes to the storage volume [19]. Therefore, the outlet fluid temperature of the borehole, Tg,out is determined from the following equation:
Tg,out = β × Tg,in + (1 − β) × (Tb)
The extracted heat from the GHE (Qg) can be expressed as:
Qg = c × m × (Tg,outTg,in)
Moreover, a water-to-water heat pump model was utilized for the heat pump unit of which performance data file was modified according to the capacity. Figure 3 indicates the performance curve of heat pump based on the data file. It shows the correlation of heat pump COP with entering heat source temperature in different outlet load temperature.
With the heating performance data, the heat pump COP can be calculated by the power consumption of heat pump (Whp) and the heat transferred to load (Qhp) by the following equation:
COP hp   =   Q hp W hp
In addition, the overall system COP is calculated using the heat energy delivered to building load (Q) and total power consumed by heat pump (Whp) and circulation pump (Wpump), as shown in following equation:
COP sys   =   Q W hp + W pump
To control three-performance prediction models of the SAGHP system, signals were sent to the heat pump and circulation pumps considering the set temperature and operation time. Based on the described simulation model, each system performance was estimated.

3.2. Simulation Conditions

This study assumed the simulation model as a 100 m2 building unit located in Seoul, Korea. The heating load calculation was conducted using TRNSYS and the peak heating load was determined to be 85.13 W/m2 [17] when the indoor design temperature was assumed as 20 °C. Therefore, the system components were designed to match the required heat energy and a heat pump model was decided to be as 3RT with reference to previous study [17]. Considering the heat pump capacity, the number and depth of the vertical GHE were determined. The total depth of the GHE in this study was 150 m, and it was proved acceptable to use the 3RT heat pump system since the heat exchange rate is about 50 W/m based on a previous study [20]. The main parameters are indicated in Table 1, which summarizes the entire simulation model such as a building, a solar collector, GHEs, boreholes, pumps and ground condition. The properties of each system components were based on the previous studies [15,20] and ethylene glycol mixture was used for anti-freeze solution. Furthermore, it shows three operation schedules set in this study to recognize the difference on the purpose of various buildings, which are Daytime (8AM–6PM), Nighttime (9PM–7AM) and All day. Based on these conditions, the simulation was calculated from 1st January to 28th February during the winter season.

4. Results and Discussion

4.1. Comparison with Each System Configuration

In order to ensure the control strategy of each system, this paper shows the simulation results of short-term and long-term operation. 
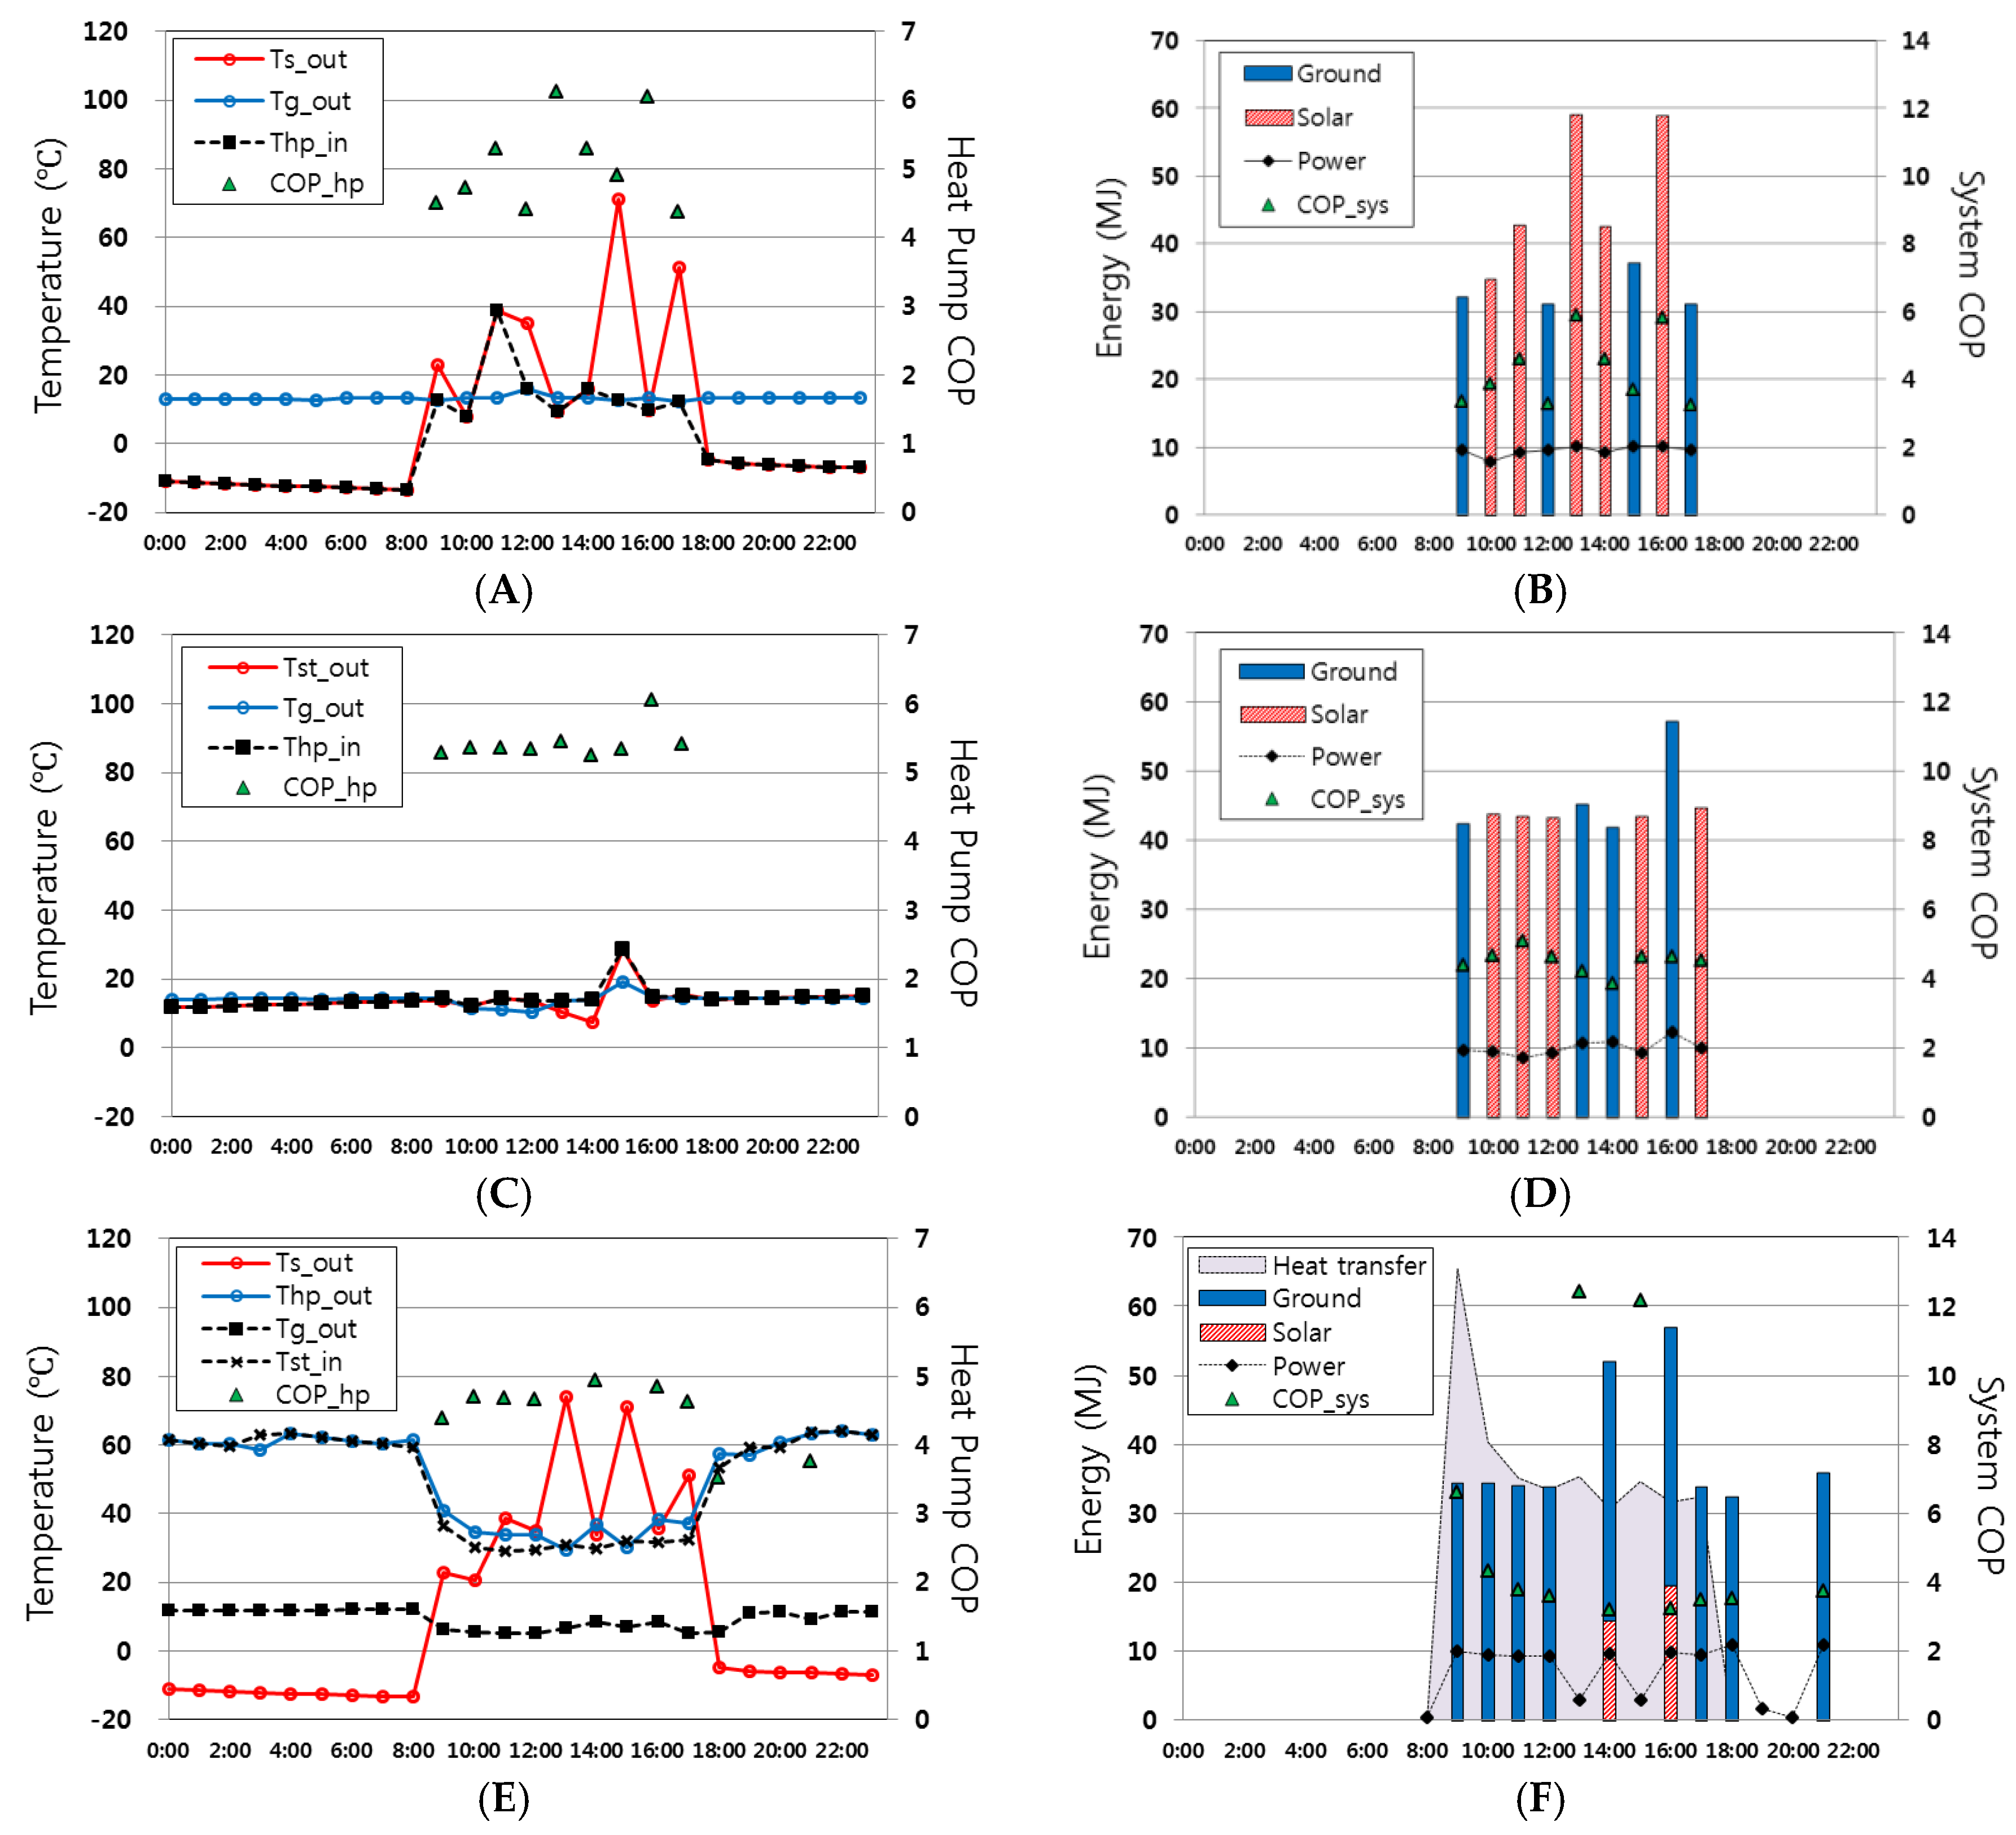
Figure 4 shows the variations in the heat source temperature and COP when the operation schedule is Daytime on the representative day of 13th on January.
According to Figure 4, SYSTEM 1 and 2 use the ground heat source which is higher than the solar heat when the heating operation starts. After the solar radiation rises, it was found that the solar heat source utilization was increased. Unlike SYSTEM 1, the heat source temperature is stable in SYSTEM 2 since it uses the solar energy stored in the thermal storage tank. In addition, the heat pump COP took on a similar pattern with the heat source temperature. In SYSTEM 3, the heat pump system basically uses the ground heat and the temperature of the fluid entering the storage tank rises temporarily if the solar heat is collected. However, the number of times being collected is unusual, so that it seems hard to use the solar heat effectively. Moreover, unlike SYSTEM 1 and 2, the heat pump system in SYSTEM 3 works additionally during non-heating time in order to maintain the temperature of the storage tank.
According to the variation in energy production from each heat source, the result shows a similar pattern with the heat source temperature as mentioned above. As shown in SYSTEM 1, the energy production rates are different depending on the heat source. When using the stable ground heat source, the energy generates relatively steadily. However, if using solar heat, it was found that the production rate was different depending on the temperature of the heat source. On the other hand, SYSTEM 2 shows a stable result since it uses the stored solar heat. In SYSTEM 3, the energy is produced in various amount because this system is controlled by the temperature of the storage tank, and it operates even during non-heating times. In addition, the system COP could vary with the heat transfer and the result indicated that system COP is over 12 at 13:00 and 15:00. This is because the stored heat source responded to the load with only pumping operations even though the system didn’t generate any heat energy from either the solar or ground sources.
Table 2 shows the main simulation results of long-term operation for 3 months, which are about energy production, average heat pump inlet temperature, power consumption and COP. 
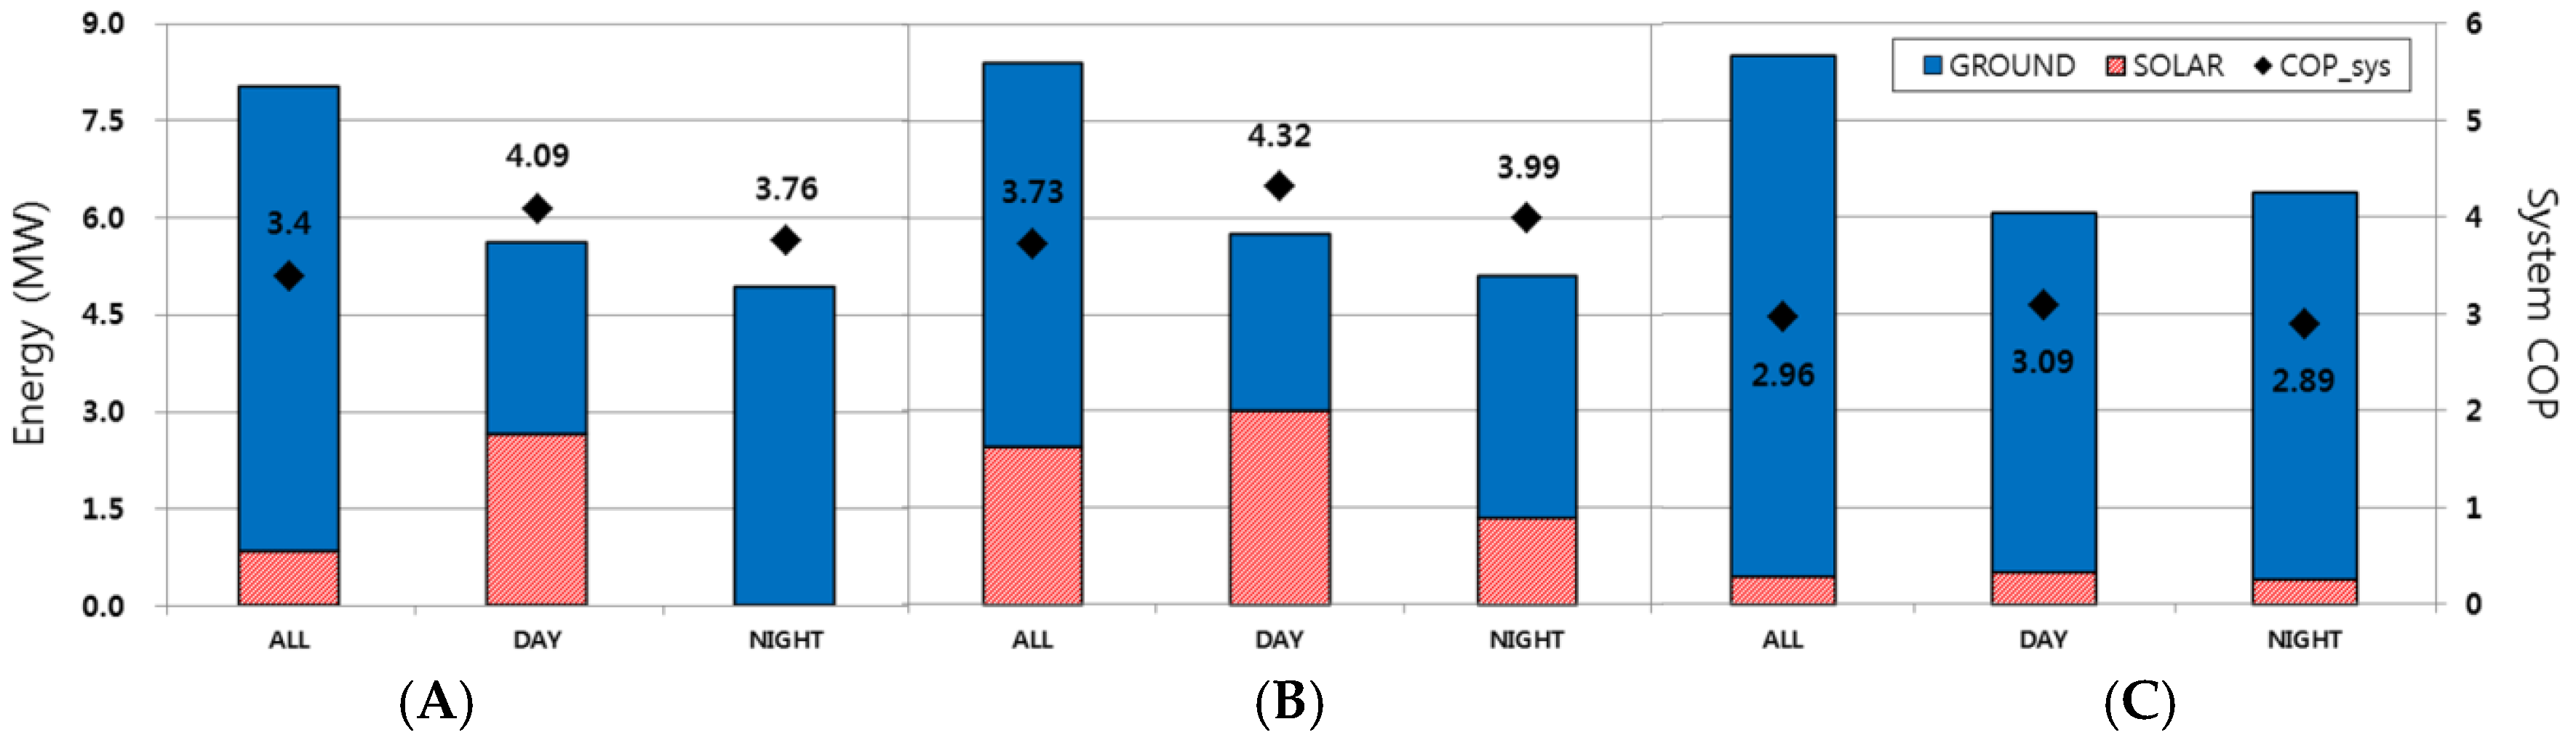
Figure 5 displays the energy production rate from each heat source and COP in diagram form.
As seen in Figure 5, the solar heat of SYSTEM 1 contributed 47% in the Daytime energy but 0% at Nighttime. In addition, the utilization in All day is determined to be 10% lower than that in Daytime. This is because the ground heat was utilized basically to respond to the load and maintain the indoor thermal environment, so the solar heat utilization was reduced.
On the other hand, the solar heat of SYSTEM 2 contributed 52% in Daytime energy, 5% higher than SYSTEM 1. Moreover, even at Nighttime, SYSTEM 2 could respond to the load using the solar heat stored during the day. In addition, the ratio of solar heat utilization is 29% in All day, 19% higher than in SYSTEM 1. From this view point, it could use the solar heat effectively if applying the thermal storage tank on the solar collector side. However, the contribution of solar heat in SYSTEM 3 was indicated at about 5%–8%. This means that it is difficult to collect the solar heat over 60 °C as seen in Figure 4.
System COP is the lowest when operating All day in all system cases, since the ground temperature decreases when using the ground heat continuously. This can be explained with Figure 6. The system COP shows the highest value in Daytime which utilizes solar heat the most and it was determined that the system COP in Daytime of SYSTEM 2 was determined to be 4.32 at most. Otherwise, SYSTEM 3 got the lowest system COP value. Furthermore, among the system cases, SYSTEM 2 got better COP values in every operation schedule and the maximum performance difference is 40% during Daytime compared with SYSTEM 3.
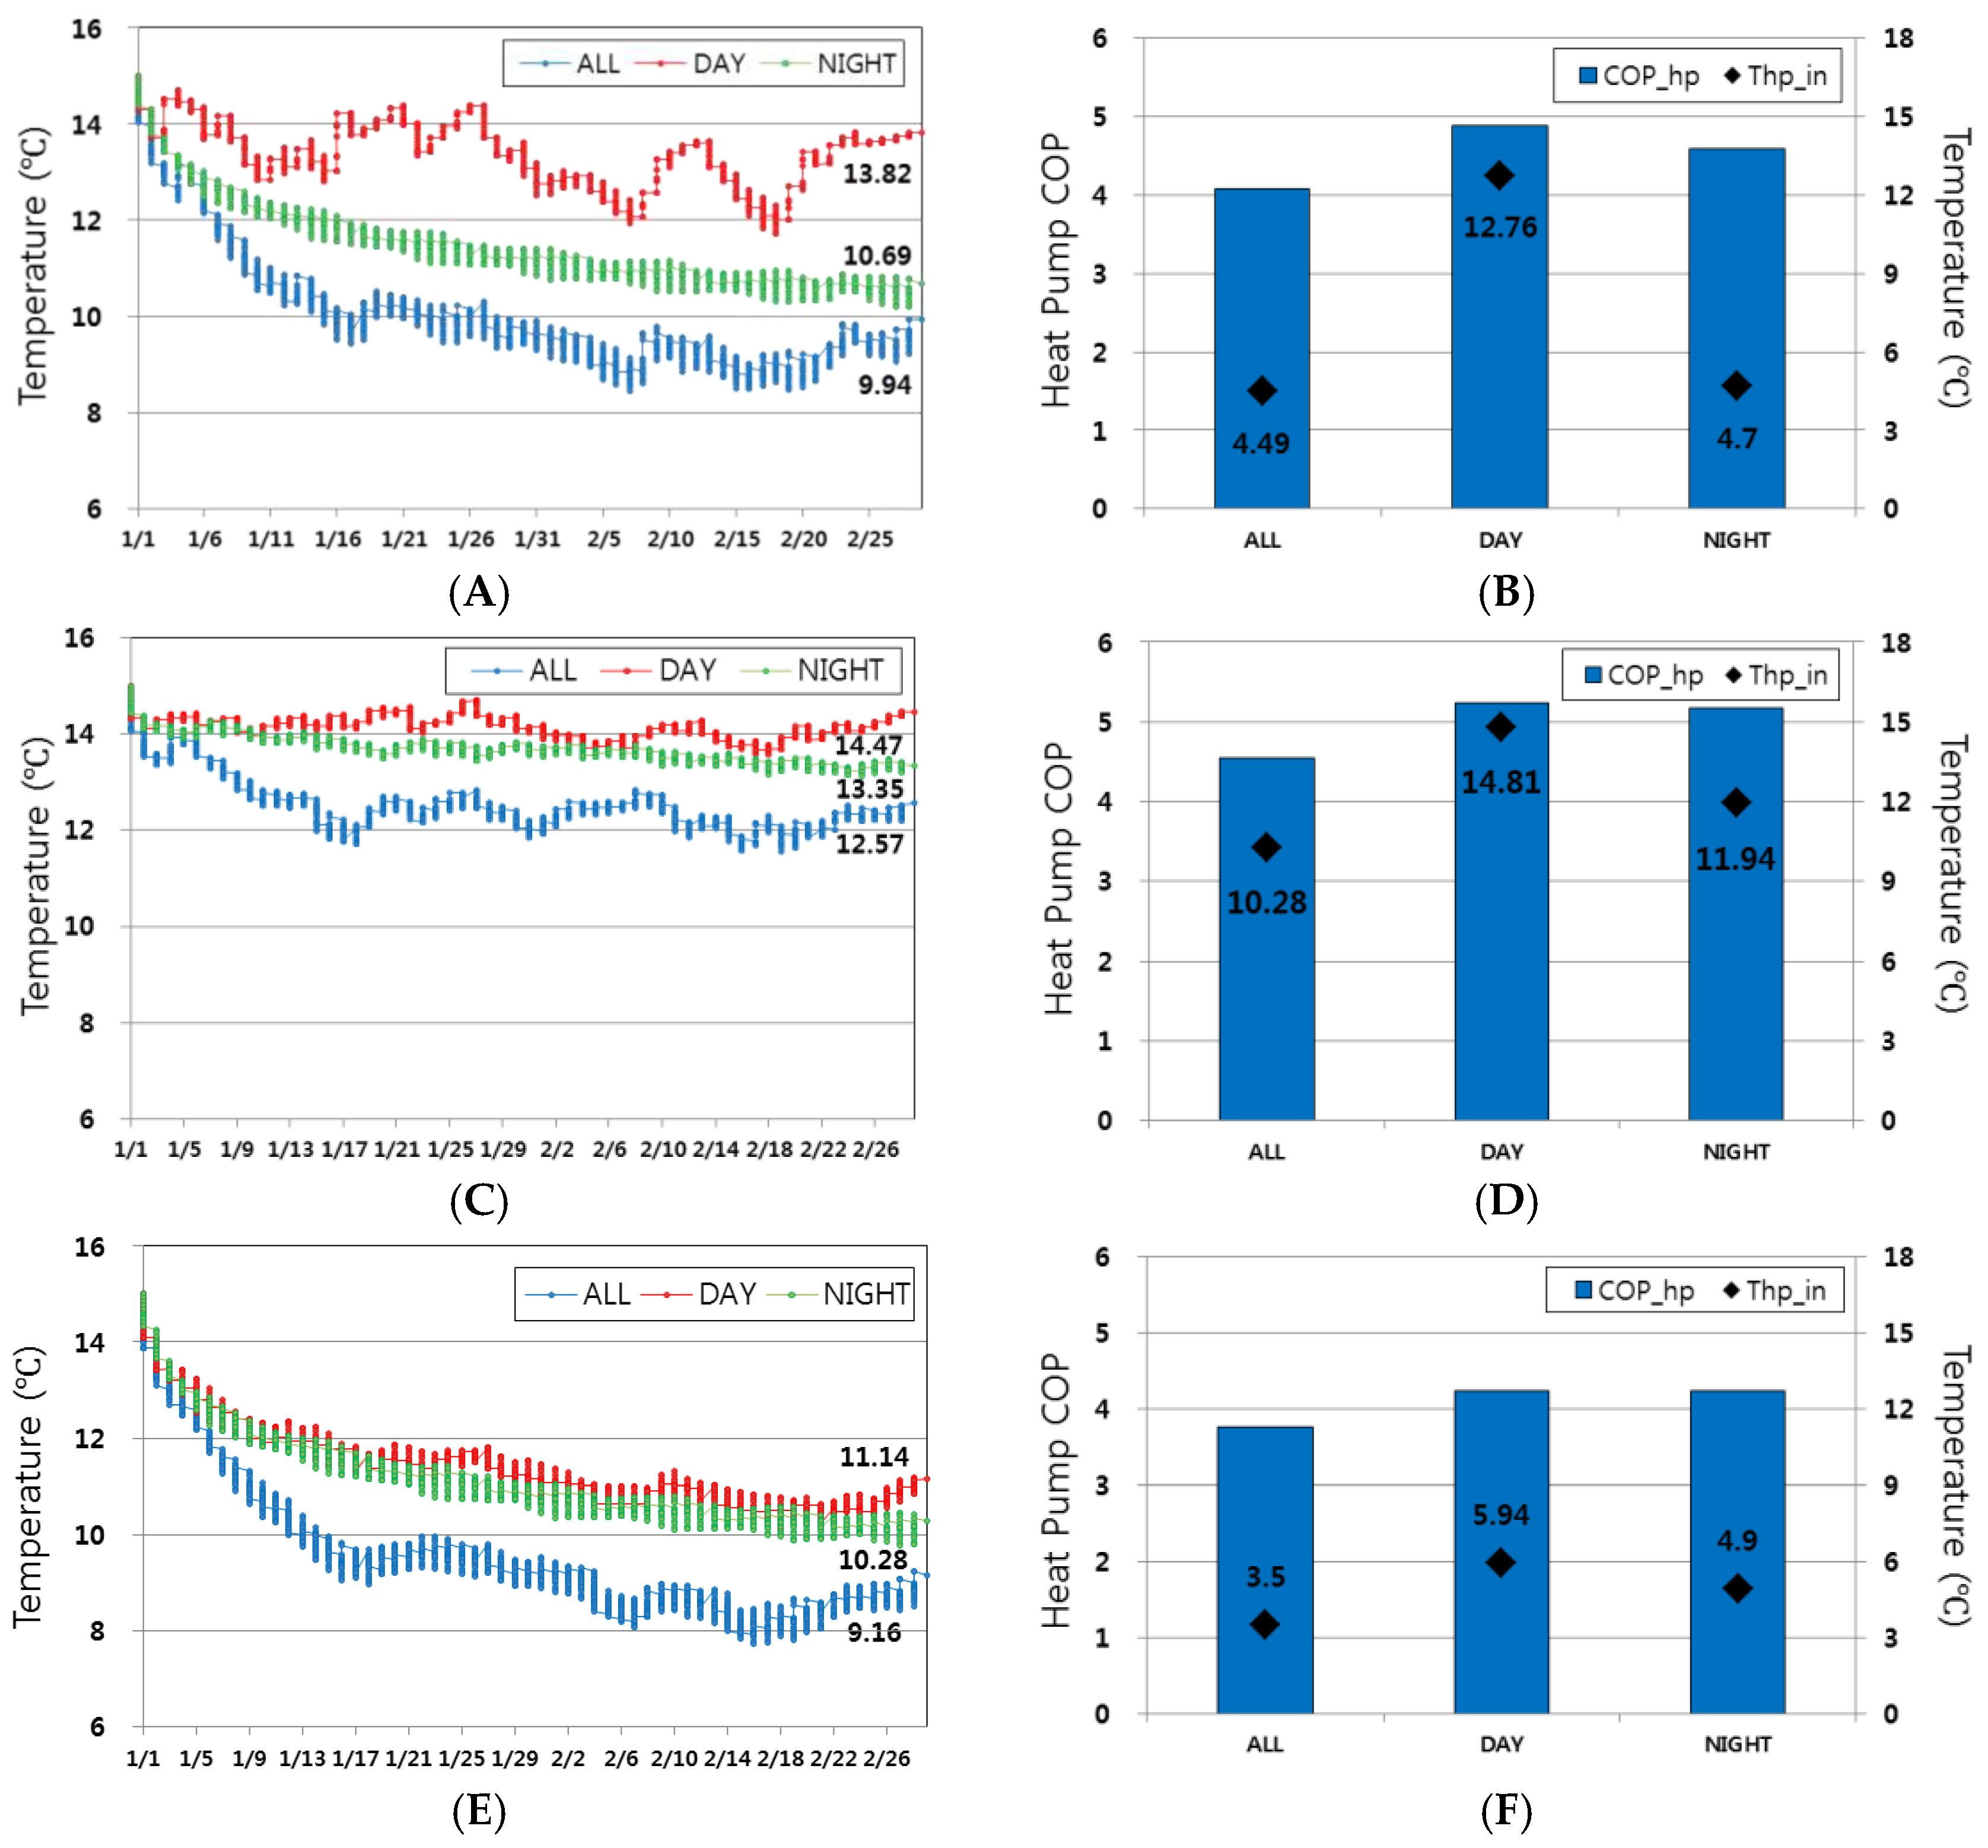
Figure 6 represents the variations in the ground and heat pump inlet temperature and COP after long-term operation for 3 months. The results show that the ground temperature decreases the most in All day operation, so that the system COP is the lowest. Comparing among systems, SYSTEM 3 has the highest ground temperature drop by 9.16–11.14 °C, while SYSTEM 2 has the lowest by 12.57–14.47 °C.
Looking at the average temperature entering the heat pump in all systems, the temperature and COP is lower in All day operation since the operation time is more than for other schedules. Compared with other systems, the average heat source temperature of SYSTEM 2 is around 10.28–14.81 °C. This is because SYSTEM 2 uses not only the solar heat over 15 °C stored efficiently but also a relatively higher ground temperature. Accordingly, the heat pump COP shows similar patterns. SYSTEM 1 uses only ground heat at Nighttime so that the average heat source temperature is 4.7. This means that the temperature is relatively lower than in a system that uses solar heat efficiently such as SYSTEM 2. In SYSTEM 3, the average heat source temperature and COP are low because this system uses not only solar heat inefficiently, but also ground heat mainly to keep the storage tank as 60 °C. Consequently, it is determined that the control temperature needs to be changed to operate more efficiently with SYSTEM 3.

4.2. Performance Analysis with Different Control Temperatures

Through the analysis of the initial design, it was realized that the performance could vary with the control temperatures such as the solar outlet temperature and thermal storage tank outlet temperature. Therefore, this section describes the analysis on the variations in the control temperature with SYSTEMS 2 and 3.
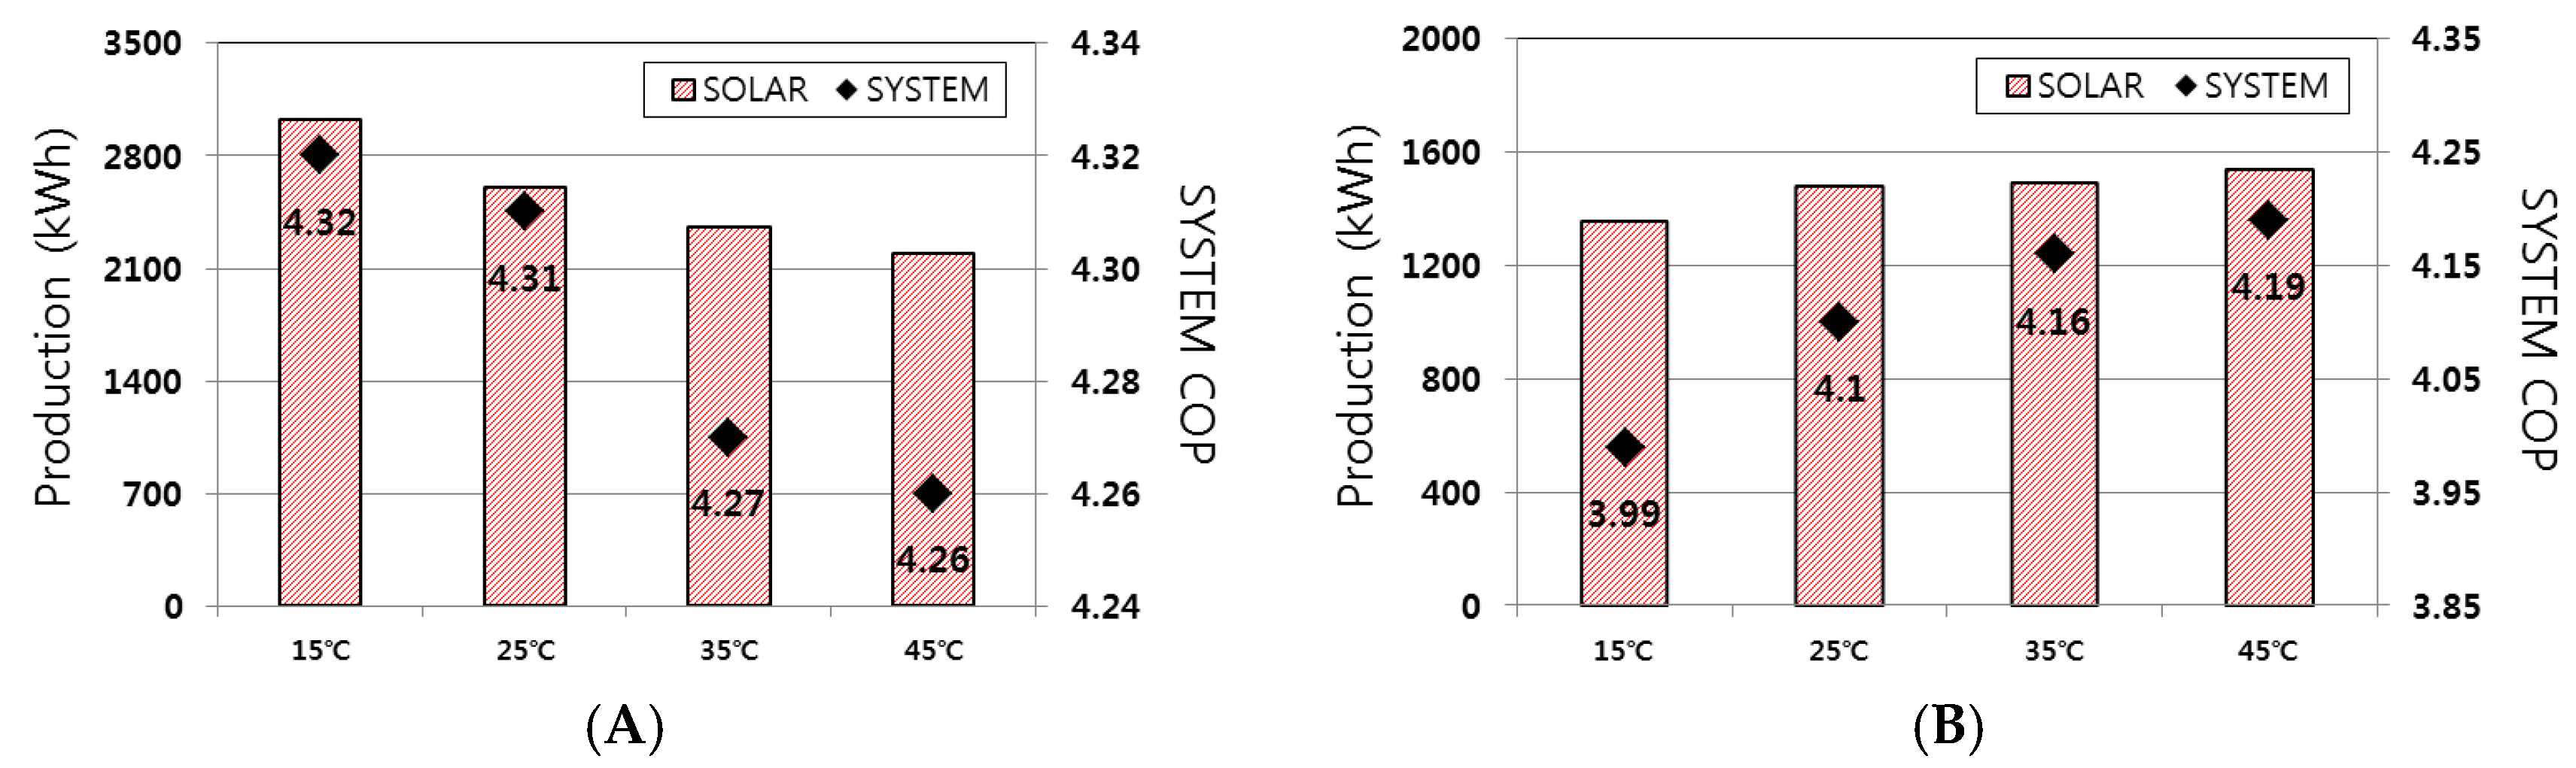
 Table 3 and Figure 7 indicate the simulation results depending on the solar collection temperature in SYSTEM 2. As seen in Figure 7, the solar heat utilization was decreased by increasing the control temperature and the system COP declined with higher usage of ground heat during the Daytime. On the other hand, the solar heat was increased as a higher solar collection temperature and the collected solar heat weren’t used effectively during the Nighttime. This means that there was heat loss in the storage tank. Therefore, it was figured out that collecting higher temperature solar heat gives more effective utilization at Nighttime.
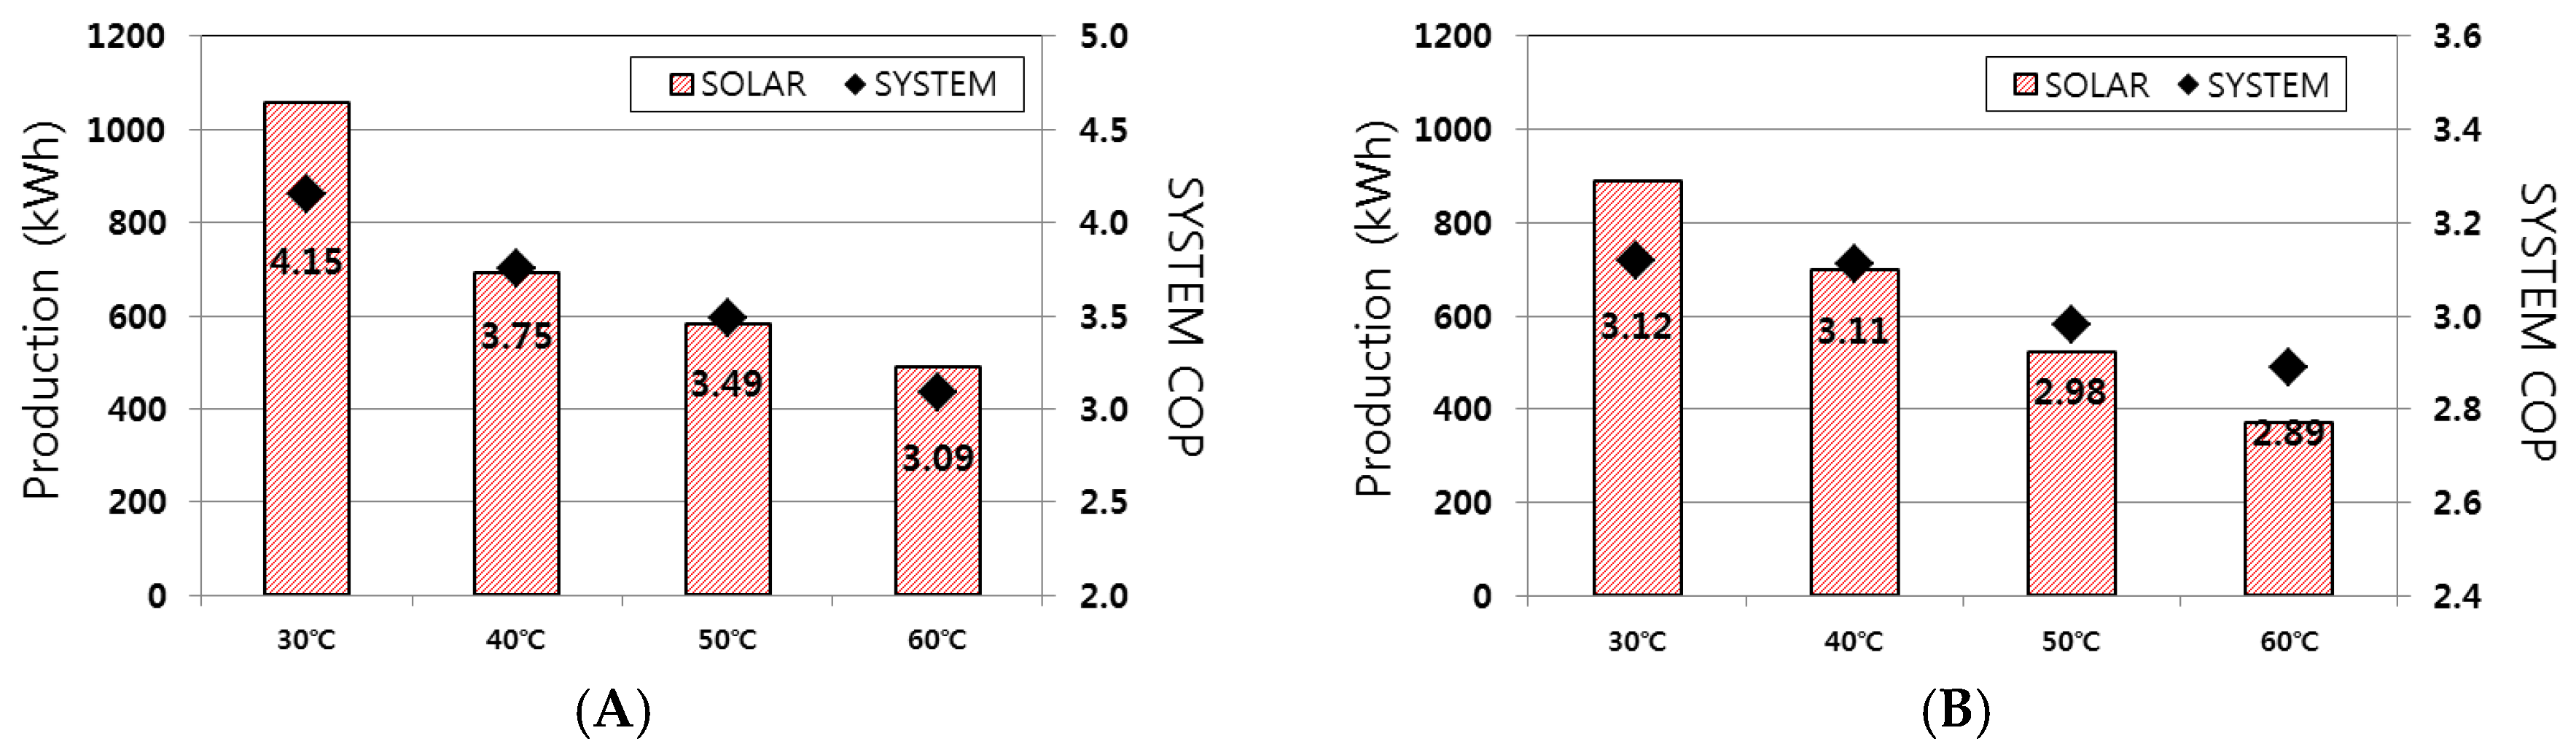
Table 4 and Figure 8 show the performance results depending on the solar collection and storage tank control temperature in SYSTEM 3. The result indicated that the solar utilization was decreased with increasing the control temperature during both Day- and Nighttime.
On the other hand, the ground temperature decreases continuously in order to keep the storage tank temperature stable, so it makes the COP values decrease simultaneously. Therefore, it was determined that the performance was more efficient if the control temperature is lower in SYSTEM 3.

4.3. Performance Analysis in Different Locations

In this section, the simulation model was used to analyze the performance in different climate zones in order to determine the most effective climate to install the SAGSHP system, which was set as SYSTEM 2 in this paper. According to the International Climatic Zones from the ASHRAE Standard [21,22], five locations in different climate zones were selected and hot climate zones were excluded to identify the performance in heating mode. Moreover, the analysis model was set under identical conditions for each location, which is important to compare the performance of identical systems in different climate zones. Table 5 indicates simulation results for each location, which are average outdoor temperature and daily solar radiation in winter (January and February), total heating demand and electricity consumption during the analysis period and system COP calculated from the results.
As a result, the highest system COP was 4.51 in Winnipeg. Even though the outdoor temperature in Winnipeg is so low that it needs the most heating demand, the system utilized solar heat energy effectively with higher solar radiation. On the other hand, the system COP was the lowest in Valencia in spite of the highest solar radiation. This would be considered that Valencia required low heating demand but the pump was excessively worked to store high solar energy. Berlin, Stockholm and Seoul show similar outdoor temperatures and heating demand, although the system COP was higher in Seoul where the solar radiation is higher. In addition, it was found that the system COP was related with the heating demand. Therefore, it was determined that the SAGSHP system operates efficiently in high solar radiation and cool climate zones which require more heating demand.

4.4. Feasibility Assessment with Different Systems

In this section, Return on Investment (ROI) analysis was conducted by calculating investment costs and annual operation costs for economic feasibility of the suggested systems compared with the conventional system. For each system it was assumed that Case 1 uses diesel boiler in winter and an electronic heat pump (EHP) in summer, Case 2 uses only GSHP and Cases 3, 4 utilize SAGHP (SYSTEM 1) and SAGHP (SYSTEM 2) suggested in this study. The analysis was conducted for five locations and different operation schedules, and the operation period was from November to February in winter and from June to August in summer under identical conditions.
The energy consumption depends on the performance of the system. Therefore, the EHP performance curve was referred to the outdoor temperature [23]. In Cases 2–4, the energy consumptions were calculated by the performance curves described in this paper. Then, the electricity costs were determined using the standard unit price of the Korean Electric Power Corporation (KEPCO) [24] and Diesel fuel costs were calculated by applying the unit price from the Korean National Oil Corporation (KNOC) in October, 2015 [25].
In addition, the initial investment costs were calculated after organizing the consistent heating and cooling equipment, which are energy systems, pumps, pipes and drilling cost for the geothermal system. Each cost was referred to the estimated cost from the professional geothermal corporation and the industrial price registered in Korean Ministry of Finance and Economy [26]. Maintenance costs of each system were estimated using the repair and replacement cycle examined in [27]. As a major system, it was assumed that the boiler and EHP are changed after 15 years and geothermal system and solar system is replaced in 20 years. Table 6 shows the estimated results including the investment costs, annual operation costs and 30 years maintenance costs of each system in the representative case of operating All day in Seoul.
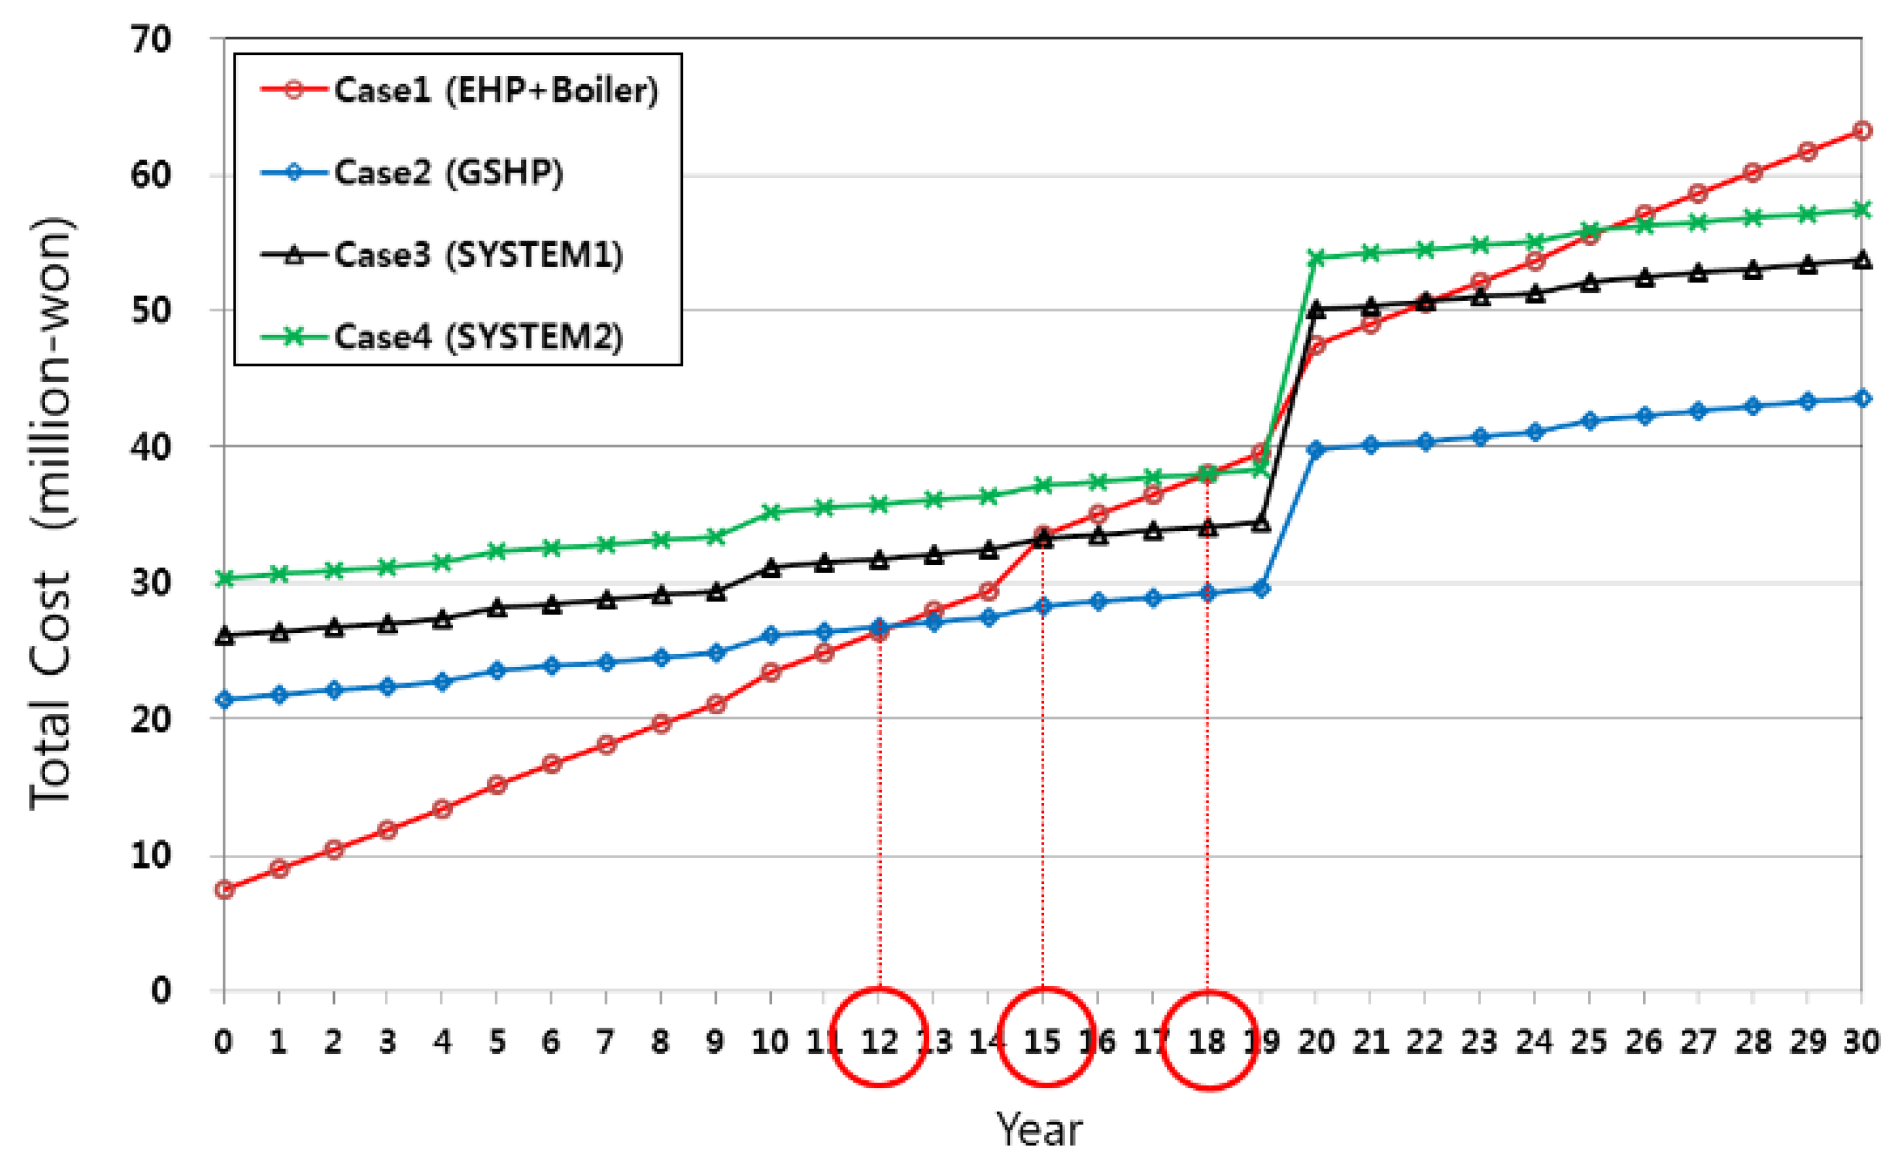
Figure 9 shows the total LCC result. The LCC analysis applied the present value method from the calculated cost in each system. Then, the real discount rate is −0.22% which reflects the recent economic situation in Korea for a detailed prediction [28]. The following Equations (7)–(9) are utilized in the present value method and the non-repetitive cost calculated with Equation (7) and the repetitive cost estimated with Equation (8) are added to determine the total present value [29]:
P F   =   F i ( 1 + i ) n
P A   =   A [ ( 1 + i ) 1 ] i ( 1 + i ) n
P = PF + PA
As seen in the figure, SYSTEM 1 and SYSTEM 2 have higher investment costs than the conventional boiler and EHP. However, the total LCC of the developed systems could be less than that of the conventional system, by reducing annual operation costs. In this regard, the investment costs by installing the developed systems instead of the conventional system can be paid back and then, the payback period can be calculated. The payback period is 12 years in a GSHP system, 15 years in SYSTEM 1 and 18 years in SYSTEM 2. In addition, the value of the SAGHP system becomes higher than the conventional system by the replacement of the system though, it recovers again.
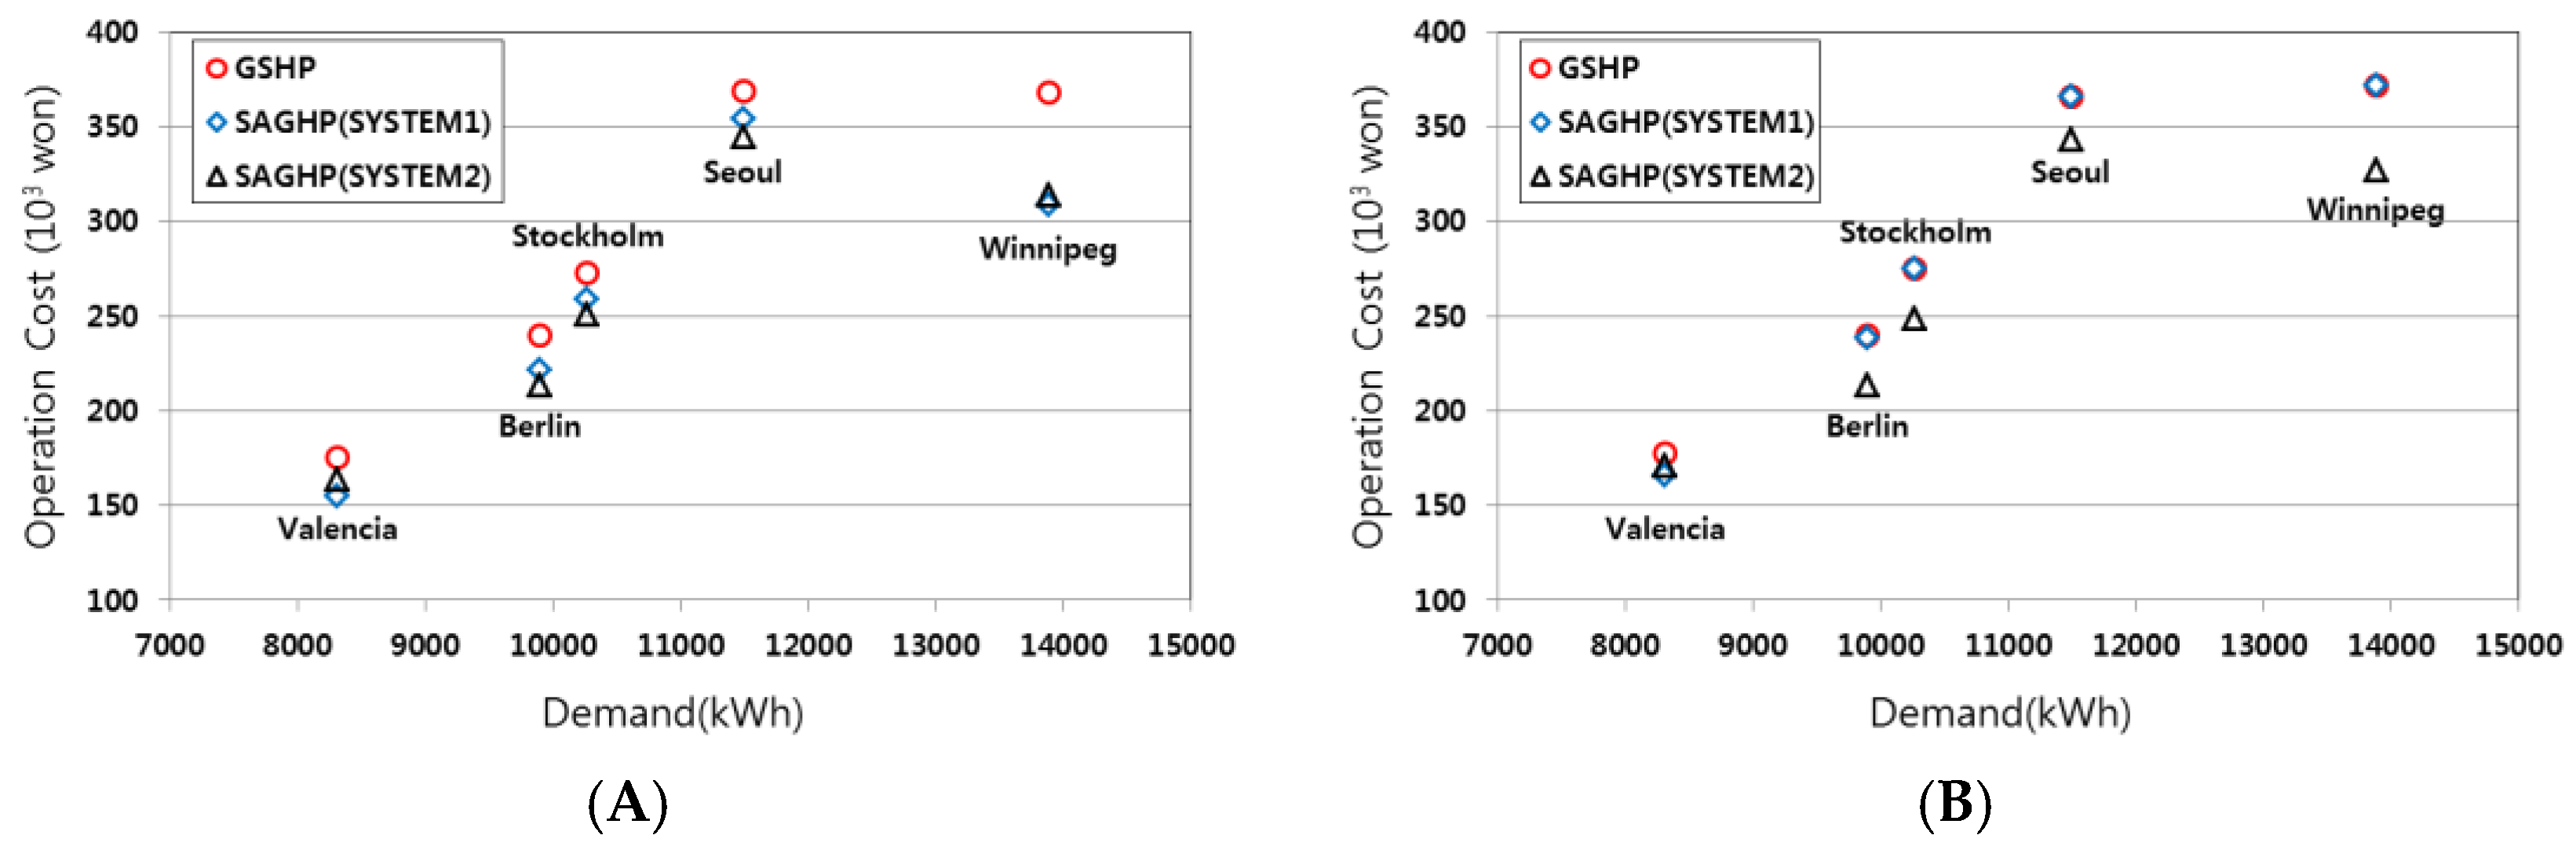
Figure 10 indicates the operation costs in each location which require different demands. Following the Daytime result, it was confirmed that SAGHP system has less operation costs than the geothermal system. Regarding the difference of the costs, the biggest difference was found in Winnipeg, which has the highest heating demand and higher solar radiation to work the SAGHP system efficiently. In addition, SYSTEM 2 has less costs rather than SYSTEM 1 in Seoul, Stockholm and Berlin, since it efficiently utilized the stored solar energy. However, in Valencia it was found that SYSTEM 2 required a higher cost than SYSTEM 1 due to the exclusive operation of solar storage due to the relatively large amount of solar radiation. In Nighttime, the cost of SYSTEM 1 was similar to the geothermal system because it can’t use solar energy, so SYSTEM 2 shows the lowest operation costs.
Table 7 shows the economic analysis result of each system at different locations including operation cost, payback period and cost per demand. In this table, the Daytime result is representatively indicated and the figures show a similar pattern as the other operation schedules.
According to the operation cost per demand, the value of the SAGHP system was reduced about 80% in Valencia, 74% in Seoul, 82% in Berlin, 82% in Stockholm and 84% in Winnipeg. Comparing the results in each location, it was figured out that the payback period was the shortest in Winnipeg where the required demand is the highest.

5. Conclusions

In this study, in order to design an optimum SAGHP system, three types of performance prediction model were developed considering the design factors focused on the thermal storage tank. Individual performance analysis models were quantitatively analyzed long-term by using dynamic energy simulations. The conclusions of this study are as follows:
  • It was confirmed that the heat source temperature from the thermal storage tank is more stable without any operation schedule constraints. Therefore, the heat source temperature was 14.81 °C in SYSTEM 2 which has a thermal storage tank and it makes the heat pump have the highest heat pump and system COP values of 5.23 and 4.32.
  • According to the utilization rate of the heat sources, the higher utilization of solar energy could reduce the rate of energy extraction from the ground, as we see in SYSTEM 2 which has a heat storage tank for only the solar system, and the soil temperature could decrease slowly up to 2.43 °C in long term operation which means the system uses the solar heat source efficiently. In this regard, the system performance using the ground heat source can be higher with a relatively stable ground temperature.
  • Depending on the control temperature, the system performance could differ in SYSTEM 2 and SYSTEM 3. In SYSTEM 2, the temperature has a relatively small influence on the system COP. However, especially in SYSTEM 3 which placed a storage tank on the load side in parallel, the system COP was improved by a maximum 25% from 2.89 to 4.15, so one needs to set the proper control strategy for the introduction area.
  • Considering the different geographical and climatic conditions, it was determined that the SAGHP system operates efficiently in high solar radiation and cool climate zones which produce more heating demand. In this paper, the case of Winnipeg required the largest heating demand and showed the highest system COP as 4.51.
  • Furthermore, it was figured out that the developed systems could reduce annual operation costs significantly compared with the conventional boiler and EHP system but by a little amount compared to a GSHP system. In addition, the investment costs of the developed systems were estimated to be excessivy due to the fixed capacity of the system for comparison of each system.
In the future, various optimum design methods considering the system capacities and investment costs will be examined by utilizing simulations coupled with the developed model.

Acknowledgments

This work was supported by the New & Renewable Energy Core Technology Program of the Korea Institute of Energy Evaluation and Planning (KETEP), granted financial resource from the Ministry of Trade, Industry & Energy, Republic of Korea. (NO. 20133030110900).

Author Contributions

The authors Min Gyung Yu and Yujin Nam defined the performance analysis models, developed the methodology and wrote the full manuscript. The authors Youngdong Yu and Janghoo Seo analyzed and double-checked the results and the whole manuscript.

Conflicts of Interest

The authors declare no conflict of interest.

Abbreviations

The following abbreviations are used in this manuscript:
TIndoor temperature (°C)
TsSolar source temperature (°C)
TgGround source temperature (°C)
TstAverage temperature of storage tank (°C)
Ts,inInlet fluid temperature of the solar collector (°C)
Ts,outOutlet fluid temperature of the solar collector (°C)
Tst,inInlet fluid temperature of the storage tank (°C)
Tst,outOutlet fluid temperature of the storage tank (°C)
Tg,inInlet fluid temperature of the borehole (°C)
Tg,outOutlet fluid temperature of the borehole (°C)
Thp,inTemperature of liquid entering from the source side of heat pump (°C)
Thp,outTemperature of liquid exiting to the load side of heat pump (°C)
QBuilding load (kW)
QsUseful solar heat energy gain (kW)
QstEnergy supply from the storage tank (kW)
QgEnergy extracted from the ground heat exchanger (kW)
QhpHeat transfer rate to load (kW)
WhpPower consumption of the heat pump (kW)
WpumpPower consumption of the circulation pump (kW)
COPhpThe heat pump coefficient of performance
COPsysThe system coefficient of performance
mFlow rate of the liquid (kg/h)
cSpecific heat of the liquid (kJ/kg K)
βDamping factor
PFPresent value of future cash
PACapitalization factor of annuity
FCost incurred after n years
AAnnual cost
iDiscount value

References

  1. Oh, J.H.; Nam, Y. Study on the effect of ground heat storage by solar heat using numerical simulation. Energies 2015, 8, 13609–13627. [Google Scholar] [CrossRef]
  2. D’Antoni, M.; Sparber, W. IEA-SHC Task 44/Annex 38 Solar and Heat Pump Systems. 2013. Available online: http://task44.iea-shc.org/ (accessed on 2 February 2016).
  3. Ochs, F.; Dermentzis, G.; Feist, W. Minimization of the residual energy demand of multi-storey passive house—Energetic and economic analysis of solar thermal and PV in thermal and PV in combination with a heat pump. Energy Procedia 2014, 48, 1124–1133. [Google Scholar] [CrossRef]
  4. Girad, A.; Gago, E.J.; Muneer, T.; Caceres, G. Higher ground source heat pump COP in a residential building through the use of solar thermal collector. Renew. Energy 2015, 80, 26–39. [Google Scholar] [CrossRef]
  5. Bakirci, K.; Ozyurt, O.; Comakli, K.; Comakli, O. Energy analysis of a solar-ground source heat pump system with vertical closed-loop for heating applications. Energy 2011, 36, 3224–3232. [Google Scholar] [CrossRef]
  6. Dai, L.; Li, S.; DuanMu, L.; Li, X.; Shang, Y.; Dong, M. Experimental performance analysis of a solar assisted ground source heat pump system under different heating operation modes. Appl. Therm. Eng. 2015, 75, 325–333. [Google Scholar] [CrossRef]
  7. Si, Q.; Okumiya, M.; Zhang, X. Performance evaluation and optimization of a novel solar-ground source heat pump system. Energy Build. 2014, 70, 237–245. [Google Scholar] [CrossRef]
  8. Emmi, G.; Zarrella, A.; De Carli, M.; Galgaro, A. An analysis of solar assisted ground source heat pumps in cold climates. Energy Convers. Manag. 2015, 106, 660–675. [Google Scholar] [CrossRef]
  9. Reda, F.; Arcuri, N.; Loiacono, P.; Mazzeo, D. Energy assessment of solar technologies coupled with a ground source heat pump system for residential energy supply in southern European climates. Energy 2015, 91, 294–305. [Google Scholar] [CrossRef]
  10. Ozgener, O.; Hepbasli, A. Experimental performance analysis of a solar assisted ground-source heat pump greenhouse heating system. Energy Build. 2005, 37, 101–110. [Google Scholar] [CrossRef]
  11. Trillat-Berdal, V.; Souyri, B.; Fraisse, G. Experimental study of a ground-coupled heat pump combined with thermal solar collectors. Energy Build. 2006, 38, 1477–1484. [Google Scholar] [CrossRef]
  12. Trillat-Berdal, V.; Souyri, B.; Fraisse, G. Coupling of geothermal heat pumps with thermal solar collectors. Appl. Therm. Eng. 2007, 27, 1750–1755. [Google Scholar] [CrossRef]
  13. Han, Z.; Zheng, M.; Kong, F.; Wang, F.; Li, Z.; Bai, T. Numerical simulation of solar assisted ground-source heat pump heating system with latent heat energy storage in severely cold area. Appl. Therm. Eng. 2008, 28, 1472–1436. [Google Scholar] [CrossRef]
  14. Nam, Y. Study on the optimum design of a heat pump system using solar and ground heat. J. SAREK 2012, 24, 509–514. [Google Scholar] [CrossRef]
  15. Nam, Y.; Gao, X. Study on the performance simulation of the heat pump system using solar and geothermal heat source. J. Korean Sol. Energy Soc. 2014, 34, 75–81. [Google Scholar] [CrossRef]
  16. TRNSYS. Available online: http://sel.me.wisc.edu/trnsys (accessed on 2 February 2016).
  17. Nam, Y.; Gao, X.; Yoon, S.H.; Lee, K.H. Study on the Performance of a Ground Source Heat Pump System Assisted by Solar Thermal Storage. Energies 2015, 8, 13378–13394. [Google Scholar] [CrossRef]
  18. Duffie, J.A.; Beckman, W.A. Solar Engineering of Thermal Process, 4th ed.; John Wiley & Sons, Inc: Hoboken, NJ, USA, 2013. [Google Scholar]
  19. Hellström, G. Duct Ground Heat Storage Model, Manual for Computer Code; University of Lund: Lund, Sweden, 1989. [Google Scholar]
  20. Nam, Y.; Oh, J.H. Study on the characteristic of heat exchange for vertical geothermal system using the numerical simulation. J. Korean Sol. Energy Soc. 2014, 34, 66–72. [Google Scholar] [CrossRef]
  21. American Society of Heating, Refrigerating and Air-Conditioning Engineers. 2009 ASHRAE Handbook—Fundamentals; American Society of Heating, Refrigerating and Air-Conditioning Engineers: Atlanta, GA, USA, 2009. [Google Scholar]
  22. American Society of Heating, Refrigerating and Air-Conditioning Engineers. ASHRAE Standard 90.1-2007 (I-P); American Society of Heating, Refrigerating and Air-Conditioning Engineers: Atlanta, GA, USA, 2008. [Google Scholar]
  23. Lazzarin, R.; Busato, F.; Noro, M. Heat pumps in refurbishment of existing buildings. J. Fed. Eur. Heat. Vent. Air Cond. Assoc. REHVA 2012, 6, 45–49. [Google Scholar]
  24. Korean Electric Power Corporation (KEPCO). Available online: http://cyber.kepco.co.kr (accessed on 2 February 2016).
  25. Korea National Oil Corporation (KNOC). Available online: http://www.opinet.co.kr (accessed on 2 February 2016).
  26. Offer & Merchandise Mall (OMMall). Available online: http://ommall.net/ (accessed on 2 February 2016).
  27. Lee, I.G.; Kang, H.W.; Won, Y.M.; Kim, Y.S. Economic Evaluation for Heating and Cooling System by Using Gas Energy and Geothermal Energy Based on LCC Analysis. J. Archit. Inst. Korea 2011, 10, 161–168. [Google Scholar]
  28. Lee, C.; Lee, E.B. Analysis on Real Discount Rate for Prediction Accuracy Improvement of Economic Investment Effect. Korean J. Constr. Eng. Manag. 2015, 16, 101–109. [Google Scholar] [CrossRef]
  29. Yu, M.G.; Nam, Y. Feasibility Assessment of Using Power Plant Waste Heat in Large Scale Horticulture Facility Energy Supply Systems. Energies 2016, 9, 112. [Google Scholar] [CrossRef]
Figure 1. Schematic diagram of the solar-assisted ground heat pump system (SAGHP) [14].
Energies 09 00291 g001
Figure 2. Conceptual diagram of systems [15]. (A) SYSTEM 1 [14]; (B) SYSTEM 2; (C) SYSTEM 3.
Energies 09 00291 g002
Figure 3. Performance curve of the heat pump.
Energies 09 00291 g003
Figure 4. Simulation result of the representative day (13th January). (A,B) SYSTEM 1; (C,D) SYSTEM 2; (E,F) SYSTEM 3; (A,C,E) heat source temp. and heat pump coefficient of performance (COP); (B,D,F) production and system COP.
Energies 09 00291 g004
Figure 5. Energy production and system COP in case. (A) SYSTEM 1; (B) SYSTEM 2; (C) SYSTEM 3.
Energies 09 00291 g005
Figure 6. Simulation results of heat pump in case. (A,C,E) Ground temperature; (B,D,F) heat pump inlet temp. and COP; (A,B) SYSTEM 1; (C,D) SYSTEM 2; (E,F) SYSTEM 3.
Energies 09 00291 g006
Figure 7. Solar heat production and COP according to the control temperature in SYSTEM 2. (A) Day; (B) Night.
Energies 09 00291 g007
Figure 8. Solar heat production and COP according to the control temperature in SYSTEM 3. (A) Day; (B) Night.
Energies 09 00291 g008
Figure 9. Life cycle cost results (All day, Seoul).
Energies 09 00291 g009
Figure 10. Operation cost calculation according to five different climate locations. (A) Day; (B) Night.
Energies 09 00291 g010
Table 1. Basic parameters of simulation.
ItemsUnitValue
Building
Design temperature°C20
Scalem10 × 10 × 3
U-Value of external wall, ceiling, floorW/(m2K)0.418, 0.193, 0.583
Solar collectors
Aream220
Tilted angle°45
Ground heat exchangers (GHEs)
Inner diametermm26
Outer diametermm32
Center-to-center half distancemm50
Pipe thermal conductivityW/(m·K)0.41
Boreholes
Fill thermal conductivityW/(m·K)1.5
Number-1
Depthm150
Diametermm200
Ground
Soil thermal conductivityW/(m·K)3.5
Soil densitykg/m33000
Heat capacitykJ/m3·K2920
Pump
FlowrateL/min30
PowerW230(solar), 340(ground)
Operation schedule
Allh00:00–24:00
Dayh08:00–18:00
Nighth21:00–07:00
Table 2. Simulation results.
SYSTEM 1SYSTEM 2SYSTEM 3
ScheduleALLDAYNIGHTALLDAYNIGHTALLDAYNIGHT
Production (kWh)Solar820.62638.202459.33022.31354.4422.1489.4371.9
ground7212.22984.74930.25949.72744.33756.08085.75570.76005.1
Avg. heat source (°C)4.4912.764.7010.2814.8111.943.505.944.90
Power (kWh)HP1961.01151.41071.81850.11102.9986.22148.41317.41414.8
Pump401.5221.6239.0401.6238.8294.4605.1461.3451.5
COPHP4.094.884.594.555.235.183.764.234.24
System3.404.093.763.734.323.992.963.092.89
Table 3. Simulation results according to the control temperature in SYSTEM 2.
CaseControl Temperature (°C)Operation ScheduleHeat Source (°C)Production (kWh)COP
SolarGroundHeat PumpSystem
115DAY14.813022.32744.35.234.32
225DAY14.932601.03054.65.214.31
335DAY16.142361.93261.75.154.27
445DAY16.642192.93430.05.144.26
515NIGHT11.941354.43756.05.183.99
625NIGHT12.071480.93807.95.194.10
735NIGHT12.191494.43658.85.204.16
845NIGHT12.201538.73590.35.214.19
Table 4. Simulation results according to the control temperature in SYSTEM 3.
CaseControl Temperature (°C)Operation ScheduleHeat Source (°C)Production (kWh)COP
SolarGroundHeat PumpSystem
130DAY8.191056.93478.64.814.15
240DAY7.34694.64412.74.633.75
350DAY7.14583.14827.14.443.49
460DAY5.94489.45570.74.233.09
530NIGHT6.08890.34958.94.703.12
640NIGHT5.61700.85326.34.453.11
750NIGHT5.43523.15790.34.382.98
860NIGHT4.90371.96005.14.242.89
Table 5. Simulation results according to the five different climate conditions.
LocationLatitudeLongitudeOutdoor Temperature (°C)Solar Radiation (kJ/m2day)Heating Demand (kWh)Electricity Consumption (kWh)COPSYS
Valencia (Spain)39.50N0.47W11.32454.73797.81058.33.59
Seoul (Korea)37.57N126.97E−2.23436.05766.61334.44.32
Berlin (Germany)52.38N13.52E0.25159.15168.81210.54.27
Stockholm (Sweden)59.37N17.90E−4.50113.45116.11188.44.31
Winnipeg (Canada)49.92N97.23W−16.22361.86199.21373.94.51
Table 6. Calculated costs for LCC analysis in each case (thousand won). Electronic heat pump: EHP.
CaseSystemInvestment CostsAnnual Operation CostsMaintenance Costs
Case 1Boiler + EHP752014549887
Case 2GSHP21,46731611,400
Case 3SAGHP (SYSTEM1)26,16730117,040
Case 4SAGHP (SYSTEM2)30,36728417,040
Table 7. Payback period results in five climate conditions (Daytime).
LocationDemand (kWh)SystemOperation Cost (103won)Cost/Demand (103won/kWh)Payback Period
Valencia8304Boiler + EHP80997-
GSHP1762119
SAGHP (SYSTEM 1)1551939
SAGHP (SYSTEM 2)1642045
Seoul11,483Boiler + EHP1370119-
GSHP3693214
SAGHP (SYSTEM 1)3543117
SAGHP (SYSTEM 2)3453029
Berlin9885Boiler + EHP1269128-
GSHP2402414
SAGHP (SYSTEM 1)2222217
SAGHP (SYSTEM 2)2142228
Stockholm10,263Boiler + EHP1439140-
GSHP2732713
SAGHP (SYSTEM 1)2592515
SAGHP (SYSTEM 2)2512418
Winnipeg13,876Boiler + EHP1981143-
GSHP368279
SAGHP (SYSTEM 1)3092212
SAGHP (SYSTEM 2)3142314

