1. Introduction
The future utility grid will be characterized by tight integration between power electronics, sensing, protection, control, communications technologies, and distributed energy resources (DER). Most DER will be installed on the distribution network which, already in its current state, lacks the proper communication and control network necessary to control the applicable resources [
1]. A communication infrastructure needs to be designed to provide a more efficient and flexible way to manage the energy flow keeping interoperability in mind [
2,
3]. On one hand, this type of integration can dramatically improve the grid performance and efficiency, but on the other, it can also introduce new types of vulnerabilities to the grid [
4] complicating system analysis and the design process [
5]. Understanding the dynamic behavior and expected performance of such complex cyber-physical systems (CPS) is challenging. A hardware/software-based smart grid [
6] testbed infrastructure is required to represent the interaction of cyber and physical components to understand the system dynamics and evaluate new designs [
5]. The testbed should provide the necessary hardware and software environment to perform different types of experiments such as hardware-in-the-loop (HIL) as well as software-in-the-loop (SIL) operational control in real-time. Since the CPS is a multidisciplinary system, the testbed should provide a standard and flexible interface to integrate with other testbed facilities from different domains for resilience studies. This type of integration provides the scalability to represent large cyber physical systems [
7] and enable cooperation between researchers from multidisciplinary fields for a better understanding of different domain interactions. Ensuring interoperability between different equipment, software packages, and protocols is challenging. Real-time operation and data exchange is another challenge. Several smart grid and CPS testbeds have been developed to represent the cyber-physical interaction on the smart grid. However, none of them provide the tools and interface to integrate several testing platforms into a scalable system that can also be expended to accommodate new types of services, components, and operation scenarios [
8,
9,
10].
The communication middleware is a critical component in a smart grid testbed and control. The communication middleware provides an abstraction layer to simplify and manage the communication between different nodes without being concerned with the complexity of hardware layers or network details [
3,
11,
12]. Moreover, the middleware should provide a standard application programming interface (API) to different applications and controllers. Using a standard API reduces the efforts needed to develop new devices and applications for the smart grid. Several types of communication middleware are available and used in different industrial and control applications. In [
3], surveys for different middleware architectures for the smart grid were provided. The communication middleware can be categorized into message- and data-centric. Most old protocols used in utility applications utilize message-centric middleware. However, the new data-centric middleware approach has more advantages over the message-centric, as it has more ability to be expanded.
The research work presented in this paper aims to: (1) solve the scalability and interoperability problems related to message-centric approaches by implementing a common data bus based on the data-centric approach; and (2) propose a hybrid hardware/software testbed infrastructure that seamlessly integrates communication, control, modeling software packages, and physical components. This framework enables a better understanding of the dynamic behavior and performance of complex CPS. The design of the data structure and standard interface for the testbed is provided. The proposed testbed interface not only allows for integration with other testbeds, but also enables remote experimental features which allow performing experiments, testing developed algorithms, and collecting data remotely. The developed infrastructure is also scalable for real smart grid applications, such as a microgrid control network.
The remaining parts of this paper are organized as follows:
Section 2 describes the physical setup of the system while
Section 3 discusses the communication middleware utilized in smart grid applications. The implementation of the data distribution service (DDS) infrastructure on a smart grid testbed is described in
Section 4. The results of the implemented communication infrastructure performance test is discussed and analyzed in
Section 5.
Section 6 summarizes the components of the developed Matlab toolbox for remote operation as well as the control and automation of the smart grid testbed. The experimental results validating the proposed system are discussed in
Section 7. The conclusions of this work are given in
Section 8.
3. Communication Middleware for Smart Grid Applications
The communication middleware for smart grid applications should consider the special requirements for real time control. Microgrids and low inertia generator control need low data latency to support fast control actions and maintain stability. The communication middleware should also provide a wide range of quality of service (QoS) profiles to meet the different needs of controllers and data types [
3,
11]. For example, the measurement data could be discarded in case of a delay when a new sample becomes available while the circuit breaker (CB) states should be persistent to ensure its proper operation. Certain types of data are tolerant to delays such as smart meters and power quality measurements while other data, such as data related to protection and fault detection, are sensitive to delay. The middleware should be aware of the data types and requirements to provide the correct priority for each data type. The communication reliability is essential in real-time applications [
11]. The middleware implementation should also avoid a bottleneck and single point of failure in the communication network [
15].
The smart grid implementation involves data exchange from local and remote nodes. These nodes represent devices manufactured by different vendors and owned by different entities. The middleware should abstract the complex network details from the user and provide a simple communication interface without dealing with complex details about the network topology and nodal information, such as a location or address [
16].
One of the main challenges in the smart grid is the dynamic participation of different devices and systems ranging from smart appliances to large systems, such as microgrids [
3]. The communication middleware should provide the way to handle dynamic participant nodes and auto discovery features for new nodes. The communication and power network topology should have the capability to be changed under catastrophic or emergency conditions. An auto discovery and dynamic participation feature will support the reconfiguration of a distributed control system. The modern grid is very susceptible for future expansions; thus, the used middleware and communication infrastructure should be capable of handling these new expansions. An expansion process should be done without the need to redesign or modify the implemented protocols. Furthermore, the communication middleware must provide a standard communication interface to ensure interoperability among different vendors and devices. To ensure system operation and reliability, the communication network should be protected by a proper encryption and authentication mechanism. The middleware should provide the security features embedded in the implementation to secure the data exchange and prevent altering data or violating customer privacy [
17]. Since most smart grid controllers and intelligent electronic devices (IEDs) use low power processors with limited memory and hardware resources, the middleware implementation must support a small footprint for limited resource devices [
3].
The communication middleware can be categorized into two main categories: message-centric and data-centric. The differences between both and selection criterion will be discussed in detail in the following subsection.
3.1. Message-Centric Middleware Approach
The data exchange in the message centric approach is based on defining a set of messages and data formats to support the expected data types and usage scenarios. These messages are predefined and embedded in nodes. The unit of the information is the message; the message can contain different types of information. The communication middleware has no information about message content or data types, thus the message parsing, data filtering, and integrity check is done on the application level. Each node must be responsible for assuring the correctness of the data types it receives as any mismatch can cause malfunctioning of the application. Each node must track the state of the data of interest locally [
18].
This approach has several drawbacks. Implementing the message parsing and integrity checks on the application level puts more responsibility on the control application developer, which makes the development more complex and time consuming. Filtering the data of interest at the application layer causes poor network utilization, wasting bandwidth and adding extra processing overhead on the application processor.
Using a set of predefined messages puts some limitations on the system expandability when expansion requires defining new data types or operating scenarios [
3]. Since the message handling is done at the application level, any change in the message formats or data types requires major changes on the application implementation. Increasing the complexity of the control application by using the message centric approach can increase the chance of software bugs and decrease the overall system reliability. The vendor-dependent implementation of message parsing and handling algorithms could lead to a wide range of different vulnerabilities adding more complexity for system maintenance [
18].
3.2. Data-Centric Middleware Approach
In this approach, the application is developed to deal with data types of interest only without any concern with the message structure or network details. The message is built by the middleware to update a change in the system state [
19]. The message structure is derived directly from the system data model. Since the message is created by the middleware, the communication infrastructure will be aware of the message contents and data types. The data centric infrastructure does all the message parsing, data filtering, and integrity checks on the middleware level to ensure the delivery of correct data types and the system state to all nodes.
This approach offers more capabilities over a traditional message-centric approach. Moving the message processing responsibility from the application to middleware layer not only simplifies the application development, but also increases the system reliability by reducing the number of errors in results from different implementations of message parsing. Implementing the data filtering on the middleware layer could result in a more optimum utilization of the network bandwidth [
18]. The infrastructure awareness of the data types make it possible to assign different QoS, priorities, and security levels based on the data types instead of the message in the message-centric approach.
Since the middleware is responsible for all message processing tasks and the applications are concerned only with the data object, adding new data types will not require modification of existing applications. This feature is essential for an expandable system, such as the smart grid.
Figure 2 depicts both middleware approaches where message-centric is on the left and data-centric on the right. The proposed framework utilized the DDS middleware which belongs to data centric communication middleware. The DDS has unique features which improve the smart grid communication over message centric communication as described below:
DDS moves the message construction, message parsing, data filtering, and validation from application to middleware. Moving the message construction process from application to middleware improves the system scalability and enable adding new types of data for new operation scenarios without the need to modify existing application. Performing message parsing and data filtering by the middleware simplifies the task of developing control application for smart grid without any concern about message structure, error checking, or network details since these entire tasks will be done by the middleware.
DDS utilizes real-time publisher-subscriber protocols which enable peer-to-peer communication without a message broker. This communication scheme improves the smart grid reliability by avoiding a single point of failure. Publisher-subscriber and peer-to-peer communication provide a more suitable environment for distributed controllers.
DDS supports automatic discovery of newly-joined devices and their data structure. This feature allows dynamic participation of network nodes which are important especially for microgrids, where different nodes can join and leave the microgrid network, such as electric vehicles and smart devices.
Unlike other communication methods which apply QoS profiles for whole data stream or protocols, DDS can apply different QoS for each data type which gives more flexible communication management and leads to a predictable behavior. QoS profiles give the ability to define the allowed latency budget, data durability for late joining devices, and data lifespan. More descriptions of QoS and its synergy to the power application will be provided in the next section.
4. Data Distribution Service Infrastructure for Smart Grid Testbed
The communication network infrastructure for the testbed should provide a flexible and scalable environment to connect different system components and exchange information in real-time. There are different types of communication networks. One of these types is client-server network communication. In this type, the communication is centrally managed by the server. This central management represents a single point of failure and bottleneck which could affect the reliability of the network. While in peer-to-peer communication, the communication is established directly between the nodes without a message broker, which is hard to manage in large networks [
15]. To meet the hard real-time requirement and scalability of the testbed, the DDS middleware is chosen for the communication network. The DDS utilizes publisher-subscriber without a message broker scheme which simplifies the communication between different nodes [
20,
21,
22]. Furthermore, the DDS is data-centric middleware which helps to maintain the focus on the algorithm and control development rather than being concerned with communication and data delivery issues [
19,
21]. The data-centric approach also allows assigning different QoS profiles to an individual data type instead of the whole stream.
Highly motivated by its high reliability and unique features, the DDS found its way to be used in a wide variety of mission critical applications. For example, DDS is implemented by the US Navy and Lockheed Martin in radar and ship management systems [
23]. Furthermore, DDS has been adopted in Air Traffic Control centers in some European countries [
24], large financial firms, automation and SCADA systems for large projects, including Grand Coulee dam in Washington State (USA) [
25], and automotive applications. The DDS is selected by the smart grid interoperability panel (SGIP) and Duke Energy for Open field message bus (OpenFMB) implementation to create a distributed, intelligent platform that supports publisher-subscriber messaging [
26].
The real-time publisher-subscriber wire protocol (RTPS) ensures the interoperability [
27], real-time performance and automatic discovery of new services. Moreover, the publisher-subscriber protocol is utilized by the IEC 61850 protocol and has started to gain more popularity in IEDs [
11]. The standard API for the DDS middleware provides the necessary tools to integrate with different simulation and analysis software with support of several programming languages such as C, C++, and JAVA.
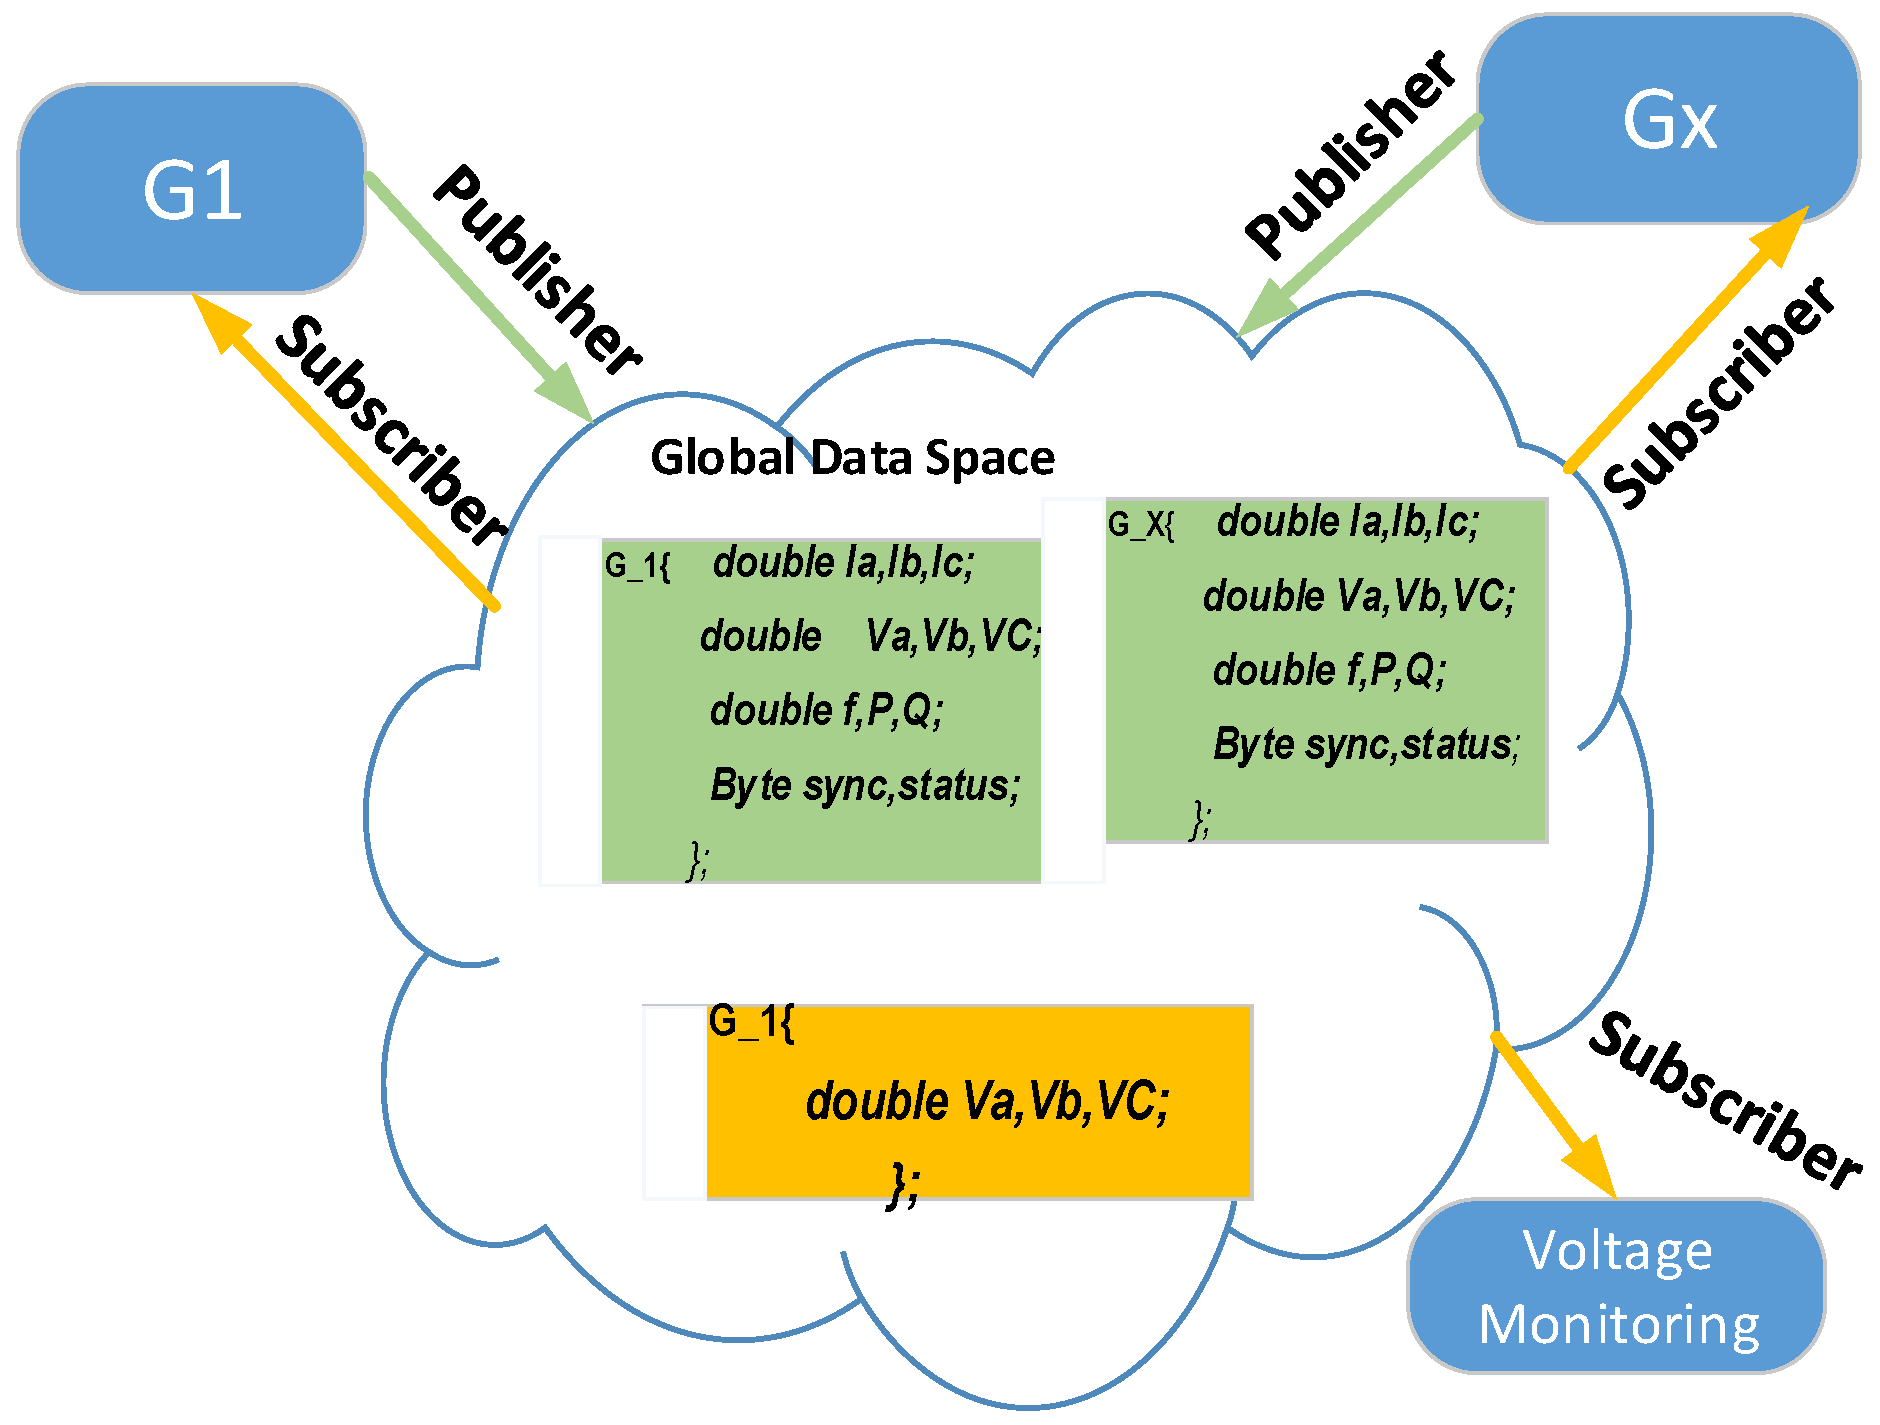
Based on the data-centric approach, implementing the DDS needs to define a data model for the system. This data model defines the structure of the data and its relation amongst physical hardware objects. In order to build a data model for the testbed, a data structure was defined for each testbed object. The structure for each object defines the object type and related data. Each object has a unique descriptive name and several topics defining the data related to this object. For example, the data structure for the generators is shown in
Figure 3. The structure name represents the object name and each variable represents one of the object parameters that can be read or modified by the other object.
Table 1 shows a list of objects and related topics. As shown in
Table 1, each row represents a system object and its related topics. For example, the first row depicts the generator data. G_x is the object type where x is the generator index. In the second column, the related topics are defined:
Ia,
Ib,
Ic are the three-phase currents,
Va,
Vb,
Vc are the three-phase voltages,
f is the frequency, (
P,
Q) are the active and reactive power, and
sync is the synchronization signal. In the microgrid case, the object type is MG_x and similar topics such as the ones in the G-X are defined except the topic “
mode”. This topic controls the microgrid operation mode in either islanded- or grid-connected operation. For the smart meter object SM_x, the
PA and
QA topics represent the accumulated active and reactive energy, respectively. For the PV emulator PV_Em_x,
Ir and
Temp topics represent the solar irradiance and temperature, respectively.
Ws is the wind speed for the wind turbine emulator object.
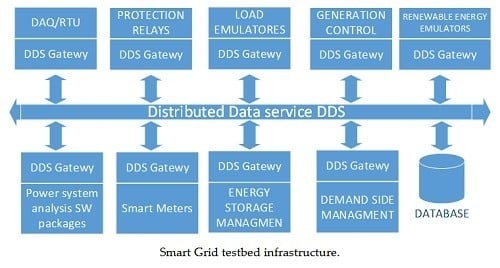
Figure 3 shows the DDS infrastructure for the smart grid testbed. The measurements from data acquisition (DAQ) and smart meters were collected and published to a global data space. The DDS DAQ and controller is implemented on an embedded board based on the Sitara AM35xx chip from TI which provides a high-performance 32-bit 1 GHz ARM processor and two slave 32-bit 200 MHZ programmable real-time units (PRU) on-chip. The main processor is utilized to run the operating system and manage the communication. The PRU are utilized to handle hard real-time, fast IO operation, DAQ, and data pre-processing. Linux, with a real-time kernel, is chosen as the operating system to manage hardware resources and provide the TCP/IP stack. For DDS implementation, an open source library provided by real-time innovation (RTI) is used and compiled to work on the embedded ARM board. The DDS library provides the API for Java and C++. For this application, the C++ API was chosen to achieve maximum performance and avoid using a virtual machine. The acquired measurements collected from analog to digital converters or digital inputs are published to the DDS global data space to be made available to all applications. The data subscriber receives the control command/references and digital output status and forwards it to digital and analog outputs. The protocol translator, shown in
Figure 4, is developed to provide an interoperability layer between the DDS and generator speed controllers. These speed controllers are controlled via RS-232 or RS-485. Similar translators can be used for other devices, such as programmable power supplies or load emulators. The controllers and applications can subscribe to receive measurement data or publish control commands for load emulators, generation control, or CBs. As shown in
Figure 5, the DDS will serve as a common data bus that connects all the system devices and applications.
After defining the data model for the smart grid testbed, it is very important to define the QoS that will be used by the infrastructure to exchange the data. Since the DDS is a content-aware middleware, it allows attaching of different QoS policies for each data type and treats each type in a different way instead of applying the same policy on the whole data stream. The user can create custom QoS profiles to control the data exchange for each application. This feature helps to achieve a predictable network behavior with a large number of nodes and different communication requirements [
19,
28]. The QoS policy defines a different set of rules that controls how the data will be sent and handled by the infrastructure. This set of rules is defined below:
The data availability rule controls the availability of the data for a lately joined subscriber. This rule can be set to a volatile or non-volatile option. If the data availability is set to volatile, when any publisher publishes or updates any data, all current subscribers will receive the updated data at the instance of update. Any subscriber who joins the network after the update instance will not be able to receive the last update. This option is suitable for periodically changing data, such as voltage and current measurements, where the data is updated frequently and old data loses its importance after a short period of time.
The non-volatile data option forces the DDS infrastructure to make the data available for a lately-joined subscriber by storing a local copy of the data. This option is necessary for certain types of data that represent the system state and topology (e.g., CB status, generator running state, etc.). This type of information is not updated frequently and will not lose its importance over time. Late-joined nodes must be able to get this type of information when they join the network at any time. The length of the old data that will be made available can also be controlled by the history option. Some applications could function better if they receive longer historical data, such as energy management systems (EMS) that consider the load pattern and utilize prediction algorithms. For this type of application, the DDS can keep longer history data. For example, late-joined EMS should be able to receive the power consumption measures for the past 24 h.
The life span rule defines how long old data will be valid. The infrastructure will remove the old non-volatile data that exceed the defined life span. This QoS rule ensures that the control application will not interact based on old invalid data.
This rule allows defining the priority for the latency sensitive data. The data with a low latency budget will be sent ahead of the data with a higher latency budget. The protection-related data is always set with the lowest latency budget. Smart meter measurements, price signals, and environment data, such as irradiance and wind speed, are set to highest latency budget.
In the unicast communication, the publisher sends a copy of the data for each subscriber node as shown in
Figure 6a. For example, EMS and demand-side management systems can subscribe to receive the price and consumption data published by a smart meter. In this case, two copies of the same data will be sent over the network [
11]. If a smart appliance subscribes to the same data, a third copy will be sent to the new subscriber. The bandwidth used to send the data will increase linearly as the number of the nodes subscribing to the data increases. This method of communication could be suitable for local high-speed networks and it is simple to configure, but is not the ideal method when considering transmitting data over the wide area network (WAN) or a low speed communication line in the case of wide area measurements and Phasor measurement unit (PMU) data. For the data requested by multiple readers, it is better to use a multicast communication scheme. In the multicast, the publisher sends only one copy of the data for the remote subscriber as shown in
Figure 6b. The bandwidth is independent on the number of subscriber nodes. Only one copy will be sent over the WAN communication line. At the receiving end, the router will forward a copy of the data to each subscriber. In order to use the multicast communication scheme for certain data, a multicast QoS policy has to be applied to this data.
RTI DDS has additional features that address the challenges of low or limited bandwidth and high latency networks. DDS supports transport priority which enables the control of priority bandwidth utilization [
29]. The RTI DDS allows the application to control the traffic load by limiting the maximum throughput and peak bursts [
29]. The DDS also gives the application full control over the real-time scheduling policy. DDS supports three different types of scheduling policies: round-robin (RR), earliest deadline first (EDF), and highest priority first (HPF). The RR scheduling distributes the tokens uniformly across all non-empty destination queues.
In EDF, scheduling the sample deadline is determined by the latency budget and the time it was written. The priorities are determined by the earliest deadline across all samples. The EDF distributes the token to destination queues in the order of their deadline priorities. If two samples have the same priority, the corresponding queues will be served in a RR fashion. In HPF, scheduling the queues is served based on the publication priority. If two samples have equal priorities, the queues will be served in a RR fashion. The EDF is the default scheduler for the DDs and meets smart grid real-time application needs since it can dynamically assign priorities to transmitted samples based on its latency budget and deadline. In this way, the scheduler will always give highest priority to the sample closest to the deadline to avoid violating the latency budget. The critical data will gain a high priority by assigning a low latency budget.
6. Testbed Remote Interface Toolbox
Based on a defined data structure for the testbed objects, a Simulink toolbox was developed to provide an interface between Matlab/Simulink and testbed hardware. This toolbox allows users to perform an experiment, control testbed hardware in real-time, and collect the data through an Ethernet network. A routing service can be used to allow remote access and experimentation through a high speed virtual private network (VPN) connection. The main blocks for the main objects of the testbed are defined as the following:
The domain creator block creates and initiates the domain for the DDS where all the publishers and subscribers share the data in a global data space.
A control block was defined for the generators as shown in
Figure 9a. The inputs are as defined in
Table 1. Each generator block contains two inputs for the publisher and subscriber configuration. Two types of generator blocks are defined based on the control mode either speed control for a slack generator or power control for other generators in the system.
The block controlling the CB is shown in
Figure 8b. This block receives the CB control signal and controls the actual CB.
The load is represented by a block with two inputs for the active and reactive power reference signals and is shown in
Figure 9c.
The busbar block, as shown in
Figure 9d, has three outputs representing the voltages of the three phases.
The transmission line block reads three signals for the three phase currents (shown in
Figure 9e).
The microgrid is represented by a block which controls the active and reactive power flow from and to the microgrid. Furthermore, it reads all the AC and DC voltage and current measurements from the hardware. The block with inputs and outputs are shown in
Figure 9f.
The smart meter block is shown in
Figure 9g. This block receives the total accumulated active and reactive power consumption from the physical smart meter as well as the accumulated power over the last minute and hour only. In addition, it receives the RMS values for voltage and current.
The physical energy storage is controlled through the block shown in
Figure 9h. This block receives the voltage and current measurements and the calculated State of Charge (SoC) from the energy storage controller. In addition, it sends a current reference to control the charging and discharging of the energy storage array. Some types of energy storage, such as lithium ion, are temperature sensitive. Thus, this block is flexible for additions as other parameters can be added depending on the energy storage type.
A real-time subscriber service can be configured to monitor the required data and store this data in a MySQL database server for later analysis, as well as storing published data onto a database server. This data can represent a real load, solar irradiance, or a wind speed pattern. The publisher-subscriber configuration defines the data rate, object, topic name, and data tables. The integration with the database server simplifies the data logging during experiments and utilizes historical collected data for testing new algorithms. Each block in the toolbox allows defining a QoS profile individually for each topic. The settings for QoS profiles are defined in a XML file. Preset QoS profiles were created to provide the necessary QoS settings for each type of data. The QoS profile for CB signals is configured to provide the minimum possible latency with a durability option set to store and deliver the data to a late or newly-created subscriber. This setting ensures the delivery of a CB control signal and correct initializations when joining the network, even if the subscriber created it after transmitting the control command. For measurement signals, each sample is time-stamped two times. The first time is stamped by the sender at the transmission instant and then stamped at the receiver at the receiving instant. To ensure synchronization and a correct order of samples, the QoS profile for measurement signals were set to deliver the data ordered by the sender time stamp.
The implementation of the HIL is depicted in
Figure 10. It can be seen that the control algorithm is simulated in the Matlab/Simulink environment. The control command is transmitted to the real hardware using the developed interface toolbox over the network using the DDS middleware and specified QoS. Real-time feedback from the physical measurement points are transmitted back to the Simulink model. The generator block in the HIL model replaces the regular Simulink simulation model for a synchronous machine with the actual machine. This capability makes it possible to consider the real behavior and dynamics of the physical system in the control design. In addition, the HIL model represents the system as an integrated CPS by taking into account the effect of the communication network behavior. The impact of different communication topologies and QoS profiles on the performance of the system can be investigated.
To simplify the initialization and startup of the testbed, an automated startup and initialization procedure was developed using a state machine. These startup and automation controllers abstract the procedure of initializing the testbed physical components by performing all the necessary steps to run the testbed. The startup controllers setup the system frequency, startup and synchronize the generators, configure the network topology, and connect different loads. The shutdown procedure ensures a correct shutdown sequence to prevent component damage. The user can utilize this controller as it is or use it as a base template to build his own controller. The hierarchy of the automatic controller is shown in
Figure 11 where it can be seen that the control is divided into two levels. The low level consists mainly of three state machine controllers. The block diagram for the first controller is shown in
Figure 12 which is responsible for starting up and shutting down the slack generator. In the startup state, the controller sets the speed of the generator at the required value depending on the required operating frequency. Then, it changes the status of the generator to the “on” state. When the output voltage and frequency reach the nominal values, the controller generates a ready signal to indicate that the slack generator is ready. While in a slack shutdown state, the controller sends a turn off signal to the generator and resets the generator ready signal to zero.
The state machine for the second controller shown in
Figure 13 is responsible for startup/shutting down of the power controlled generators in the system. In the startup state, the first step is to send a start signal to the generator then start the synchronization process shown in
Figure 14. After the synchronization process has completed, the controller closes the generator CB to connect the generator to the testbed. After that, it generates a ready signal to indicate the successful completeness of the starting up process. In the shutting down state, the controller opens the generator CB and sends a shutdown signal to the generator.
The high level controller is responsible for coordinating the operation of the low level generator startup controllers and configuring the testbed network topology by connecting necessary transmission lines, busbars, and loads. As shown in
Figure 15, the main controller consists of two main states: namely, startup and shutdown. In the startup state, the controller calls the generator start up algorithms in the required order and monitors the generator status. Then, it connects the CBs to configure the testbed topology and connect the loads. Once all the generators are running and the topology configuration is done, it generates a ready signal for the entire testbed. This signal can be used to enable starting up a certain experimentation procedure. In the shutdown state, the controller shuts down the generators in the correct order by shutting down the power controlled generators one-by-one while disconnecting any connected loads to avoid overloading the remaining generators. Finally, after shutting down all the power controlled generators, the slack generator is disconnected and all circuit statuses are reset to an open state.
7. Experimental Results
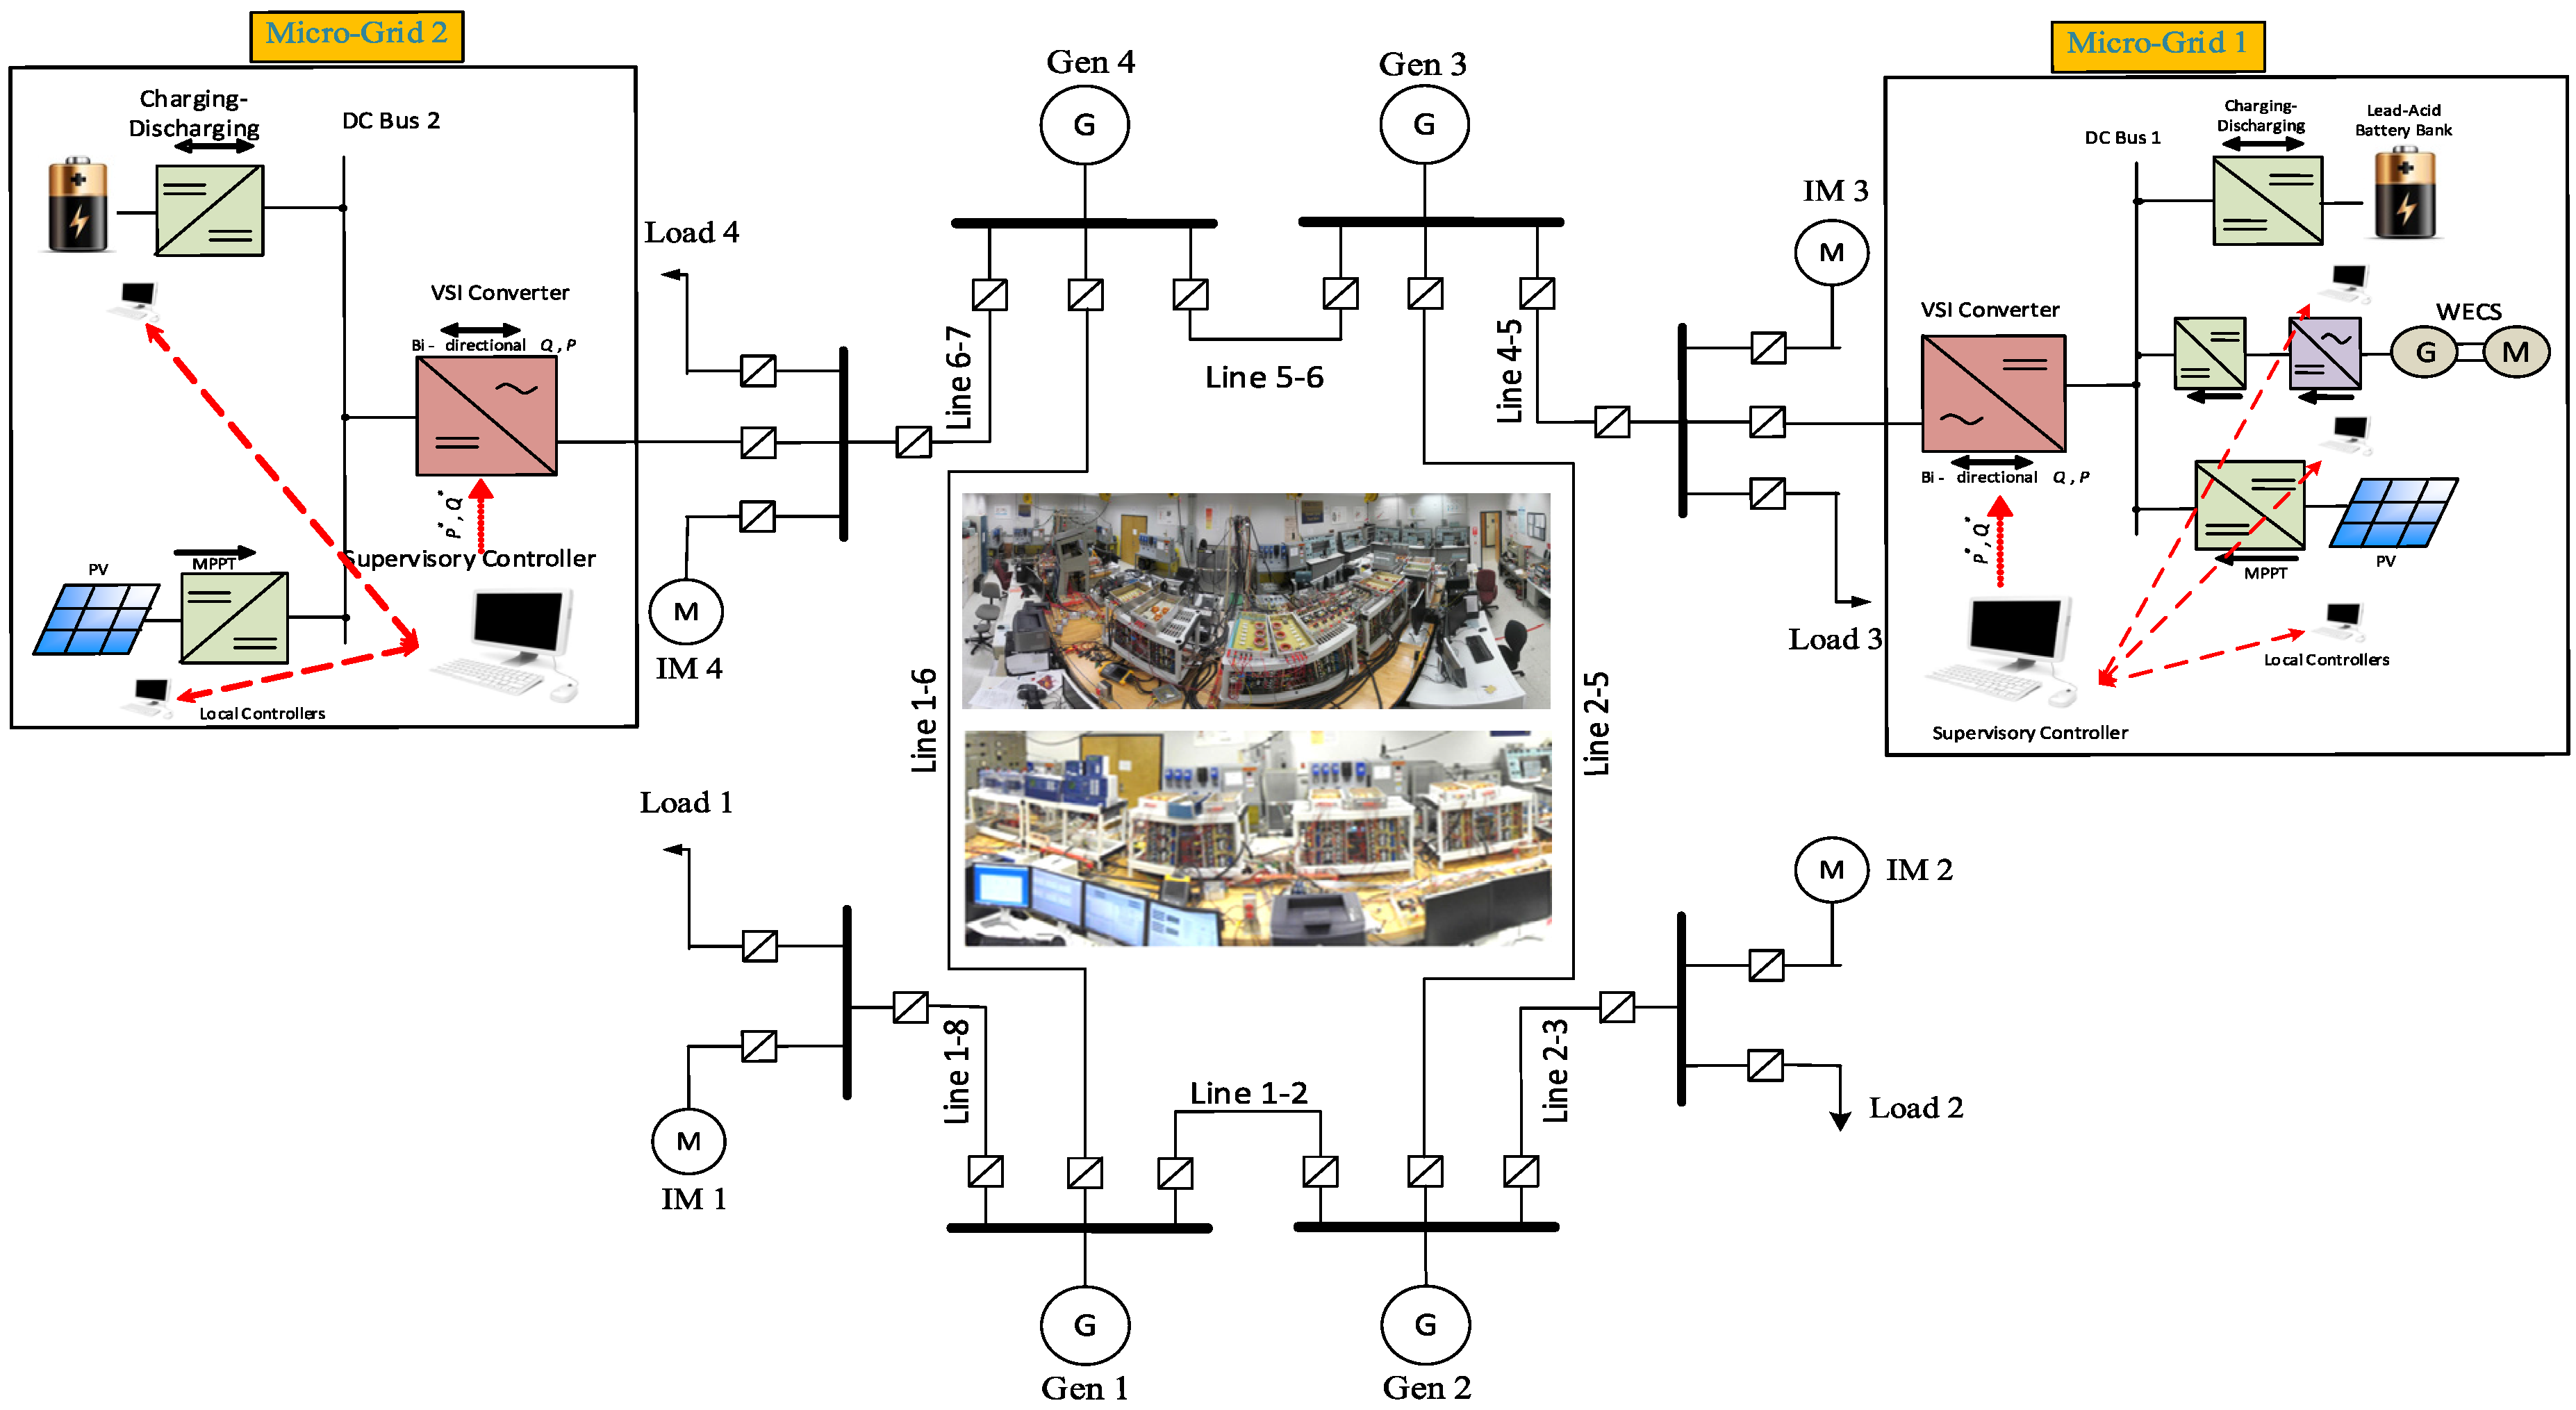
The functionality of the developed communication infrastructure, controllers, and remote interface toolbox was verified experimentally on the smart grid testbed. For the testbed layout, please refer to
Figure 1. In order to show the capabilities of the developed framework, three experiments were carried out with different operation scenarios and scales. The first case shows the synchronization process for multiple generators in detail. The second case depicts the load sharing amongst four generators, while the third one shows how the developed framework is used for topology reconfiguration.
- a.
Case 1: Generator Synchronization
In this experiment, the capability of implementing a closed-loop high speed controller using the proposed framework is shown. The synchronization process requires a high sampling rate for frequency and phase angle estimation and low latency feedback. The sequence of automatic system operation starts by starting generator 1 (slack) as shown in
Figure 11. During this step, a starting signal is sent to the prime mover along with the frequency reference value. The generators’ prime movers are controlled using the RS-485 protocol. The protocol translator, shown in
Figure 4, is used to provide interoperability between the DDS network and serial protocols. When the slack generator frequency reaches 60 Hz, the automation controller connects transmission lines TL 1-2 and TL 1-8, and then connects load 1. In this scenario, load 1 is set at 600 W. Then, generator 2 is started and synchronized to the slack generator.
The results of the carried out experiments are depicted in
Figure 16 and
Figure 17.
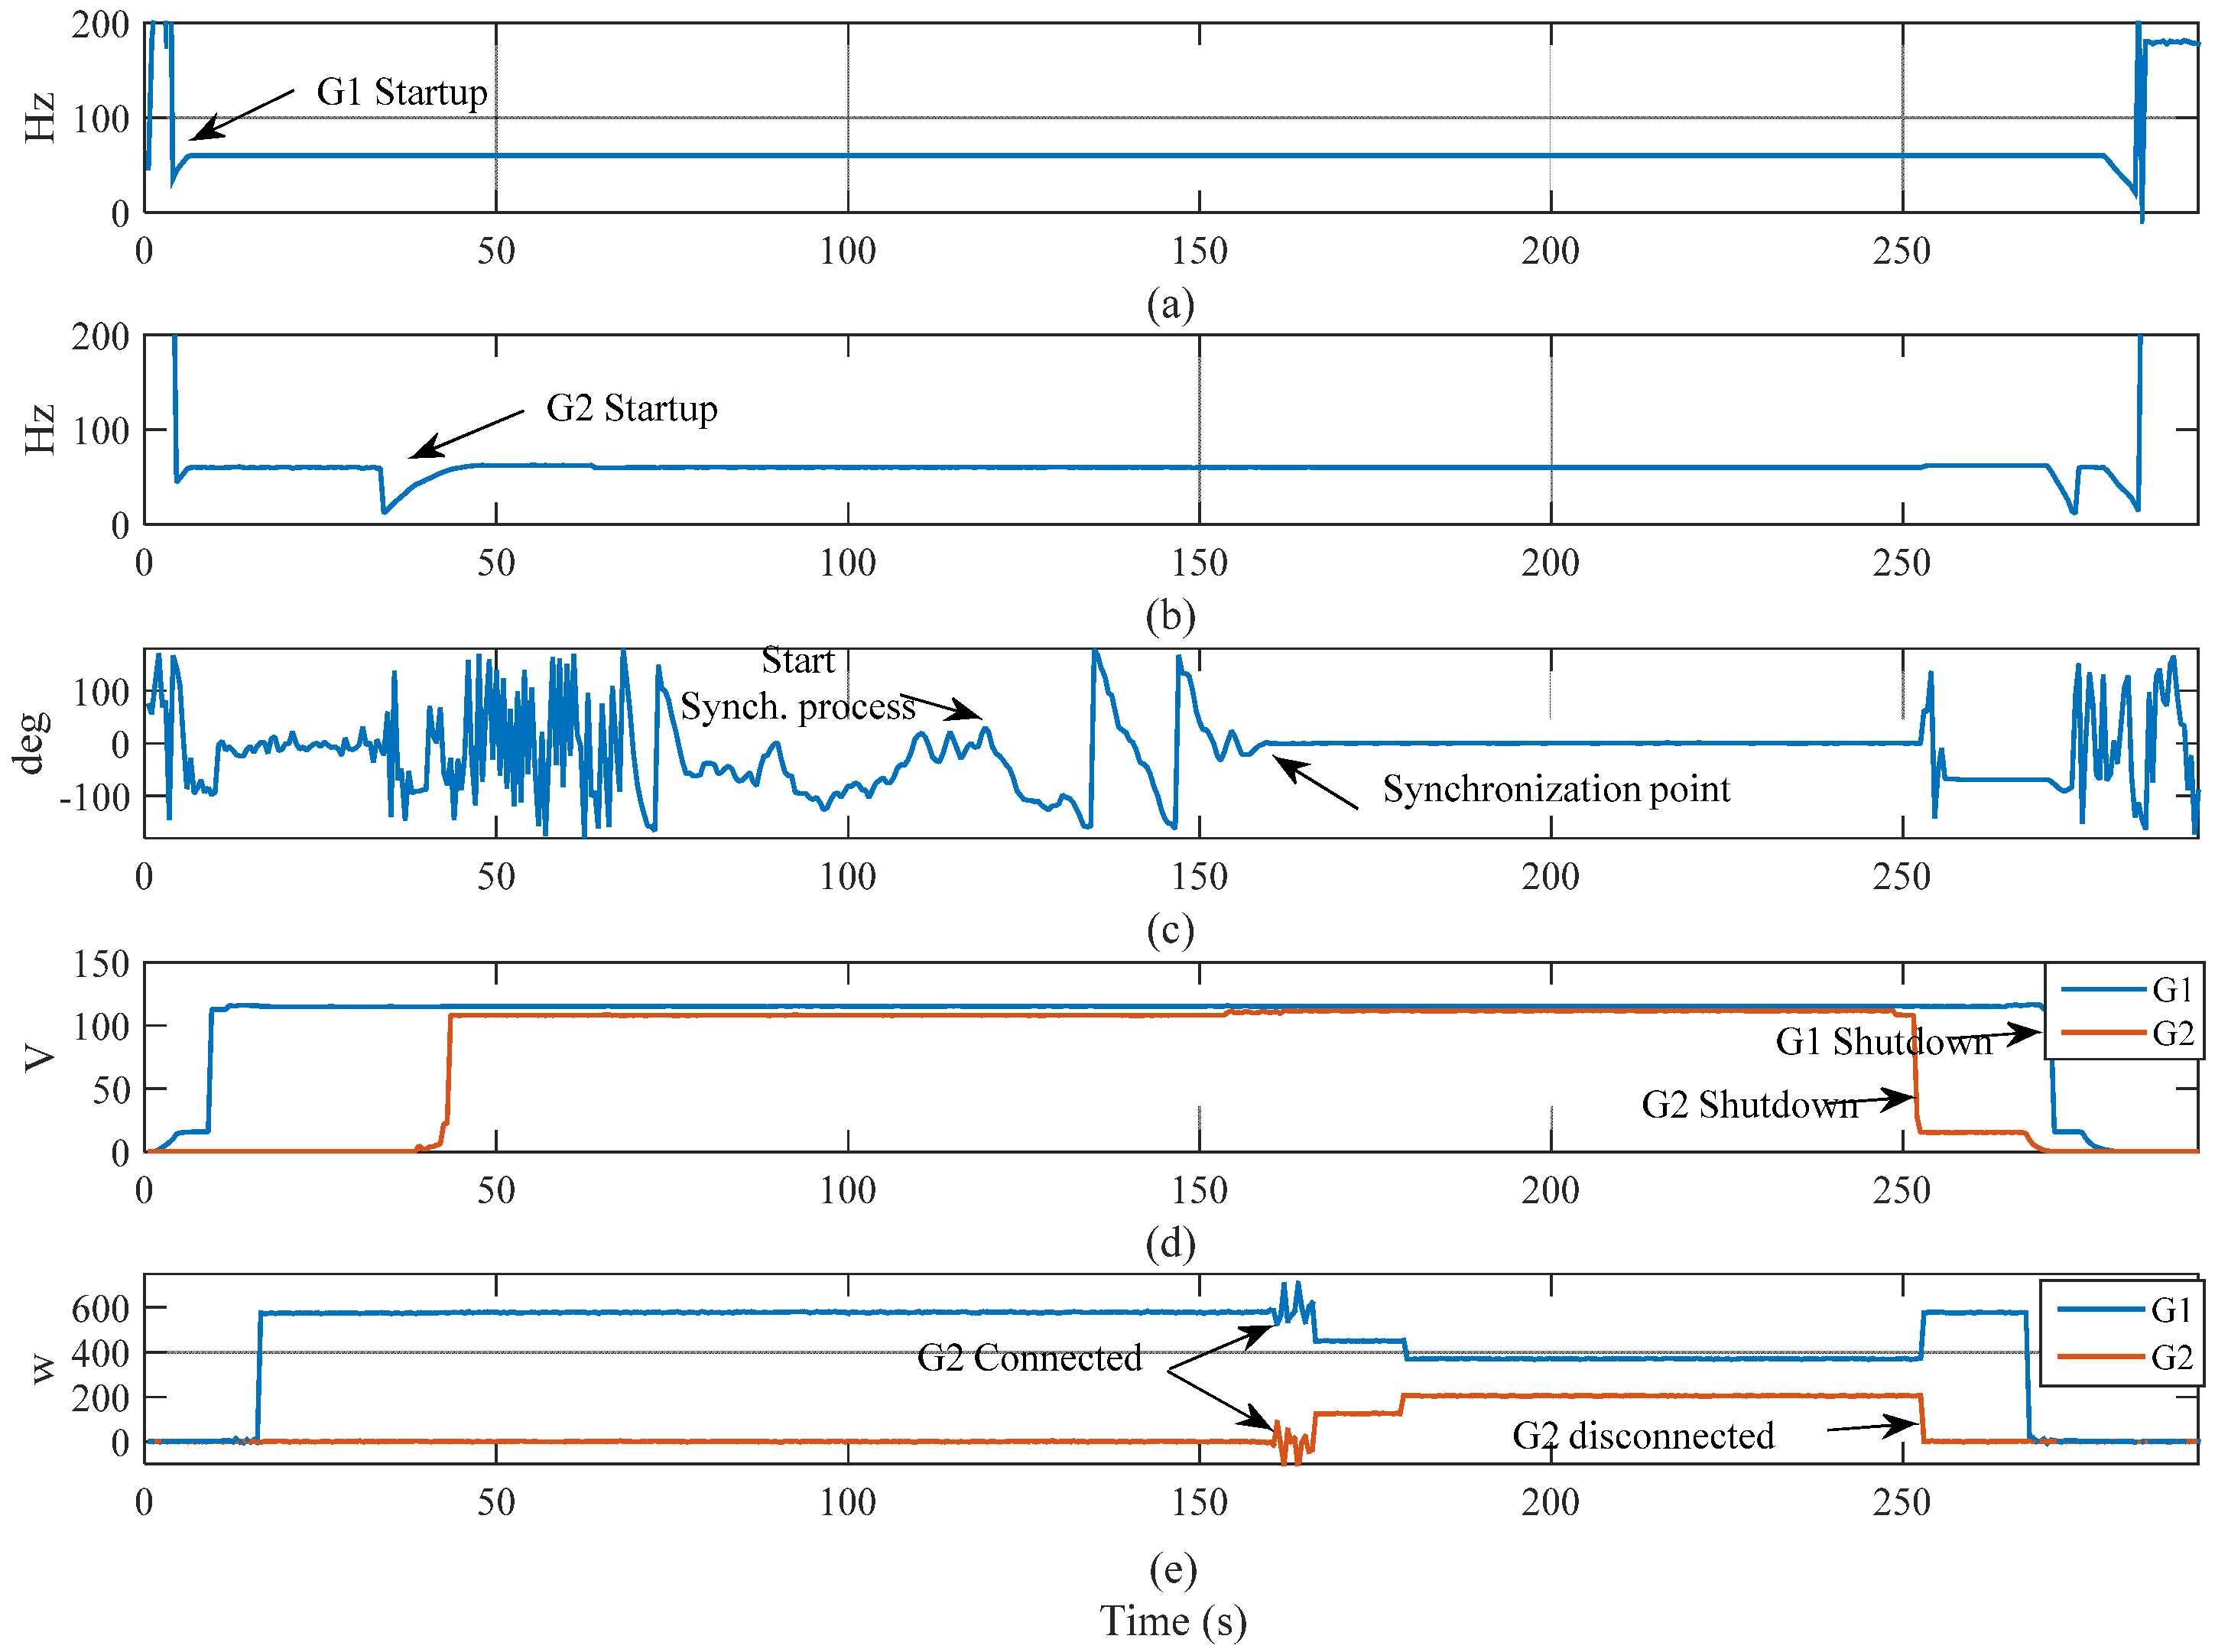
Figure 16a shows the generator 1 frequency at time 4 s when the startup signal is sent to generator 1. The frequency ramps up until a frequency of 60 Hz is reached. The frequency measured before the generator startup is noise because of the lack of a generator output voltage. At time 9 s, generator 1 is connected and the voltage is stabilized around 115 V as shown in
Figure 16d. The load is connected at time 16s as shown in
Figure 16e.
Figure 16b shows the generator 2 startup at time 34 s. It is worth mentioning that the generator 2 frequency was shown as 60 Hz even before the generator startup due to leakage across the solid state switches. This leads to reading a frequency of generator 1 when generator 2 is not connected.
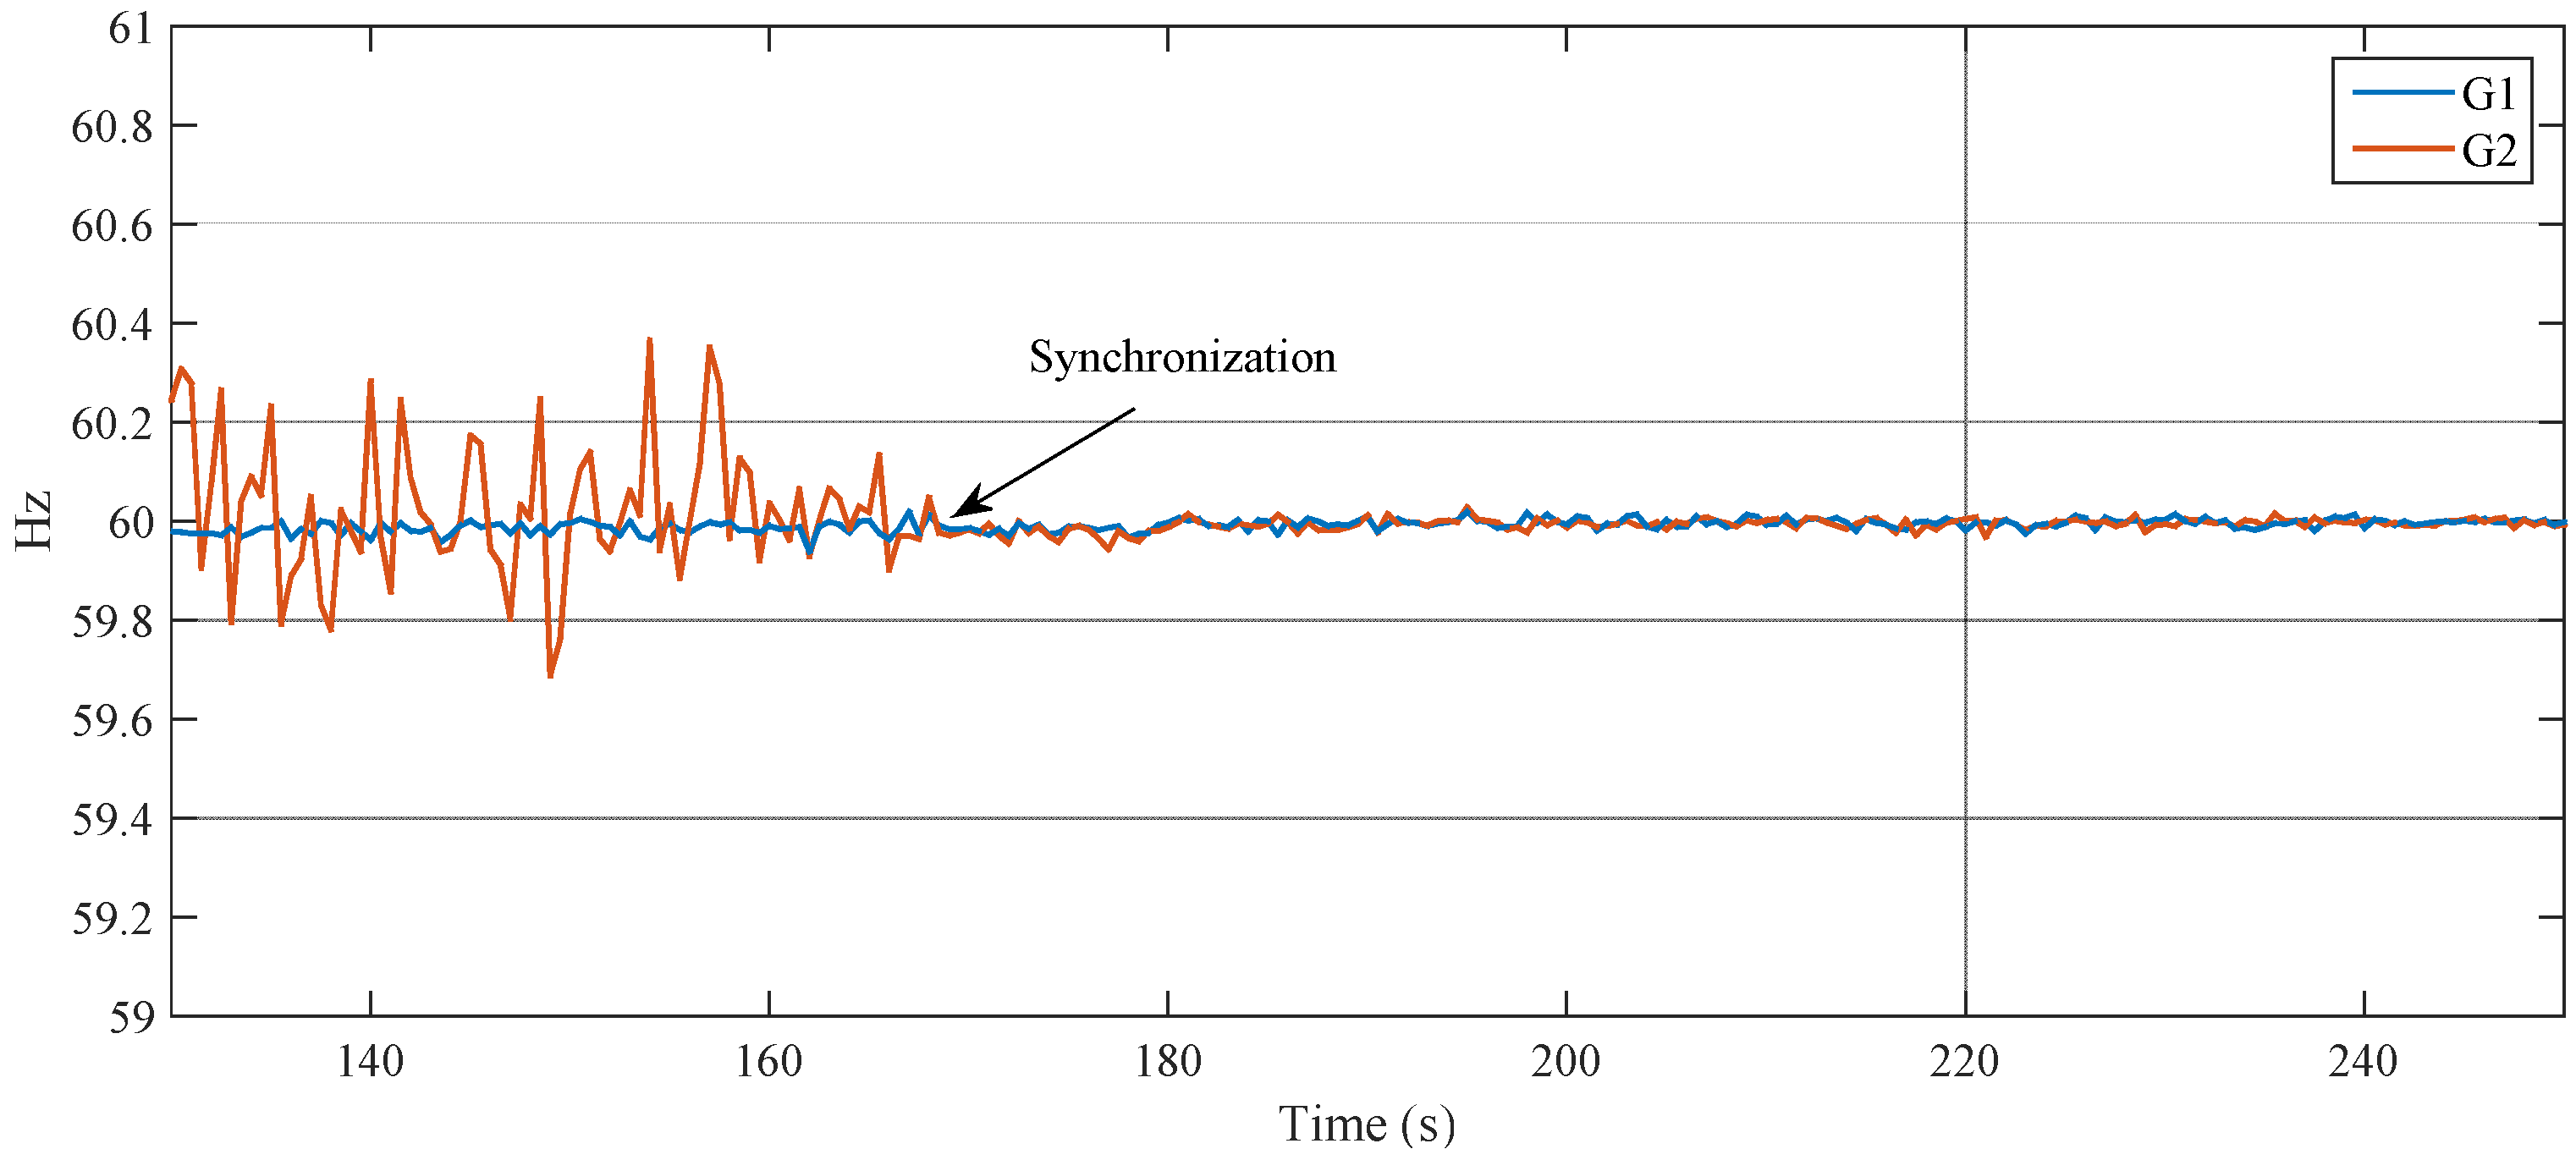
Figure 16c shows the phase angle difference between generator 1 and 2 voltages. Frequency fluctuations can be seen before the synchronization, but these fluctuations go to zero as soon as the process completes.
Figure 17 shows a zoom in on time frame 130–250 s to further illustrate the synchronization process. It is clear that the framework successfully performs an accurate synchronization and frequency stabilization in real-time.
Figure 16e shows that the slack generator fed all the load while, after synchronization, the load is shared between the two generators.
This case shows the scalability of the developed framework since four generators, six transmission lines, and two loads are involved. The main focus of this case is to configure the required network topology and control power flow to share the load amongst different sources automatically. The experiment starts by starting generator 1 and connecting it to the load bus through TL 1-8 and to the generator 2 bus through TL 1-2. After that, generator 2 is started and synchronized to the slack generator. Generator 2 is then connected to the network through transmission lines (TL 2-5). Similarly, generators 3 and 4 are started and synchronized. Then, TL 5-6 and TL 1-6 are connected. The entire startup process is handled by the developed startup and automation controller. During the experiment, loads 2 and 4 were disconnected. Generators 2 and 3 were working in the power control mode with a reference power of 300W. Generator 4 was synchronized and running under no load to represent a spinning reserve. Load 3 was fixed to a value of 300 W while load 1 was varying to emulate a certain load pattern. The control command to the loads was sent over a wireless link. The maximum output power of generator 1 was set to 700 W.
The results of the carried out test are shown in
Figure 18 where the total demand (load 1 + load 3) is shown in
Figure 18a. The output of the four generators (1–4) is shown in
Figure 18b–e, respectively. When the total demand changes from 900 W to 1200 W at time 65 s, the slack generator output changes from 300 W to 600 W while the rest of the load is supplied by generators 2 and 3. At time 115 s, the load increased to 1500 W and consequently, the slack generator output is increased to 900 W which exceeds the preset maximum limit. The controller commands generator 4 to inject power to reduce the slack generator power below the limit. At time 215 s, the load demand decreased to 900 W. In this case, due to low demand, generator 4 returns to reserve mode. An intentional outage of generator 3 is created at time 293 s where the slack generator output is increased to compensate for the lost generation power. However, the slack generator output is still below the critical limit, hence the controller did not initiate a power injection from generator 4. For this scenario, it can be seen that the developed framework was able to efficiently exchange data from multiple sources and controllers in real-time to maintain a power balance between load and generation.
- c.
Case 3: Topology Reconfiguration
This experiment shows the capability of dynamic reconfiguration of the physical network topology. For this purpose, the radial power transmission network consists of generators 1 and 2, transmission lines TL 1-2, TL 2-5, TL 4-5, TL 5-6, and TL 6-7 and loads 3 and 4 (refer to
Figure 1 for the network topology). During high demand, the network topology will be reconfigured to a ring by connecting TL 1-6 to improve the voltage profile. During this experiment, load 3 is used as constant load of 300 W, while load 4 is emulating a variable load pattern from 500 W to 1700 W with a minimum allowed voltage of 114 V as shown in
Figure 19b. Generator 3 is set to inject 300 W during the operation.
After starting and synchronizing generators 1 and 2, the transmission network is configured to feed loads 3 and 4 as described above. A variable load pattern is applied by controlling load 4 while monitoring the load voltage. When the load reaches 1700 W at time 92 s, the load voltage drops to 113 V. Violating the allowed voltage limit triggers a topology reconfiguration from radial to ring by connecting transmission line TL 1-6 at time 104 s. This reconfiguration improves the load voltage profile from 113 V to 115 V as shown in
Figure 19c.
The control software for all experiments was completely modeled using Matlab/Simulink. The developed interface toolbox established the communication between the Matlab model and the real hardware components by utilizing the DDS middleware. The entire model is converted to C code and run in real-time. During the operation, the model received measured data at a message rate of 100 Msg/s. The experimental results proved the efficiency and reliability of the developed control and communication infrastructure for managing and collecting real-time data from the smart grid testbed. The integration between the modeling and analysis software and the smart grid testbed hardware components provides a hybrid hardware-software environment for prototyping and testing developed control and real hardware devices. Fully-automated operation without human intervention was reached using the developed infrastructure. It is worth mentioning that the system is scalable. i.e., it can be expanded to larger systems with a higher number of units and distributed control models run on distributed network resources. Furthermore, the implemented testbed infrastructure allows remote users to connect and perform experiments.


