1. Introduction
Thermal conversion of biomass is a promising way to produce gaseous and liquid fuels [
1]. Among all the techniques, gasification has received extensive attention because it produces valuable gaseous products, which can be used as a fuel for internal combustion engines, gas turbine, boilers, and cooking [
2]. Extensive studies have been conducted on biomass gasification processes to investigate how to increase the energy transformation efficiency, reduce pollution during the gasification process and improve the device reliability [
3,
4,
5]. Among all the obstacles that impede the development of gasification technology, tar formation is the most cumbersome one [
6]. Tar is a complex mixture of hydrocarbons, which includes aromatic compounds, along with other oxygen-containing hydrocarbons and complex polycyclic aromatic hydrocarbons (PAHs). Tar is defined by EU/IEA/US-DOE meeting as all organic contaminants with a molecular weight larger than benzene [
7]. Tar easily causes fouling in ducts, valves, and engines, and polymerizes to form more complex structures during combustion, thus decreasing the reliability of equipment and increasing pollutant emissions [
8,
9]. Tar limits the usage of syngas in application processes. The minimum allowable limit for tar is dependent on the end user application. As tabulated by Milne and Evans [
10], the general tolerance limits for engines, turbines and other combustion devices range from 5 to 100 mg/Nm
3.
There are two types of tar control technologies, which are syngas conditioning and inside gasifier treatment. The first method is proved to be effective but it is costly and may cause secondary pollution. The second method is gaining much more attention due to its economic benefits.
As reviewed by Milne and Evans [
7], the formation and conversion of tar is seriously affected by the material composition, temperature, gasification agent(s), oxidation processes and residence time. These are all important operation parameters for a biomass gasifier. Plenty of works are available on tar formation and destruction behavior under the effect of the parameters mentioned above. It is generally agreed that tar is produced during biomass pyrolysis around 300 to 500 °C. It can be divided into primary, secondary and tertiary tar, according to its reaction history. The primary tar is characterized by cellulose-derived products such as levoglucosan, hydroxyacetaldehyde and furfurals. The secondary tar species are phenolics and olefins, while tertiary tar includes methyl derivatives of aromatics, such as methyl acenaphthylene, methylnaphthalene, toluene, and indene. Tar composition varies with the temperature program used during pyrolysis. High heating rates lead to a high tar production and a high proportion of primary and secondary tar, hence, flush pyrolysis technology is applied for bio-oil production [
11]. Low heating rates result in a low tar production and high tertiary tar proportion, that is the reason why slow pyrolysis is used for torrefaction and gasification. Tars produced by pyrolysis may change under certain conditions. Chen
et al. [
12] reported that biomass pyrolysis tar decomposed by more than 90% at 1000 °C. Besides decomposition, tar also experiences polymerization reactions above 800 °C. Their study also revealed that primary and secondary tar could be converted into highly polymerized and highly aromatic components, such as naphthalene and indene. Houben [
13] reported that tar decomposition reactions can be accelerated under an oxidative environment. Pyrolysis tar conversion rates under a partially oxidative atmosphere are higher than under inert conditions. Moreover, oxygen-containing compounds are favored, which are mainly phenol and its homologous series.
As reviewed above, oxygen supply is a key issue for biomass gasifier design. Several gasifier concepts have been developed in the past 20 years [
14]. The majority of them have a single inlet for air, no matter whether it is an updraft, downdraft or fluidized gasifier. Few of them has more than one air inlet. Pan
et al. [
15] reported a 88.7 wt % of tar reduction by injecting secondary air above the biomass feeding point in a fluidized bed configuration. Narv
et al. [
16] performed secondary air injection in the freeboard of a fluidized bed gasifier and observed a tar reduction of nearly 50 wt % with a temperature rise of about 70 °C. The Asian Institute of Technology (AIT) developed a two stage biomass gasifier [
7]. Experimental results showed that the tar concentration in flue gas is about 40 times less than in a single-stage reactor under similar operating conditions. This concept involves a downdraft gasifier with two air inlets. Tar produced in first pyrolysis stage will pass through a high temperature char bed and decompose at elevated temperatures. Yoshikawa [
17] combined a fixed-bed pyrolyzer with a high temperature reformer using a high temperature steam/air mixture and demonstrated that the injection of high temperature steam/air mixture into the pyrolysis gas effectively decomposes tar and soot components in the pyrolysis gas into gaseous products. Henriksen
et al. [
18] reported successful working and operating experiences with a two-stage gasifier. Although it has only one oxygen inlet, the pyrolysis and gasification process are separated by a partial oxidation zone, where the produced pyrolysis tar can be decomposed to a great extent.
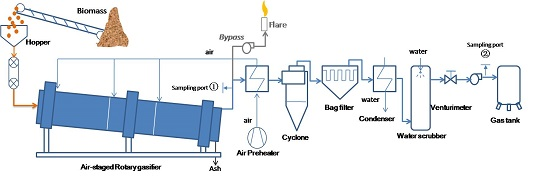
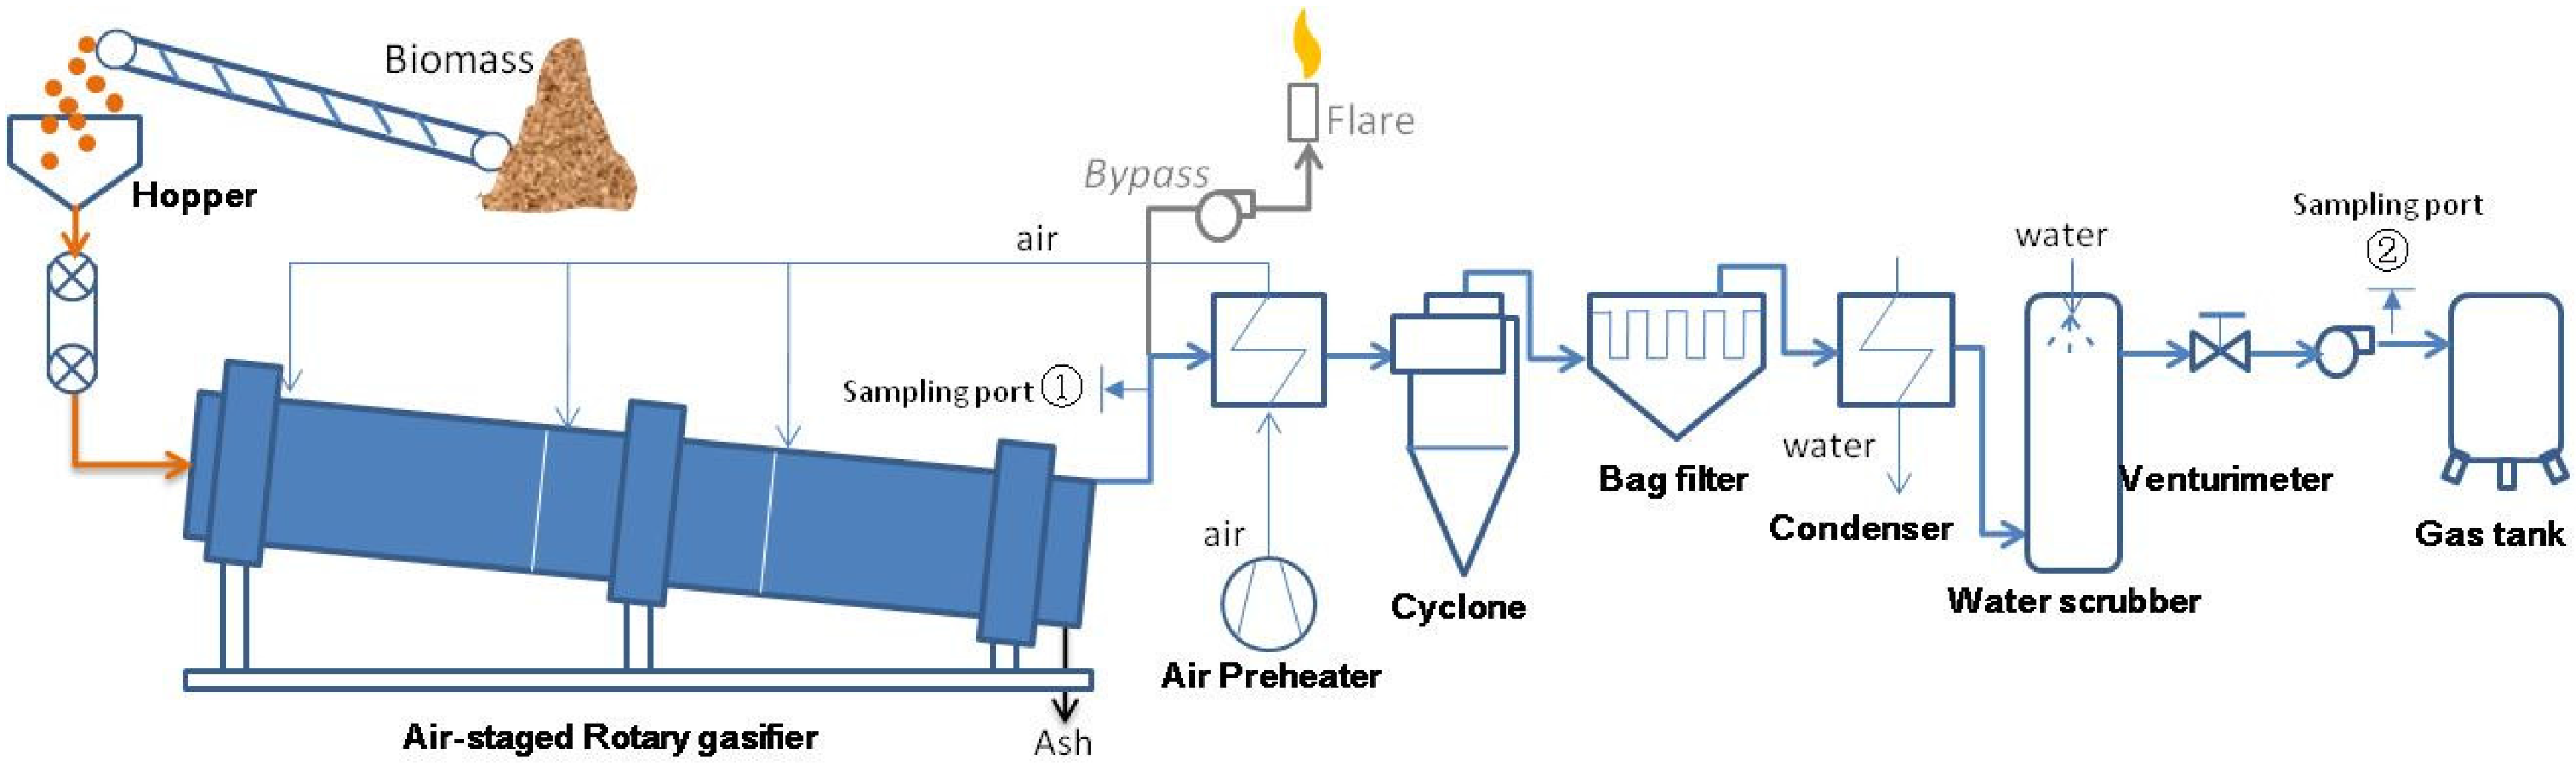
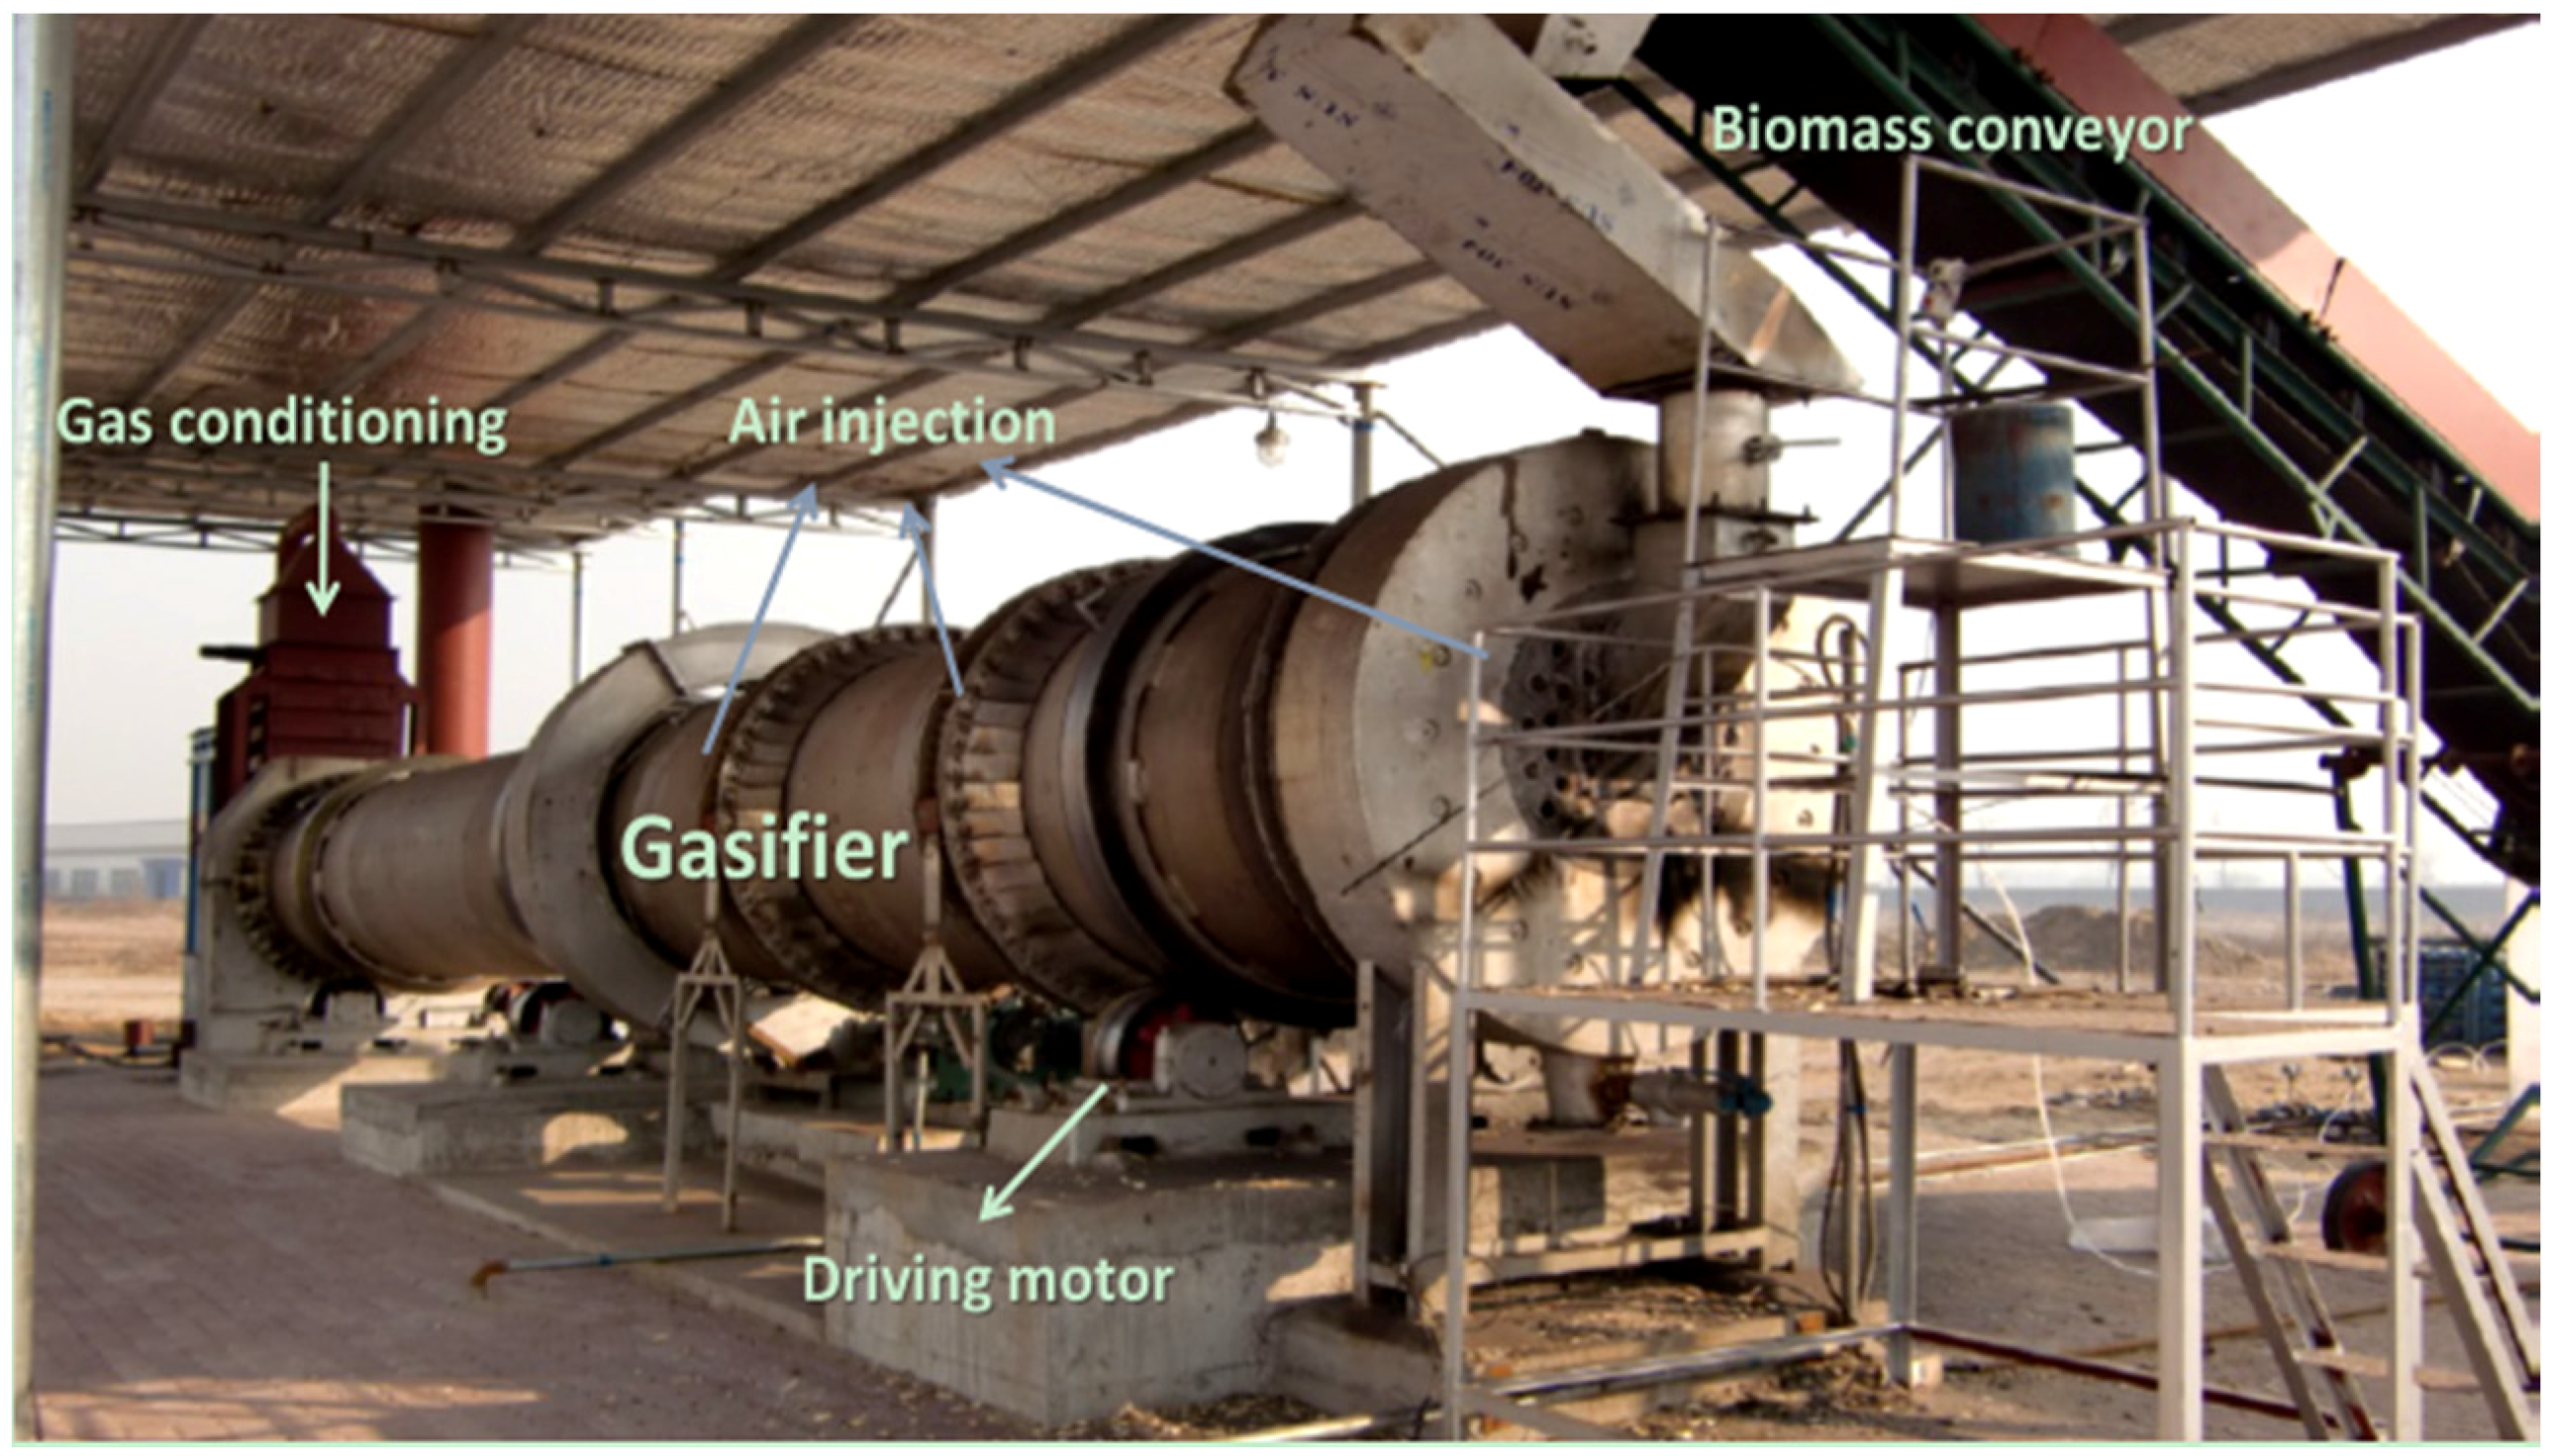
From the extensive literature search, it can be observed that the temperature profile and oxygen injection are key design issues that influence tar production during gasification. A few unique gasifiers have been developed. Some of them were based on an “air staging” concept and some separated gasification into many processes through structure modification. In the current work, a novel gasifier system with a thermal capacity of 1.5 MW
th was proposed. The conceptual configuration of the gasification reactor is illustrated in
Figure 1. The gasifier is a rotary kiln with a 6 degree angle of inclination. Unlike a traditional rotary kiln, it is divided into three regions, which are oxidative degradation, partial oxidation and char gasification. Biomass is fed into the reactor from the left end and passes through the gasifier by rotating the reactor. Air used for gasification is injected into three different regions by a blower.
Figure 1.
Conceptual schematic of the novel air staged biomass gasifier.
Figure 1.
Conceptual schematic of the novel air staged biomass gasifier.
The pyrolysis reaction takes place in the first region under an oxidative atmosphere. Then, the pyrolytic gas with tar species is drawn into the second region by an induced fan. In this stage, homogeneous partial oxidation reactions happen. Tar components decompose into small molecule gaseous products. After the pyrolytic and partial oxidation process, the volatiles in the biomass solid fuel are released completely and this leaves a char with high carbon content. In the third stage, the char gasification reaction takes place. Besides, biomass char also acts as absorbent to adsorb tar components [
19].
The air staging strategy does not just reduce tar production; it also produces an energy self-sufficient system. DTU developed a two-stage gasifier [
18], where the oxidation and pyrolysis processes are separated. However, its pyrolysis stage is heated externally by exhaust gas from a gas engine. In the present gasifier, every single stage is auto-thermal. Heat for pyrolysis is provided by partial oxidation of the solid biomass fuel in an oxidative environment. Besides, radiation heat from the second region also helps maintain the temperature in the pyrolysis region. In the present study, the optimal operation parameters and main factors that influence tar production, low heat value (LHV) of the fuel gas, gas production rate, cold gas efficiency and carbon conversion rate were investigated. In addition, the heat balance was calculated and discussed.
3. Results and Discussion
The aim of this study was to demonstrate the concept of a novel air-staged gasification process to produce tar-free fuel gas. A series of tests were conducted to investigate the impact of parameter variation such as air injection percentage (AIP) of the three regions and equivalent ratio (λ) on temperature distribution, gas composition, tar formation, gas production rate, cold gas efficiency, and carbon conversion rate.
The gasifier is designed for a nominal fuel power of 1.5 MWth. This is equal to 300 kg/h biomass fuel fed into the gasifier with a low heat value of 17 MJ/kg.
The equivalent ratio (λ) is defined by Equation (1):
The stoichiometric air V
0 is calculated by Equation (2):
Here V
0 refers to the stoichiometric air required for fuel combustion (Nm
3/kg), Car, Har, Oar, Sar refer to the elemental mass compositions of C, H, O and S (wt %), which are available in
Table 1.
Besides λ, AIP also plays an important role on the temperature profile inside the gasifier. According to the description of the conceptual design, the purpose of the three air injections is not identical. The first air is to supply the heat required for the pyrolysis reactions; the secondary air is used for partial oxidation of the pyrolytic gas, which results in a high temperature environment; the third air acts as an agent for char gasification. Hence, optimization of AIP is crucial for acquiring a desired temperature distribution.
A series of test runs were carried out with the 1.5 MWth pilot scale gasifier to understand the behavior of this gasifier and improve its performance.
3.1. Optimization of AIP
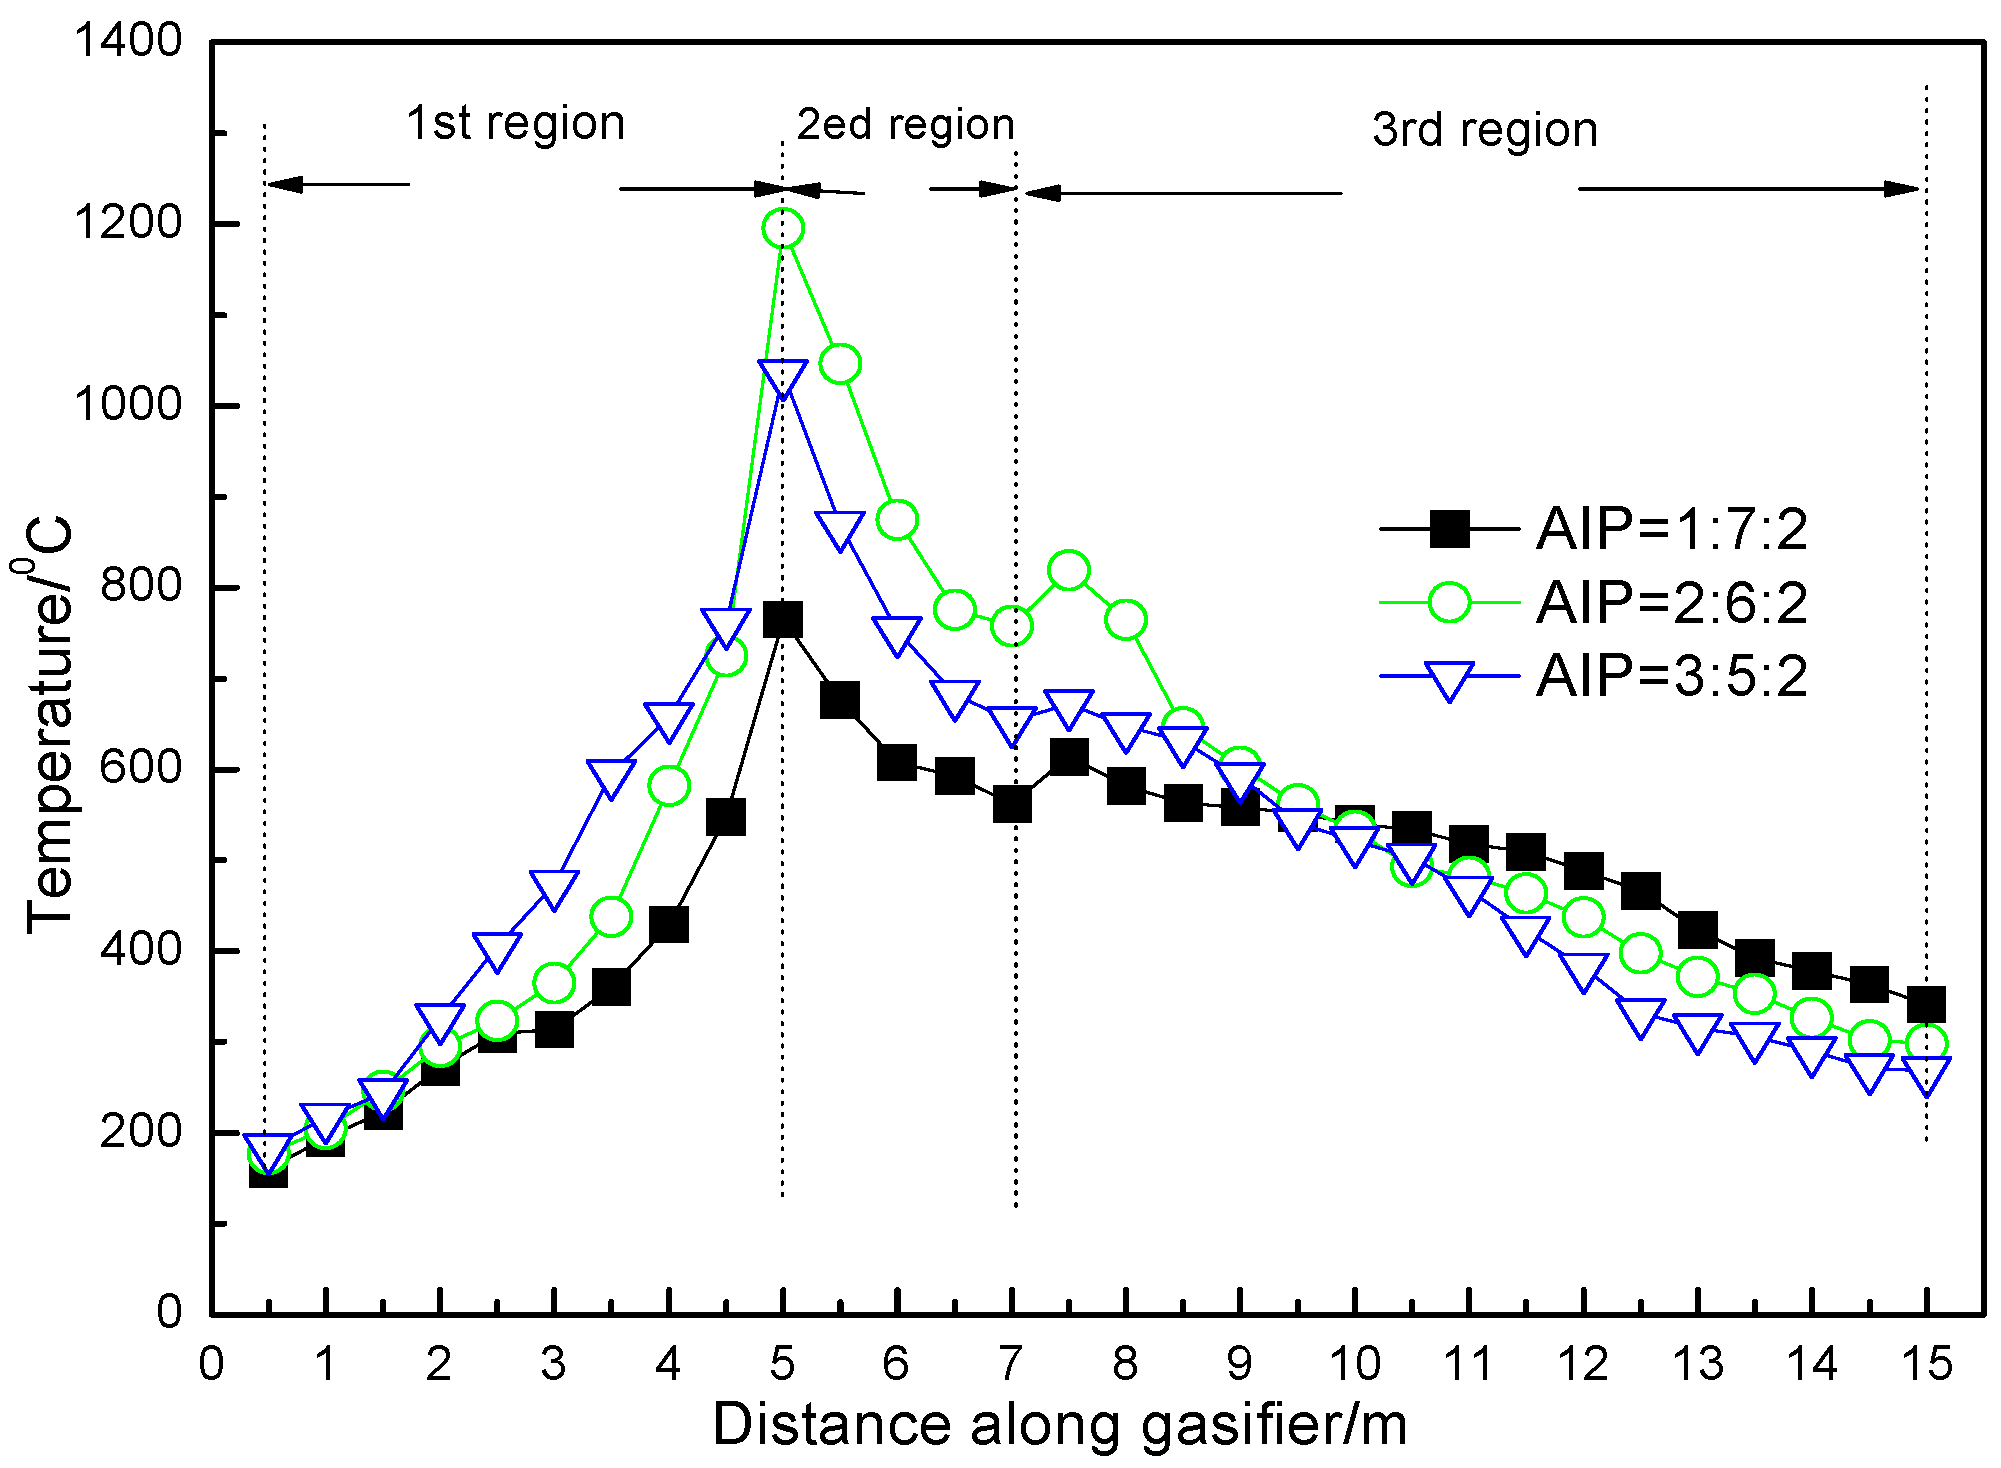
We have made plenty of tests covering all the equivalence ratios (0.28 to 0.45). Three different AIP conditions were tested, which were condition 1 (1:7:2), condition 2 (2:6:2) and condition 3 (3:5:2). Results showed that an optimum ratio of (2:6:2) applied to all the equivalence ratios. In order to be concise, only the temperature curve when λ = 0.36 is drawn in
Figure 5.
Figure 5.
Temperature profile varied with AIP.
Figure 5.
Temperature profile varied with AIP.
The temperature of the pyrolysis region rose up as the injected air increased. As described before, the heat required for the pyrolytic reactions is supplied by biomass and char oxidation. Hence, the more oxygen was injected, the higher the temperature rose. However, the second region behaved differently. In the second region, oxygen was injected into the gaseous phase, where it mixed with pyrolytic gas and resulted in a homogeneous partial oxidation reaction. Therefore, the environment temperature suddenly increased. In this experiment, although air injection in the second region decreased from 0.7 to 0.6, the peak temperature rose from 765 to 1196 °C. This indicated that more combustible gas was produced under condition 2. Under condition 1, the temperature in the first region was too low for the biomass decomposition reactions to take place. The pyrolytic gas produced was less than under condition 2. Therefore, even though the oxygen injection in the second region was higher; there was not enough gas for combustion, and as a result, the temperature decreased. Under condition 3, the temperature in the second region decreased. Although the pyrolysis reaction was enhanced due to the higher temperature, a large amount of injected oxygen may cause an oxidation of the pyrolytic products in the same time they are produced. In addition, a lack of oxygen in the second region restrains the secondary oxidation of the pyrolytic gas. For these reasons, the temperature in the second region was lower than under condition 2.
Heat required for char gasification is transferred by radiation and hot gas convection from the partial oxidation process. Therefore, the temperature profile in the third region was greatly affected by the second region, even though the air injection in the third region was identical for the three conditions.
Based on the above analysis, condition 2 is the most optimal. The highest temperature was achieved in the second region, which resulted in a maximum tar reduction efficiency and char gasification rate. Thus, in the following tests, AIP was fixed at 2:6:2 to obtain the best temperature distribution. Next the total air injected into the gasifier was varied to investigate the effect of λ on gasifier performance.
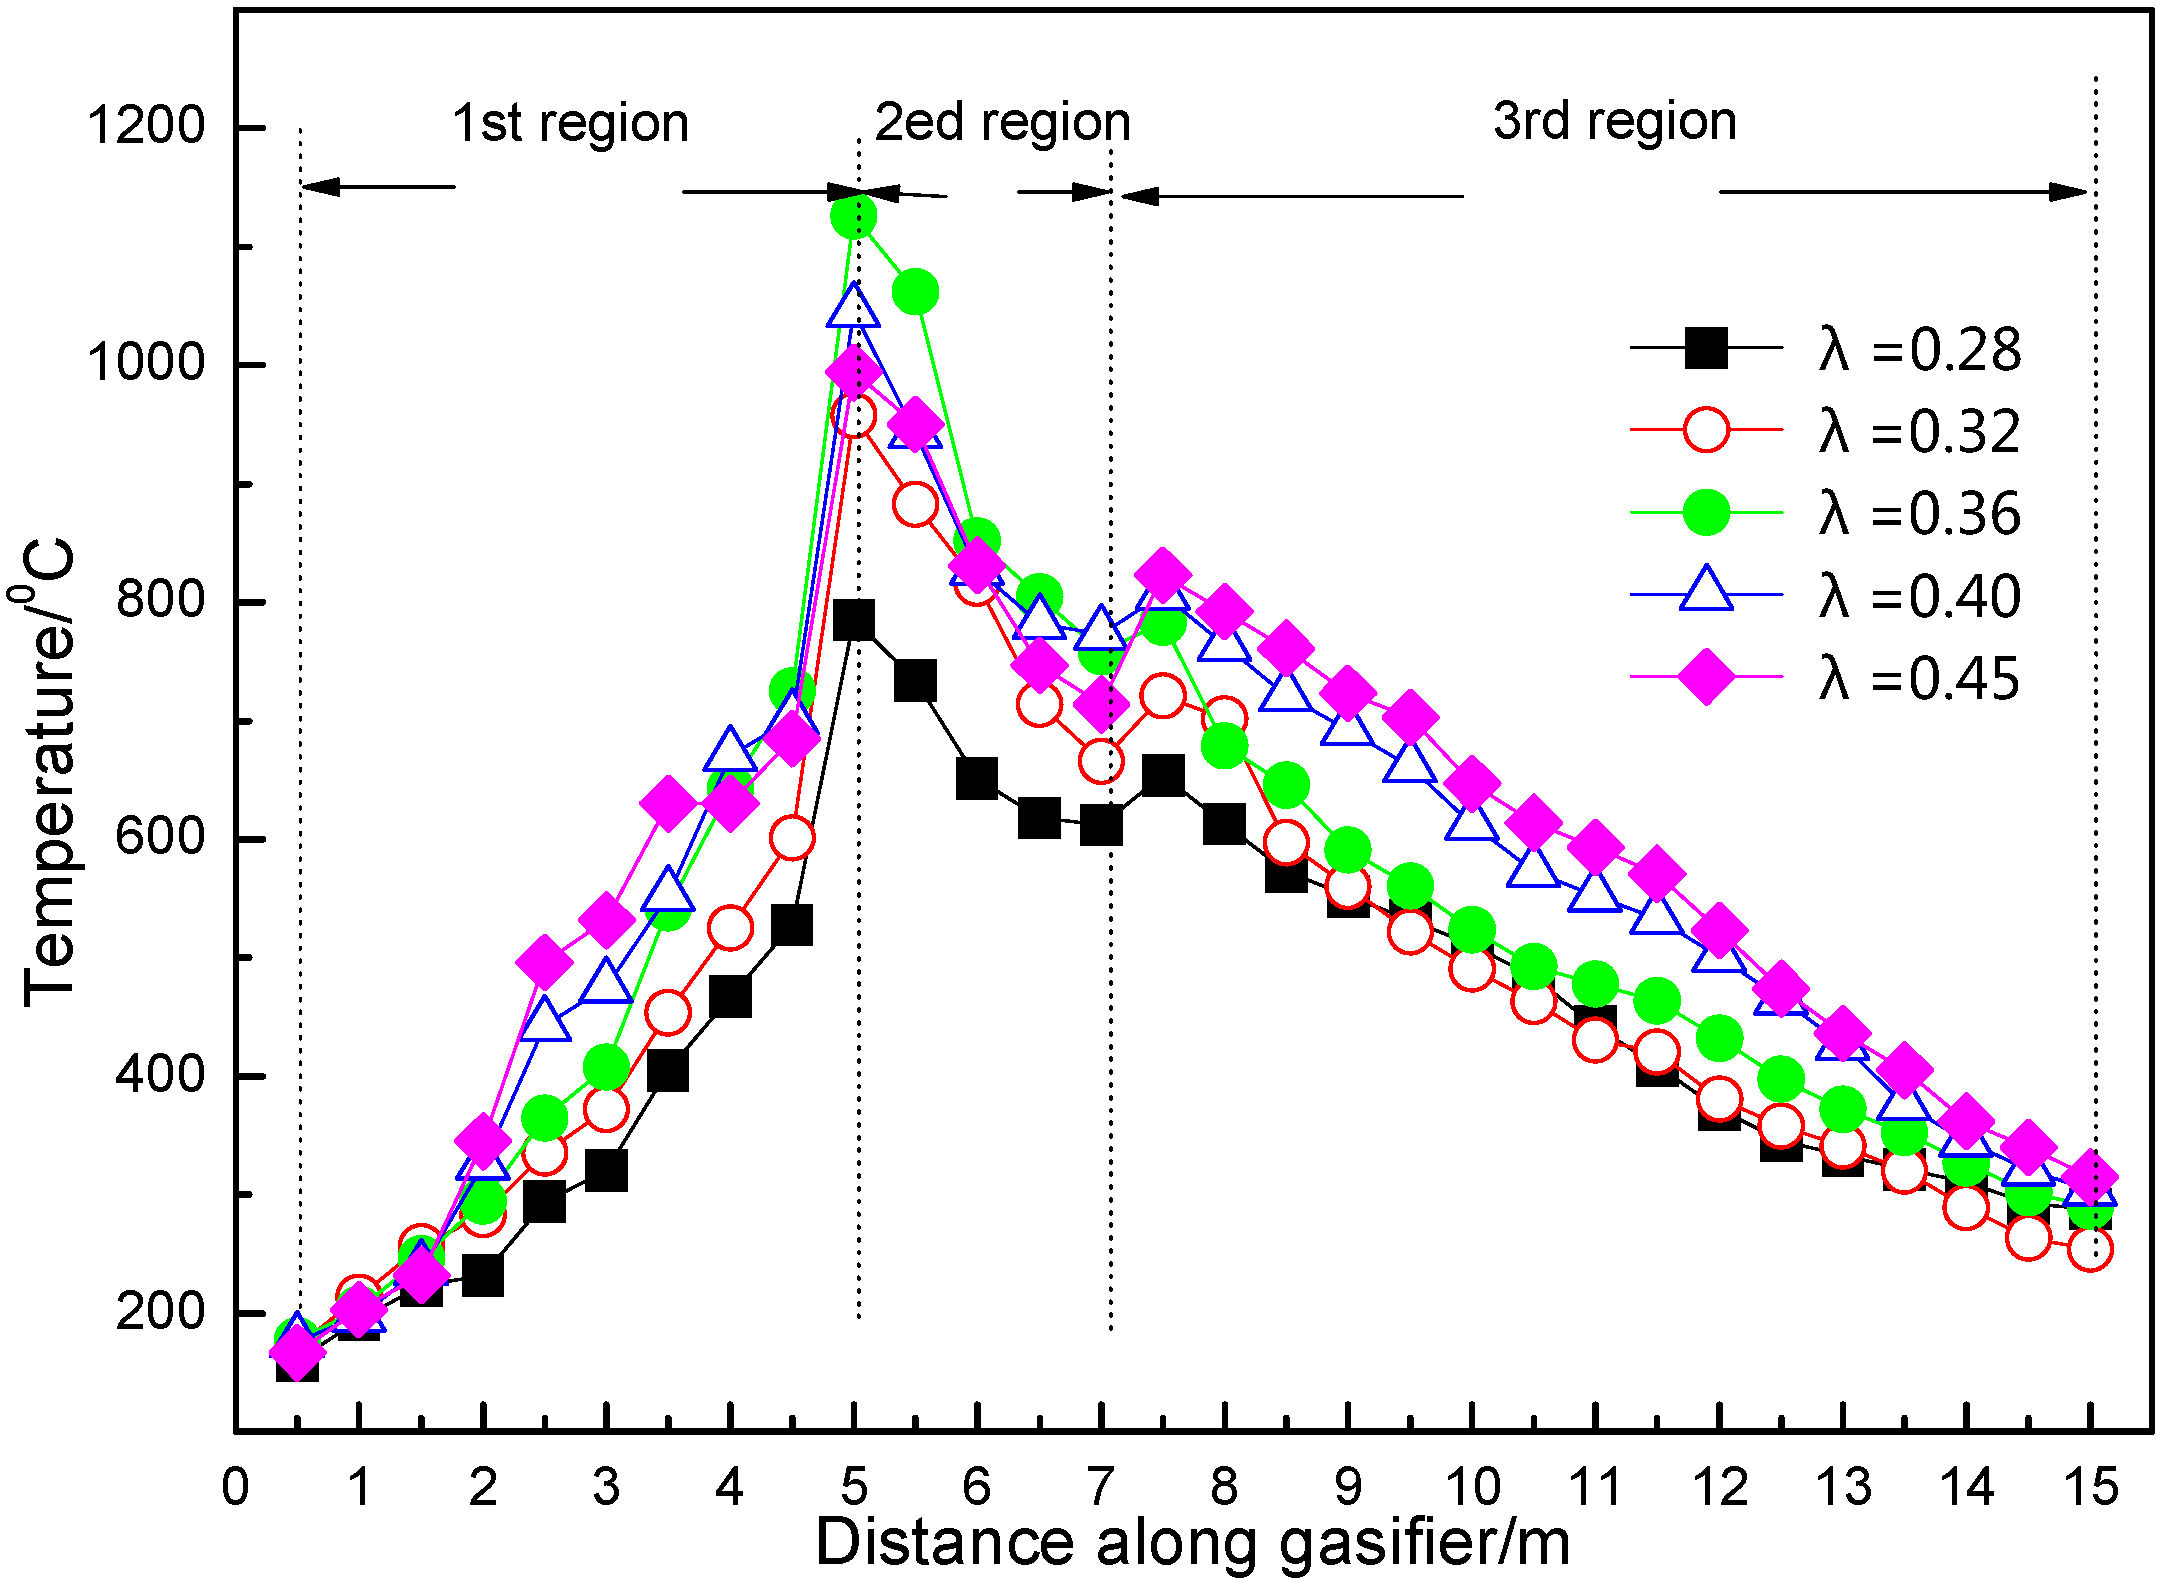
3.2. Temperature Profile vs. λ
We have conducted many experiments under different λ values (from 0.2 to 0.6). Results indicated that the auto thermal operation happens only if λ is larger than 0.28. Thus, we just present the results when 0.28 < λ < 0.45. The temperature distribution along the axis of the gasifier is illustrated in
Figure 6. It can be seen that the variation of temperature curves were alike for different λ values. In addition, the shape of the temperature curves was in accordance with the three regions inside the gasifier.
Figure 6.
Temperature profile variation with λ.
Figure 6.
Temperature profile variation with λ.
When biomass fuel was fed into the gasifier, it was heated by radiation of the hot solid fuel and gas in the second region. The environment temperature at the inlet immediately rose up to around 200 °C. As the biomass was moved by rotating the gasifier, the temperature gradually increased. When the temperature reached 350 °C, the pyrolysis reactions started. It was reported that pyrolytic reactions could be enhanced under an oxidative environment [
20]. At the end of the first region, the biomass decomposition reactions were almost finished. A slight increase of temperature could be observed due to hot gas radiation from the second region. Along the temperature curves in the first region, no obvious peaks were detected, which indicated that the oxidation reaction took place smoothly. Researchers have concluded that in such a temperature range (300–500 °C), the oxidation reactions almost take place between solid fuel and oxygen [
21]. The combustion of pyrolytic gas requires a higher activation energy which cannot be reached within this temperature range [
22,
23]. Under the current temperature, a large amount of CO and CH
4 were produced, however they would not be burned in the first region and would experience partial oxidation in the next stage.
A step temperature increase appeared at the inlet of the second region. This is because of the combustion of pyrolytic gas. Oxygen injected at the first stage has all been consumed. The pyrolytic gas with high heat value was drawn to the partial oxidation area, where the gas met with oxygen and underwent an intense combustion reaction. Hence, the temperature exceeded 1000 °C.
At the inlet of the third region, another obvious peak was observed. The third injected air would cause combustion of the residual syngas that was not consumed in the second region. Besides, heterogeneous oxidation reactions would also occur when air contacts the hot biomass char. These homogeneous and heterogeneous oxidation reactions resulted in an increase of the environment temperature, while the heat released was instantly adsorbed by gasification reactions of biomass char. Hence, the temperature gradually decreased to around 300 °C at the outlet of the gasifier.
When λ increased, the temperature profile responded regularly. Firstly, the average temperature of the pyrolysis region increased. In the presented novel gasification process, pyrolysis reactions take place under an oxidative environment, and the oxygen concentration in the pyrolysis zone varied with λ. Since the heterogeneous oxidation reaction rate is slower than that of homogeneous oxidation, the heat release rate is slow and gentle, thus the temperature increased slightly. The oxidative reactions mainly happen on the surface of biomass or biomass semi-coke, where degradation of biomass large molecules occurs as well. The oxidation and degradation reactions almost take place at the same time and in the same location. Hence, it is an “
in-situ,” oxidative degradation process [
24]. In this way, the heat released from oxidation could be effectively adsorbed by reduction reactions. Therefore, the overall temperature won′t rise too much, while a high decomposition rate of biomass fuel can be achieved. This is the major advantage of this air-staged gasifier.
The steep growth at the inlet of second region can be attributed to severe combustion of the pyrolytic gas. As shown in
Figure 6, when λ increased from 0.28 to 0.36, the peak temperature rose from 965 to 1196 °C. It is obvious that a higher λ promoted partial oxidation reactions, and hence released more heat to this region. The temperature didn′t vary linearly with λ. When λ increased from 0.36 to 0.45, the temperature decreased from 1196 to 1124 °C. This is because that under higher λ conditions, biomass pyrolysis is already finished. Increased air injection will dilute the pyrolytic gas since a large amount of N
2 is injected into the system. Therefore, the partial oxidation rate of the pyrolytic gas is slowed down and the temperature of the second region decreased accordingly.
In the third region, a distinct peak was observed at the inlet as well. However, it behaved differently with λ than in the second region. The peak temperature increased with λ in all tests. No inflection point was detected. This is because in the third region, the combustible gas concentration is low, therefore, heterogeneous oxidation reactions prevail. Oxygen was inclined to react with the biomass char rather than the gases. After the previous two stages, biomass devolatilization was completed. Char produced in the present gasification process would be more active, since it was produced by oxidative degradation. Researchers have reported that biomass char produced by pyrolysis in certain oxygen concentration environments has a highly porous structure, and the specific surface area could reach a value of 321 m
2/g [
19]. Moreover, oxidative char is rich in oxygen- containing functional groups, which may act as an “activation center” during gasification and oxidation [
25]. In conclusion, biomass char produced in an oxidative environment is more reactive. For this reason, an increase in λ results in a promotion of heterogeneous oxidation reactions and heat release and therefore, the average temperature of the third region rose with λ. At the outlet of the third region, the temperature dropped down to around 300 °C. Some components of the biomass tar would condense under 350 °C. Thus, a lower temperature would be helpful for trapping tar. In addition, a low temperature syngas outflow also indicates a high energy efficiency.
According to the above analysis, the temperature features of this gasifier can be summarized as follows: the moderate temperature and oxidative environment in the first region promoted the pyrolytic reaction and increased the production of gaseous products. A high temperature area is formed by homogeneous partial oxidation of the pyrolytic gas in the second region. This resulted in a high tar destruction rate. Biomass char produced by oxidative degradation had a high reaction activity. Hence, the gasification reaction in the third region was favored.
3.3. Syngas Quality
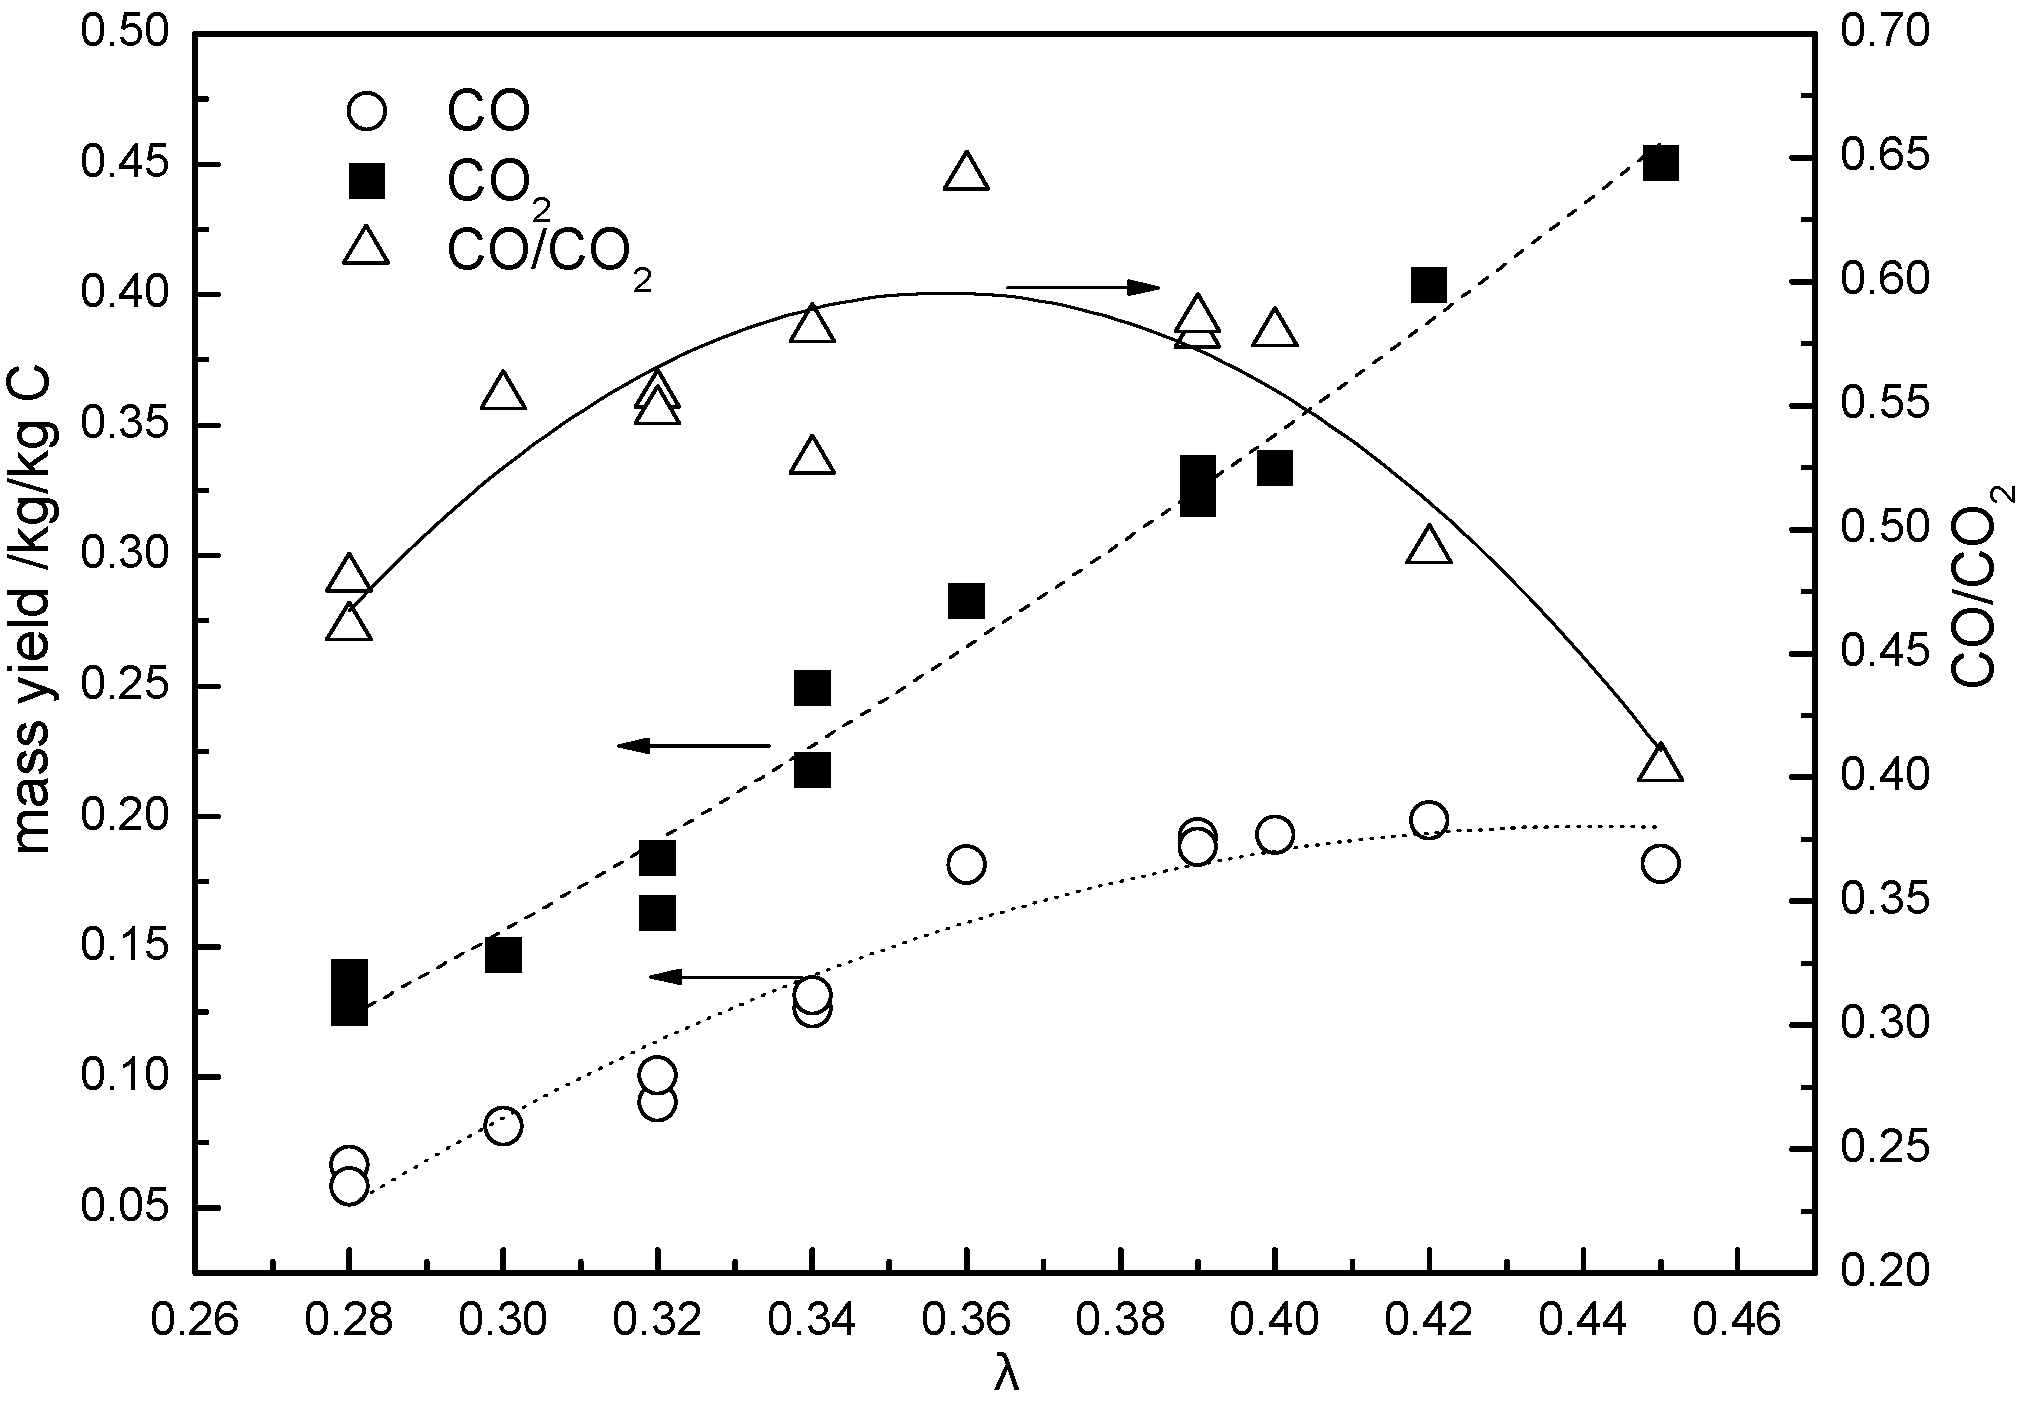
The fuel gas mass yield variation with λ is shown in
Figure 7,
Figure 8 and
Figure 9. The main components are CO, CO
2, H
2, CH
4 and trace amounts of C
xH
y. The unit of gas yield is kg/kg C, where C equals the mass of biomass plus the carbon mass content. The carbon mass content is listed in
Table 1.
Figure 7.
CO and CO2 mass yield.
Figure 7.
CO and CO2 mass yield.
CO first increased then decreased as λ increased. As λ increased from 0.28 to 0.42, the yield of CO increased from 0.125 to 0.373 kg/kg C. After that, CO decreased to 0.341 kg/kg C. However, the mass yield of CO2 continuously increases with λ. The mass of CO2 is always larger than that of CO for all conditions.
During the biomass thermal chemical conversion process, the production of CO
2 is always accompanied by CO release. It seems that there is a rivalry between the formation of CO and CO
2. The proportion of CO and CO
2 is determined by the temperature and oxygen concentration in the environment. When the temperature was low, an increase of λ resulted in production of CO, while, CO
2 might be favored under a high temperature environment. Looking at the CO/CO
2 value in
Figure 7, it is clear that when λ is below 0.36, the temperature is not high enough to initiate homogeneous oxidation. That is kinetically control reaction, thus CO keeps increasing as a result of the promoted pyrolysis reaction. Meanwhile, as λ surpasses 0.36, a significant increase of temperature in the second stage could be observed in
Figure 6. Hence, CO would be oxidized into CO
2 and lead to a decrease of CO/CO
2. Under this condition, it seems that the diffusion rate dominates the oxidation reaction.
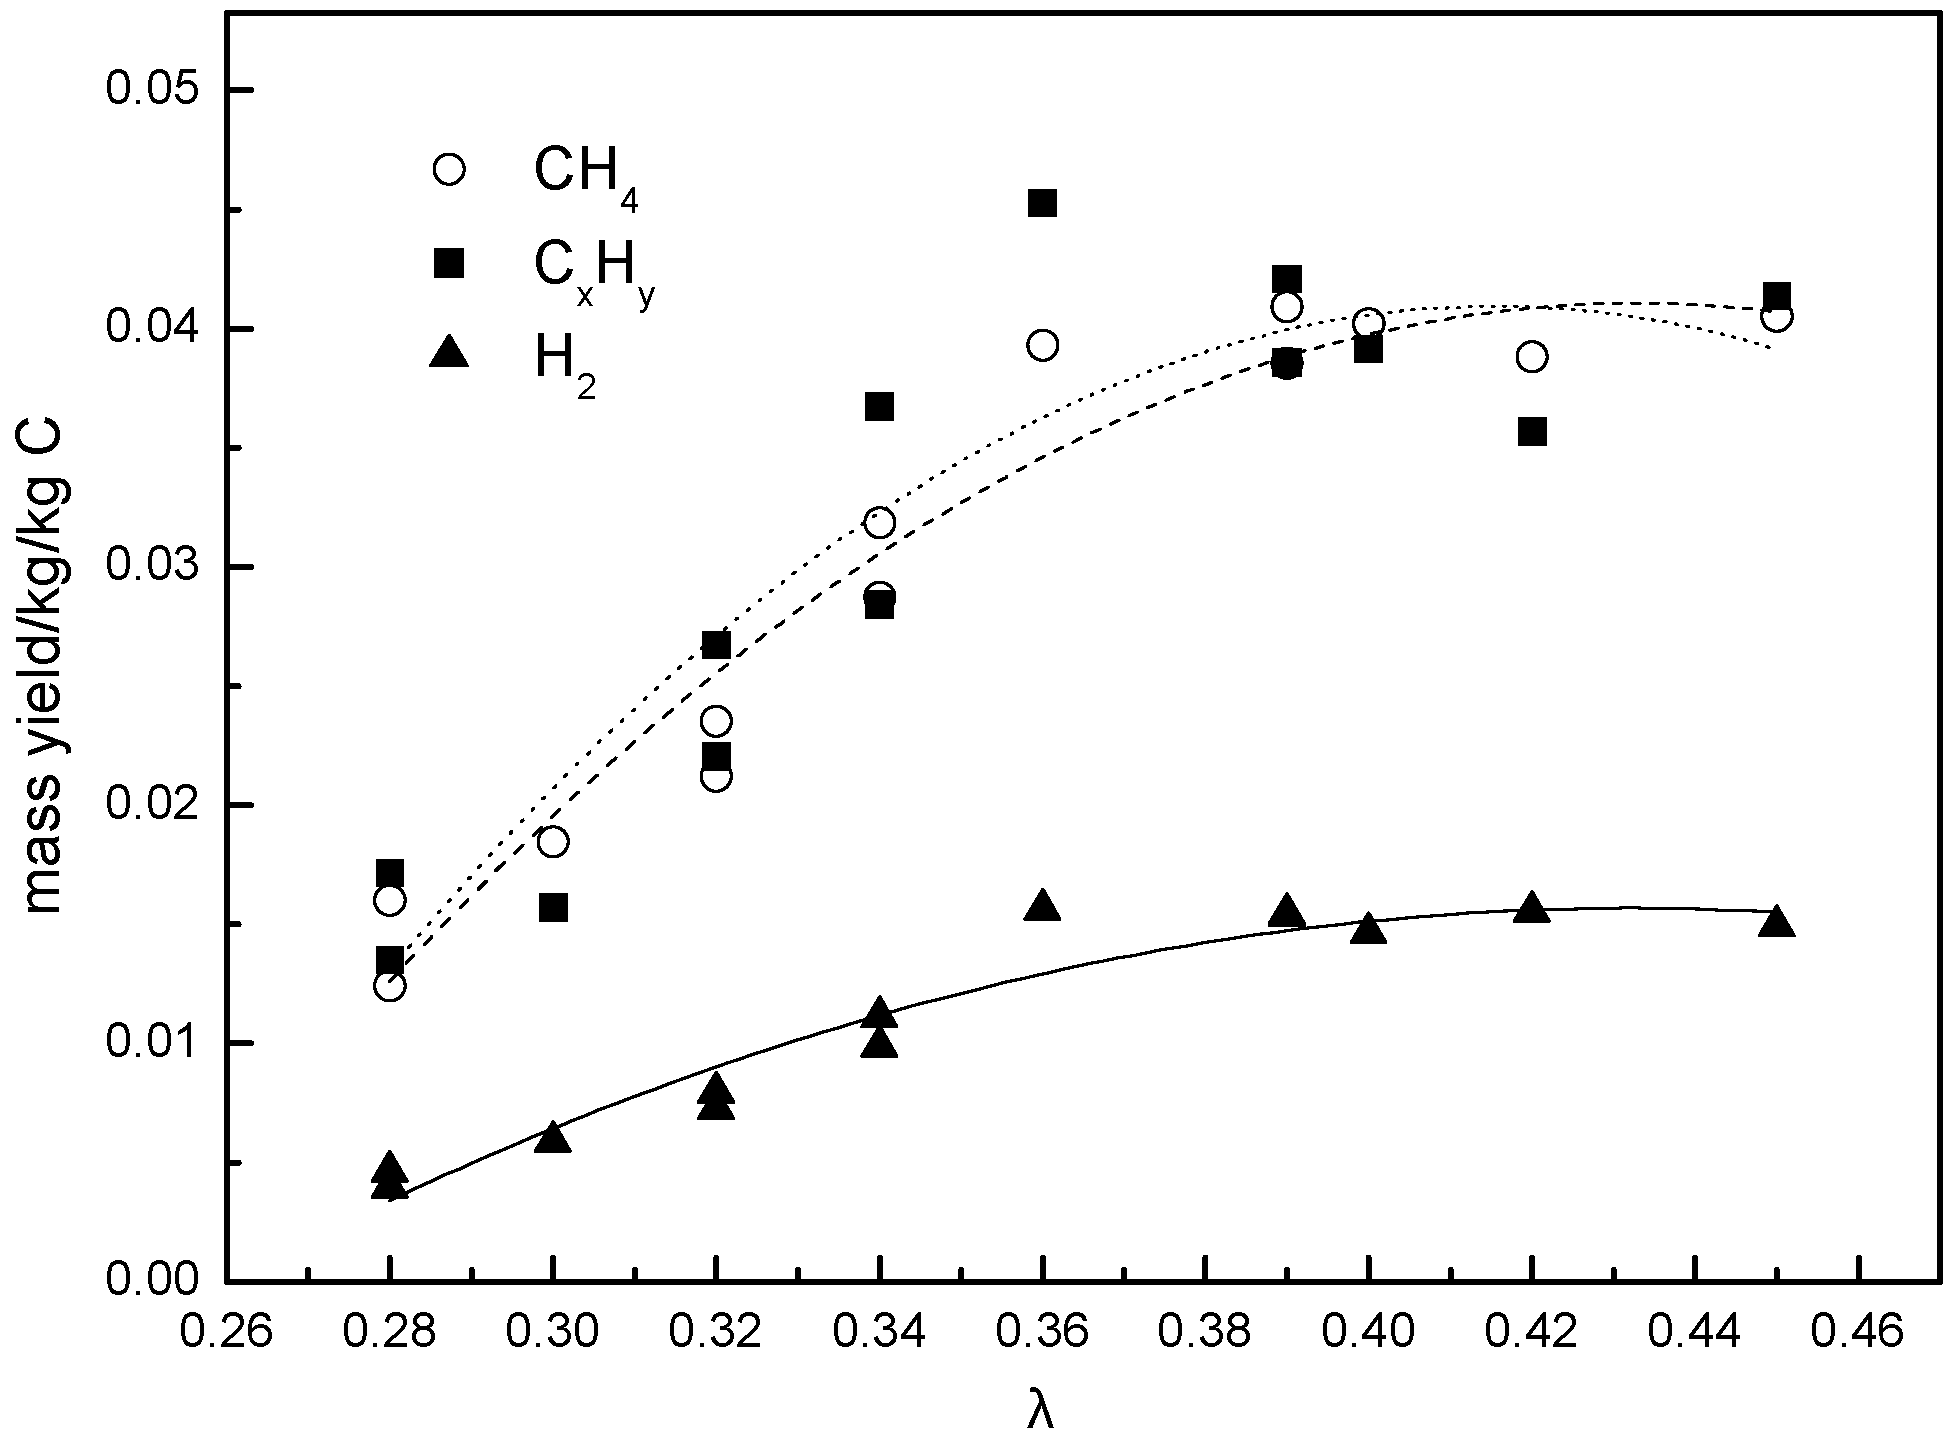
H
2 yield is shown in
Figure 8. The peak value of 0.029 kg/kg C appears at λ = 0.36. The release of H
2 is mainly due to bonds between H radicals that are produced by the decomposition of larger molecules. Moreover, the polycondensation and dehydrocyclization of the biomass char structure would be another source of H
2 formation. Hence, H
2 production has a strong relationship with the environmental temperature. However, when λ exceeded 0.36, H
2 may be consumed through combustion.
Figure 8.
CH4, CxHy and H2 mass yield.
Figure 8.
CH4, CxHy and H2 mass yield.
CH
4 and C
xH
y are shown in
Figure 8. The formation of CH
4 is always considered to be the product of demethylation reactions. Therefore, the amount of methyls in the biomass structure and the environmental temperature would be important for CH
4 production. The peak values of CH
4 and C
xH
y were 0.074 kg/kg C and 0.085 kg/kg C at the point of λ = 0.36.
The syngas low heat value (LHV) is calculated by Equation (3):
where V
CO, V
H2, V
CH4 and V
CxHy are the volume composition of CO, H
2, CH
4 and C
xH
y in the syngas.
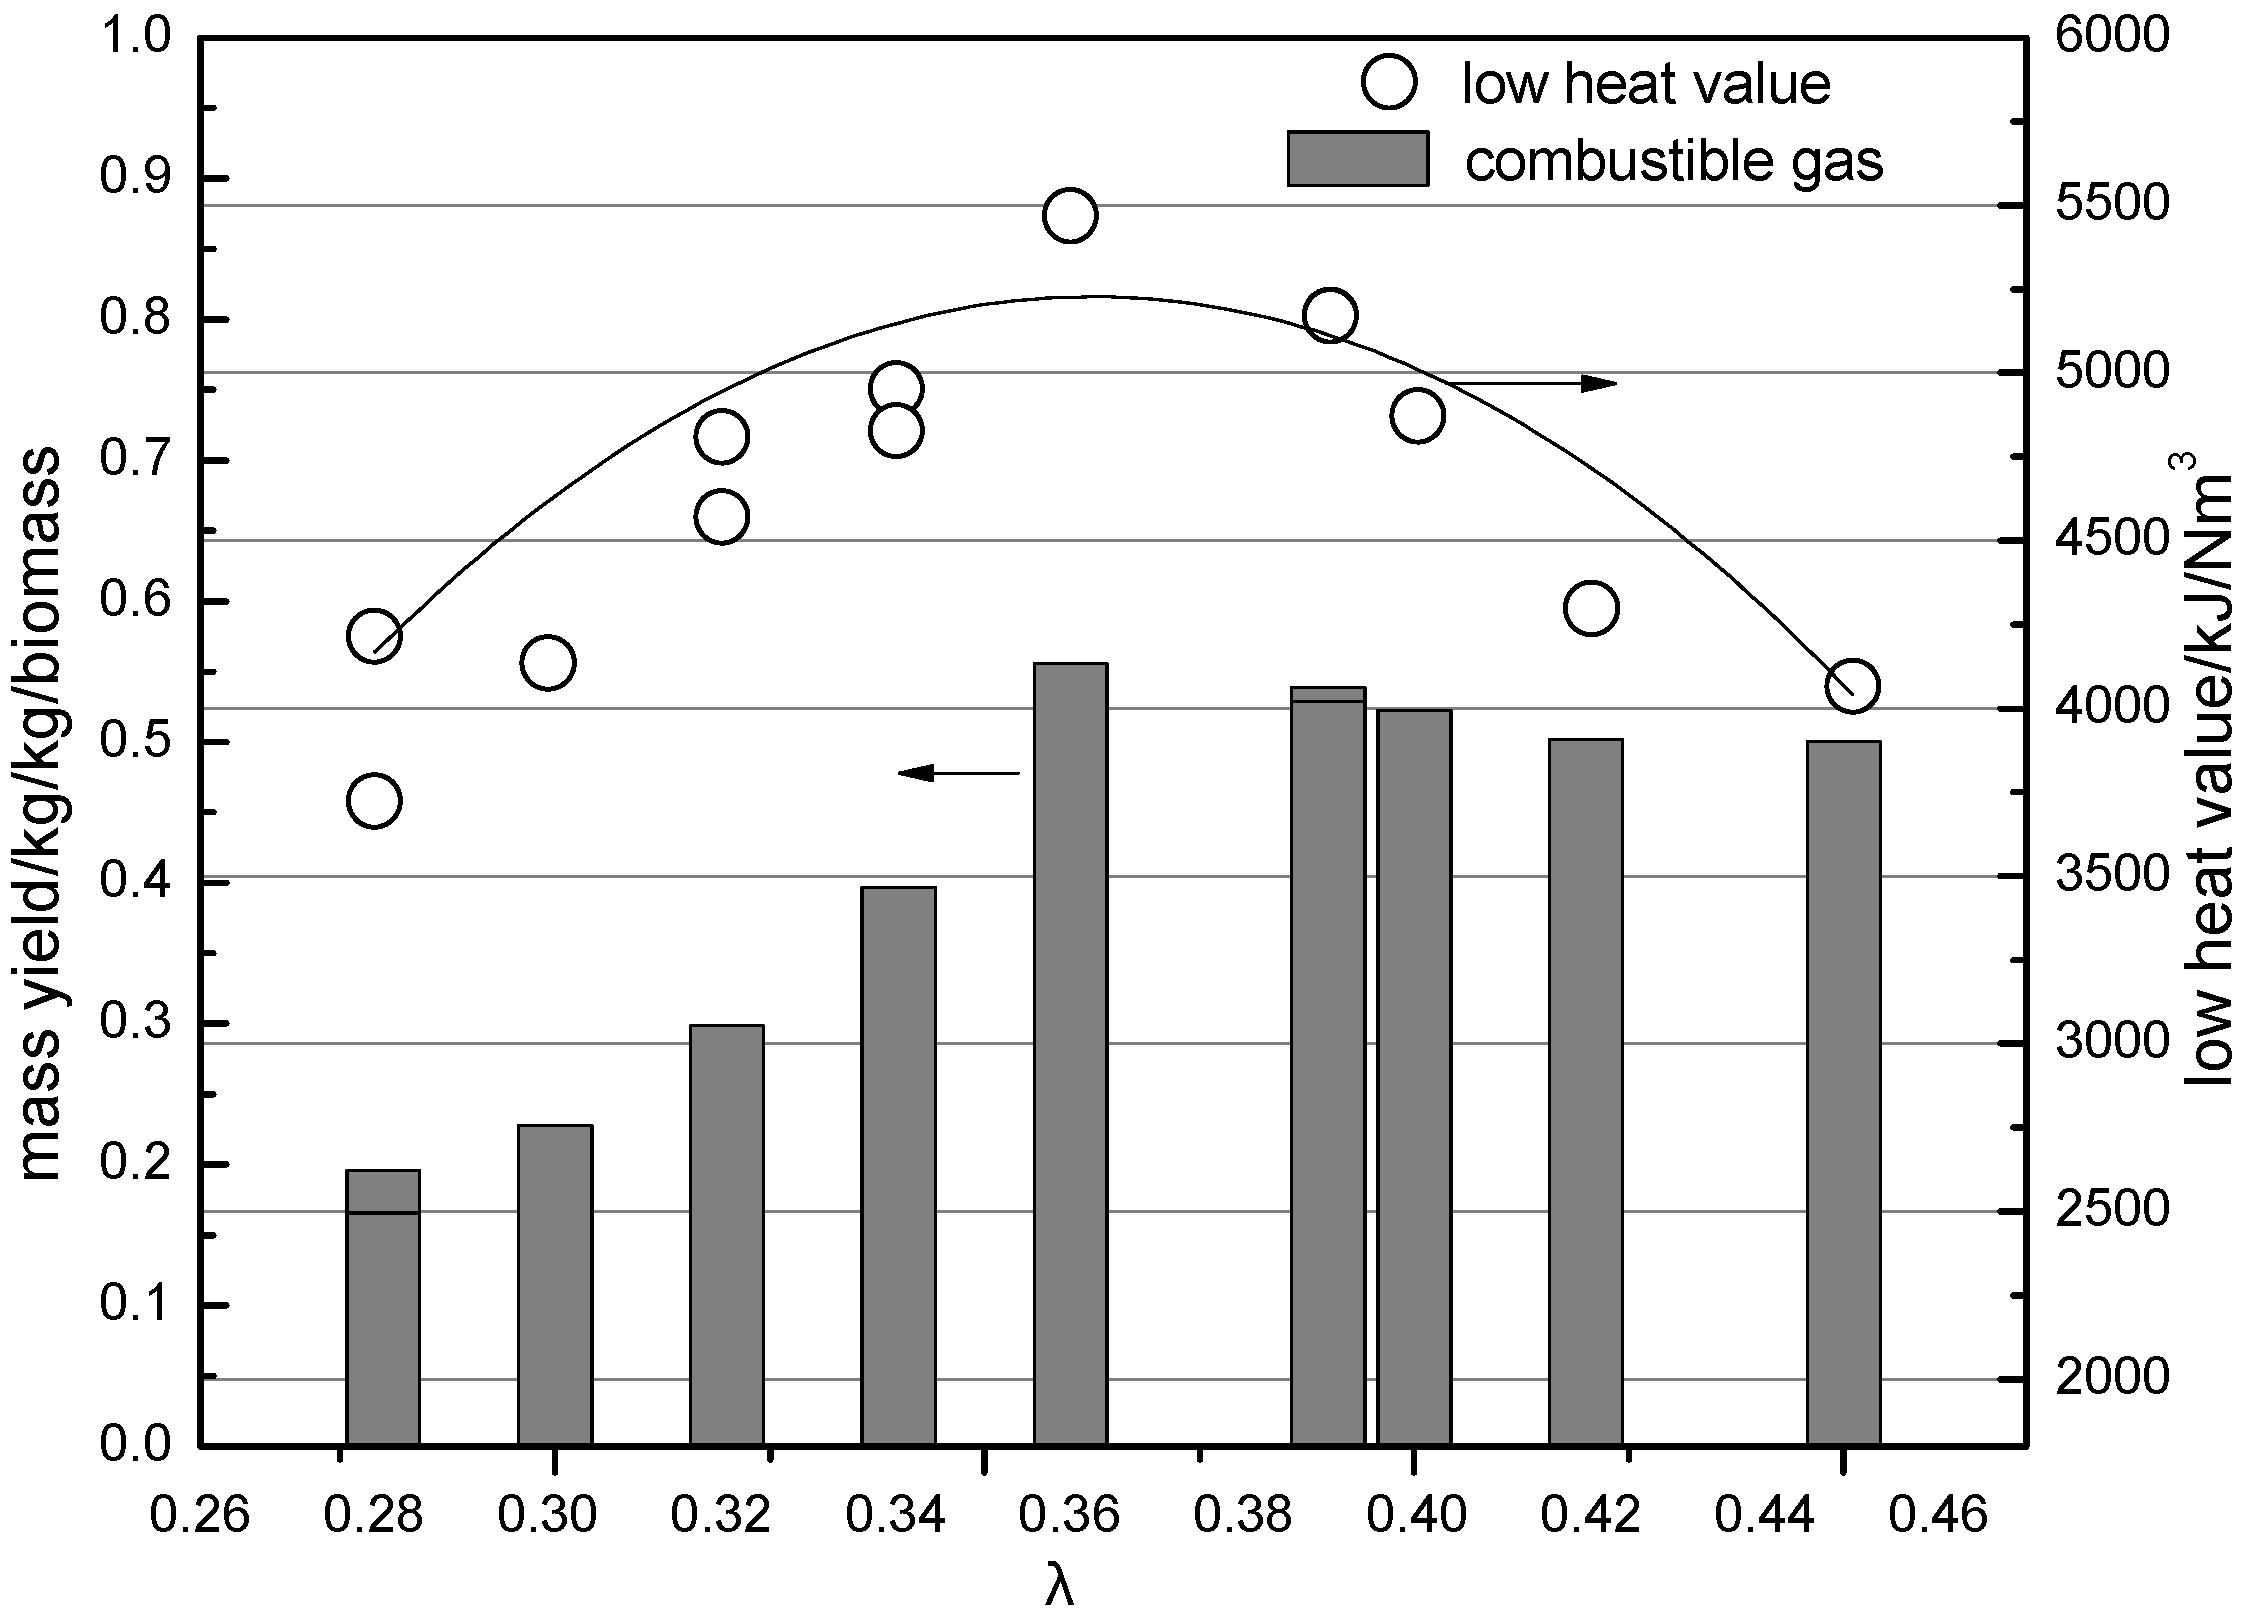
The variation of LHV is shown in
Figure 9. A higher λ resulted in a rise of the temperature inside the gasifier. However, the quality of syngas was not always increasing. When λ increased from 0.28 to 0.36, LHV grew from 4214.66 kJ/Nm
3 to 5469.85 kJ/Nm
3, whereas, LHV decreased to 4065.50 kJ/Nm
3 when λ increased to 0.45. Thus, optimization of λ was critical in the present biomass gasification process.
Figure 9.
Mass of combustible gas and low heat value of syngas.
Figure 9.
Mass of combustible gas and low heat value of syngas.
The total combustible gas and LHV in syngas reached a maximum value of 0.556 kg/kg biomass and 5469.85 kJ/Nm3 at λ = 0.36 in the current study. Under these conditions, the temperature in the second region was comparatively high. Since the oxygen concentration was not too high, the combustible gases would not be consumed by combustion. It is also found that when λ exceeded 0.36, the environmental temperature rose up to a high level. Therefore, the oxidation of produced fuel gas would reduce the heat value of the syngas. It is clear that λ = 0.36 is a threshold point for improving or deteriorating syngas quality in this study. Several factors contributed to this transformation, such as the high decomposition rate of biomass in an oxidative environment, higher tar destruction efficiency, and more reactive char for gasification.
3.4. Tar Yield and Composition
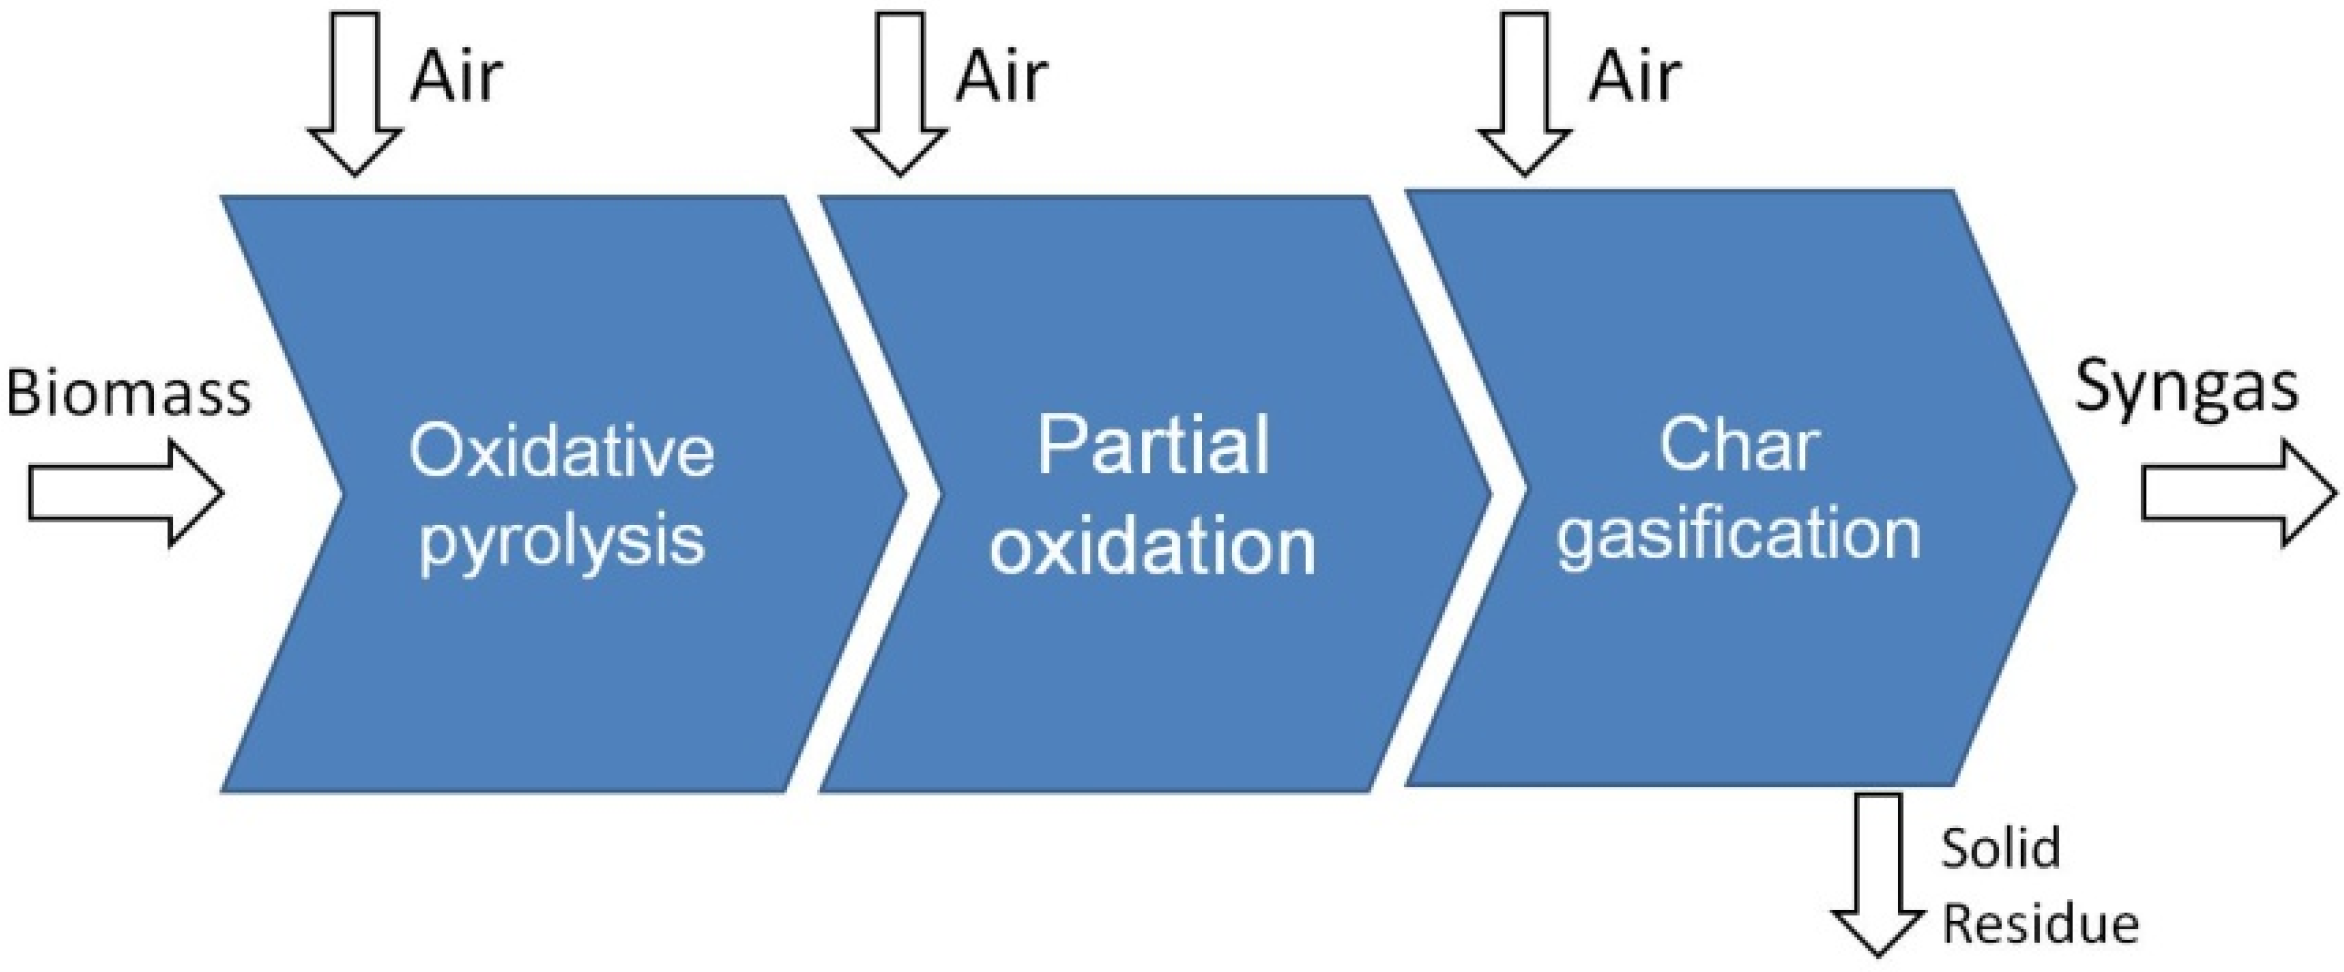
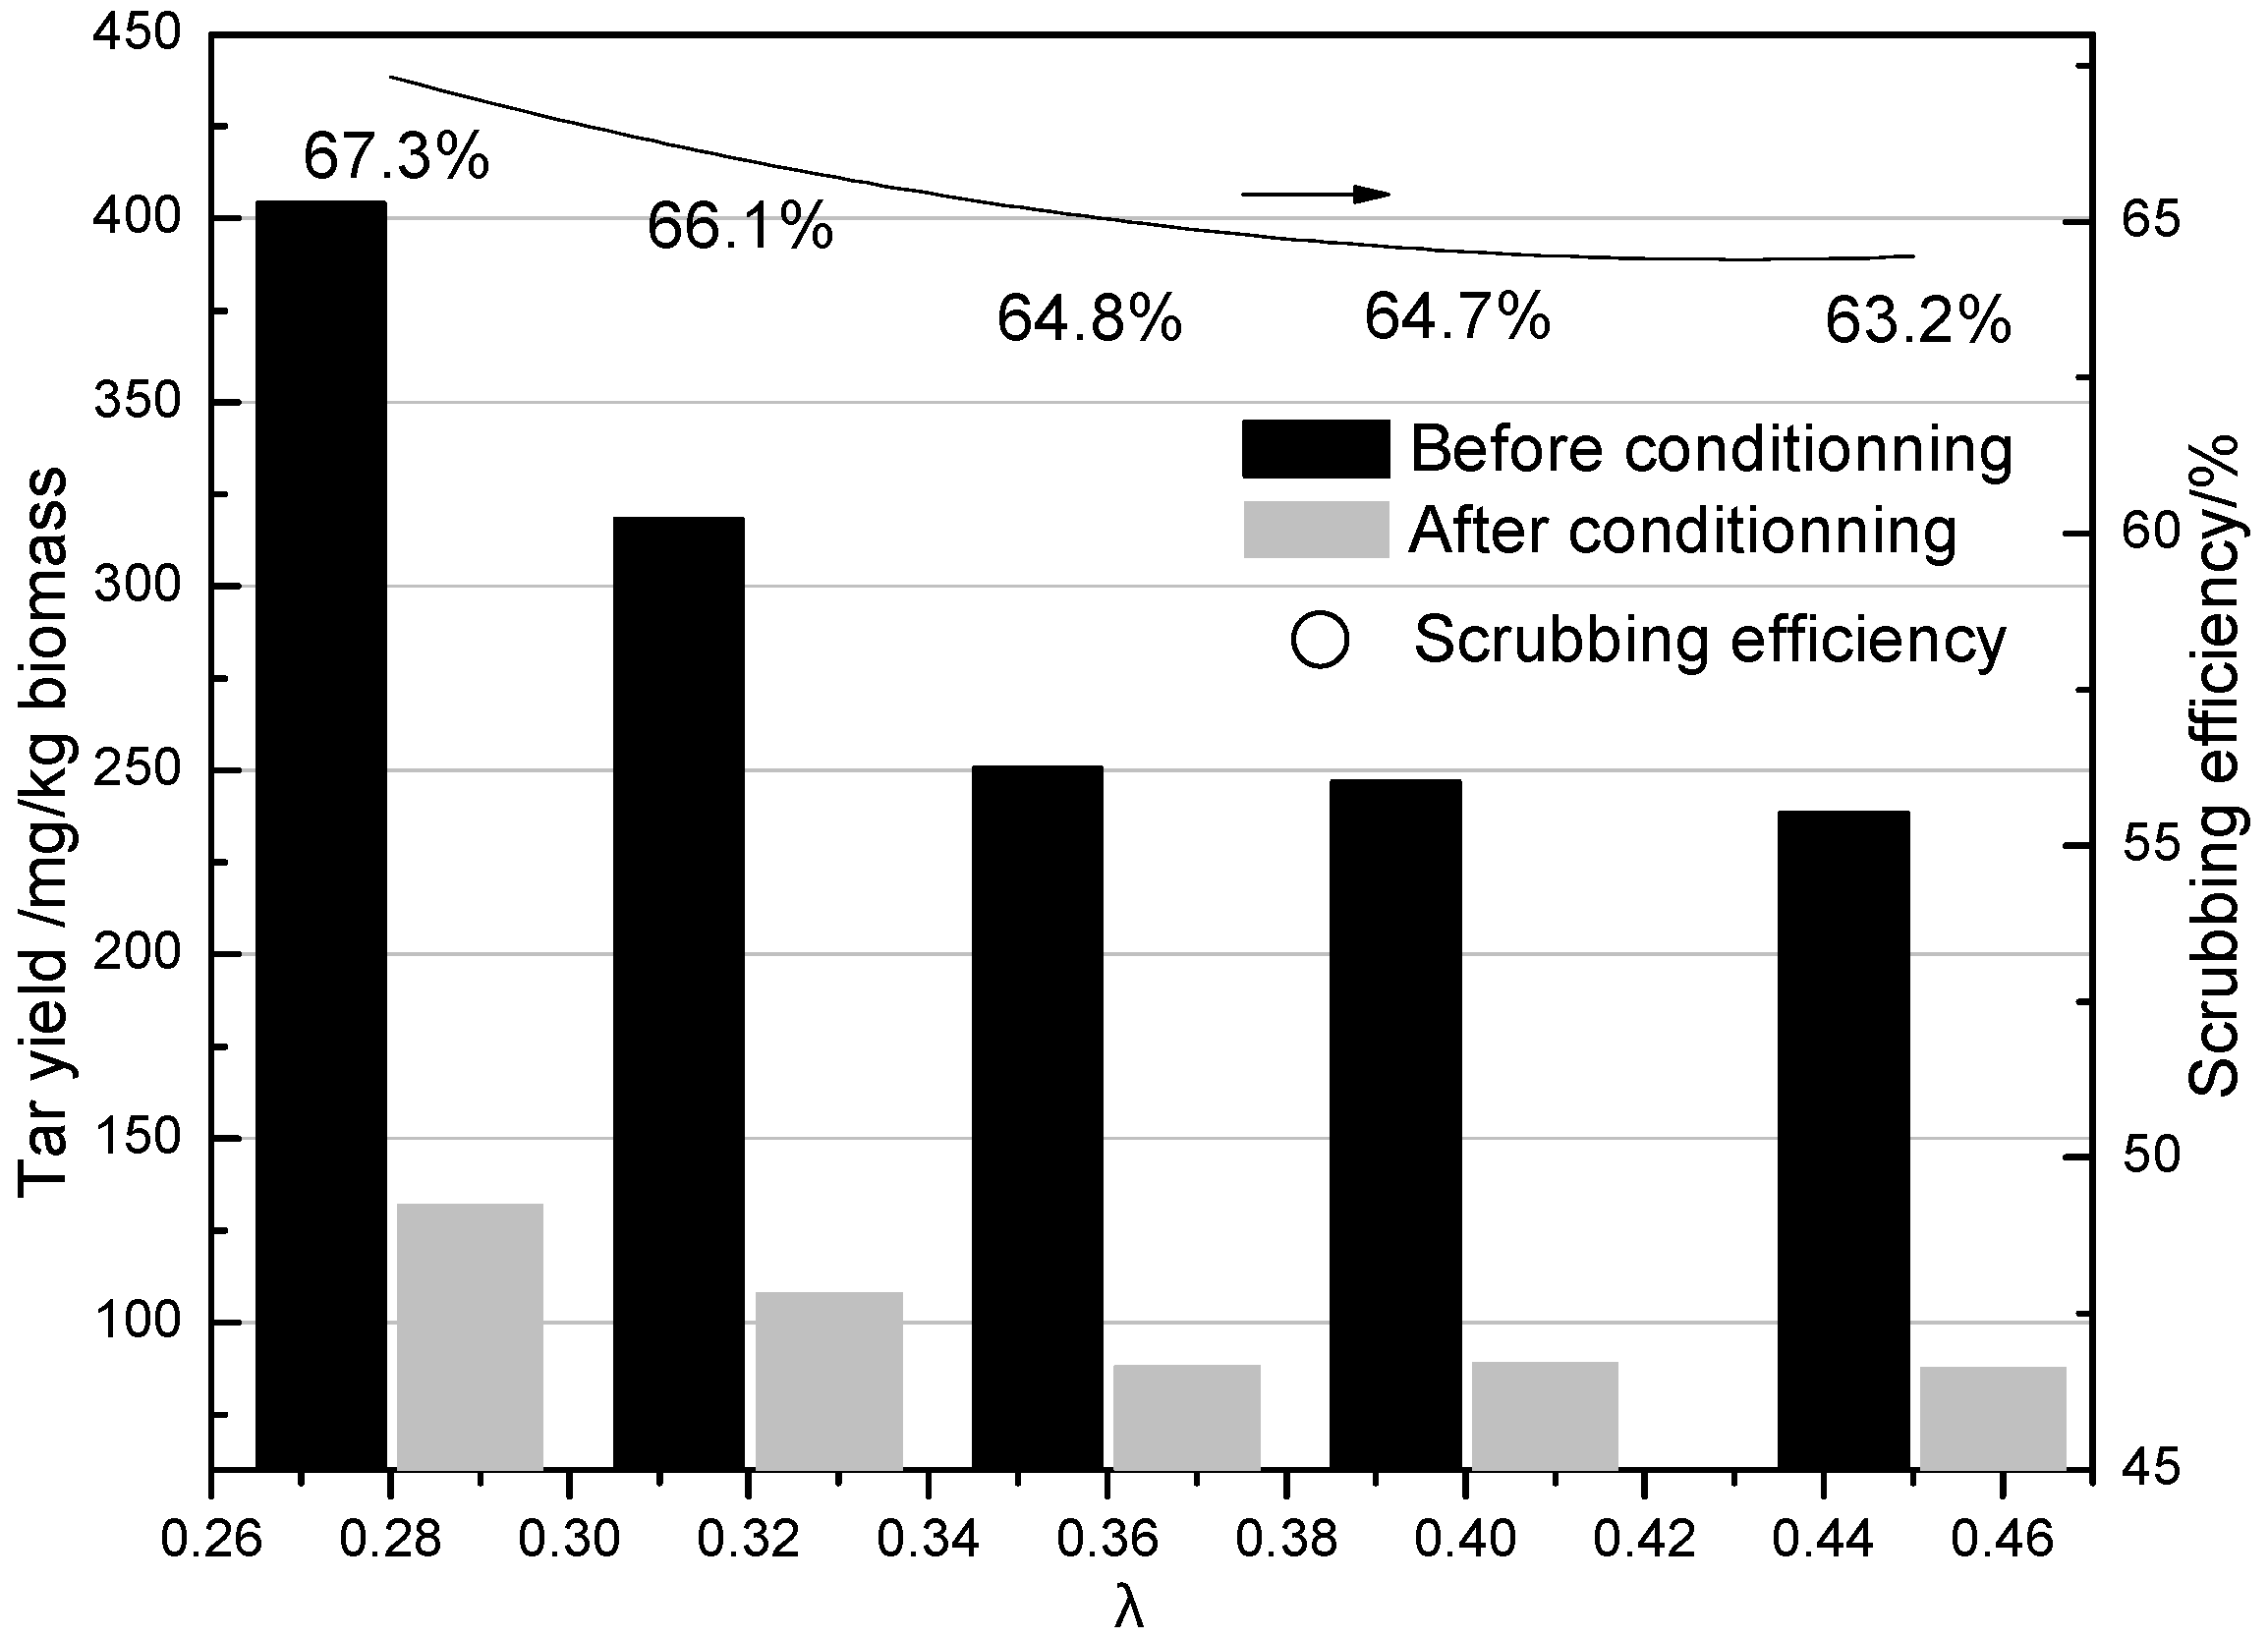
Biomass tar sampled from sample port 1 (before conditioning) and 2 (after conditioning) were analyzed carefully. The total tar yield variation with λ is shown in
Figure 10. It was observed that when λ increased from 0.28 to 0.45, the tar yield was reduced from 404 mg/(kg biomass) to 238 mg/(kg biomass). In the present gasifier, biomass tar was mainly formed at the pyrolysis stage. After that, tar decomposition and conversion happened in the second and third regions. During the tar conversion process, large molecular species not only cracked but polymerized to form high molecular weight aromatics. When the oxygen concentration in the first region was increased, tar production was suppressed. It is reported in the literature that under an oxidative environment, a large number of free radicals are formed [
26]. These high reactive radicals will attack the weak bonds between tar molecules, hence pyrolytic tar would easily decompose. Increasing λ resulted in a temperature rise in the second and third regions as shown in
Figure 6. A high temperature environment is beneficial for tar decomposition. Moreover, biomass char can act as an adsorbent and catalyst for tar conversion as described before. This effect would be enhanced under higher temperatures. Looking at the above factors, the total biomass tar production was reduced by an increase of λ.
Figure 10 also shows that tar yield obviously decreased after the gas conditioning process. Although the scrubbing efficiency slightly decreased as the input tar concentration was reduced, the average efficiency could be kept at around 65%. This indicated that the gas conditioning system has good load regulation ability.
Figure 10.
Tar concentration variation with λ.
Figure 10.
Tar concentration variation with λ.
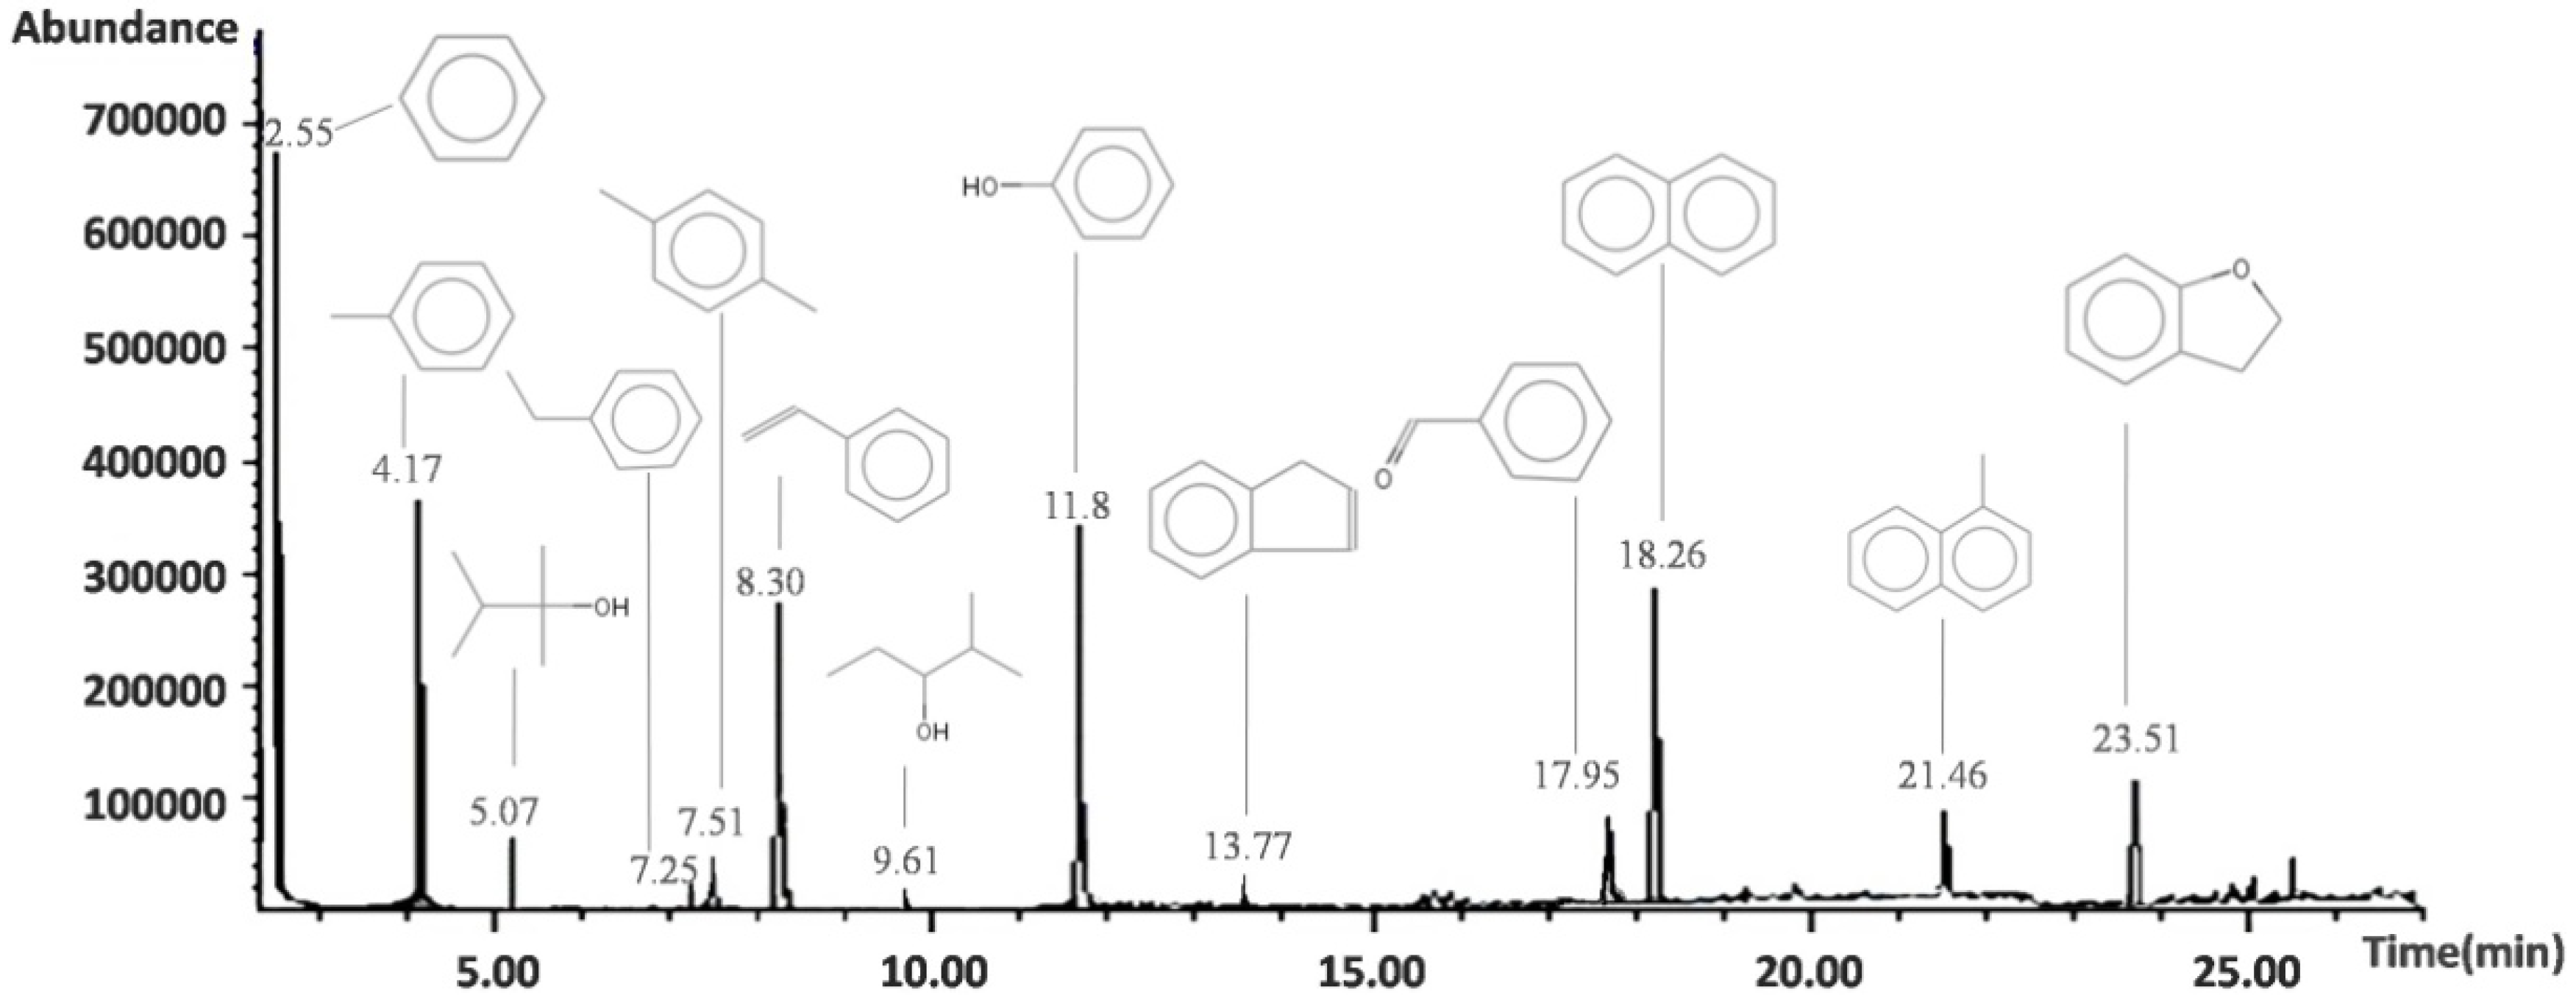
Figure 11 shows a GC chromatogram illustrating the composition of a typical tar sample from sampling port 1. Each remarkable peak was marked with the corresponding species. The highest peak corresponded to benzene, followed by toluene, styrene, phenol and naphthalene. Benzene, toluene and xylene have lower boiling points. These components are not problematic for further usage. In addition, these species could increase the syngas lower heating value and anti-knocking properties during combustion in a gas engine. However, these tar components easily condense below 300 °C, which could cause fouling in the gas duct and other process facilities.
Figure 11.
GC chromatogram of a typical sample from sampling port 1.
Figure 11.
GC chromatogram of a typical sample from sampling port 1.
Tar composition and species relative concentrations are listed in
Table 2. The relative concentrations are calculated by the corresponding peak area minus the sum of the areas of all the detected peaks. The listed 13 species represent about 85% of the total detected tar components. Among all the detected species, benzene was the most abundant one. Since benzene is the simplest aromatic with singe ring, any side chain breakage or decomposition of aromatics would produce benzene. It can be seen from
Table 2 that when λ increased from 0.28 to 0.45, its relative concentration increased from 27.22% to 48.73%. This implies that tar decomposition and side chain breakage were favored under higher λ. Besides benzene, toluene and naphthalene are the other two most abundant components. When λ increased from 0.28 to 0.45, their concentration rose up from 9.76% and 6.75% to 15.32% and 13.52%, respectively. In comparison, toluene and naphthalene have more thermo-stable structures.
Table 2.
Tar concentration and species relative concentration (%).
Table 2.
Tar concentration and species relative concentration (%).
| No. | Molecular Formula | Species Name | Equivalent Ratio (λ) |
|---|
| 0.28 | 0.32 | 0.36 | 0.40 | 0.45 |
|---|
| Before Conditioning | After Conditioning |
|---|
| 1 | C6H6 | Benzene | 37.22 | 39.21 | 43.25 | 41.35 | 45.64 | 48.73 |
| 2 | C7H8 | Toluene | 9.76 | 9.86 | 12.46 | 12.06 | 14.63 | 15.32 |
| 3 | C8H16O2 | 2-Butanol, 2,3-dimethyl- | 2.45 | 2.75 | 2.01 | / | 1.65 | 1.1 |
| 4 | C8H10 | Ethylbenzene | 1.21 | 1.12 | 0.46 | / | 0.73 | 0.37 |
| 5 | C8H10 | p-Xylene | 1.12 | 0.42 | 0.52 | / | 0.35 | 0.26 |
| 6 | C8H8 | Styrene | 6.53 | 5.72 | 4.36 | 1.68 | 2.1 | 2.41 |
| 7 | C6H14O | 3-Pentanol, 2-methyl- | 0.87 | 0.46 | 0.63 | / | 0.37 | 0.43 |
| 8 | C6H6O | Phenol | 9.24 | 6.26 | 2.68 | 1.72 | 2.74 | 2.35 |
| 9 | C9H8 | Indene | 0.55 | 0.94 | 1.12 | / | 1.42 | 1.32 |
| 10 | C7H6O3 | Benzaldehyde | 2.13 | 0.96 | 0.86 | / | 0.87 | 0.91 |
| 11 | C8H10 | Naphthalene | 6.75 | 10.14 | 12.56 | 31.32 | 13.22 | 13.52 |
| 12 | C11H10 | Naphthalene, 1-methyl- | 2.31 | 2.41 | 2.33 | 3.17 | 2.42 | 2.51 |
| 13 | C8H8O | Benzofuran, 2,3-dihydro- | 4.31 | 4.14 | 0.85 | / | 0.67 | 0.72 |
| Percentage of above species (with benzene) from all detected species % | 84.45 | 84.39 | 84.09 | 91.3 | 86.81 | 89.95 |
| Percentage of above species (without benzene) from all detected species % | 47.23 | 45.18 | 40.84 | 49.95 | 41.17 | 41.22 |
The amounts of phenol and its derivatives were comparatively less. Since hydroxyls easily break away from benzene rings under high temperatures and in an oxidative environment, phenolic products could be converted to benzene easily. As seen from
Table 2, as λ increased from 0.28 to 0.45, the phenol concentration decreased from 9.24% to 2.35%. Likewise, benzofuran decreased from 4.31% to 0.72%. Other oxygen-containing tar components presented a decreasing trend with increase of λ as well.
Tar composition variation before and after conditioning is illustrated in
Table 2. It can be seen that after gas conditioning, the number of species was reduced remarkably. Six detected species accounted for up more than 90% of the total tar. The primary constituents are benzene, toluene, styrene, phenol, naphthalene and 1-methylnaphthalene.
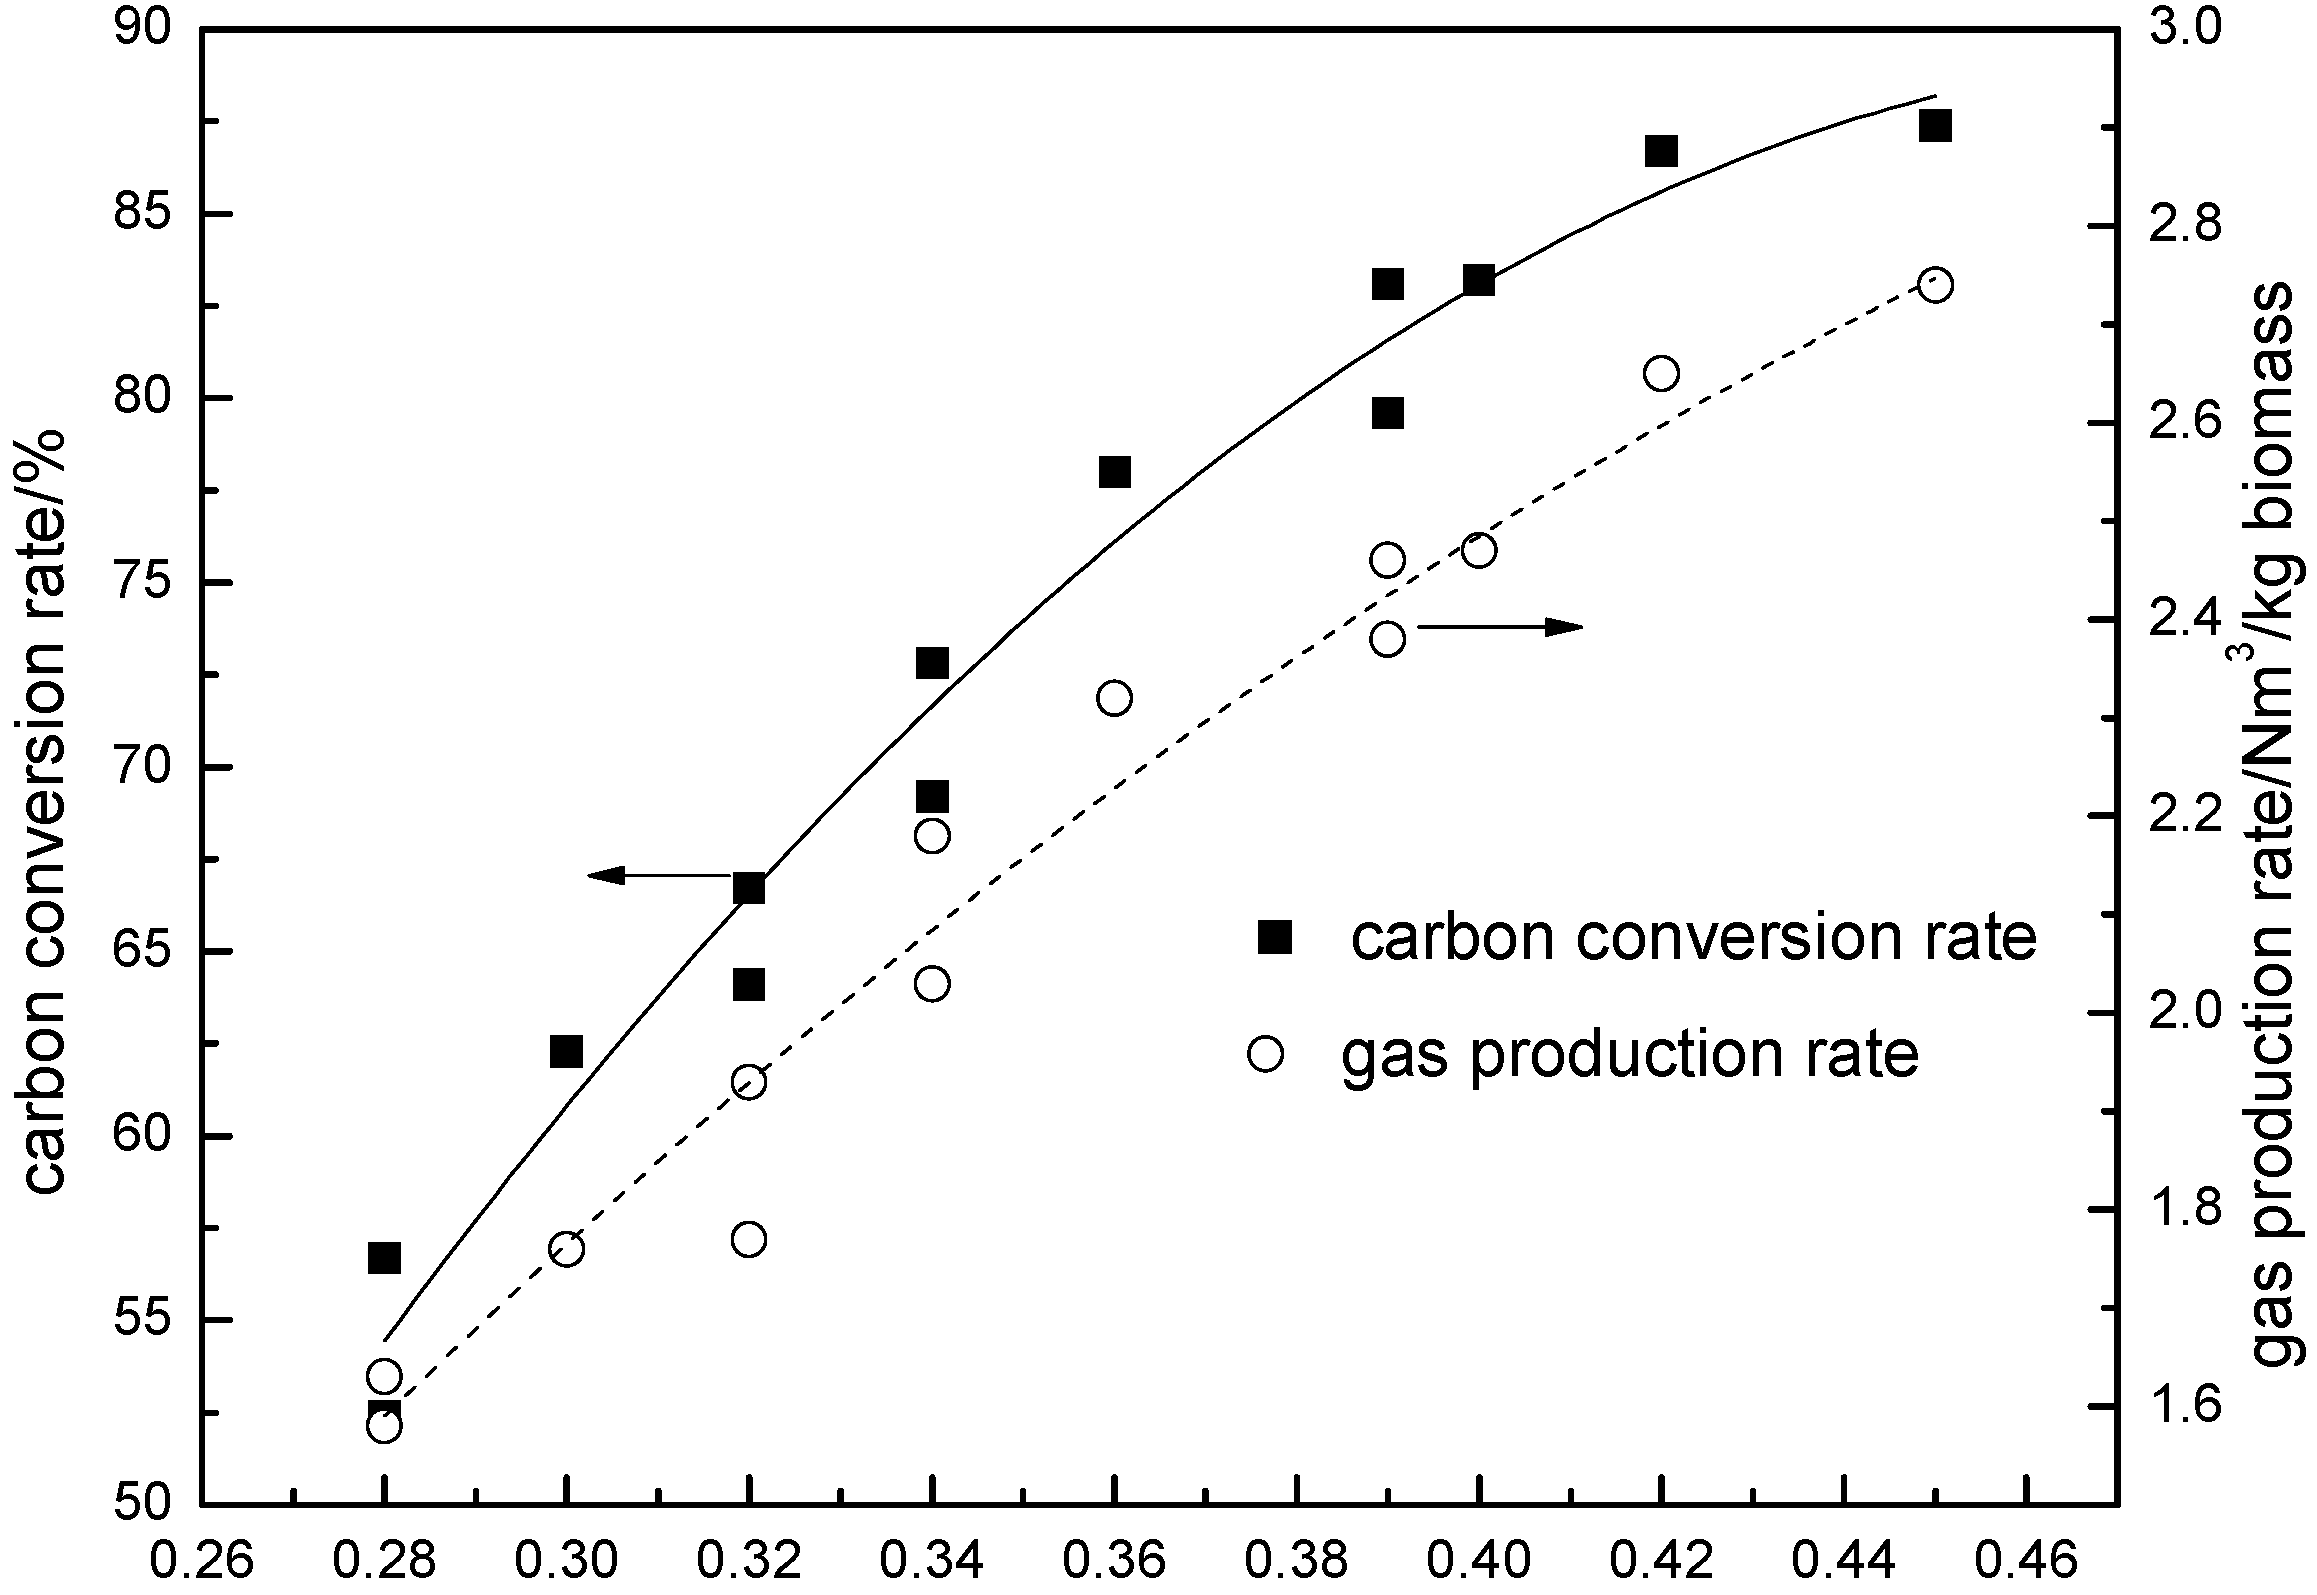
3.5. Gas Production Rate and Carbon Conversion Rate
Gas production rate and carbon conversion rates are defined by Equations (4) and (5).
As shown in
Figure 12, the gas production rate increased continuously with λ. This is because gas production rate takes no account of heat value. The increase of gas production rate after λ = 0.36 is mainly due to a rapid production of CO
2 (
Figure 7). Similarly, the carbon conversion rate displays an increasing trend with λ as well. Under the conditions when λ was below 0.36, the carbon conversion rate increased rapidly. When λ was greater than 0.36, the rate of increased was slightly slowed down. As λ increased from 0.28 to 0.36, more air was injected; gasification and oxidation reactions were enhanced. As a result, a large number of combustible gases were produced. With further air being injected, the fuel gas would be combusted, since homogeneous oxidation reactions are faster than heterogeneous oxidation reactions under a high temperature [
23]. However, homogeneous oxidation will not affect the carbon conversion rate, therefore, an increase of λ from 0.36 to 0.45 would have a weaker influence on carbon conversion rates than the condition when λ < 0.36.
Figure 12.
Carbon conversion rate and gas production rate.
Figure 12.
Carbon conversion rate and gas production rate.
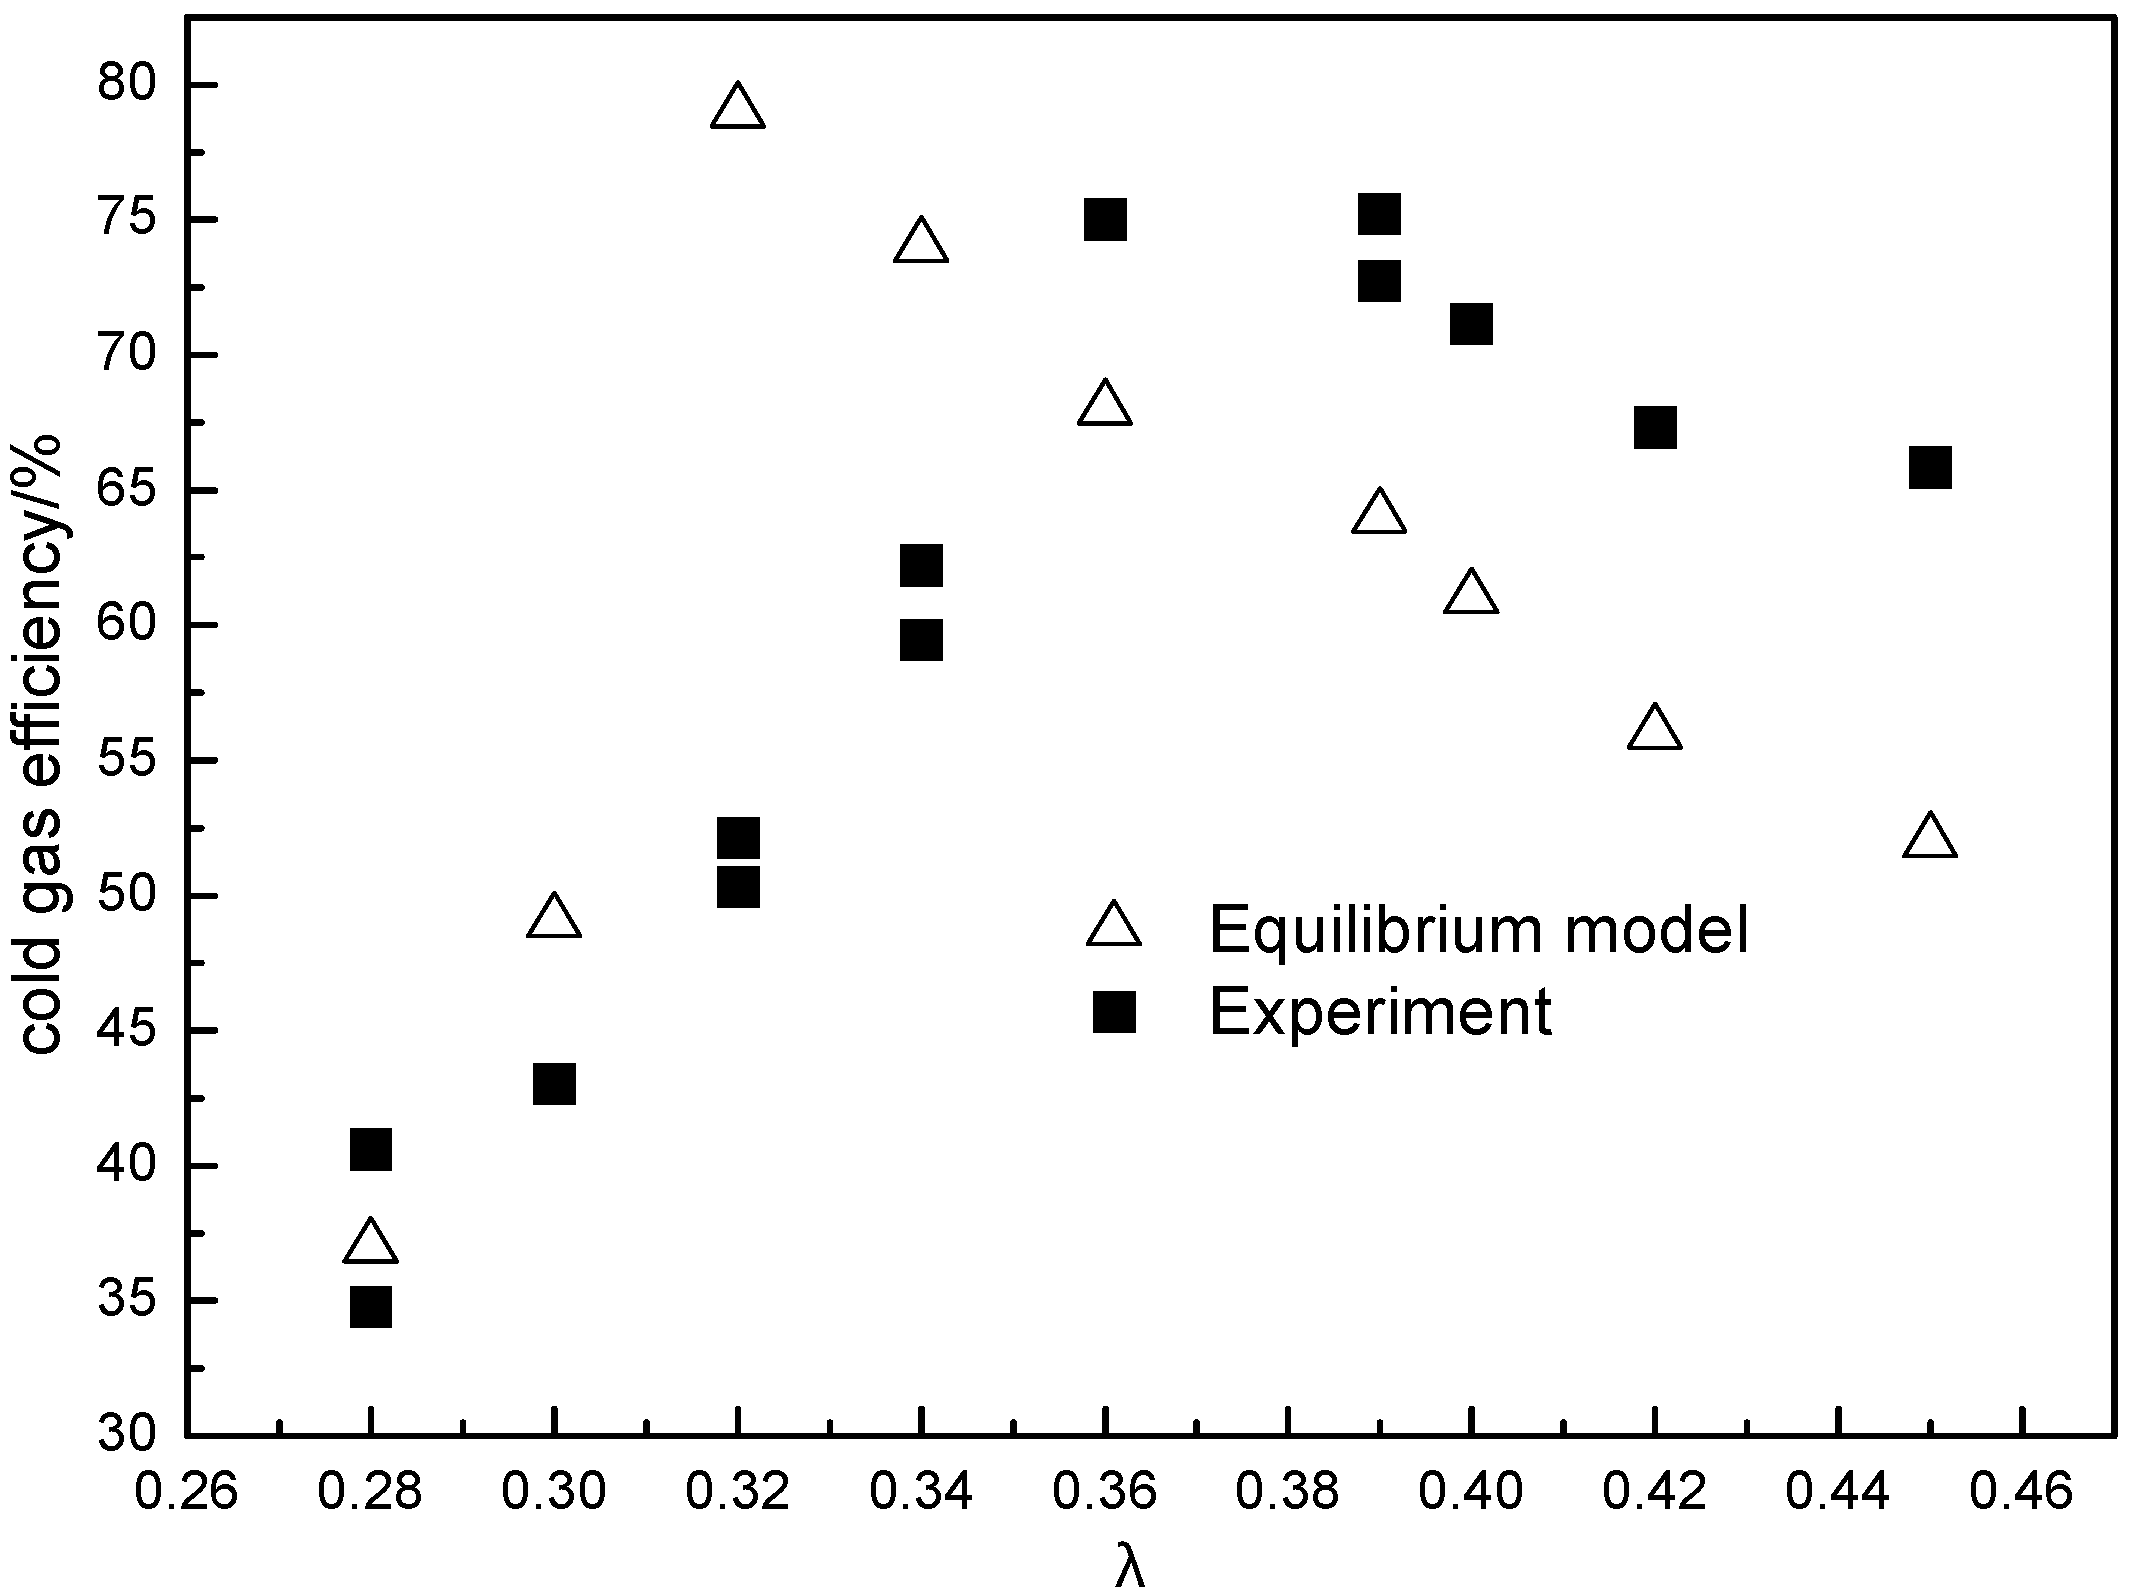
3.6. Cold Gas Efficiency
Cold gas efficiency indicates the energy conversion efficiency from biomass feedstock to syngas. It is defined by Equation (6):
A comparison of the theoretical and experimental cold gas efficiency results is plotted in
Figure 13. The theoretical thermodynamic equilibrium calculations based on Gibbs free energy minimization is chosen to model the biomass gasification process. For the equilibrium calculations, the software program FactSage 5.4.1 has been used. FactSage is an integrated thermochemical databank system consisting of calculation modules and databases. It enables the user to access and manipulate pure substance and solution databases and perform thermochemical calculations such as multiphase chemical equilibria. It was seen that under equilibrium conditions there is a general increase in the cold gas efficiency with λ. The maximum value of 79% was obtained at λ = 0.32. This peak value is higher than the operational results and occurs at a lower λ. The highest cold gas efficiency of 75% can be achieved when λ was 0.36 under the operation conditions. Since the equilibrium model assumes an isothermal and long enough residence time to achieve equilibrium, the error may be attributed to the non-isothermal temperature inside the gasifier and the short residence time.
Figure 13.
Cold gas efficiency of theoretical vs. experimental results.
Figure 13.
Cold gas efficiency of theoretical vs. experimental results.
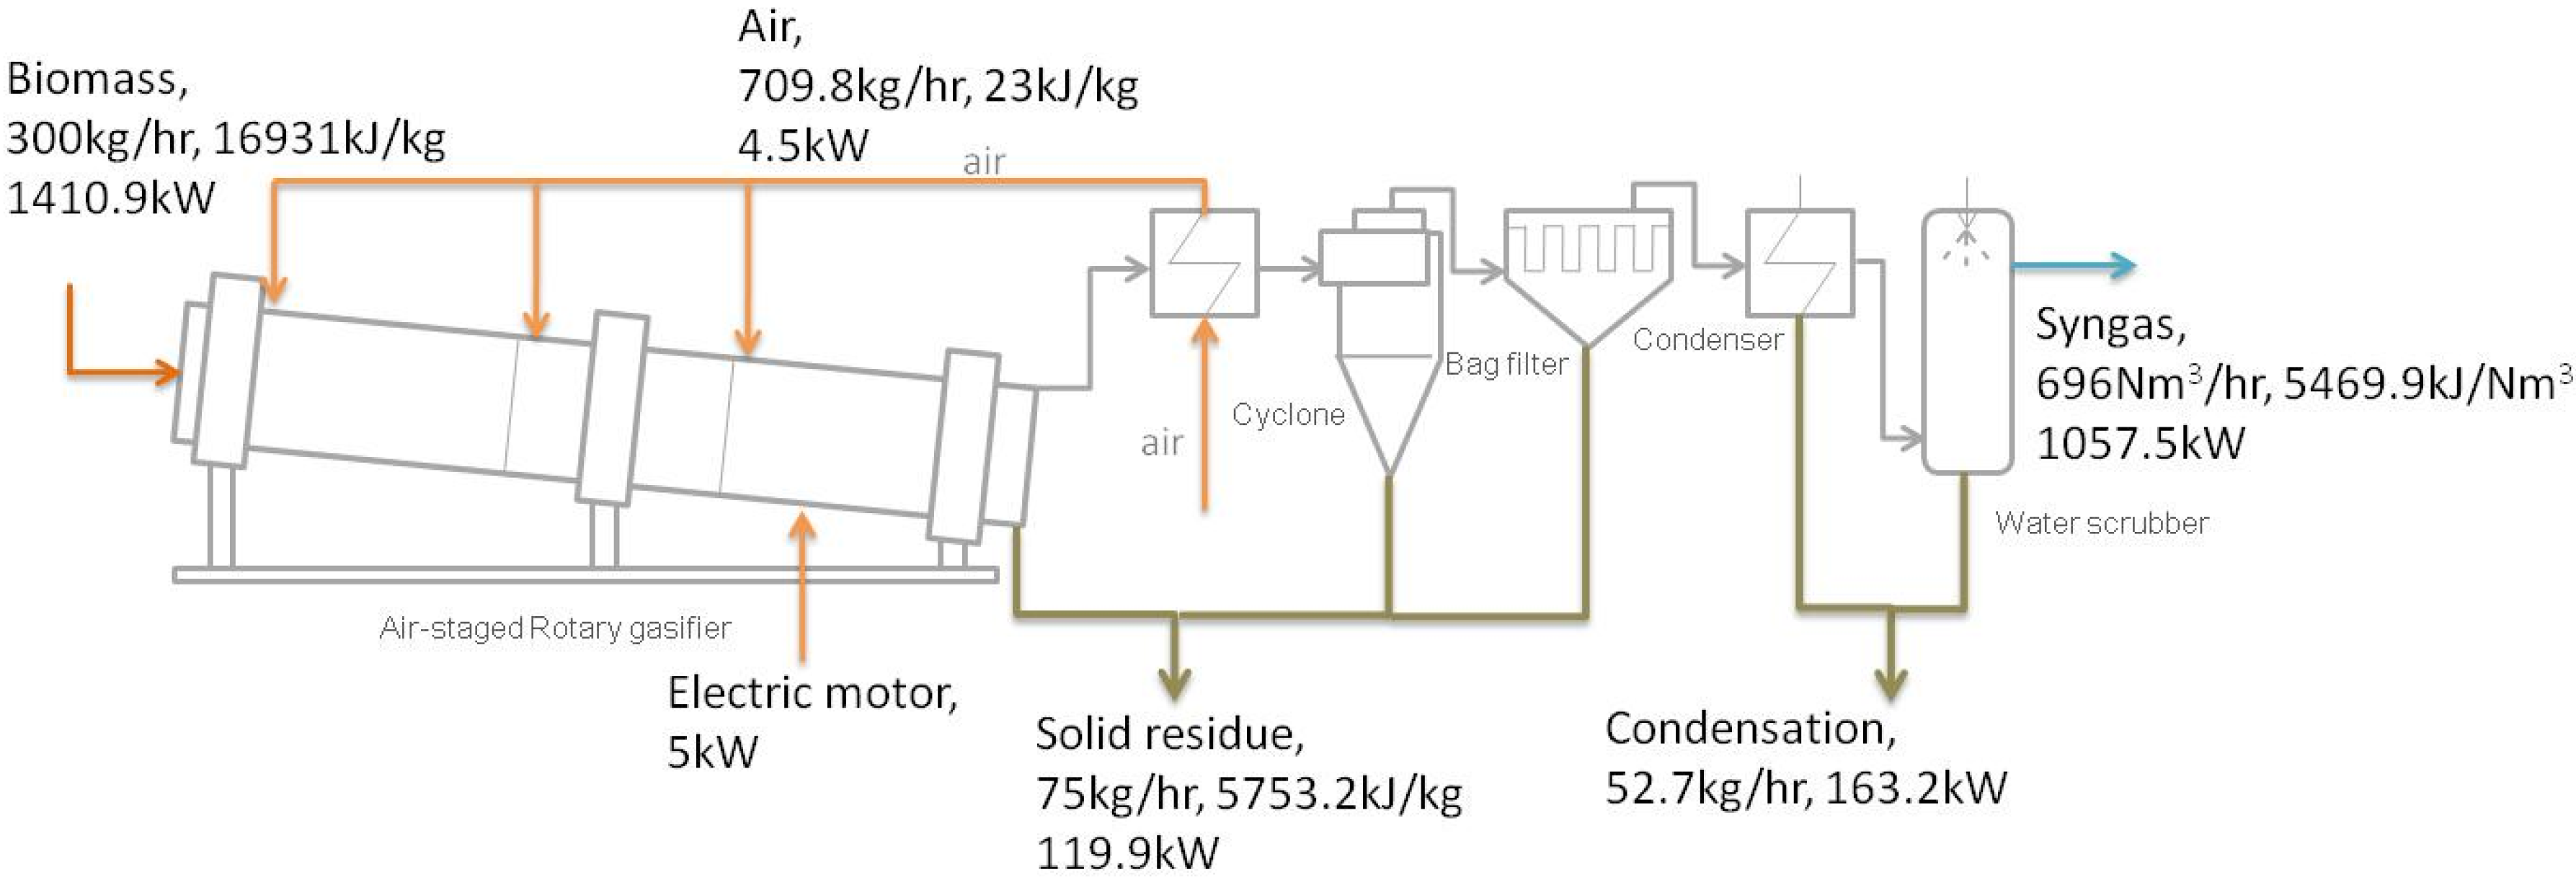
3.7. Energy Balance Analysis
The total energy balance is calculated using Equations (7) to (10):
where E = mass × heat value:
Figure 14 shows the schematic diagram of the system with the energy input and output of products at each stage. Total energy input was determined by biomass feeding rate, total air injection and motor power. In the present test, the energy input was 1420.4 kW. The syngas energy was 1057.5 kW, so the energy conversion efficiency is 74.45%. This was due to heat losses from the system and also the heat reserved in the char residue. Besides, some of the energy is also lost in the gas conditioning system through the scrubbing and condensation processes. The characteristics of the solid residue are listed in
Table 3.
Figure 14.
Energy input and output of the gasification system.
Figure 14.
Energy input and output of the gasification system.
Table 3.
Proximate and ultimate analysis of the solid residue.
Table 3.
Proximate and ultimate analysis of the solid residue.
| Proximate Analysis 1 (wt %) | Ultimate Analysis 1 (wt %) | Low Heat Value (kJ/kg) |
|---|
| Water | Ash | Volatile | Fixed Carbon | C | H | O | N | S |
|---|
| 1.35 | 88.29 | 0 | 10.36 | 5.93 | 3.17 | 0.12 | 0.24 | 0.31 | 5753.2 |
The heat value of the solid residue was determined by a bomb calorimeter test. The average heat value is 5753.2 kJ/kg. The solid residue ash production rate is 75 kg/h, which is measured by regular weighing of all the ash from the gasifier, cyclone and bag filter (shown in
Figure 14). As syngas comes in contact with the cyclone internal walls, the temperature drops and tar components along with water vapor may condense. In this process, ash and char would contact with the condensates, causing the ash and char to become wet, decreasing its calorific value. The condensation heat is measured by monitoring the scrubbing and cooling water temperature variation as well as their flow rate. The heat inputs and outputs drawn in
Figure 14 were not totally balanced. The error of 4.95% could be due to system heat dissipation and other possible heat losses that could not be measured.
3.8. Comparison of Performance of Biomass Gasifier
In
Table 4 the experimental results are compared with those reported in the literature. Generally, fluidized bed gasifiers provide an intensive contact between gas and solid biomass which results in higher reaction rates and conversion efficiencies. Fixed bed gasifiers typically have a lower heat and mass transfer and often generate higher amounts of char. The peak temperature in a fixed bed system is also lways higher than in a fluidized bed gasifier, therefore, higher heat value syngas is produced. A recent review [
14] reported that multi-stage gasifiers show an obvious advantage compared with other types. The separation of heating and drying, pyrolysis, oxidation and gasification processes makes it possible to control and optimize the different steps separately. Multi-stage gasifiers produce high purity gas with low levels of tar and high process efficiencies. In the present study, the rotary kiln gasifier combined both the advantages of fixed bed and fluidized bed gasifiers to form a new multi-stage gasifier concept, which has not been reported in any of the previous work. This gasifier provides a more intensive mixture of gas and solid fuel than a fixed bed one, meanwhile, its temperature is higher than that of a fluidized bed one.
Table 4 shows that the present gasifier has a comparatively higher heat value of gas with low tar concentration.
Table 4.
Comparison of the experimental results with published in literature.
Table 4.
Comparison of the experimental results with published in literature.
| Biomass Fuel | Low Heat Value of Syngas MJ/m3 | Tar Concentration (g/m3) | Cold Gas Efficiency (%) | Gasifier Type | Reference |
|---|
| Biomass/waste | 2.9–4.9 | 10~40/0.01–0.9/1~23 | 39.1–56.9/<70 | fluidized bed | [14,27,28] |
| Agrol, willow, and DDGS, sawdust | 2.7–4.3 | 5–12/1~30 | 50-70 | Circulated fluidized bed | [14,28,29,30] |
| Sesame wood and rose wood/hazelnut shell | 4.5–6.3/4~5 | 0.015–0.5/0.01~6 | 30–80.91 | Downdraft fixed bed | [14,29,31,32,33] |
| Sewage sludge and woodpellets | 4.9–5.3/5~6 | 30–150/10~150 | 20–60 | Updraft fixed bed | [14,29,33,34,35] |
| Straw, manure fibres, sewage sludge | 5.2~7/6.6 | 4.8/<0.015 | 87%~93% | Multi-stage | [14,36] |
| Waste wood | 5.5 | 0.038 | 75 | Rotary kiln | present study |


