
Coordinated Voltage Control in Distribution Network with the Presence of DGs and Variable Loads Using Pareto and Fuzzy Logic

Abstract
:
1. Introduction
- (1)
- Variables and unbalanced loads with DGs in distribution network are investigated.
- (2)
- CVCPF uses two optimization techniques. Pareto Optimization to find the optimal voltage and fuzzy logic to calculate the optimal value of reactive power of DG.
- (3)
- CVCPF uses the reactive power of DG as a control variable to minimize the voltage variation.
- (4)
- The objectives of the MO voltage control problem are resolved separately.
2. Coordinated Voltage Control (CVC)
2.1. Objectives Function
2.1.1. Voltage at Pilot Bus
2.1.2. Reactive Power
2.1.3. Voltage at Generators
2.2. Constraints
2.2.1. Reactive Power Constraint
2.2.2. Technical Compliance Voltage
2.2.3. Weights Constraints
3. Coordinated Voltage Control Using Pareto and Fuzzy Logic (CVCPF)
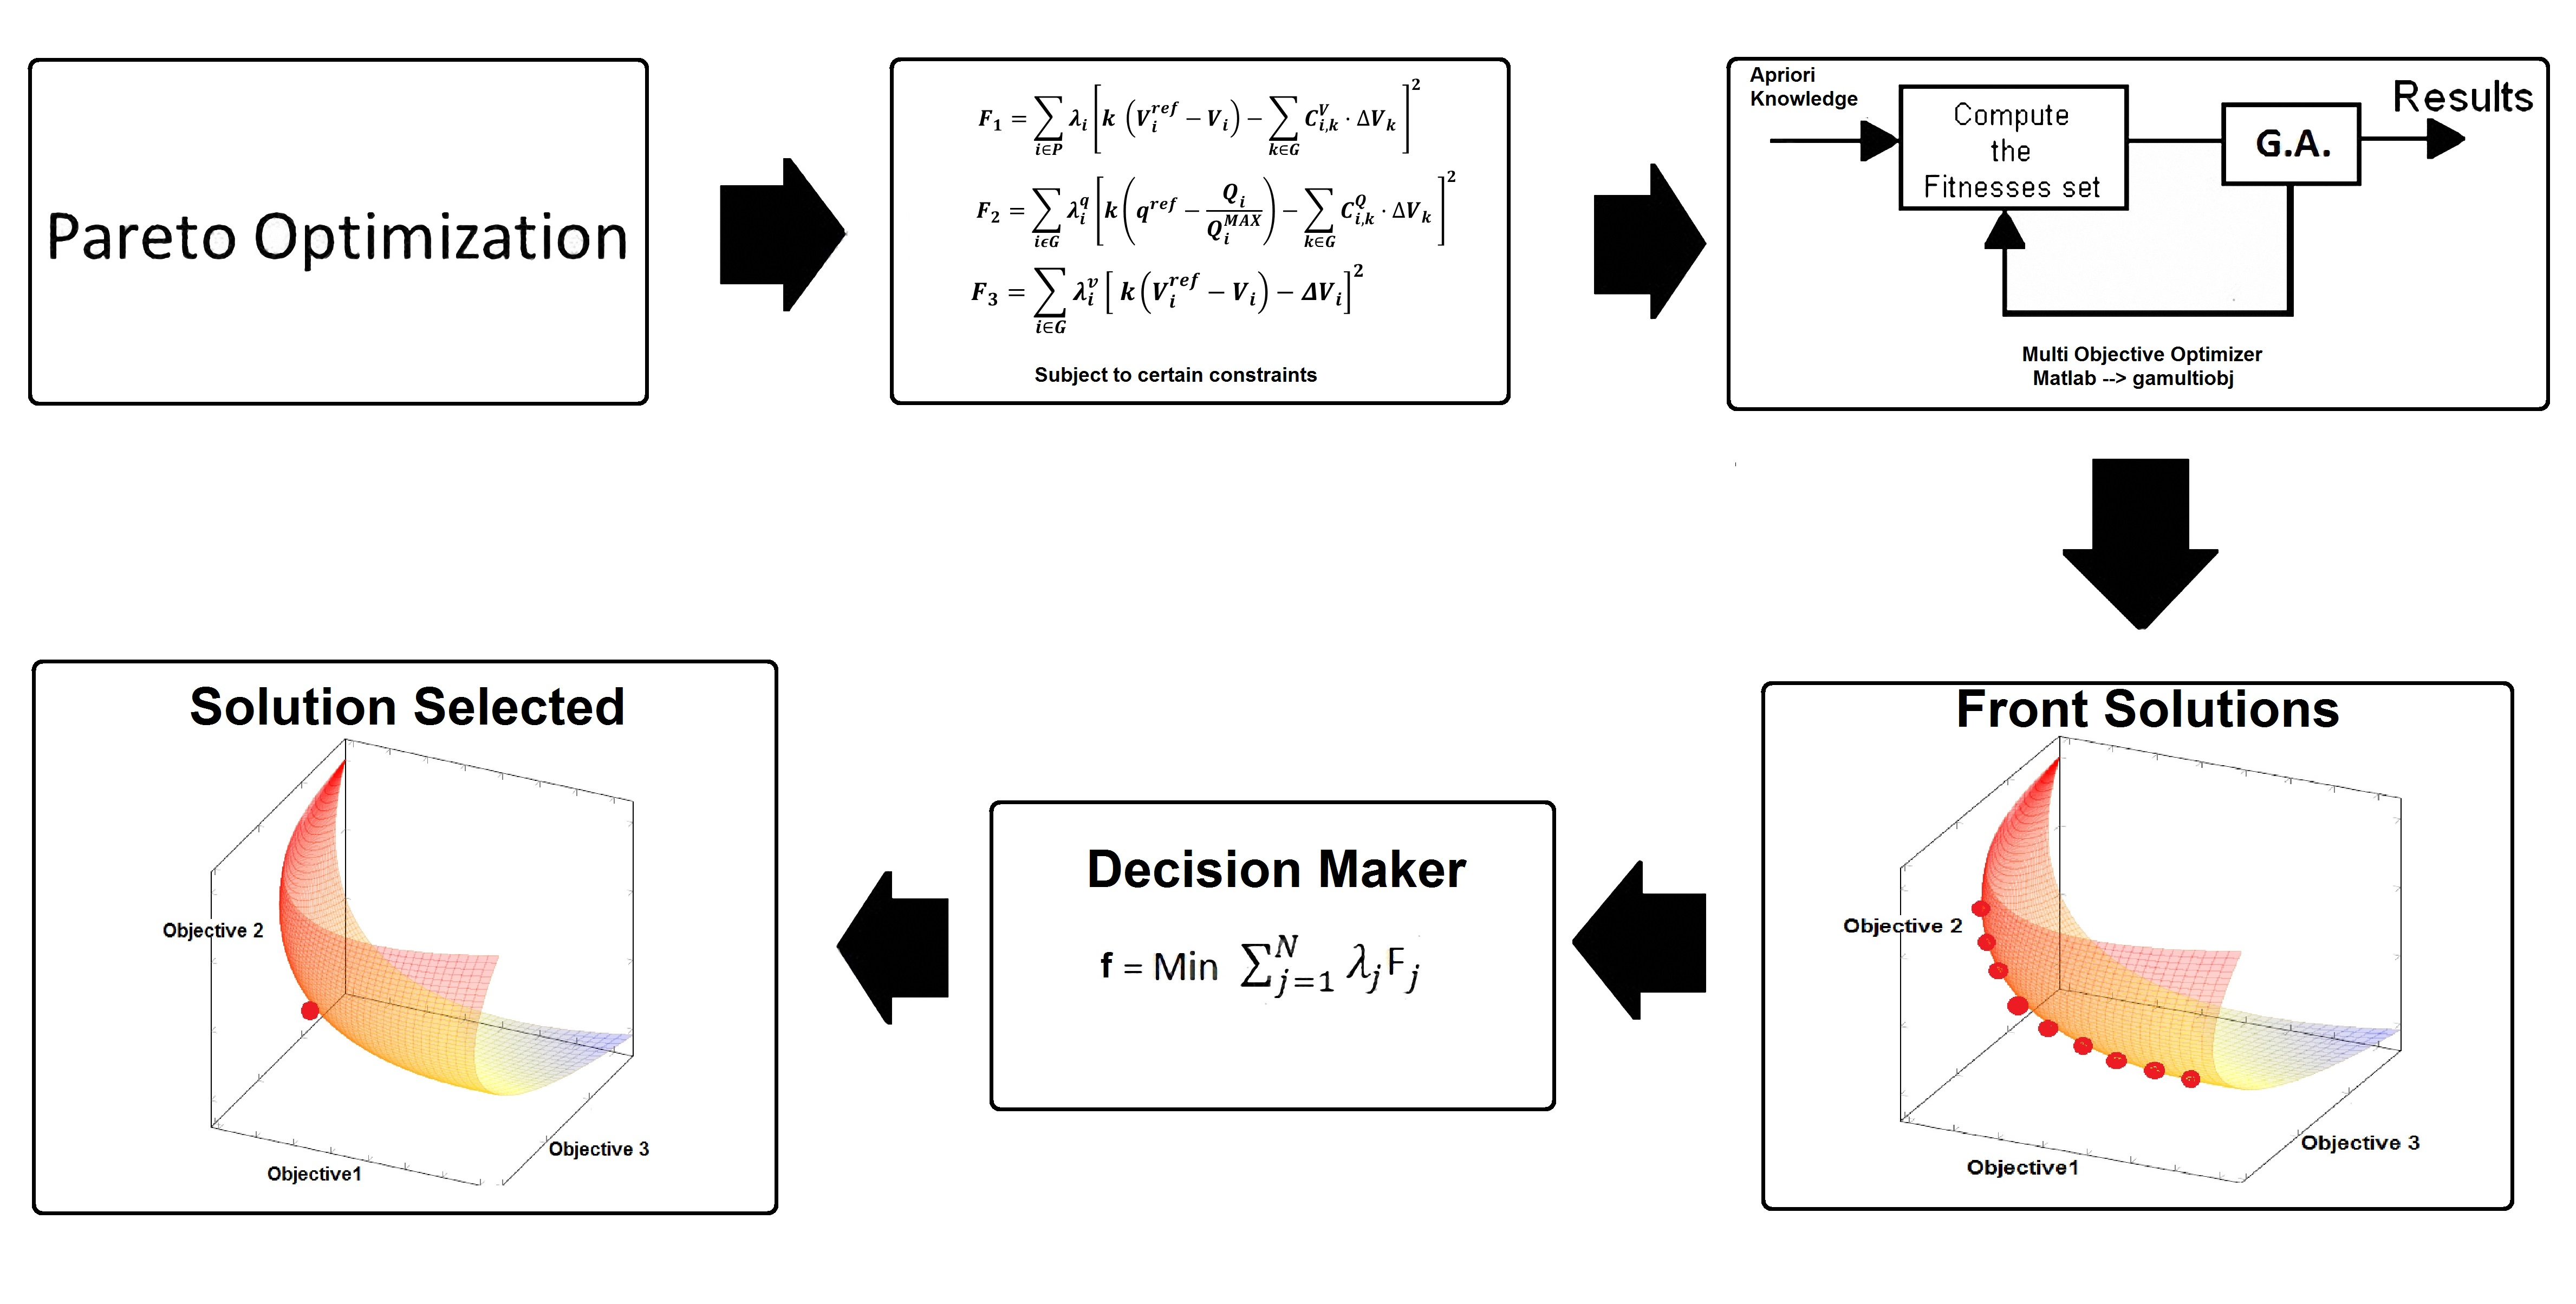
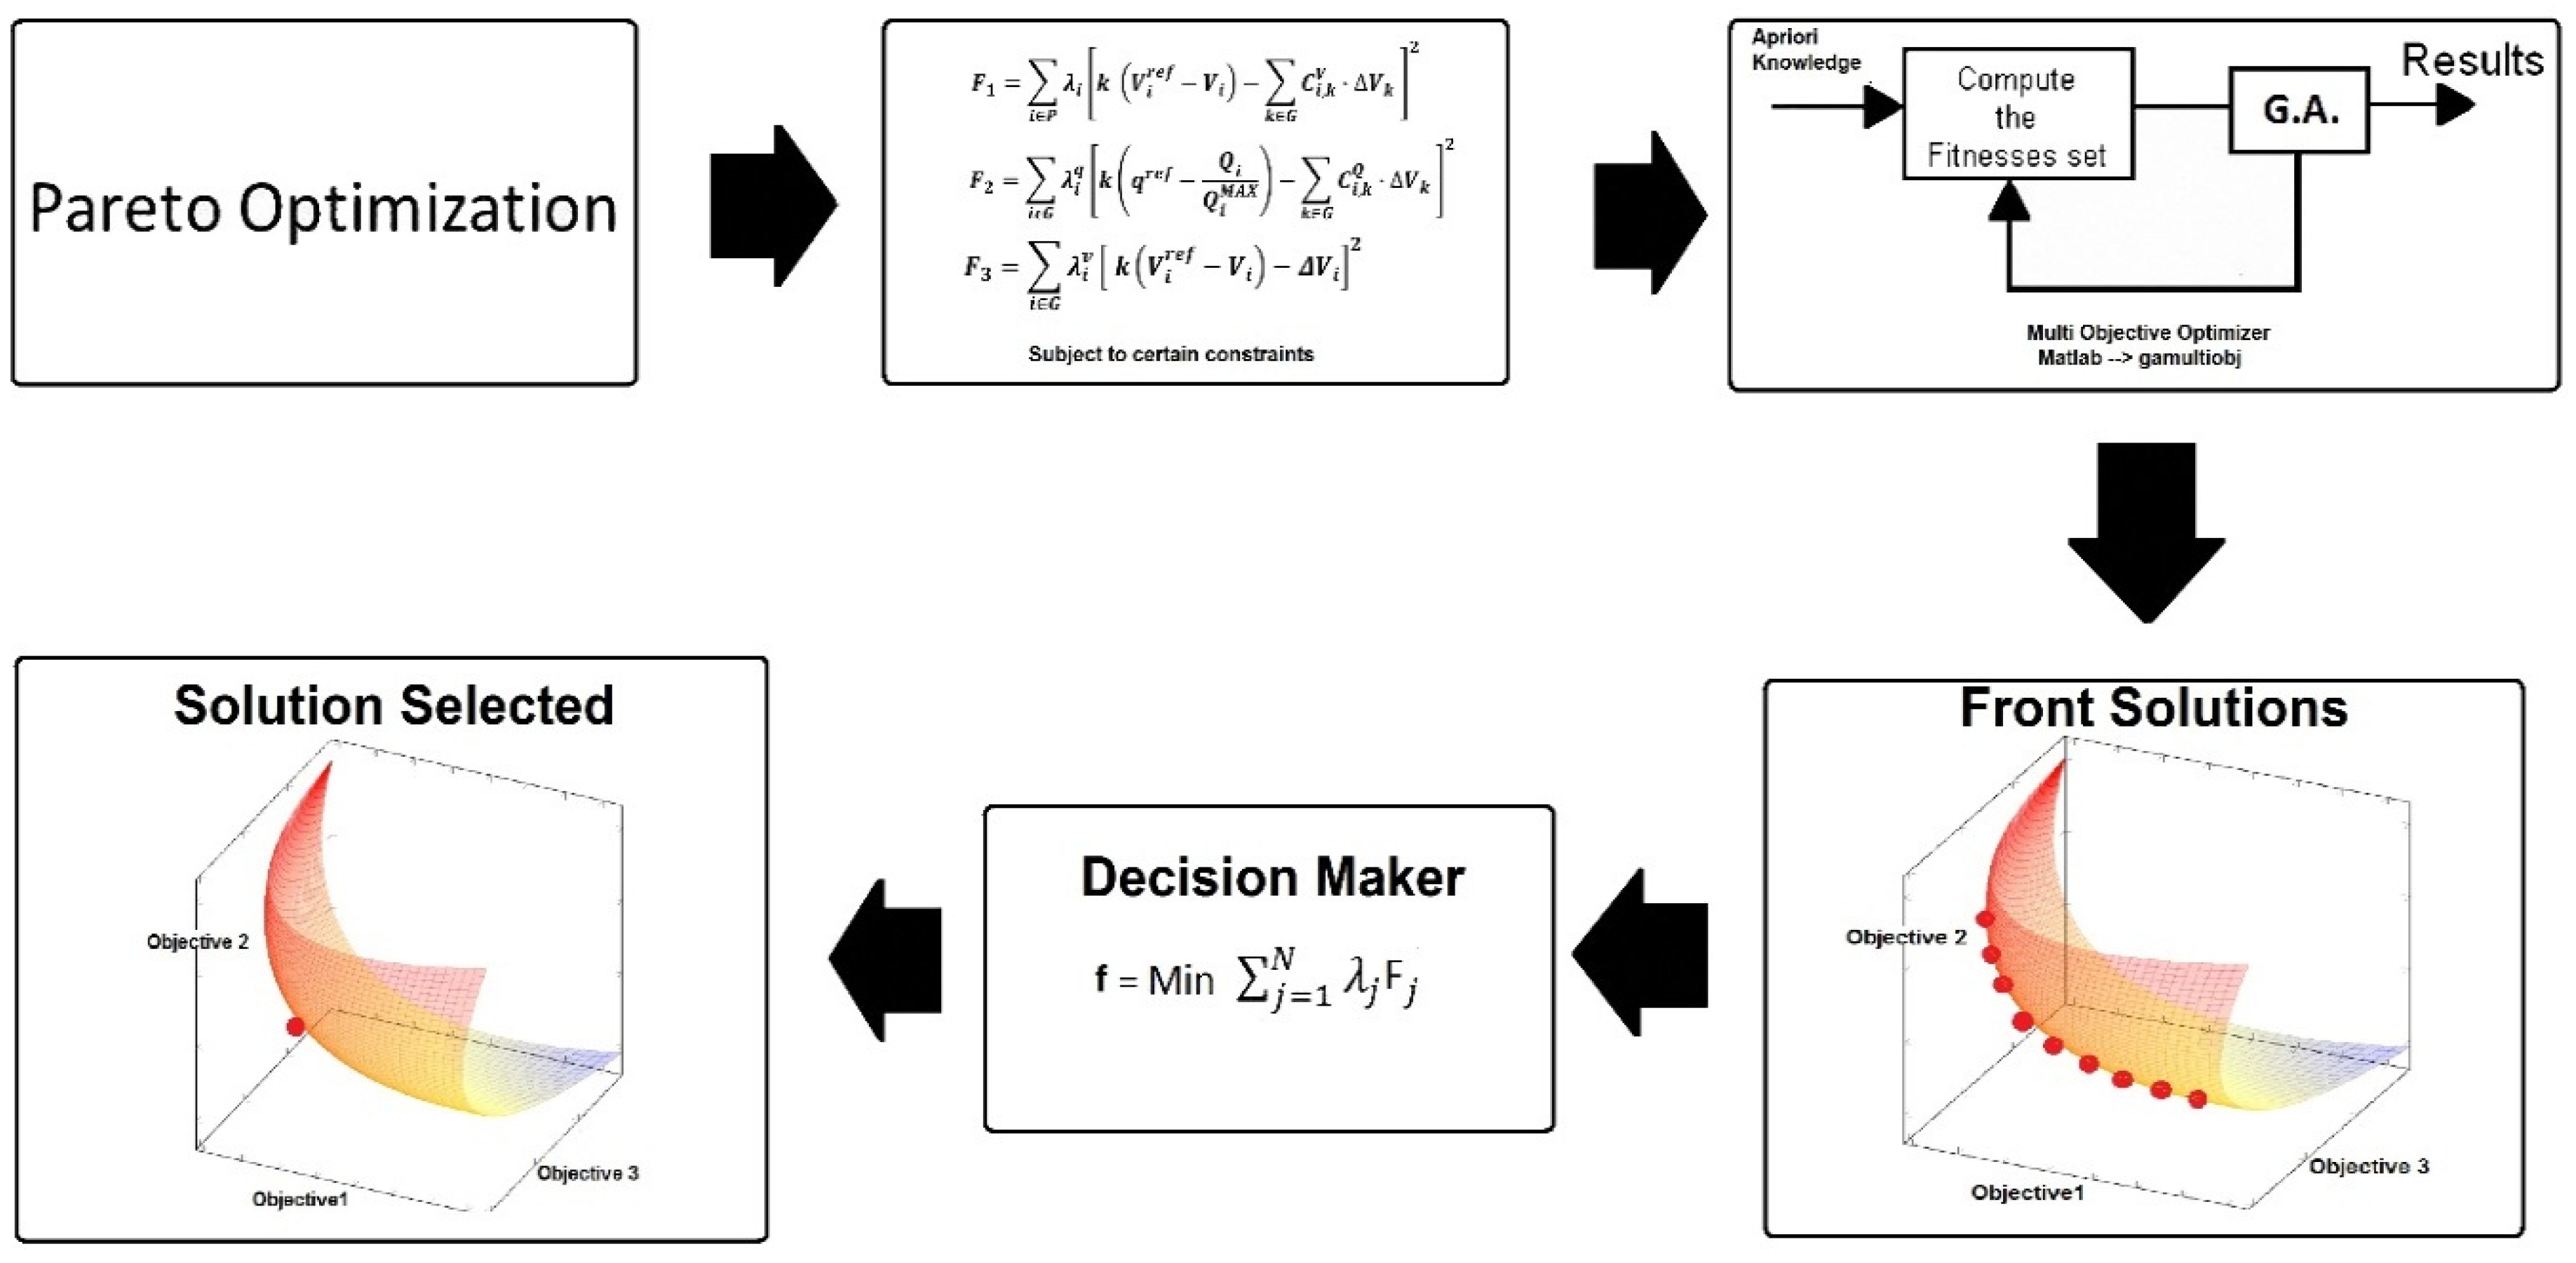
3.1. Pareto Optimization
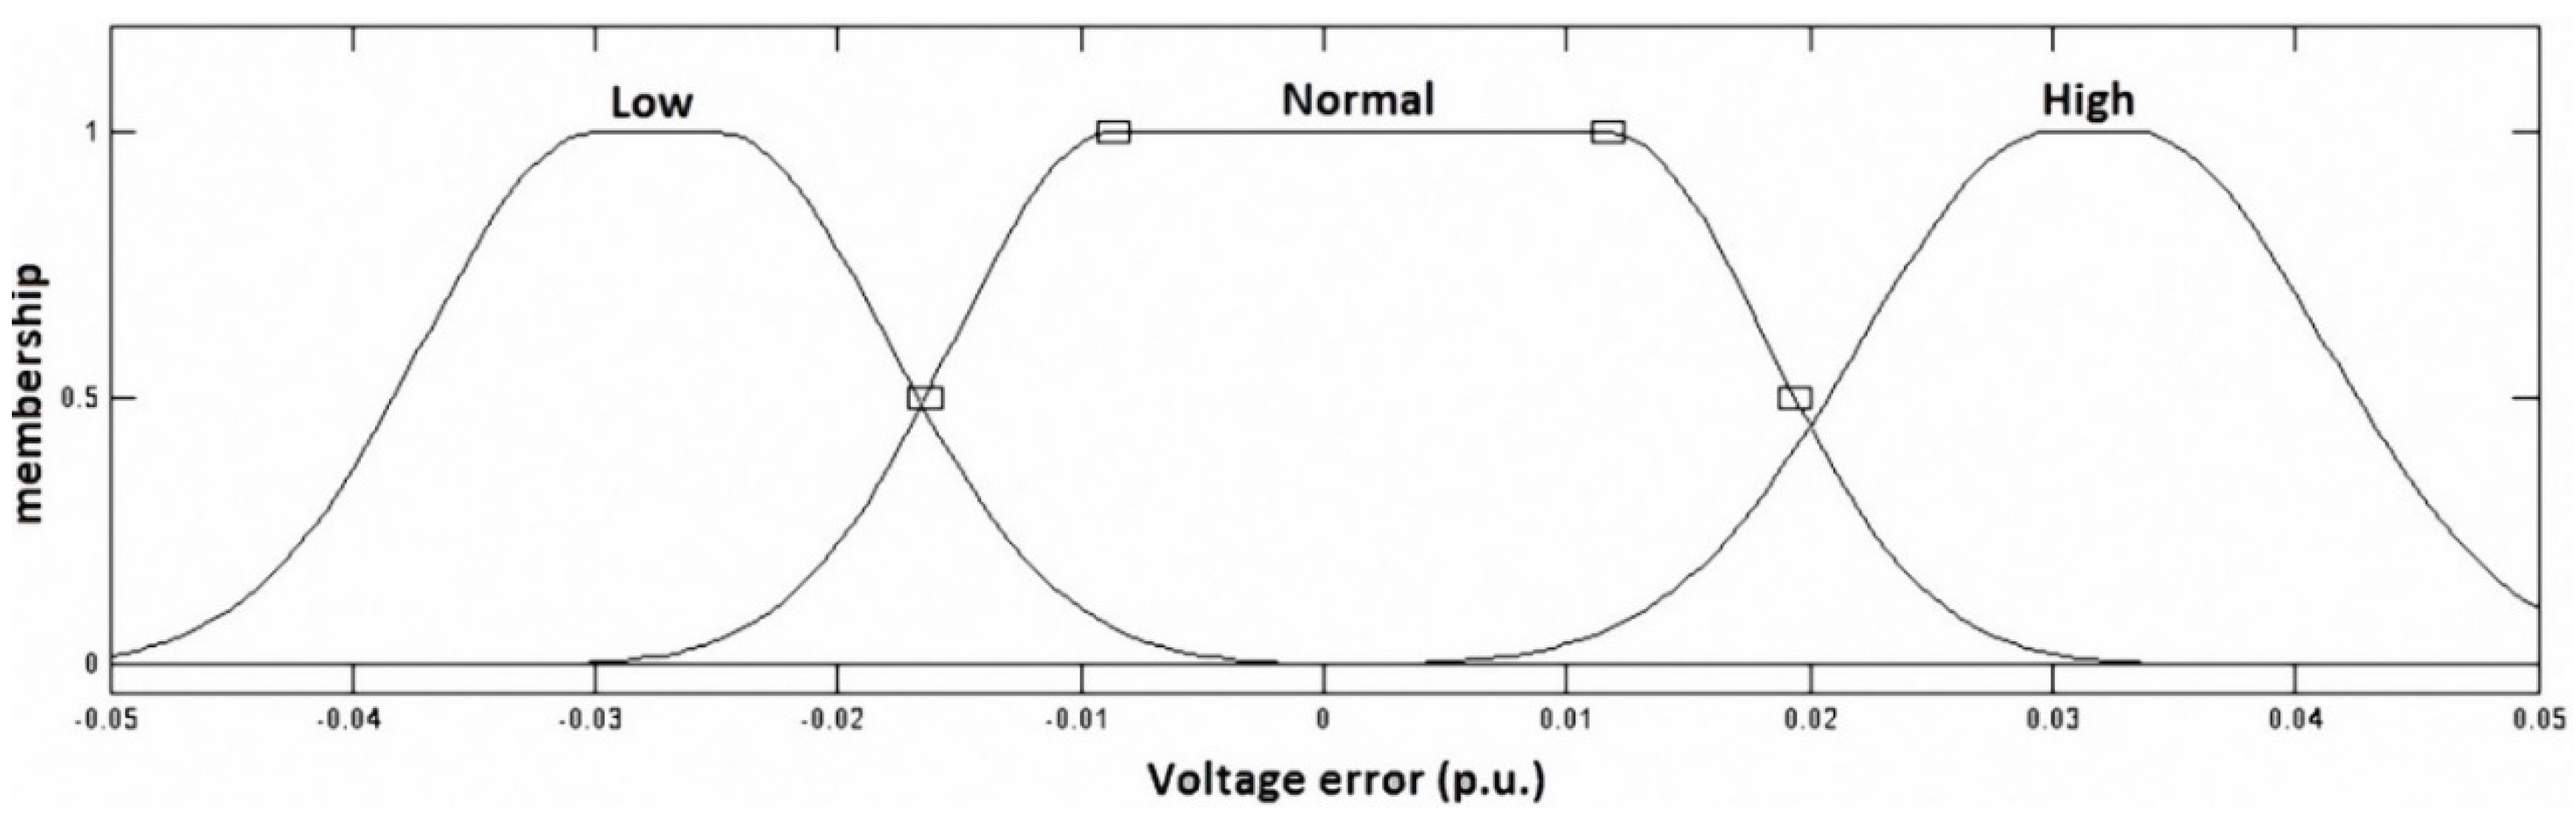
3.2. Fuzzy Logic
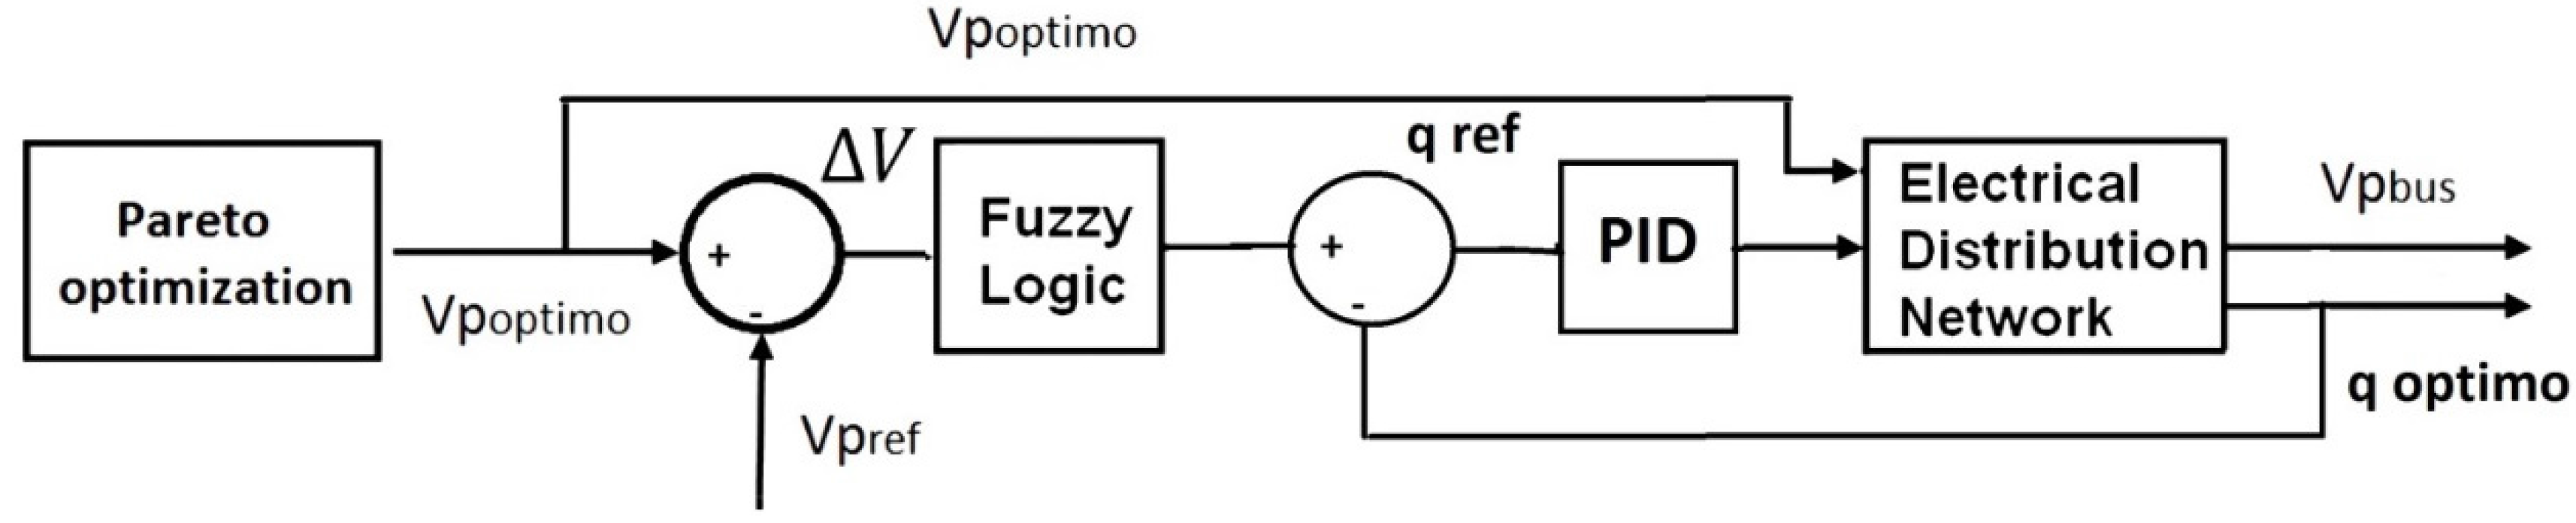
3.3. Design of Reactive Power of DG
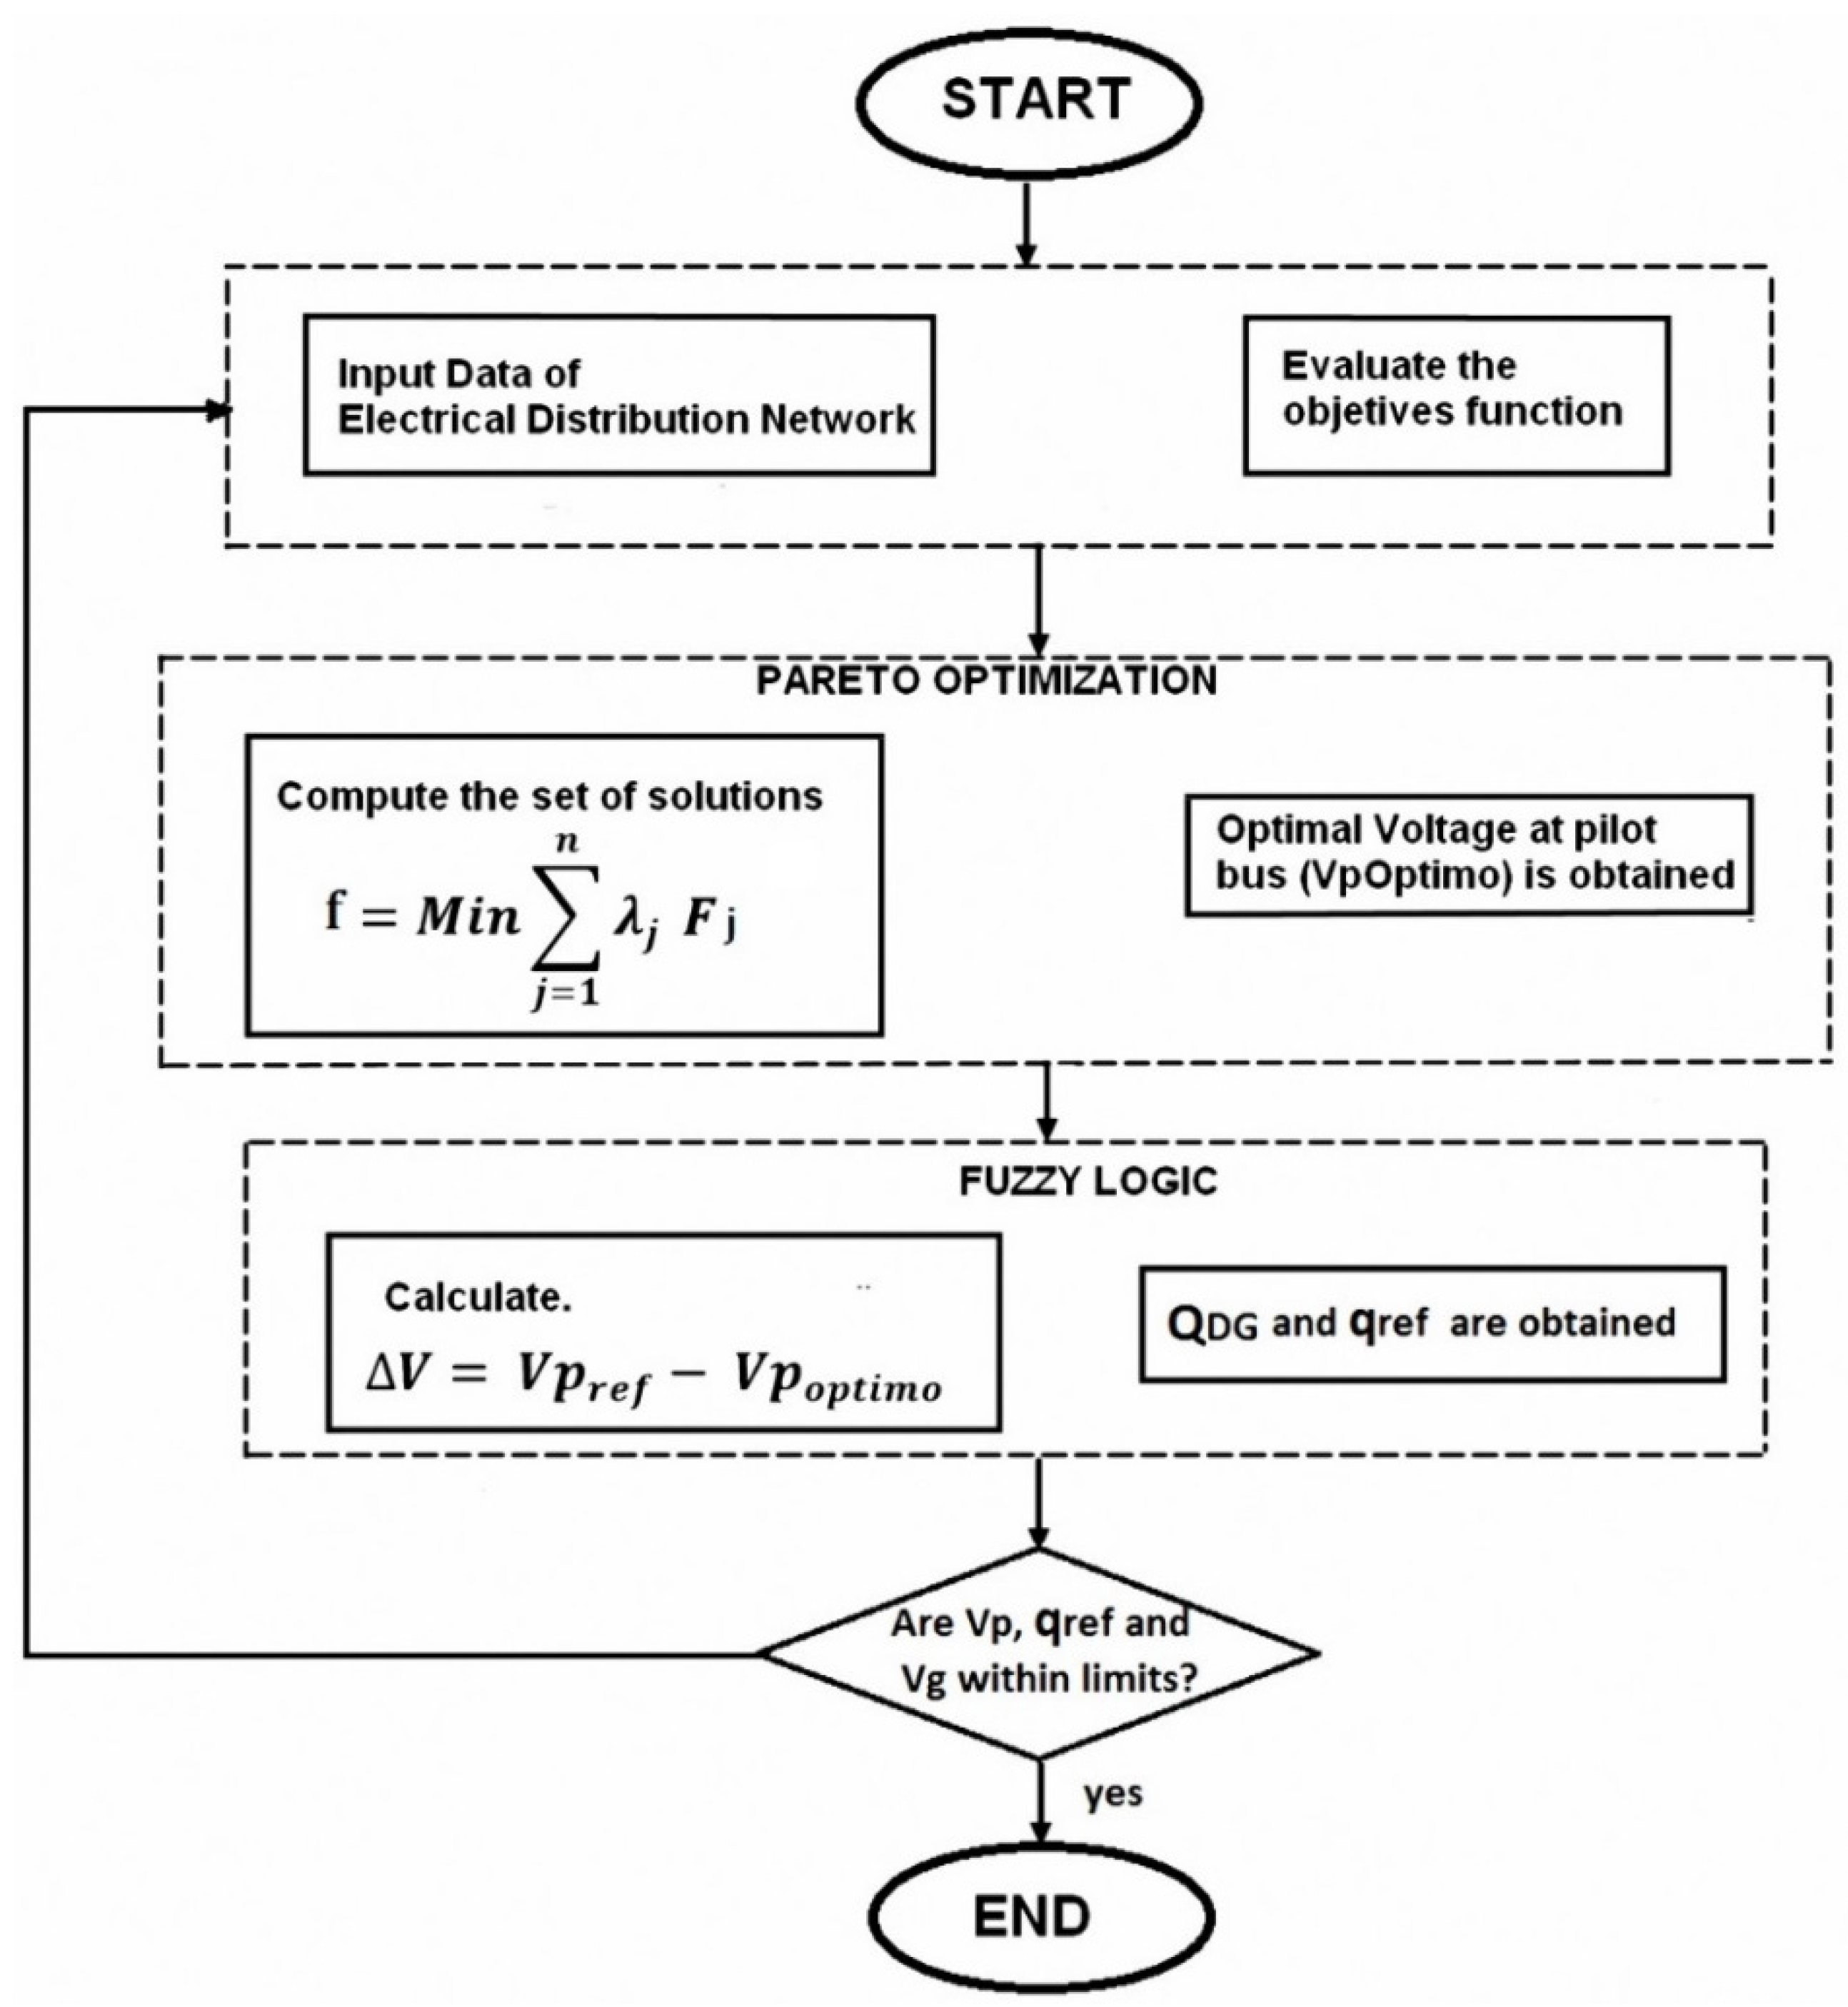
3.4. Solution Algorithm
- Step 1.
- System Data: Define input variables; the algorithm acquires the network values.
- Step 2.
- Analyze and complete the objective functions. The objective functions are calculated from Equations (1) to (3) and the constraints Equations (4) to (6). CVCPF calculates the three weights corresponding to F1, F2, and F3 and finds a set of solutions (Pareto frontier).
- Step 3.
- Decision-maker (DM) calculates the fitness solution.
- Step 4.
- Fuzzy logic
- Step 5.
- Control: According to the voltage at the pilot bus and the optimal reactive power reference, the control action is calculated on the OLTC and the PF of the DG.
- Step 6.
- With the data from step 5, CVCPF calculates new values for the distribution network using the OpenDSS program [26].
- Step 7.
- If voltage values at the pilot buses, reactive power reference, and voltage at generators are within the limits go to step 8; if not, return to step 1.
- Step 8.
- End.
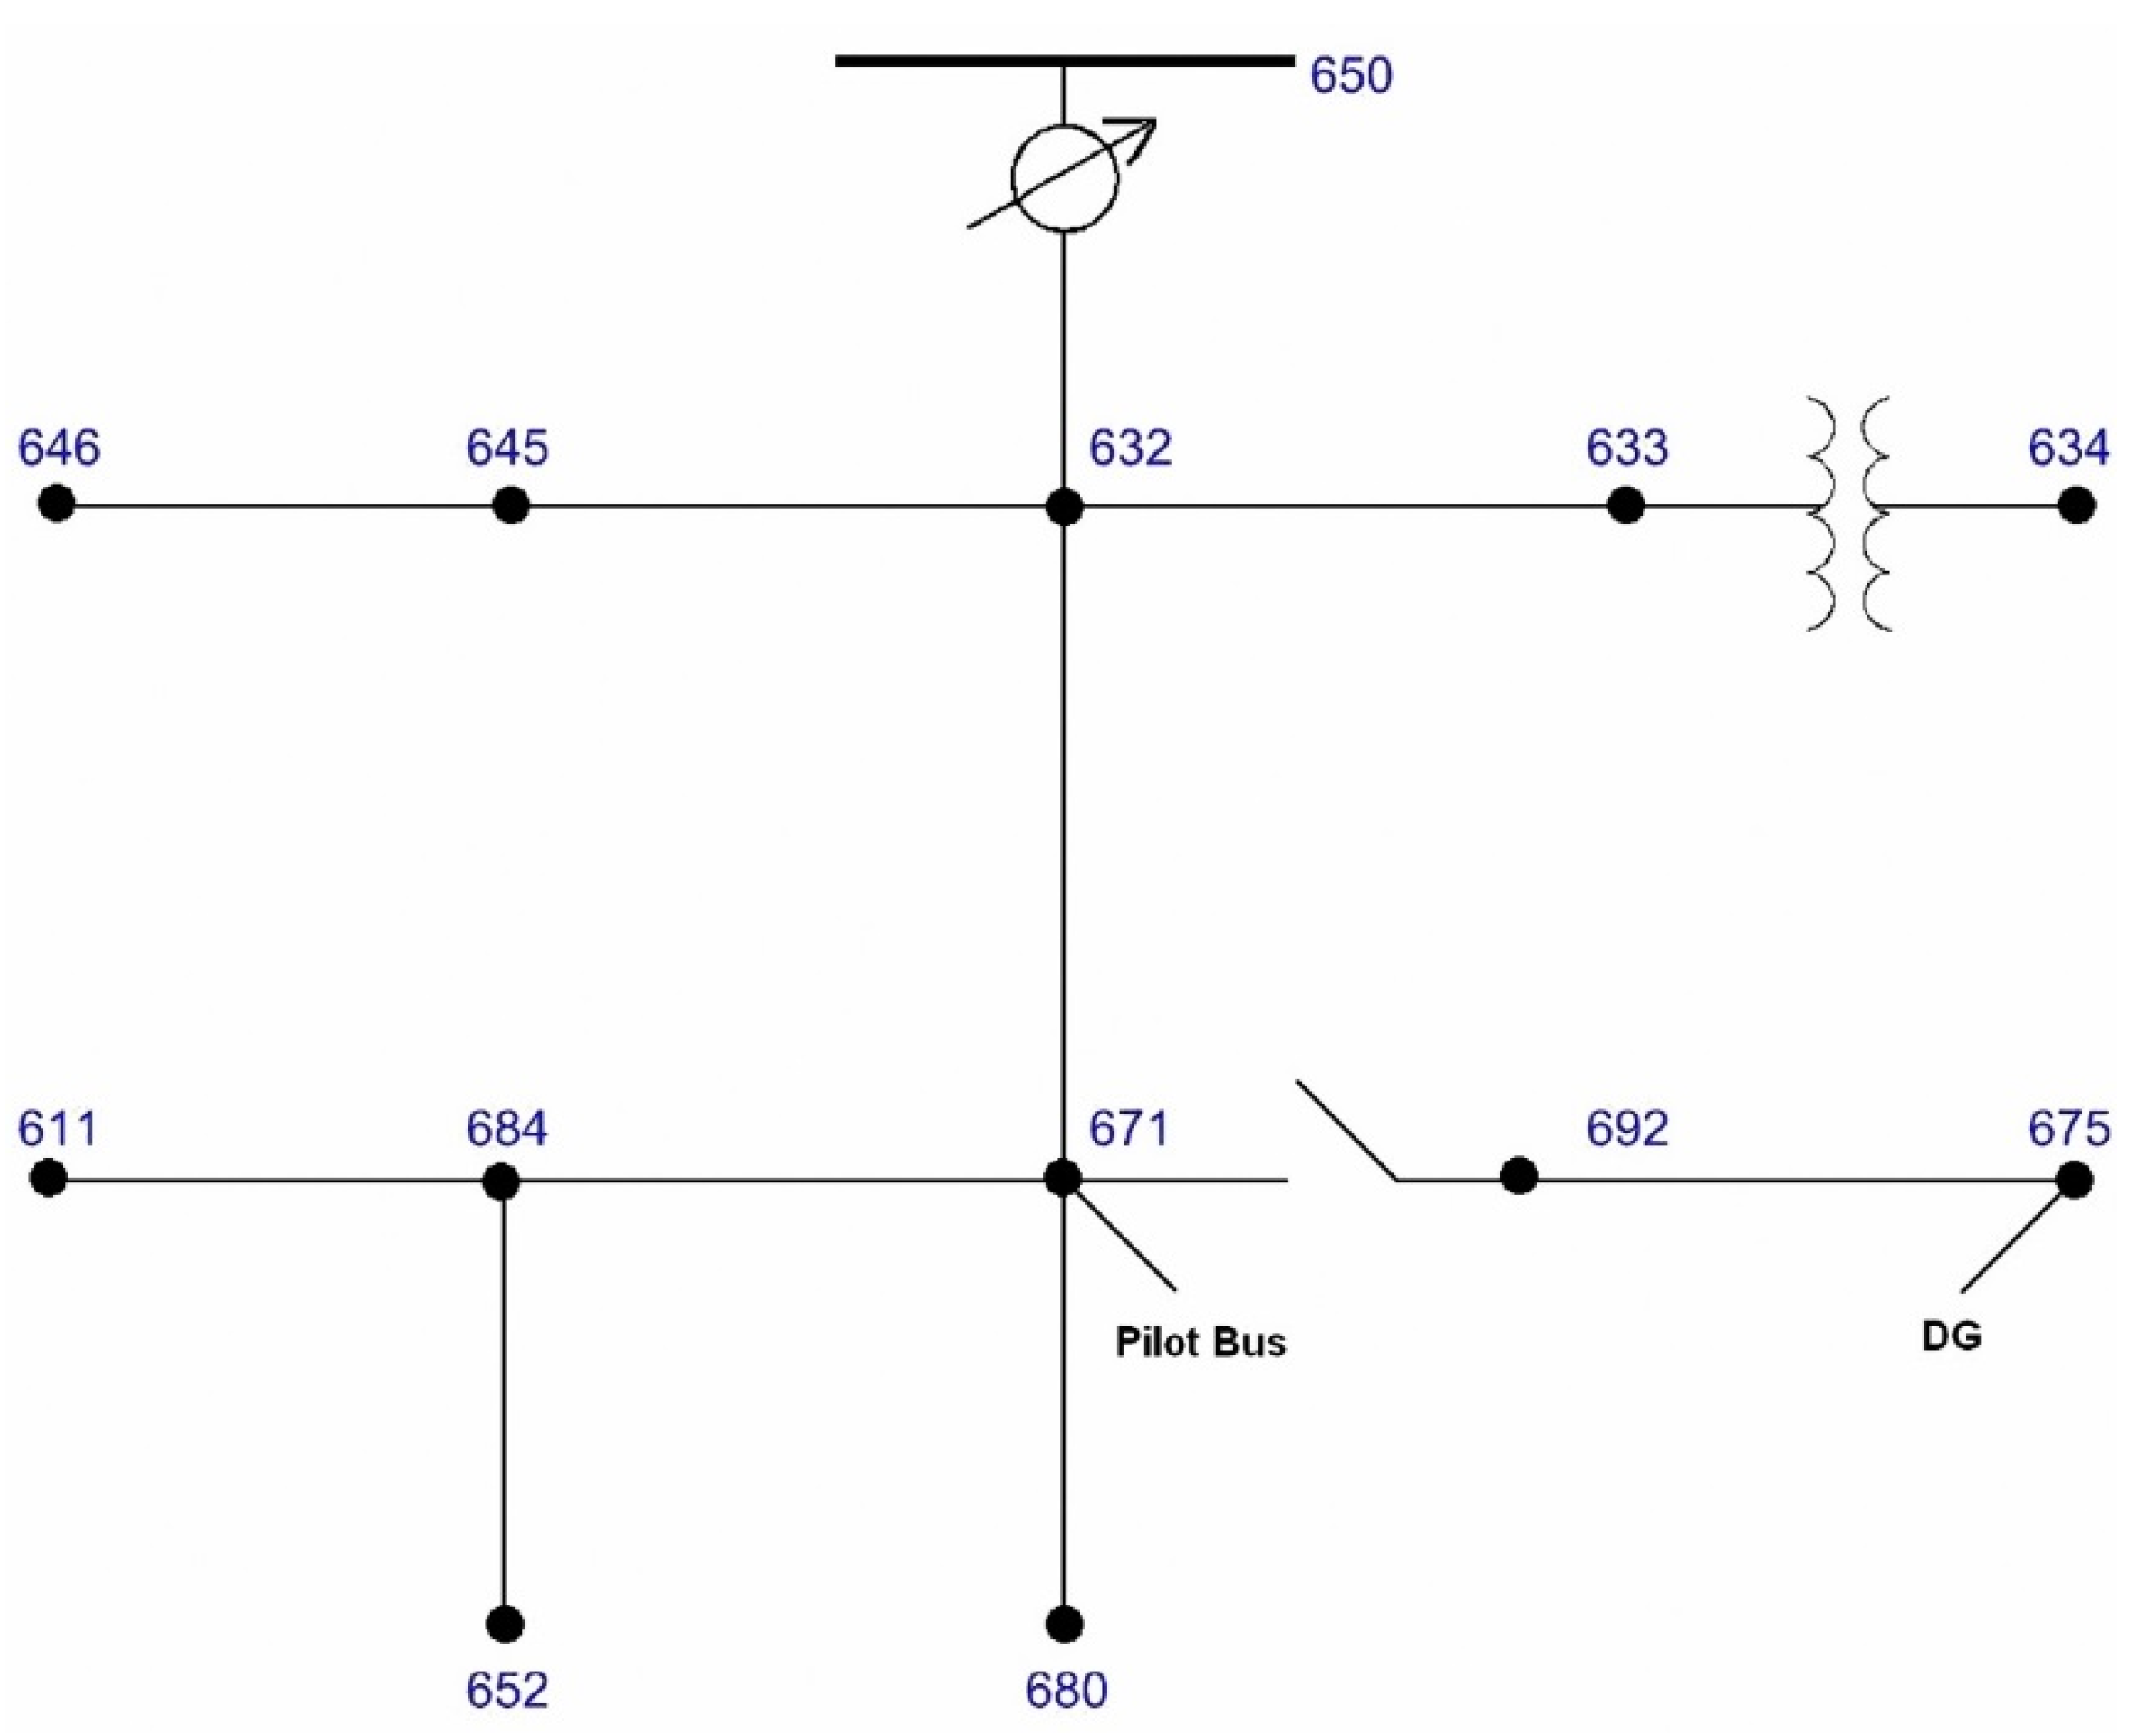
3.5. Case Study
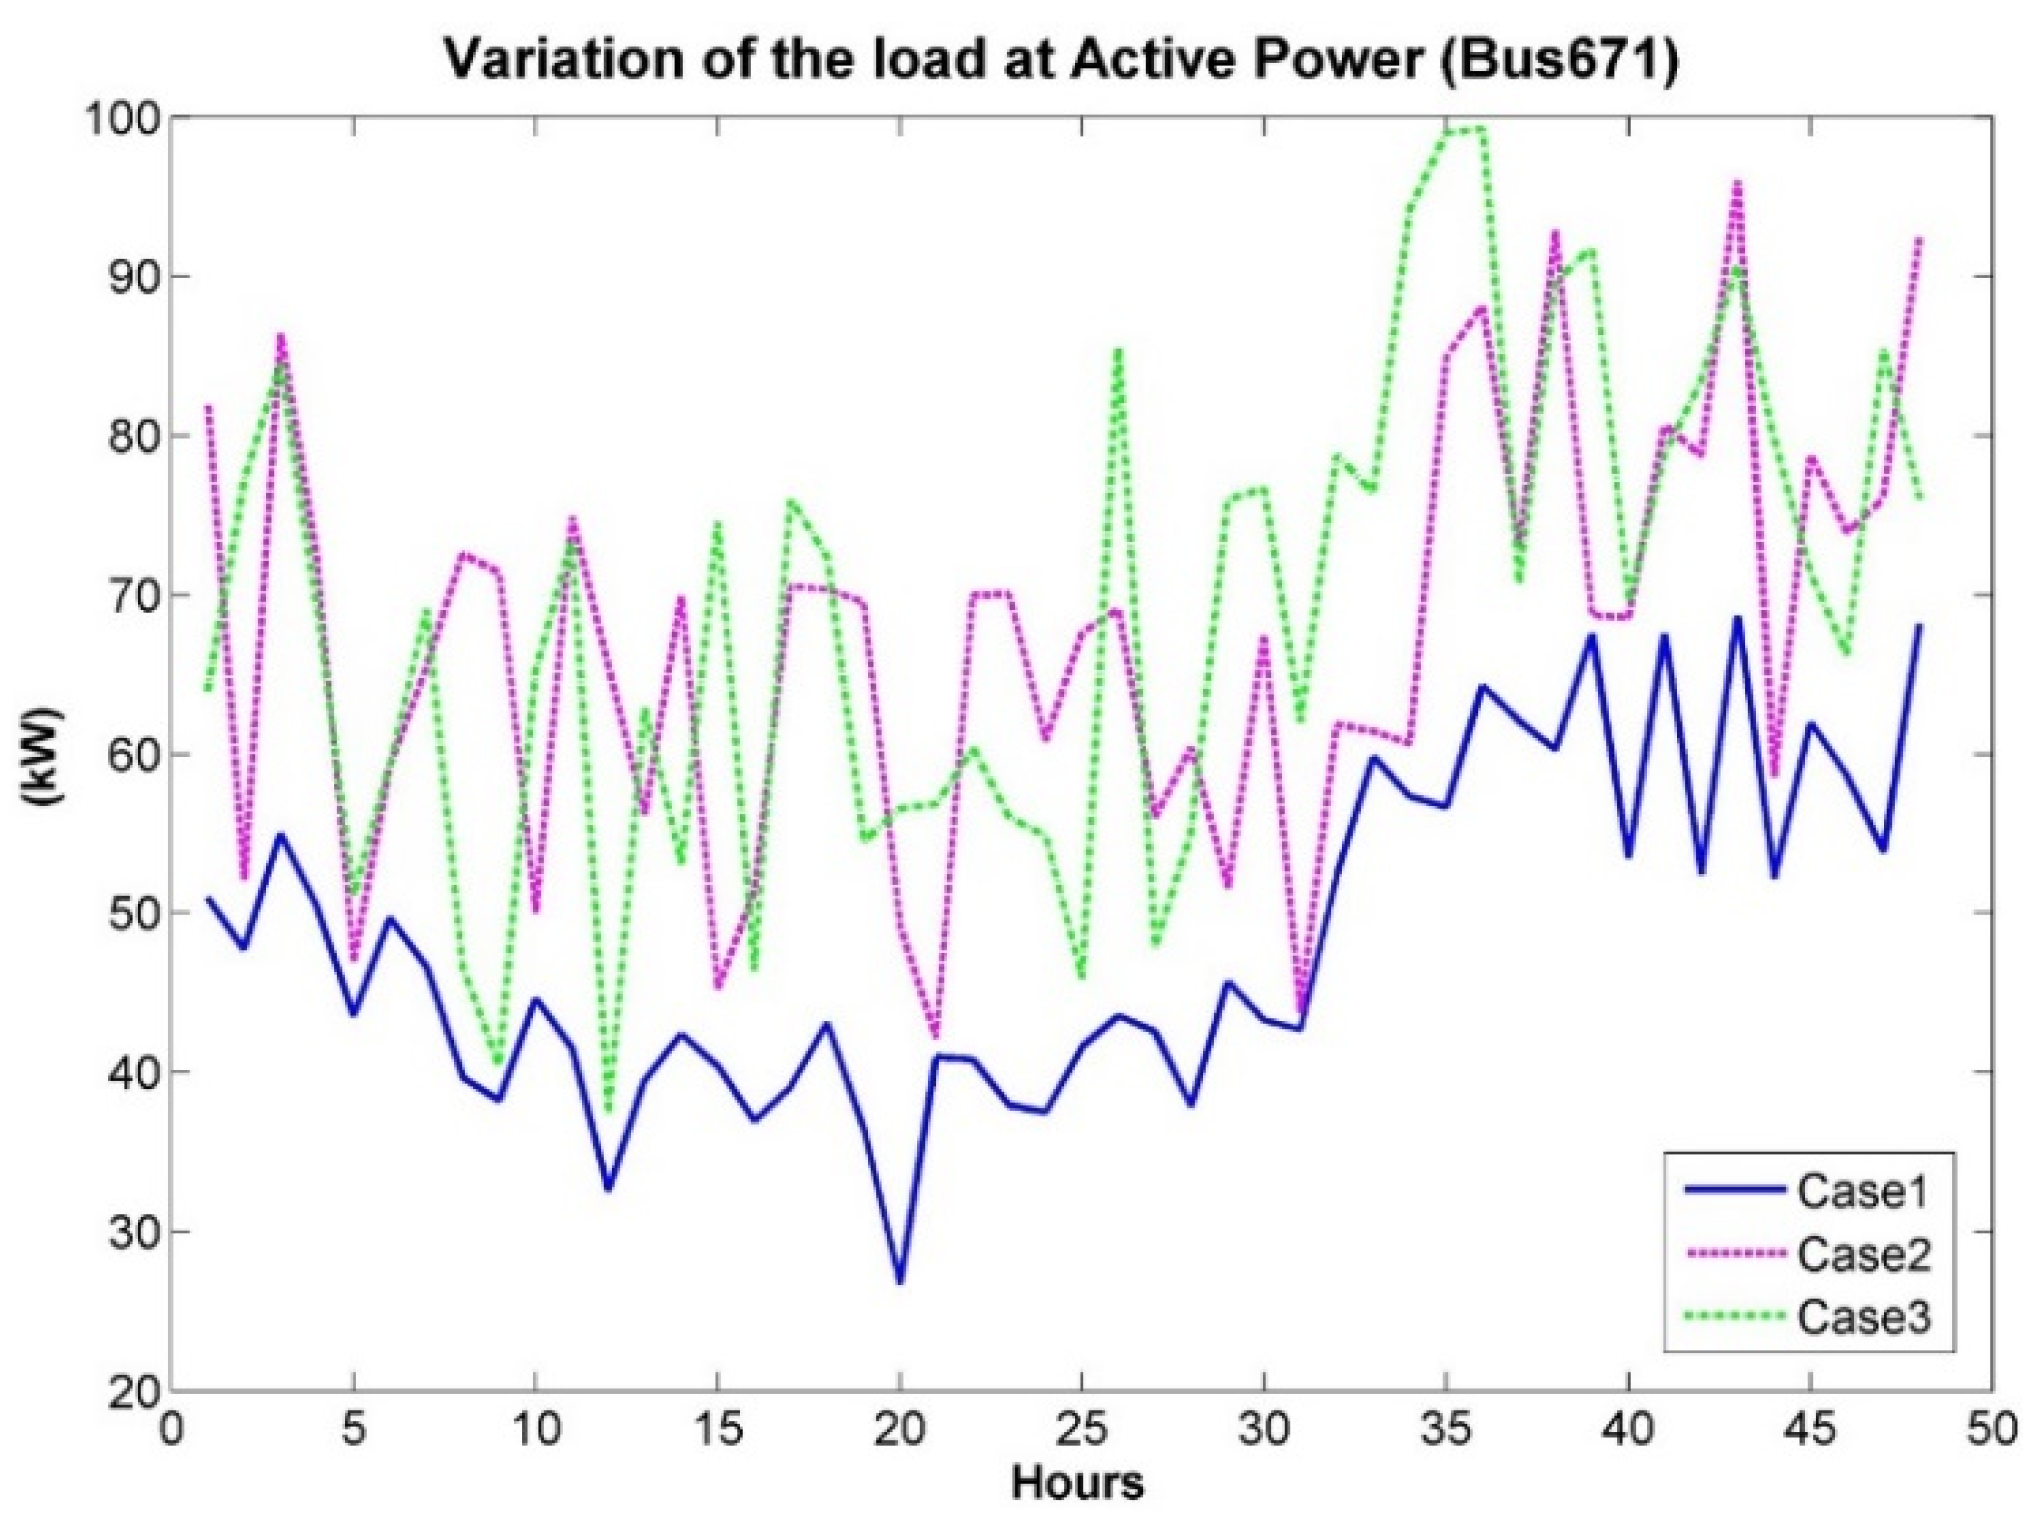
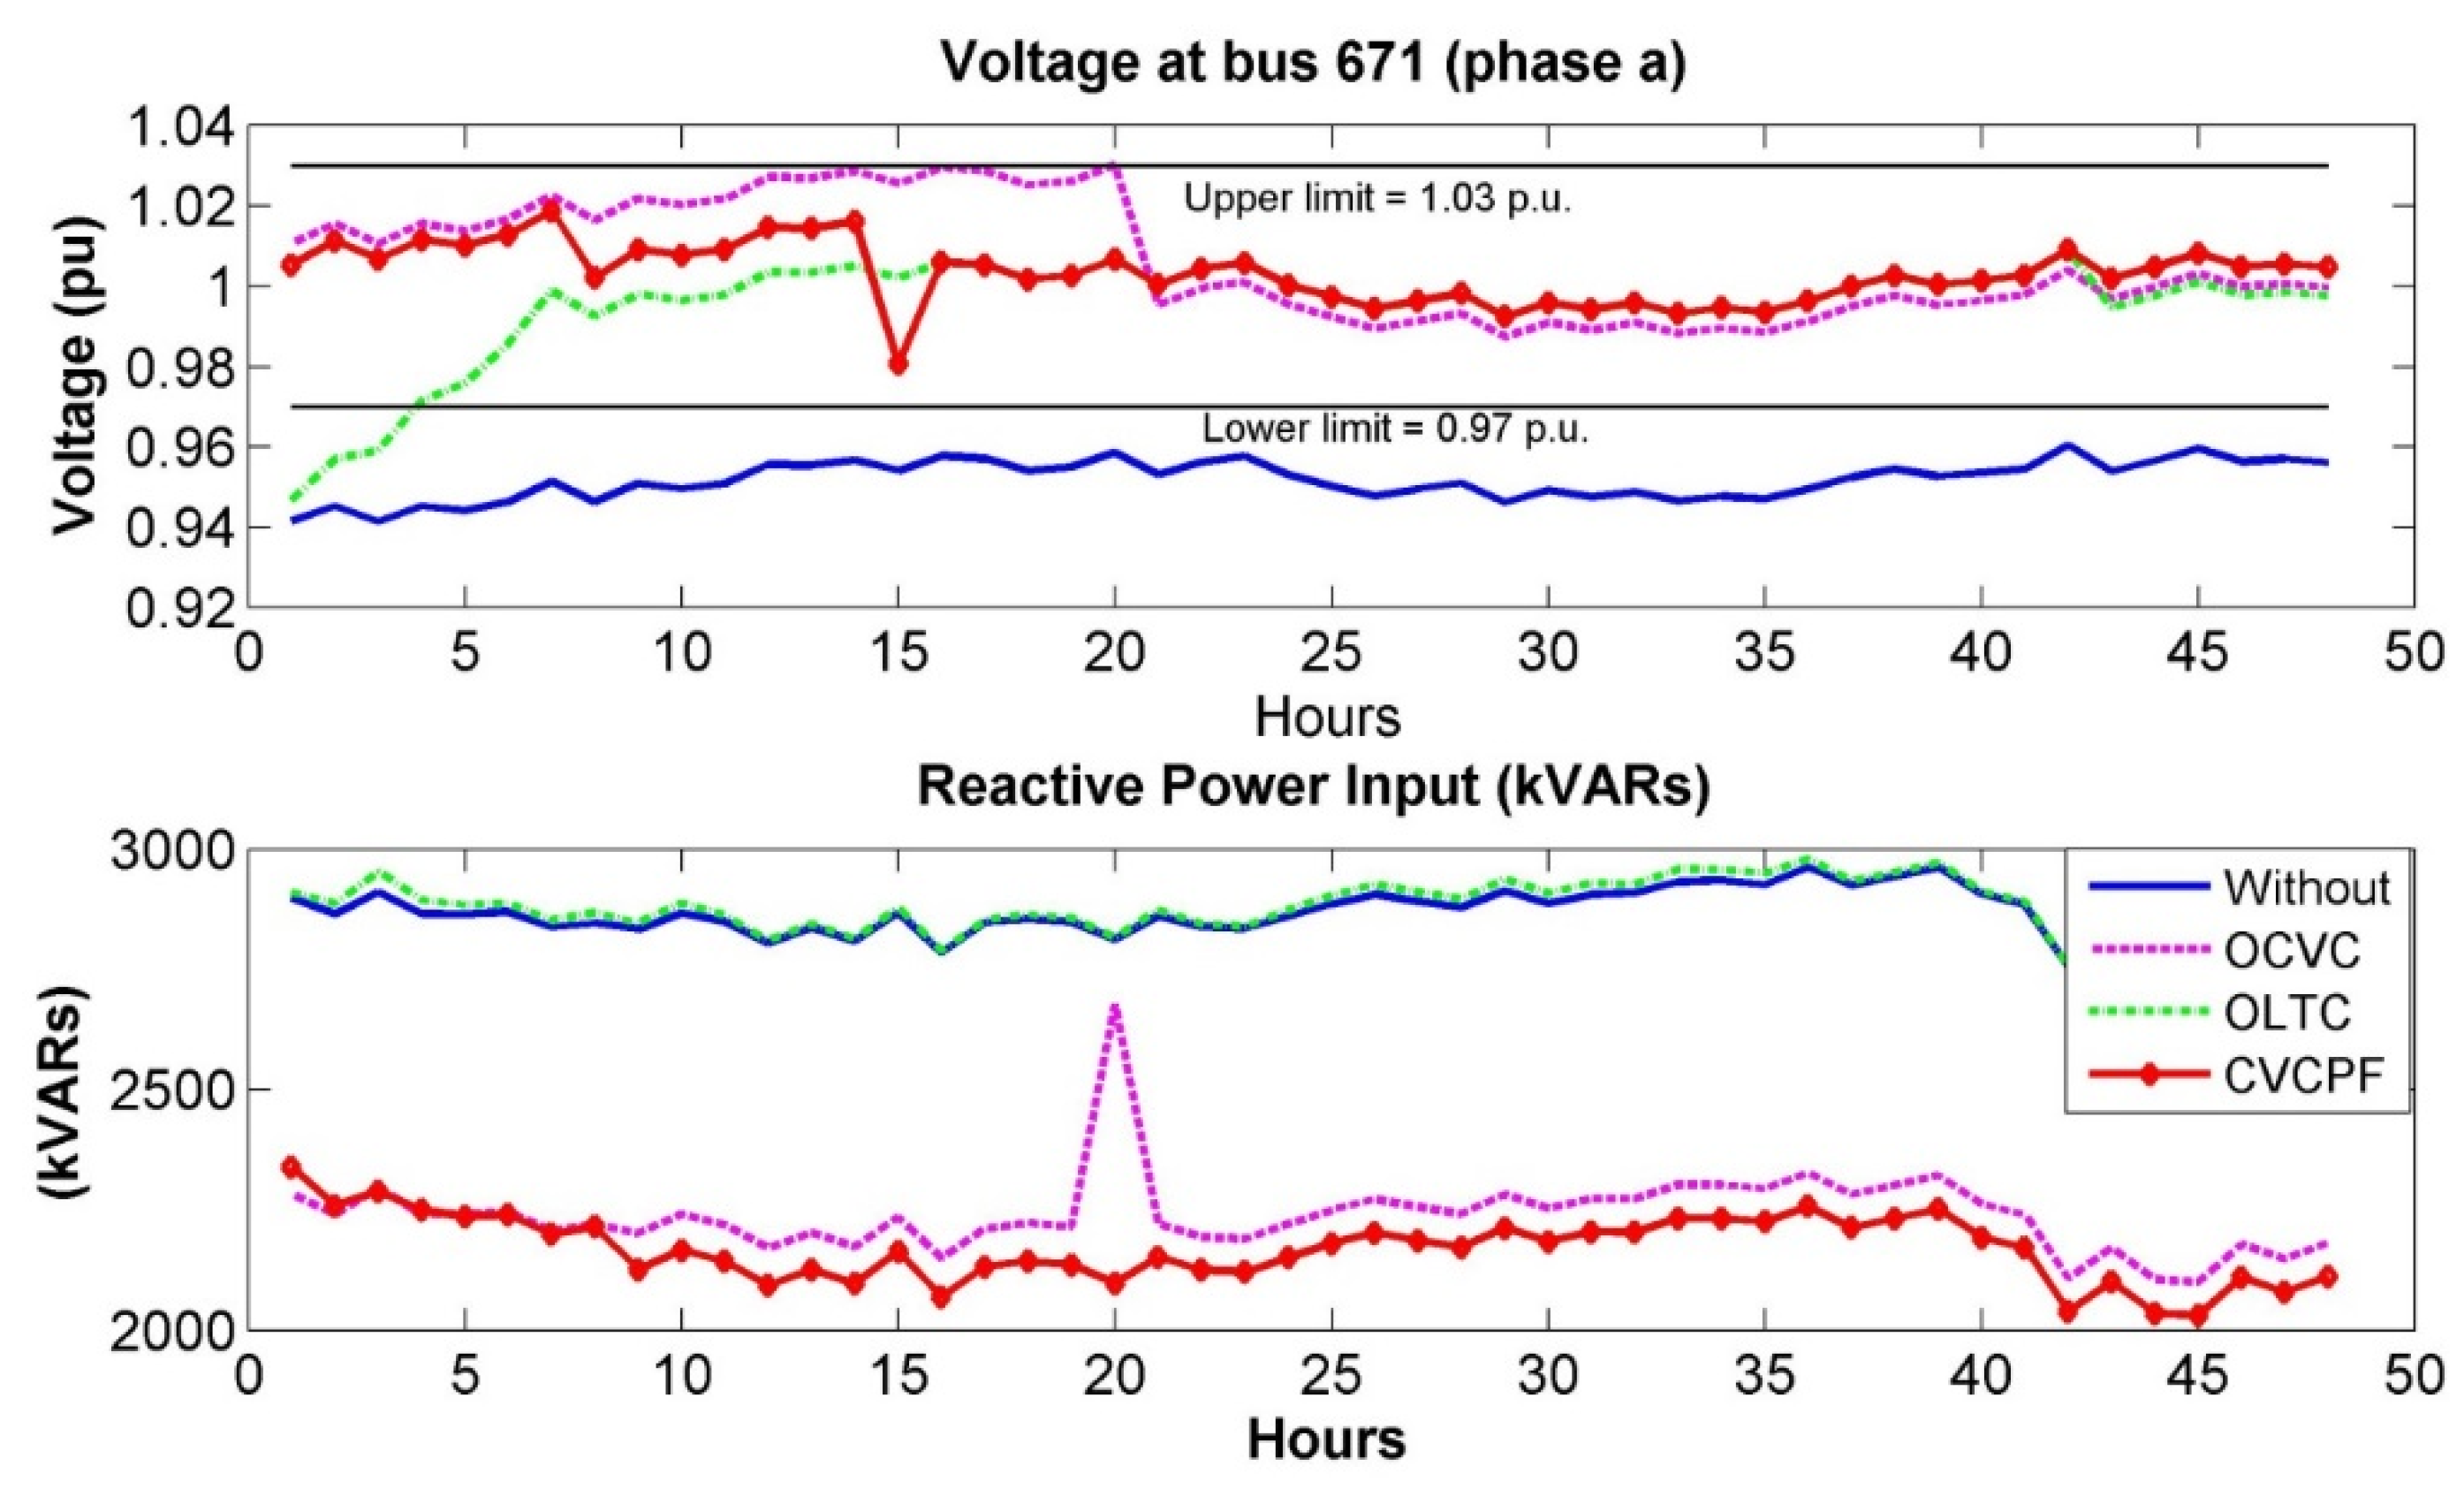
4. Simulation Results
5. Conclusions
Acknowledgments
Author Contributions
Conflicts of Interest
References
- Habibi, A.; Nayeripour, M.; Aghaei, J. Secure multi-objective distributed generation planning in distribution network. In Proceedings of the 2013 21st Iranian Conference on Electrical Engineering (ICEE), Mashhad, Iran, 14–16 May 2013; pp. 1–6.
- De Oliveira-de Jesus, P.M.; de Leao, M.T.P.; Khodr, H.M. Remuneration of distribution networks using a fuzzy multicriteria planning algorithm. In Proceedings of the 2006 International Conference on Probabilistic Methods Applied to Power Systems (PMAPS 2006), Stockholm, Sweden, 11–15 June 2006; pp. 1–7.
- Ahmidi, A.; Guillaud, X.; Besanger, Y.; Blanc, R. A multilevel approach for optimal participating of wind farms at reactive power balancing in transmission power system. IEEE Syst. J. 2012, 6, 260–269. [Google Scholar] [CrossRef]
- Anwar, A.; Pota, H.R. Loss reduction of power distribution network using optimum size and location of distributed generation. In Proceedings of the 2011 21st Australasian Universities Power Engineering Conference (AUPEC), Brisbane, Australia, 25–28 September 2011; pp. 1–6.
- Queiroz, L.M.O.; Lyra, C. Adaptive hybrid genetic algorithm for technical loss reduction in distribution networks under variable demands. IEEE Trans. Power Syst. 2009, 24, 445–453. [Google Scholar] [CrossRef]
- Zidan, A.; El-Saadany, E.F. Network reconfiguration in balanced distribution systems with variable load demand and variable renewable resources generation. In Proceedings of the 2012 IEEE Power and Energy Society General Meeting, San Diego, CA, USA, 22–26 July 2012; pp. 1–8.
- Lopez, E.; Opazo, H.; Garcia, L.; Bastard, P. Online reconfiguration considering variability demand: Applications to real networks. IEEE Trans. Power Syst. 2004, 19, 549–553. [Google Scholar] [CrossRef]
- Dehghani-Arani, A.; Maddahi, R. Introduction a multi-objective function in unbalanced and unsymmetrical distribution networks for optimal placement and sizing of distributed generation units using NSGA-II. In Proceedings of the 2013 18th Conference on Electrical Power Distribution Networks (EPDC), Kermanshah, Iran, 30 April–1 May 2013; pp. 1–9.
- Hong, Y.Y.; Lai, Y.M.; Chang, Y.R.; Lee, Y.D.; Liu, P.W. Optimizing capacities of distributed generation and energy storage in a small autonomous power system considering uncertainty in renewables. Energies 2015, 8, 2473–2492. [Google Scholar] [CrossRef]
- Richardot, O.; Viciu, A.; Besanger, Y.; HadjSaid, N.; Kieny, C. Coordinated voltage control in distribution networks using distributed generation. In Proceedings of the 2005/2006 IEEE PES Transmission and Distribution Conference and Exhibition, Dallas, TX, USA, 21–24 May 2006; pp. 1196–1201.
- Knowles, J.; Corne, D. The pareto archived evolution strategy: A new baseline algorithm for pareto multiobjective optimisation. In Proceedings of the 1999 Congress on Evolutionary Computation, Washington, DC, USA, 6–9 July 1999; Volume 101, p. 105.
- Soroudi, A.; Caire, R.; Hadjsaid, N.; Ehsan, M. Probabilistic dynamic multi-objective model for renewable and non-renewable distributed generation planning. IET Gener. Transm. Distrib. 2011, 5, 1173–1182. [Google Scholar] [CrossRef]
- Ngatchou, P.; Anahita, Z.; El-Sharkawi, M.A. Pareto multi objective optimization. In Proceedings of the 13th International Conference on Intelligent Systems Application to Power Systems, Arlington, VA, USA, 6–10 November 2005; pp. 84–91.
- Lin, X.; Yao, J.; Mao, T.; Gong, L. Inductive reactive power compensation optimization for 10 kV distribution network with distributed generations. In Proceedings of the 2013 Chinese Automation Congress (CAC), Changsha, China, 7–8 November 2013; pp. 87–91.
- Deb, K.; Pratap, A.; Agarwal, S.; Meyarivan, T. A fast and elitist multiobjective genetic algorithm: NSGA-II. IEEE Trans. Evol. Comput. 2002, 6, 182–197. [Google Scholar] [CrossRef]
- Barin, A.; Canha, L.N.; Machado, R.Q.; da Rosa Abaide, A.; Maziero, E.; Arend, G. Analysis of the impacts of distributed generation sources considering the appropriate choice of parameters in a multi-objective approach for distribution system planning. In Proceedings of the 5th International Conference on European Electricity Market, Lisboa, Portugal, 28–30 May 2008; pp. 1–6.
- Loetamonphong, J.; Fang, S.C.; Young, R.E. Multi-objective optimization problems with fuzzy relation equation constraints. Fuzzy Sets Syst. 2002, 127, 141–164. [Google Scholar] [CrossRef]
- Gao, Y.; Liu, J.; Yang, J.; Liang, H.; Zhang, J. Multi-objective planning of multi-type distributed generation considering timing characteristics and environmental benefits. Energies 2014, 7, 6242–6257. [Google Scholar] [CrossRef]
- Gaonkar, J.D.N.; Pillai, G.N. Fuzzy logic based coordinated voltage regulation method for distribution system with multiple synchronous generators. In Proceedings of the 2010 IEEE PES Transmission and Distribution Conference and Exposition, New Orleans, LA, USA, 19–22 April 2010; pp. 1–5.
- Ghatee, M.; Hashemi, S.M. Application of fuzzy minimum cost flow problems to network design under uncertainty. Fuzzy Sets Syst. 2009, 160, 3263–3289. [Google Scholar] [CrossRef]
- Kiprakis, A.E.; Wallace, A.R. Maximising energy capture from distributed generators in weak networks. IEE Proc. Gener. Transm. Distrib. 2004, 151, 611–618. [Google Scholar] [CrossRef]
- Maciel, R.S.; Padilha-Feltrin, A. Distributed generation impact evaluation using a multi-objective tabu search. In Proceedings of the 15th International Conference on Intelligent System Applications to Power Systems, Curitiba, Brazil, 8–12 November 2009; pp. 1–5.
- Viawan, F.A.; Karlsson, D. Coordinated voltage and reactive power control in the presence of distributed generation. In Proceedings of the 2008 IEEE Power and Energy Society General Meeting—Conversion and Delivery of Electrical Energy in the 21st Century, Pittsburgh, PA, USA, 20–24 July 2008; pp. 1–6.
- Masters, C.L. Voltage rise: The big issue when connecting embedded generation to long 11 kv overhead lines. Power Eng. J. 2002, 16, 5–12. [Google Scholar] [CrossRef]
- Takagi, T.; Sugeno, M. Fuzzy identification of systems and its applications to modeling and control. IEEE Trans. Syst. Man Cybern. 1985, SMC-15, 116–132. [Google Scholar] [CrossRef]
- Opendss Manual and Reference Guide. Available online: http://sourceforge.net/projects/electricdss (accessed on 18 May 2015).
- Kersting, W.H. Radial distribution test feeders. In Proceedings of the 2001 IEEE Power Engineering Society Winter Meeting, Columbus, OH, USA, 28 January–1 February 2001; Volume 902, pp. 908–912.
- Khushalani, S.; Schulz, N. Unbalanced distribution power flow with distributed generation. In Proceedings of the 2005/2006 IEEE PES Transmission and Distribution Conference and Exhibition, Dallas, TX, USA, 21–24 May 2006; pp. 301–306.


| Node | Load | Ph-1 | Ph-1 | Ph-2 | Ph-2 | Ph-3 | Ph-3 |
|---|---|---|---|---|---|---|---|
| Model | kW | kVAr | kW | kVAr | kW | kVAr | |
| 634 | Y-PQ | 160 | 110 | 120 | 90 | 120 | 90 |
| 645 | Y-PQ | 0 | 0 | 170 | 125 | 0 | 0 |
| 646 | D-Z | 0 | 0 | 230 | 132 | 0 | 0 |
| 652 | Y-Z | 128 | 86 | 0 | 0 | 0 | 0 |
| 671 | D-PQ | 385 | 220 | 385 | 220 | 385 | 220 |
| 675 | Y-PQ | 485 | 190 | 68 | 60 | 290 | 212 |
| 692 | D-I | 0 | 0 | 0 | 0 | 170 | 151 |
| 611 | Y-I | 0 | 0 | 0 | 0 | 170 | 80 |
| TOTAL | 1158 | 606 | 973 | 627 | 1135 | 753 |
| Node | R (Mile) | X (Mile) | Distance | Config. | X/R Ratio |
|---|---|---|---|---|---|
| 650–632 | 0.3465 | 1.0179 | 0.378 | 601 | 2.9376 |
| 632–633 | 0.7526 | 1.1814 | 0.094 | 602 | 1.5697 |
| 632–645 | 1.3294 | 1.3471 | 0.094 | 603 | 1.0133 |
| 632–671 | 0.3465 | 1.0179 | 0.378 | 601 | 2.9376 |
| 645–646 | 1.3294 | 1.3471 | 0.056 | 603 | 1.0133 |
| 671–684 | 1.3238 | 1.3569 | 0.056 | 604 | 1.0250 |
| 671–680 | 0.3465 | 1.0179 | 0.189 | 601 | 2.9376 |
| 692–675 | 0.7982 | 0.4463 | 0.094 | 606 | 0.5591 |
| 684–611 | 1.3292 | 1.3475 | 0.056 | 605 | 1.0137 |
| 684–652 | 1.3425 | 0.5124 | 0.151 | 607 | 0.3816 |
| 671–692 | Switch | ||||
| 633–634 | 1.10% | 2% | XFM-1 |
| Case 1 (kW) | Case 2 (kW) | Case 3 (kW) | ||||||
|---|---|---|---|---|---|---|---|---|
| Hour | Bus 671 | Variation | Hour | Bus 671 | Variation | Hour | Bus 671 | Variation |
| 43 | 68.69 | 16.27 | 3 | 86.38 | 34.28 | 26 | 85.59 | 39.66 |
| 44 | 52.20 | 16.49 | 44 | 58.62 | 37.38 | 27 | 47.86 | 37.73 |
| Case 2 | ||||
|---|---|---|---|---|
| Hour | Variation (V p.u.) | |||
| CVCPF | OCVC | OLTC | ||
| Maximum load variation | 3 | 0.065 | 0.081 | 0.033 |
| 44 | 0.016 | 0.026 | 0.033 | |
| Line crosses | 3 | 0.065 | 0.081 | 0.033 |
| 22 | 0.026 | 0.053 | 0.033 | |
| 39 | 0.021 | 0.032 | 0.038 | |
| 44 | 0.016 | 0.026 | 0.033 | |
| OCVC variation is higher than 0.025 V | 3 | 0.065 | 0.081 | 0.033 |
| 4 | 0.023 | 0.039 | 0.024 | |
| 10 | 0.028 | 0.029 | 0.036 | |
| 11 | 0.028 | 0.029 | 0.036 | |
| 22 | 0.026 | 0.053 | 0.033 | |
| 35 | 0.028 | 0.029 | 0.029 | |
| 39 | 0.021 | 0.032 | 0.038 | |
| 44 | 0.016 | 0.026 | 0.033 | |
© 2016 by the authors; licensee MDPI, Basel, Switzerland. This article is an open access article distributed under the terms and conditions of the Creative Commons by Attribution (CC-BY) license (http://creativecommons.org/licenses/by/4.0/).
Share and Cite
Castro, J.R.; Saad, M.; Lefebvre, S.; Asber, D.; Lenoir, L. Coordinated Voltage Control in Distribution Network with the Presence of DGs and Variable Loads Using Pareto and Fuzzy Logic. Energies 2016, 9, 107. https://doi.org/10.3390/en9020107
Castro JR, Saad M, Lefebvre S, Asber D, Lenoir L. Coordinated Voltage Control in Distribution Network with the Presence of DGs and Variable Loads Using Pareto and Fuzzy Logic. Energies. 2016; 9(2):107. https://doi.org/10.3390/en9020107
Chicago/Turabian StyleCastro, José Raúl, Maarouf Saad, Serge Lefebvre, Dalal Asber, and Laurent Lenoir. 2016. "Coordinated Voltage Control in Distribution Network with the Presence of DGs and Variable Loads Using Pareto and Fuzzy Logic" Energies 9, no. 2: 107. https://doi.org/10.3390/en9020107