1. Introduction
For a century, utility companies have used conventional power grid system to provide electricity. Lack of techniques to automatically monitor the grid system and transfer useful data has forced utility companies to send workers out to gather data needed for optimal management of power grid systems. For example, these utility workers perform multiple functions on-site including reading meters, looking for faulty equipment, and measuring voltage. In such a conventional and, potentially outdated power grid system, there is little chance to optimally manage supply and demand effectively. In recent years, a new generation of power grid system, referred to as the Smart Grid, with an aim of managing electricity demand in a sustainable, reliable, and economical manner has emerged [
1]. The Smart Grids European Technology Platform considers Smart Grid as an electricity network that can intelligently integrate the actions of all the connected users, generators, consumers, and those that do both, in order to efficiently deliver sustainable economic and secure electricity supply [
2]. The Smart Grid is made possible by two-way communication technology and automation that has been used for decades in other industries. The two-way communication technology, which can transmit and receive digital signals, enhances the information transfer between each devices associated with the grid, e.g., substations, transformers, switches, consumers, and central control center. The automation makes it possible to adjust and control, potentially, each individual device or a collection of devices from a central location. Energy efficiency is achieved by employing appropriate power control algorithms. In general, Smart Grid is an intelligent power system that integrates advanced control, communications, and sensing technologies into the power grid.
Smart Gird contributes significantly in peak demand management as the trend of power demand can be monitored and the demand can be shifted from “on-peak” to “off-peak” periods by employing Demand Response [
3]. However, applying Smart Grid for smart control of each consumer’s, for example, operation status recognition, operation control optimization, fault detection, etc., is challenging owing to uncertainty in usage conditions of household [
4]. Nevertheless, using bi-directional data transfer enabled via Smart Grid and with greater knowledge of operational characteristics of individual appliances, necessary automation control strategies can be developed to operate appliances in an efficient. In order to provide specific power utilization information, effective recognition of the types of appliances have been considered by many researchers [
5,
6,
7]. These research works demonstrate that multiple appliances can be distinguished based on certain classification algorithms. It is to be noted that only a handful of research work [
8] has been done to study the classification of multiple operation modes of appliances. Some of the household appliances, such as a lamp or television, have single or limited operation modes, while others such as a refrigerator or clothes washer, have multiple operation modes due to their settings. In general, an equipment operation cycle may have unique characteristics such as “run time”, “idle time”, “maximum power”,
etc., based on the operation of the appliance. Classification of operation cycles for each appliances is beneficial for Smart Grid as it provides a clear and convincing understanding of the operation modes for effective power management. This paper discusses a classification method to classify multiple operation cycles for a household refrigerator.
In recent years, the research community has used the concept of load signatures for appliance load monitoring. The load signature corresponds to the specific electrical behavior of an individual appliance/piece of equipment when it is in operation [
9]. A load signature could use multiple attributes such as active power, reactive power, switching transient current, and waveform to describe the transient and steady-state behaviors of an appliance. In fact, as each appliance has a unique load signature, many research studies focused on using load signature to classify household appliances. Huang
et al. developed a household appliance classification method by using appliance power signature and harmonic features [
10]. Xu and Dong formulated an appliance signature vector which comprises of different load signatures to identify household appliances [
11]. Chui
et al. used four appliance features namely, active power, reactive power, total harmonic distortion, and maximum transient current for household appliance classification and identification [
7].
Meanwhile, many algorithms have been applied to identify different load signature patterns. Srinivasan
et al. proposed a neural network based approach for signature identification of electrical devices based on the current harmonics [
6]. Popescu
et al. characterized home appliance load signature from the perspective of Recurrence Plot Analysis [
12]. Kim
et al. used the k-nearest neighbor method to detect specific appliance electrical events [
13]. Also, clustering as a main technique to partition data into groups has been used to classify building electricity customers [
14], predict future building energy demand [
15], and detect abnormal behaviors [
16]. Chui
et al. proposed an appliance signature identification solution using k-means clustering to identify different household appliances [
7].
Although, previous research efforts have proven load signature as an effective mean to classify and identify different appliances, there is no research focusing on household appliance operational pattern classification and identification. The classification and identification of these operational patterns could help users to understand their operation modes, estimate their energy usage, and diagnose the health of their appliances. This study fills this gap by introducing k-means clustering technique which is one of the most popular unsupervised learning algorithms that solve the clustering problem to classify the operational cycles of typical household appliances. The objective of the research work is to aid the operation mode recognition method of household appliances through classifying and recognizing different operation patterns. To validate the proposed classification method, a case study focusing on pattern classification of undisturbed household refrigerator operation cycles is conducted.
Household Refrigerator
The household refrigerator is selected for the case study as it is as one of the major household appliances which used 8% of U.S. residential electricity use in 2012 [
17]. While refrigerator energy usage cannot be ignored, the use of refrigerants in refrigerator equipment also adds to the degradation of the environment, specifically the greenhouse gas emissions and ozone layer depletion [
18]. Needless to say, smart control of household refrigerators is of great importance for achieving sustainability.
The operation of refrigerators is impacted by factors such as frost formation, door opening, and defrosting. Previous research has indicated that the energy use of a refrigerator can be dynamically modeled by considering the impacts of these factors [
19]. However, the derivations of these factors are different, for example, frost formation and defrosting are determined by refrigerator’s own factory settings and control strategy, while door openings are derived from user interference. Previous research has shown that occupant interference has a significant impact on refrigerator energy use, specifically owing to the frequency of door opening [
20]. Extending these concepts, in our study, we broadly consider user interferences in two scenarios—disturbed and undisturbed. During the disturbed scenario, user interference occurs and vice-versa. For this reason, this paper uses undisturbed cycles as they more persuasively represent typical refrigerator operation. Moreover, efficiency strategies to improve refrigerator health and performance may be implemented via Smart Grids during undisturbed periods. The other factors that impact energy use are the type of refrigerator door construction including the insulation technologies, and the refrigeration electrical components and control technologies. Thus, in this paper, we focus on the pattern recognition of undisturbed cycles in order to extract the household refrigerator’s operation characteristics.
The paper is organized as follows: typical refrigerator operation cycles are introduced in
Section 2. In
Section 3, we present the basic idea of the proposed research methodologies including k-means clustering, attributes selection for clustering, selection of number of clusters, measurement of clustering quality, and identification of different clusters.
Section 4 presents a case study to validate the proposed method. In
Section 5, we discuss the conclusion and future works.
2. Typical Refrigerator Operation Cycles
Household refrigerators are cyclic appliances whose operations consist of repeating cycles. A typical refrigerator cycle includes both run time and idle time. While run time is when the refrigerator turns on to refrigerate or to defrost, idle time is when the refrigerator turns off and, therefore, no electricity is consumed. These operation cycles are further divided into two major groups: disturbed and undisturbed cycles, based on occupants inference such as door opening and loading/unloading food. Since operation cycles are impacted by occupants’ usages which typically happen in daytime, the undisturbed cycles occur consecutively in a time period that happens between late night and early morning when there is little or no interference from occupants.
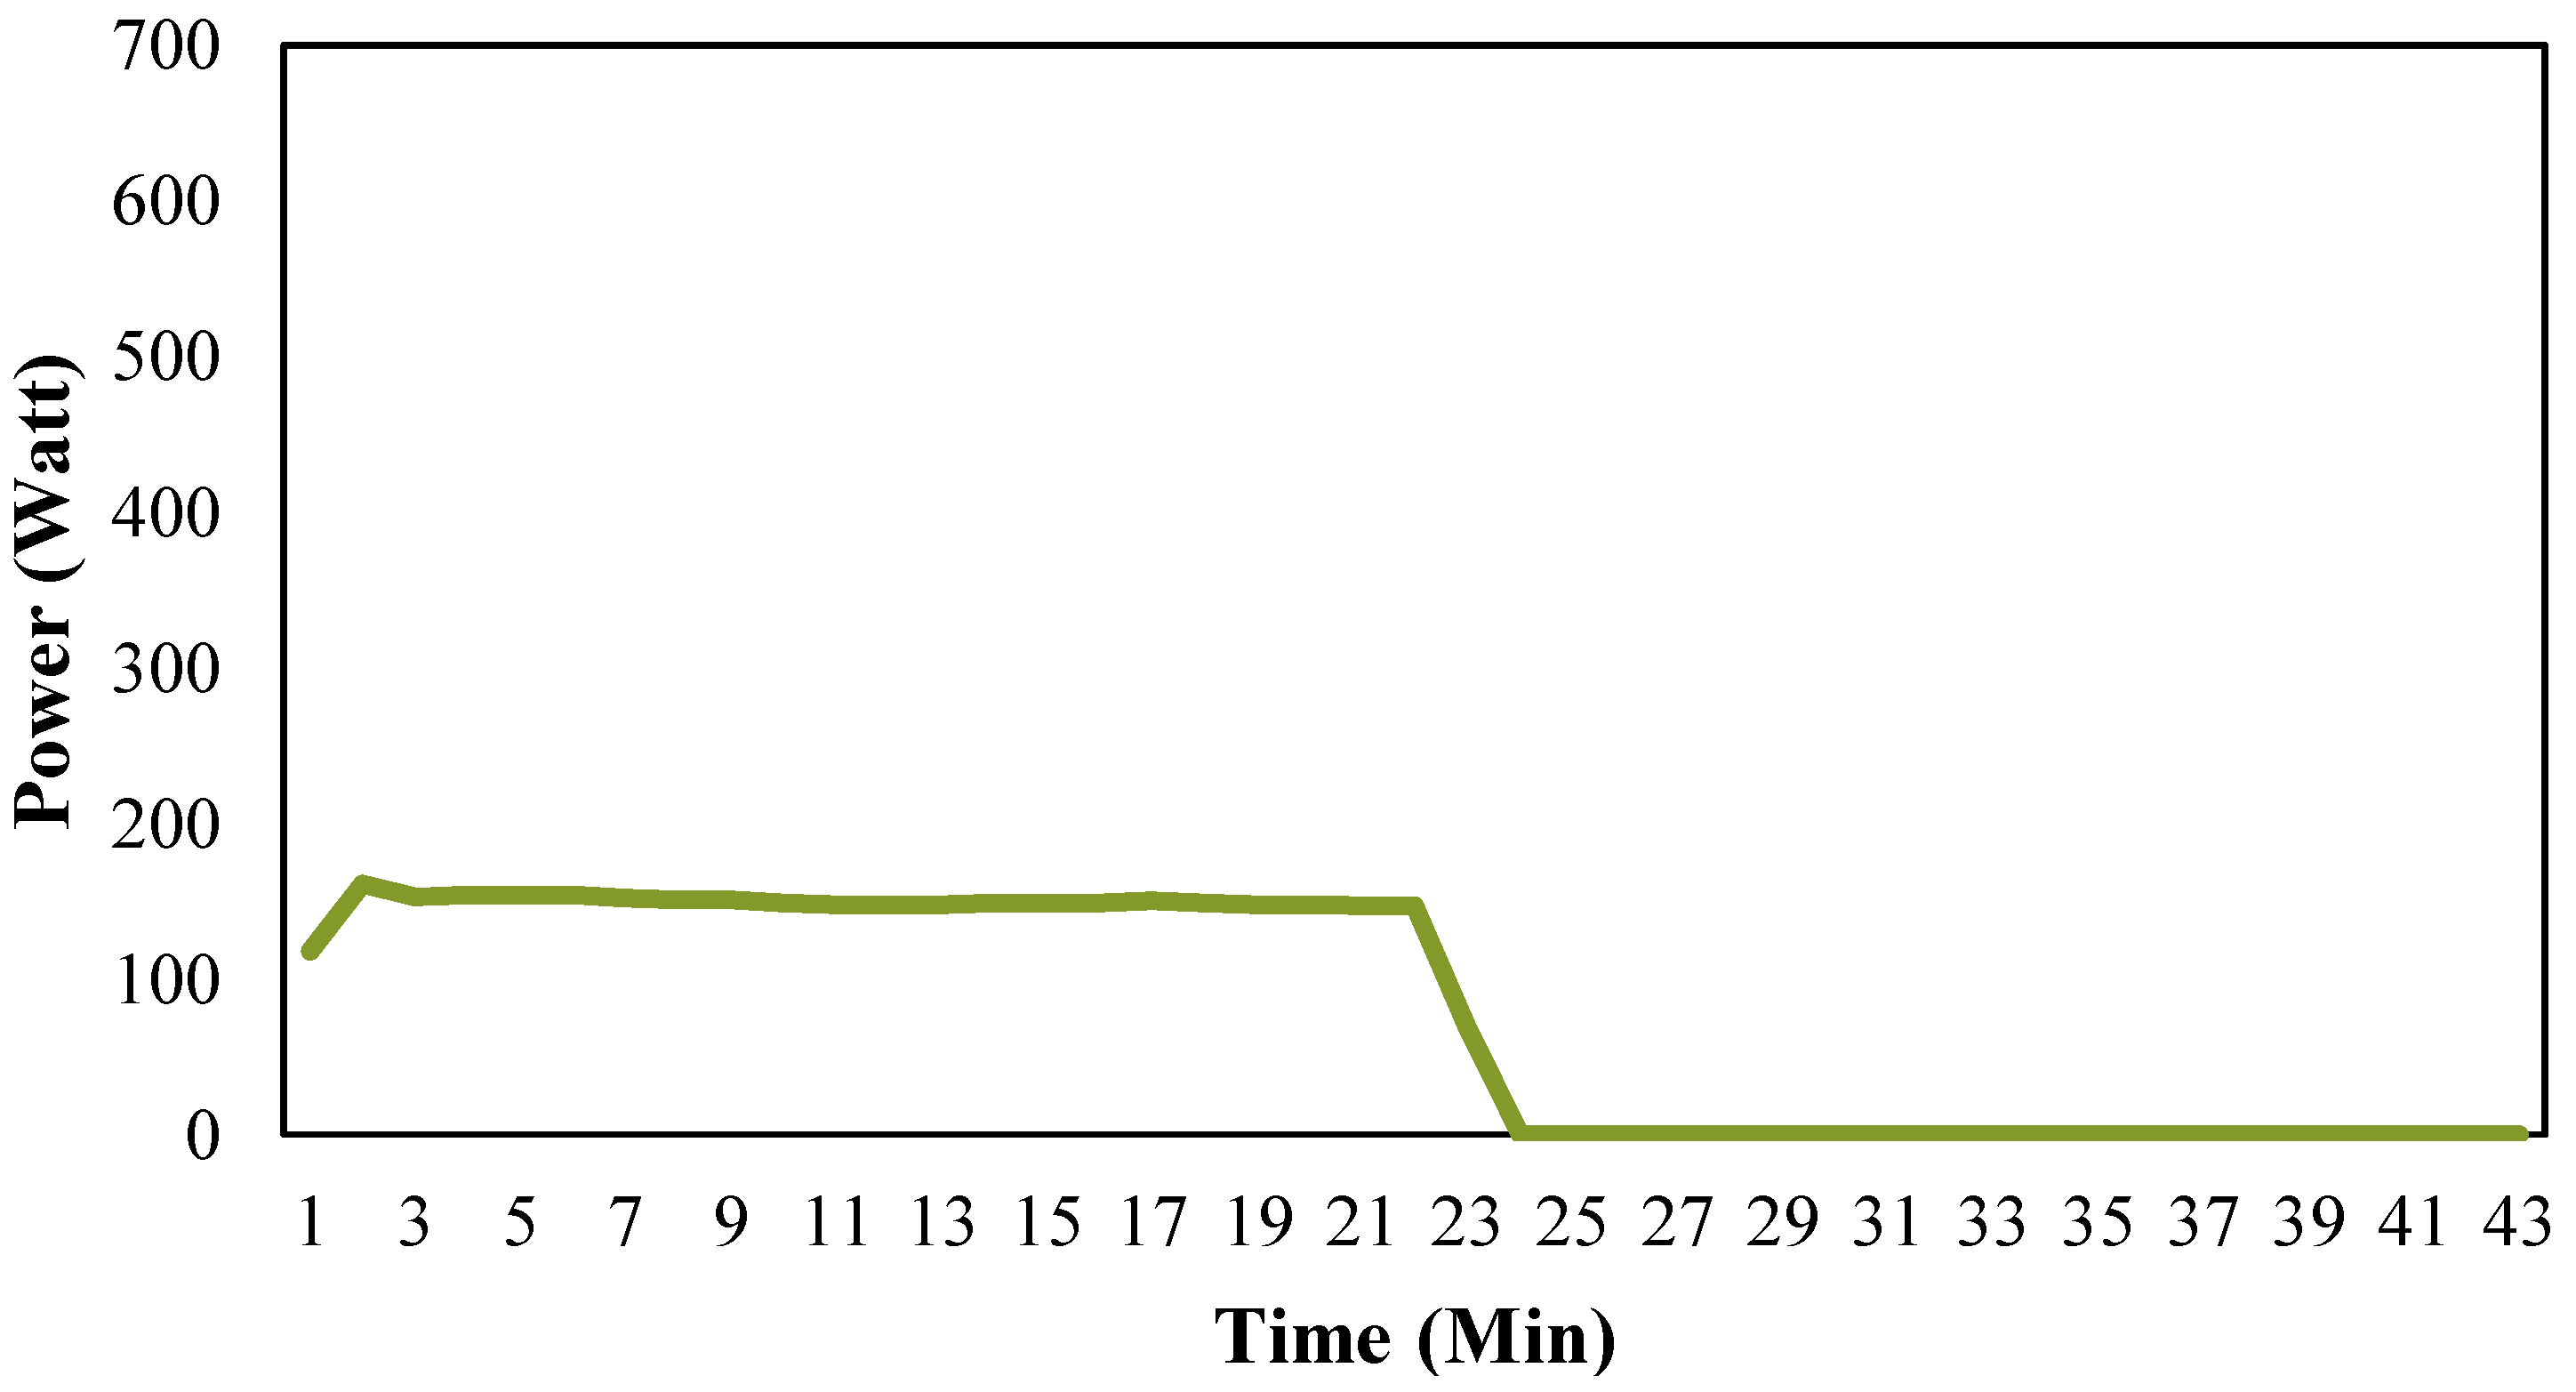
Figure 1 shows a typical operation cycle which normally occurs without occupant’s interference. Many alternative attributes which describe the characteristics of the operation cycle can be extracted based on
Figure 1. These attributes include, but are not limited to startup time, operation time, shut down time, run time, idle time, total electricity use, average power, maximum power, and minimum power. In order to obtain satisfactory classification results, selecting appropriate attributes is crucial for this study. The selection of attributes is addressed in detail in
Section 4.2—data preprocessing.
Figure 1.
Typical household refrigerator operation cycle for 24 h period.
Figure 1.
Typical household refrigerator operation cycle for 24 h period.
3. Methodology
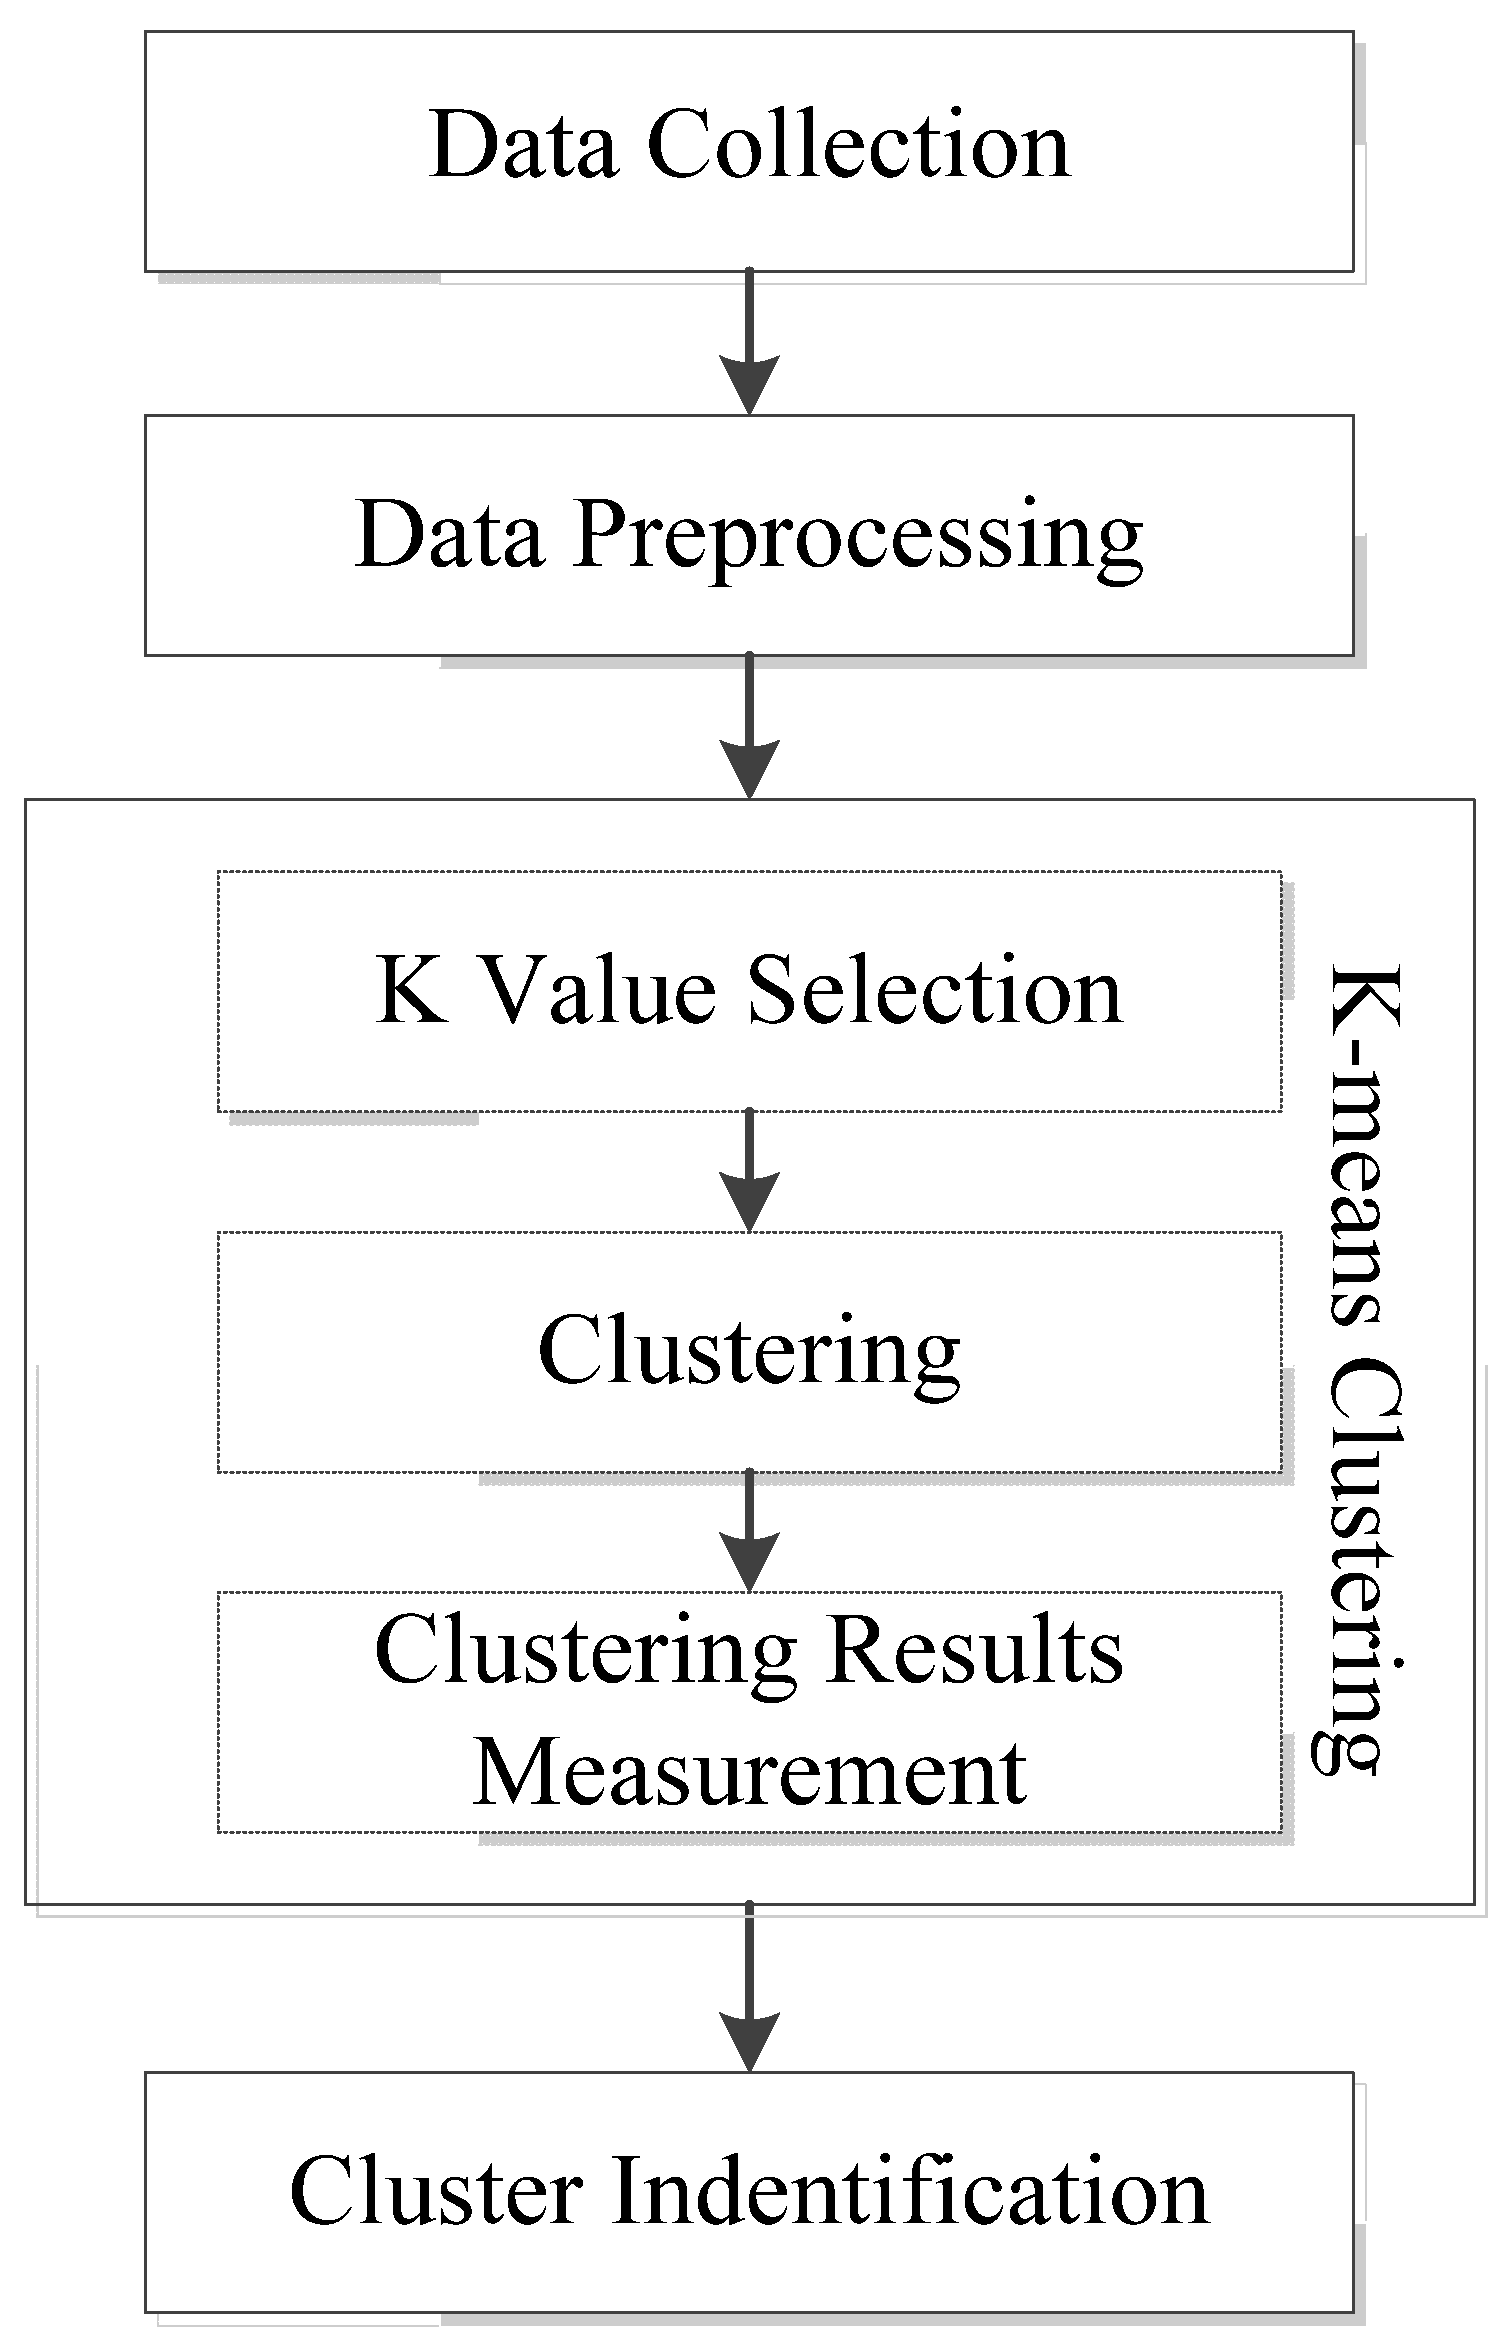
The pattern classification strategy developed in this study comprises of four steps namely, data collection, data preprocessing, k-means clustering, and pattern recognition,
Figure 2. In general, appliances energy use data were collected by using innovative monitoring meters. The operation cycle is identified by the turn-on and turn-off events of the appliances. For each operation cycle, appropriate attributes which are capable of describing the difference between different types of operation cycles should be selected. K-means clustering algorithm is applied to partition the data into several groups. As k-means clustering method requires pre-determination of correct number of clusters, an error function which can assist this determination in selecting optimum k is introduced. Because the ground truth is unknown for this study, an intrinsic method,
i.e., silhouette coefficient is used to measure the clustering result. Finally, we recognize and define the clustering results based on their characteristics such as average total energy use, average maximum power, sequential order, and frequency.
Figure 2.
Flowchart for pattern recognition of different refrigerator operation cycles.
Figure 2.
Flowchart for pattern recognition of different refrigerator operation cycles.
3.1. K-Means Clustering
Clustering is an unsupervised learning technique that groups a set of data into multiple clusters so that objects in the same cluster have high similarity, while they are very dissimilar to objects in other clusters [
21]. In other words, clustering technique groups the data objects based on whether they are similar or not, and the similarity and dissimilarity are assessed based on the attributes which are used to describe the objects.
In this paper, we applied a centroid-based clustering algorithm, k-means clustering, for pattern recognition as it is efficient for large and multi-dimension datasets. The basic idea of k-means algorithm is to assign objects to the most similar cluster and update the center value of the cluster iteratively until the assignment is stable, that is, the clusters formed in current round are the same as those forms in the previous round. An error function is introduced to verify the stability of the assignment and measure the partition quality. In k-means, a cluster is represented in terms of its centroid which is defined as the mean value of the objects within the cluster. The difference between each object in the cluster and the cluster centroid is measured by the Euclidean distance which is defined as follows:
where
is the object,
is the cluster centroid,
is the dimension of the data,
is the
th attribute value of the object,
is the
th attribute value of the cluster centroid.
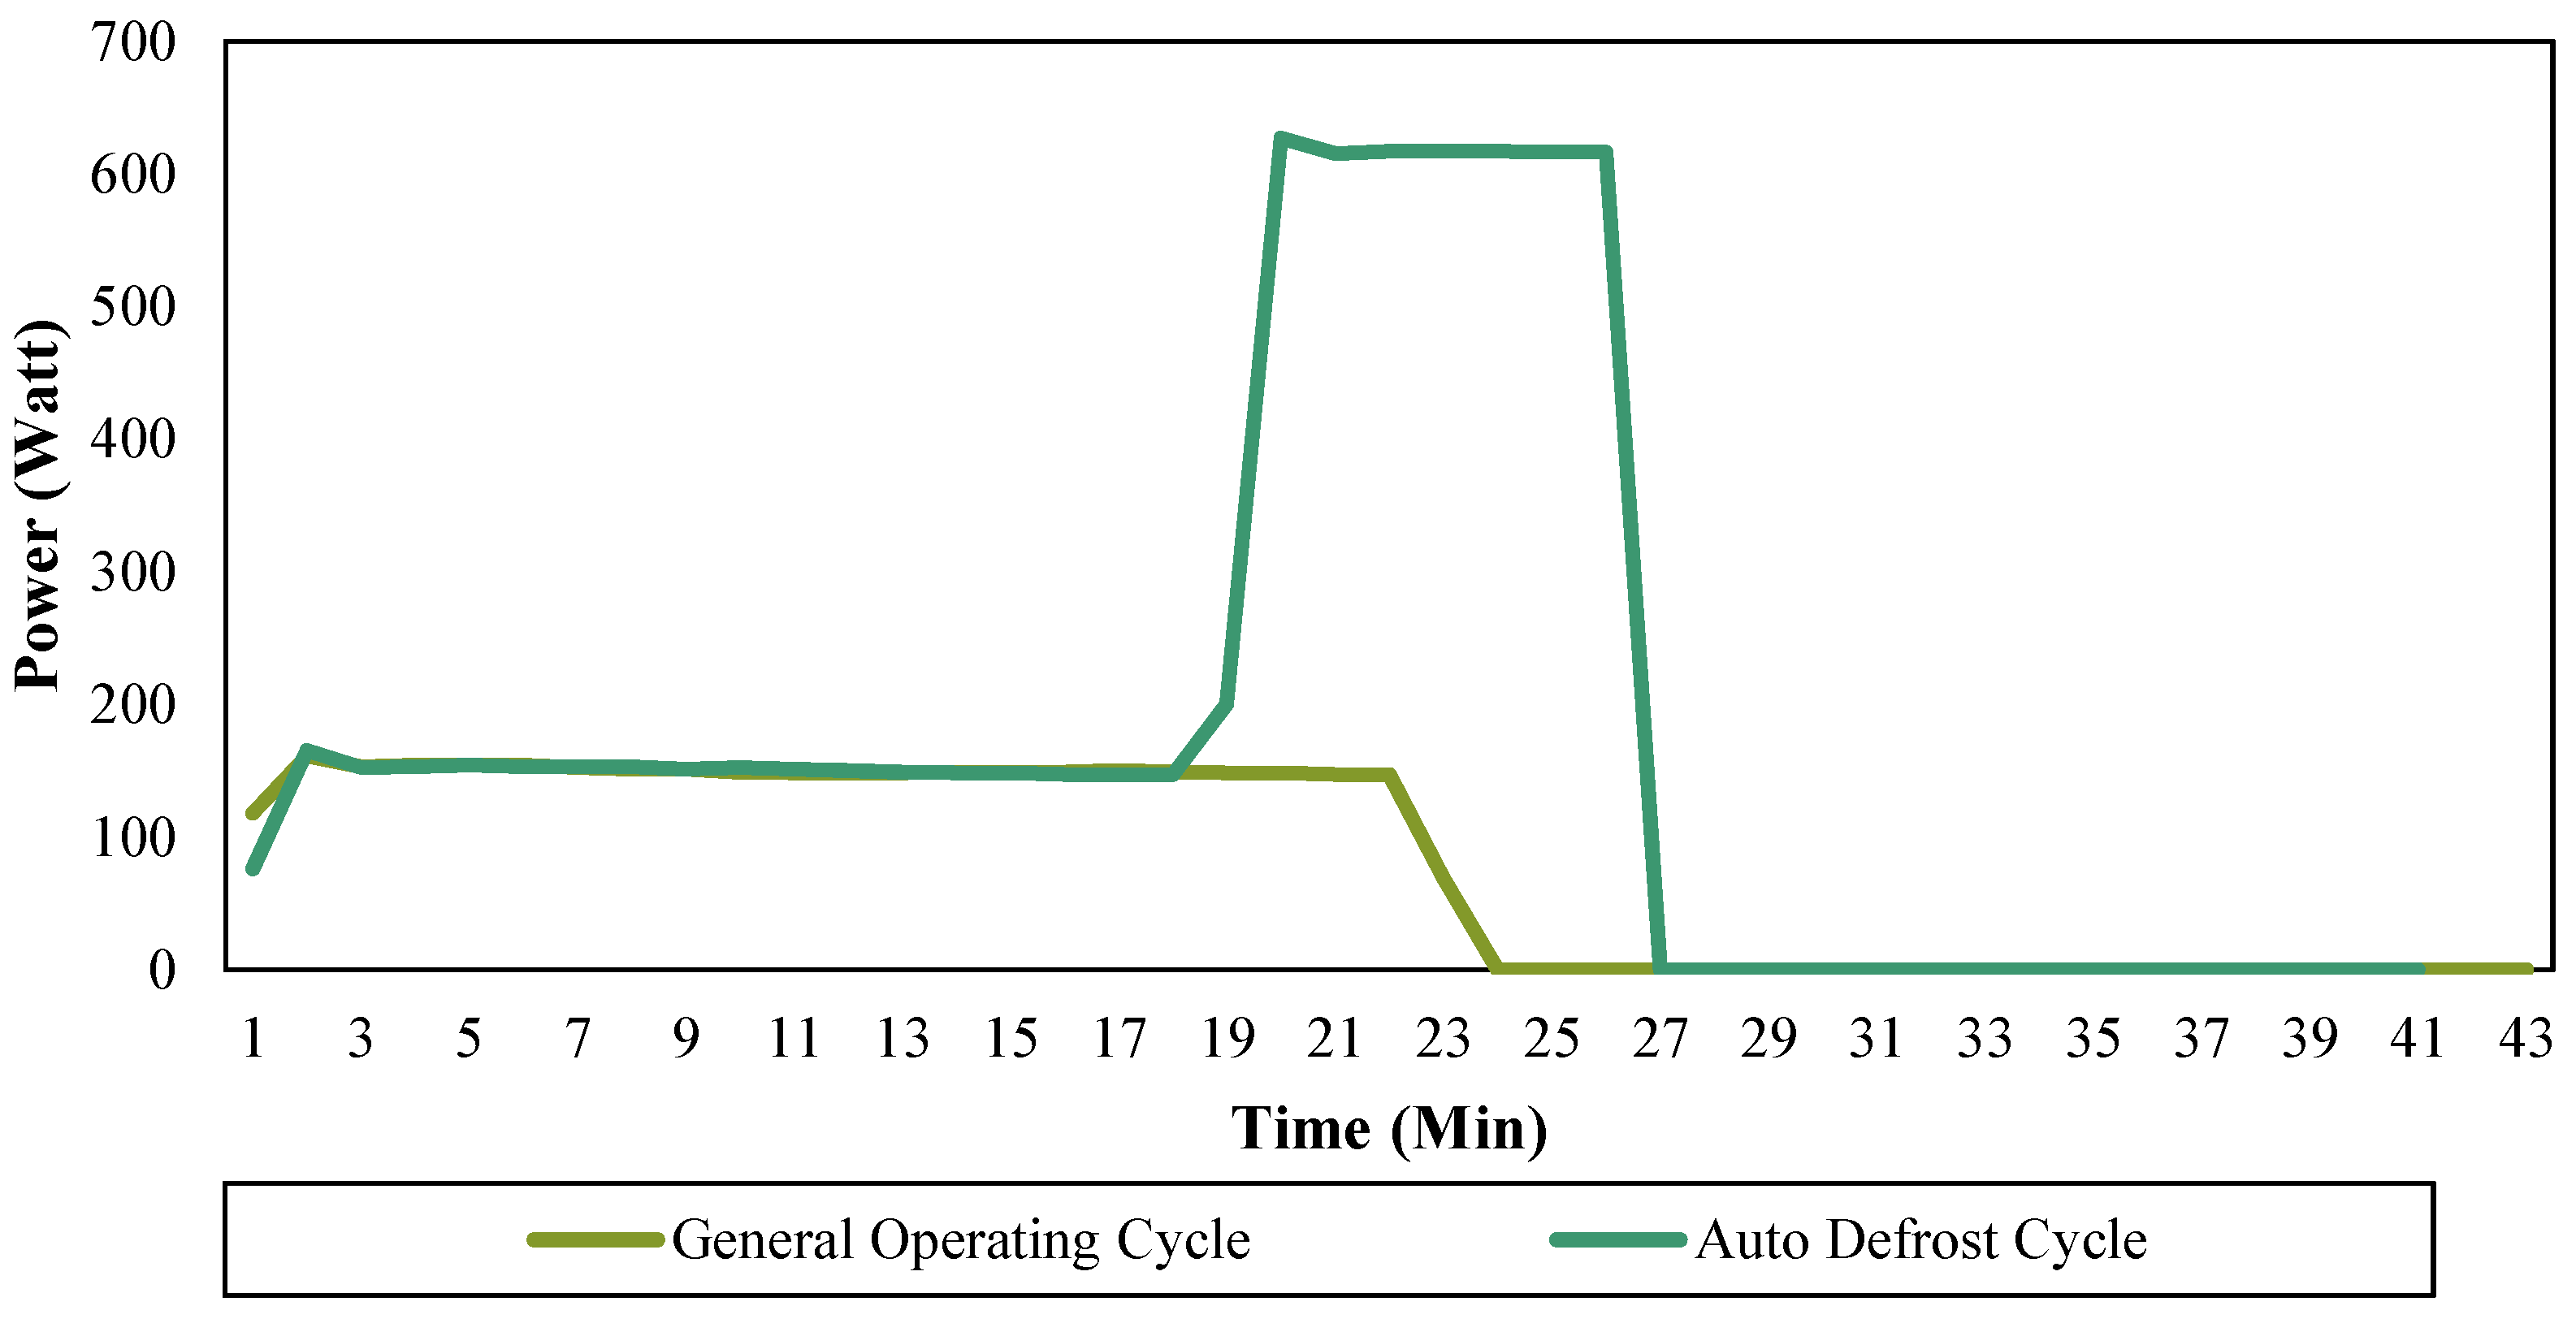
3.2. Attributes Selection for Clustering
Since clustering determines the similarity and dissimilarity based on the attributes describing the objects, appropriate attributes which can help distinguish objects of different groups should be selected and extracted from the initial database. As noted previously, many attributes of the operation cycle can be considered for clustering. While in this paper, the refrigerator operation cycles are distinguished from the perspective of different working modes, for example, auto-defrost mode, general operating mode, and cooling mode. In general, different working modes of operation that may result in different operation time, power rate, waveform, etc. Therefore, certain attributes which are able to describe such difference should be selected in order to receive promising classification result. Notably, there is no uniform selection of attributes that can classify operation cycles of appliances of all kinds. Different types of r appliances could have different operational control strategies, working components, etc., thus their differences between different working modes are hard to be described in a uniform manner. The selection of attributes highly depends on the type of appliance and the way it shows the difference between different operation modes. Preliminary studies and expert knowledge are needed to investigate appropriate attributes that can help in distinguishing different operation modes for a certain types of appliance.
3.3. Selection of Number of Clusters
The exact number of clusters is required to be pre-determined for k-means clustering method since appropriate number of clusters controls the proper granularity of cluster analysis [
21]. The precise number of clusters should be able to build a good balance between accuracy and compressibility in cluster analysis. In this study, the right number of clusters is ambiguous since the dataset is unlabeled and the number of different refrigerator operation cycles is unknown. The determination of the correct number of clusters depends on the distribution’s shape and scale in our dataset, as well as the clustering resolution required for this research work. An error function is introduced to help find the exact number of clusters for this study. An error function is defined as:
where
is the sum of the squared error for all objects in the dataset,
is the data point in each cluster,
is the central point of each cluster,
is the number of clusters, and
is Euclidean distance between each data point
and its central point
. The error function aims to make the resulting k clustering as compact and as separate as possible. In other words, k-means algorithm can be treated as an optimization problem which minimizes the error function. The process of selecting the exact number of clusters is described as follows:
Step 1: Selection of an alternative k (k > 0) values which are likely to be the right number of clusters based on the distribution of the operation cycles;
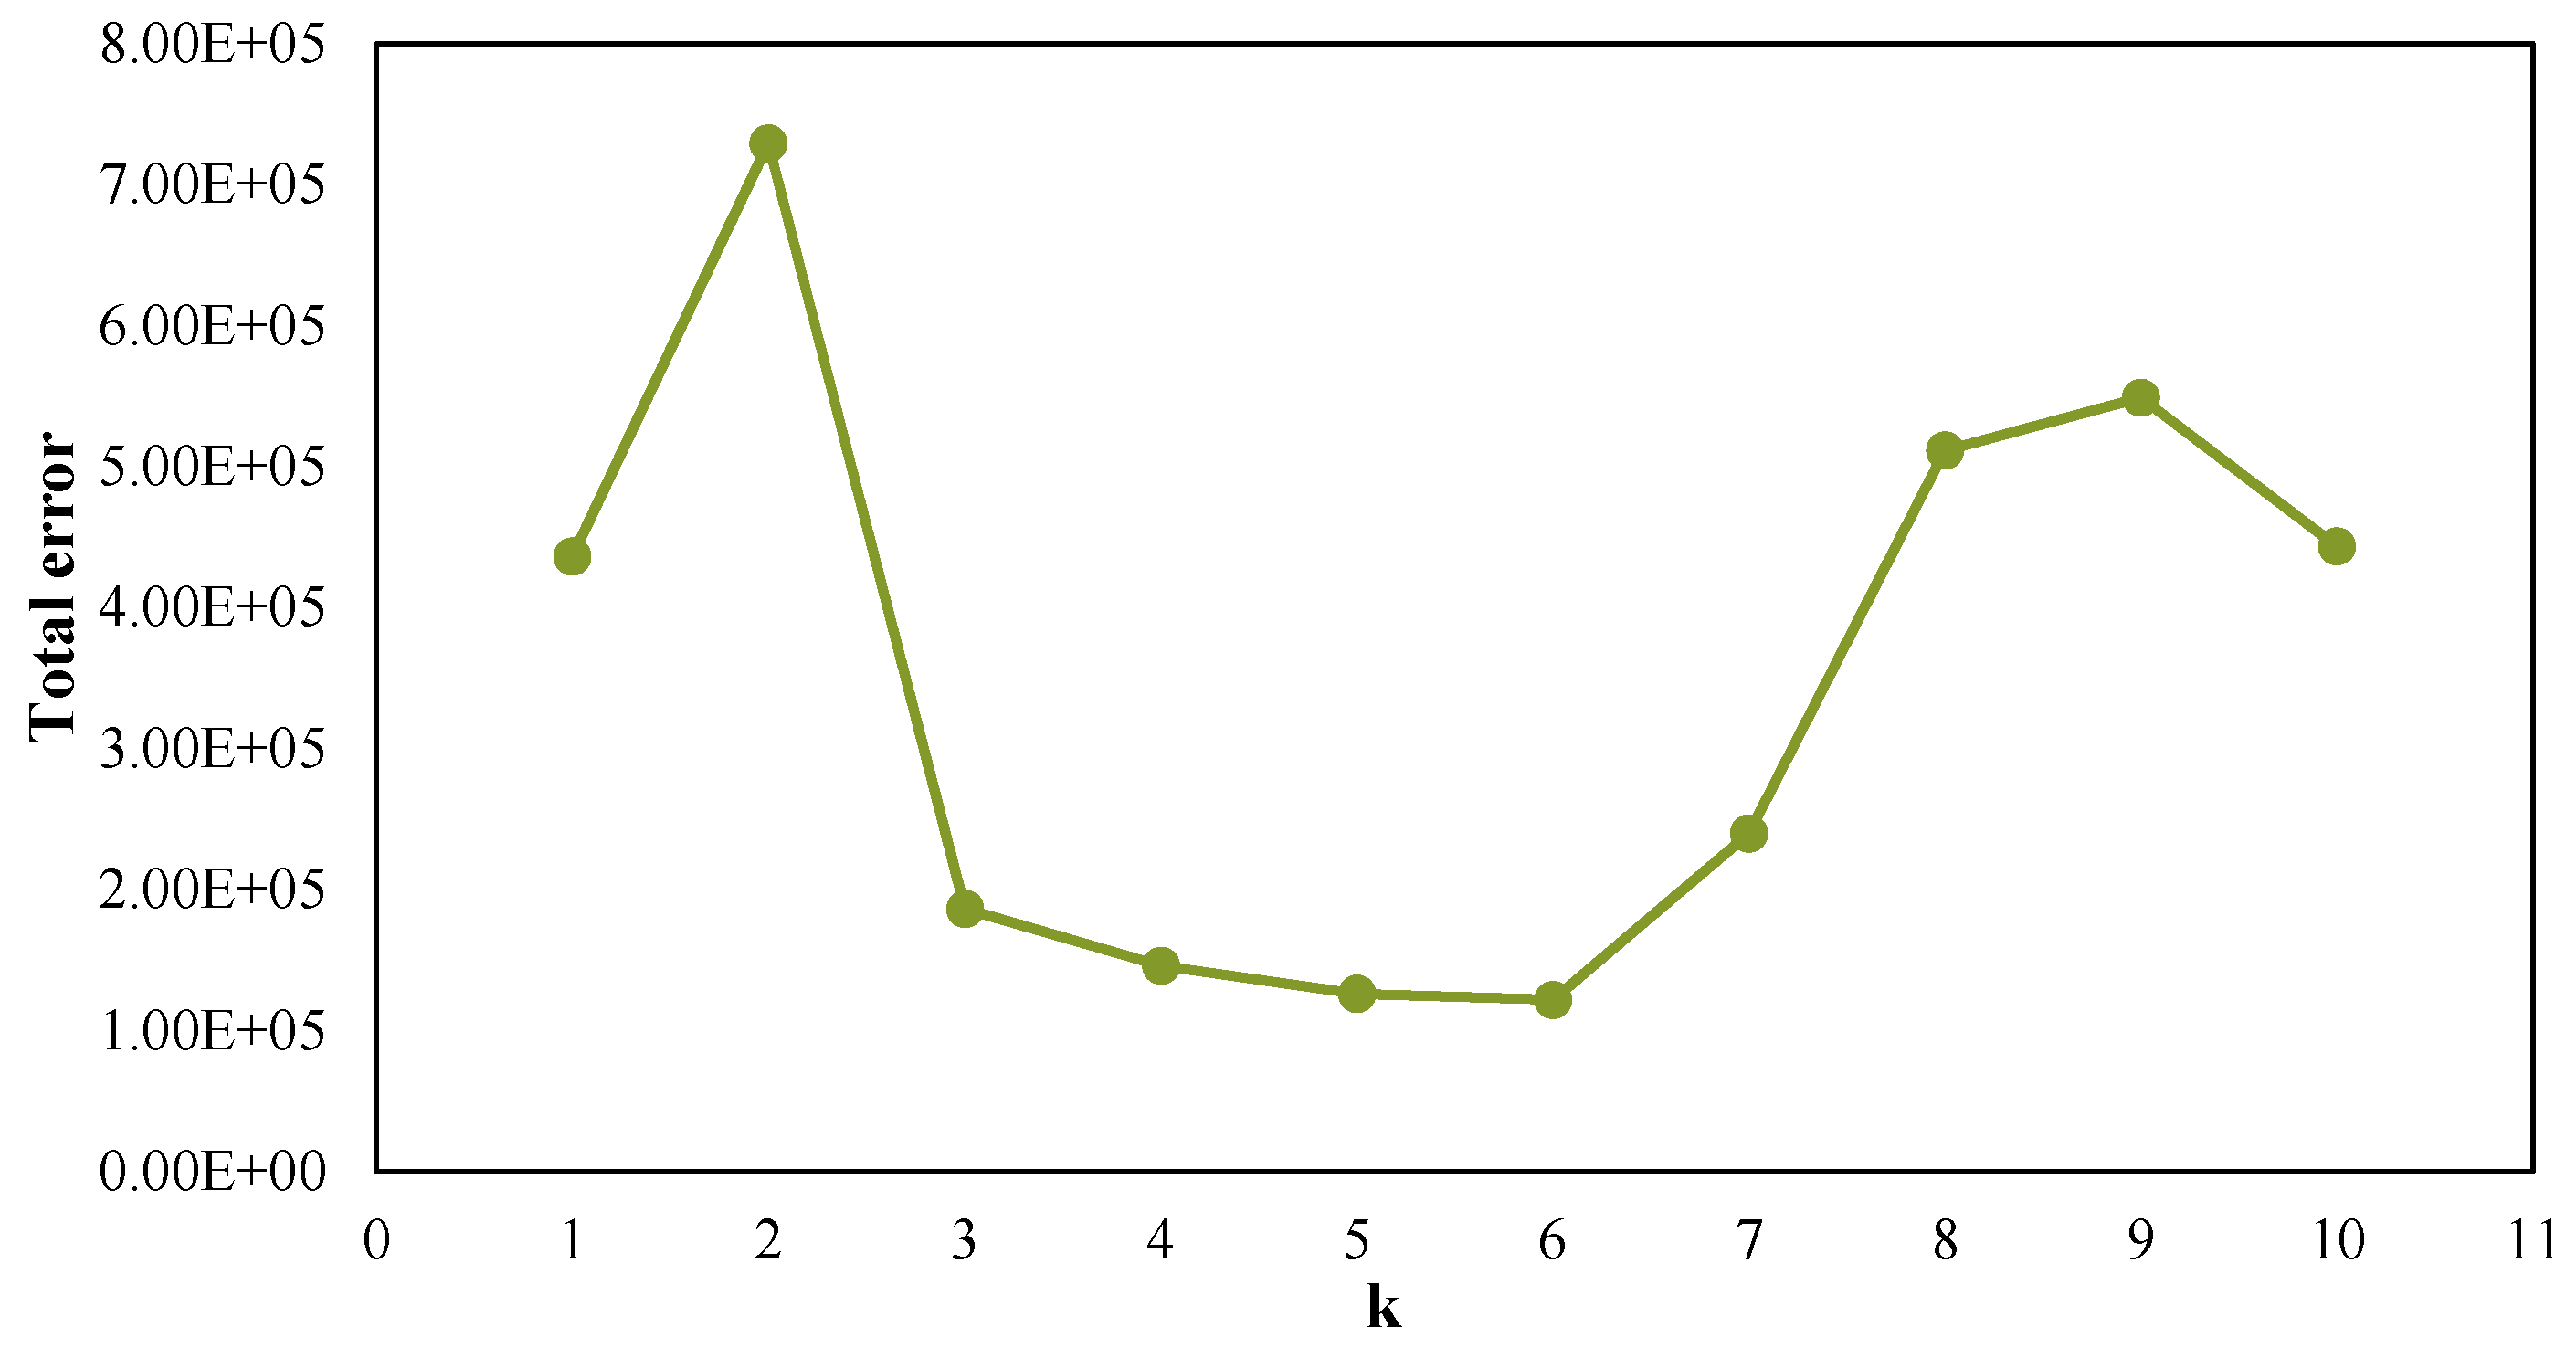
Step 2: Calculation of the total error value of the selected k based on the error function;
Step 3: Building a curve of total error with respect of k which shows its tendency;
Step 4: Finding an optimum k value based on the total error trends. Normally, the first or most significant turning point of the curve suggests the right number of clusters [
21]; and
Step 5: Validating the selected k according to the distribution and the resolution required by the researcher.
3.4. Measurement of Clustering Quality
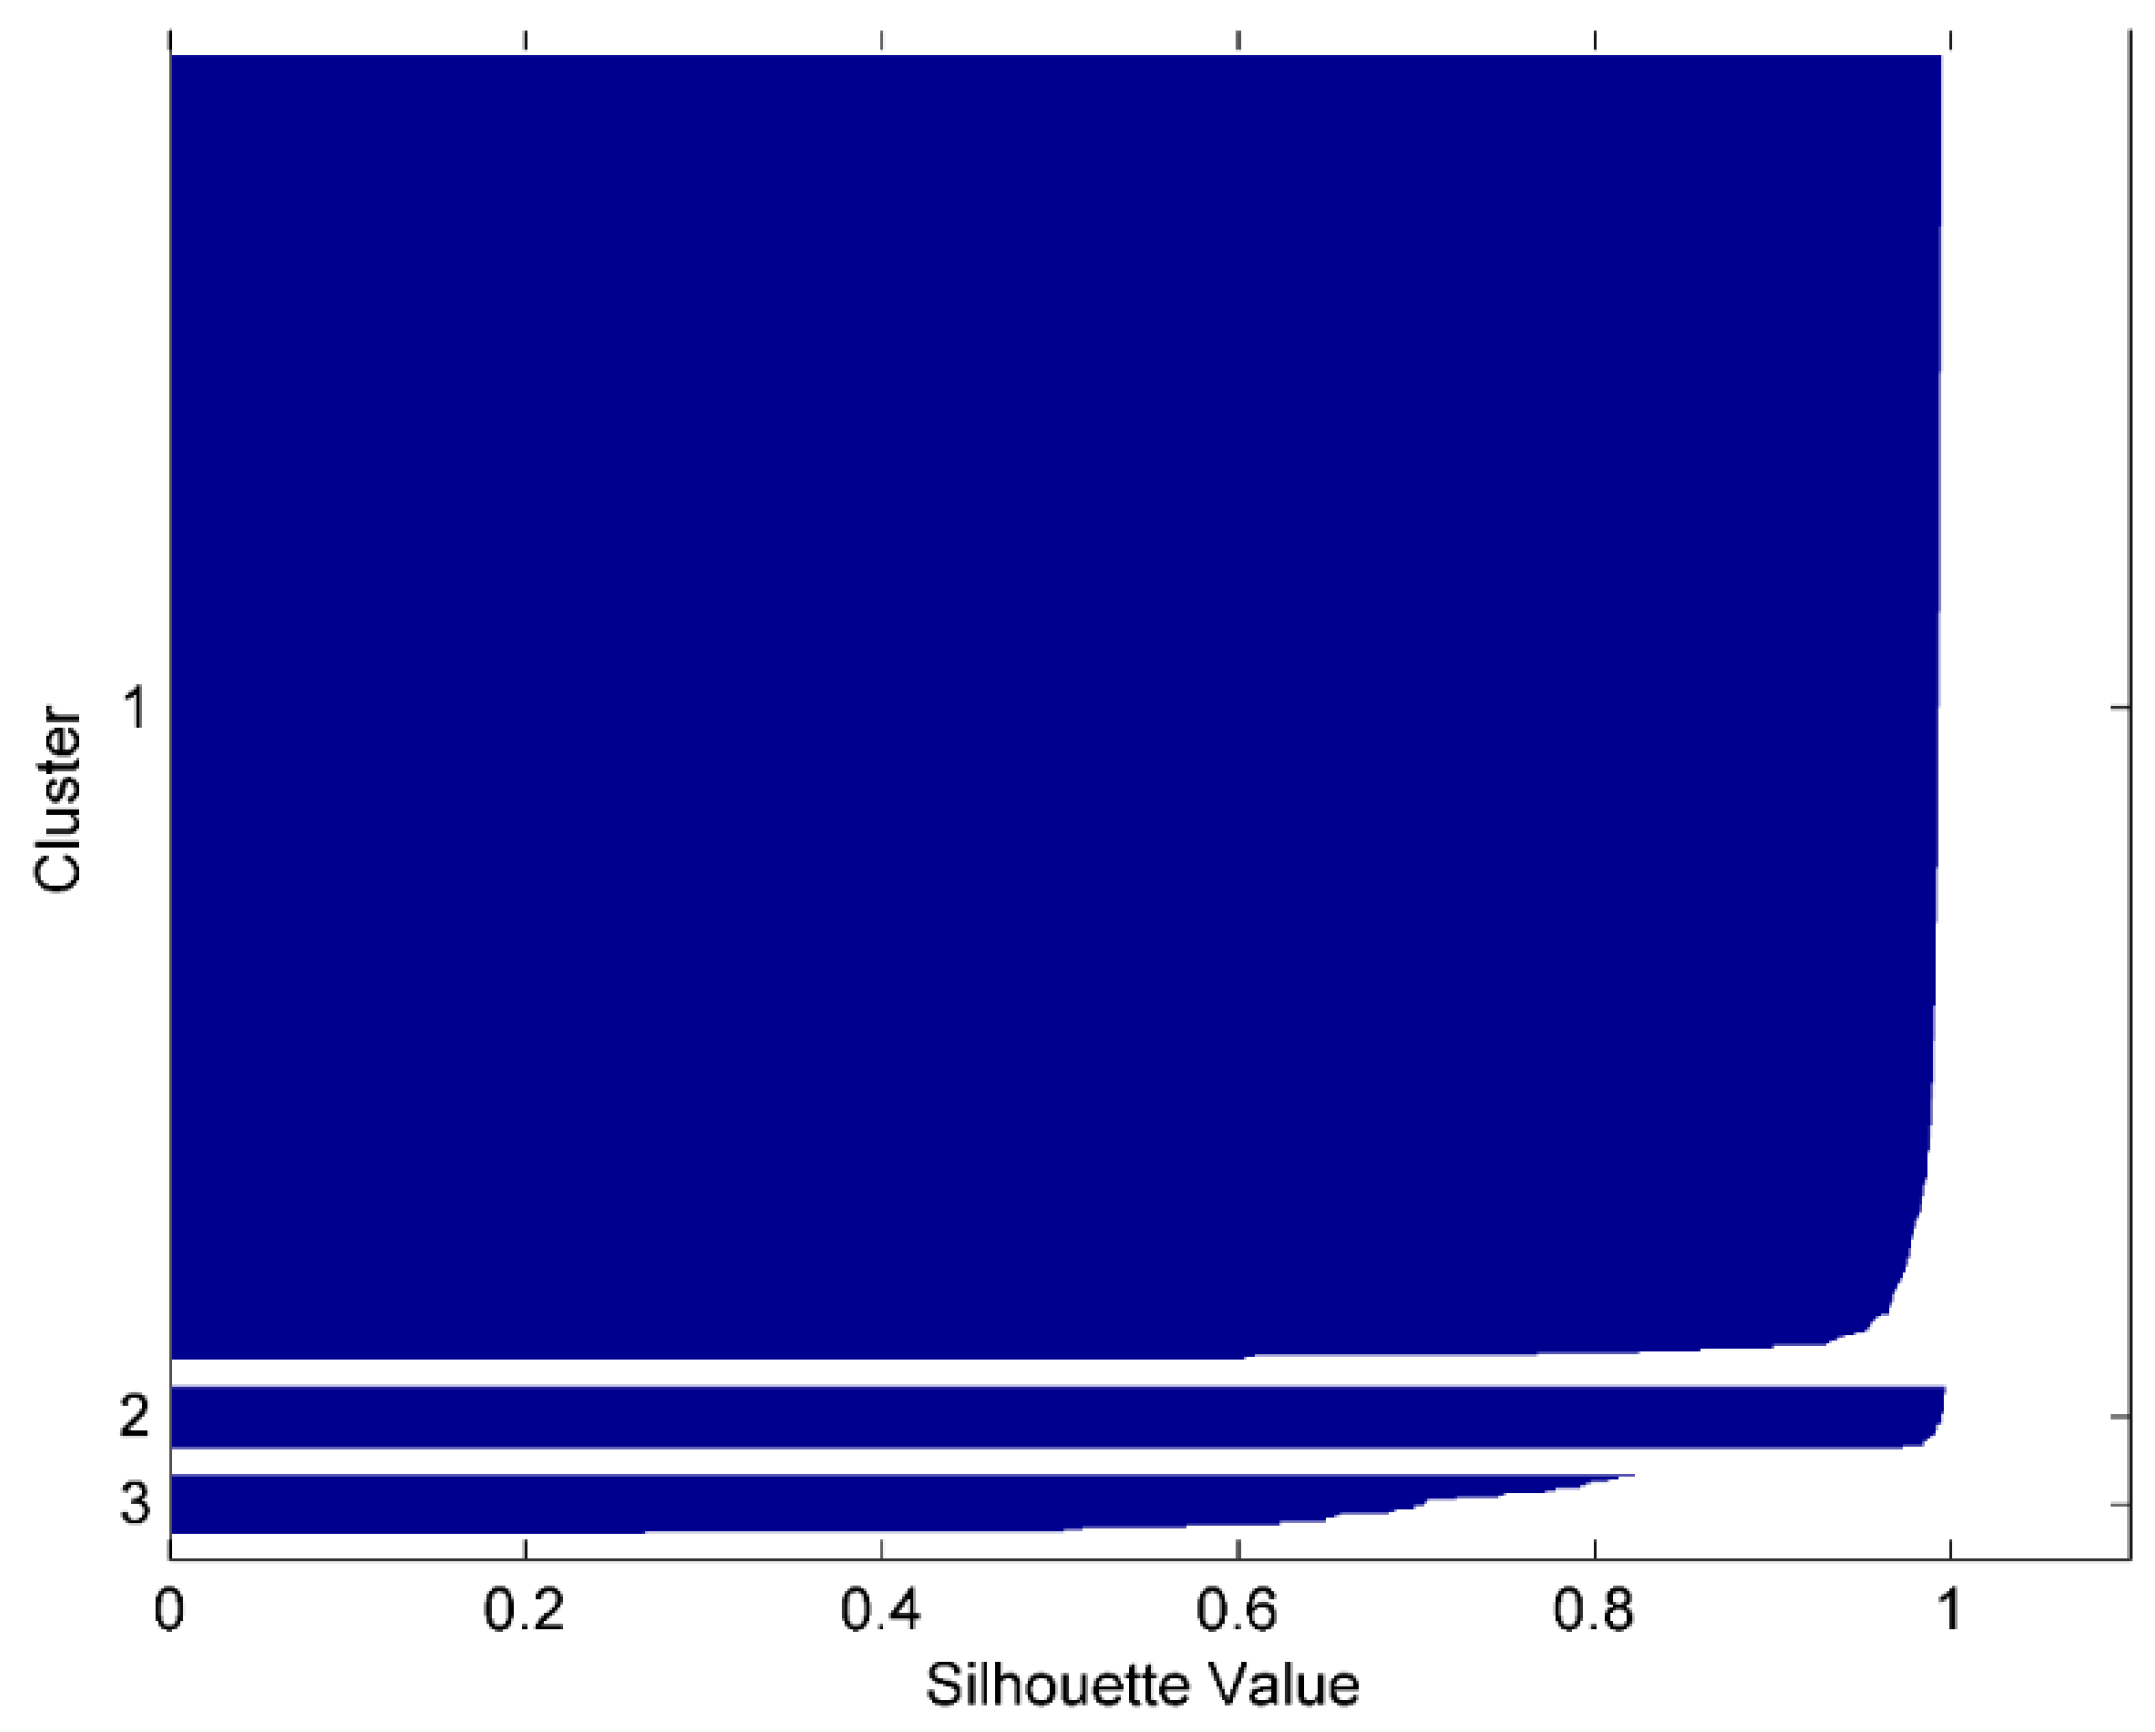
In this study, since the ground truth which is the number of different types of refrigerator operation cycles is unavailable, we measure the clustering quality by using the intrinsic methods which evaluate the goodness of a clustering by considering how well the clusters are separated. The silhouette coefficient which was first proposed by Peter J. Rousseeuw is a method to show how well each object lies within its cluster [
22]. The silhouette coefficient is defined as:
where
is an individual point in the dataset,
is the average distance of point
to all other objects in its cluster,
is the minimum average distance of point
to points in other clusters. The value of the silhouette coefficient is between −1 and 1. As
measures how dissimilar
is to its own cluster, a smaller value means the cluster is more compact. The value of
implies the degree of difference between
and other clusters, thus the larger
is, the more separated
is from other clusters. Therefore, positive silhouette coefficient value means the cluster including
is compact and
is far from other clusters, while negative silhouette coefficient value means
is closer to the objects in another cluster than to the objects in its own cluster. Normally, for silhouette coefficient value, the bigger, the better, and value 1 is the extreme preferable condition.
3.5. Identification of Different Clusters
Identification of different clusters is important for users to understand their operation modes as the classification partitions cycles on a statistical basis, which is impossible to reveal the meaning behind each clusters. In this paper, the concept of identification of different clusters is to collect information which is able work as clues to link each cluster to the specific operation mode. Specifically, clusters are identified based on their characteristics such as volume, average power, average energy use, and sequential order, which are able to reflect the relation between clusters and operation mode.
5. Conclusions
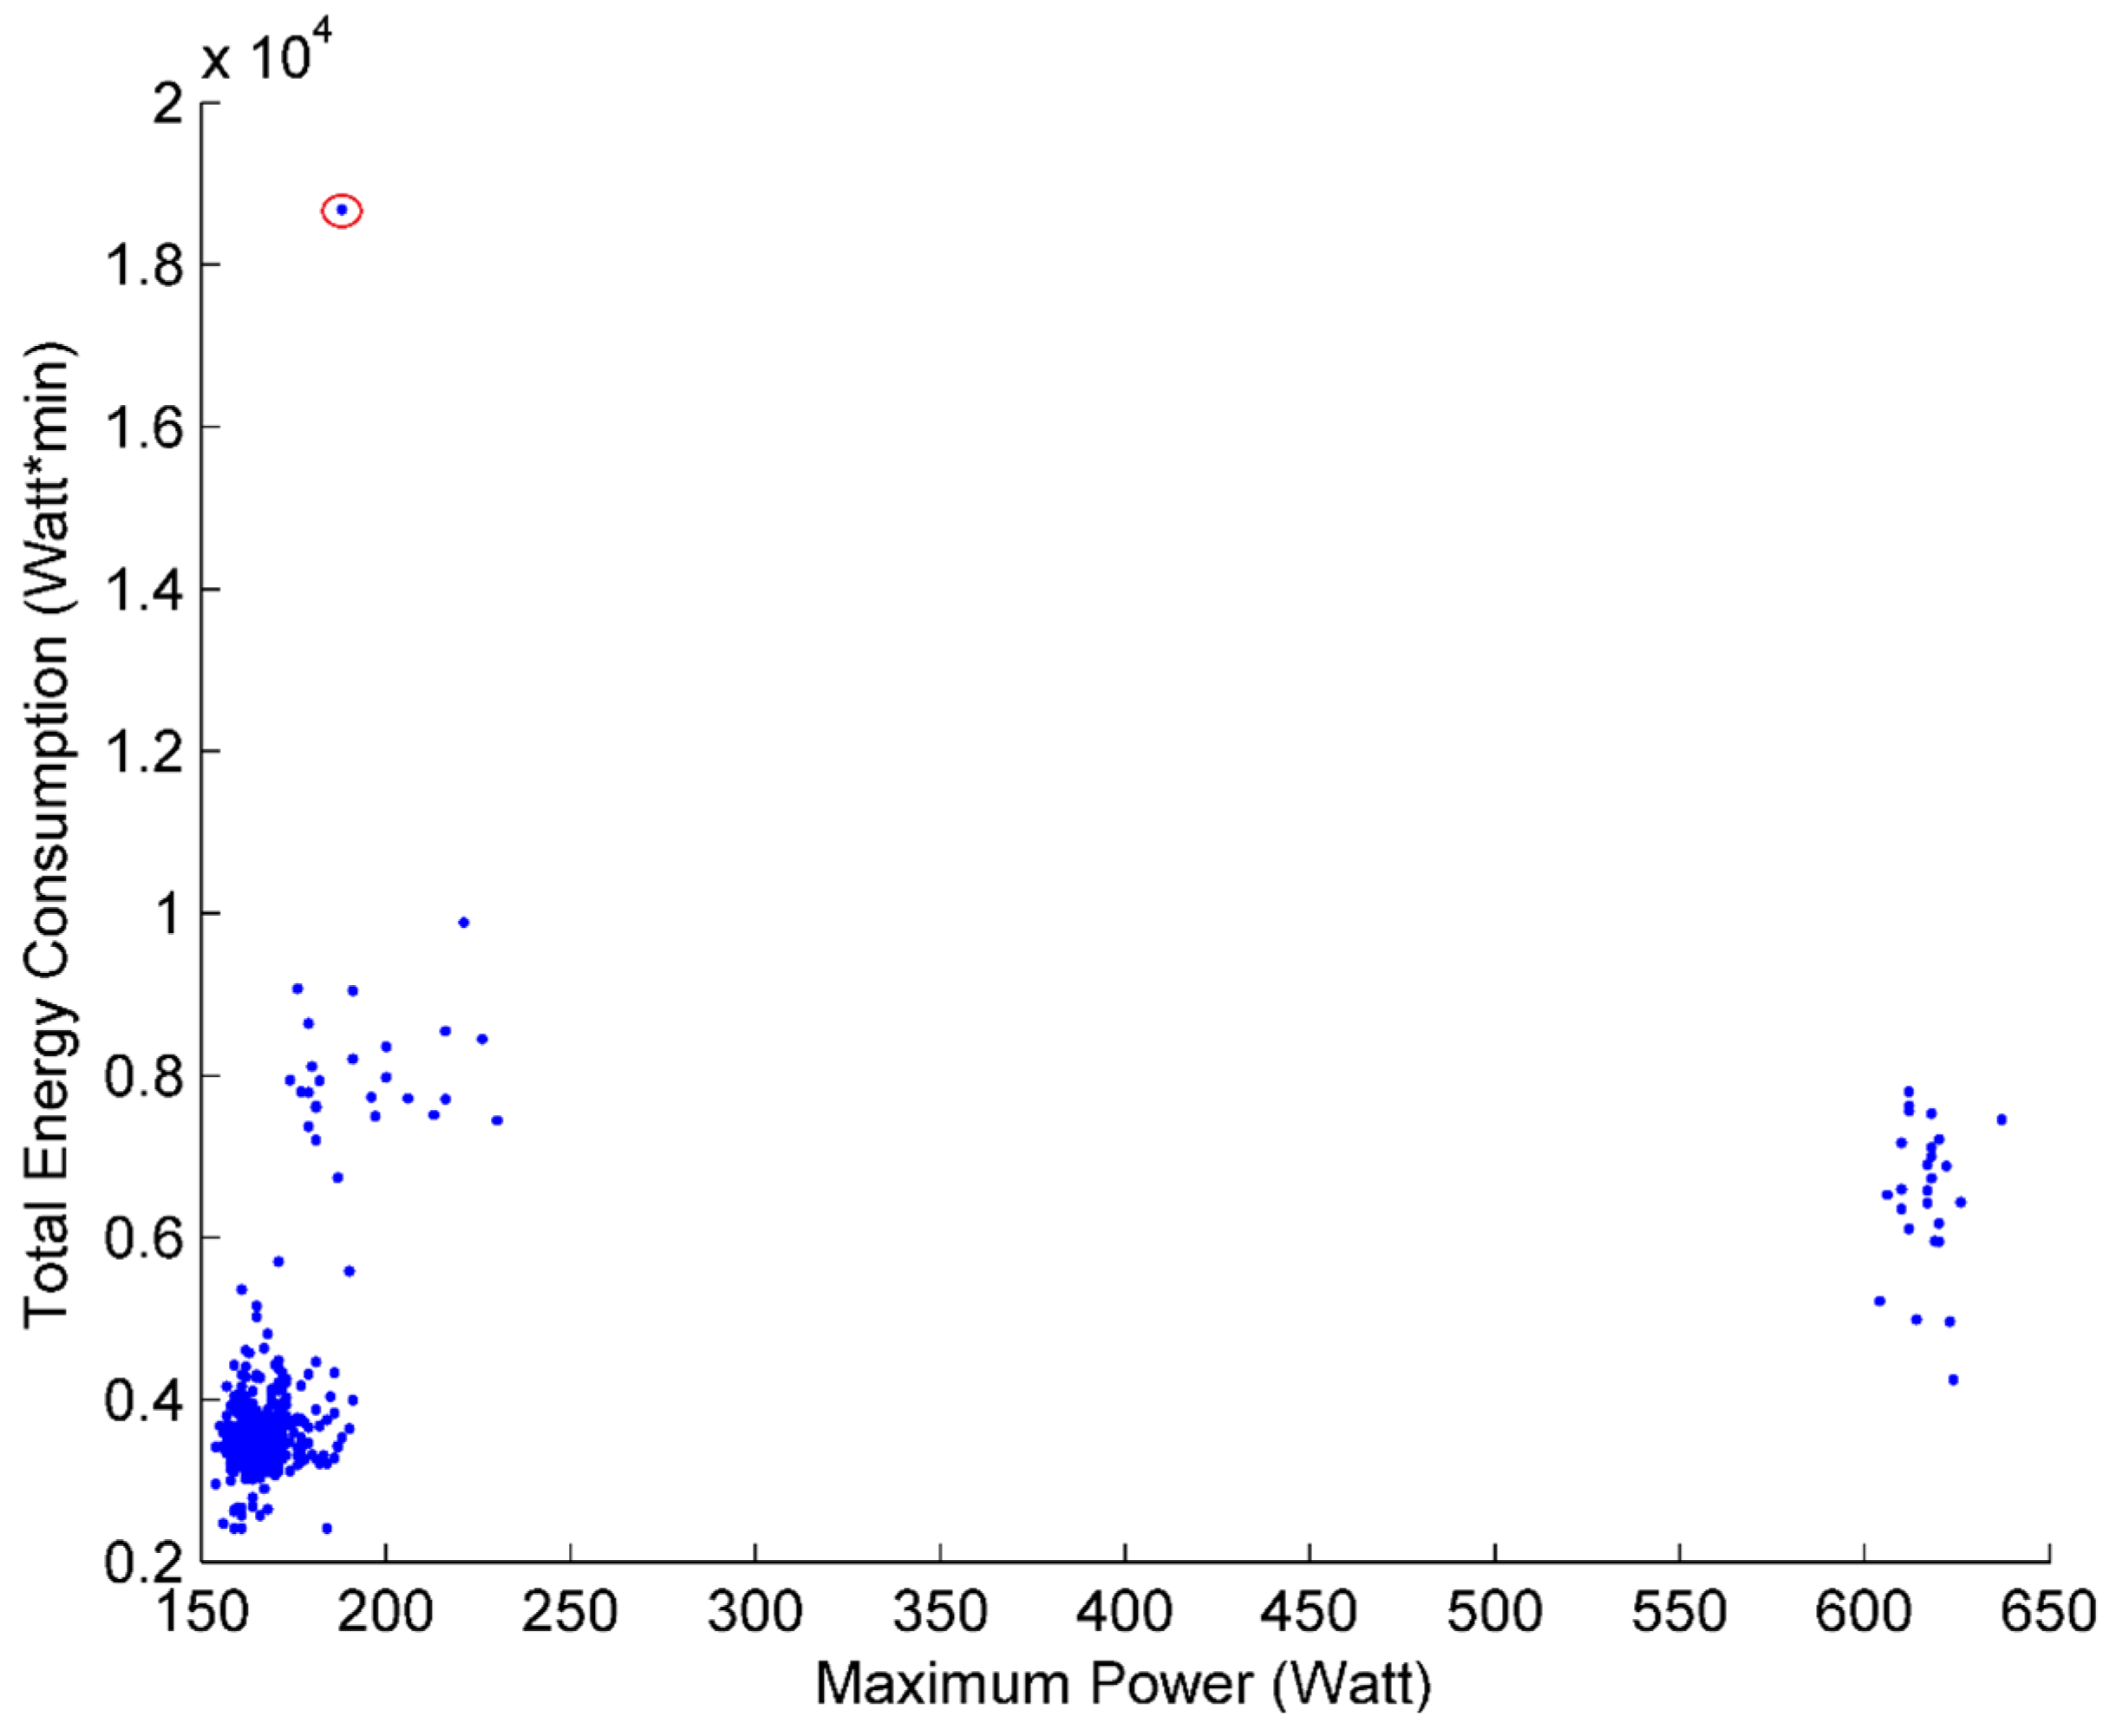
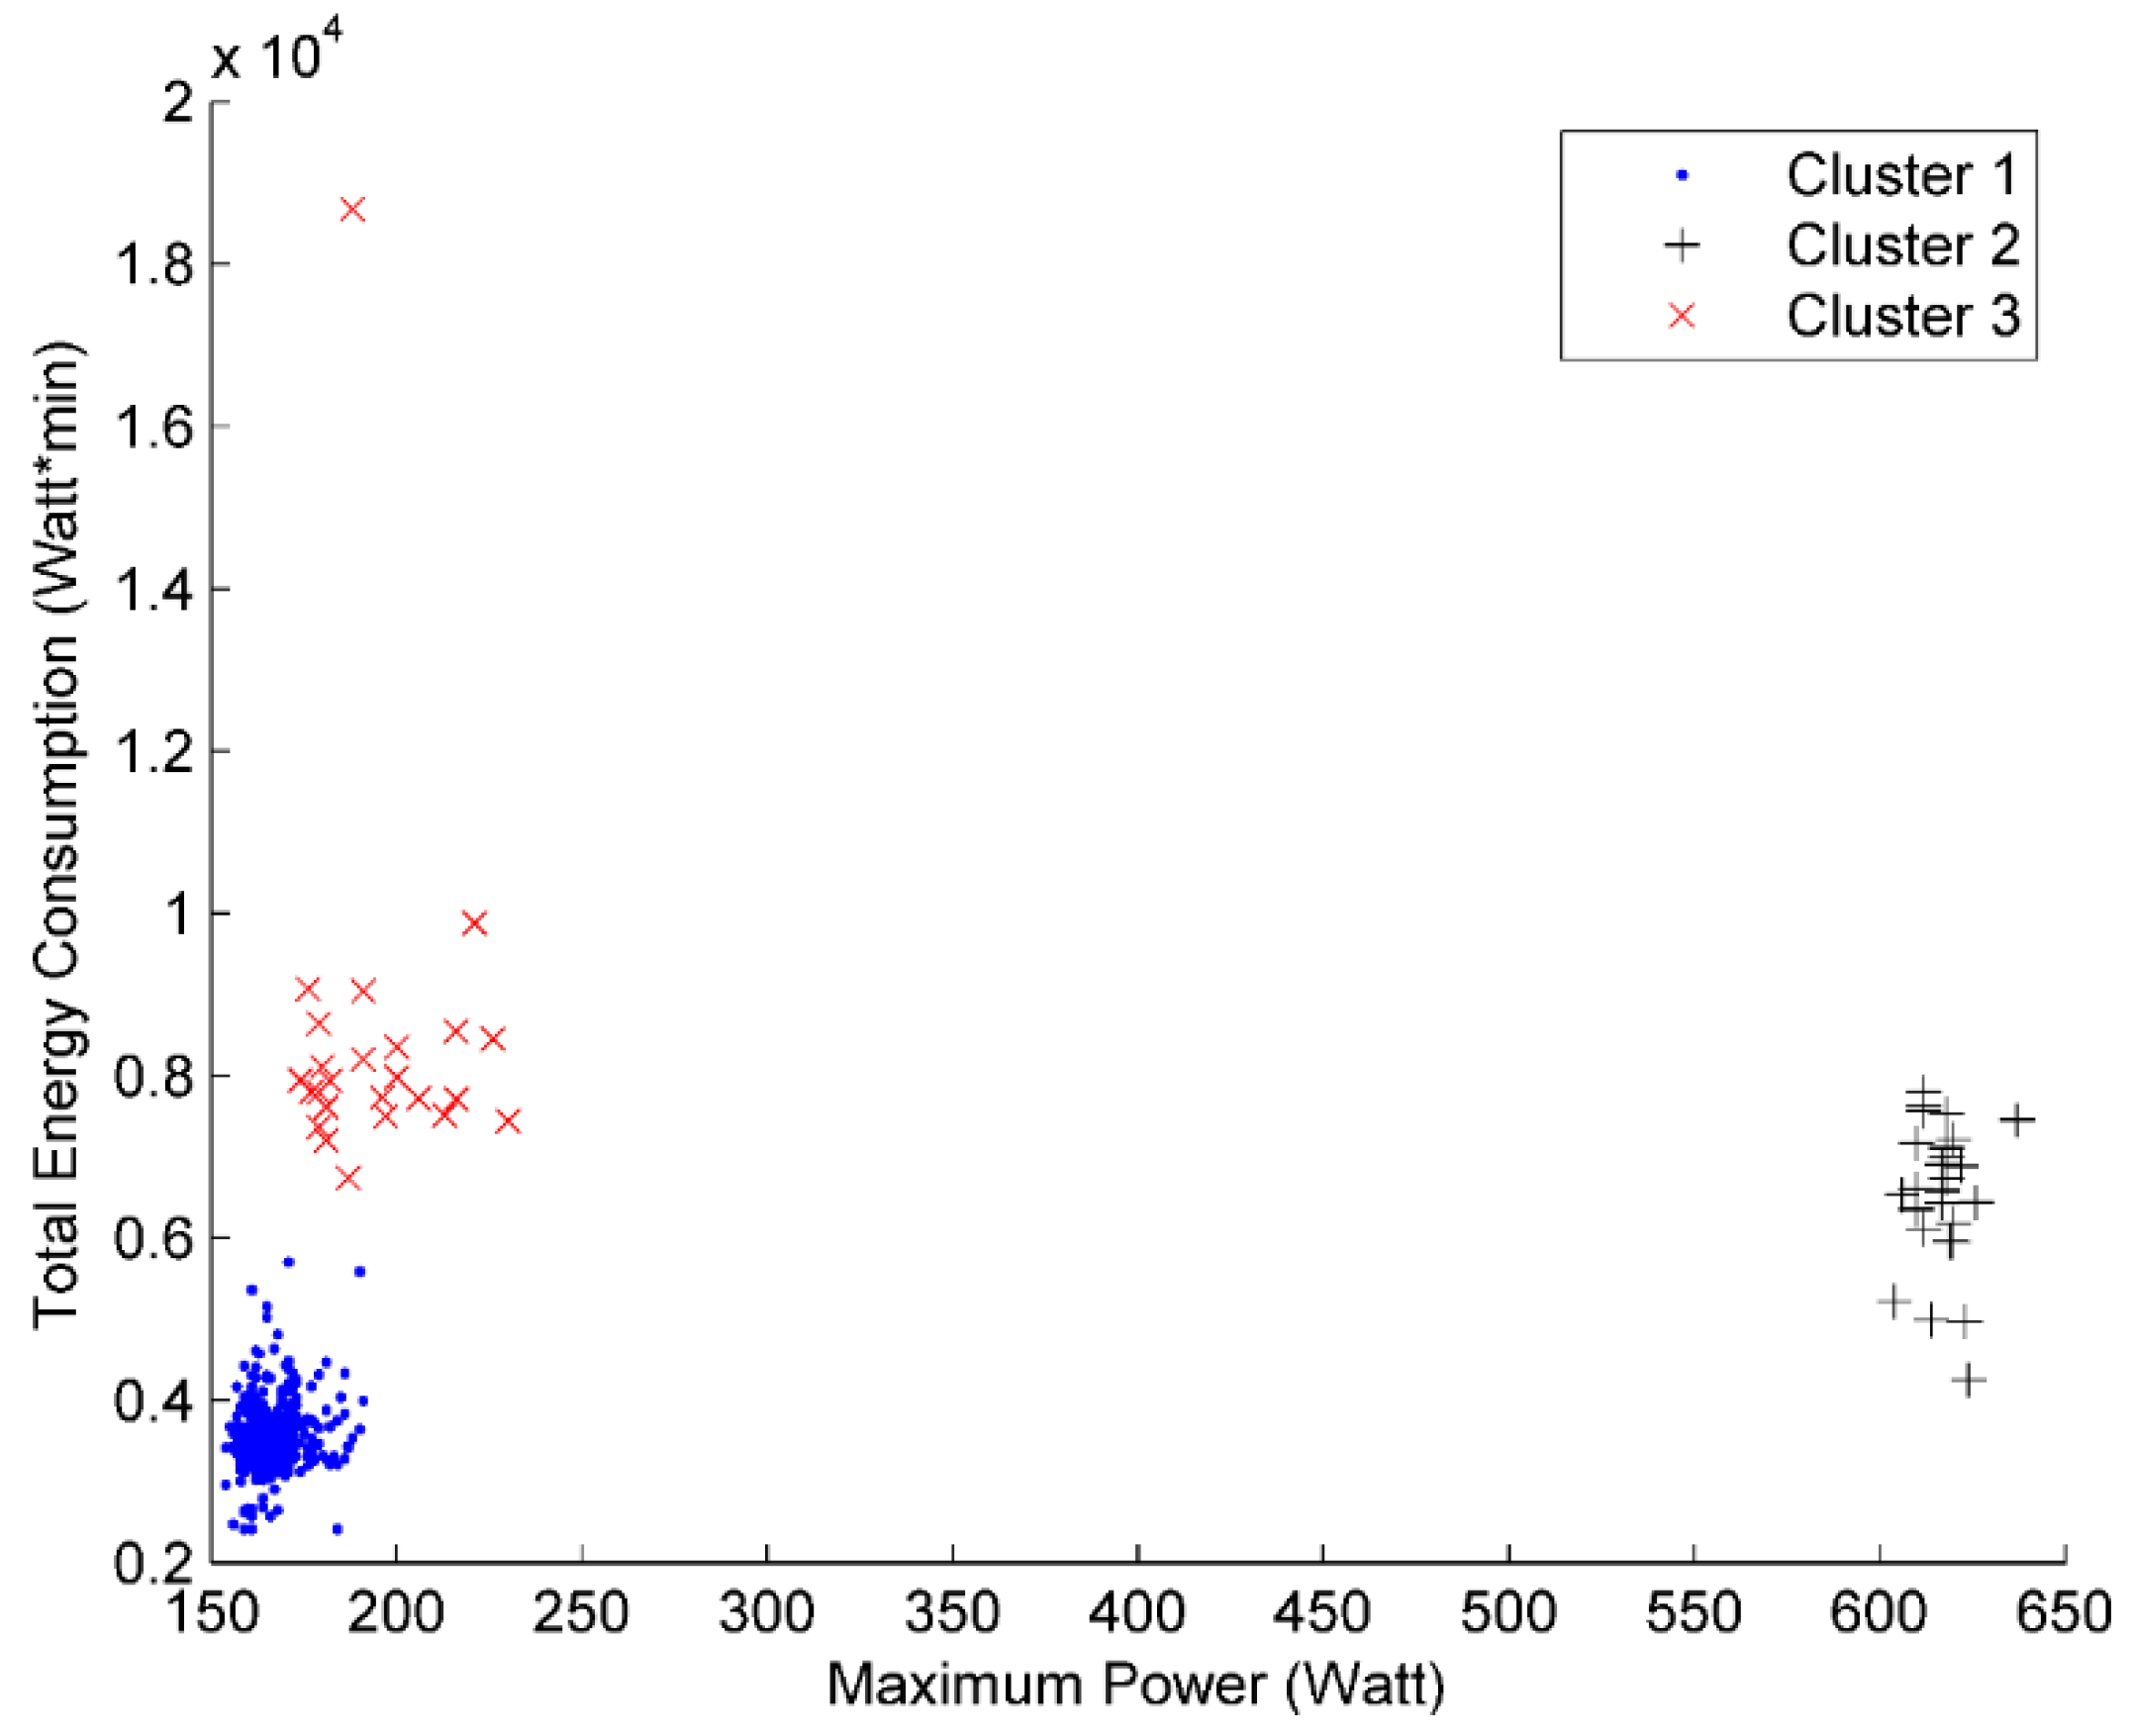
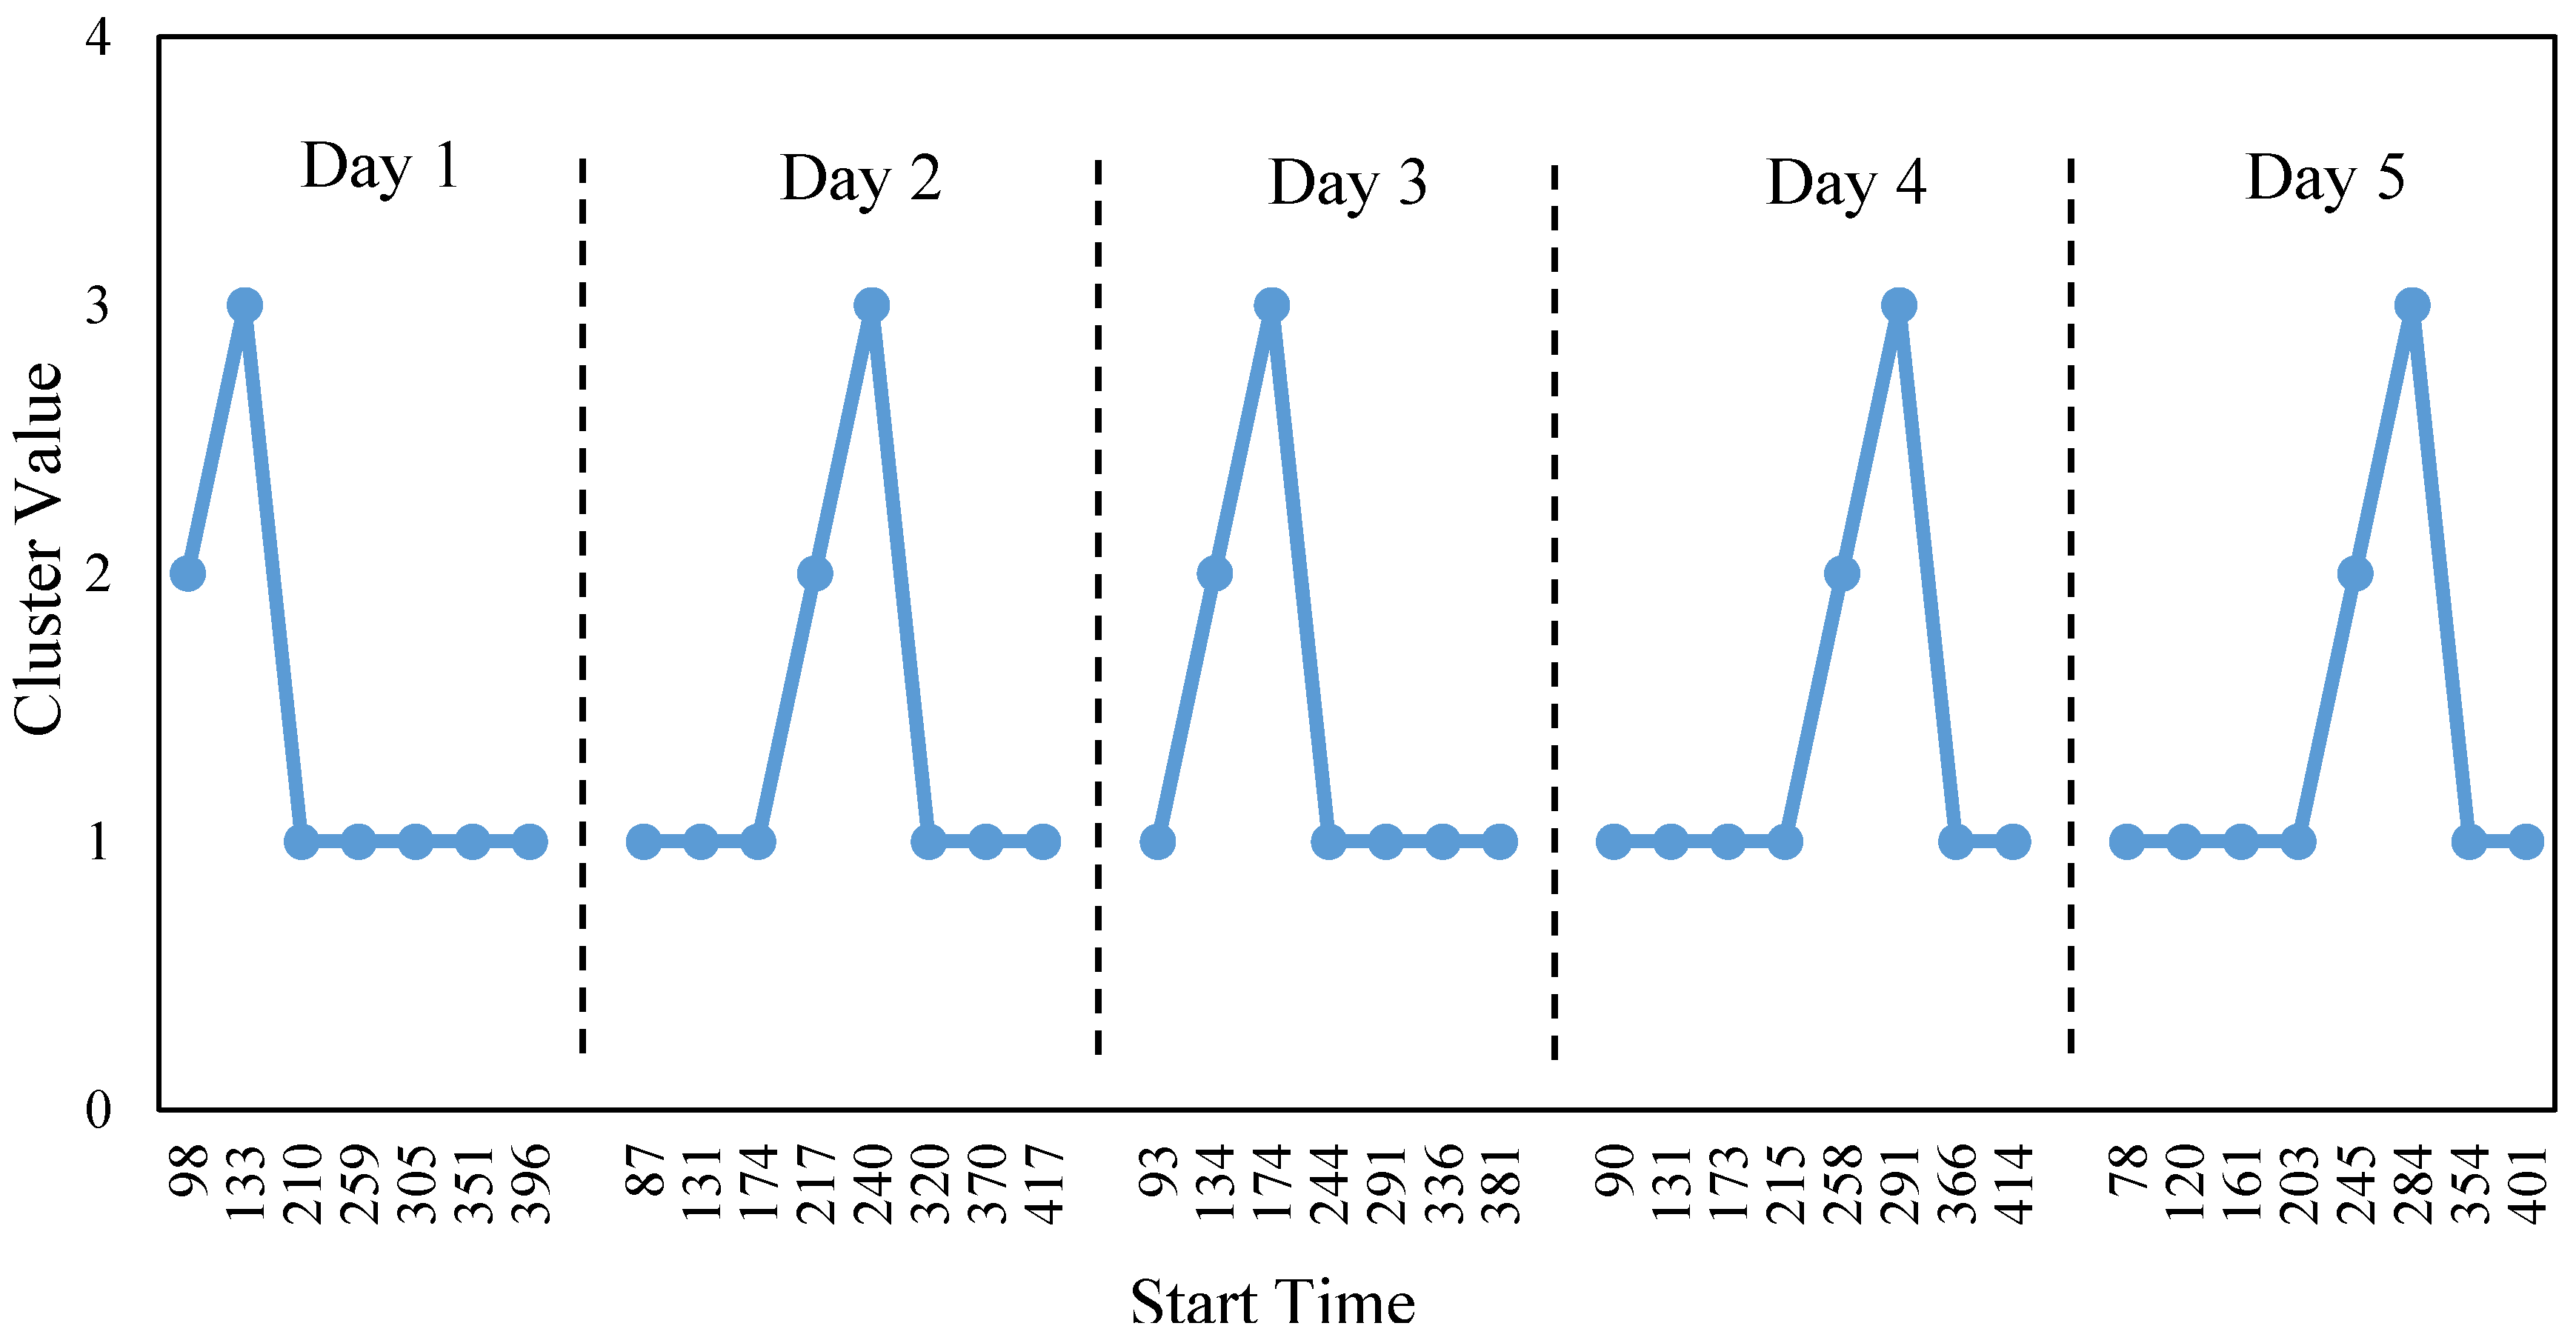
An unsupervised machine learning model is proposed to classify household appliances operation cycles. The model was developed using k-means clustering as the classification algorithm and silhouette coefficient as performance measurement. To link each cluster to the specific operation mode, an identification process considering cluster characteristics related to operation mode is also provided. To validate the proposed method, a case study was conducted by testing it on a typical household refrigerator. In the case study, two attributes namely, maximum power and total energy use for each operation cycle were used for the classification. The undisturbed operation cycles are classified into three clusters and the silhouette coefficient performance indicated that each cluster is compact and distinct from others. The classification result shows that the proposed classification method could partition different types of operation cycle rationally by selecting proper attributes. The identification results confirm that the undisturbed refrigerator operation cycles can be recognized by considering the operation characteristics as well as the sequential order between different clusters.
The results of the case study demonstrates that the proposed classification method is capable of classifying operational cycles of household appliances, which can assist users in understanding the operation conditions of the appliances. The proposed method is beneficial for Smart Grid system as it provides a solution for the monitor to understand the way of operation of each appliances. In addition, the energy efficiency related index of each cluster, such as maximum power, total energy use, run time, and idle time can be used for refrigerator energy efficiency evaluation and fault detection. The identification of different operation cycles is significant in the research area of establishing appliance load profile, anticipating peak load, and intelligent control. Future work will focus on the research of pattern recognition for disturbed refrigerator operation cycles in order to comprehend the household refrigerator’s energy performance and health, and subsequent integration with smart technologies.


