Article

Coordinated Charging Strategy for Electric Taxis in Temporal and Spatial Scale

1
National Active Distribution Network Technology Research Center (NANTEC), Beijing Jiaotong University, No. 3 Shang Yuan Cun, Haidian District, Beijing 100044, China
2
Collaborative Innovation Center of Electric Vehicles in Beijing, No. 3 Shang Yuan Cun, Haidian District, Beijing 100044, China
*
Author to whom correspondence should be addressed.
Energies 2015, 8(2), 1256-1272; https://doi.org/10.3390/en8021256
Submission received: 5 December 2014 / Revised: 20 January 2015 / Accepted: 29 January 2015 / Published: 5 February 2015
(This article belongs to the Special Issue Electrical Power and Energy Systems for Transportation Applications)

Abstract

:
Currently, electric taxis have been deployed in many cities of China. However, the charging unbalance in both temporal and spatial scale has become a rising problem, which leads to low charging efficiency or charging congestion in different stations or time periods. This paper presents a multi-objective coordinated charging strategy for electric taxis in the temporal and spatial scale. That is, the objectives are maximizing the utilization efficiency of charging facilities, minimizing the load unbalance of the regional power system and minimizing the customers’ cost. Besides, the basic configuration of a charging station and operation rules of electric taxis would be the constraints. To tackle this multi-objective optimizing problems, a fuzzy mathematical method has been utilized to transfer the multi-objective optimization to a single optimization issue, and furthermore, the Improved Particle Swarm Optimization (IPSO) Algorithm has been used to solve the optimization problem. Moreover, simulation cases are carried out, Case 1 is the original charging procedure, and Cases 2 and 3 are the temporal and spatial scale optimized separately, followed with Case 4, the combined coordinated charging. The simulation shows the significant improvement in charging facilities efficiency and users’ benefits, as well as the better dispatching of electric taxis’ charging loads.

1. Introduction

In recent years, Electric Vehicle (EV) technologies have developed rapidly with the high attention from governments all over the world. In China, the government document, Energy Saving and New Energy Vehicles Industry Development Planning (2011–2020), put forward that the number of EVs should reach 5 million in 2020, and according to the research report from the Ministry of Industry and Information Technology, the figure is predicted to be 60 million in 2030 [1]. At the same time, with the development of the EV industry, related charging facilities must be built to meet the anticipated significantly increased charging demand. There are also many local plans for the construction of charging stations, chargers and intelligent charging service system, such as in Beijing, Shenzhen.
As pioneers, electric buses and electric taxis are first to be demonstrated for utilization of EVs. In Shenzhen, an EV charging network has been set up with electric buses, electric taxis, charging stations and related charging services.
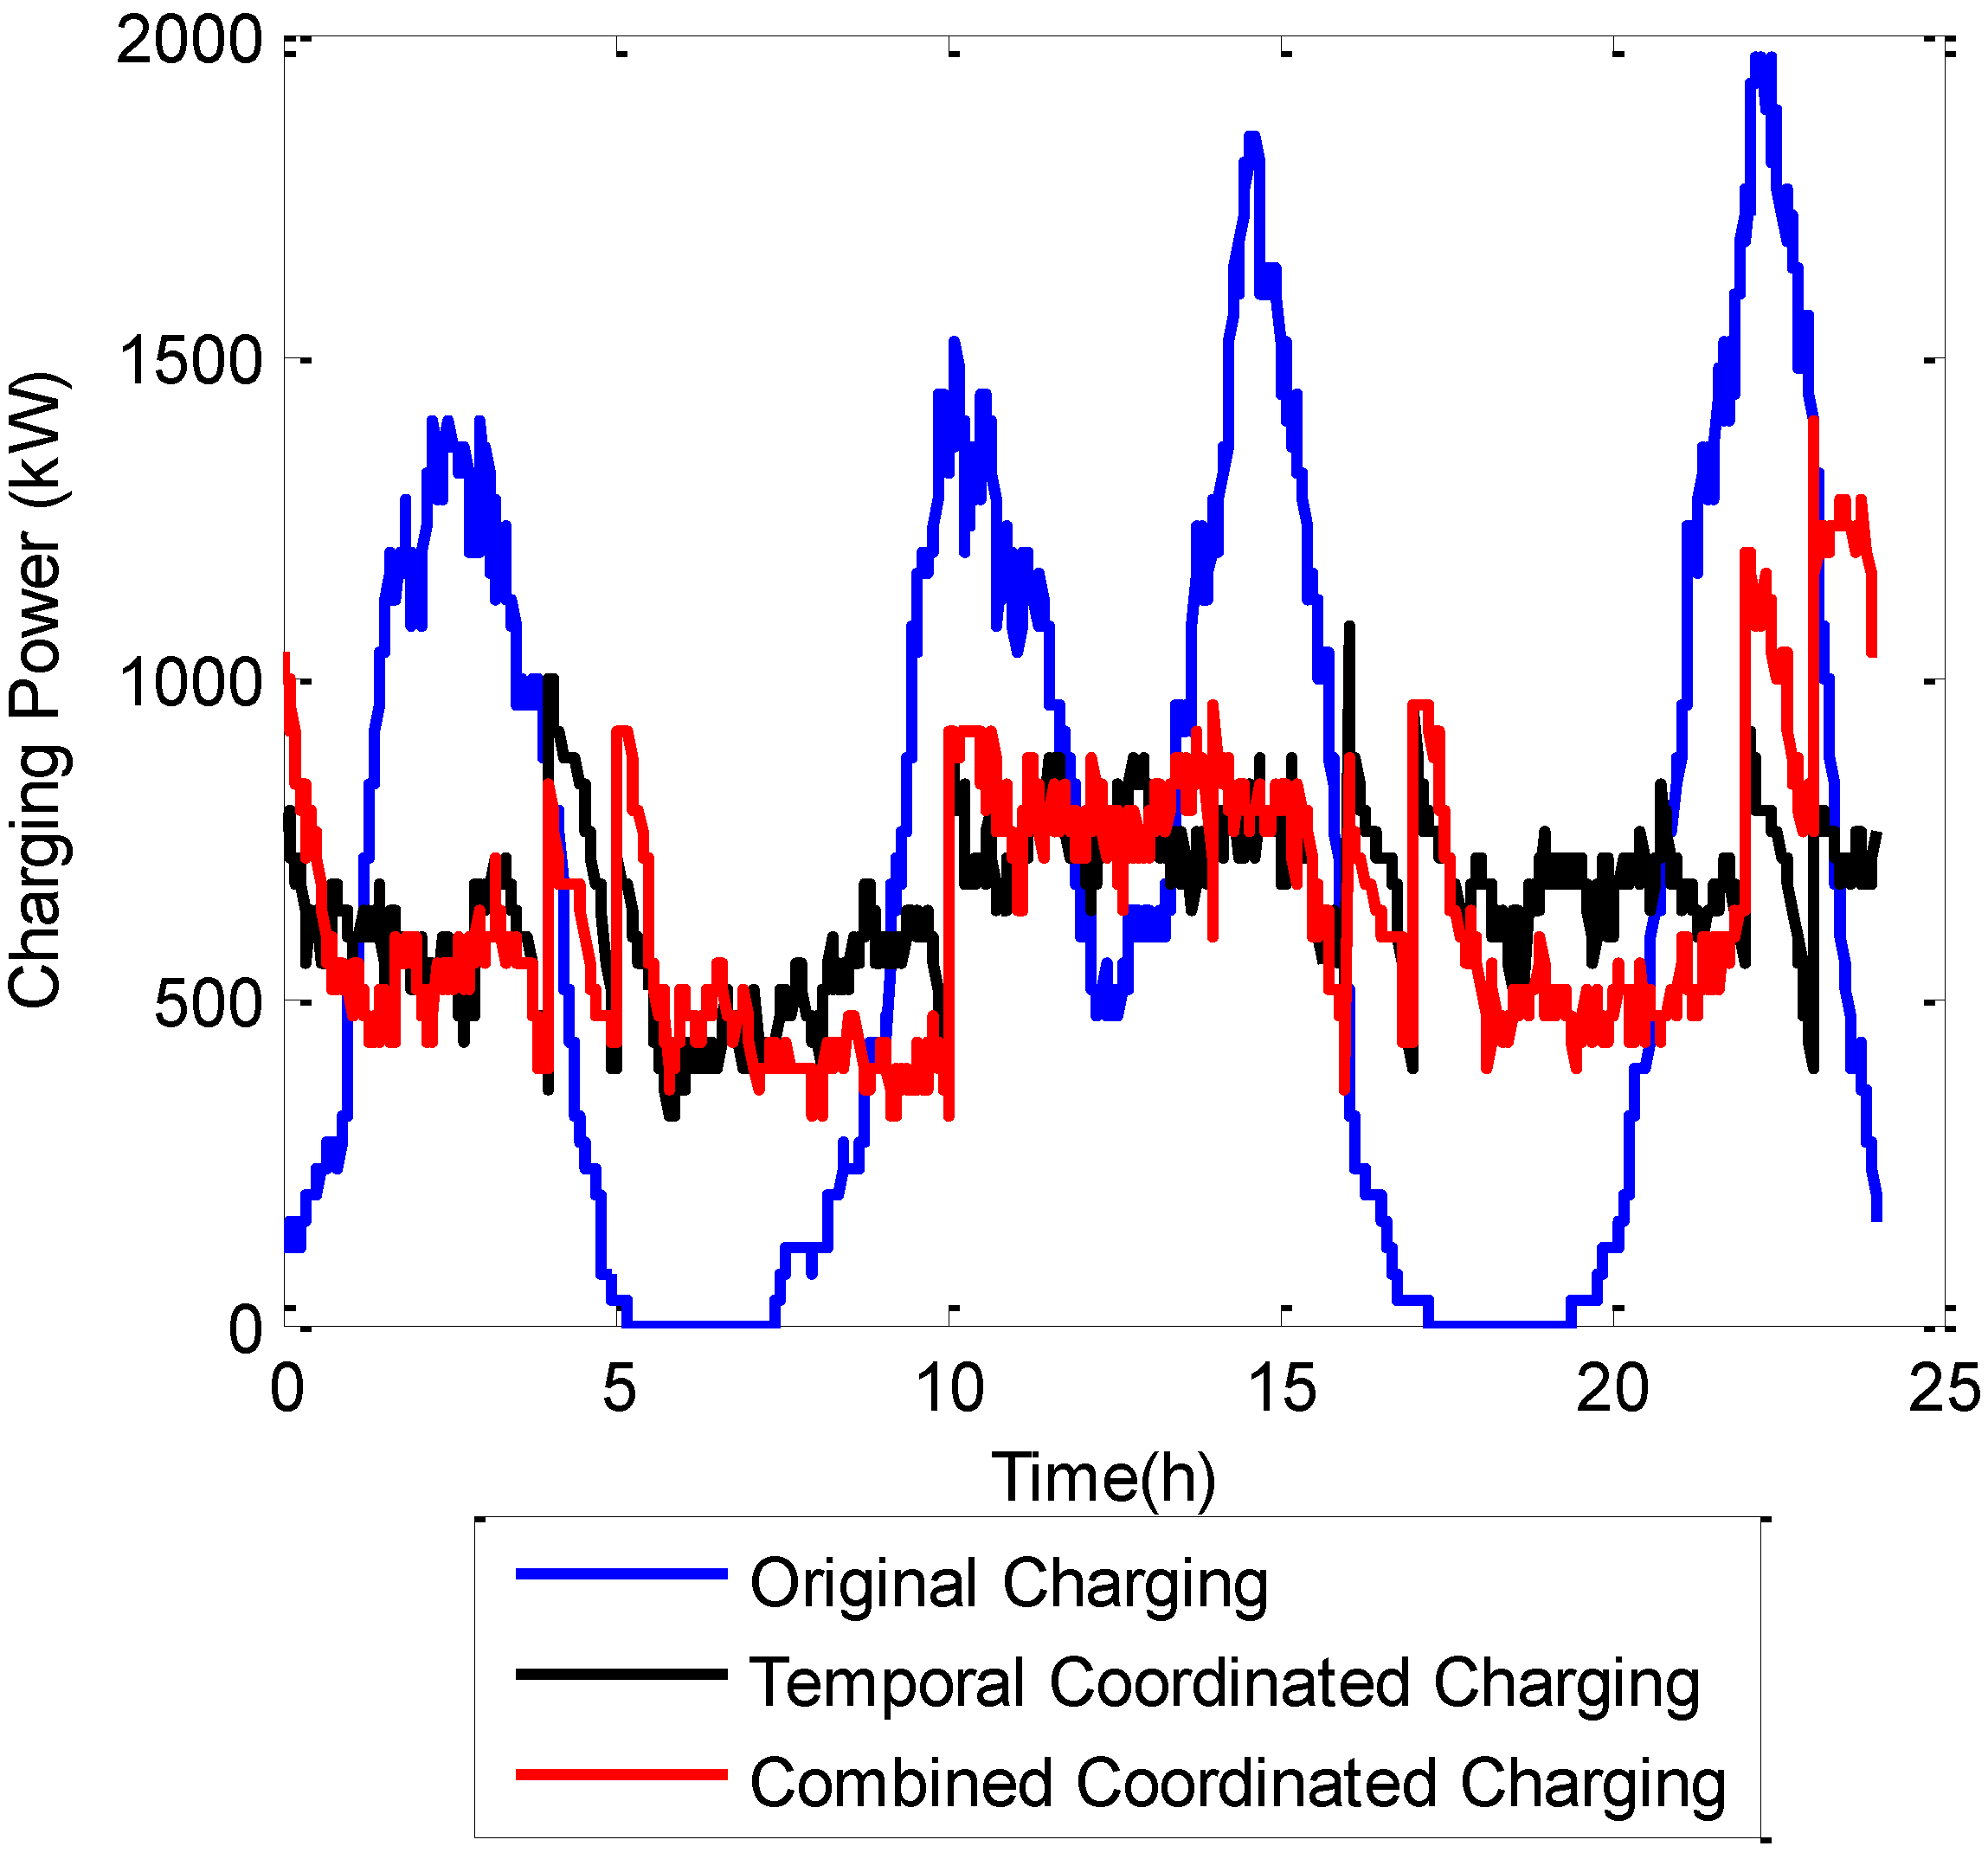
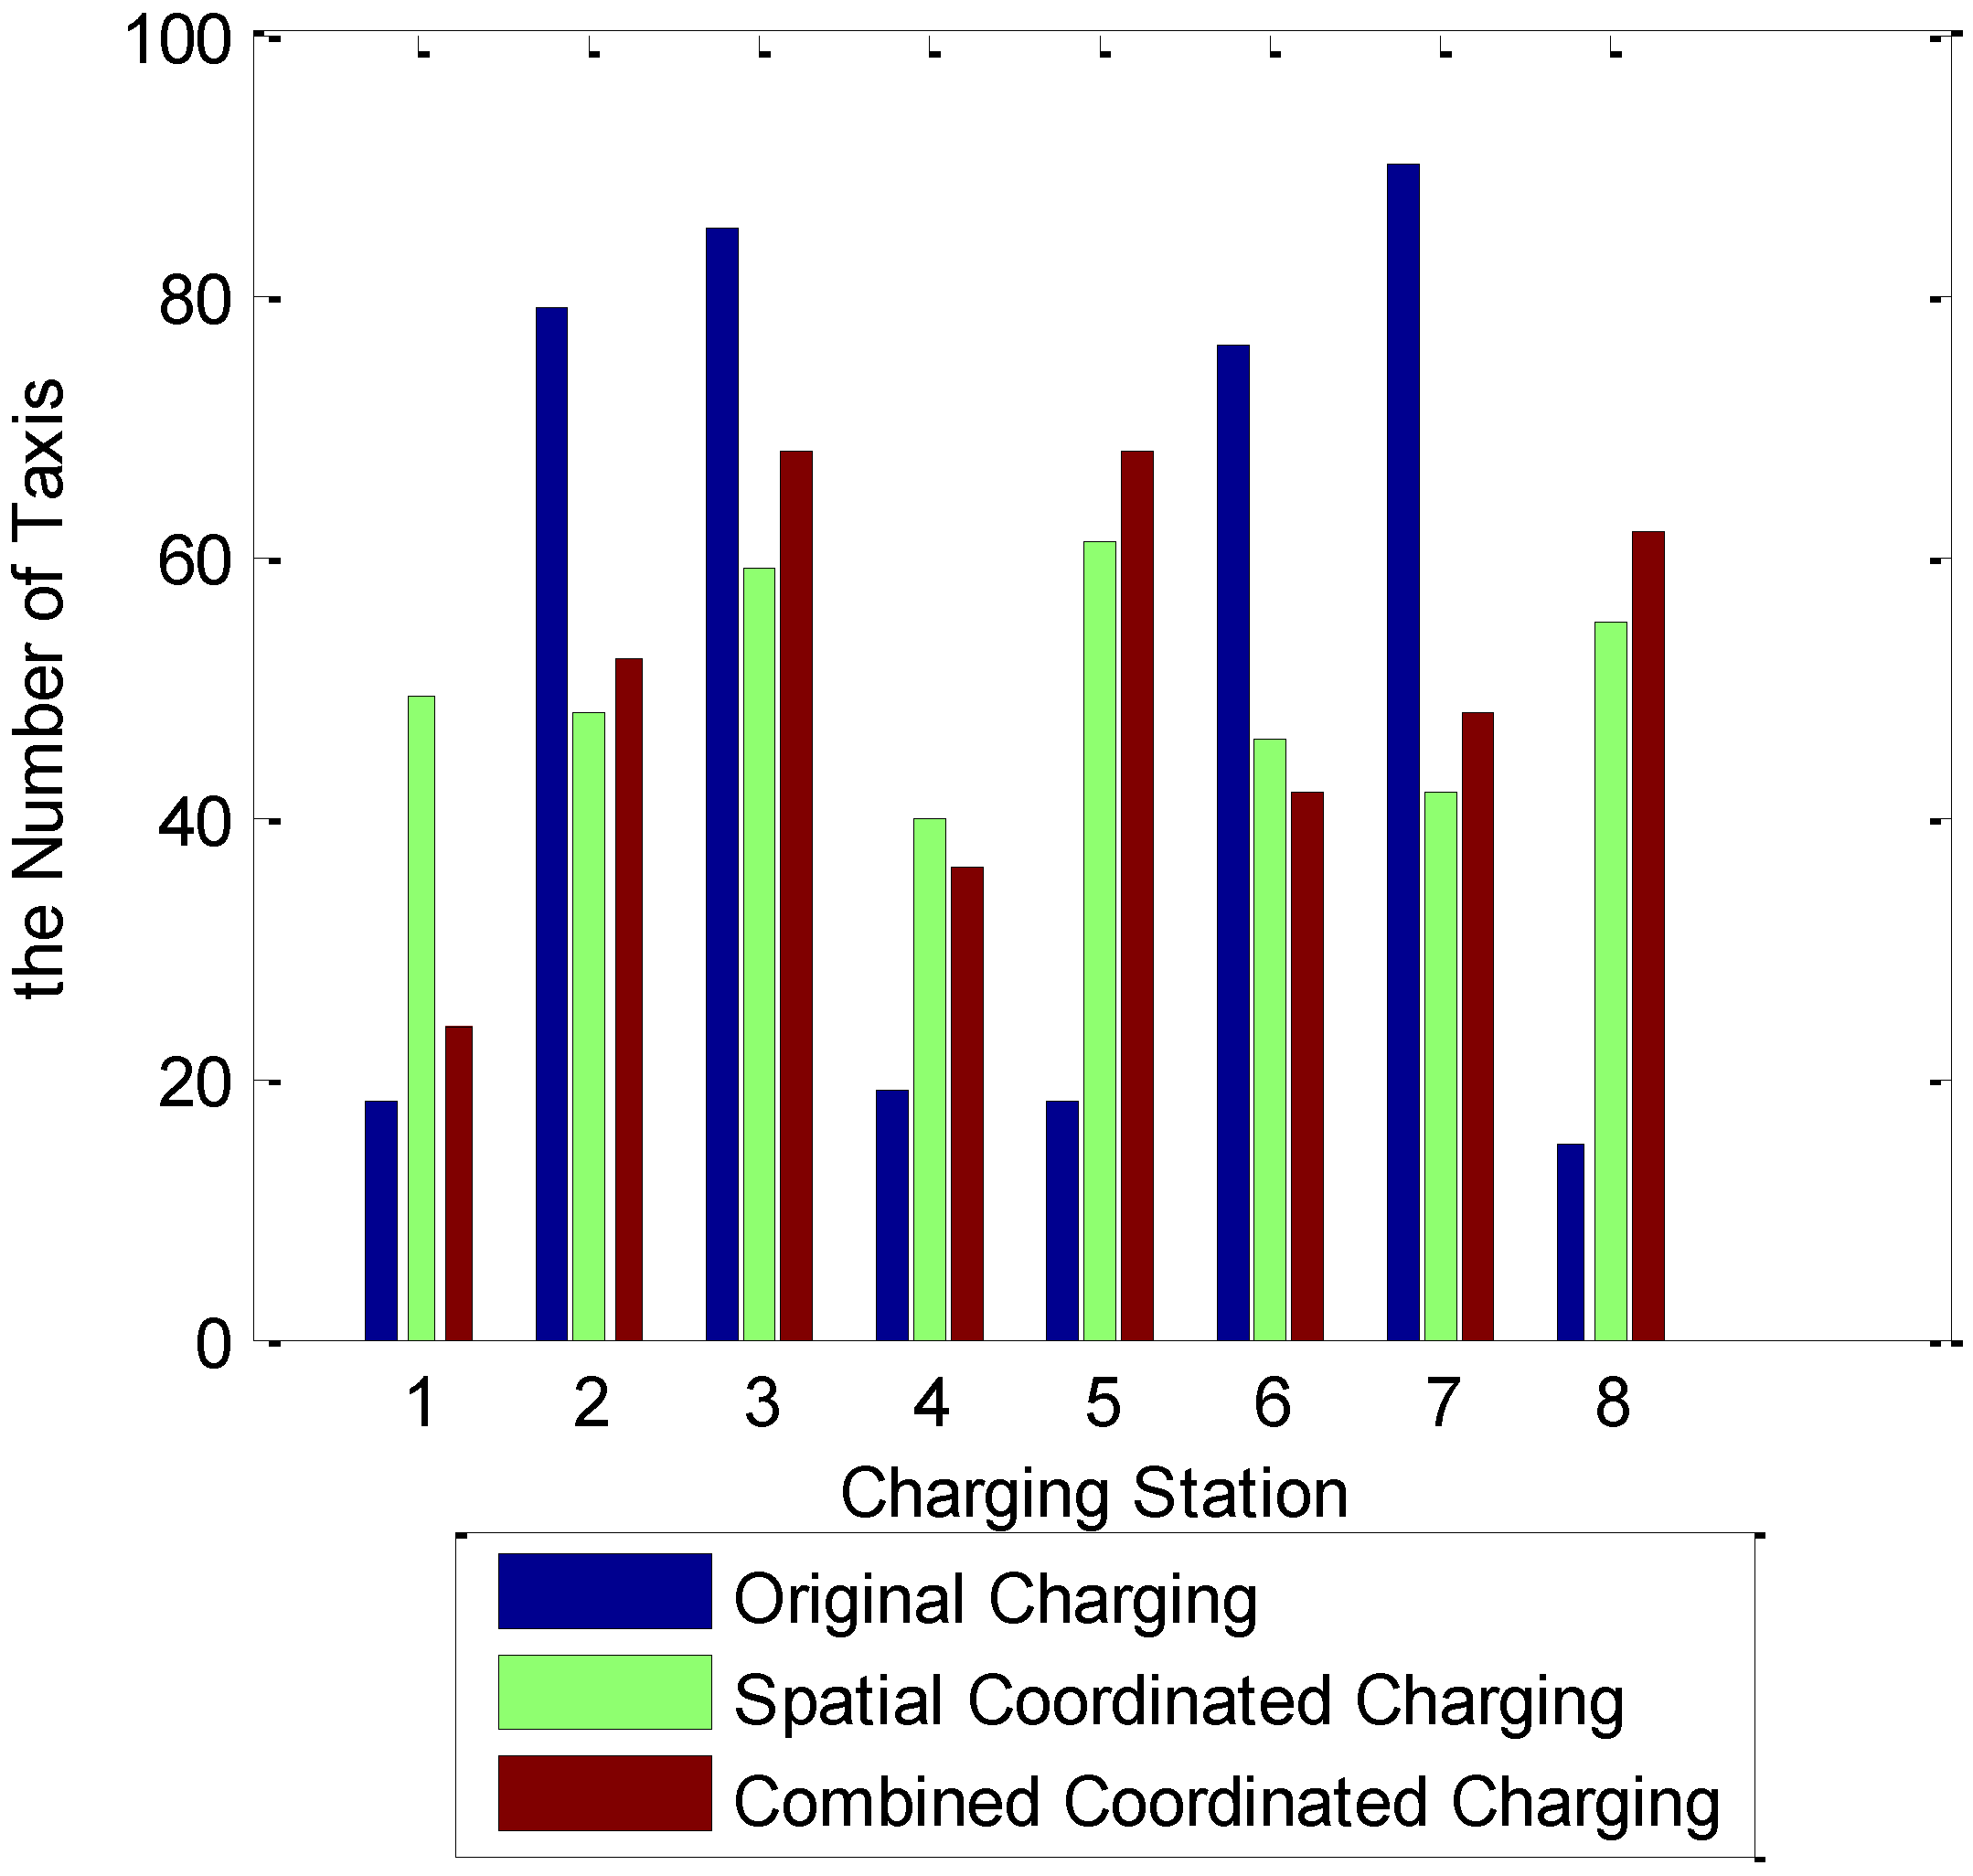
In this paper, only electric taxis are considered. After running for a while, some issues have arisen with the operation of electric taxis. According to investigation of operational data from Shenzhen, taxi drivers work two shifts, one for day-time, the other for night. The shift-swapping time and position are not strict, but are usually around 5:00/17:00 and somewhere near the drivers’ places. In terms of the hidden rules that electric taxis should start with full State of Charge (SOC), two charging peaks occur before the work shifts. Moreover, charging twice is not enough to operate for the whole day, and another two charges are needed during the operation periods. All of these facts result in four load peaks in the temporal scale. At the same time, unbalanced distribution in the spatial scale also arises for the reason that most drivers prefer the charging station to be near their places.
If the charging load distribution of EVs is unbalanced in either the temporal or spatial scale, the utilization efficiency of charging facilities will be much lower. It may also trigger some relative load unbalance problems when EV load penetration gets higher, for example, more charging costs for drivers and more feeder losses in regional power systems.
Some researchers have proposed some charging strategies to solve similar electric taxi operation problems. In [2], with some investigation of EV taxi data from Shenzhen, the authors understood that the status (e.g., operational patterns, driver income and charging behaviors) of EV taxis can provide invaluable information to policy makers and studied the patterns from two aspects: operational behaviors and charging behaviors, but a rescheduling strategy was not proposed. In [3,4,5,6], the research group mainly focused on maximizing the profit to reach optimal charging for electric taxis, minimizing their charging cost in face of time-varying electricity prices and some pricing schemes for electric taxis to track the load profile, whose scope is mainly for cost or benefit optimization from a temporal perspective without consideration of the spatial scope. Besides, other work [7] proposed a facility optimization model to minimize the life circle cost (LCC) of charging/swapping facilities, the time value of electric taxis under the constraints of queuing model and the price spread between oil and electricity. A new dispatching policy also presented in [8] with consideration of the taxi demand, the remaining power of electrical taxis, and the availability of battery charging/switching stations in order to reduce the waiting time for power recharging and thus increase the workable hours for taxi drivers.
Most of the works above have a relatively narrow vision for electric taxis. In this paper, we summarize the problems of electric taxi operation to be on a temporal and spatial scale. Moreover, the issue of coordinated charging for electric taxis at both scales was modeled by using a multi-objective approach based on three separate objectives: maximizing the utilization efficiency of charging facilities, minimizing the load unbalance co-operated with the regional power system and minimizing the customers’ cost. Then the problem was solved by a fuzzy mathematical method and Improved PSO algorithm.
In summary, the originality of this paper, as well as the differences between the proposed strategy and the EV optimization in the literature, is: (i) in this paper, with the investigation of electric taxis operated in Shenzhen, most of the settings are assumed based on real operation data. The optimization formulation proposed is oriented to handle the practical problems arising from real electric taxi operation; (ii) in the previous research, electric taxi optimization was formulated for electricity cost, or for the charging facilities, or for the customer demands, but those studies only considered this issue from specific perspective. This paper proposes an integrated strategy for electric taxis’ coordinated charging, considering the charging facilities, charging load influence related to the regional power system and customers’ composite cost; and (iii) most previous research only considers the electric taxi optimization problem from a time perspective. This paper explored the electric taxi charging problem with different visions, with a temporal, spatial and combined scope, so the new strategy involves the solution of a multi-objective and multi-scale constrained optimization model for coordinated charging.
Furthermore, we focused mainly on coordinated charging for electric taxis. However, the proposed procedure can also be extended easily to other types of EV users, e.g., commuting EVs charging at stations. The remainder of this paper is organized as follows: Section 2 formulates our coordinated charging model and shows the strategy proposed for solving the mentioned charging problem; Section 3 presents the mathematical methodology to solve the proposed model, fuzzy method and Improved PSO algorithm. Our simulations for different cases are presented in Section 4. Section 5 summarizes the conclusions.

2. Coordinated Charging Strategy

In this paper, the proposed strategy is oriented to tackle the unbalance problem in the temporal and spatial domain. 
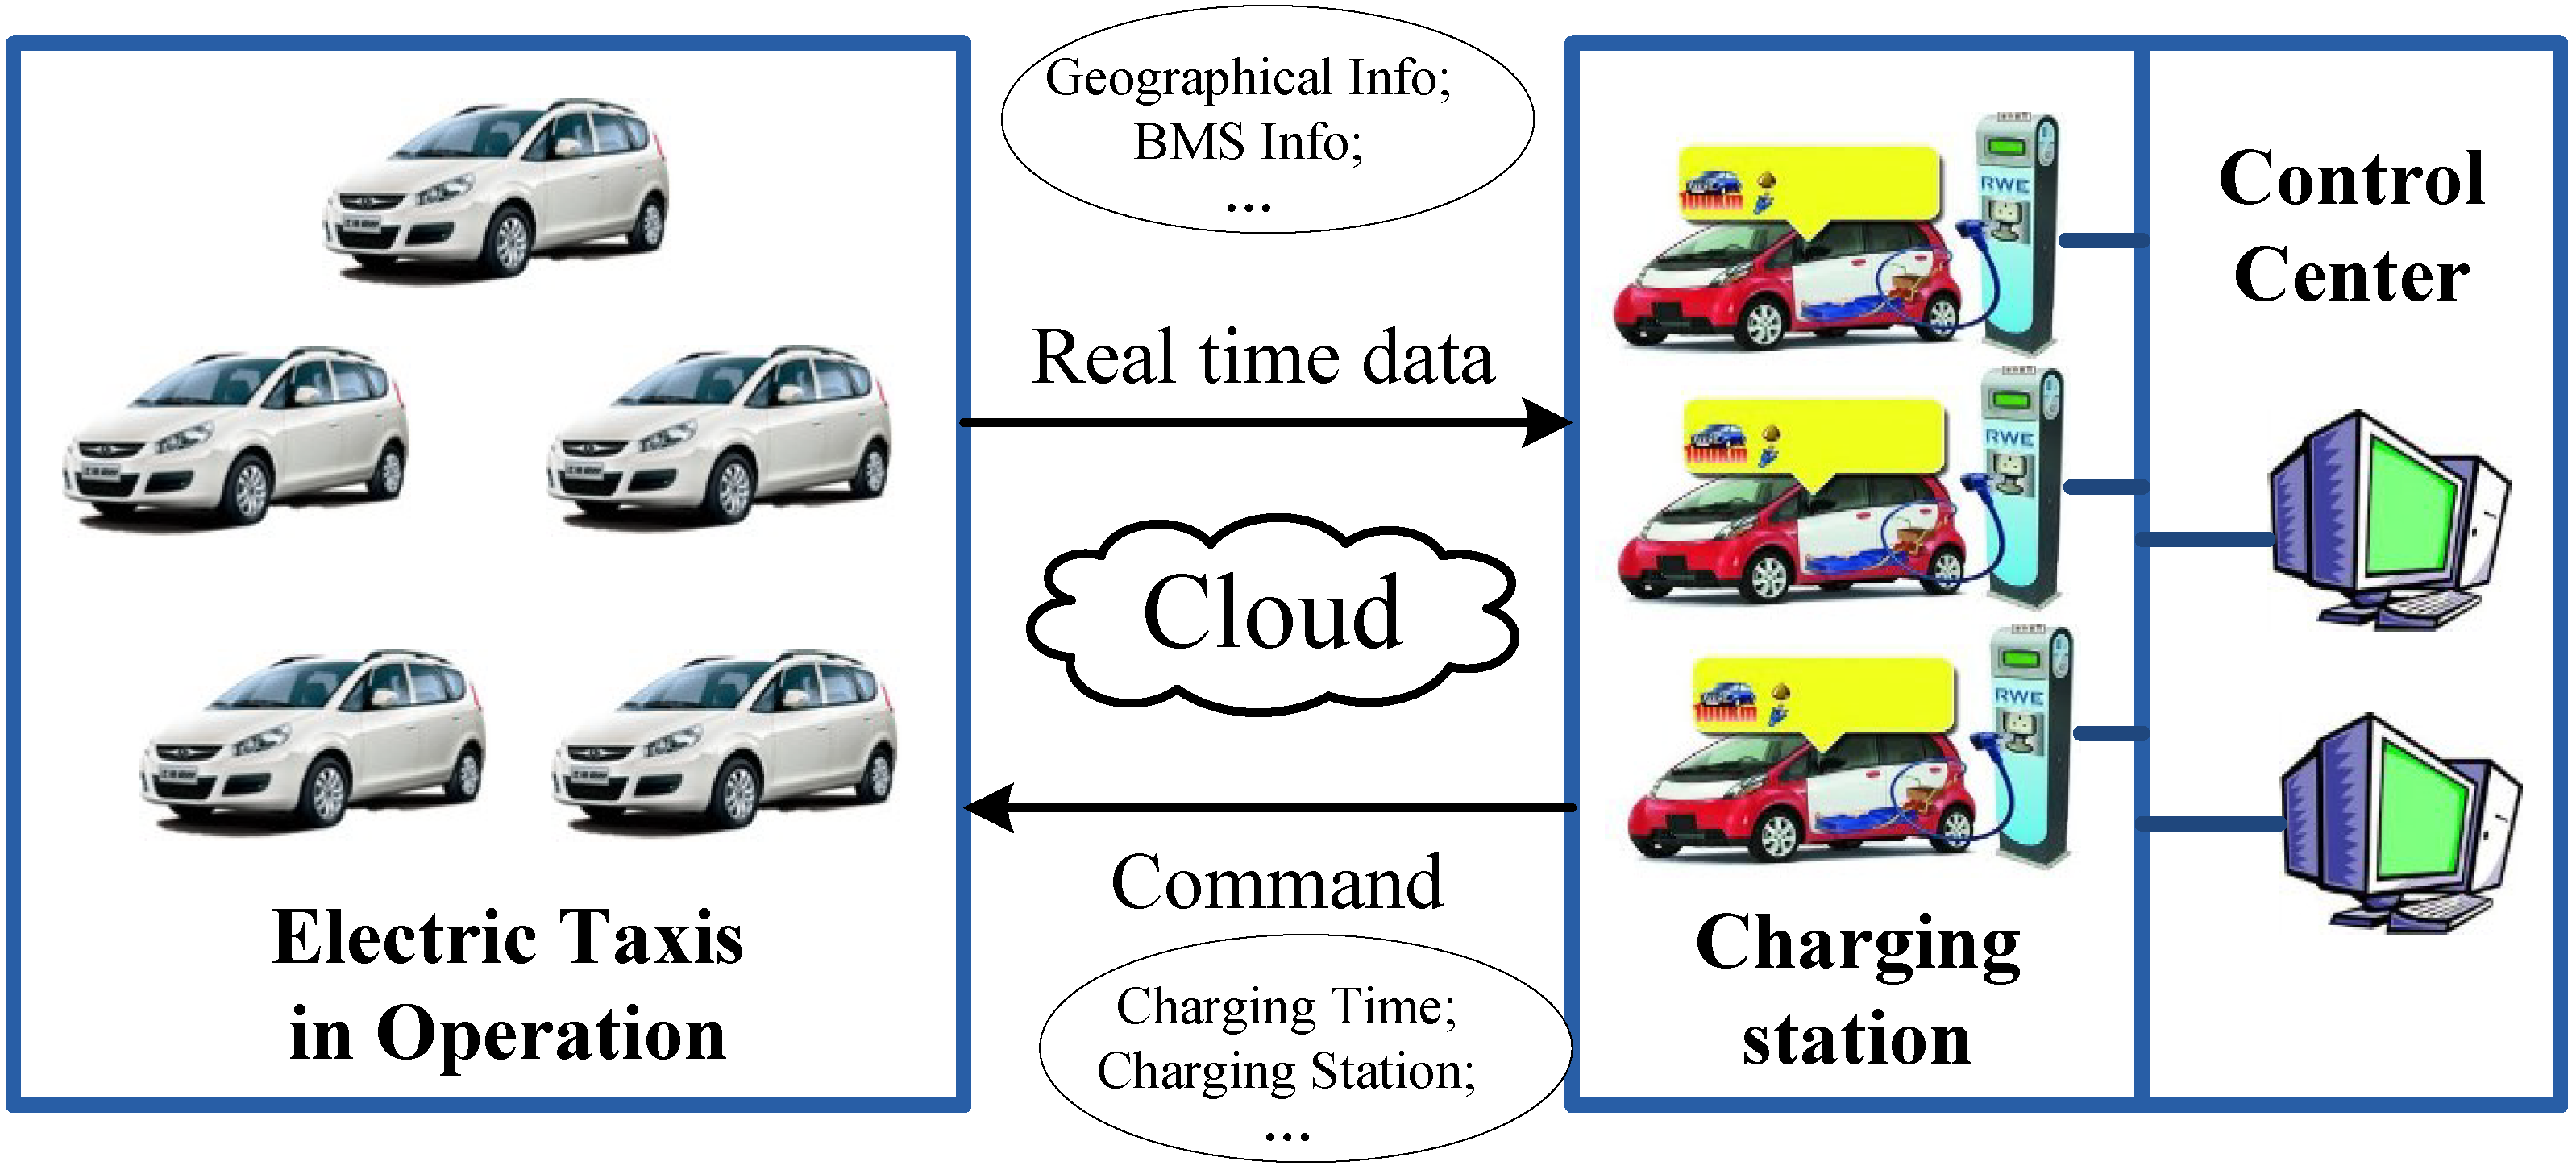
Figure 1 shows the relationship and communication between electric taxis and charging stations. Electric taxis would send the real time data to a charging station through 3G/4G, including geographical information, battery management information and operation information. The charging station would send the command of the time and station to charge for each electric taxi after the optimization procedure.
The main purpose of the coordinated charging for electric taxis is to determine the optimal time and the optimal station to charge. More preciously, for coordinated charging in the temporal scale, the objective is to seek the best time period to charge; and for coordinated charging in the spatial scale, the objective is to find the best station to charge. The coordinated charging variable, the time period and station to charge, would be optimized under minimizing or maximizing one or more objective functions while satisfying the several equality and inequality constraints. Its mathematical model can established as:
Min f ( x ) s . t . g ( x ) = 0 , h ( x ) 0
where, f is the objective function to be optimized; g and h are the equality and inequality constrains, respectively; x is the vector of time or station selection variable.
Figure 1. Framework of charging station and electric taxis.
Energies 08 01256 g001
In this paper, three optimization objectives are put forward for electric taxis’ coordinated charging, including maximizing the utilization efficiency of charging facilities, minimizing the load unbalance in the regional power system and minimizing the customers’ cost. Their mathematical models and constraints are described as follows.

2.1. Objective Functions

2.1.1. Maximizing the Utilization Efficiency of Charging Facilities

In terms of the operation characteristics of electric taxis, the unbalanced utilization of charging equipment leads to most electric taxis turning to charge at a certain period of time or at a certain station, which reduces the temporal and spatial utilization rate of the charging equipment. From the perspective of charging station operators, in order to improve the utilization efficiency of charging infrastructure in temporal and spatial scale, a scheme should be proposed to average the temporal and spatial characteristic of charging behaviors, which is shown as below:
Time: F 1 , time = min t = 1 T ( m = 1 M x m , t P m 1 T t = 1 T m = 1 M t x m , t P m ) 2
Space : F 1 , space = min n = 1 N ( m = 1 M x m , n P m C n j = 1 N C n m = 1 M x m , n P m ) 2
t = 1 , 2 , ... , T ; m = 1 , 2 , ... , M ; n = 1 , 2 , ... , N ; where, M and N is the number of electric taxis and stations in this region, respectively; T is the simulation duration; xm,t and xm,n are the selection variable for temporal and spatial optimization. Besides, Pm is the charging power of electric taxi m; and Cn is the number of chargers in charging station n.

2.1.2. Minimizing the Load Unbalance in the Regional Power System

The unbalanced charging load will also lead to an uneven distribution in the regional power system in both the temporal and spatial scale. The corresponding bad side impact is higher power losses that are one of the most important issues for power system operation. By this means, minimizing power losses is also considered to be an objective, shown as below:
Time : F 2 , time = min t = 1 T ( P loss , t 2 + Q loss , t 2 )
Space : F 2 , space = min n b r h = 1 N b r h ( P loss , n brh 2 + Q loss , n brh 2 )
where, Ploss and Qloss are the active and reactive power loss and t and nbrh are the time point and branch number, respectively.
However, to obtain Ploss and Qloss, the power flow calculation should be involved, which would severely delay the calculation speed for optimization. Additionally, Qloss is usually neglected after the power factor correction. To simplify the model, based on the conclusions shown in [9,10] that the power losses are approximately linearly related to load variance in a radial power system, we extended load variance from the temporal scale to the spatial scale, and use this value to estimate power losses in the regional power system:
Time : F 2 , time = min t = 1 T ( P t P ¯ T ) 2
Space : F 2 , space = min n bus = 1 N bus ( P n bus P ¯ N bus ) 2
where, P t and P n bus are the active load of regional power system in period t; active load of nbus, respectively. Besides, P ¯ T and P ¯ N bus are the average active power in the corresponding scale.

2.1.3. Minimizing the Customers’ Cost

Electric taxis are operated for making profits, however, the charging cost is one of the basic costs for electric taxis, just like the oil expense for fuel vehicles. Besides, the charging procedure, which needs at least two hours with 1/2C charging rate from 0% to 100% Battery State of Charge (SOC), is not like refilling the oil. In this way, the time cost (the charging time and the time waiting to charge) and travel cost (travel to charging station) are also involved into the cost function, which is depicted below,
F 3 = min C time + C travel + C utility
where, Ctime, Ctravel and Cutility are the cost of time, travel and the electricity bills, respectively (Unit:RMB). This equation could be used in the three scales above. For the details:
C time = α ( T c + T w )
C travel = β L travel
C utility = t = 1 T c t ( n = 1 N c n m = 1 M x m , n , t P m Δ t )
In the equation above, Tc and Tw represent the time to charging and to wait for charging (Unit: h); Ltravel means the travel distance to the station for charging (Unit: km); α, β are the price coefficients of time and travelling; ct, cn are the service price of charging station in each period and each station (unit: RMB/kWh).
Besides, the EV battery cost (e.g., degradation and replacement) is not considered in this paper, because the optimizing formulation proposed is to operate the electric taxi charging issue for both temporal and spatial scale in the period duration of one day. The EV battery degradation and replacement cost in one day is negligible, compared to the operation cost for the whole day, so to simplify this paper, the battery degradation cost has been neglected.

2.2. Constraints

2.2.1. Constraints with Electric Taxi Operation

(1) In the strategy proposed, the electric taxis have limited charging times for one simulation duration. For example, we consider 24 h to be one simulation duration, which also serves as two shifts for taxi operation, and four times is the charging limitation:
t = 1 T x m , t = 4
(2) Besides, the electric taxi drivers who are willing to charge have N options to choose the station, but only one could be the final decision:
n = 1 N x m , n = 1
(3) Next, to make sure enough electricity for the electric taxi reaches the assigned charging station, the travel distance during each charging interval should be less than the driving mileage (DM) of the electric taxi. In Equation (14), the Loperation is the electric taxis’ operation distance between two adjacent chargings is:
L operation D M

2.2.2. Electric Taxi Battery Constraints

(1) For the Charging Power, the charging power for a single charger is also constrained by the capability of the charging facilities. The limitation is shown as follows:
P c min P c P c max
where, P c min and P c max are the bottom and upper power limit of the charger.
(2) For SOC of battery, the SOC of battery also has some constraints:
S O C min S O C m , t S O C max
where, S O C min is the bottom power limit of SOC; S O C max is the upper power limit of SOC; S O C m , t is the SOC of vehicle m in period t.
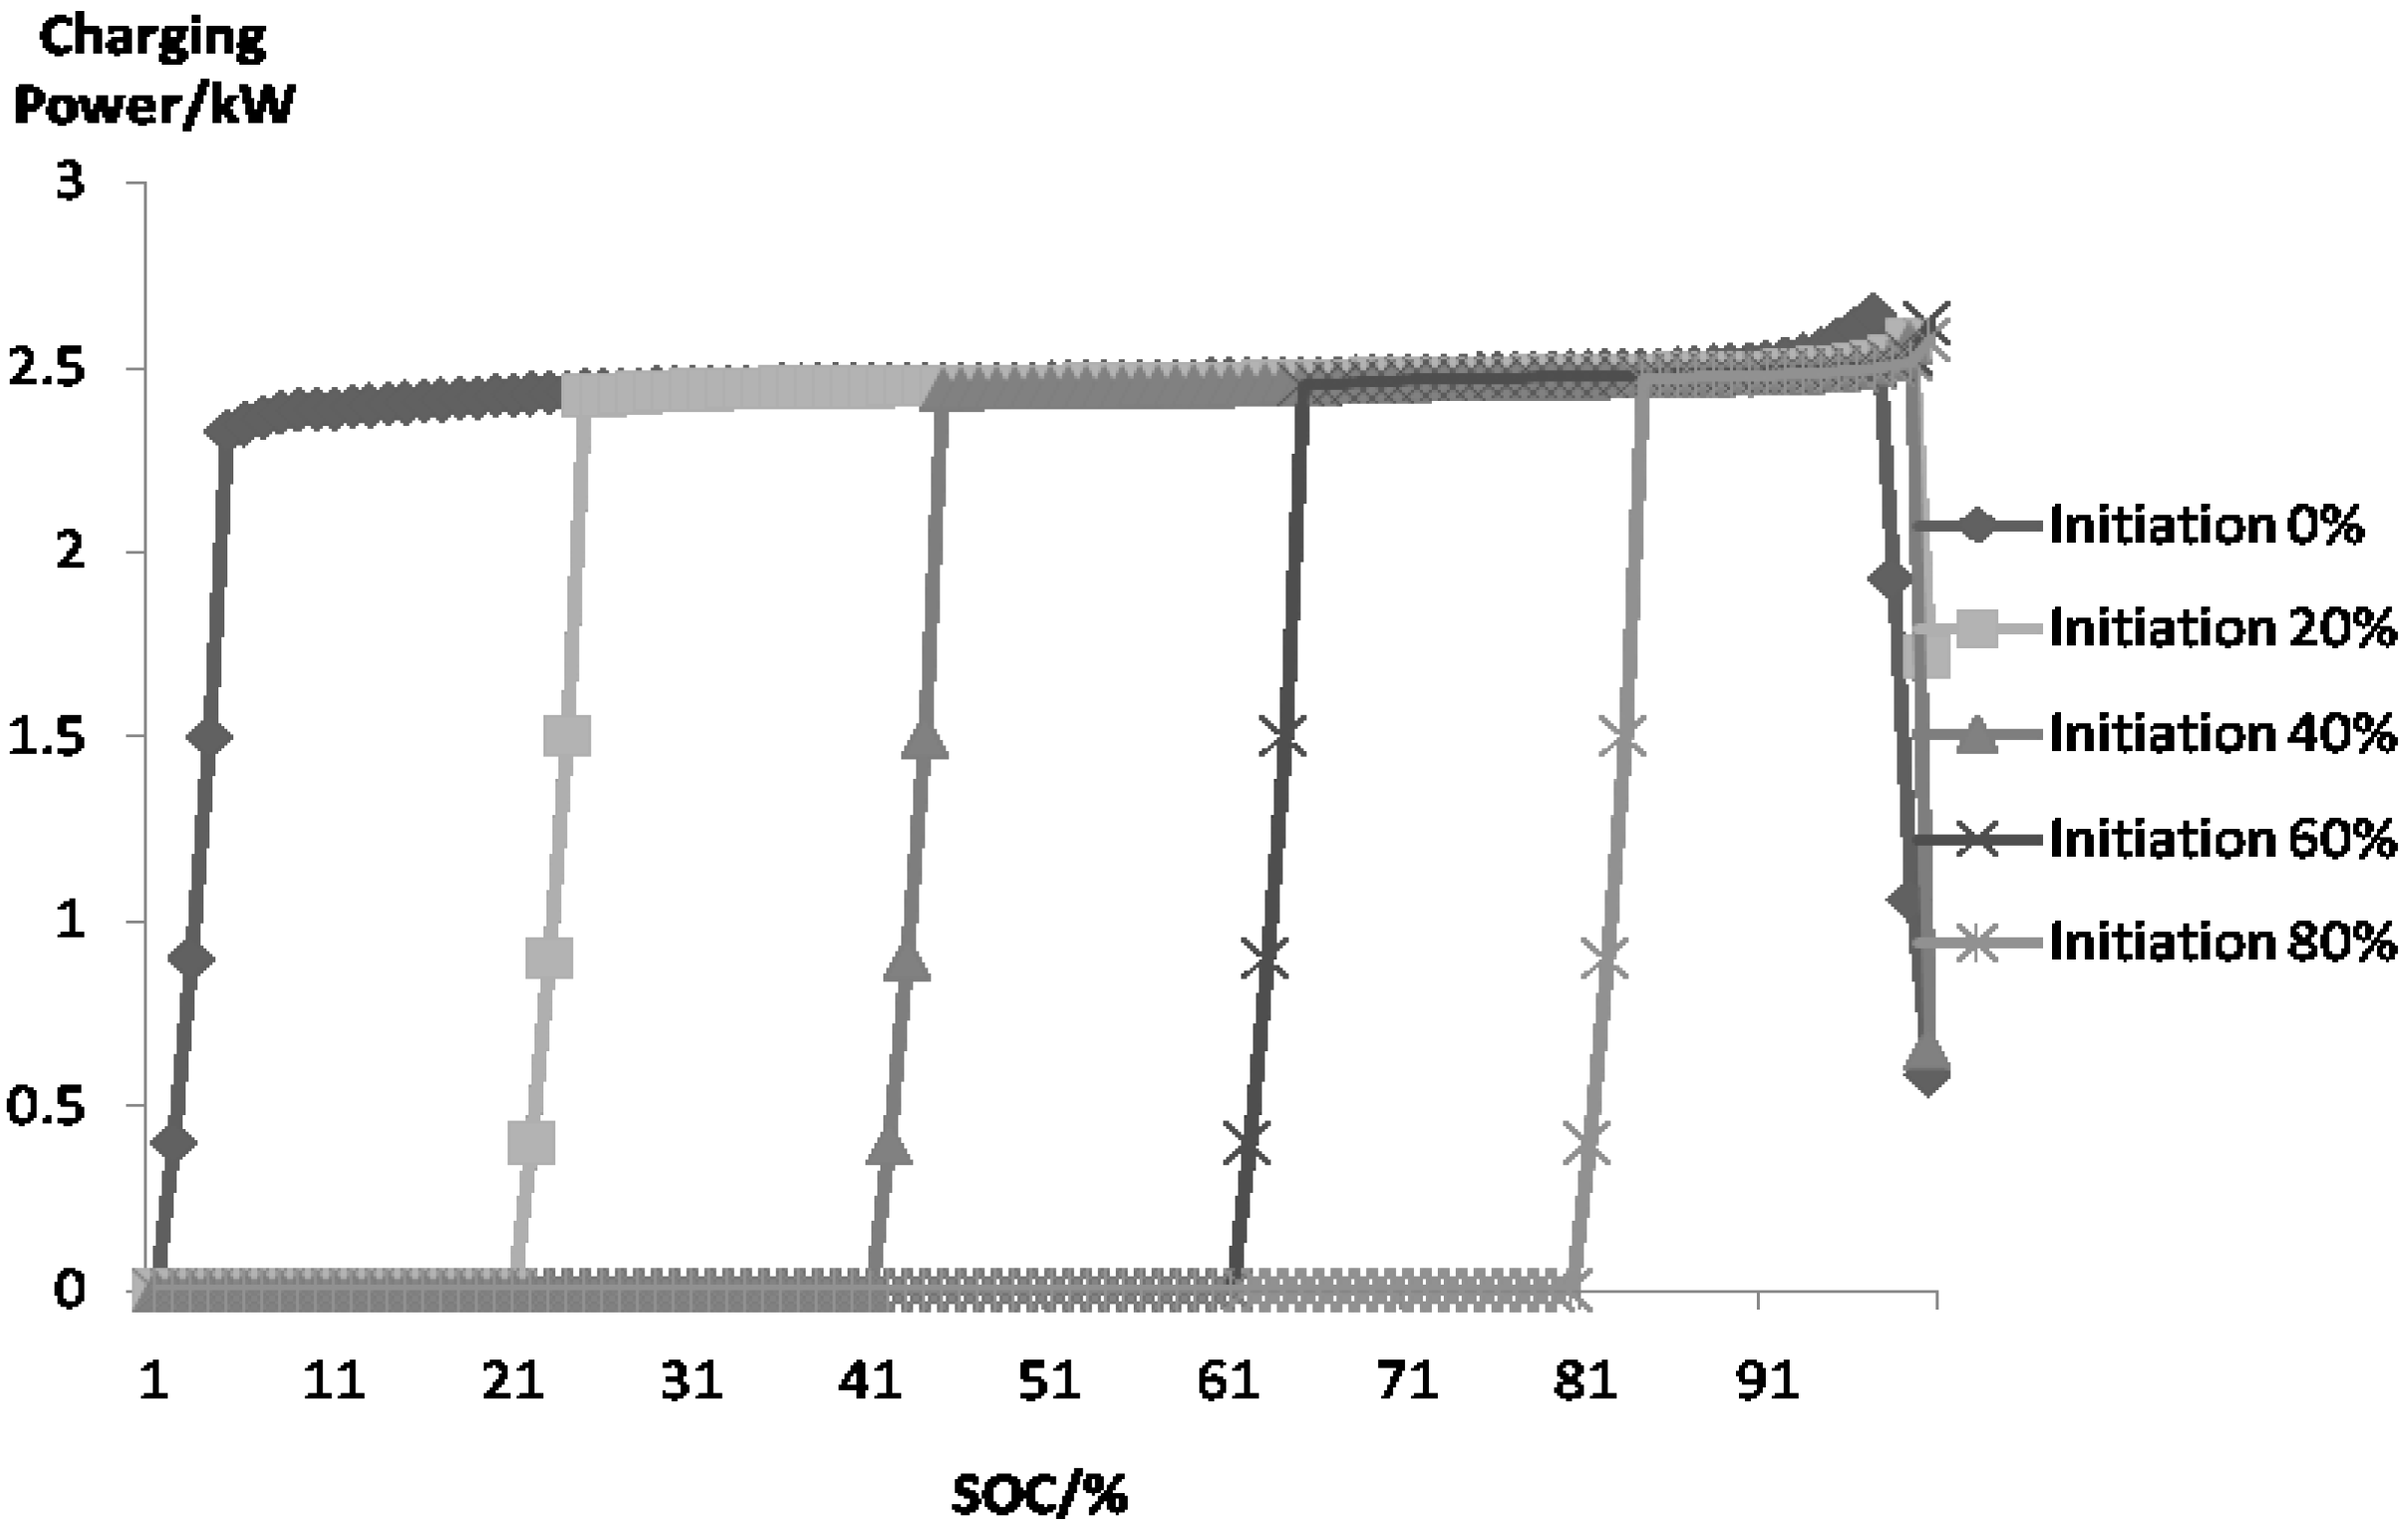
(3) Next, as the experiment data indicates, lithium battery charging is usually done in the Constant Current Constant Voltage mode [11,12]. Shown in Figure 2, the five charging profiles are overlapped no matter what the value of the original SOC is. In this way, we can draw the conclusion that the entire charging pattern is fixed as the initiation of 0%, and any charging power profile with a certain initial SOC could be decided by the entire charging pattern and its value of initial SOC [13].
Figure 2. The charging pattern of various SOC at the beginning of charging.
Energies 08 01256 g002

3. Methodology

3.1. Fuzzy Mathematical Method for Multi-Objective Problems

In this paper, the problem for coordinated charging turns out to be a multi-objective optimization problem. Usually, the weighting method and the fuzzy mathematics method are utilized to handle each objective weight of a multi-objective optimization problem. Compared to subjective setting or several tests for weighting methods to get proper weight coefficients, the fuzzy mathematics method uses a membership function to perform objective function fuzzification to form the fuzzy multi-objective function. There is no need to use weighting coefficients to tackle multi-objective problems in the fuzzy mathematics method, and the solution is obtained objectively [14].
For objectively considering the weight of each optimization objective, the linear membership function is used to make the objective functions fuzzification to form the fuzzy multi-objective function. The linear membership function can be described as:
μ x ( x ) = { 0 f i ( x ) c i , min f i ( x ) c i , min c i , max c i , min c i , min < f i ( x ) < c i , max i = 1 , 2 , 3 , 4 1 f i ( x ) c i , max
where, f i ( x ) is ith objective function of fuzzy multi-objective problem; μ i ( x ) is the membership function of f i ( x ) ; m is the number of objective functions; c i , min , c i , max are the upper and lower limit values of f i ( x ) , respectively; c i , min is the optimal value obtained by a single objective function; and c i , max is the initial value of each objective function, the details of which are summarized in Table 1. The membership function curves given by Equation (17) are shown in Figure 3.
Table 1. Case setting of charging period.
Time/h12345678
Waiting coefficient0.10.510.50.1000.1
Charging price0.50.50.50.50.50.50.51
Nominated load profile0.760.710.670.660.650.660.690.72
Time/h910111213141516
Waiting coefficient0.50.80.50.10.10.510.5
Charging price11222221
Nominated load profile0.810.890.930.940.910.870.850.85
Time/h1718192021222324
Waiting coefficient0.1000.10.50.80.50.1
Charging price11222110.5
Nominated load profile0.890.991.000.980.970.930.860.80
Figure 3. Membership function of sub-objective.
Energies 08 01256 g003

3.2. Improved Self-Adaptive PSO Algorithm with Detection Function

The coordinated charging problem in the strategy of Section 2 is considered a complex multi-constraints, nonlinear optimization problem. Compared to many classical algorithms, such as linear programming, quadratic programming, gradient descending method and other numerical algorithms, heuristic algorithms are novel algorithms for solving optimization problems and are much easier to implement and extend. The typical heuristic methods include genetic algorithms (GA), particle swarm optimization (PSO), differential evolution (DE), artificial immune algorithm, and artificial bee colony (ABC) algorithm. These algorithms are based on multi-point stochastic searching, and they can effectively solve optimization problems in different situations. Their global convergence capacity is better than that of the classical algorithms.
The PSO algorithm possesses superior performance in its implementation and a good trade-off between exploration and exploitation ability. It was introduced by Kennedy and Eberhart in 1995 [15], and originates from the simulation of birds’ behaviour and fish behaviour. PSO is an algorithm with a simple structure, simple parameter setting and fast convergence speed, which has been widely applied in function optimization, mathematical modelling, system control, and some other areas [16].
In basic PSO algorithms, ω, c1 and c2 are fixed values. For the search accuracy and search speed, many improved PSO methods were proposed to modify the parameters, especially the inertia weight, so that the search space can be changed steadily from the global to the local. In this paper, the improved inertia weight is shown in Equation (20). The algorithm may adjust ω dynamically via Equation (20), so that it can optimize dynamically by taking both global search and local search into account during changing. The improved PSO is shown as follows:
v id k + 1 = ω ( k ) v id k + c 1 r 1 ( p id z id k ) + c 2 r 2 ( p gd z id k )
z id k + 1 = z id k + v id k + 1
ω ( k ) = ω start ( ω start ω end ) ( k T ) 2
where, ω start and ω end represent the initial value and the final value of ω , respectively; T is the maximum number of evolutionary generations; k is the current number of the evolutionary generation.

3.3. The Mathematical Procedure

In this section, we present the mathematical procedure for the coordinated charging strategy proposed based on multi-objective and multi-scale optimization. During this procedure, the operation of the charging process has been simulated, and besides, there should be a monitor system collecting the operation data for the optimization platform. After the optimization calculation, the command from the control center would be sent to execute the elements which decide when and where to charge the electric taxi. All of these are performed in the aggregator, the brain of this system. In details, this is expressed as follows:
STEP 1: During operation, the electric taxi information is collected at the control center through the monitoring system, including the ID of vehicles, the geographical data, the SOC condition, etc. For simulation, all of these data would be generated by a stochastic process.
STEP 2: The optimization process:
  • Case 2: For temporally-coordinated charging: the operation scheduling of electric taxis for one simulation duration is collected, which is the original operation. Then, the scheduling would be optimized through the proposed multi-objective strategy. The new electric taxi scheduling would be better in facility utilization, charging load profile and operation cost.
  • Case 3: For spatially-coordinated charging: this optimization is quite similar to the temporal model, with the difference that the variable is the choice of charging station in a certain period rather than charging period for a long duration.
  • Case 4: For combination coordinated charging: When the temporally-coordinated charging is running, once the charging period dispatching for one simulation interval is accomplished, then the spatial coordinated charging procedure would be called for optimal charging station selection.
STEP 3: When the temporal or spatial coordinated charging is called, the Improved PSO algorithm for the corresponding fitness function, where the fuzzy mathematical method has turned multi-objective optimization into single objective optimization, would be executed. The optimization procedure-based improved PSO is shown in Figure 4.
Figure 4. The flow chart of the improved PSO algorithm.
Energies 08 01256 g004

4. Simulations and Results

4.1. Case Setting

In this section, some operation data are generated based on the original operation statistics of electric taxis in Shenzhen. Assuming that:
(1)
There are N charging station and M electric taxis running in the region with a charging demand distribution in four time intervals, according to the statistical results in [17]. In this case, N = 8; M = 100.
(2)
The value of selection variables, xm,t and xm,n, either 1 or 0, xm,t = 1 means the electric taxi m would start charging at period t, xm,t = 0 means not; and xm,n = 1 means the electric taxi m would choose to charge at station n, xm,n = 0 also means not.
(3)
Assume that the distance between the position of the electric taxis and their assigned charging station shows a normal distribution N~(10, 2) (unit: km). Besides, we neglect the bad traffic conditions, such as the traffic congestion, and suppose that electric taxi m is running with the speed of vm. The speeds of electric taxis are also in a normal distribution N~(40, 5) (unit: km/h).
(4)
In Equations (9) and (10), α, β are the price coefficients of extra time and travel for EV operation, respectively. According to the investigation, we assume that the wages and the working hours of electric taxi drivers during a working shift would be 300 yuan and 12 h, respectively. So 25 (unit: RMB/h) is considered to be the value of α for time coefficient in the simulation cases. Besides, with the speed value of each taxi, v m , the coefficient of travel could be transferred from the coefficient of time. By this mean, β is considered to be α / v m (unit: yuan/km).
(5)
The charging rate for electric taxis used in this simulation is 0.5 C, and it is constant for all the charging facilities, which also comes from the investigation for the Shenzhen case.
(6)
The time shifts and the time starting to charge distribution are assumed as in Figure 5 below.
Figure 5. The starting time to charge distribution.
Energies 08 01256 g005
(7)
The SOC of vehicles when arriving at the station are assumed to be in a normal distribution, with the mean value of 50% and standard deviation of 10% shown in Figure 6. Besides, the charging duration would be derived through the initial SOC of electric taxis.
Figure 6. SOC distribution when electric taxis return.
Energies 08 01256 g006
(8)
The waiting coefficient of different time period stations are assumed in terms of the statistical results, and the charging price of temporal scale is assumed based on the peak-valley price, which are shown in Table 1 and Table 2.
Table 2. Case setting of charging stations.
No.12345678
Number of chargers6841048106
Waiting coefficient0.050.200.200.050.050.200.200.05
Charging price11111111
(9)
Next, the regional power system and charging station geographical information are shown in Figure 7, which is a modified IEEE 33 bus system with charging station loads. The load in each bus and the fluctuation are emulated in Table 2.
Figure 7. Case setting for stations.
Energies 08 01256 g007
(10)
In the simulation cases, the parameters of the Improved PSO Algorithm, c1, c2, ωstart and ωend, have been assigned to be 1.49, 1.49, 0.9 and 0.4, respectively.
(11)
The upper and lower limitations ci,min, ci,max of the fuzzy mathematic method are shown in Table 3.
Table 3. Upper and lower sub-objective limits.
Sub-ObjectiveObjective 1Objective 2Objective 3
Original value, ci,max (Temporal)4.7683 × 1084.8068 × 1081.1824 × 106
Optimal value, ci,min (Temporal)2.0288 × 1072.7157 × 1079.2963 × 105
Original value, ci,max (Spatial)9.8929 × 1081.2391 × 1082.2636 × 104
Optimal value, ci,min (Spatial)4.0234 × 1083.5364 × 1032.1236 × 104

4.2. Results

4.2.1. The Effectiveness of the Improved PSO Algorithm

In this paper, we utilized the Improved PSO Algorithm to solve a multi-constraints, nonlinear optimization problem. In Figure 8, the fitness optimization process of the Improved PSO and the original PSO are compared. Compared to the original PSO algorithm, we can see that the Improved PSO with the changing inertia weight, still has the better search ability and better optimization results.
Figure 8. Fitness comparison of original and improved PSO algorithms.
Energies 08 01256 g008

4.2.2. Results of Cases 1, 2 and 4

With the charging strategy in temporal scale, the charging power dispatches are compared in Figure 9, that is, the original charging load profile, generated based on the operation characteristics shown in Figure 5, and the temporal and combined coordinated charging profiles obtained from the corresponding strategy. Table 4 displays the sub-objective values and multi-objective values in the three different cases.
In the Figure above and Table below, it is shown that the charging load curve has a better deployment with a much better choice of charging time, for both spatial and combined coordinated charging. The charging peak has declined from approximately 2000 kW to 1000 kW and 1500 kW, respectively.
Table 4. Sub-objective value of temporal coordinated charging strategy.
ObjectiveObjective 1Objective 2Objective 3Multi-Objective
Original charging4.7683 × 1084.8068 × 1081.1824 × 1063.0000
Temporal coordinated charging2.2597 × 1073.1242 × 1071.1490 × 1060.8819
Combined coordinated charging6.5921 × 1077.1438 × 1071.1118 × 1060.9183
Additionally, the Table depicts the details of the optimization process, with an apparent decrease in all of the three objectives, especially for Objective 1 and 2, as well as the multi-objective. It is noticed that the combined coordinated charging has a modest optimizing effect, compared to separated spatial coordinated charging, with the reason that the combined dispatching considered only one time interval with a limited vision for global optimization.
Figure 9. The comparison of original, temporal and combined coordinated charging load.
Energies 08 01256 g009
Besides, we could see the effectiveness of the temporal and combined coordinated charging strategy in a modified IEEE 33 bus test system. In Table 5, the Cases 2 and 4 both show the improvement in power loss and voltage deviation, and Case 2 is even better, which conforms to the conclusion of Table 4.
Table 5. Effects in modified IEEE 33-bus system with coordinated charging strategy.
CaseCase 1Case 2Case 4
Power loss (kWh)7081.46818.96824.6
Voltage deviation (kV2)2.5318 × 1042.4427 × 1042.4439 × 104

4.2.3. Results of Cases 1, 3 and 4

With the charging strategy in spatial scale, the charging selection for stations are compared in Figure 10. That is, the original charging, generated based on the positions of eight charging stations shown in Figure 5, with the assumption that the geographical information is the only factor that taxi drivers consider, and the spatial and combined coordinated charging results obtained from the corresponding strategy. Table 6, displays the sub-objective values and multi-objective values in three different cases.
Table 6. Sub-objective value of spatial coordinated charging strategy.
ObjectiveObjective 1Objective 2Objective 3Multi-Objective
Original charging9.8929 × 1081.2391 × 1072.2636 × 1043.0000
Spatial coordinated charging4.9374 × 1086.4124 × 1052.1961 × 1040.6787
Combination coordinated charging5.0361 × 1081.8533 × 1062.2036 × 1040.7589
In Figure 10, the original charging scenario is supposed to result in charging congestion and charging delay at related stations, and the dispatching is much better after applying the new dispatching rules for station selection. The sub-objective values have been reduced, especially for Objective 2, which verifies the effectiveness of the spatial and combined coordinated charging strategy. The combined coordinated charging still has the same problem, showing restrained improvement compared to separate optimization.
Figure 10. The comparison of original, spatial and combined coordinated charging distribution.
Energies 08 01256 g010

5. Conclusions

In this paper, a new strategy has been proposed for electric taxi coordinated charging, subject to the charging facilities, charging load influence in the regional power system and customers’ composite cost; additionally, this work also applies different visions to evaluate this problem, in the temporal, spatial and combined scales, and the key of this problem is to intelligently identify the appropriate charging periods and stations to charge. The new strategy involves the solution of a constrained multi-objective and multi-scale optimization model for coordinated charging. Moreover, the simulations could prove that this strategy shows significant effectiveness for coordinated charging in the temporal and spatial scale.

Acknowledgments

This work was supported by National Key Technology R&D Program (2013BAA01B03). Besides, we also want to thank the investigation support from Potevio New Energy.

Author Contributions

The initial design and implementation of the coordinated charging framework and the solution based on the fuzzy method and Improved PSO was done by Yuqing Yang. She was also responsible for the simulation implementation for case study. Besides, this work was also performed under the advisement and regular feedback from Weige Zhang, who also revised the manuscript critically. Moreover, Liyong Niu and Jiuchun Jiang also gave some useful suggestions for this work and helped revise the manuscript.

Conflicts of Interest

The authors declare no conflict of interest.

References

  1. Zhang, W.; Wu, B.; Li, W.; Lai, X. Discussion on development trend of battery electric vehicles in China and its energy supply mode. Power Syst. Technol. 2009, 33, 1–5. [Google Scholar]
  2. Tian, Z.; Wang, Y.; Tian, C.; Zhang, F.; Tu, L.; Xu, C. Understanding operational and charging patterns of electric vehicles using GPS records. In Proceedings of the 2014 IEEE 17th International Conference on Intelligent Transportation System (ITSC), Qingdao, China, 8–11 October 2014.
  3. Sun, L.; Yang, J.; Yang, Z. Optimal charging strategy of plug-in electric taxi. In Proceedings of the 10th IEEE International Conference on Control and Automation (ICCA), Hangzhou, China, 12–14 June 2013.
  4. Yang, Z.; Sun, L.; Ke, M.; Shi, Z.; Chen, J. Optimal charging strategy for plug-in electric taxi with time-varying profits. IEEE Trans. Smart Grid 2014, 5, 2787–2797. [Google Scholar] [CrossRef]
  5. Yang, J.; Yang, Z. Pricing scheme for aggregate load scheduling of plug-in electric taxi fleet. In Proceedings of the 33rd Chinese Control Conference, Nanjing, China, 28–30 June 2014.
  6. Yang, Z.; Sun, L.; Chen, J.; Yang, Q.; Chen, X.; Xing, K. Profit maximization for plug-in electric taxi with uncertain future electricity prices. IEEE Trans. Power Syst. 2014, 29, 3058–3068. [Google Scholar] [CrossRef]
  7. Jing, Z.; Fang, L.; Lin, S.; Shao, W. Modelling for electric taxi load and optimization model for charging and swapping facilities for electric taxi. ITEC Asia Pac. 2014. [CrossRef]
  8. Lu, J.; Yeh, M.; Hsu, Y.C.; Yang, S.; Gan, C.; Chen, M. Operation electric taxi fleets: A new dispatching strategy with charging plans. In Proceedings of the 2012 IEEE International Electric Vehicle Conference (IEVC), Greenville, SC, USA, 4–8 March 2012.
  9. Eric, S.; Mohammad, H.; MacPherson, M.J. Coordinated charging of plug-in hybrid electric vehicles to minimize distribution system losses. IEEE Trans. Smart Grid. 2011, 2, 198–205. [Google Scholar] [CrossRef]
  10. You, H.; Jiang, X. Research on relationship of load variance characteristics and electric distribution line energy loss. Power Demand Side Manag. 2008, 10, 13–15. [Google Scholar]
  11. Wen, J. Studies of Lithium-Ion Power Battery Optimization Charging Theory for Pure Electric Vehicle; Bejing Jiaotong University: Beijing, China, 2011. [Google Scholar]
  12. Wen, F. Study on Basic Issues of the Li-ion Battery Pack Management Technology for Pure Electric Vehicles; Beijing Jiaotong University: Beijing, China, 2010. [Google Scholar]
  13. Yang, Y.; Jiang, J.; Bao, Y.; Zhang, W.; Huang, M.; Su, S. Dynamic coordinated charging strategy and positive effects in regional power system. In Proceedings of the 11th IEEE International Conference on Control and Automation (ICCA), Taichung, Taiwan, 18–20 June 2014.
  14. He, X.; Wang, W. Fuzzy Multi-objective opimal power flow based on modified artificial bee colony algorithm. Math. Probel. Eng. 2014, 2014. [Google Scholar] [CrossRef]
  15. Kennedy, J.; Eberhart, R. Particle swarm optimization. In Proceedings of the IEEE International Conference on Neutral Networks, Perth, WA, USA, 27 November–1 December 1995.
  16. Zhang, Y.C.; Xiong, X.; Zhang, Q.D. An improved Self-adaptive PSO algorithm with detection function for multimodal function optimization problem. Math. Probel. Eng. 2013, 2013. [Google Scholar] [CrossRef]
  17. Li, Y.; Huang, M.; Zhang, W. An estimation method for daily charging load of electric taxis. Autom. Electr. Power Syst. 2014, 38, 55–60. [Google Scholar]

