Article

Classification of Highly Imbalanced Supervisory Control and Data Acquisition Data for Fault Detection of Wind Turbine Generators

by
Jorge Maldonado-Correa
1,2,*,
Marcelo Valdiviezo-Condolo
2,
Estefanía Artigao
1,
Sergio Martín-Martínez
1 and
Emilio Gómez-Lázaro
1
1
Renewable Energy Research Institute (IIER), University of Castilla-La Mancha, 02071 Albacete, Spain
2
Technological and Energy Research Center (CITE), National University of Loja, Loja 110150, Ecuador
*
Author to whom correspondence should be addressed.
Energies 2024, 17(7), 1590; https://doi.org/10.3390/en17071590
Submission received: 1 February 2024 / Revised: 14 March 2024 / Accepted: 22 March 2024 / Published: 26 March 2024
(This article belongs to the Collection Renewable Energy and Energy Storage Systems)

Abstract

:
It is common knowledge that wind energy is a crucial, strategic component of the mix needed to create a green economy. In this regard, optimizing the operations and maintenance (O&M) of wind turbines (WTs) is key, as it will serve to reduce the levelized cost of electricity (LCOE) of wind energy. Since most modern WTs are equipped with a Supervisory Control and Data Acquisition (SCADA) system for remote monitoring and control, condition-based maintenance using SCADA data is considered a promising solution, although certain drawbacks still exist. Typically, large amounts of normal-operating SCADA data are generated against small amounts of fault-related data. In this study, we use high-frequency SCADA data from an operating WT with a significant imbalance between normal and fault classes. We implement several resampling techniques to address this challenge and generate synthetic generator fault data. In addition, several machine learning (ML) algorithms are proposed for processing the resampled data and WT generator fault classification. Experimental results show that ADASYN + Random Forest obtained the best performance, providing promising results toward wind farm O&M optimization.

1. Introduction

Wind energy has experienced sustained growth over the last decade, as shown in a recent report by the Global Wind Energy Council (GWEC), which informed that 78 WTs were installed in 2022. This has facilitated a total of 906 WTs of installed wind power capacity around the world [1]. Moreover, the rapid development of Artificial Intelligence (AI) techniques and their tools has positioned the fault prediction of wind turbines (WTs) as a field of great interest in the scientific community [2].
WTs are equipped with a SCADA (Supervisory Control and Data Acquisition) system for performance monitoring, supervision, and remote control. A SCADA system typically uses 10 min intervals to monitor more than 200 signals generated by a WT [3] and creates historical datasets which, after being processed by appropriate data analysis techniques, are a valuable source of information on the WT’s status. However, datasets in the real world are unevenly available, especially in industrial machinery fault detection, which means that the amount of normal data (majority class) is much larger than that of fault-related data (minority classes).
In this context, it is important to mention that WTs are routinely in a normal operating state, i.e., a large amount of normal SCADA data and little abnormal SCADA data are generated. The normal operating state of the WT comprises many stages, such as the maximum power point tracking stage, the constant rotational speed stage, the rated power output stage, etc. [4].
Most of the models used for fault classification, and the metrics employed to evaluate such models, assume that the distribution of classes is equal. However, imbalanced distributions exist across the board between abnormal and normal classes, leading to inaccurate failure diagnoses and predictions, because these models tend to be biased toward the most widespread class.
This paper analyzes high-frequency and highly imbalanced SCADA data and alarms on an in-service WT to predict failure in the induction generator. The data used for the study are sampled every 30 s, thus being high-frequency. We highlight this aspect since the sampling frequency of SCADA data used in most studies on WT fault prediction is 10 min [5].
In this work, the class imbalance problem, commonly disregarded, is first tackled. To this end, modern resampling techniques are used to remove or generate synthetic data randomly. Novel machine learning (ML) algorithms are then used for data processing and fault classification. Finally, in order to avoid indicators that focus exclusively on one of the classes, we use specific performance metrics that evaluate the overall performance of the classification algorithms.
The main contributions of this article are summarized as follows:
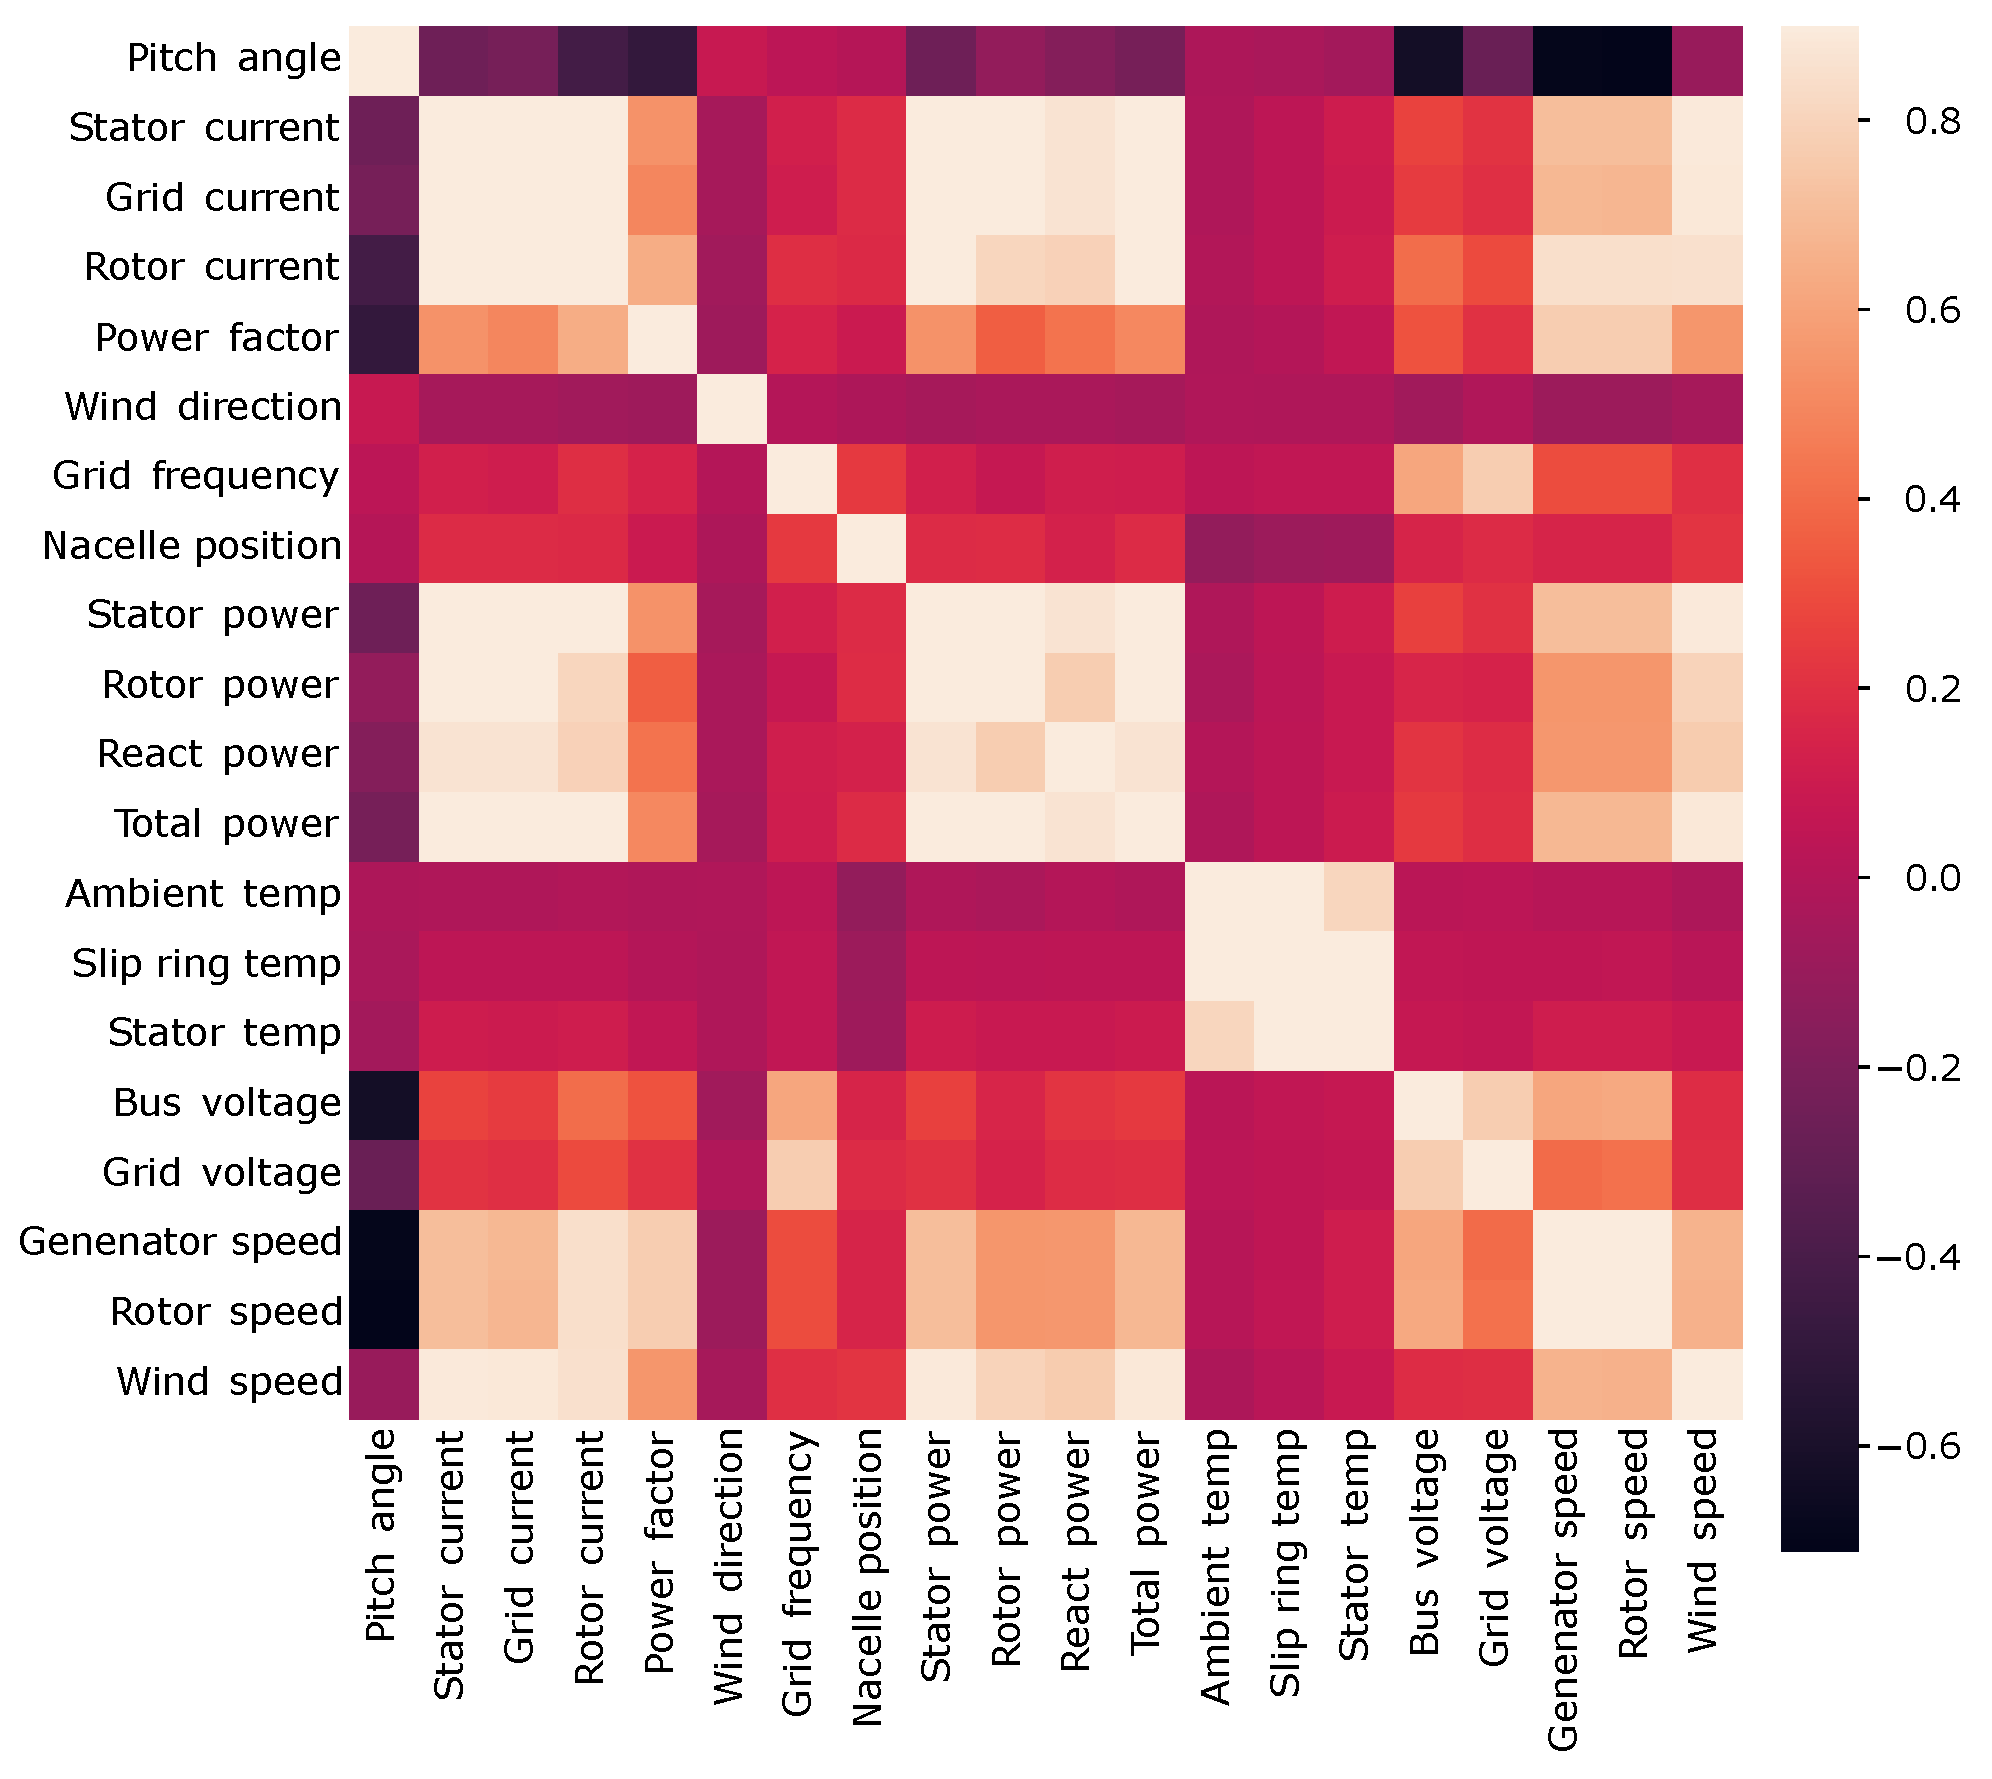
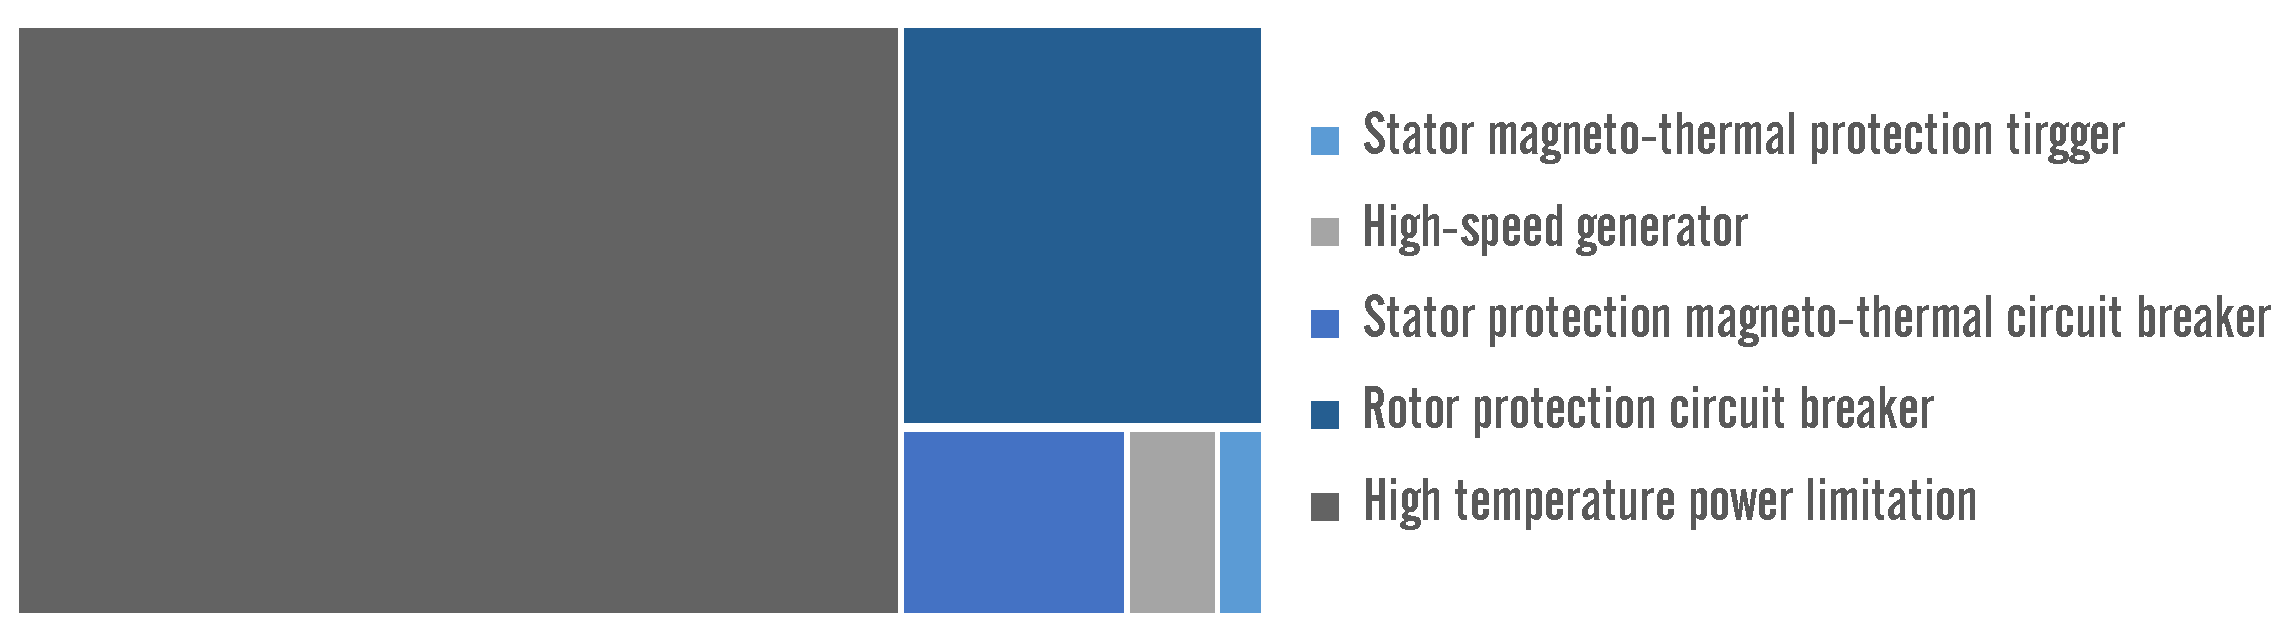
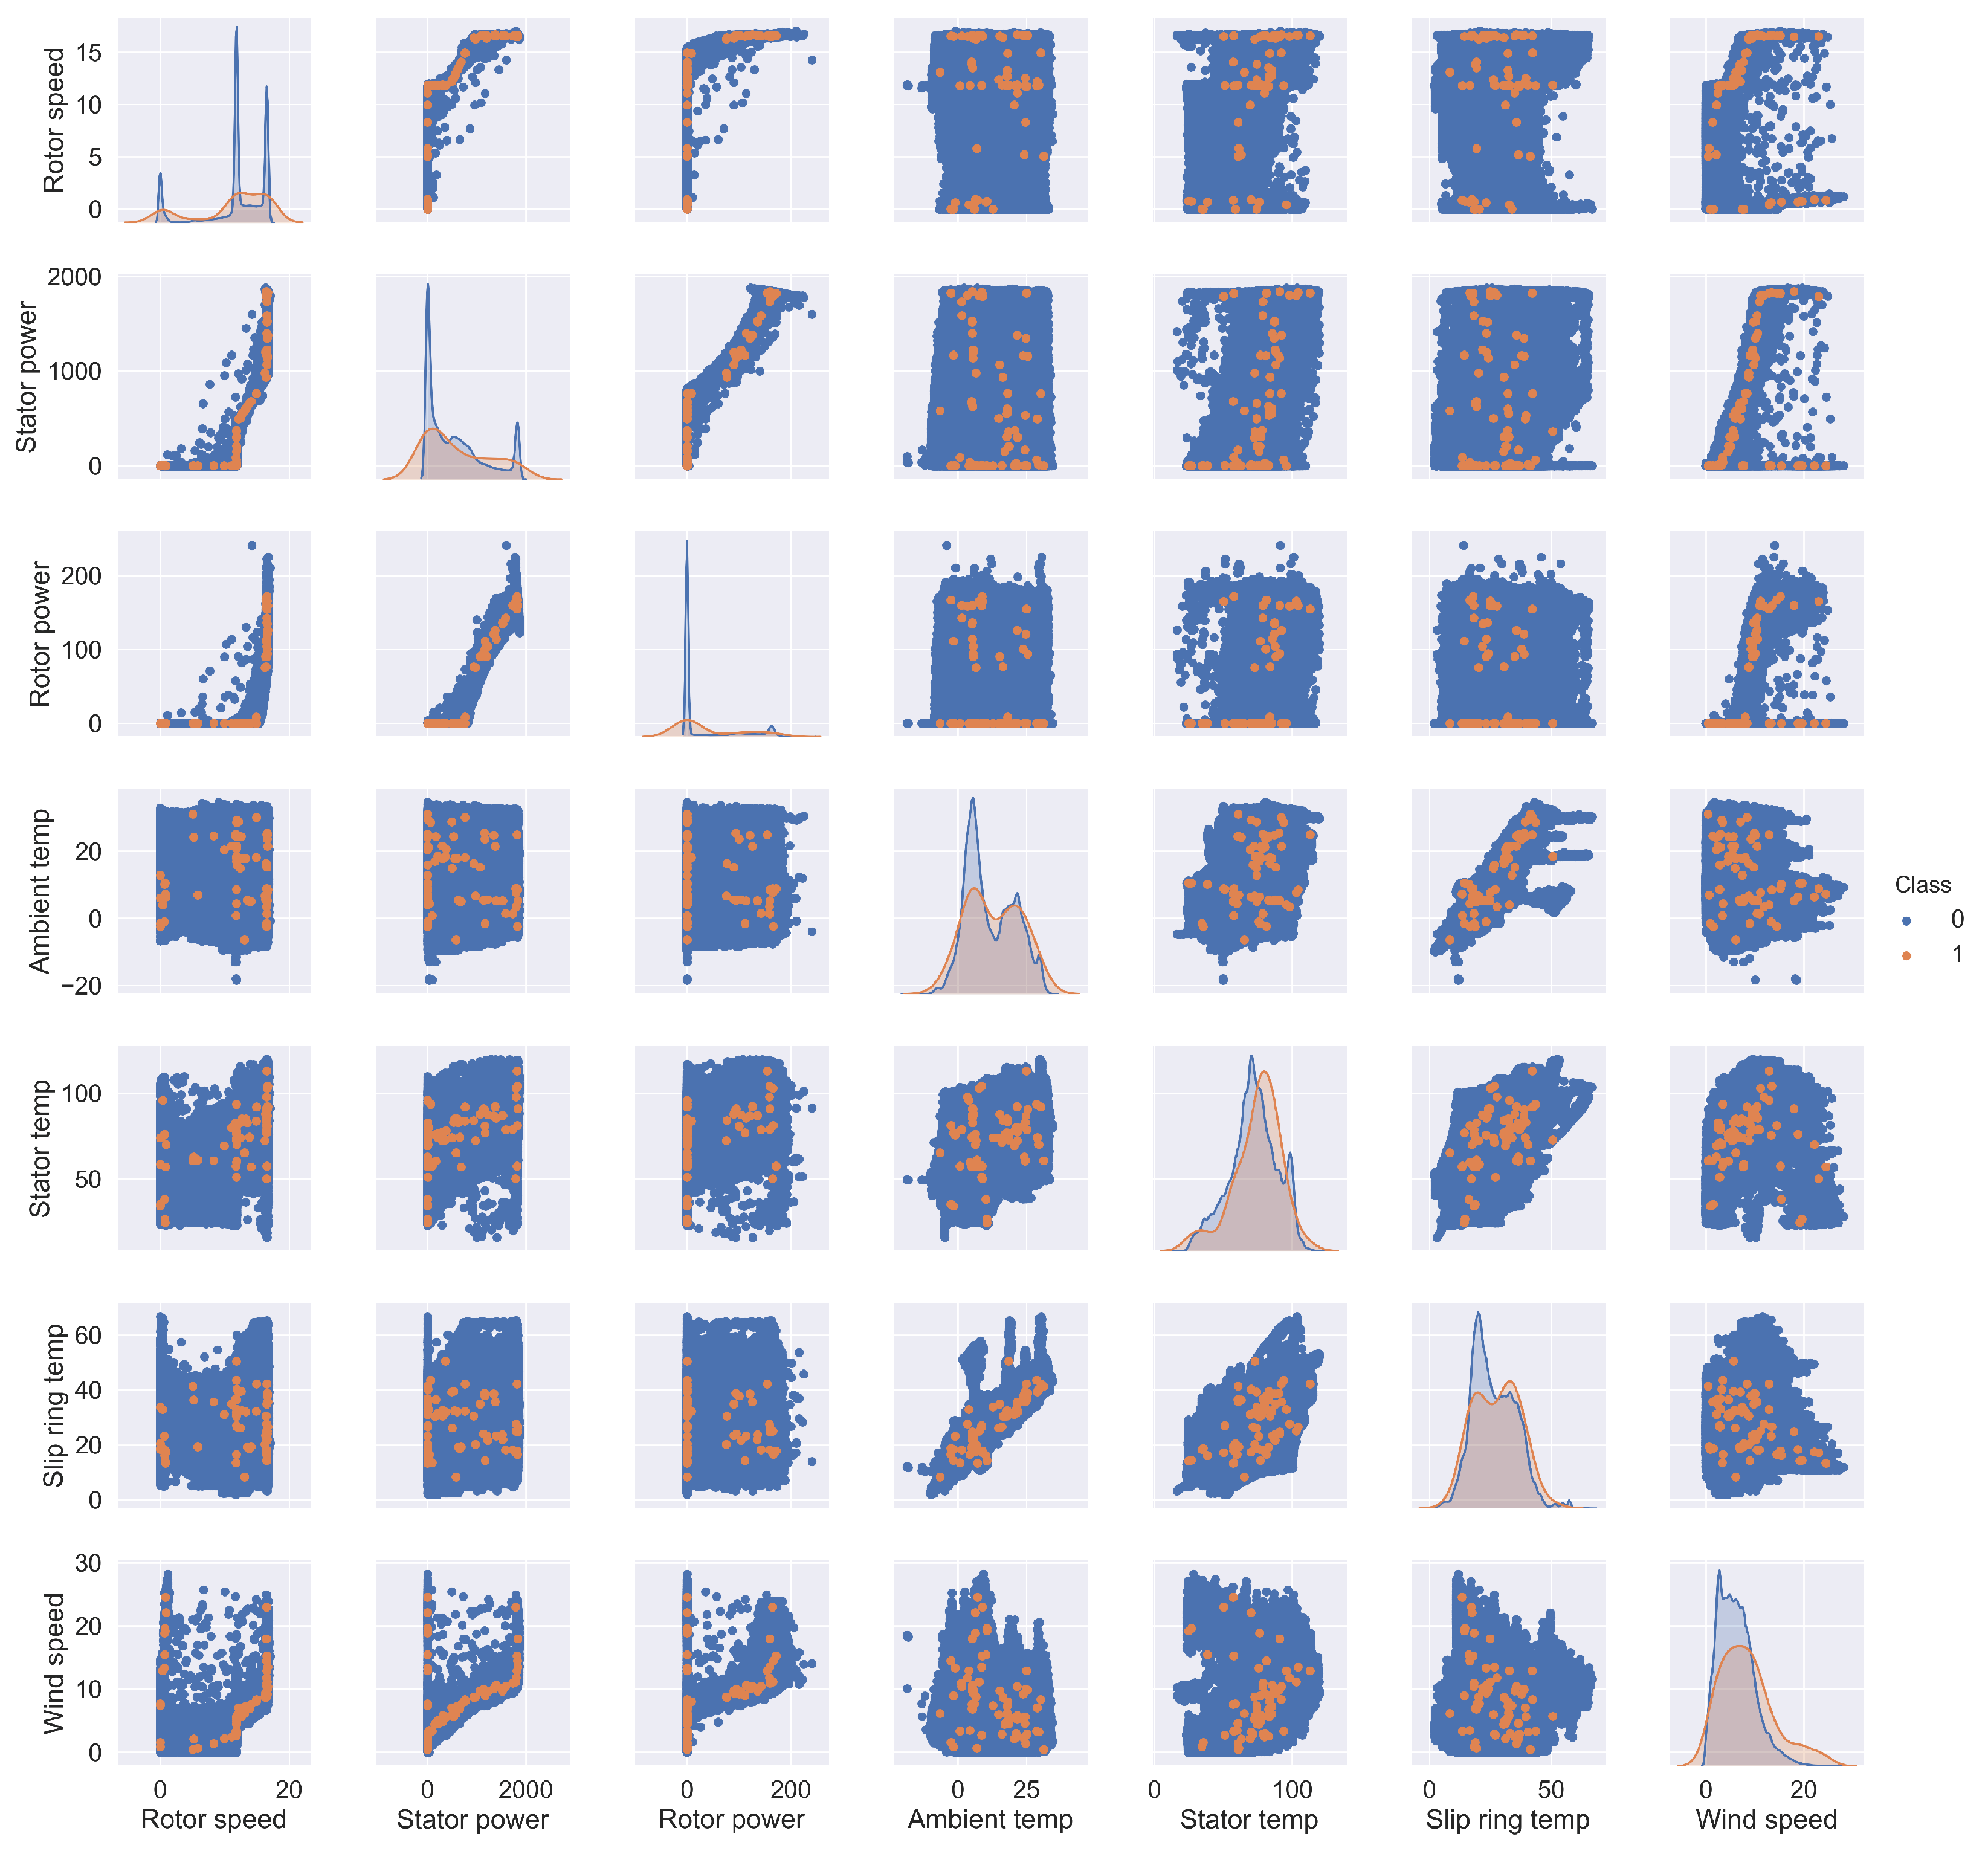
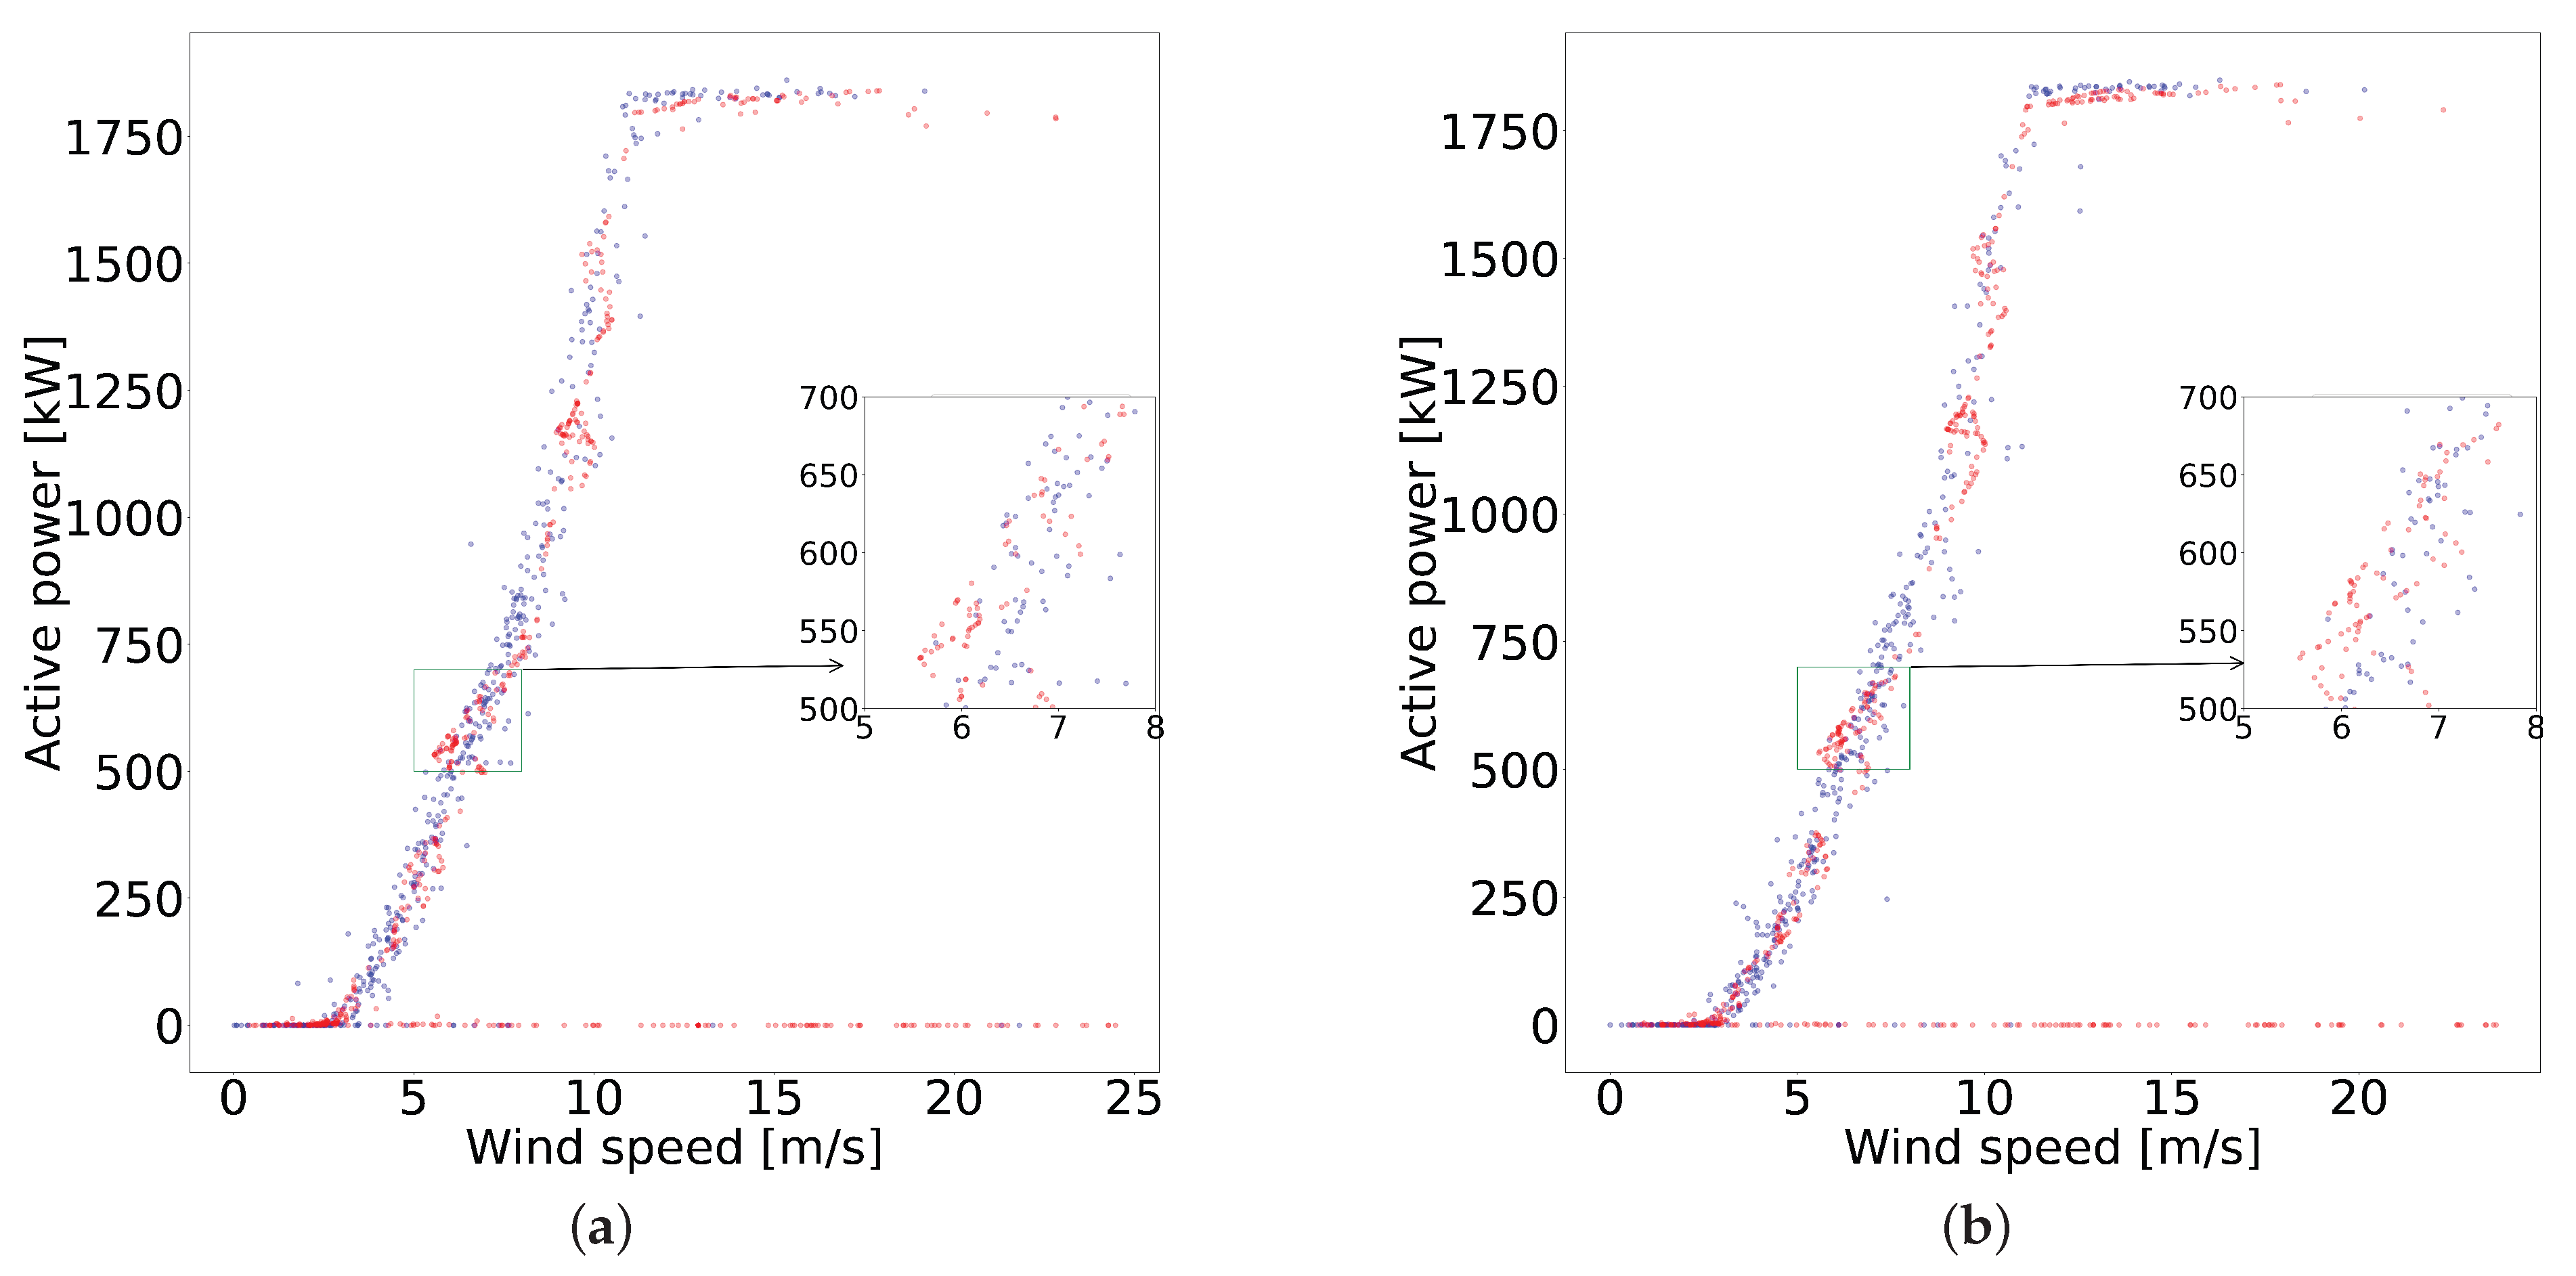
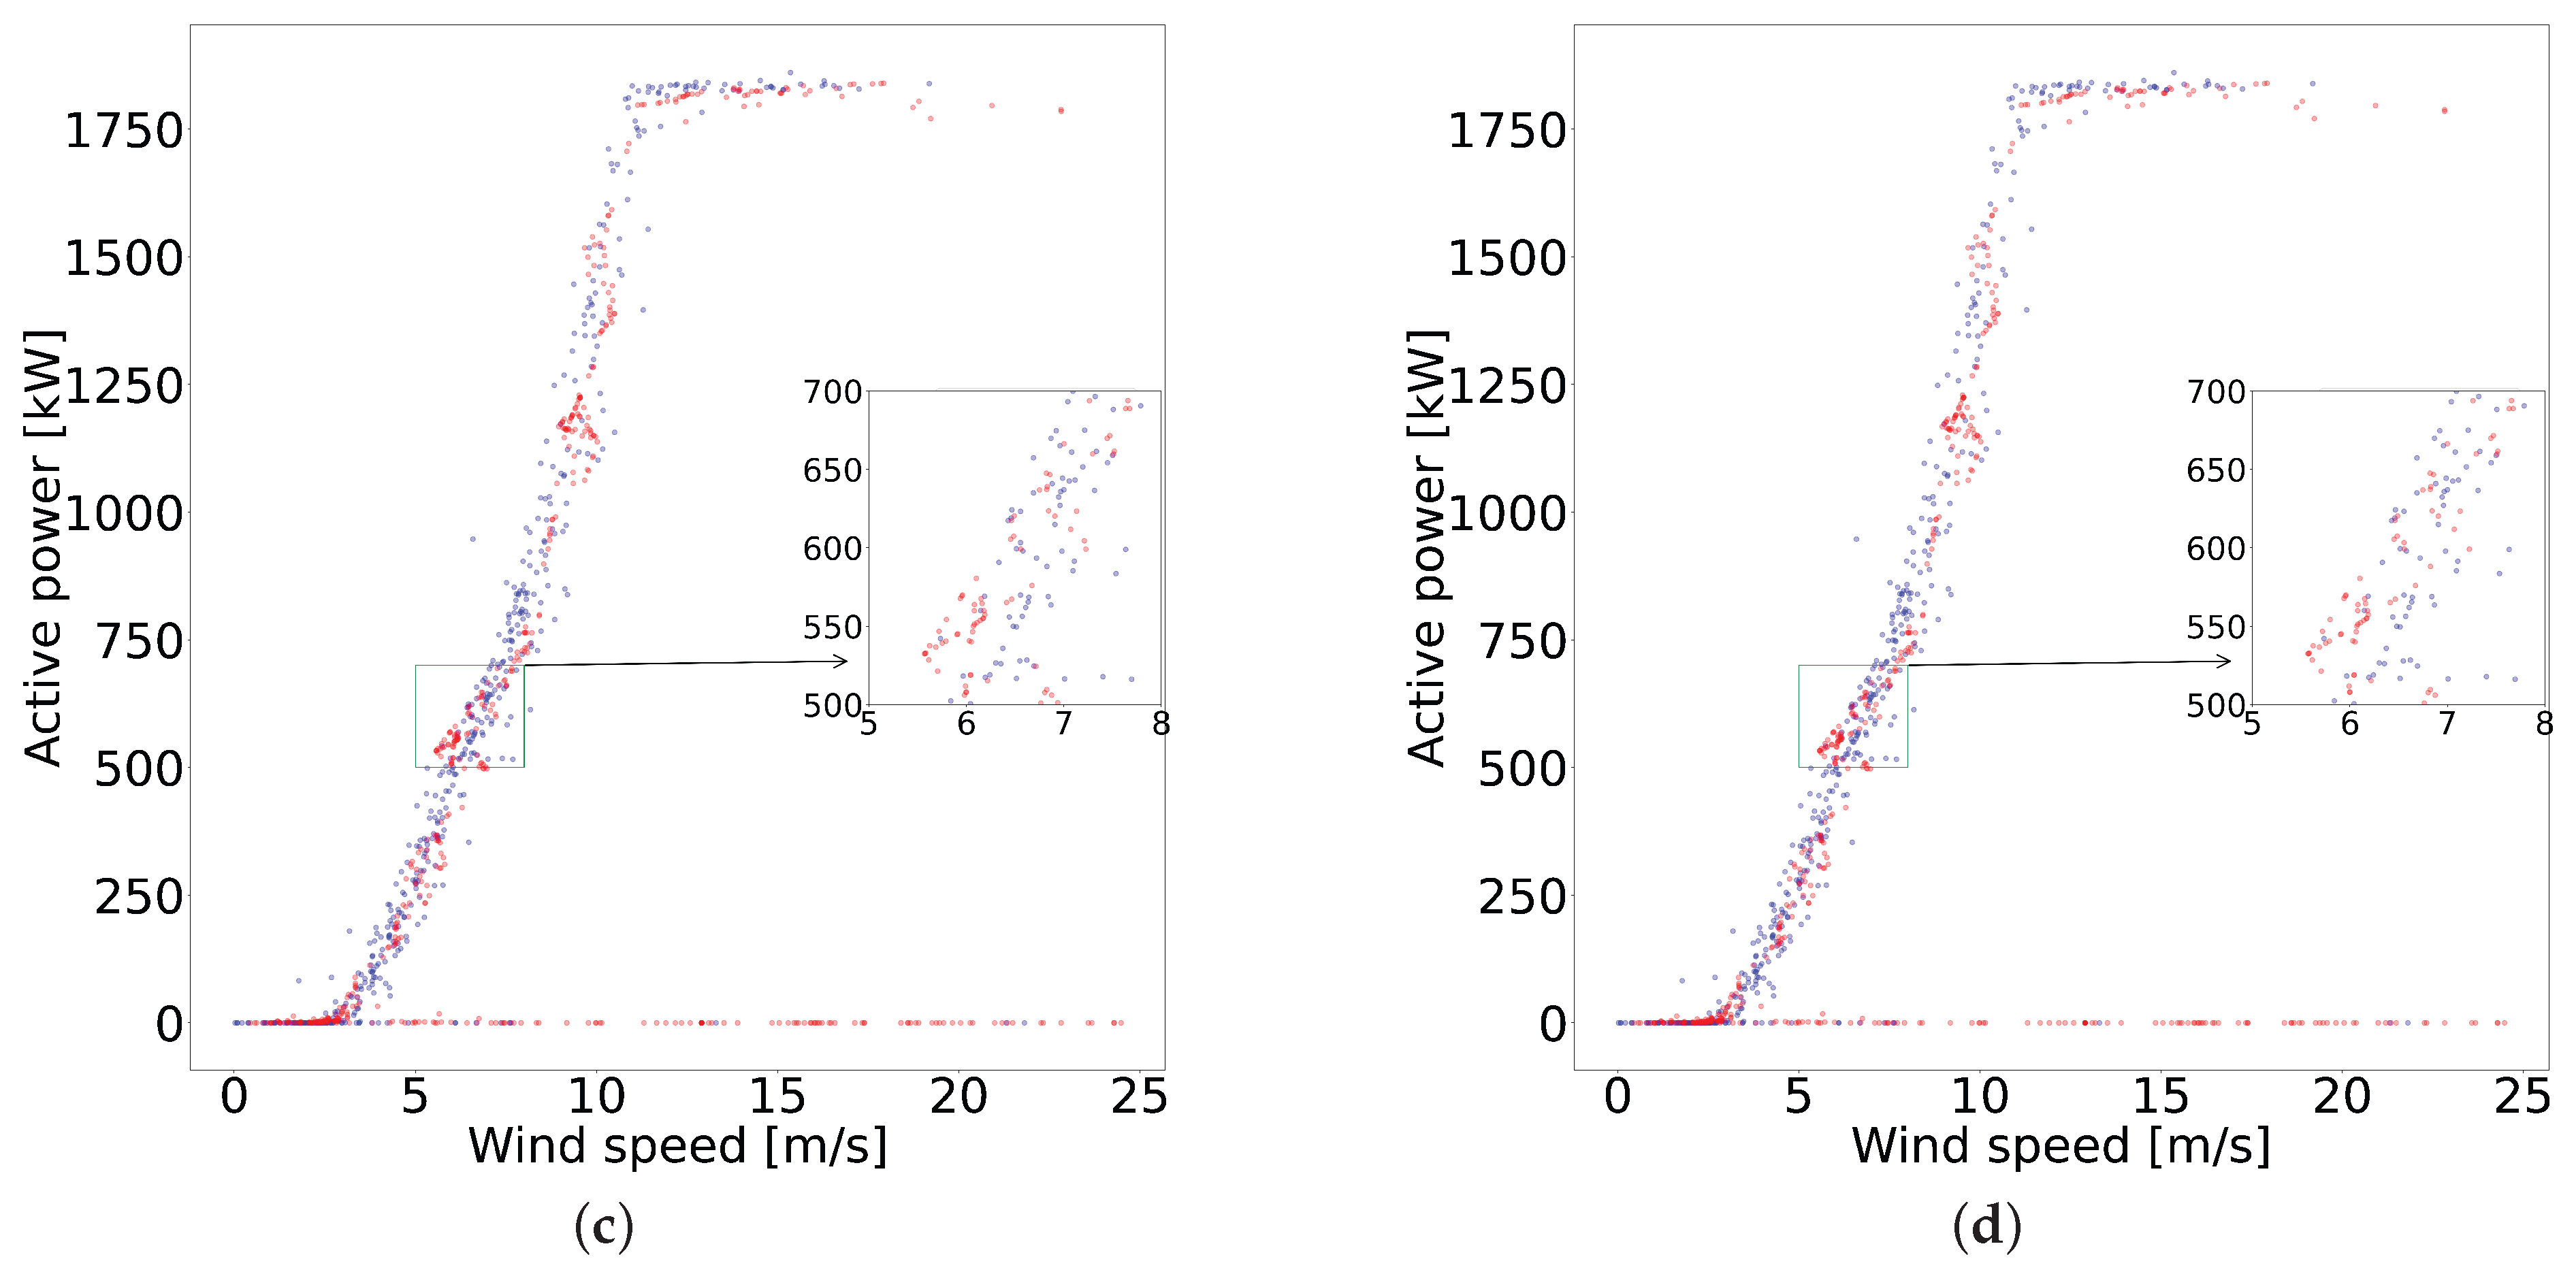
  • We carried out an exhaustive analysis of the SCADA operating data and alarms. In the case of operational data, their high sampling frequency allowed us to better observe the behavior patterns in the variables of interest.
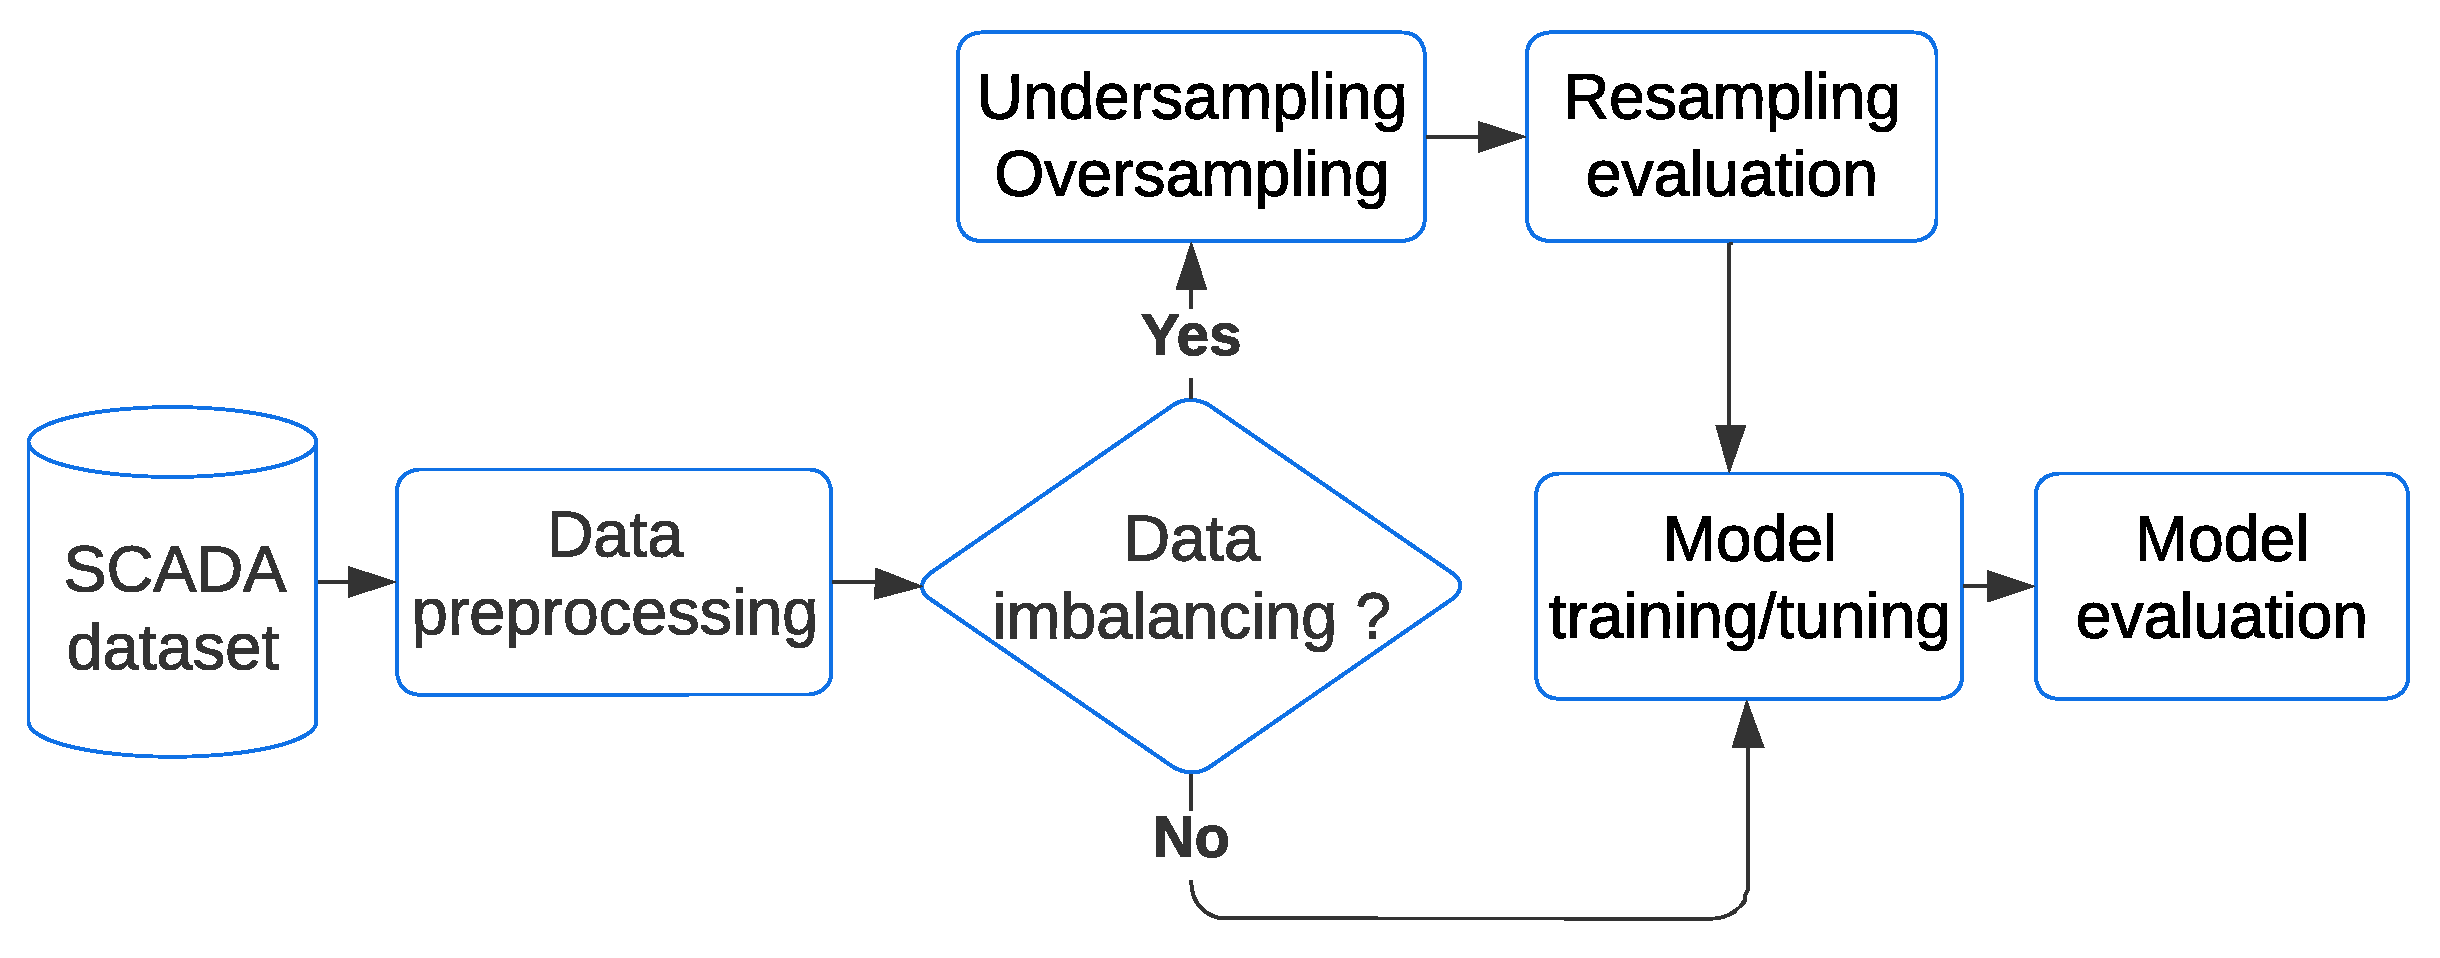
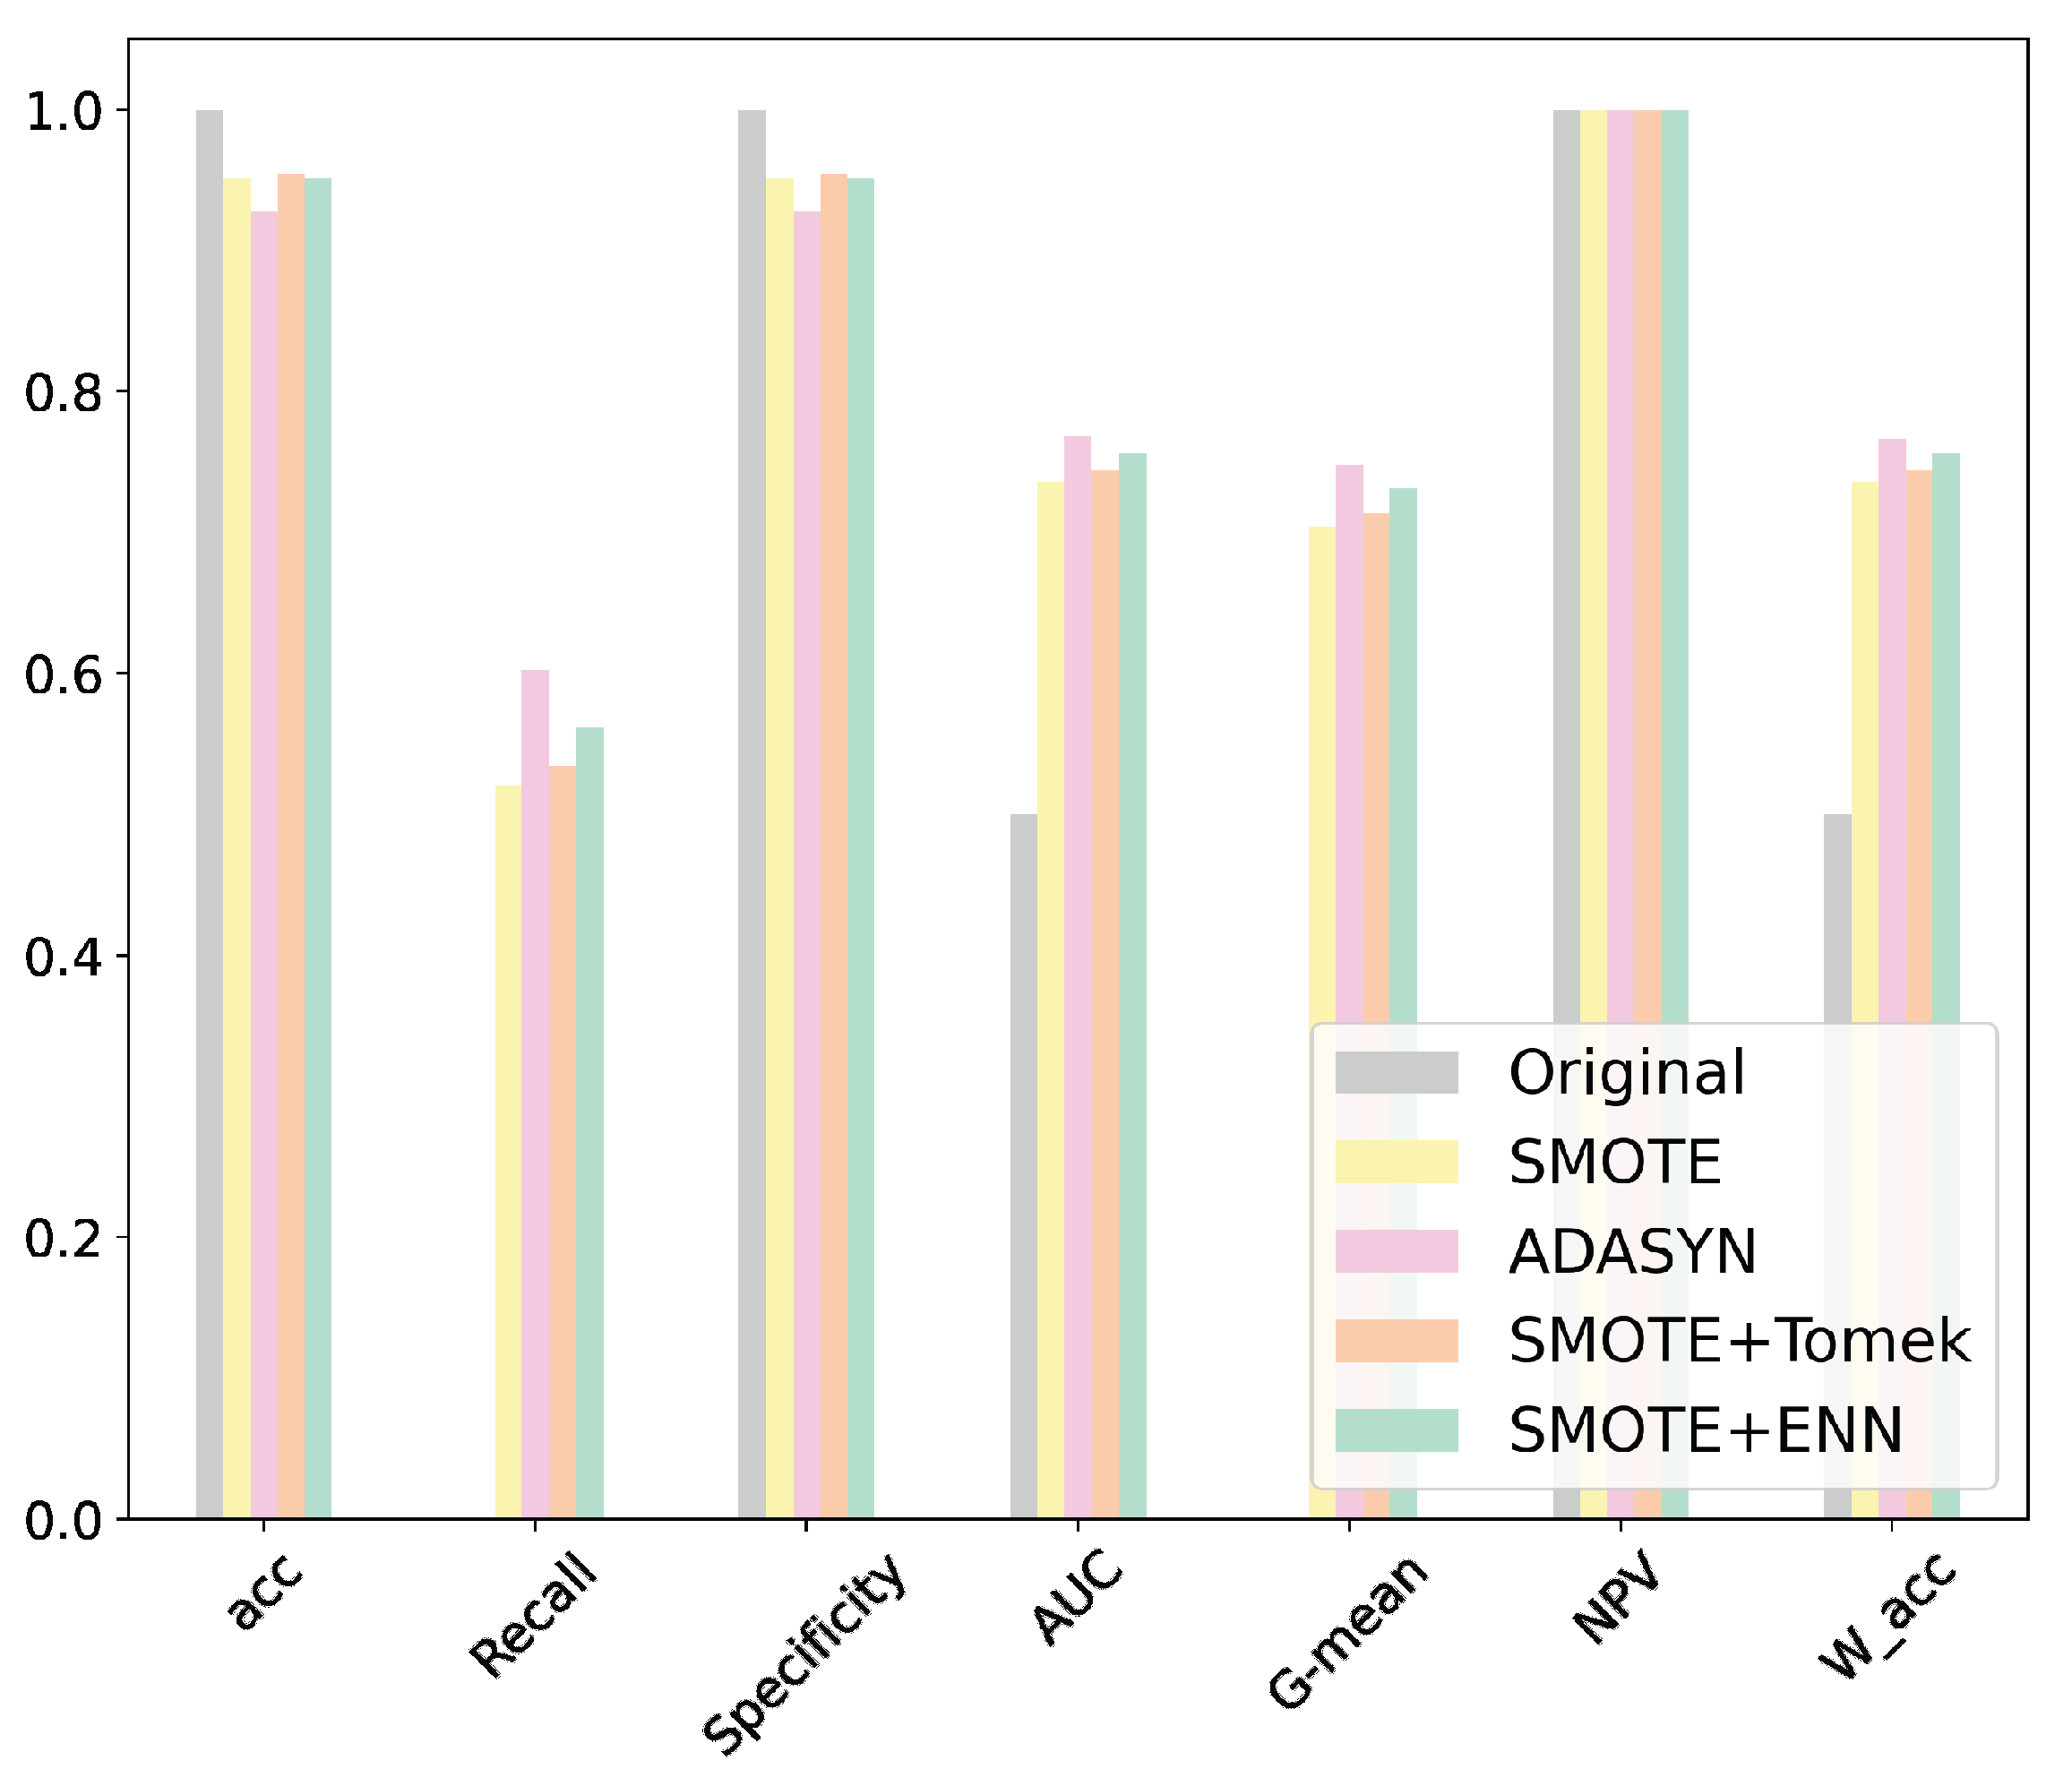
  • We used different resampling techniques to analyze our dataset, which is characterized by a severe imbalance between classes (normal and faults), with an approximate imbalance rate of 10,000:1. To reduce the classification bias of the data toward the majority class, the data were resampled in the training set with different oversampling methods.
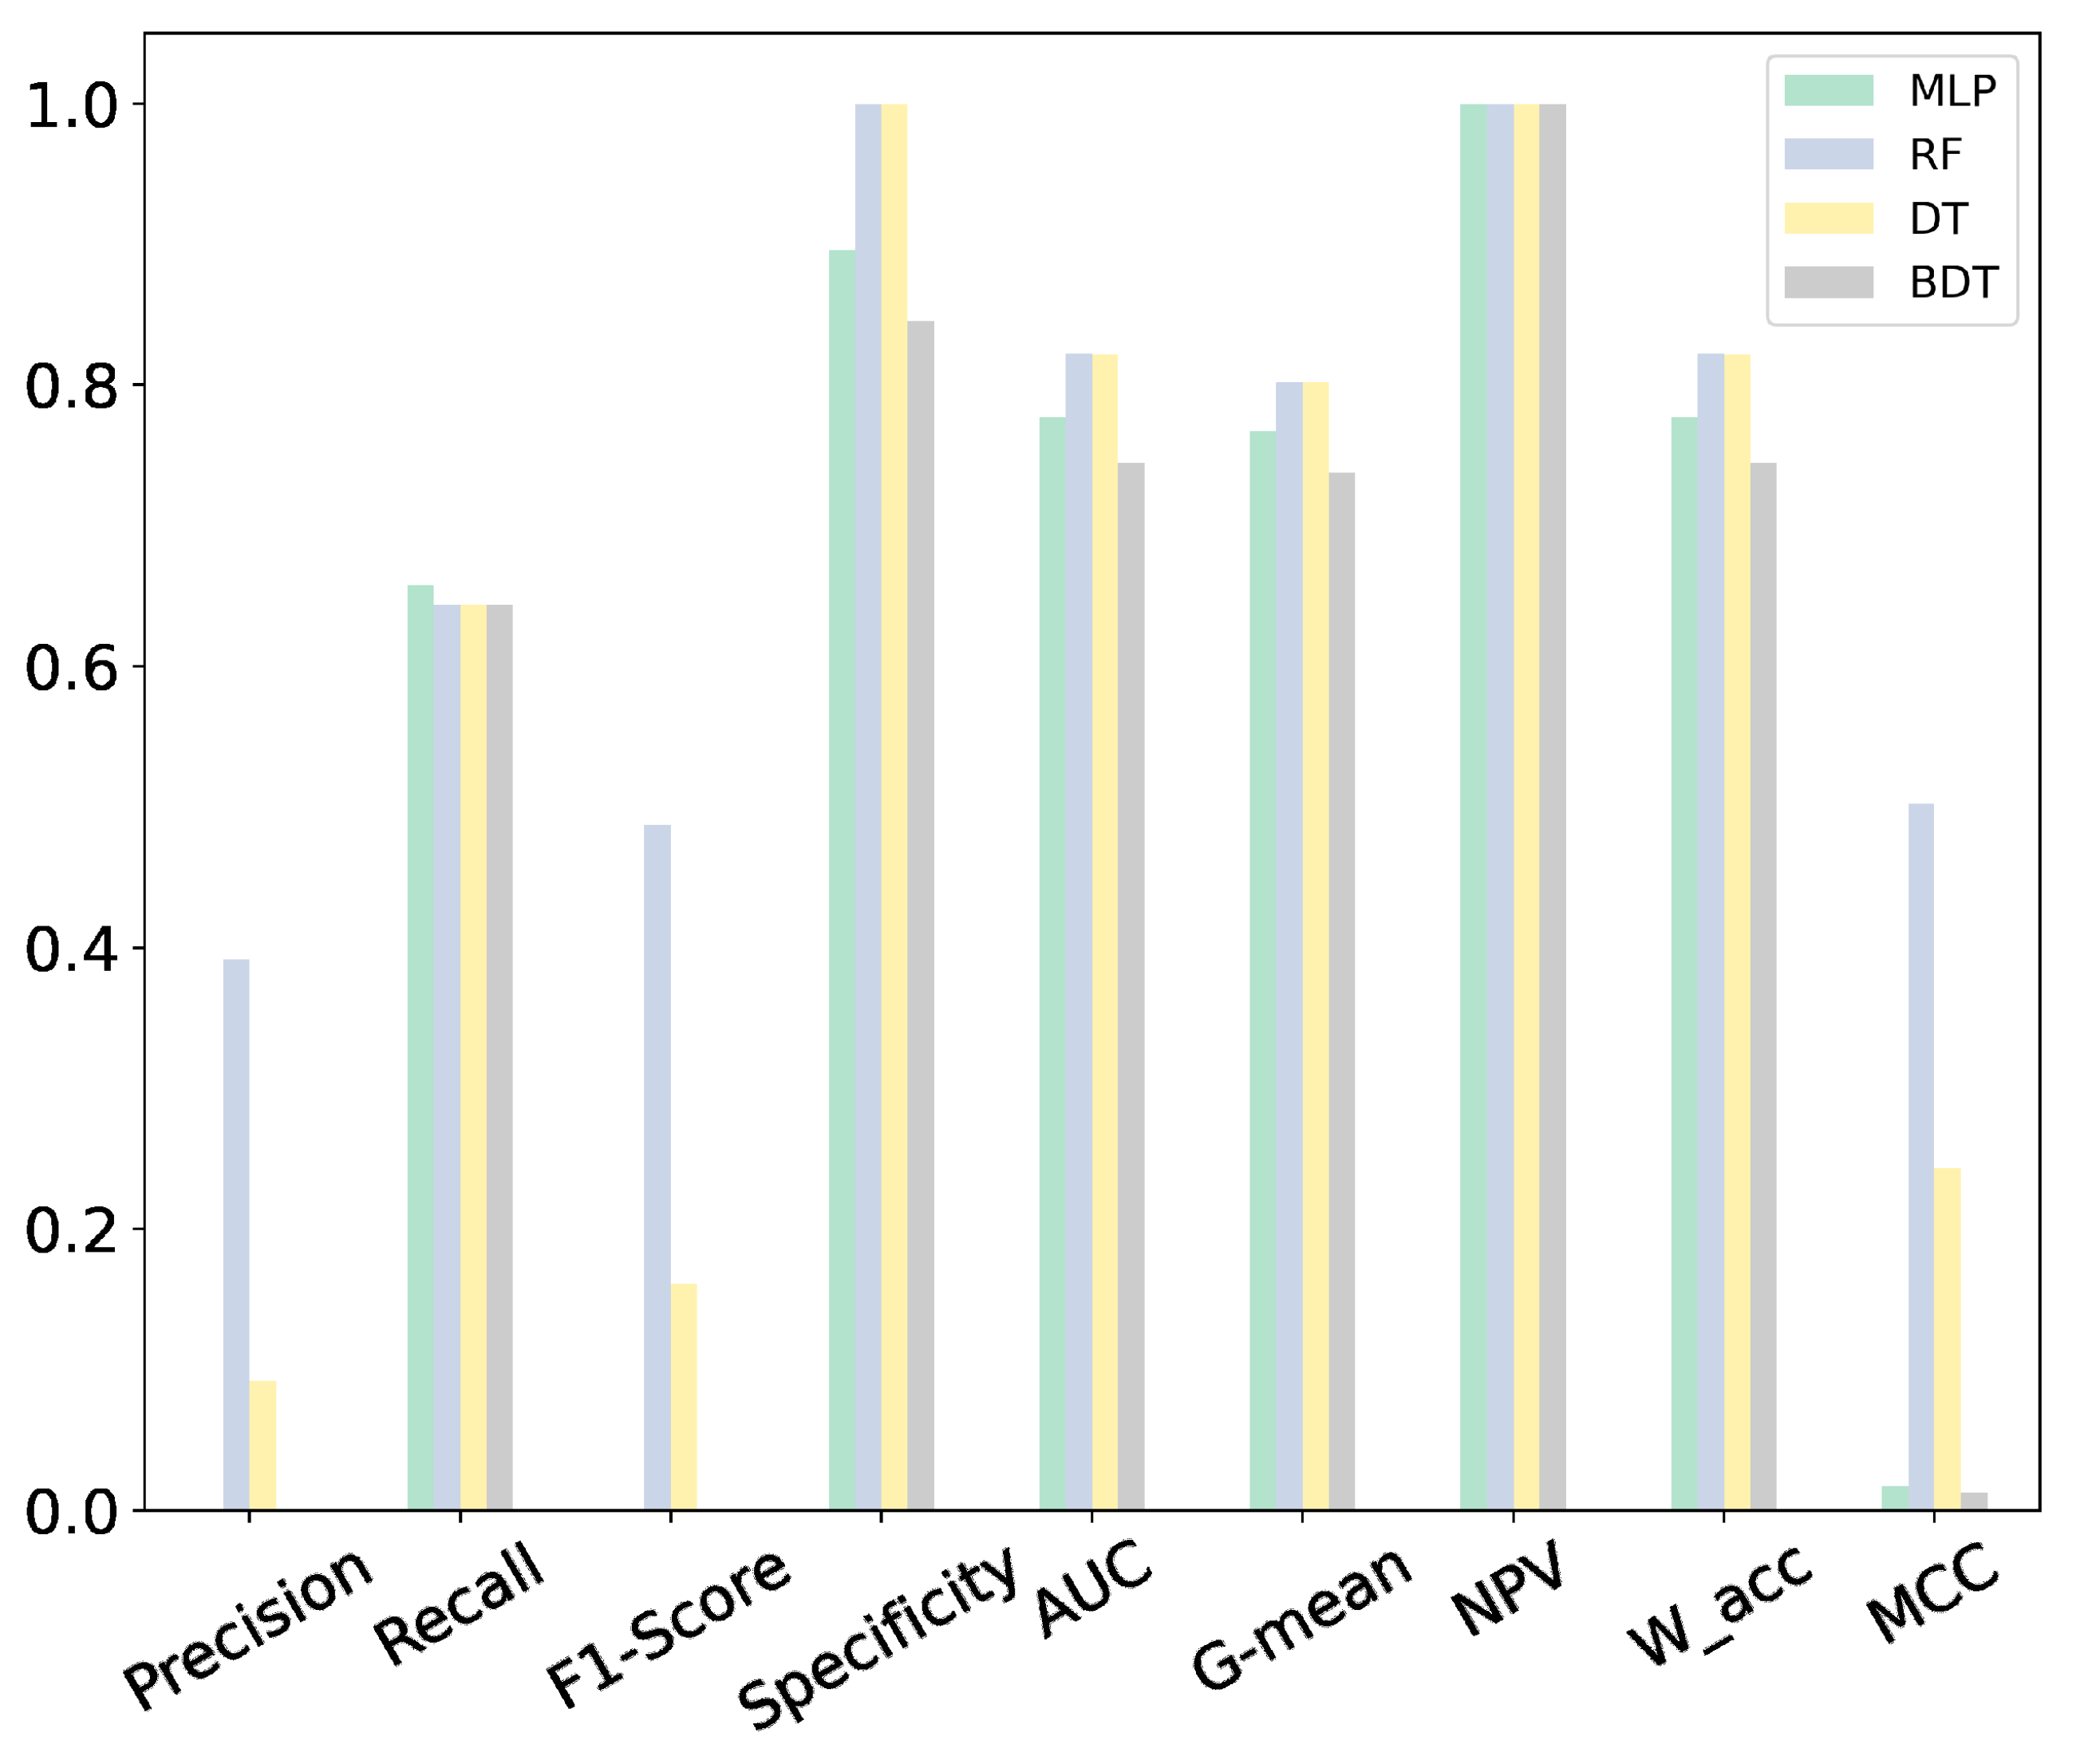
  • Using different metrics, we compared the performance of four binary classification algorithms. We tried to use evaluation metrics that measure the overall performance of the classification algorithms without solely focusing on one particular class.
Following this introduction, the paper is structured as follows: Section 2 describes the state of the art and motivation of the present work. Section 3 presents the dataset used for the analysis and the different methods implemented. The results are described in Section 4, including the performance metrics. Finally, the conclusions drawn from the analysis are summarized in Section 5, and the acknowledgments are included.

2. State of the Art and Motivation

A dataset is defined as imbalanced when the classification categories are not equally represented [6], which generally occurs in industrial rotating machinery for failure data versus normally operating data.
A recent work, presented in [7], performs a state-of-the-art review on intelligent machine fault diagnosis using small and imbalanced data. The research results are divided into three categories: data augmentation-based, feature learning-based, and classifier design-based. The authors conclude that the data augmentation-based strategy using the Synthetic Minority Oversampling Technique (SMOTE) can effectively enlarge the volume of fault data; the feature learning-based strategy identifies faults accurately by extracting features from small and imbalanced data, whereas the classifier design-based strategy achieves high accuracy in fault diagnosis by building classifiers suitable for small and imbalanced data. Additionally, Ref. [8] proposes a deep learning (DL) model with data pre-processing and hyper-parameter tuning to achieve early anomaly detection in WTs. The imbalanced classes in the records are addressed by SMOTE, with the experimental results showing that the proposed model can identify possible failures 72 h before they occur.
In [9], a Minority Clustering SMOTE method (MC-SMOTE) is proposed, which involves clustering minority class samples to improve classification performance. Here, minority class samples are clustered and then combined with SMOTE. Subsequently, an experiment is performed on real SCADA data on WT blade icing, the results of which demonstrate the superiority of MC-SMOTE over SMOTE. Additionally, in [10], an imbalance learning algorithm based on the SMOTE (Easy-SMT) technique is proposed and augments the faulty classes. The feasibility and effectiveness of the proposed method in a real WT icing fault forecasting challenge are determined. The experiments show that Easy-SMT achieves better performance in binary and multi-fault classifications.
Similarly, in [11], the MiniBatch K-means clustering algorithm is combined with SMOTE (MBK-SMOTE), allowing for the distribution of samples to be balanced. The authors then use the Random Forest (RF) algorithm to predict icing on WT blades, concluding that MBK-SMOTE significantly improves prediction accuracy.
Another method to diagnose WT blade icing faults is presented in [12]. To overcome the shortcomings of data imbalance, a Safe Circle SMOTE (SC-SMOTE) is proposed and a fault diagnosis method based on an improved k-Nearest Neighbor (kNN) classification is adopted. The experimental results show the effectiveness of the method.
Furthermore, in [13], different analysis techniques are applied to imbalanced SCADA data to improve temperature-related faults of the gearbox of a WT. Principal Component Analysis (PCA) is used for data modeling and reduction, and an oversampling technique is used for imbalanced data, which is able to increase the information per sample. The combination of these techniques leads to a better performance of the classification algorithms.
To overcome the problem of data imbalance between the majority and minority classes, and the problem that models tend to be biased toward the majority class, a new intelligent fault diagnosis methodology based on Deep Neural Networks (DNNs) is proposed in [4]. Here, the problem of imbalance between classes is tackled by learning a deep representation that can preserve within-class information and between-class information. The effectiveness and generalization of the proposed method are validated on SCADA data from two WTs.
Meanwhile, a new Spatio-Temporal Multiscale Neural Network (STMNN) is presented in [14], to extract fault features from imbalanced SCADA data and execute the multi-class fault diagnosis of WTs. To address the SCADA data imbalance problem and improve the fault diagnosis performance, the model adopts Focal Loss (FL) as the loss function; the experiments show that the STMNN method achieves the best performance.
In [15], a novel approach based on the Synthetic and Dependent Wild Bootstrapped Oversampling Technique (SDWBOTE) is proposed for fault detection and localization of WTs with imbalanced data. The authors design an improved oversampling algorithm to generate the balanced dataset. They then introduce Convolutional Neural Networks (CNNs), with experimental results of seven cases using the datasets collected from two real wind farms in China to validate the effectiveness and robustness of the proposed approach.
A further work is presented in [16], which aims to predict fault-related alarms in WTs. SCADA data are analyzed, and SMOTE is used to balance the classes. Then, Support Vector Classifiers (SVCs) and Decision Trees (DTs) are compared, and the obtained performance results incline DT to be selected for the prediction model. Additionally, an investigation on WT gearbox failure diagnosis is presented in [17], the aim of which is to identify the most suitable classification technique that least depends on the imbalance level of the dataset. The authors conclude that DT is the most suitable prediction model for this task.
Moreover, in [18], a fault diagnosis algorithm combining SMOTE with adaptive Transfer Learning (TL) is proposed. A case study demonstrates that the proposed algorithm can effectively train models with highly imbalanced data and identify the types of faults and the time windows in which they occur. In [19], models are developed using Artificial Neural Networks (ANNs) to characterize the behavior and predict failures of the WT, gearbox, and generator. The proposed method is tested on real WTs in Italy to verify its effectiveness.
An approach for detecting faults in WT converters using CNN and SCADA data is presented in [20], finding that the accuracy of the proposed model is up to 98% compared to other models.
In [21], TL algorithms on SCADA data are used for WT fault diagnosis. TL algorithms are used to solve the data imbalance problem and two failure modes are compared with the proposed algorithm, which is shown to perform better in dealing with data imbalance. A study on WT failure data is presented in [22], demonstrating through case studies that the proposed system can effectively detect failure events in the generator, the transformer, and the hydraulic system. Another experimental study shows that, by using SCADA data, SMOTE, and ML tools, WT failures can be predicted with 80% accuracy 18 days in advance [23].
While the above shows that SMOTE has been successfully used in a number of studies for imbalanced datasets in the wind industry, other oversampling techniques are widely used in the AI community and, in some cases, may be more effective than SMOTE. This is the case of Adaptive Synthetic Sampling (ADASYN) and Ranked Minority Oversampling of Minorities in Boosting (RAMOBoost). However, as stated in [24], these have not yet been used for the condition monitoring (CM) of WTs. Other studies that motivated this work were [25,26,27,28,29,30,31,32].
In summary, there are a considerable number of scientific studies that combine techniques for treating imbalanced SCADA data with the application of ML models in specific problems of WT fault detection. Several factors, such as ice accumulation on the blades, gearbox heating, and converter component malfunctions, among others, can cause these failures. However, studies using highly imbalanced and high-frequency SCADA data for WT generator fault detection are limited. We aim to fill this research gap, providing new perspectives and innovative solutions.
Table 1 summarizes the most relevant articles analyzed in this work. The objective is to succinctly show the different data resampling techniques used in WT fault detection research. Likewise, the AI algorithms used, the WT component or subsystem on which the study is focused, and the results achieved are shown.
In particular, the results column offers the reader the possibility of comparing the performance of the algorithms used in fault detection based on the metrics of precision, recall, F1-Score, Area Under Curve (AUC), accuracy (acc), geometric mean (G-mean), and Matthews Correlation Coefficient (MCC).

3. Materials and Methods

This section describes the dataset used in the present work and the methodology implemented. The methodology includes algorithms to tackle the class imbalance problem and, subsequently, the ML algorithms for fault detection. The complete process is summarized in Figure 1.

3.1. Data Description

This paper analyzes high-frequency SCADA data from an operating onshore wind farm located in the province of Albacete in Spain for a period of nearly a year, representing a total of 782,233 records. Due to a confidentiality agreement between the wind farm owners and the authors, the wind farm name is anonymized in this study.
The SCADA data specifically correspond to a pitch-controlled WT Gamesa G90-2MW, equipped with a doubly fed induction generator (DFIG). The SCADA system of the WT under study collects 20 variables every 30 s.
In order to reduce the full dataset, a correlation matrix was used to determine the most suitable variables for the study. The matrix shows the color-coded Pearson’s correlation coefficient scale for each pair of variables. In this study, we have chosen this correlation method for its ability to calculate the correlation between quantitative variables and to identify linear relationships between variables in the SCADA dataset.
As can be seen in Figure 2, there is a low correlation between the different temperatures and the different power-related variables. Regarding the speed-related variables, these present a medium-high correlation with the power-related ones, as opposed to the former with the temperature-related variables, which again show a low correlation.
After analyzing this matrix, the following variables were selected for the study: wind speed, slip ring temperature, stator temperature, ambient temperature, rotor power, stator power, and rotor speed. These variables were selected based on the target variable. In this study, stator power is the target variable as it is closely related to the generator. In addition, the authors made a final selection of the resulting variables based on their domain knowledge.
Besides the variables shown, the SCADA system also collects alarms and warnings, which indicate abnormal behavior in the operation of WT components or system-operating states. According to [33], alarms can be classified into general alarms, operational alarms, environmental alarms, and communication alarms.
During the period of study, the SCADA system recorded generator failures that resulted in WT shutdown. In addition, a few days prior to these failure events, running alarms associated with failure, which did not involve WT shutdown, were recorded. These operating alarm records were considered in this study, and their details are presented in Figure 3.

3.2. Methods to Balance the Class Distribution

As previously explained, imbalanced training datasets can negatively affect the performance of most ML algorithms, with it thus being necessary to balance the class distribution prior to implementing fault detection using ML.
In this study, the WT failure data represent the minority class. The majority class (no anomaly or class 0) represents 99.99067% of the dataset, while the minority class (anomaly or class 1) represents 0.00933% of the dataset, with an imbalance ratio of close to 10,000:1.
Data resampling is an effective strategy for balancing the class distribution. The two main data resampling methods for the training dataset are oversampling and undersampling. Undersampling is the method by which the number of instances or samples of the majority class are removed. Among the most commonly used undersampling methods are random undersampling, near miss undersampling, and Tomek Links undersampling [34].
The oversampling technique aims to increase the number of instances or samples of the minority class until the training dataset is balanced. The most commonly used oversampling methods are random oversampling [13] and SMOTE, the latter having several variations, such as Borderline-SMOTE [35].
Another oversampling technique is ADASYN, which has been widely applied in the healthcare domain, but has not been used with WT SCADA data. In the present work, ADASYN and SMOTE (including two variations) are proposed.
The ADASYN procedure is briefly described as follows [36].
  • First, the number of synthetic data examples that need to be generated for the minority class is determined:
    G = ( m l m s ) · β
    where m s represents the number of minority class examples, m l represents the number of majority class examples, and β is used to specify the balance level after the generation of the synthetic data, being between [0,1].
  • Afterward, for each example, the minority class ( x i ) , finds k-nearest neighbors based on the Euclidean distance in n dimensional space, and calculates the ratio r i defined as
    r i = Δ i k ; i = 1 , , m s
    where Δ i represents the number of examples in the k-nearest neighbors of ( x i ) , associated with the predominant class.
  • Then, normalize the ratio r i according to
    r ^ i = r i i = 1 m s r i
    where r ^ i represents the density distribution, and i r ^ i = 1 .
  • Finally, the number of synthetic data instances that must be developed is calculated for each x i :
    g i = r ^ i · G
The other technique used in the present work, SMOTE, generates synthetic samples in the feature space formed by samples of the minority class and the KNN. According to [7], the procedure used by the SMOTE algorithm is as follows:
  • The nearest neighbor sample for each minority class sample is found.
  • Random samples to interpolate are chosen among the nearest neighbor samples.
  • The original minority class samples and their neighbor samples are linearly interpolated. The synthetic sample ( χ n e w ) is generated by
    χ n e w = χ + r a n d ( 0 , 1 ) · ( χ i χ ) , ( i = 1 , 2 , , N )
    where χ represents the original samples used to obtain the new samples, r a n d ( 0 , 1 ) is a random number from 0 to 1, which guarantees that χ n e w is on the line joining the original data χ and one of its nearest neighbors, and χ i represents a randomly selected sample among the minority class samples.
In addition, two variations of SMOTE are implemented in the present work, namely SMOTE + Tomek and SMOTE + ENN. Both variations are regarded as hybrid methods, since they combine oversampling and undersampling techniques, providing the best of both techniques for improved results.

3.3. ML Methods for Fault Detection

The present work uses four binary classification algorithms to predict WT failures. These were trained using the default parameters and adjusting the hyperparameters. A brief description of the algorithms used is presented below.
  • Random Forest (RF). Proposed by Leo Breiman in 2001 [37], this is a supervised learning algorithm used for classification or regression problems, which works by building many decision trees, where each tree yields a class prediction, and the class with the most votes becomes the model prediction [38]. The general RF classifier pseudocode used in this study is shown in Algorithm 1.
  • Decision Trees (DTs). Non-parametric algorithms obtained from a set of learning cases, labeled by class and attribute values. This prediction algorithm is suitable for regression and classification problems, although it can be highly unstable, and overtraining should be avoided [39]. Algorithm 2 shows the pseudocode of the DT classifier.
  • Multilayer Perceptron (MLP). ANNs are applied to a sequence of time series forecasting problems. These have an input layer, one or more hidden layers, and an output layer [40]. The advantages of MLP include the ability to withstand elevated levels of noise in the input data and to learn independently of the linear and nonlinear relationships existing in the variables under study.
    For the binary classification problem, the MLP can be described as
    y ( x ) = φ · ( i = 1 n W i X i + b )
    where W i denotes the weights associated with the neuron, X i are its inputs, b is the bias, and φ is the transfer or activation function.
Algorithm 1: Random Forest Classifier
Energies 17 01590 i001
Algorithm 2: Decision Tree Classifier
Energies 17 01590 i002
  • The MLP structure used in this study consists of four hidden layers in addition to the input and output layers. The activation functions of the hidden layers are rectified linear unit (ReLU) and Sigmoid for the output layer. In addition, in the first hidden layer, a dropout rate equal to 0.5 was applied to avoid the model overfitting problems. The MLP pseudocode is shown in Algorithm 3.
  • Boosting Decision Tree (BDT). In this algorithm, each tree depends on the previous trees (boosting). Therefore, each tree has information about the errors made by the previous one, thus helping to refine the result [10]. The pseudocode for the BDT classifier employed in this study is presented in Algorithm 4.
Algorithm 3: Multilayer Perceptron Classifier
Energies 17 01590 i003
Algorithm 4: Boosting with Decision Trees Classifier
Energies 17 01590 i004

3.4. Metrics Used to Quantify the Prediction Accuracy

Various performance metrics are used to quantify prediction errors of oversampling methods, on the one hand, and of ML methods, on the other hand. The metrics selected for use in the present study are accuracy (acc), recall, precision, AUC, specificity, F1-Score, geometric mean (G-mean), Negative Predictive Value (NPV), weighted accuracy (W_acc), and Matthews Correlation Coefficient (MCC). Of these, acc, recall, specificity, AUC, G-mean, NPV, and W_acc are specifically useful for classification models with imbalanced data since they focus specifically on the performance of a class [13,23].
Conversely, acc can be a very unreliable metric when the class distribution is highly biased [4,11], and is thus not used in this study to evaluate the ML methods for fault detection.
All of the above-mentioned metrics are briefly described as follows, where TP, TN, FP, and FN refer to true positives, true negatives, false positives, and false negatives, respectively.
  • Acc: The total percentage of correctly classified elements is given by the total number of correct predictions divided by the total number of m predictions (Equation (7)).
    a c c = T P + T N m
  • Recall: Known as True Positive Rate, this is the percentage of positive instances correctly classified, i.e., the ability of the model to predict the class correctly, as shown in Equation (8). Recall is useful for failure prediction as it effectively measures the minority class prediction coverage [13].
    r e c a l l = T P T P + F N
  • Precision: As indicated in Equation (9), precision measures the number of positive class predictions that belong to the positive class. In other words, precision refers to the number of positive items that the model properly detected out of all the potentially positive elements [9].
    p r e c i s i o n = T P T P + F P
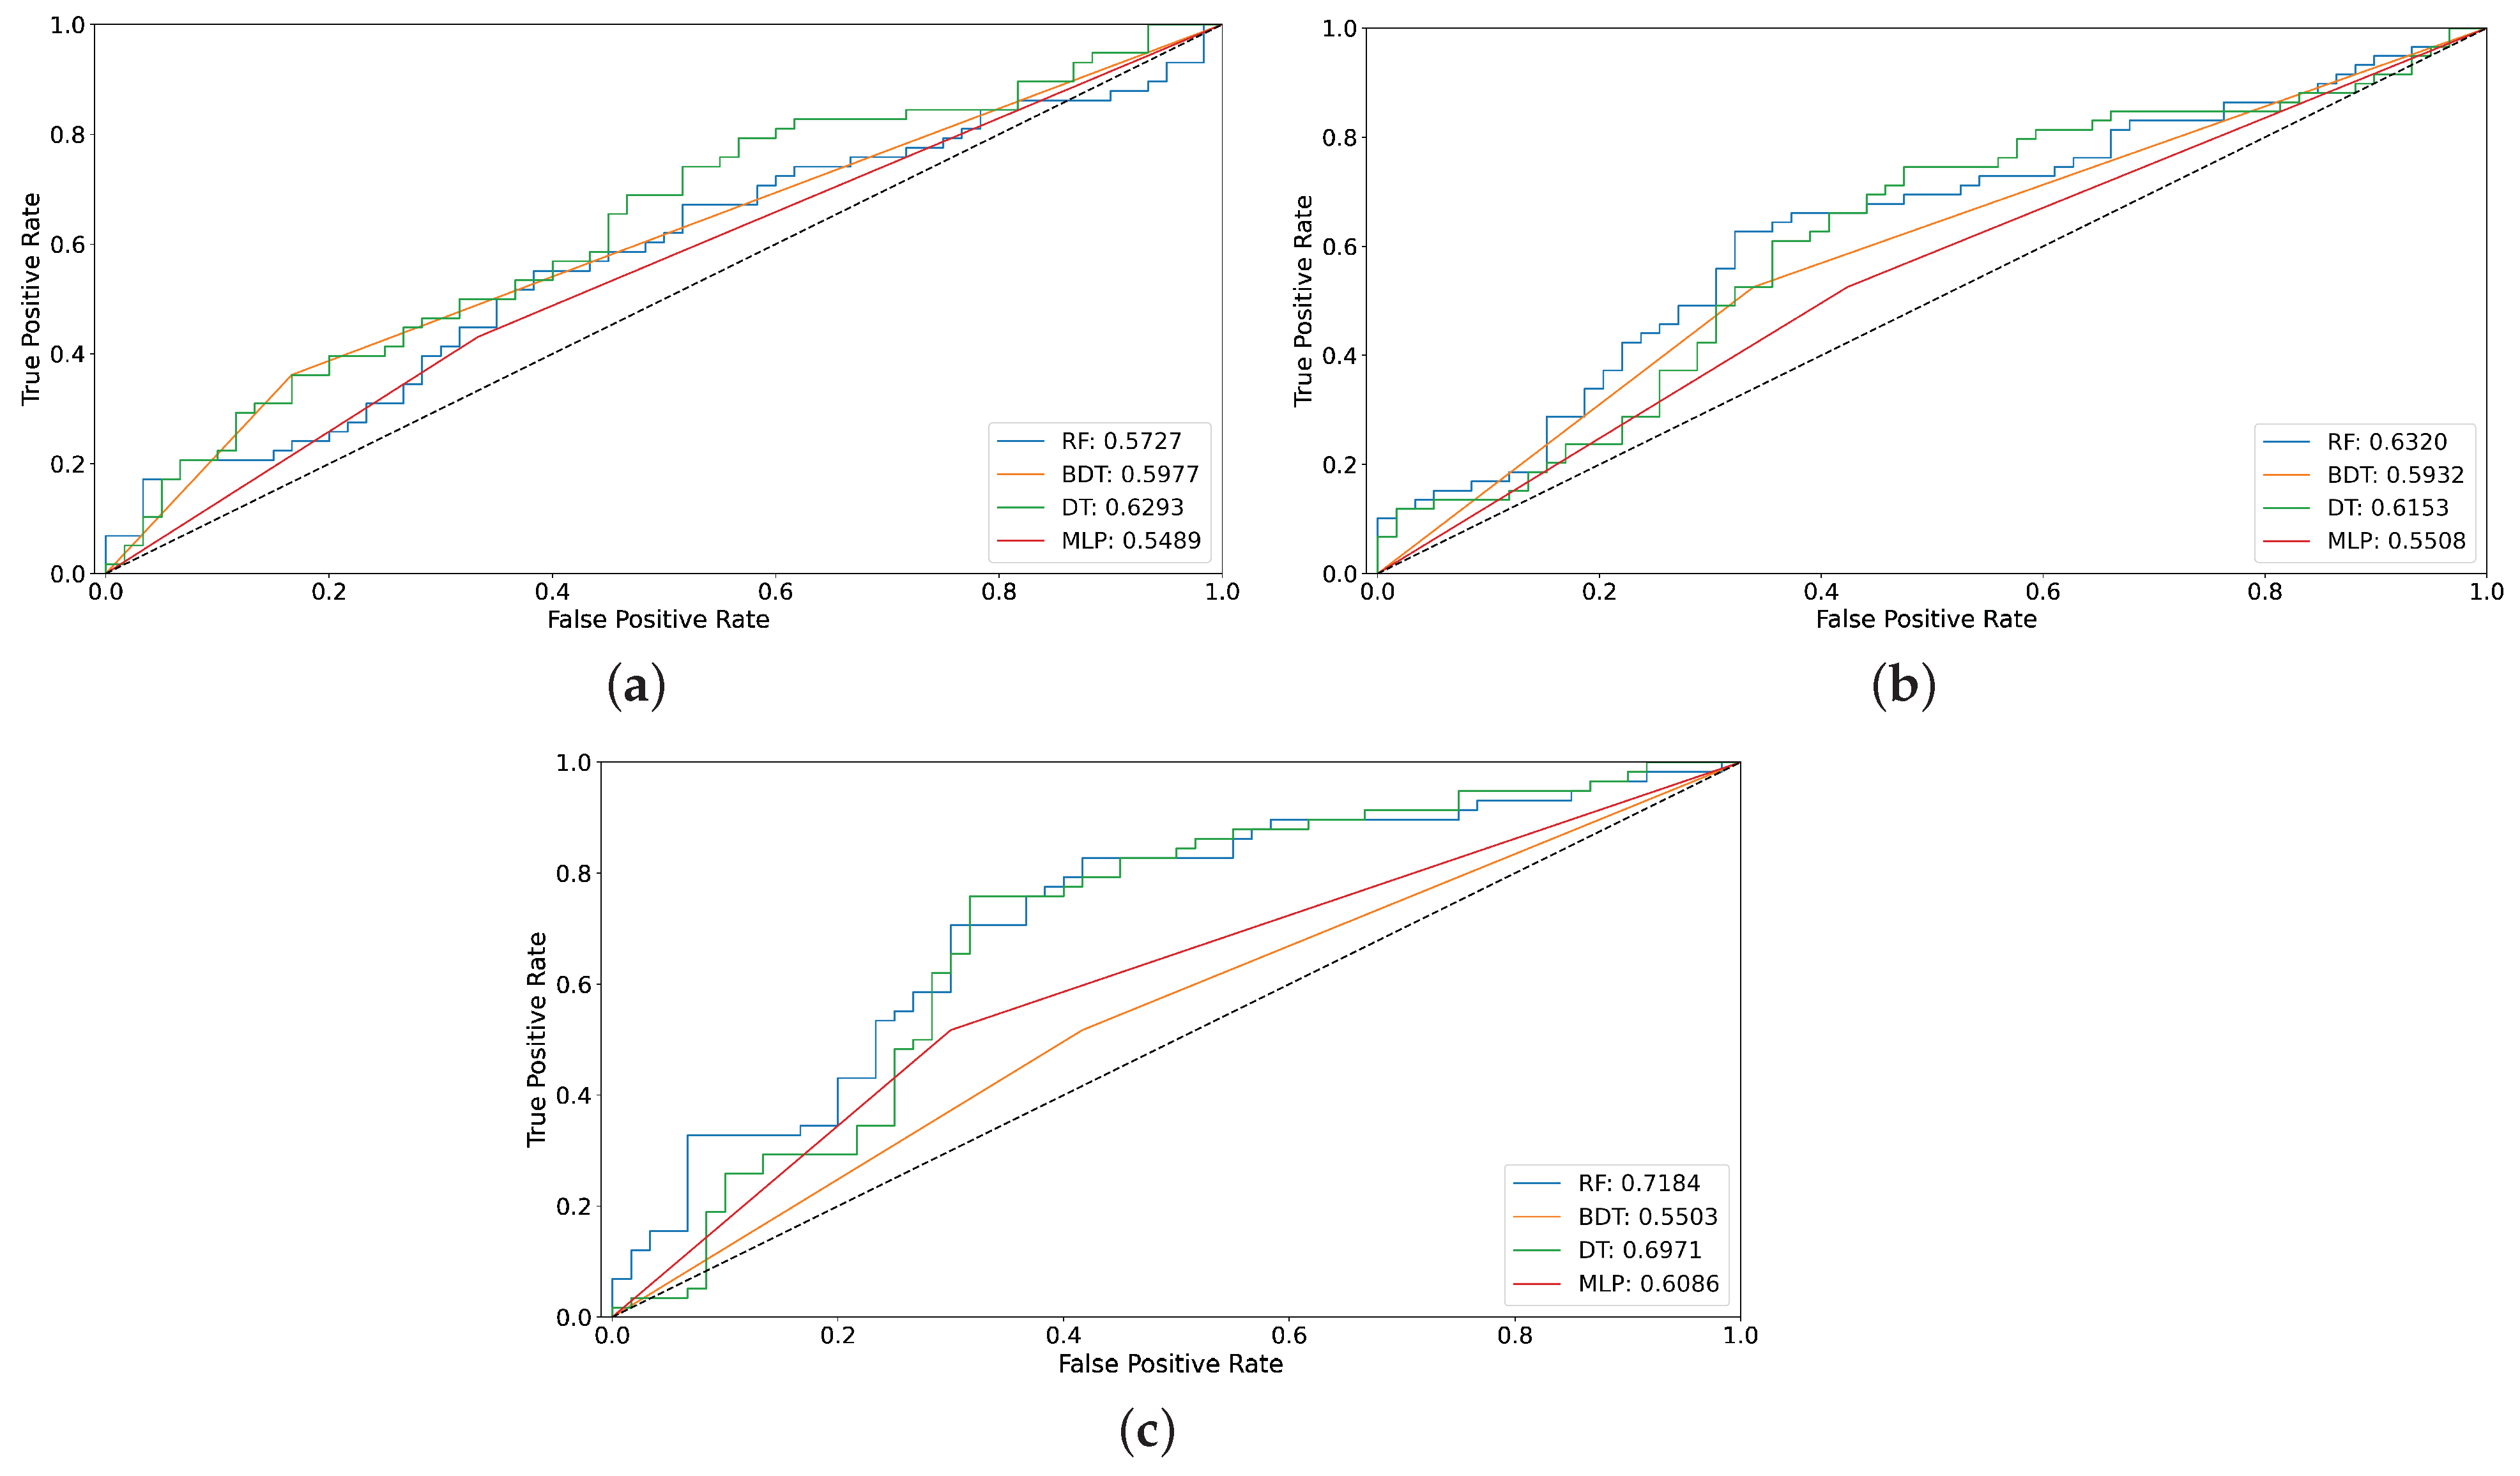
  • AUC: This metric represents the area under the ROC curve. The ROC (Receiver Operating Characteristic) curve is a graph that shows the performance of a classification model. The graph represents the distribution of the True Positive Rate on the y-axis versus the False Positive Rate on the x-axis.
    A U C = r e c a l l + s p e c i f i c i t y 2
  • Specificity: This is a metric that determines the harmonic mean between precision and the recall [13]. Specifically, Equation (11) defines the classification specificity.
    s p e c i f i c i t y = T N F P + T N
  • F1-Score: This is a metric for quantifying model performance. It is useful for imbalanced data because it attempts to find the balance between precision and recall [36]. The F1-Score measure is calculated as follows:
    F 1 - S c o r e = 2 · p r e c i s i o n · r e c a l l p r e c i s i o n + r e c a l l
  • G-mean: This evaluates the performance of the majority and minority classes compared to each other. Although negative cases are successfully classified, a low G-mean suggests poor performance in classifying positive cases [9]. G-mean can be calculated as follows:
    G - m e a n = r e c a l l + s p e c i f i c i t y
  • NPV: This is the ratio of properly categorized negative class labels to the total number of predicted negative labels [13]. The formula for this metric is given by
    N P V = T N F N + T N
  • W_acc: This is the average of the recall and specificity (Equation (15)), and measures the average accuracy of both minority and majority classes. If a classifier performs equally well on both classes, this number drops to the traditional accuracy. In contrast, if the high value of traditional accuracy is due to the classifier exploiting the majority class distribution, the balanced accuracy will be lower than the accuracy [21].
    W _ a c c = 0.5 · ( r e c a l l + s p e c i f i c i t y )
  • MCC: This includes all the elements of the confusion matrix (TP, TN, FP, and FN), as shown in Equation (16). It is the metric least influenced by imbalanced data. It ranges from −1 to +1; a value of +1 indicates a perfect prediction, and −1 indicates the worst possible prediction [17].
M C C = ( T P · T N ) ( F P · F N ) ( T P + F P ) ( T P + F N ) ( T N + F N ) ( T N + F N )

4. Results

This section presents the results after performing the methodology described in Figure 1, with the ultimate goal of improving the fault detection algorithms by improving the imbalance problem.

4.1. Data Resampling

As mentioned in Section 3.2, this study has an imbalance between the normal and fault classes. To delve deeper into the problem of imbalance, a further correlation analysis was performed to determine the relationship between the variables under study for both the normal and anomaly classes of samples.
In this regard, as depicted in Figure 4, a high positive correlation was found between stator power and rotor power (for both class 0 and class 1 samples), which denotes a close relationship between the generator’s electrical and mechanical behavior. Deviations in this correlation during WT operation could be an early indication of possible generator failure.
Moreover, similar correlations were observed between stator power and wind speed and between ambient temperature and slip ring temperature. The latter association can be explained by the direct effect of ambient temperature on the increase in slip ring temperature. On the other hand, the correlations with the other variables were lower due to the dispersion of the samples analyzed.
The differences between the synthetic samples generated with the resampling techniques are visually imperceptible when considering the complete dataset. Therefore, a sample of 10,000 data was selected for better visualization of the resampling on the power curve. Figure 5 shows the application of the four resampling techniques, and a magnified segment of the power curve is used to show how each technique generates different synthetic samples.
The class imbalance problem was then tackled. A DT classifier was used to evaluate the different oversampling techniques. This decision was taken due to the computational benefits of this algorithm [41], which is crucial due to the considerable volume of data being processed in this study. The experiments were carried out with the hyperparameters shown in Table 2.
The results of applying the oversampling techniques to the complete dataset were analyzed using the specific metrics selected, explained in Section 3.4, and shown in Figure 6. As can be seen, the ADASYN technique performed best, yielding the following metrics: acc = 92.80%, recall = 60.27%, specificity = 92.80%, AUC = 76.85%, G-mean = 74.79%, NPV = 99.99%, and W_acc = 76.58%.

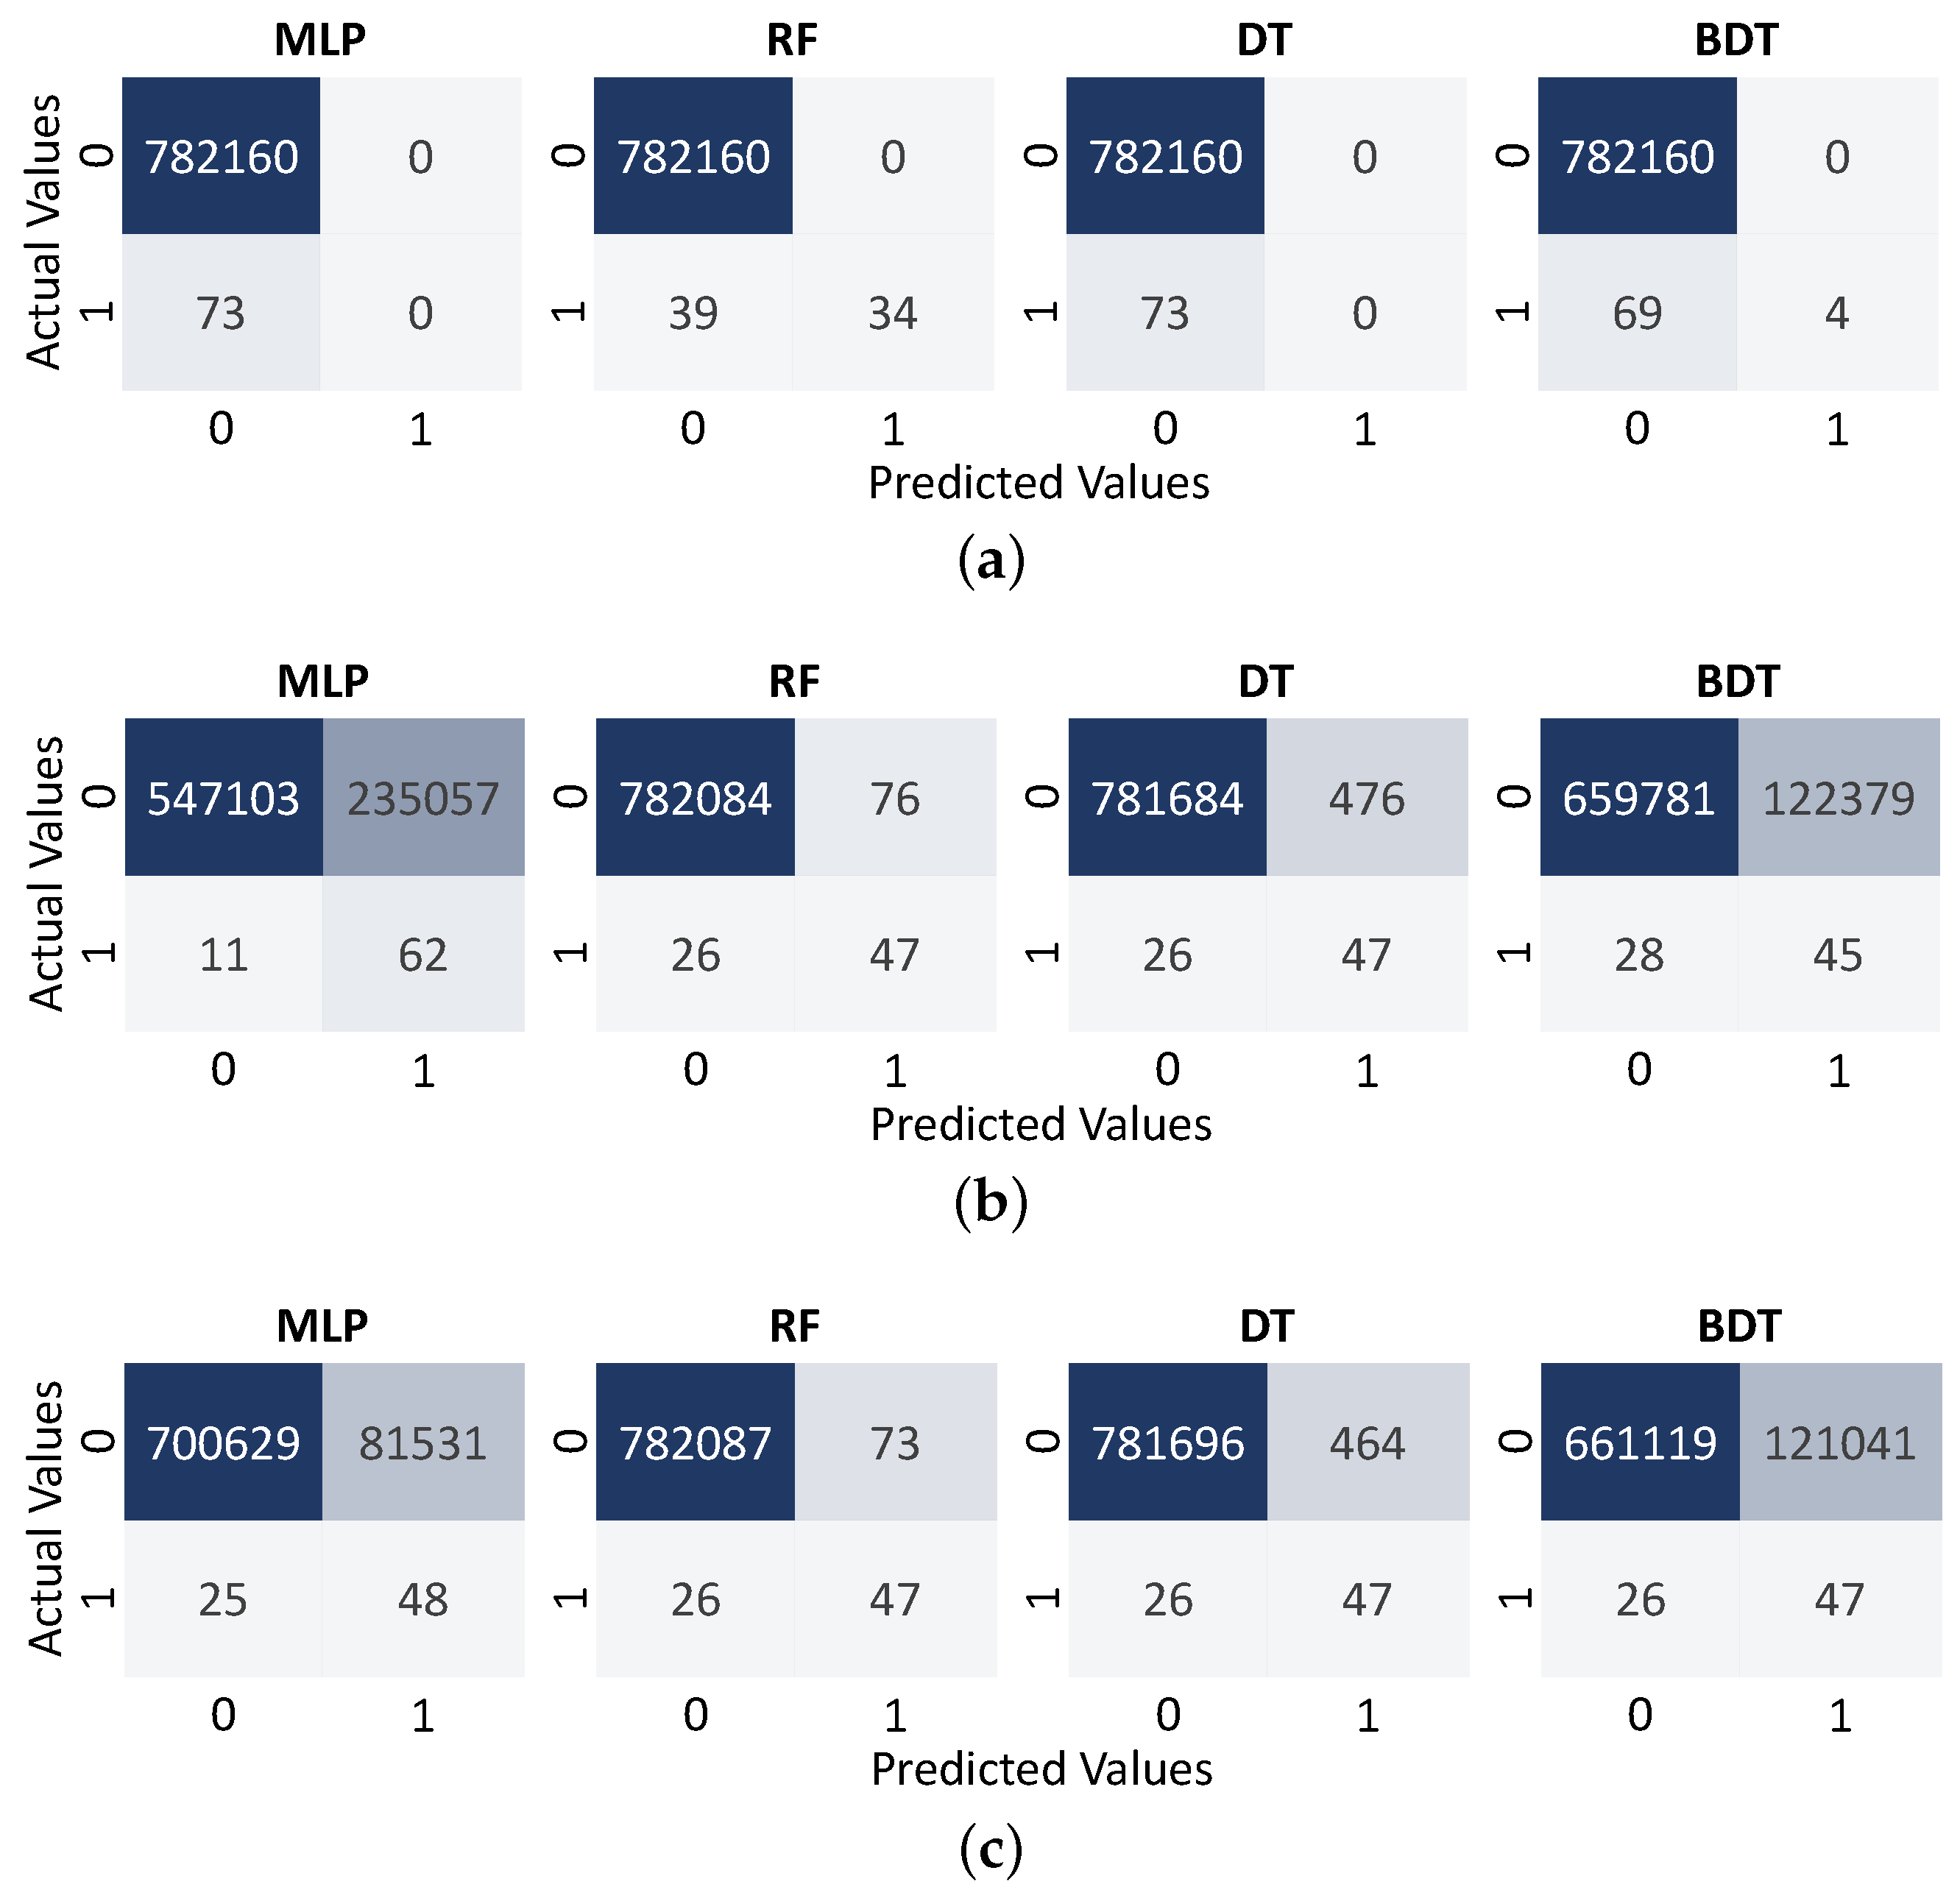
4.2. Performance of Classification Algorithms

After having implemented (and analyzed) the techniques to overcome the class imbalance problem, the fault detection algorithms described in Section 3.3 were implemented, with these being MLP, RF, DT and BDT. To this end, the dataset was first divided into a training set (70% of the data) and a test set (remaining 30% of the data), and various analyses were performed by gradually adjusting the hyperparameters in the specific algorithms.
As in the previous step, the metrics proposed in Section 3.4 were used to quantify the results. Since the aim of this study was to predict generator failures, (i.e., faults – class 1), class 1 is considered the more important one in the analysis. In this sense, recall is regarded as a key metric since one of the objectives in fault classification problems is to minimize the number of false negatives. Erroneous classification of observations as normal operation (class 0) instead of fault (class 1) may cause unplanned downtime and, thus, additional costs in the O&M of WTs.
Table 3 shows the classifiers’ performance when using the resampled dataset using the Adasyn technique, mentioned above as the most effective in terms of resampling. Experimental tests were carried out by varying the values of the hyperparameters. The best performance obtained by each classifier is shown in bold.
The metrics obtained after implementing the ML algorithms are shown in Figure 7. As can be seen, RF is the best performing algorithm, with the following scores: precision = 39.16%, recall = 64.38%, F1-Score = 48.70%, specificity = 99.99%, AUC = 82.18%, G-mean = 80.23%, NPV = 99.99%, W_acc = 82.18%, and MCC = 50.21%. It is also noticeable that, for some metrics, DT reaches values close to those obtained for RF. As previously explained, acc was not used to evaluate the proposed models since it can be very unreliable when the class distribution is highly biased, as is the case here.
The performance of the ML techniques selected for fault detection were further analyzed before and after implementing the oversampling techniques, through confusion-matrix plots and ROC curves.
On the one hand, the results of the confusion-matrix plots prove that, without applying resampling techniques, the classifiers overfit the majority class, as can be seen in Figure 8a. On the other hand, the results of the evaluation of the classifiers trained with the resampled datasets, SMOTE (Figure 8b) and ADASYN (Figure 8c), highlight the performance of RF in classifying faults, especially the minority class.
Finally, the performance of these models was analyzed using ROC curves. As can be observed in Figure 9, the results obtained improve after applying SMOTE and slightly more after applying ADASYN. This is especially true for RF and DT techniques, with RF providing better results than DT.

5. Conclusions

This paper presents a solution for the prediction of faults in the WT generator, which is one of the main components of a WT. The solution is based on high-frequency and highly imbalanced normal-operating SCADA data and fault-related data. The proposed solution includes testing four resampling techniques to compensate for biases that occur in imbalanced classification problems.
The resampling techniques implemented in the present work compare commonly used methods for the CM of WTs, such as SMOTE and its variations, against newer techniques, such as ADASYN, which is used in other fields but has not previously been implemented in the wind energy sector. These oversampling techniques were analyzed using different performance metrics as well as confusion-matrix plots and ROC curves, where ADASYN obtained the highest scores on most evaluation metrics. Furthermore, four classification algorithms for WT generator fault detection were tested before and after implementing the proposed resampling techniques, with RF (after ADASYN) obtaining the best results on different evaluation metrics and showing better results than DT in the confusion-matrix plots and ROC curves.
Therefore, the methodology proposed in this study, developed using high-resolution SCADA data from real WTs, is able to overcome the imbalance problem normally found in operating wind farms and, thus, improve fault detection which will serve to optimize the O&M of WTs.
Future research directions include exploring advanced oversampling methods such as Gaussian Copula Oversampling, Distance-based Arranging Oversampling, and hybrid techniques like SMOTE-NC + RUS (SMOTE for Nominal and Continuous features + Random Under Sampling) to address the imbalance between SCADA system operational data and WT fault data. We will also investigate the use of DL algorithms, such as LSTM, due to their ability to identify complex data patterns without additional resampling techniques. This will allow us to evaluate the benefits and limitations of different models, thus improving the detection of WT faults.

Author Contributions

All authors contributed equally to the conceptualization and methodological design of the proposal; J.M.-C. and M.V.-C. were responsible for data preparation and analysis; J.M.-C. and M.V.-C. prepared the original draft; E.A. and S.M.-M. contributed to the review and editing, and E.G.-L. was responsible for project supervision. All authors have read and accepted the published version of the manuscript.

Funding

This research was partially funded by the Junta de Comunidades de Castilla-La Mancha and the E.U. FEDER (SBPLY/19/180501/000287) and by the Spanish Ministry of Economy and Competitiveness and the European Union (PID2021-126082OB-C21). The authors would like to recognize the assistance received by National University of Loja through the research project 20-DI-FEIRNNR-2023.

Data Availability Statement

The authors do not have permission to share data.

Conflicts of Interest

The authors declare no conflicts of interest.

Abbreviations

The following abbreviations are used in this manuscript:
SMOTESynthetic Minority Oversampling Technique
MC-SMOTEMinority Clustering SMOTE
RFRandom Forest
kNNk-Nearest Neighbor
SC-SMOTESafe Circle SMOTE
DNNsDeep Neural Networks
STMNNSpatio-Temporal Multiscale Neural Network
FLFocal Loss
SDWBOTESynthetic and Dependent Wild Bootstrapped Oversampling Technique
CNNsConvolutional Neural Networks
SVCsSupport Vector Classifiers
DTsDecision Trees
TLTransfer Learning
ANNsArtificial Neural Networks
ADASYNAdaptive Synthetic Sampling
MLPMulti-Layer Perceptron
BDTBoosting Decision Tree
CMCondition monitoring
AUCArea Under Curve
accAccuracy
G-meanGeometric mean
MCCMatthews Correlation Coefficient
TPTrue positives
TNTrue negatives
FPFalse positives
FNFalse negatives
ROCReceiver Operating Characteristic
NPVNegative Predictive Value
W_accWeighted accuracy
Nomenclature
GNumber of examples synthetic data to be generated
m s Number of minority class examples
m l Number of majority class examples
β Balance level after the generation of the synthetic data
x i Examples of the minority class
nDimensional space
r i Majority class ratio within k-nearest minority neighbors
kNumber of nearest neighbors
Δ i Number of examples in the k-nearest neighbors of x i
r ^ i Density distribution
g i Number of synthetic data instances to generate for each x i
χ n e w Synthetic sample to be generated
χ Original samples
χ i Randomly selected sample among the minority class samples
W i Weights associated with the neuron
X i Input vector
bBias
φ Transfer or activation function
mTotal number of predictions

References

  1. Global Wind Energy Council GWEC. Global Wind Report 2023; Technical report; Global Wind Energy Council GWEC: Lisbon, Portugal, 2023. [Google Scholar]
  2. Khanafer, M.; Shirmohammadi, S. Applied AI in instrumentation and measurement: The deep learning revolution. IEEE Instrum. Meas. Mag. 2020, 23, 10–17. [Google Scholar] [CrossRef]
  3. Blanco, M.A.; Gibert, K.; Marti-Puig, P.; Cusidó, J.; Solé-Casals, J. Identifying health status of wind turbines by using self organizing maps and interpretation-oriented post-processing tools. Energies 2018, 11, 723. [Google Scholar] [CrossRef]
  4. Chen, L.; Xu, G.; Zhang, Q.; Zhang, X. Learning deep representation of imbalanced SCADA data for fault detection of wind turbines. Measurement 2019, 139, 370–379. [Google Scholar] [CrossRef]
  5. Maldonado-Correa, J.; Martín-Martínez, S.; Artigao, E.; Gómez-Lázaro, E. Using SCADA Data for Wind Turbine Condition Monitoring: A Systematic Literature Review. Energies 2020, 13, 3132. [Google Scholar] [CrossRef]
  6. Chawla, N.V.; Bowyer, K.W.; Hall, L.O.; Kegelmeyer, W.P. SMOTE: Synthetic Minority Over-sampling Technique. J. Artif. Intell. Res. 2002, 16, 321–357. [Google Scholar] [CrossRef]
  7. Zhang, T.; Chen, J.; Li, F.; Zhang, K.; Lv, H.; He, S.; Xu, E. Intelligent fault diagnosis of machines with small & imbalanced data: A state-of-the-art review and possible extensions. ISA Trans. 2022, 119, 152–171. [Google Scholar] [CrossRef] [PubMed]
  8. Chen, H.; Hsu, J.Y.; Hsieh, J.Y.; Hsu, H.Y.; Chang, C.H.; Lin, Y.J. Predictive maintenance of abnormal wind turbine events by using machine learning based on condition monitoring for anomaly detection. J. Mech. Sci. Technol. 2021, 35, 5323–5333. [Google Scholar] [CrossRef]
  9. Yi, H.; Jiang, Q.; Yan, X.; Wang, B. Imbalanced Classification Based Minority Clustering Synthetic Minority Oversampling Technique with Wind Turbine Fault Detection Application. IEEE Trans. Ind. Inform. 2020, 17, 5867–5875. [Google Scholar] [CrossRef]
  10. Wu, Z.; Lin, W.; Ji, Y. An Integrated Ensemble Learning Model for Imbalanced Fault Diagnostics and Prognostics. IEEE Access 2018, 6, 8394–8402. [Google Scholar] [CrossRef]
  11. Ge, Y.; Yue, D.; Chen, L. Prediction of wind turbine blades icing based on MBK-SMOTE and random forest in imbalanced data set. In Proceedings of the 2017 IEEE Conference on Energy Internet and Energy System Integration (EI2), Beijing, China, 26–28 November 2017; pp. 1–6. [Google Scholar] [CrossRef]
  12. Peng, C.; Chen, Q.; Zhang, L.; Wan, L.; Yuan, X. Research on Fault Diagnosis of Wind Power Generator Blade Based on SC-SMOTE and kNN. J. Inf. Process. Syst. 2020, 16, 870–881. [Google Scholar] [CrossRef]
  13. Velandia-Cardenas, C.; Vidal, Y.; Pozo, F. Wind Turbine Fault Detection Using Highly Imbalanced Real SCADA Data. Energies 2021, 14, 1728. [Google Scholar] [CrossRef]
  14. He, Q.; Pang, Y.; Jiang, G.; Xie, P. A Spatio-Temporal Multiscale Neural Network Approach for Wind Turbine Fault Diagnosis With Imbalanced SCADA Data. IEEE Trans. Ind. Inform. 2021, 17, 6875–6884. [Google Scholar] [CrossRef]
  15. Jiang, N.; Li, N. A wind turbine frequent principal fault detection and localization approach with imbalanced data using an improved synthetic oversampling technique. Int. J. Electr. Power Energy Syst. 2021, 126, 106595. [Google Scholar] [CrossRef]
  16. Karadayi, B.; Kuvvetli, Y.; Ural, S. Fault-related Alarm Detection of a Wind Turbine SCADA System. In Proceedings of the 2021 3rd International Congress on Human-Computer Interaction, Optimization and Robotic Applications (HORA), Ankara, Turkey, 11–13 June 2021; pp. 1–5. [Google Scholar] [CrossRef]
  17. Santos, P.; Maudes, J.; Bustillo, A. Identifying maximum imbalance in datasets for fault diagnosis of gearboxes. J. Intell. Manuf. 2018, 29, 333–351. [Google Scholar] [CrossRef]
  18. Zhang, Y.; Liu, B.; Wang, C. A Fault Diagnosis Method for Electrical Equipment With Imbalanced SCADA Data Based on SMOTE Oversampling and Domain Adaptation. In Proceedings of the 2023 8th International Conference on Power and Renewable Energy (ICPRE), Shanghai, China, 22–25 September 2023; pp. 195–202. [Google Scholar] [CrossRef]
  19. Santolamazza, A.; Dadi, D.; Introna, V. A Data-Mining Approach for Wind Turbine Fault Detection Based on SCADA Data Analysis Using Artificial Neural Networks. Energies 2021, 14, 1845. [Google Scholar] [CrossRef]
  20. Xiao, C.; Liu, Z.; Zhang, T.; Zhang, X. Deep Learning Method for Fault Detection of Wind Turbine Converter. Appl. Sci. 2021, 11, 1280. [Google Scholar] [CrossRef]
  21. Chen, W.; Qiu, Y.; Feng, Y.; Li, Y.; Kusiak, A. Diagnosis of wind turbine faults with transfer learning algorithms. Renew. Energy 2021, 163, 2053–2067. [Google Scholar] [CrossRef]
  22. Liu, X.; Du, J.; Ye, Z.S. A Condition Monitoring and Fault Isolation System for Wind Turbine Based on SCADA Data. IEEE Trans. Ind. Inform. 2022, 18, 986–995. [Google Scholar] [CrossRef]
  23. Zhao, Y.; Li, D.; Dong, A.; Kang, D.; Lv, Q.; Shang, L. Fault prediction and diagnosis of wind turbine generators using SCADA data. Energies 2017, 10, 1210. [Google Scholar] [CrossRef]
  24. Chatterjee, J.; Dethlefs, N. Scientometric review of artificial intelligence for operations & maintenance of wind turbines: The past, present and future. Renew. Sustain. Energy Rev. 2021, 144, 111051. [Google Scholar]
  25. Li, B.; Tang, B.; Deng, L.; Wei, J. Joint attention feature transfer network for gearbox fault diagnosis with imbalanced data. Mech. Syst. Signal Process. 2022, 176, 109146. [Google Scholar] [CrossRef]
  26. Chatterjee, J.; Dethlefs, N. Deep learning with knowledge transfer for explainable anomaly prediction in wind turbines. Wind Energy 2020, 23, 1693–1710. [Google Scholar] [CrossRef]
  27. Tang, M.; Meng, C.; Wu, H.; Zhu, H.; Yi, J.; Tang, J.; Wang, Y. Fault Detection for Wind Turbine Blade Bolts Based on GSG Combined with CS-LightGBM. Sensors 2022, 22, 6763. [Google Scholar] [CrossRef] [PubMed]
  28. Desai, A.; Guo, Y.; Sheng, S.; Sheng, S.; Phillips, C.; Williams, L. Prognosis of Wind Turbine Gearbox Bearing Failures using SCADA and Modeled Data. Annu. Conf. PHM Soc. 2020, 12, 10. [Google Scholar] [CrossRef]
  29. Zhang, G.; Li, Y.; Jiang, W.; Shu, L. A fault diagnosis method for wind turbines with limited labeled data based on balanced joint adaptive network. Neurocomputing 2022, 481, 133–153. [Google Scholar] [CrossRef]
  30. Chatterjee, S.; Byun, Y.C. Highly imbalanced fault classification of wind turbines using data resampling and hybrid ensemble method approach. Eng. Appl. Artif. Intell. 2023, 126, 107104. [Google Scholar] [CrossRef]
  31. Sun, S.; Hu, W.; Liu, Y.; Wang, T.; Chu, F. Matching contrastive learning: An effective and intelligent method for wind turbine fault diagnosis with imbalanced SCADA data. Expert Syst. Appl. 2023, 223, 119891. [Google Scholar] [CrossRef]
  32. Qian, M.; Li, Y.F. A Weakly Supervised Learning-Based Oversampling Framework for Class-Imbalanced Fault Diagnosis. IEEE Trans. Reliab. 2022, 71, 429–442. [Google Scholar] [CrossRef]
  33. Qiu, Y.; Feng, Y.; Infield, D. Fault diagnosis of wind turbine with SCADA alarms based multidimensional information processing method. Renew. Energy 2020, 145, 1923–1931. [Google Scholar] [CrossRef]
  34. Nunes, A.R.; Morais, H.; Sardinha, A. Use of Learning Mechanisms to Improve the Condition Monitoring of Wind Turbine Generators: A Review. Energies 2021, 14, 7129. [Google Scholar] [CrossRef]
  35. Elreedy, D.; Atiya, A.F. A Comprehensive Analysis of Synthetic Minority Oversampling Technique (SMOTE) for handling class imbalance. Inf. Sci. 2019, 505, 32–64. [Google Scholar] [CrossRef]
  36. He, H.; Bai, Y.; Garcia, E.A.; Li, S. ADASYN: Adaptive synthetic sampling approach for imbalanced learning. In Proceedings of the 2008 IEEE International Joint Conference on Neural Networks (IEEE World Congress on Computational Intelligence), Hong Kong, 1–8 June 2008; pp. 1322–1328. [Google Scholar] [CrossRef]
  37. Breiman, L. Random Forests. Mach. Learn. 2001, 45, 5–32. [Google Scholar] [CrossRef]
  38. Zhang, D.; Qian, L.; Mao, B.; Huang, C.; Huang, B.; Si, Y. A Data-Driven Design for Fault Detection of Wind Turbines Using Random Forests and XGboost. IEEE Access 2018, 6, 21020–21031. [Google Scholar] [CrossRef]
  39. Peco Chacón, A.M.; Segovia Ramírez, I.; García Márquez, F.P. State of the Art of Artificial Intelligence Applied for False Alarms in Wind Turbines. Arch. Comput. Methods Eng. 2021, 29, 2659–2683. [Google Scholar] [CrossRef]
  40. Helbing, G.; Ritter, M. Deep Learning for fault detection in wind turbines. Renew. Sustain. Energy Rev. 2018, 98, 189–198. [Google Scholar] [CrossRef]
  41. Ahakonye, L.A.C.; Nwakanma, C.I.; Lee, J.M.; Kim, D.S. SCADA intrusion detection scheme exploiting the fusion of modified decision tree and Chi-square feature selection. Internet Things 2023, 21, 100676. [Google Scholar] [CrossRef]
Figure 1. Overall flowchart of the implementation of ML and imbalanced SCADA data analysis.
Energies 17 01590 g001
Figure 2. Correlation matrix of the full dataset.
Energies 17 01590 g002
Figure 3. Description of the name and percentage of SCADA alarms used in this study.
Energies 17 01590 g003
Figure 4. Correlation analysis between WT variables using scatterplot matrix.
Energies 17 01590 g004
Figure 5. Comparative analysis of resampling techniques. (a) Results after SMOTE; (b) Results after ADASYN; (c) Results after SMOTE + Tomek; (d) Results after SMOTE + ENN.
Energies 17 01590 g005aEnergies 17 01590 g005b
Figure 6. Evaluation metrics obtained for different oversampling techniques.
Energies 17 01590 g006
Figure 7. Evaluation metrics obtained for different fault prediction techniques.
Energies 17 01590 g007
Figure 8. Confusion matrix results for performance evaluation of the proposed models with and without oversampling techniques. (a) Original data; (b) Results after SMOTE; (c) Results after ADASYN.
Energies 17 01590 g008
Figure 9. ROC curves results for performance evaluation of the proposed models with and without oversampling techniques. (a) Original data; (b) Results after SMOTE; (c) Results after ADASYN.
Energies 17 01590 g009
Table 1. Summary of relevant studies on resampling techniques and ML tools for WT fault detection.
Ref. and
Year
TDID 1Learning
Algorithms
Tools/
Methods
Main
Components
Results
[4]
2019
Triplet loss functionclassificationDNN, kNNblade90.85% (precision),
63.10% (recall),
74.47% (F1-Score)
[7]
2021
SMOTEclassificationGANs 2, DNN,
SVM 3
WTnot
specified
[8]
2021
SMOTEclassificationDNN, SVM 3,
RF, kNN
WT>90% (precision)
[9]
2020
MC-SMOTEclassification,
clustering
SVM 3, CART 4,
Bayesian classifiers
blade91.70% (precision),
92.10% (recall),
91.90% (F1-Score)
[10]
2018
SMOTEclassificationRF, GBDT 5,
XGBoost 6
WT86.82% (precision),
96.50% (recall),
91.49% (F1-Score)
[11]
2017
MBK-SMOTEclassification,
clustering
K-means, RFblade54.00% F1-Score),
74.85% (AUC)
[12]
2020
SC-SMOTEclassificationkNNblade78.90% (acc)
[13]
2021
Random
oversampling,
data reshaping
classificationkNN, SVM 3,
RUSBoost 7
gearbox99.82% (recall),
95.48% (F1-Score),
95.36% (acc)
[14]
2021
FL functionclassificationSTMNN, LSTM 8,
CNN
WT94.70% (F1-Score),
90.10% (G-mean)
[15]
2021
SDWBOTEclassificationCNNWT97.51% (F1-Score)
[16]
2021
SMOTEclassificationSVC, DTWT80.00% (precision),
83.00% (recall),
81.00% (F1-Score),
87.00% (acc)
[17]
2018
SMOTE,
undersampling,
cost-sensitive learning
classificationMLP 9, Naive Bayes,
kNN, DT, Bagging,
Rotation Forest
gearbox85.00% (MCC)
[18]
2023
SMOTEclassificationCNN, ResNet 10gearbox,
generator bearing,
hydraulic system
>75.00% (recall),
>51.43% (F1-Score)
[20]
2021
Upsampling operationsclassificationCNNconverter98.41% (precision),
97.66% (recall),
98.04% (acc)
[21]
2021
Re-samplingclassificationkNN, RF,
TrAdaBoost 11,
Inception V3
blade,
pitch system
>73.20% (recall),
>89.40% (acc)
[23]
2017
SMOTEclassificationANN, SVM 3,
KNN, Naive Bayes
generator96.34% (recall),
94.80% (acc)
[25]
2022
SMOTE,
FL function,
re-sampling
classificationGANs 2, JAFTN 12,
WDCNN 13
gearbox99.70% (precision),
99.60% (F1-Score),
99.60% (acc)
[26]
2020
SMOTEclassification,
clustering
LSTM 8, XGBoost 6WT97.00% (acc)
[27]
2022
SMOTE,
cost-sensitive learning
classificationLGBM 14, GMM 15blade97.80% (F1-Score)
[28]
2020
SMOTE,
cost-sensitive learning
classificationLogistic regression,
RF, XGBoost 6,
LSTM 8
gearbox52.00% (precision),
86.00% (recall),
57.00% (F1-Score)
[29]
2022
SMOTEclassificationLSTM 8, CNN,
MLP 9
hydraulic system,
generator, converter
>80.20% (F1-Score),
>90.60% (acc)
[30]
2023
SMOTE+ENNclassificationDT, AdaBoost 16,
KNN, RF
WT99.60% (precision),
99.20% (recall),
99.60% (F1-Score)
[31]
2023
SMOTE,
Adasyn
classificationMCL 17, STMNN,
STFNN 18
WT94.70% (F1-Score)
[32]
2022
SMOTE,
Adasyn,
SMOTE+ENN
classificationDT, KNN,
SVM 3, MLP 9
blade94.20% (F1-Score),
94.20% (G-mean),
93.80% (MCC)
1 Techniques for Dealing with Imbalanced Data (TDID), 2 Generative Adversarial Networks (GANs), 3 Support Vector Machine (SVM), 4 Classification and Regression Trees (CARTs), 5 Gradient Boosting Decision Tree (GBDT), 6 eXtreme Gradient Boosting (XGBoost), 7 Random Under-Sampling Boosting (RUSBoost), 8 Long Short Term Memory (LSTM), 9 Multi-Layer Perceptron (MLP), 10 Residual Neural Network (ResNet), 11 Transfer Adaptive Boosting (TrAdaBoost), 12 Joint Attention Feature Transfer Network (JAFTN), 13 Deep Convolutional Neural Networks with Wide First-layer Kernels (WDCNN), 14 Light Gradient Boosting Machine classifier (LGBM), 15 Gaussian Mixture Model (GMM), 16 Adaptive Boosting (AdaBoost), 17 Matching Contrastive Learning (MCL), 18 Spatio-Temporal Fusion Neural Network (STFNN).
Table 2. Hyperparameters of the DT classifier.
HyperparameterValueDescription
max_depth5Maximum Tree Depth
min_samples_split2Minimum number of samples to split node
min_samples_leaf1Minimum number of samples in a leaf
max_featuresNoneMaximum number of characteristics
criterionginiMeasure of the quality of a node split
Table 3. Performance evaluation values for the classifiers used in this study.
MLP
hidden_layer sizesalphaPrecisionRecallF1-ScoreSpecificityAUCG-meanNVPW_accMCC
1000.00010.0000.1500.0010.7660.6100.4810.9890.5580.016
1000.0010.0000.2000.0010.7620.5710.6390.9890.5810.021
1000.010.0010.6250.0010.8950.7710.7690.9990.7750.024
(50, 50)0.00010.0000.1050.0010.7870.5970.3220.9890.5180.008
(50, 50)0.0010.0000.1000.0010.7880.5950.3140.9890.5440.020
BDT (lr: 50, max_depth: 0.01)
n_estimatorsmin_samples splitPrecisionRecallF1-ScoreSpecificityAUCG-meanNVPW_accMCC
030.0000.3000.0000.0050.7840.5890.9240.7230.013
130.0000.5000.0000.0050.7840.5890.9530.7230.002
230.0000.6000.0010.0050.8440.7390.9940.7500.014
350.0000.5000.0000.0030.8300.5760.9070.7440.001
450.0000.4000.0000.0030.8300.5760.9070.7400.001
DT (criterion: gini)
max_depthmin_samples splitPrecisionRecallF1-ScoreSpecificityAUCG-meanNVPW_accMCC
None20.0820.5000.1310.9930.5460.5550.9990.5460.227
None20.0820.3000.1310.9930.5460.3150.9990.5460.227
520.0940.6000.1620.9930.8220.8050.9990.8260.247
550.0220.3000.1110.9180.5950.5250.9990.6090.219
550.0220.3000.1110.9180.5950.5250.9990.6090.219
RF (n_stimators: 50)
max_depthmin_samples splitPrecisionRecallF1-ScoreSpecificityAUCG-meanNVPW_accMCC
None20.1490.4000.4260.9370.6480.7220.9990.5230.420
None50.2190.4000.4250.9960.6680.7220.9990.5230.419
None100.0190.5000.4250.9960.6610.6220.9990.5230.419
1020.1830.5000.4890.9340.5890.7430.9990.6570.413
1050.3910.6430.4870.9990.8210.8020.9990.8210.502
Disclaimer/Publisher’s Note: The statements, opinions and data contained in all publications are solely those of the individual author(s) and contributor(s) and not of MDPI and/or the editor(s). MDPI and/or the editor(s) disclaim responsibility for any injury to people or property resulting from any ideas, methods, instructions or products referred to in the content.

