
Oil-Water Two-Phase Flow with Three Different Crude Oils: Flow Structure, Droplet Size and Viscosity
Abstract
:1. Introduction
2. Experimental Section
2.1. Materials
2.2. Experimental Apparatus
2.3. Measurement of the Droplet Size
3. Results
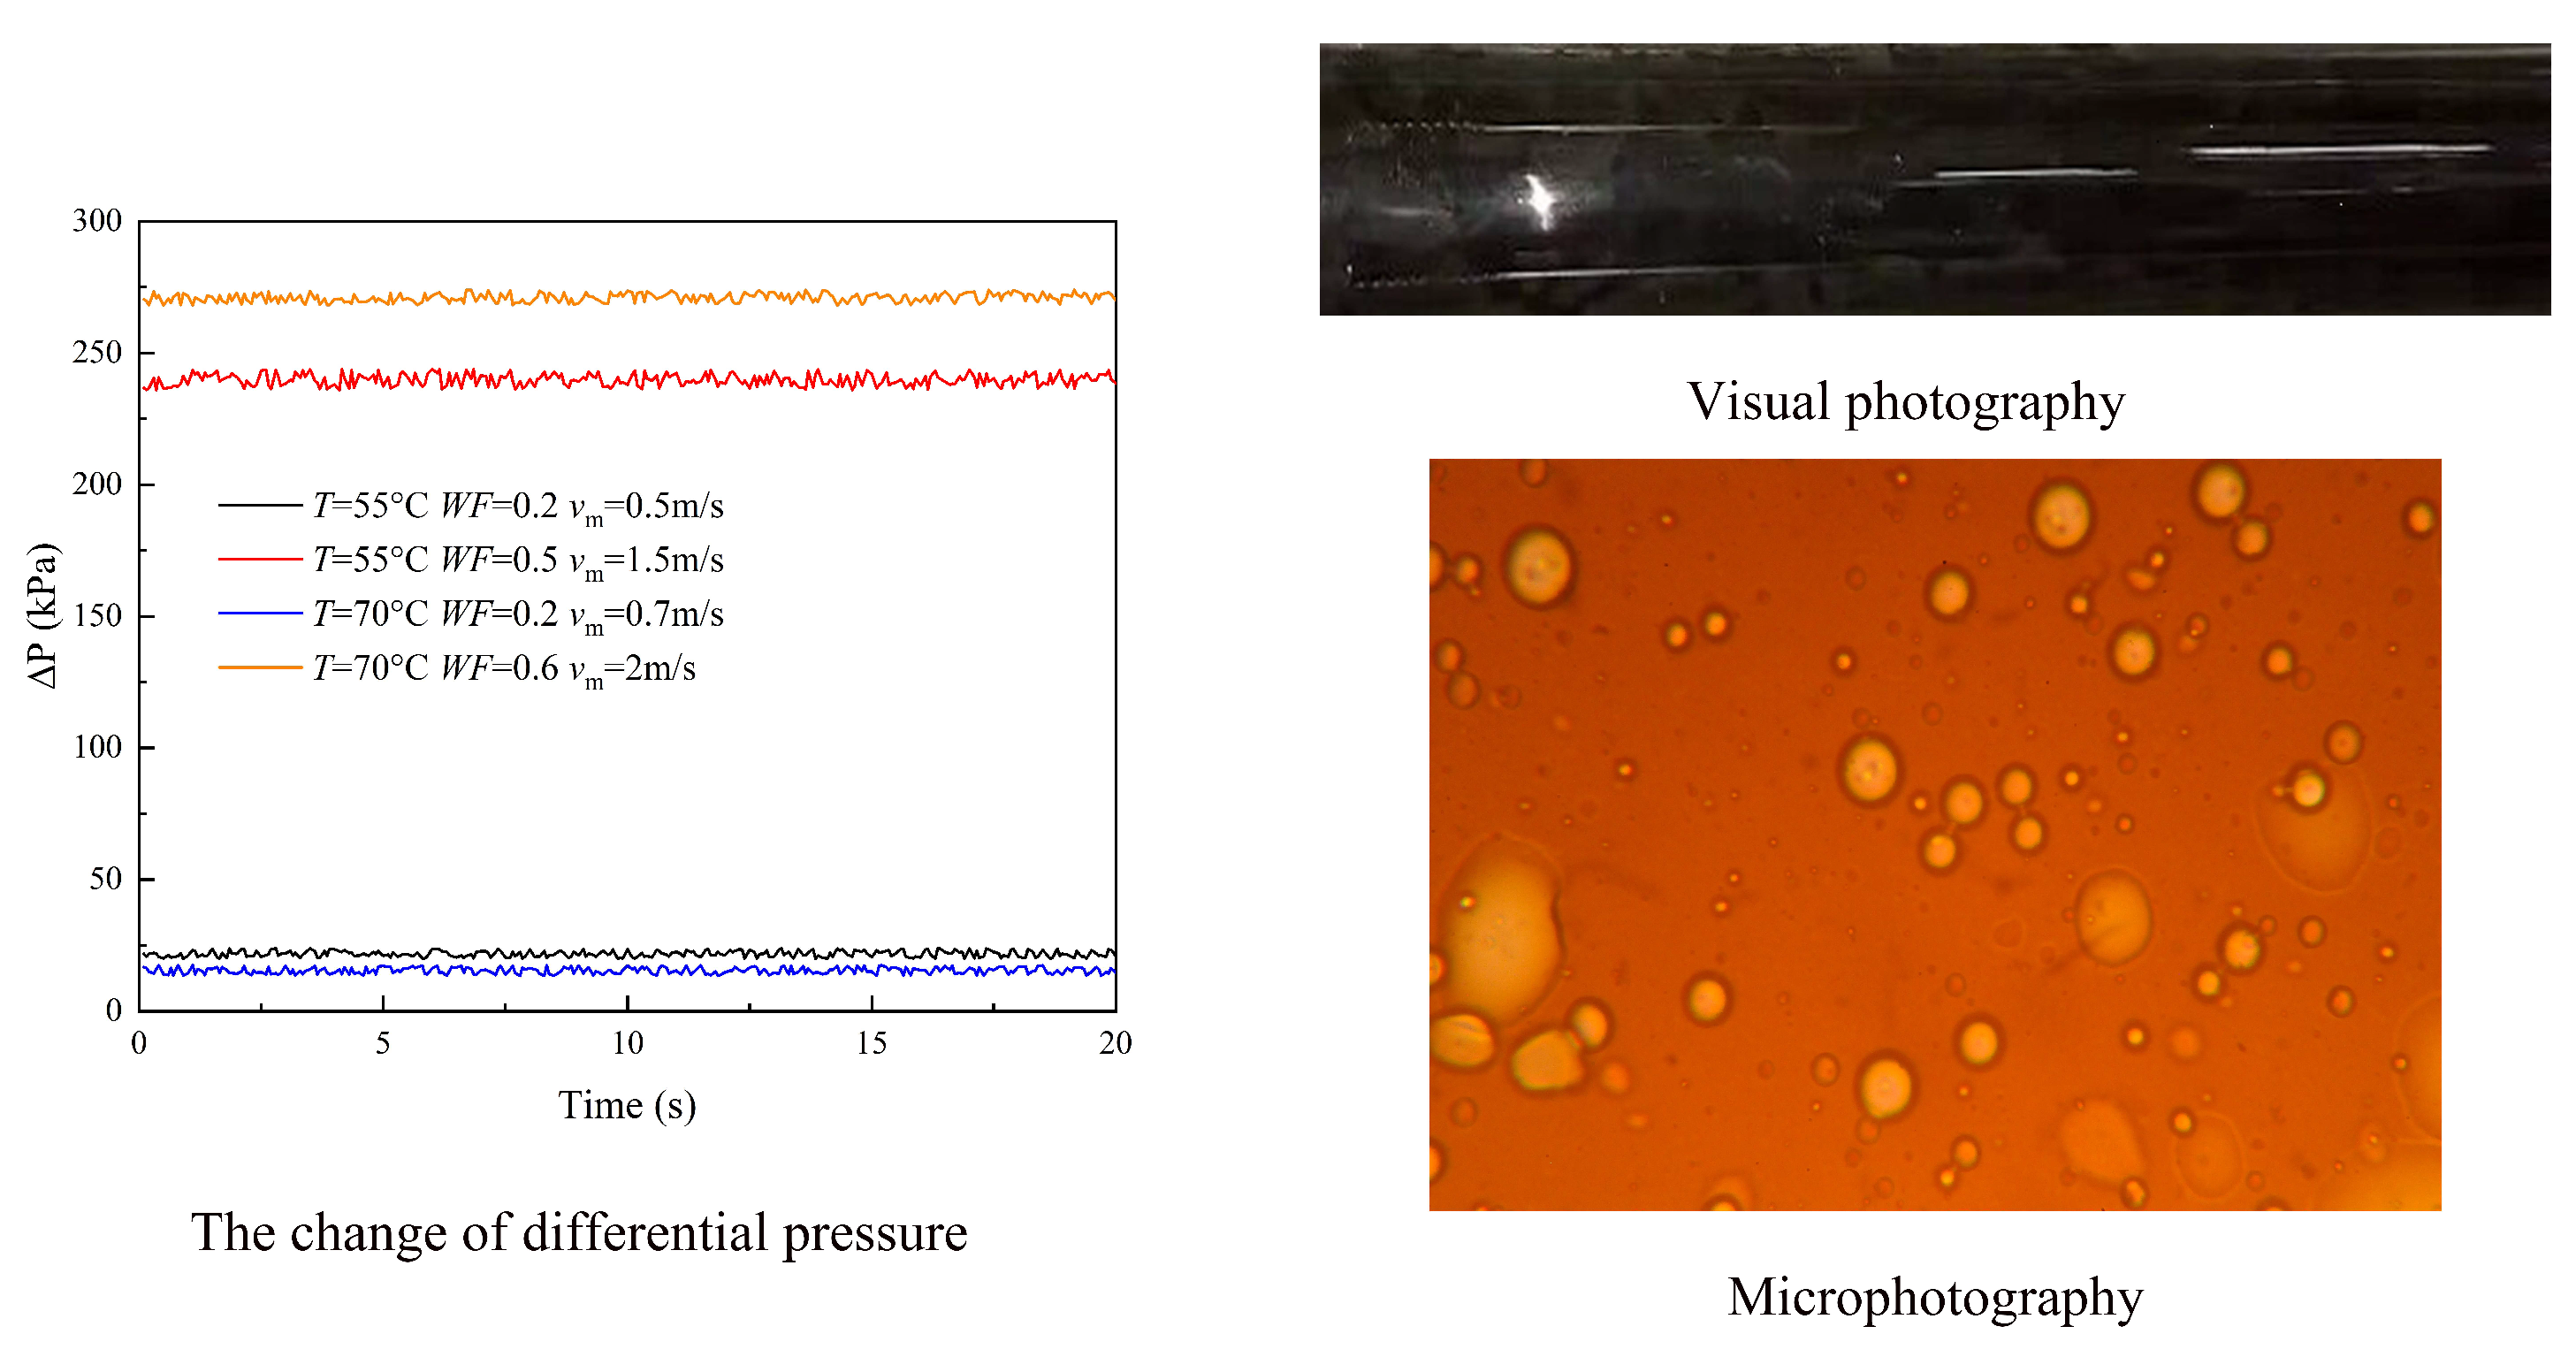
3.1. Flow Patterns
- (1)
- Oil continuous flow
- (2)
- Water continuous flow
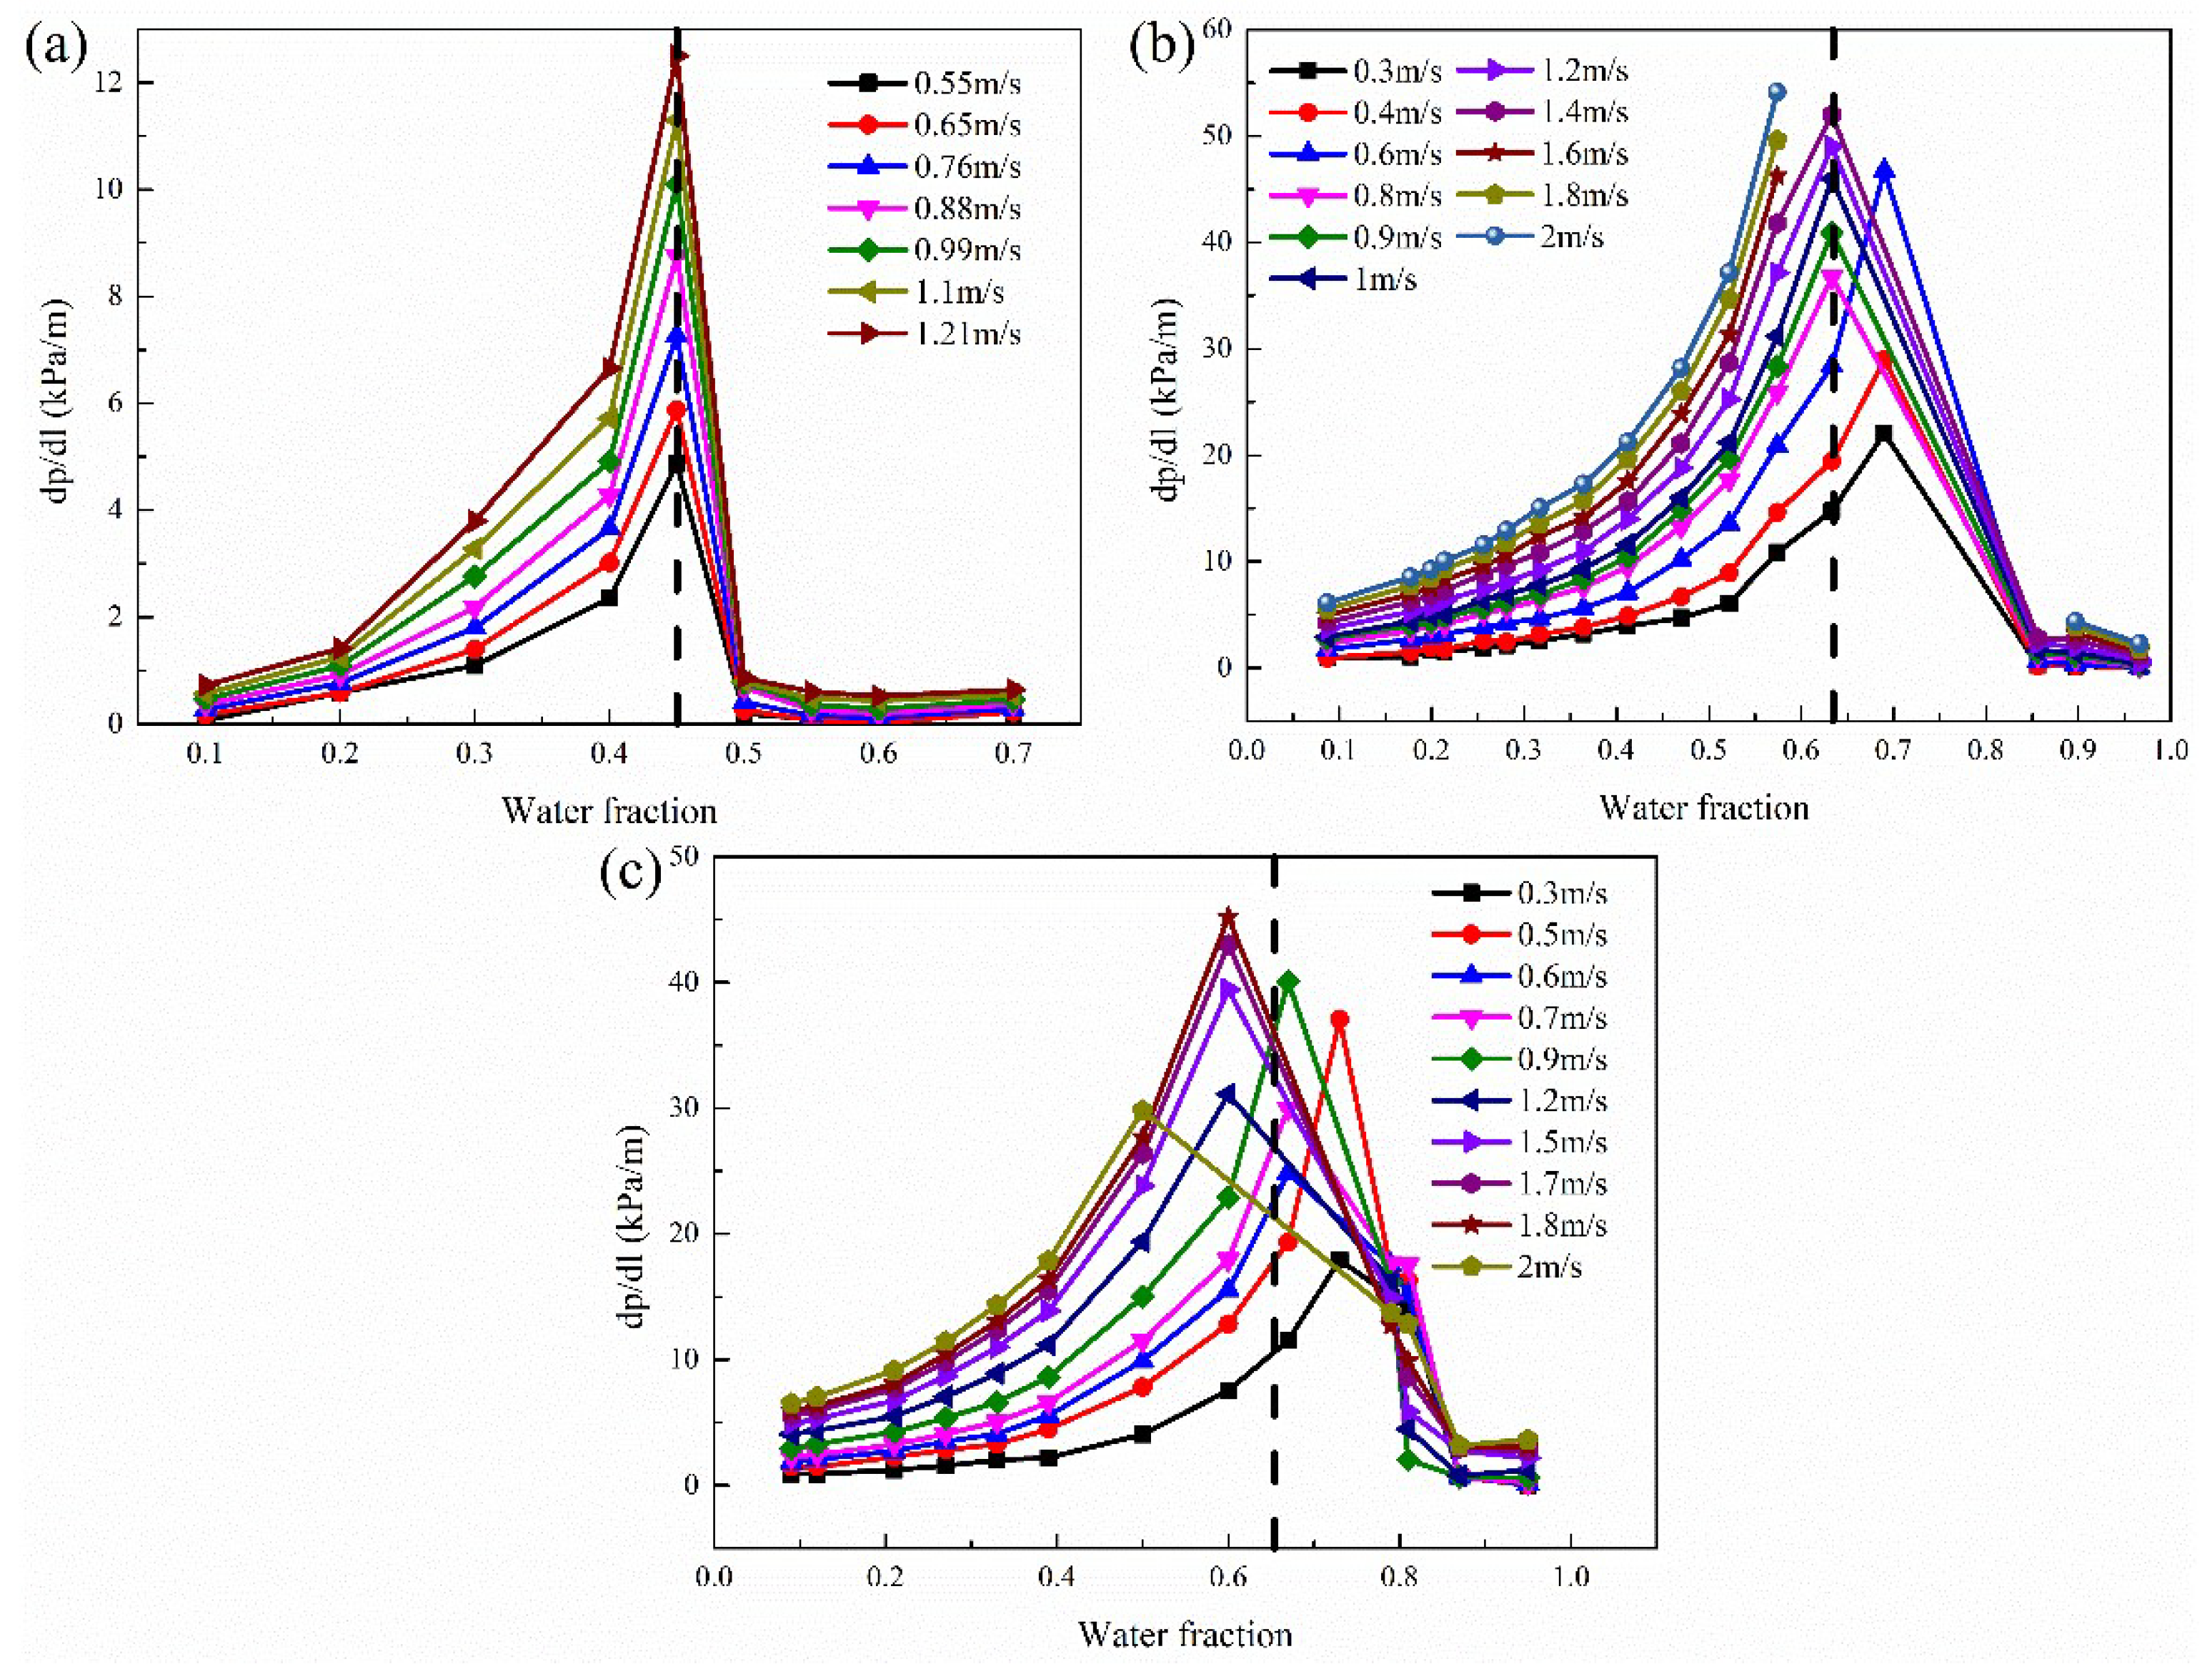
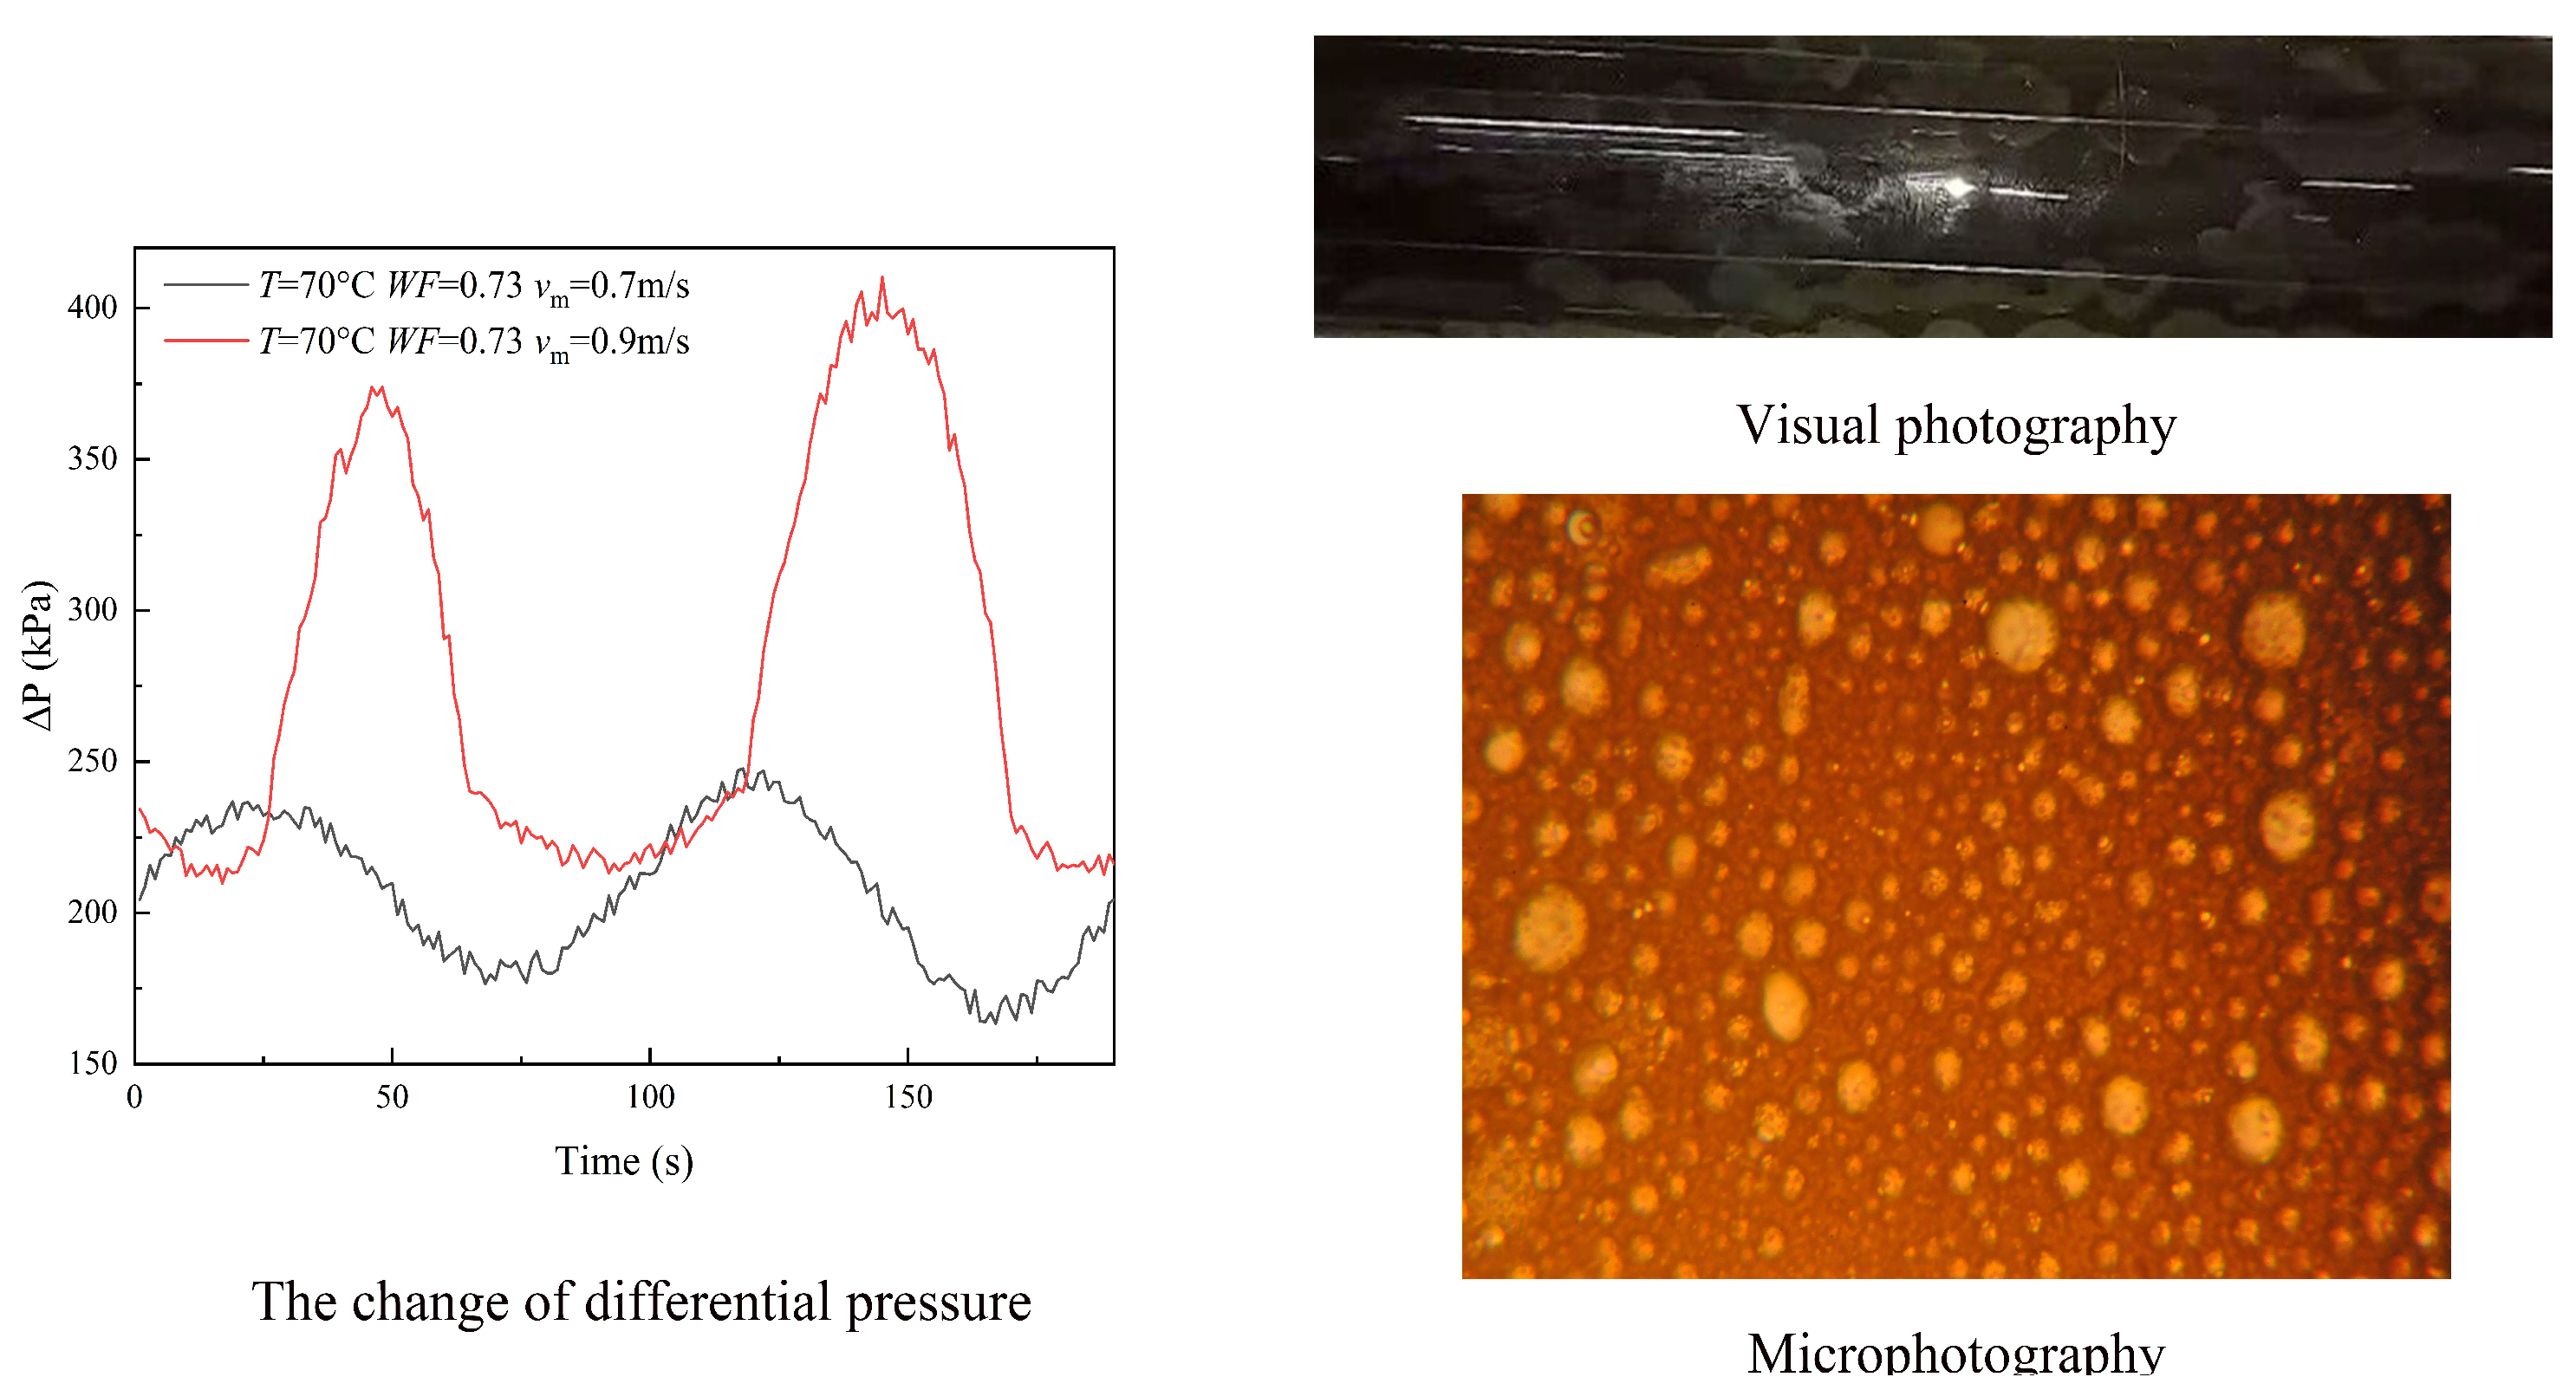
3.2. Pressure Drop
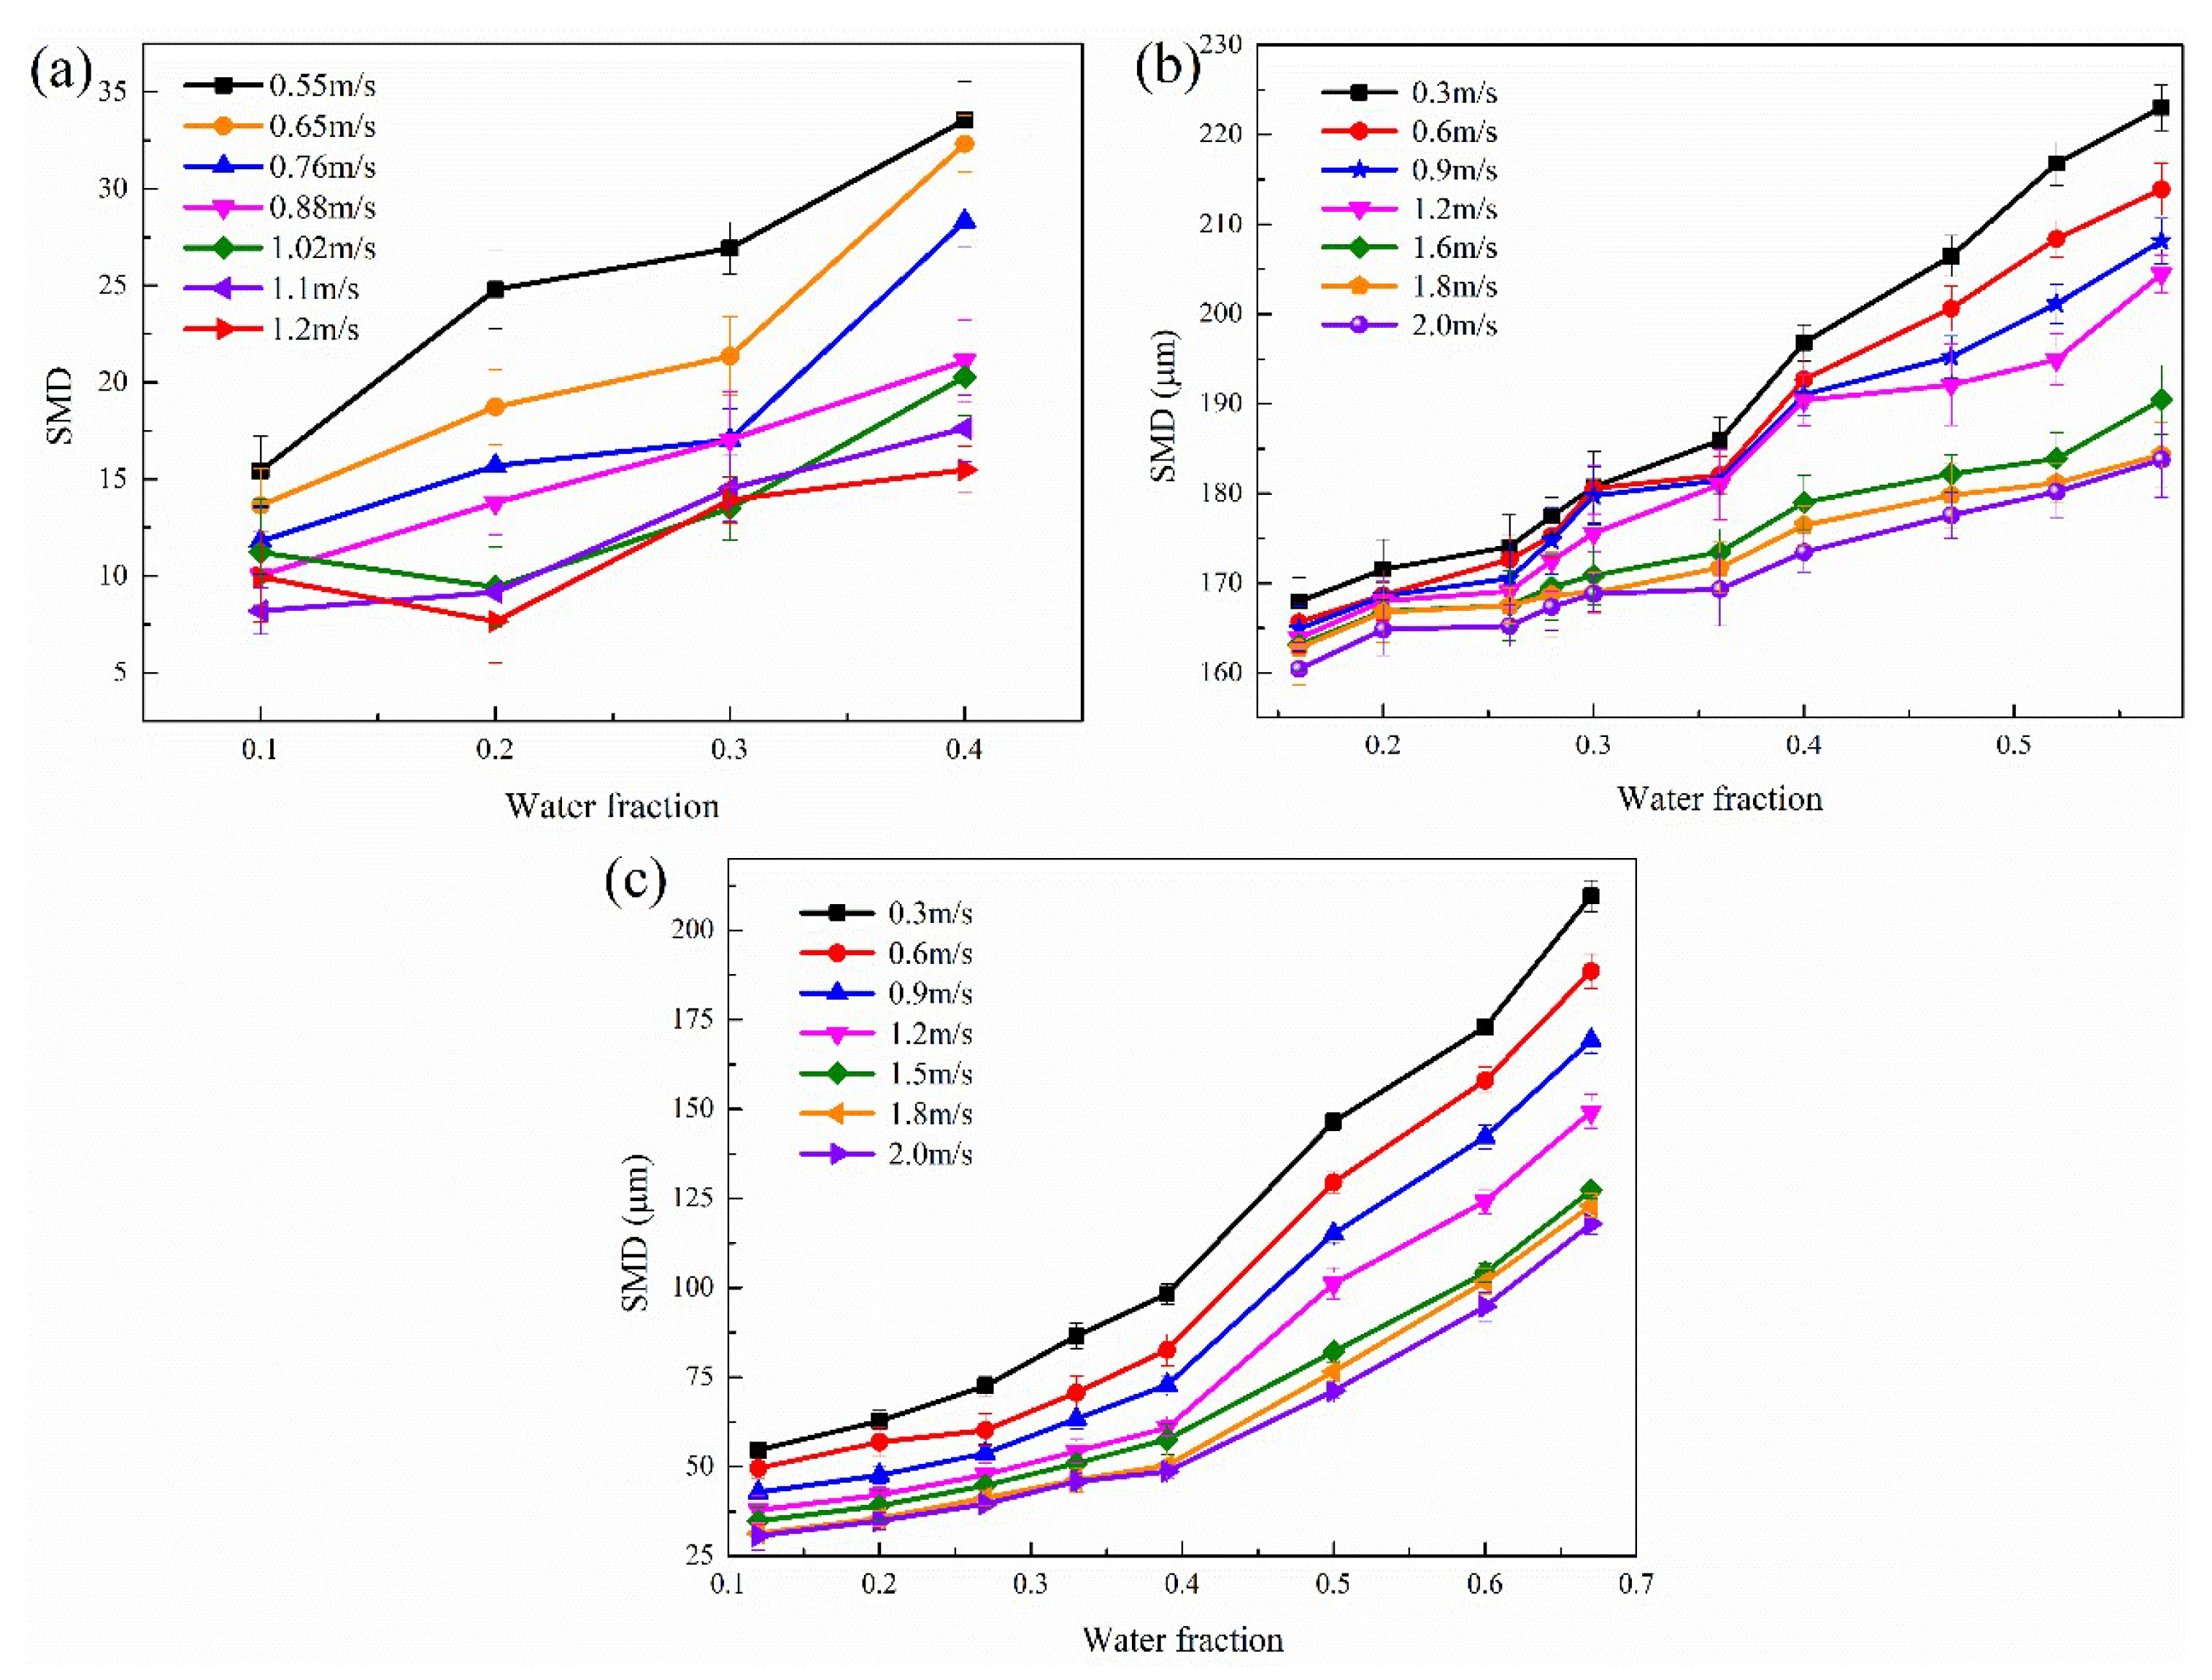
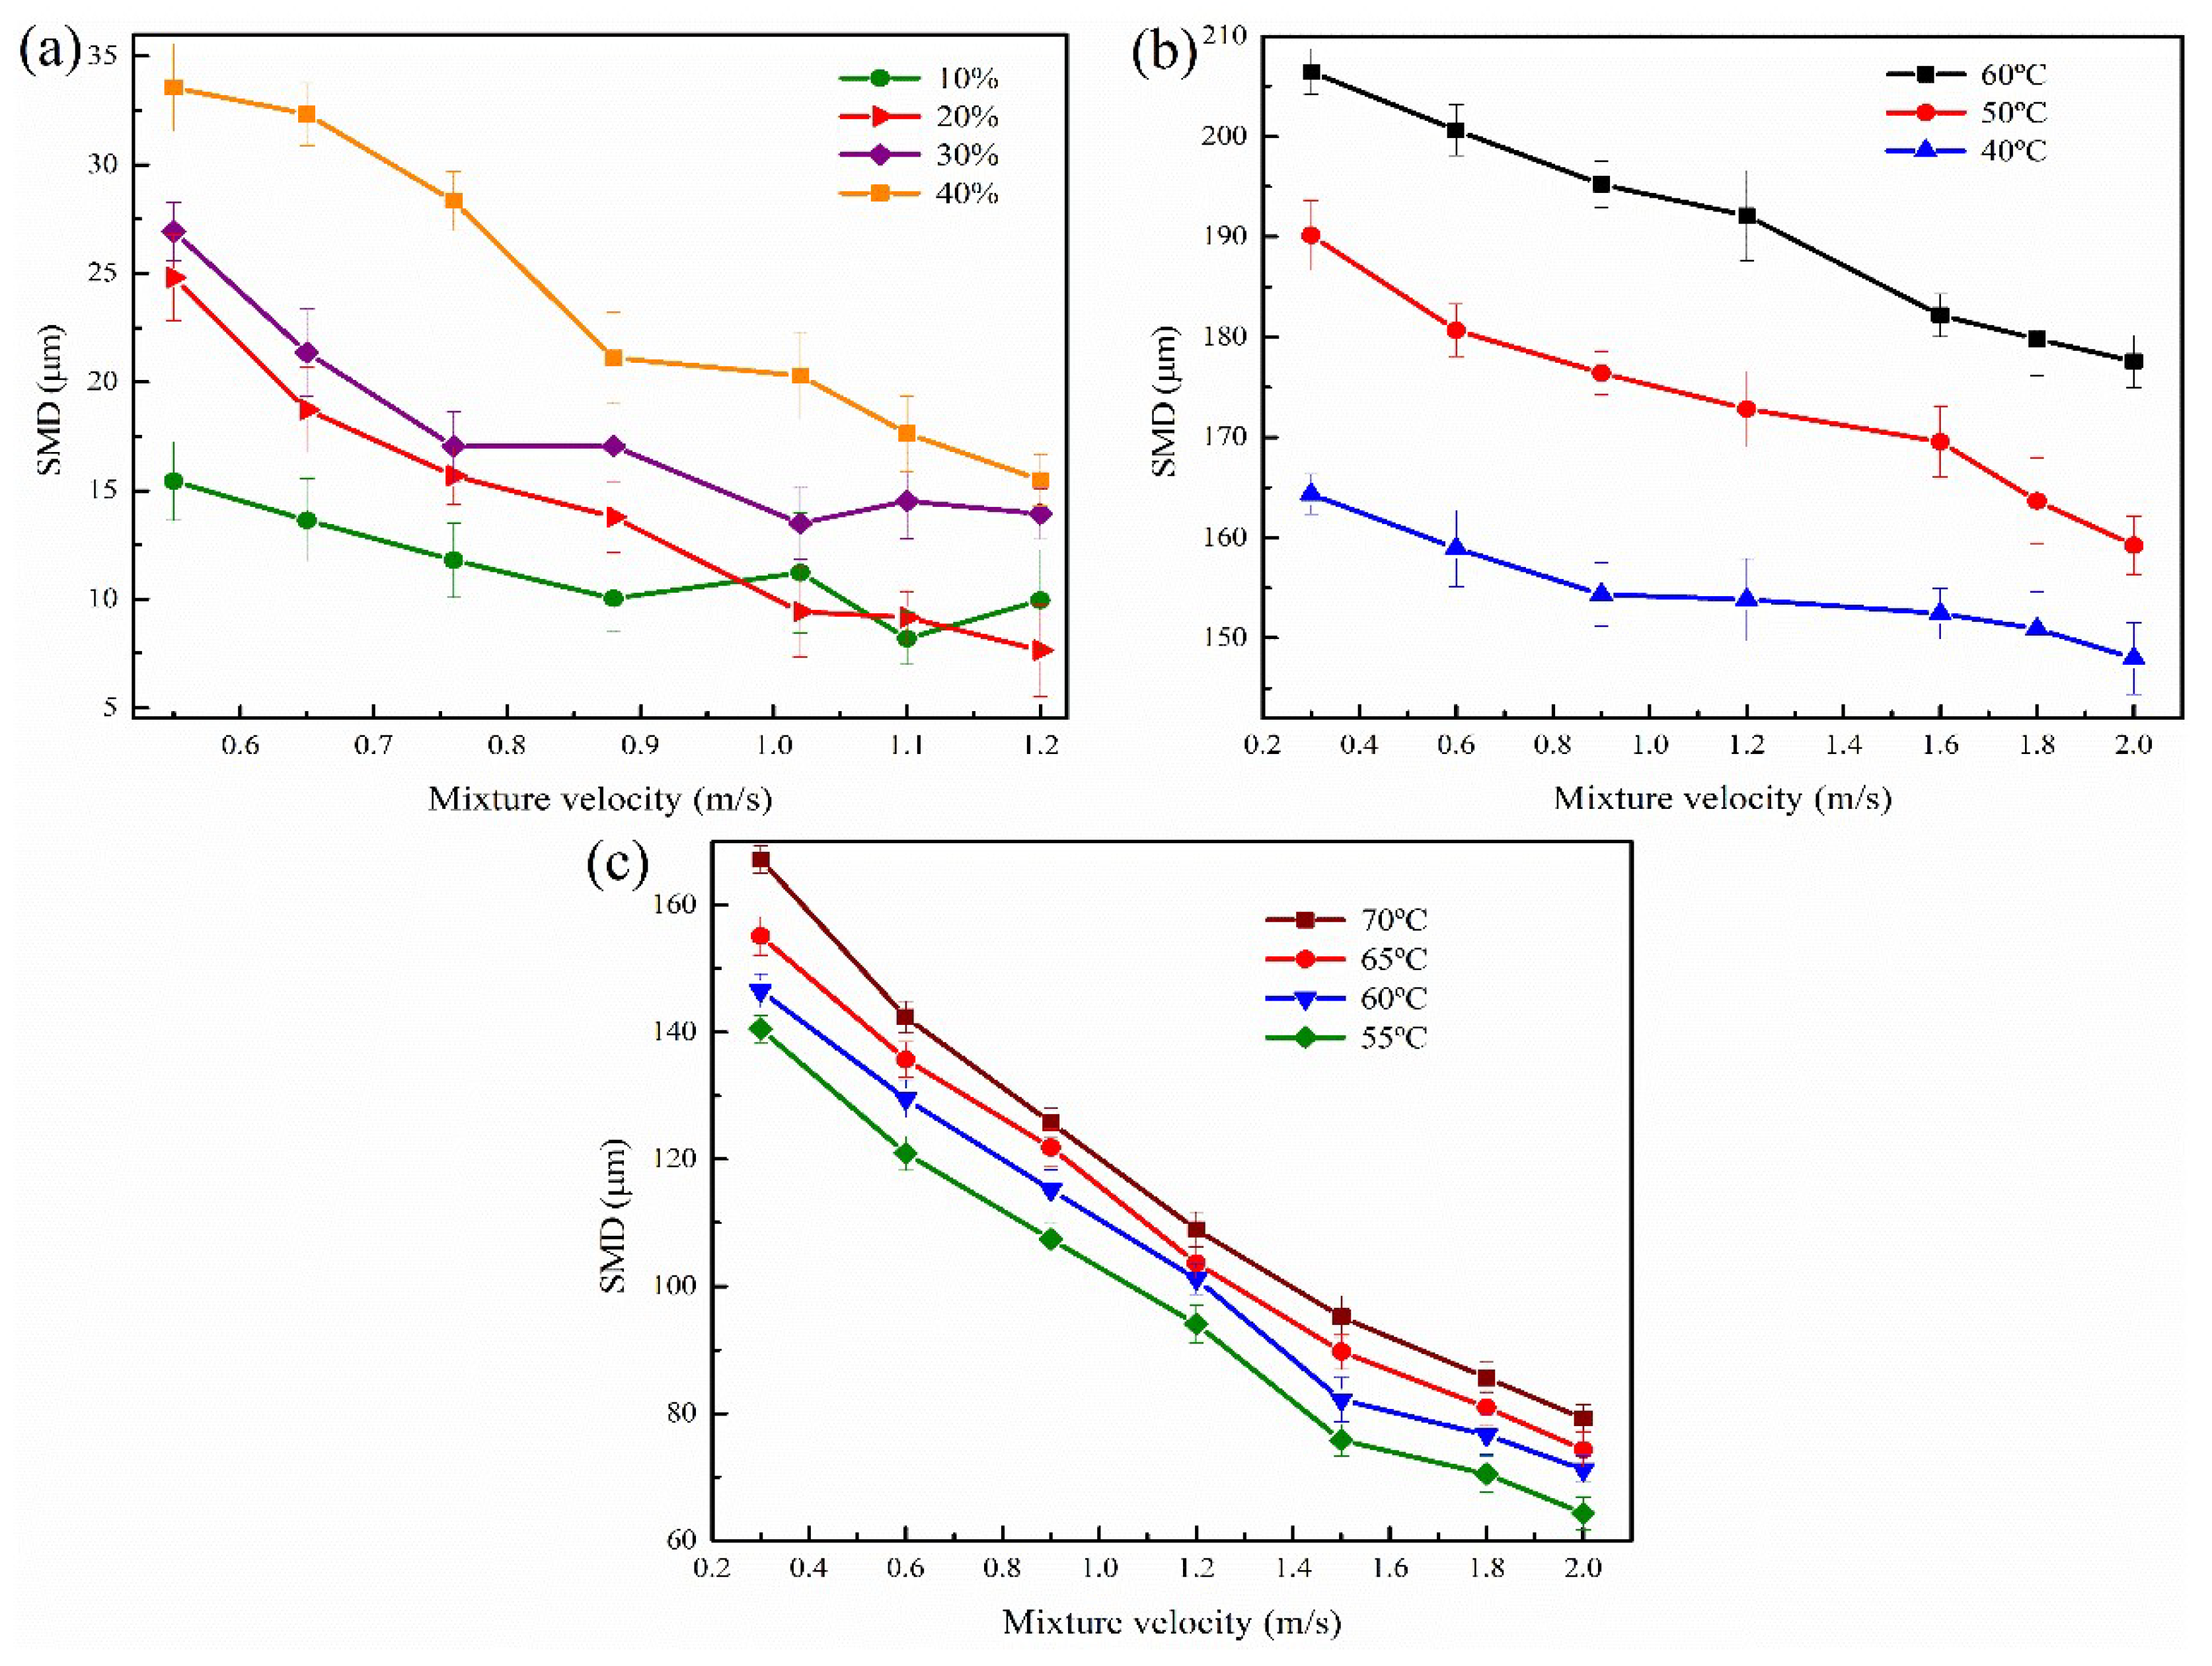
3.3. Droplet Size
3.3.1. Effect of Oil Viscosity
3.3.2. Effect of Water Fraction
3.3.3. Effect of Temperature
3.3.4. Effect of Mixture Velocity
3.4. Apparent Viscosity Model
3.4.1. Effect of Flow Parameters on the Apparent Viscosity
3.4.2. Effect of Interfacial Area Concentration on the Apparent Viscosity
3.4.3. The new Apparent Viscosity Model
4. Conclusions
Author Contributions
Funding
Data Availability Statement
Acknowledgments
Conflicts of Interest
Appendix A
- (1)
- w/o dispersed flow

- (2)
- w/o&w intermittent flow

- (3)
- w/o&w core-annular flow

- (4)
- (w/o)/w flow

- (5)
- o/w dispersed flow

Appendix B

| WF | vm (m/s) | K | μ (mPa·s) | ||
|---|---|---|---|---|---|
| 0.2 | 0.3 | 0.9341 | 0.1452 | 94.67 | 107.52 |
| 0.4 | 126.22 | 105.50 | |||
| 0.6 | 189.33 | 102.72 | |||
| 0.8 | 252.44 | 100.79 | |||
| 0.9 | 283.99 | 100.01 | |||
| 1 | 315.55 | 99.31 | |||
| 1.2 | 378.66 | 98.13 | |||
| 1.4 | 441.77 | 97.13 | |||
| 1.6 | 504.88 | 96.28 | |||
| 1.8 | 567.99 | 95.54 | |||
| 2 | 631.10 | 94.88 | |||
| 0.3 | 0.3 | 0.9563 | 0.2056 | 91.08 | 168.62 |
| 0.4 | 125.45 | 166.51 | |||
| 0.6 | 188.17 | 163.59 | |||
| 0.8 | 250.89 | 161.55 | |||
| 0.9 | 282.25 | 160.72 | |||
| 1 | 313.62 | 159.98 | |||
| 1.2 | 376.34 | 158.71 | |||
| 1.4 | 439.06 | 157.65 | |||
| 1.6 | 501.79 | 156.73 | |||
| 1.8 | 564.51 | 155.93 | |||
| 2 | 627.23 | 155.21 | |||
| 0.52 | 0.3 | 0.9337 | 0.6204 | 94.67 | 458.86 |
| 0.4 | 126.23 | 450.19 | |||
| 0.6 | 189.35 | 438.26 | |||
| 0.8 | 252.46 | 429.98 | |||
| 0.9 | 284.02 | 426.64 | |||
| 1 | 315.58 | 423.67 | |||
| 1.2 | 378.70 | 418.58 | |||
| 1.4 | 441.81 | 414.33 | |||
| 1.6 | 504.93 | 410.68 | |||
| 1.8 | 568.04 | 407.49 | |||
| 2 | 631.16 | 404.65 |
References
- Liu, Q.; Liu, J.J.; Liang, B.; Sun, W.J.; He, J.; Lei, Y. The Influence of Pore Structure of the Core-Scale Fracture-Controlled Matrix Unit on Imbibition: Model Construction and Definition of the Fractal Coefficient. Lithosphere 2022, 2022, 6245345. [Google Scholar] [CrossRef]
- Dong, X.X.; Tan, C.; Yuan, Y.; Dong, F. Measuring Oil-Water Two-Phase Flow Velocity with Continuous-Wave Ultrasound Doppler Sensor and Drift-Flux Model. IEEE Trans. Instrum. Meas. 2016, 65, 1098–1107. [Google Scholar] [CrossRef]
- Angeli, P.; Hewitt, G.F. Flow structure in horizontal oil-water flow. Int. J. Multiph. Flow 2000, 26, 1117–1140. [Google Scholar] [CrossRef]
- Oddie, G.; Shi, H.; Durlofsky, L.J.; Aziz, K.; Pfeffer, B.; Holmes, J.A. Experimental study of two and three phase flows in large diameter inclined pipes. Int. J. Multiph. Flow 2003, 29, 527–558. [Google Scholar] [CrossRef]
- Yagodnitsyna, A.A.; Kovalev, A.V.; Bilsky, A.V. Flow patterns of immiscible liquid-liquid flow in a rectangular microchannel with T-junction. Chem. Eng. J. 2016, 303, 547–554. [Google Scholar] [CrossRef]
- Yusuf, N.; Al-Wahaibi, Y.; Al-Wahaibi, T.; Al-Ajmi, A.; Olawale, A.S.; Mohammed, I.A. Effect of oil viscosity on the flow structure and pressure gradient in horizontal oil–water flow. Chem. Eng. Res. Des. 2012, 90, 1019–1030. [Google Scholar] [CrossRef]
- Al-Sarkhi, A.; Pereyra, E.; Mantilla, I.; Avila, C. Dimensionless Oil-Water Stratified to Non-Stratified Flow Pattern Transition. J. Pet. Sci. Eng. 2017, 151, 284–291. [Google Scholar] [CrossRef]
- Brauner, N.; Maron, D.M. Flow pattern transitions in two-phase liquid-liquid flow in horizontal tubes. Int. J. Multiph. Flow 1992, 18, 123–140. [Google Scholar] [CrossRef]
- Mukhaimer, A.; Al-Sarkhi, A.; El Nakla, M.; Ahmed, W.H.; Al-Hadhrami, L. Pressure drop and flow pattern of oil–water flow for low viscosity oils: Role of mixture viscosity. Int. J. Multiph. Flow 2015, 73, 90–96. [Google Scholar] [CrossRef]
- Jing, J.Q.; Sun, J.; Tan, J.T.; Huang, M.; Liang, Q.S.; Xue, T. Investigation on flow patterns and pressure drops of highly viscous crude oil–water flows in a horizontal pipe. Exp. Therm. Fluid Sci. 2016, 72, 88–96. [Google Scholar] [CrossRef]
- Luo, X.M.; Lü, G.B.; Zhang, W.; He, L.; Lü, Y.L. Flow structure and pressure gradient of extra heavy crude oil-water two-phase flow. Exp. Therm. Fluid Sci. 2017, 82, 174–181. [Google Scholar] [CrossRef]
- Gonzalez, D.; Schumann, H.; Kjlaas, J. Pipe flow experiments of unstable oil-water dispersions with three different oil viscosities: Flow pattern, pressure drop and droplet size measurements. J. Pet. Sci. Eng. 2022, 218, 110996. [Google Scholar] [CrossRef]
- Nydal, P.O.J. Pipe flow of water-in-crude oil emulsions: Effective viscosity, inversion point and droplet size distribution. J. Pet. Sci. Eng. 2013, 101, 35–43. [Google Scholar]
- Tan, J.T.; Luo, P.Y.; Vahaji, S.; Jing, J.Q.; Hu, H.L.; Yu, B.; Tu, J.Y. Experimental investigation on phase inversion point and flow characteristics of heavy crude oil-water flow. Appl. Therm. Eng. 2020, 180, 115777. [Google Scholar] [CrossRef]
- Lovick, J.; Angeli, P. Experimental studies on the dual continuous flow pattern in oil–water flows. Int. J. Multiph. Flow 2004, 30, 139–157. [Google Scholar] [CrossRef]
- Trallero, L. Oil-Water Flow Patterns in Horizontal Pipes. Ph.D. Thesis, The University of Tulsa, Tulsa, OK, USA, 1995. [Google Scholar]
- Yang, Z.G.; Wu, X.P.; Guo, J.X.; Zhang, J.J.; Xiong, R.Y.; Liu, L.; Kiyingi, W. Characterization of Asphaltene Deposition Behavior in Diluted Heavy Oil under High-Pressure Conditions. Energies 2023, 16, 6780. [Google Scholar] [CrossRef]
- Llanos, S.; Acevedo, S.; Cortés, F.; Franco, C. Effect of the Asphaltene Oxidation Process on the Formation of Emulsions of Water in Oil (W/O) Model Solutions. Energies 2018, 11, 722. [Google Scholar] [CrossRef]
- Bannwart, A.C.; Rodriguez, O.M.H.; Carvalho, C.H.M.D.; Wang, I.S.; Vara, R.M.O. Flow patterns in heavy crude oil-water flow. J. Energy Resour. Technol. 2004, 126, 184–189. [Google Scholar] [CrossRef]
- Wang, W.; Gong, J.; Angeli, P. Investigation on heavy crude-water two phase flow and related flow characteristics. Int. J. Multiph. Flow 2011, 37, 1156–1164. [Google Scholar] [CrossRef]
- Majid, A.A.A.; Saidian, M.; Prasad, M.; Koh, C.A. Measurement of the water droplet size in water-in-oil emulsions using low field nuclear magnetic resonance for gas hydrate slurry applications. Can. J. Chem. 2015, 93, 1007–1013. [Google Scholar] [CrossRef]
- Lovick, J.; Angeli, P. Droplet size and velocity profiles in liquid–liquid horizontal flows. Chem. Eng. Sci. 2004, 59, 3105–3115. [Google Scholar] [CrossRef]
- Zhai, L.S.; Wang, H.M.; Yan, C.; Zhang, H.X.; Jin, N.D. Development of empirical correlation to predict droplet size of oil-in-water flows using a multi-scale Poincaré plot. Exp. Therm. Fluid Sci. 2018, 98, 290–302. [Google Scholar] [CrossRef]
- Balcaen, M.; Neve, L.D.; Dewettinck, K.; Meeren, P.V.D. Effect of dilution on particle size analysis of w/o emulsions by dynamic light scattering. J. Dispers. Sci. Technol. 2021, 42, 869–879. [Google Scholar] [CrossRef]
- Sentis, M.P.L.; Lemahieu, G.; Hemsley, E.; Bouzaid, M.; Brambilla, G. Size distribution of migrating particles and droplets under gravity in concentrated dispersions measured with static multiple light scattering. J. Colloid Interface Sci. 2024, 653, 1358–1368. [Google Scholar] [CrossRef] [PubMed]
- Goddeeris, C.; Cuppo, F.; Reynaers, H.; Bouwman, W.G.; Van den Mooter, G. Light scattering measurements on microemulsions: Estimation of droplet sizes. Int. J. Pharm. 2006, 312, 187–195. [Google Scholar] [CrossRef] [PubMed]
- Zhang, M.; Li, X.; Zhang, L.; Wang, Z.; Xiao, X.; Zhu, L. An investigation of the droplet size distributions in a cyclone reactor for liquid-liquid heterogeneous reactions using FBRM and PVM. Can. J. Chem. Eng. 2020, 98, 1622–1630. [Google Scholar] [CrossRef]
- Schümann, H.; Khatibi, M.; Tutkun, M.; HPettersen, B.; Yang, Z.; Nydal, O.J. Droplet Size Measurements in Oil–Water Dispersions: A Comparison Study Using FBRM and PVM. J. Dispers. Sci. Technol. 2015, 36, 1432–1443. [Google Scholar] [CrossRef]
- Brown, D.E.; Pitt, K. Drop size distribution of stirred non-coalescing liquid—Liquid system. Chem. Eng. Sci. 1972, 27, 577–583. [Google Scholar] [CrossRef]
- Chatzi, E.G.; Kiparissides, C. Drop size distributions in high holdup fraction dispersion systems: Effect of the degree of hydrolysis of PVA stabilizer. Chem. Eng. Sci. 1994, 49, 5039–5052. [Google Scholar] [CrossRef]
- Vankova, N.; Tcholakova, S.; Denkov, N.D.; Ivanov, I.B.; Vulchev, V.D.; Danner, T. Emulsification in turbulent flow 1. Mean and maximum drop diameters in inertial and viscous regimes. J. Colloid Interface Sci. 2007, 312, 363–380. [Google Scholar] [CrossRef]
- Boxall, J.A.; Koh, C.A.; Sloan, E.D.; Sum, A.K.; Wu, D.T. Measurement and Calibration of Droplet Size Distributions in Water-in-Oil Emulsions by Particle Video Microscope and a Focused Beam Reflectance Method. Ind. Eng. Chem. Res. 2010, 49, 1412–1418. [Google Scholar] [CrossRef]
- Al-Wahaibi, T.; Angeli, P. Droplet size and velocity in dual continuous horizontal oil–water flows. Chem. Eng. Res. Des. 2008, 86, 83–93. [Google Scholar] [CrossRef]
- Yi, L.; Wang, C.; Vuren, T.v.; Lohse, D.; Risso, F.; Toschi, F.; Sun, C. Physical mechanisms for droplet size and effective viscosity asymmetries in turbulent emulsions. J. Fluid Mech. 2022, 951, A39. [Google Scholar] [CrossRef]
- Pal, R. A novel method to correlate emulsion viscosity data. Colloids Surf. A 1998, 137, 275–286. [Google Scholar] [CrossRef]
- Phan-Thien, N.; Pham, D.C. Differential multiphase models for polydispersed suspensions and particulate solids. J. Non-Newton. Fluid Mech. 1997, 72, 305–318. [Google Scholar] [CrossRef]
- Pal, R.; Rhodes, E. A novel viscosity correlation for non-newtonian concentrated emulsions. J. Colloid Interface Sci. 1985, 107, 301–307. [Google Scholar] [CrossRef]
- Pal, R. Effect of droplet size on the rheology of emulsions. AIChE J. 1996, 42, 3181–3190. [Google Scholar] [CrossRef]
- Zhang, J.; Xu, J.Y. Apparent viscosity characteristics and prediction model of an unstable oil-in-water or water-in-oil dispersion system. J. Dispers. Sci. Technol. 2019, 40, 1645–1656. [Google Scholar] [CrossRef]
- Camy, J.P.; Marsden, S.S.; Hung-B, J.E.; Arihara, N.; Casse, F.J.; Alvarado-Q, D.A.; Mandel, L.; Mobarak, S.; Gonzalez-G, H.O.; Mao, M.L.; et al. The rheology of crude oil dispersions. In Proceedings of the SPE Oilfield Chemistry Symposium, Dallas, TX, USA, 13–14 January 1975. [Google Scholar]
- Chen, J.L. Pressure drop calculation of vertical tube flow of oil, gas and water mixtures—By flow pattern calculation method. Pet. Explor. Dev. 1980, 50–61. Available online: https://www.cnki.net (accessed on 10 January 2024).
- Pal, R.; Rhodes, E. Viscosity/concentration relationships for emulsions. J. Rheol. 1989, 33, 1021–1045. [Google Scholar] [CrossRef]
- Wang, W. Investigation of Oil and Water Two Phase Flow and Properties of Water-in Crude Oil Emulsion. Ph.D. Thesis, China University of Petroleum, Beijing, China, 2009. [Google Scholar]
- Pal, R. Influence of interfacial rheology on the viscosity of concentrated emulsions. J. Colloid Interface Sci. 2011, 356, 118–122. [Google Scholar] [CrossRef]
- Kong, R.; Kim, S. Characterization of horizontal air–water two-phase flow. Nucl. Eng. Des. 2017, 312, 266–276. [Google Scholar] [CrossRef]
- Zhang, H.-Q.; Sarica, C. Unified Modeling of Gas/Oil/Water Pipe Flow—Basic Approaches and Preliminary Validation. Spe Proj. Facil. Constr. 2005, 1, 1–7. [Google Scholar]
- Ward, J.P.; Knudsen, J.G. Turbulent flow of unstable liquid-liquid dispersions: Drop sizes and velocity distributions. AIChE J. 1967, 13, 356–365. [Google Scholar] [CrossRef]
- You, J.; Li, C.X.; Liu, D.W.; Yang, F.; Sun, G.Y. Influence of Aggregation State of Asphaltenes on Structural Properties of Model Oil/Brine Interface. Energy Fuels 2019, 33, 2994–3002. [Google Scholar] [CrossRef]
- dos Santosa, R.G.; Bannwart, A.C.; Loh, W. Phase segregation, shear thinning and rheological behavior of crude oil in-water emulsions. Chem. Eng. Res. Des. 2014, 92, 1629–1636. [Google Scholar] [CrossRef]
- Kumar, V.; Brooks, C.S. Benchmark of interfacial area concentration approaches for the two-fluid model in gas-dispersed condensing flow. Prog. Nucl. Energy 2020, 124, 103329. [Google Scholar] [CrossRef]
- Hibiki, T.; Rassame, S. Modeling local interfacial area concentration for adiabatic and boiling bubbly flows. Appl. Therm. Eng. 2023, 234, 121279. [Google Scholar] [CrossRef]
- Iskandrani, A.; Kojasoy, G. Local void fraction and velocity field description in horizontal bubbly flow. Nucl. Eng. Des. 2001, 204, 117–128. [Google Scholar] [CrossRef]
- Hazuku, T.; Takamasa, T.; Hibiki, T. Phase Distribution Characteristics of Bubbly Flow in Mini Pipes Under Normal and Mi-crogravity Conditions. Microgravity Sci. Technol. 2015, 27, 75–96. [Google Scholar] [CrossRef]
- Tselishcheva, E.A.; Antal, S.P.; Podowski, M.Z. Mechanistic multidimensional analysis of horizontal two-phase flows. Nucl. Eng. Des. 2010, 240, 405–415. [Google Scholar] [CrossRef]


| Researchers | Viscosity Model | Application Condition | Remarks |
|---|---|---|---|
| Camy [40] | w/o & o/w | w/o: k = 3.8; o/w: k = 6.6. | |
| Chen [41] | w/o | Take into account the effect of viscosity of oil and water phase and the volume fraction of dispersed phase. | |
| Pal and Rhodes [42] | w/o & o/w | is the volume fraction of dispersed phase which give 100 times the single-phase viscosity. | |
| Wang [43] | w/o & o/w | is the droplet Reynolds number factor relate to the shear action and size of droplet. | |
| Pal [44]) | o/w | Considered the influence of shear rate and interfacial rheology, is the volume fraction of dispersed phase, is the interfacial mobility parameter. | |
| Zhang and Xu [39] | w/o & o/w | h is determined by the dispersed phase distribution and the ratio of the viscosity between dispersed phase and continuous phase. |
| Fluids | Density (kg/m3) | Viscosity (mPa·s) | Interfacial Tension (mN/m) |
|---|---|---|---|
| crude oil A | 792 | 1.01 | 41.72 |
| crude oil B | 850 | 7.16 | 47.68 |
| crude oil C | 893 | 65 | 54.98 |
| water | 990 | 0.546 |
| Fluids | Resins (wt%) | Asphaltenes (wt%) | Saturates (wt%) | Aromatics (wt%) |
|---|---|---|---|---|
| crude oil A | 4.29 | 0.60 | 34.1 | 61.01 |
| crude oil B | 11.61 | 1.58 | 53.42 | 33.39 |
| crude oil C | 16.62 | 2.91 | 48.74 | 31.73 |
| Temperature (°C) | Pressure Gradient (kPa/m) | ||||||
|---|---|---|---|---|---|---|---|
| 0.55 m/s | 0.65 m/s | 0.76 m/s | 0.88 m/s | 0.99 m/s | 1.1 m/s | 1.21 m/s | |
| 30 | 1.09 | 1.40 | 1.80 | 2.19 | 2.77 | 3.28 | 3.79 |
| 40 | 0.99 | 1.26 | 1.61 | 1.99 | 2.57 | 3.09 | 3.57 |
Disclaimer/Publisher’s Note: The statements, opinions and data contained in all publications are solely those of the individual author(s) and contributor(s) and not of MDPI and/or the editor(s). MDPI and/or the editor(s) disclaim responsibility for any injury to people or property resulting from any ideas, methods, instructions or products referred to in the content. |
© 2024 by the authors. Licensee MDPI, Basel, Switzerland. This article is an open access article distributed under the terms and conditions of the Creative Commons Attribution (CC BY) license (https://creativecommons.org/licenses/by/4.0/).
Share and Cite
Lv, Y.; Chen, S.; Lv, G.; He, L. Oil-Water Two-Phase Flow with Three Different Crude Oils: Flow Structure, Droplet Size and Viscosity. Energies 2024, 17, 1573. https://doi.org/10.3390/en17071573
Lv Y, Chen S, Lv G, He L. Oil-Water Two-Phase Flow with Three Different Crude Oils: Flow Structure, Droplet Size and Viscosity. Energies. 2024; 17(7):1573. https://doi.org/10.3390/en17071573
Chicago/Turabian StyleLv, Yuling, Shujiong Chen, Guobin Lv, and Limin He. 2024. "Oil-Water Two-Phase Flow with Three Different Crude Oils: Flow Structure, Droplet Size and Viscosity" Energies 17, no. 7: 1573. https://doi.org/10.3390/en17071573