Review

Methods for Quantifying Expansion in Lithium-Ion Battery Cells Resulting from Cycling: A Review

by
Tessa Krause
1,2,*,†,
Daniel Nusko
3,†,
Luciana Pitta Bauermann
3,*,
Matthias Vetter
3,
Marcel Schäfer
2 and
Carlo Holly
1,4
1
Chair for Technology of Optical Systems TOS, RWTH Aachen University, Steinbachstraße 15, 52074 Aachen, Germany
2
Precitec GmbH & Co., KG, Draisstraße 1, 76571 Gaggenau, Germany
3
Fraunhofer Institute for Solar Energy Systems ISE, Heidenhofstr. 2, 79110 Freiburg, Germany
4
Fraunhofer Institute for Laser Technology ILT, Steinbachstraße 15, 52074 Aachen, Germany
*
Authors to whom correspondence should be addressed.
These authors contributed equally to this work.
Energies 2024, 17(7), 1566; https://doi.org/10.3390/en17071566
Submission received: 20 February 2024 / Revised: 11 March 2024 / Accepted: 19 March 2024 / Published: 25 March 2024
(This article belongs to the Collection Review Papers in Energy and Environment)

Abstract

:
Significant efforts are being made across academia and industry to better characterize lithium ion battery cells as reliance on the technology for applications ranging from green energy storage to electric mobility increases. The measurement of short-term and long-term volume expansion in lithium-ion battery cells is relevant for several reasons. For instance, expansion provides information about the quality and homogeneity of battery cells during charge and discharge cycles. Expansion also provides information about aging over the cell’s lifetime. Expansion measurements are useful for the evaluation of new materials and the improvement of end-of-line quality tests during cell production. These measurements may also indicate the safety of battery cells by aiding in predicting the state of charge and the state of health over the lifetime of the cell. Expansion measurements can also assess inhomogeneities on the electrodes, in addition to defects such as gas accumulation and lithium plating. In this review, we first establish the mechanisms through which reversible and irreversible volume expansion occur. We then explore the current state-of-the-art for both contact and noncontact measurements of volume expansion. This review compiles the existing literature on four approaches to contact measurement and eight noncontact measurement approaches. Finally, we discuss the different considerations when selecting an appropriate measurement technique.

1. Introduction

Due to ongoing concerns regarding climate change, many European governments have enacted legislation to stop or significantly reduce the production of internal combustion engine vehicles in the next few decades [1]. This is putting more pressure than ever on both academia and industry to develop energy storage solutions for electric vehicles that have suitable capacity and operational lifetime. At present, the most promising avenue for the electrification of the global vehicle fleet is lithium-ion battery technology. In addition, the adoption of green energy solutions, such as solar and wind power, necessitates energy storage solutions. Lithium-ion battery technology is well suited to energy storage applications as well, as it has higher energy densities and faster charging than previously used battery technologies such as lead-acid, nickel-cadmium or nickel-metal hydride cells [2].
New active materials are continuously being tested to enhance the performance and longevity of battery cells while also improving sustainability from both an economic and environmental perspective. Moreover, the manufacturing of lithium-ion battery cells is a complex, multistep process, where each step must be executed with low tolerance for error to ensure short-term and long-term performance and safety [3]. As such, a number of metrology and measurement approaches are used to characterize various components in the battery cell. One important parameter to be measured is the reversible and irreversible expansion of the electroactive materials coated on both electrodes that occurs during charging and discharging cycles on assembled battery cells. Expansion measurements can be used to validate expansion models such that manufacturers can predict how much a properly functioning battery cell will expand during its lifetime under normal operation conditions [4,5,6]. This is particularly important when considering electric vehicles, where hundreds or sometimes thousands of cells are packaged tightly together [7]. Should unexpected volume expansion occur, the individual cells might exert excessive pressure on each other [8]. This could lead to failure modes with performance and safety consequences such as detachment of the electrical contact, poor heat dissipation among the cells, or, in a worst case scenario, cell bursting [9,10,11]. Expansion measurements can also be useful to assess the results of aging inside the battery cell, such as gas and metallic lithium generation [12,13,14]. For these reasons, the measurement of volume expansion is essential for the purpose of ensuring cell safety and performance.
A number of review papers have been written on topics adjacent to the measurement of battery expansion. However, the authors believe this review is the first of its kind that considers both contact and noncontact approaches while maintaining a larger focus on the measurement of assembled cells.
Popp et al. review mechanical methods including dilatometry, strain measurement, acoustic emission and ultrasonic probing for state determination in lithium-ion batteries [15]. The authors evaluate sources proposing alternatives to electrical measurements for state determination. This review is limited to mechanical methods and does not consider optical or radiological approaches to cell characterization.
Michael et al. review the use of dilatometry in the measurement of electrochemical devices with a focus on push-piston style dilatometers [16]. The electrochemical devices considered include lithium-ion battery components such as graphite and silicon anodes, as well as cathodes of various compositions. This review provides an excellent overview of the use of dilatometry for the measurement of single components; however, it largely does not consider assembled batteries. This review also takes little consideration into contactless measurement approaches.
Reviews have been written relating to the evaluation of lithium-ion cells. Zou et al. review the types of faults in lithium-ion cells, how these faults manifest, and how the faults can be diagnosed [17]. Expansion is mentioned as an indicator of cell overheating; however, this review does not discuss strategies for measuring expansion. Tran et al. have organized a similar review, with a larger focus on algorithms that can be used to identify faults in lithium-ion battery cells [18]. Battery cell expansion is mentioned in the context of its occurrence as a result of abuse conditions such as over- or undercharge or overheating. Once again, there is no discussion of measurement techniques for evaluating cell expansion.
The review we have compiled first establishes the expansion mechanisms with either reversible or irreversible manifestations. Next, we consider contact and noncontact approaches to evaluating the volume expansion of lithium-ion cells. Finally, we compare and contrast the different approaches, with consideration toward the purpose of the measurement, duration, required resolution, and repeatability of results. Costs and required space for the measurement equipment are also considered.

2. Expansion Mechanisms in Battery Cells

Different mechanisms are responsible for the expansion of battery cells during cycling. Expansion mechanisms can be divided into either reversible or irreversible manifestations [19,20]. Reversible expansion occurs due to the intercalation of lithium ions into and out of the electrodes [21]. Conversely, due to irreversible expansion, the thickness of the battery cell does not return to the initial state and experiences degradation over its lifetime [22,23,24]. The main causes of irreversible expansion are the further formation of the solid electrolyte interphase (SEI) layer, lithium plating, and gas formation [24,25,26].

2.1. Reversible Expansion

The main expansion mechanism in lithium-ion cells occurs due to lithiation and can be observed to be reversible. The lithium ions stored in the lattice of the electrodes are transported from the negative to the positive electrode by diffusion during discharge, with the reverse occurring during charging. This principle is shown in Figure 1. The electrodes go through a reversible swelling and contraction phases during charge and discharge due to the deintercalation and intercalation of lithium ions [27,28,29,30]. Reversible expansion due to thermal effects is also observed during the charging and discharging of lithium-ion cells [31].

2.1.1. Expansion Due to Electrode Lithiation

The negative electrode, commonly referred to as the anode, is typically composed of a copper current collector coated with electroactive materials and additives [33]. The most common anode material in modern lithium-ion batteries is graphite. It has a maximum gravimetric capacity of 372 m Ah / g while storing one lithium ion per six carbon atoms in its fully lithiated stage (LiC6) [34,35]. Figure 2 shows the open circuit voltage (OCV) of graphite and the stages from unlithiated to fully lithiated carbon. Through intercalation in the charging process, lithium ions are extracted from the lithium metal oxide in the cathode and are inserted into the graphite host lattice of the anode. The intercalation of the lithium ions occurs through different stages. At one extreme there is stage 1L, where the unlithiated graphite has a small, randomly distributed population of lithium ions. At the other extreme there is stage 1, where every layer between two graphite layers is filled with lithium ions [36,37]. During intercalation into the graphite anode, an expansion of up to 10% has been observed [38,39]. The typical plateau in Figure 2 from stage 2L to stage 2 depends on the phase transition inside the lattice. Stage 2L is not ordered; the lithium ions in the anode are in undefined positions. Only after reaching stage 2 are all positions filled. Therefore, there is no expansion in this phase, only an ordering of the ions. Stage 2L only appears during delithiation (discharge), and stage 3 appears during lithiation (charge) and forms directly into stage 2 [40]. During deintercalation, the lithium ions are extracted randomly out of the structure, which form a solid solution or a liquid rather than a sorted phase [41].
While graphite is the most prevalent, other materials are utilized as an anode for lithium-ion battery cells. One such material is lithium titanate (LTO). Lithium-titanate (LTO) has a very low gravimetric capacity of 175 m Ah / g in comparison to graphite. During (de-)lithiation, three lithium ions can intercalate into LTO with a average structure strain of approximately 0.2%. This makes LTO a zero-strain material with high cycling stability [43]. Unlike graphite, in LTO anodes, there is no formation of an solid-electrolyte-interphase (SEI) passivation layer. Therefore, no further expansion is expected. LTO anodes have the advantages of good cyclic performance, safe operation, high power, and almost no volume change during intercalation. However, LTO anodes suffer from low electronic conductivities and lithium-ion diffusion coefficients. This leads to low charge and discharge capabilities in high C-rate conditions [44,45,46].
Silicon is also utilized as an anode material. Silicon (Si) has the highest theoretical gravimetric capacity among the current materials used as anodes, with up to 4200 m Ah / g [47]. This high capacity is possible due to the relatively large number of lithium ions per silicon atom. One silicon atom can host 4.4 lithium ions [48]. Due to the high density of intercalated lithium ions into the silicon, the volume expansion of the anode is substantial. The anode expansion has been observed to be from 280% up to more than 300% of its original thickness [49,50,51,52]. Significant expansion can lead to cracks in the SEI layer, which can cause redox reactions between the electrolyte and the electrode’s active material. These reactions can induce loss of active material (LAM), thereby leading to a loss of capacity [53]. Alloys of graphite and silicon are used as an anode to combine the benefits of both materials [54].
The positive electrode in a lithium-ion battery, often referred to as the cathode, is the most dominant factor in determining its working potential range. As a primary cathode material, lithium cobalt oxide (LCO) has become widely accepted for use in electronic devices [55]. This material has a relatively high specific capacity of approximately 140 m Ah / g . The expansion of an lithium-cobalt-oxide (LCO) cathode is around 1.8% of the initial thickness [56].
The most common cathode materials for use in electric vehicles (EVs) are nickel manganese cobalt (NMC) and nickel cobalt aluminum (NCA) [55,57]. The specific capacity of nickel-manganese-cobalt (NMC) as cathode material is 160 m Ah / g –175 m Ah / g [58]. The swelling and contraction of the cathode due to intercalation is typically at least 1% to 3% [59] and up to 4.5% [60] of the initial volume for NMC and nickel-cobalt-aluminium (NCA), respectively. These cathode materials therefore play a minor role in the expansion of a battery cell.
Another common cathode material is lithium iron phosphate (LFP) or (LiFePO4). The theoretical volume change of this material between complete charge and discharge is 6.8% from the initial volume. An important advantage of LFP batteries is their long lifetime of up to 6000 cycles, which is roughly three times higher than NMC cells. Unfortunately, the material has low conductivity, a low lithium-ion diffusion coefficient, high self-discharge rates, and, compared with other materials, a relatively low specific capacity of 130 m Ah / g –140 m Ah / g [61,62].

2.1.2. Thermal Expansion

Variation in the internal temperature of battery cells may trigger thermal runaway and capacity fade, as well as also induce internal mechanical stress [63]. This internal stress is a safety issue during the operation of the cell. Heat production in battery cells can be divided into two different internal heat sources: joule heat and heat generated through entropy changes due to chemical reactions [64].
Joule heat is generated by the ohmic resistance of the electrically conductive internal components, such as the electrodes through which electric current flows [31,65]. The internal resistance of a battery cell is assumed to be combination of the lithium ion and electron conductivity through the current collectors, the active materials, the connectors, and the electrolyte [66]. The generated friction during electric flow is entirely transformed into heat. Therefore, the heat production due to joule heat is completely irreversible and happens during both charging and discharging [67,68]. Differences in the joule heat production and the thermal expansion due to different thermal and electrical conductivity exists also in the external interface of the battery cell, which are the tabs [69]. At high discharge rates, the expected heat generation will occur near the positive tab. Typically, the collector used for the positive electrode is made of aluminum, and the negative electrode is either made of copper or nickel. As a result, the positive electrode has poor thermal conductivity.
Entropy heat is a reversible heat production process in a battery cell. Entropy occurs due to the entropy change during electrochemical reactions from Gibbs free energy conversion to electrical energy. Since lithium-ion batteries have high specific energies, the Gibbs energy is high as well [68,70]. Heat generation due to entropy changes occurs exothermically during discharge and endothermically during charge, thus also contributing to reversible expansion. The components of the battery cell will expand and contract according to their dilatation coefficient [31].

2.2. Irreversible Expansion

When a battery cell expands irreversibly, decomposition material is formed, and the cell does not return to its initial form. This kind of thickness change is associated with cell degradation, such as gas generation, lithium plating, the formation of an SEI layer, or the delamination of active materials due to insufficient external contraction after its expansion [71].

2.2.1. Solid Electrolyte Interface Layer

Most electrolytes are unstable at the operating potentials of common anode materials like graphite or silicon [72]. Since most electrolytes have decomposition potentials below 1 V vs. Li+/Li, the stable operation of the combination of a negative electrode and an electrolyte is not possible [73,74,75,76]. During the formation process of battery cells, a solid, electrically insulating boundary layer at the interface between the electrolyte and negative electrode is formed [77,78]. This layer is referred to as the SEI layer. The nature of the SEI layer is complex and not completely understood, but regardless, it constitutes one of the most important production steps for the safe use of lithium-ion batteries. The generation of the SEI layer occurs from the decomposition of the electrolyte at the electrode/electrolyte boundary [32,79]. The SEI layer is mostly composed of inorganic materials such as Li2CO3, LiF, and Li2O, as well as organic materials like carbonates and polyolefins [79,80]. At the electrode interface, mostly inorganic and thermodynamically stable products are formed, whereas organic compounds are formed on the boundary facing the electrolyte [32]. The SEI layer is shown in Figure 1 between the anode and the electrolyte as letters A to D. The consumption of electrolyte and active electrode material results in an irreversible capacity loss in the battery cell [79]. Once an initial and stable SEI layer has formed, the electrolyte can no longer be positioned adjacent to the electrode material, and no further decomposition takes place. The lithium ions can, however, diffuse through the SEI layer [81].
Since silicon undergoes a large expansion of up to 300% of the original volume, there is a high risk that the SEI layer is damaged during charging and discharging cycles. During lithiation, the SEI layer, which forms on the silicon particles, can break, and a new interphase is created between the electrolyte and the electrode. This leads to a newly formed SEI layer at the boundary, which, after many cycles, results in an irreversible expansion of the anode, irreversible loss of lithium inventory (LLI), and a capacity fade [80].

2.2.2. Lithium Plating

Generally, modern lithium-ion battery cells do not contain any metallic lithium. The intercalation speed, with which lithium ions intercalate between the active materials of the cathode and the anode, is dependent on the temperature and charging and discharging rates. If the temperature during charging falls below 10 °C, a decrease in the nominal charge rate is to be expected [13]. The formation of metallic lithium, referred to as lithium plating, can occur when the anode potential falls below 0 V vs. Li/Li+, at low temperatures in combination with a high state of charge (SoC), and at high charging and discharging rates [82,83]. As soon as the current is applied, a large overpotential is produced. As anode polarization increases, the anode potential falls below 0 V (vs. Li+/Li). At high charging rates, the amount of lithium ions moved from the cathode to the anode in the charge transfer process per unit of time increases. Since the intercalation speed is limited, lithium ions might remain on the outer surface of the anode and be reduced to metallic lithium. The reverse can occur in the case of high discharge rates.
Based on charging conditions, the morphology of deposited lithium varies. It can be classified into three types, including mossy, granular (particle-like), and dendritic (needle-like deposits). The morphology is determined by the current rate. Mossy and granular lithium form at low current rates, whereas dendrites form at high current rates [84]. Lithium plating is a critical safety issue. Solid lithium has the ability to pierce the separator and reach the opposite electrode, thus causing a short circuit within the battery cell. Dead lithium, the main component of inactive lithium, on the anode surface can also form an electrically insulating, high-impedance layer [84]. All of these degradation effects result in a reduction in the capacity of the battery cell [84].
Measuring the changes in cell thickness can be a useful strategy for detecting lithium plating [85]. According to the literature, when transitioning from a completely unlithiated condition to lithiated LiC6 (intercalation of lithium), the total volume of the graphite anodes can increase by up to 10% [13]. When the lithium deposits on the surface of the graphite instead of intercalating into the anode, this leads to an additional increase in the overall volume. Some metallic lithium can intercalate as lithium ions into the anode host lattice after a certain relaxation time, thus leading to a reversible lithium plating with a capacity recovery [86,87]. Due to the reversibility of lithium plating, the cell thickness increases rapidly during the lithium plating condition and decreases during the rest time. Identifying lithium plating through volume expansion is straightforward, but it requires the use of an accurate device to measure cell thickness. Furthermore, this approach is only applicable to pouch cells [84]. Active lithium is lost either through SEI formation reactions or through the loss of contact to the active surface through the formation of isolated lithium metal particles or layers. This irreversible share of the lithium plating, as well as the gas generation, results in a permanent thickness increase [13].

2.2.3. Gas Generation

The first charge cycles of a battery cell during its manufacturing produces the controlled formation of the SEI layer and gas generation by the decomposition of the electrolyte and electrode. Degassing is common practice in the cell manufacturing process. The further generation of gas can be a result of contamination within the cell, an incompatible combination of electrode/electrolyte materials, or due to abusive operating conditions (high/low temperature, under high pressure, or over/undercharging) [19]. Significant research has gone into additives to the electrolyte to prevent gas generation. The gas accumulation inside the cell can cause negative effects such as increased impedance between the electrodes, decreased capacity, shortened shelf life, and a shorter useful lifetime. In addition, this gas is usually composed of hydrogen or organic compounds, which are often highly flammable [88]. Further formation of the SEI layer due to degradation reactions leads to the production of gas, which leads to irreversible swelling. This reaction is exothermic and can also cause an increase in the temperature inside the cell [64].

3. Measurement of Expansion in Lithium-Ion Battery Cells

There are different approaches to measure the expansion in lithium-ion batteries. These can be divided into two groups: contact and noncontact measurement approaches. The value of the expected expansion of battery cells depend on the chemistry used, thickness, and number of electrode layers. However, cell expansion should be in the range of a few micrometers to a few millimeters.

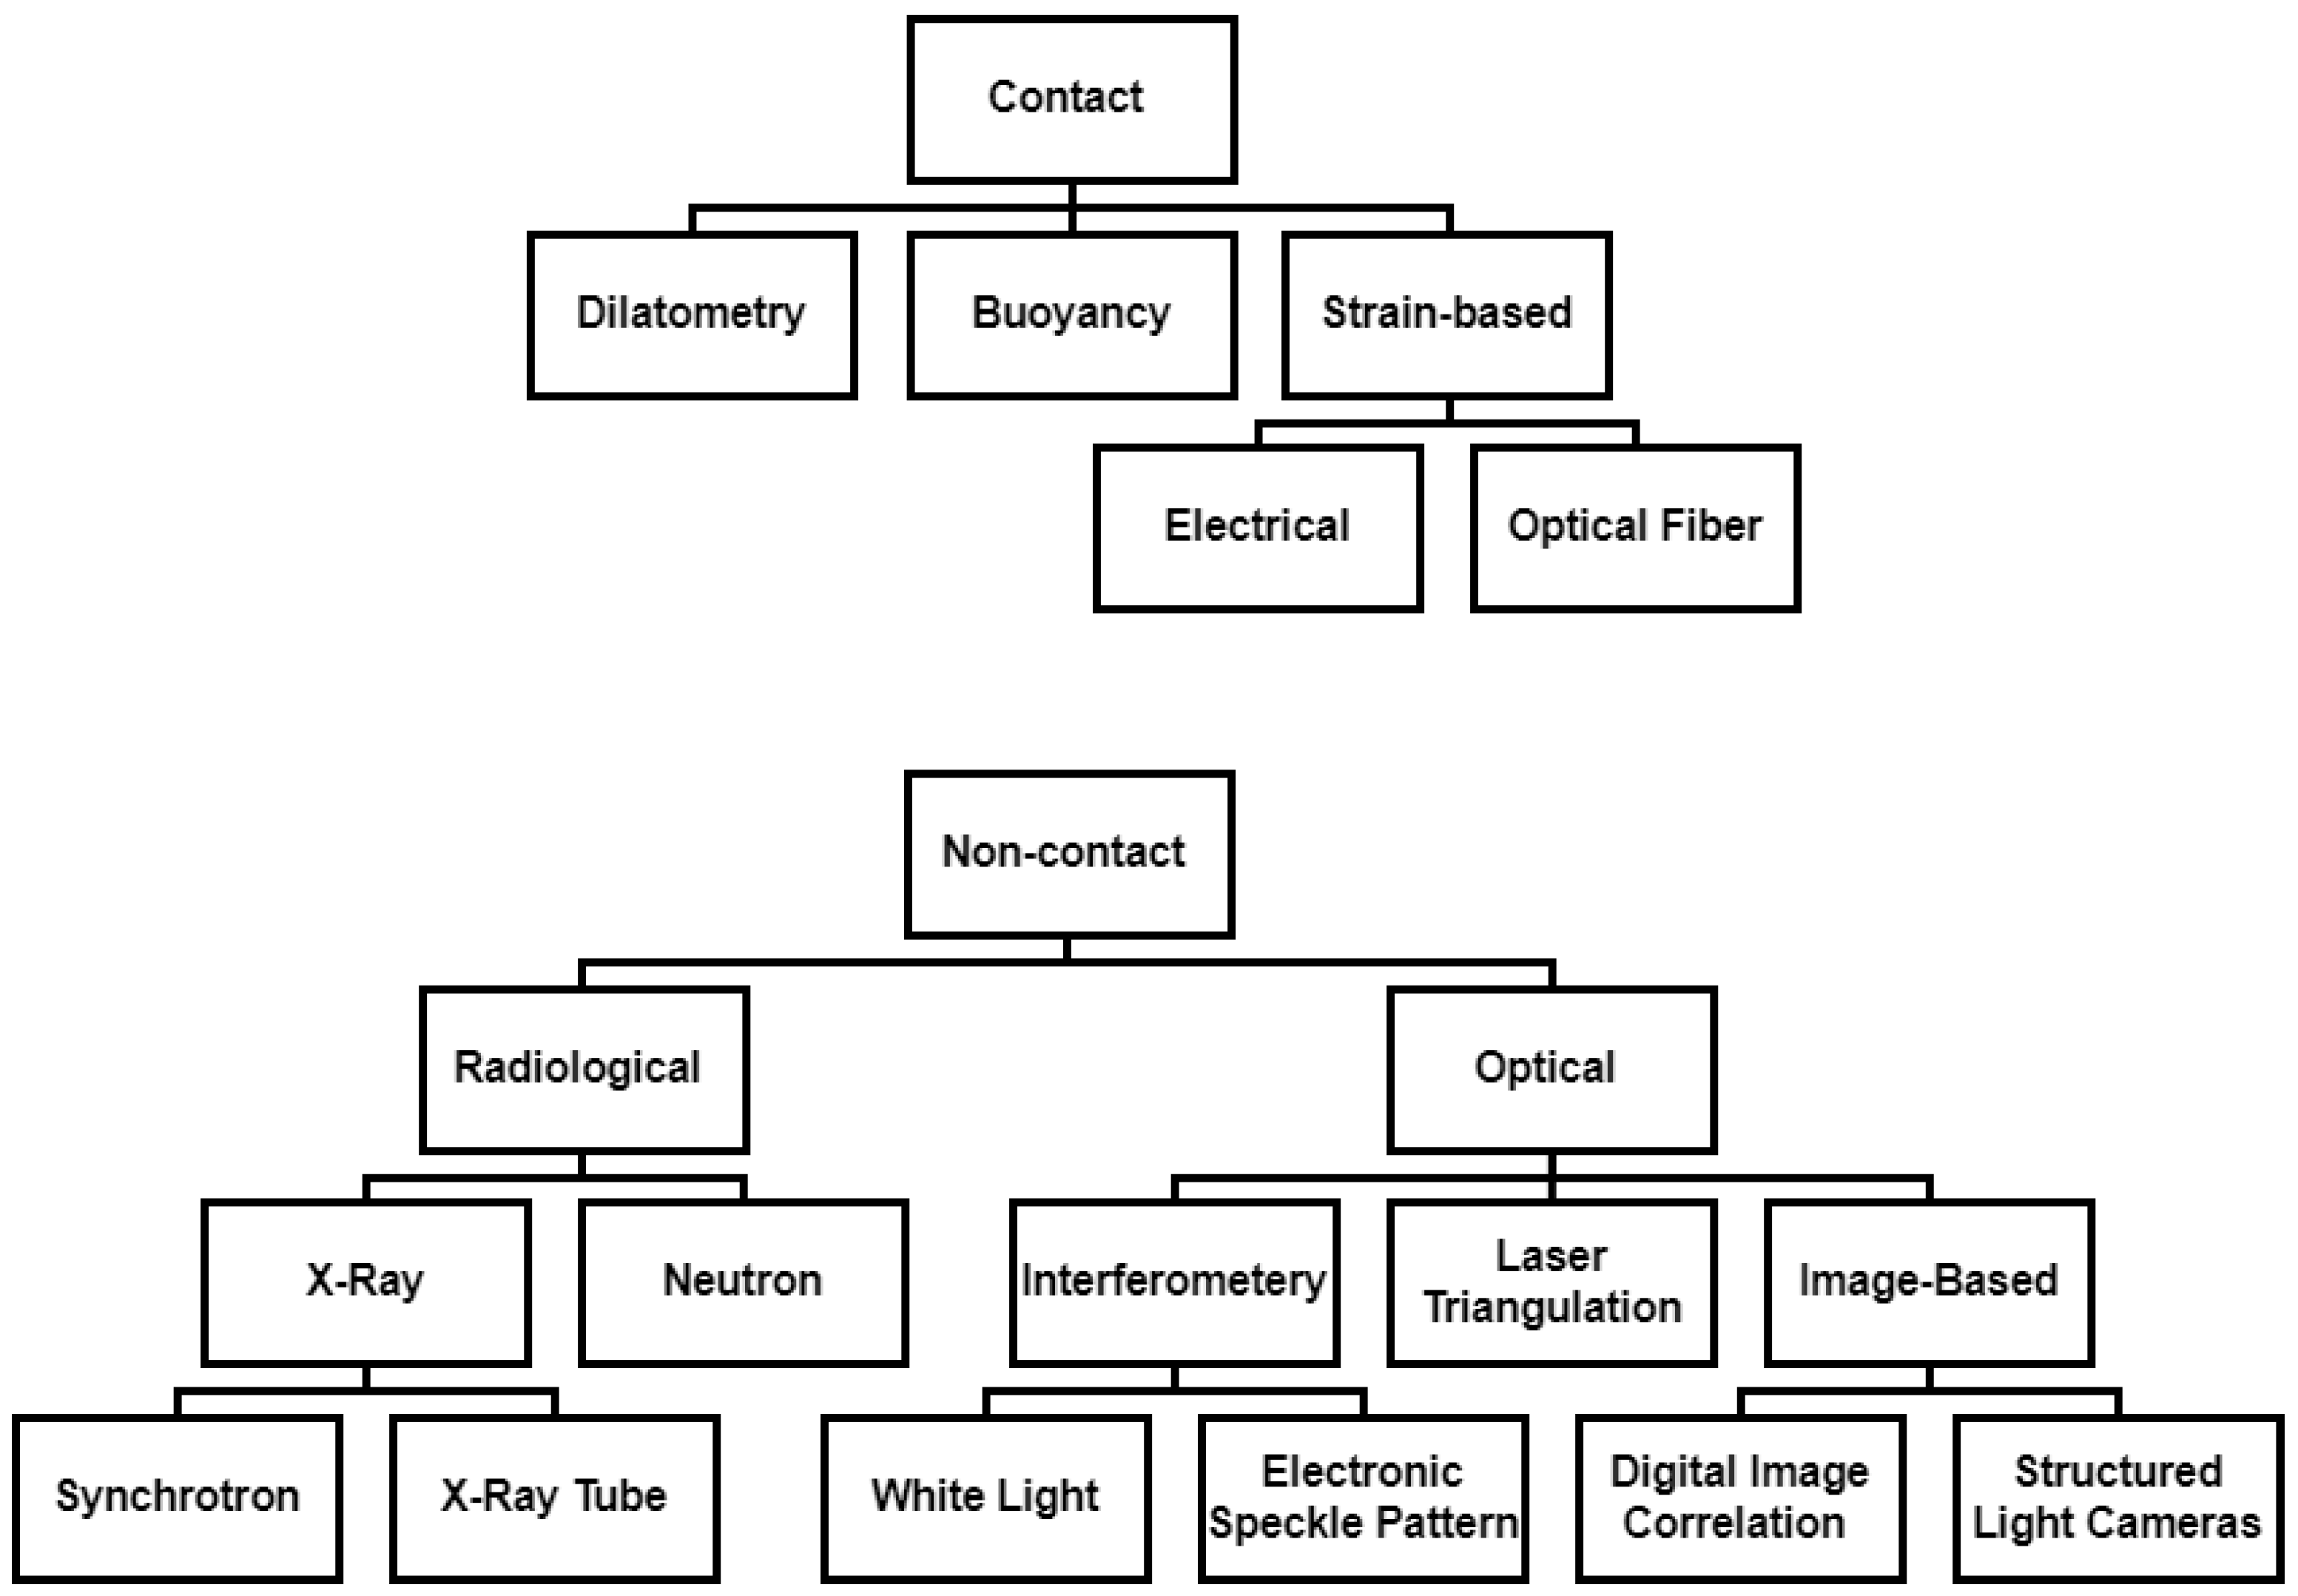
3.1. Contact Approaches

Contact measurements can be carried out both outside the housing on entire battery cells and on individual components within disassembled battery cells. Contact measuring principles vary in terms of the sensor contact area and the pressure applied between the sensor and object to be measured. Contact approaches can be divided into dilatometer, strain, and buoyancy measurements. A summary of the advantages and disadvantages of these measurement approaches can be found in Table 1.

3.1.1. Dilatometry

Mechanical dilatometry is one of the oldest and most frequently used methods for measuring the expansion of different materials on a macroscopic level [89]. Primarily used to determine the specific temperature coefficient, this method has now become established for measuring the expansion of battery cells. The typical design of a dilatometer is comprised of a sensor that is positioned away from the heat source. As a result, it is possible to calculate the coefficient of thermal expansion (CTE) of the material or device by characterizing the expansion [89].
Depending on the sensor design, dilatometers can be of various types, such as push-piston, push-rod, capacitance, high-resolution laser, and optical [16]. One of the advantages of dilatometer measurements is the possibility to measure the entire battery cell, as well as single components individually. The advantage of dilatometry lies in its nondestructive nature and simplicity. The most common system, especially to measure the expansion of battery cells and electrochemical devices, are push-piston dilatometers [16,89]. The measuring object is placed between two plates: one fixed and one with the possibility to move parallel in the direction of the swelling.
Dilatometers can be used to make ex situ measurements to assess the expansion and the intercalation of guest ions into a host structure [90]. In this case, the battery cell must be disassembled, and the thickness of individual components can be measured. For a good estimation of expansion in the battery cells, post mortem analyses should be done for unaged and aged samples. In 1982, Biberacher et al. [91] presented a method for measuring the electrochemical intercalation of HSO4/H2SO4 in graphite using a high-resolution push-piston dilatometer. They observed a maximum dilation of 140% for graphite during intercalation. Figure 3 shows two typical apparatuses for dilatometry measurements of electrochemical devices. Figure 3a shows the setup for the thickness measurement of single working electrodes. The working and counterelectrodes are separated by a rigid separator, which is in modern dilatometer setups typically made out of a stiff, but porous and permeable glass frit [92,93]. The push-piston sensor is placed above the working electrode to measure the horizontal displacement from intercalation into and deintercalation out of this electrode. The dilatometer illustrated in Figure 3b has the ability to measure the swelling of whole battery cells. The displacement sensor is typically placed in the center of the battery cell.
Rieger et al. [94] used dilatometry to investigate the expansion of commercially available LCO/G cells. For this purpose, one dilatometer was used for the graphite anode and one for the LCO cathode. The setup is similar to that shown in Figure 3a. Here, an expansion of the LCO cathode of about 2% and of the graphite anode of about 7% with complete lithiation were measured. During normal use, as specified by the manufacturer, there is an expansion of 5%.
Moyssari et al. [90] used an electrochemical dilatometer to measure the change in thickness of anode materials with different SiG compositions: one with a ratio of 0/95, and one with a ratio of 20/75. Two coin cells were made using each anode composition. The working electrode was SiG, and the counter electrode was made of lithium metal. After a 6 h rest period, eight cycles were performed with a C rate between 0.033 C and 0.1 C. The electrochemical dilatometer used contains a separator made of porous borosilicate glass between the two electrodes. This separator mechanically decouples the two electrodes. The expansion sensor applies a force of 1 N to ensure permanent contact. It was found that the specific capacitance and the capacitance loss increased with higher silicon content. The hysteresis between lithiation and delithiation also increased with enlarged silicon content. During normal use, an expansion of 5.2% occurred. Among other causes, this can be attributed to the continuous formation of the SEI. In the formation cycles, the expansion behavior increased from about 5.5% for the 0/95 electrode to about 47% for the 20/75 electrode. For later cycles, the expansion behavior for the 0/95 electrode remained the same. For the next largest SiG ratio of 3/92, the expansion decreased from 14% during formation to 7% for further cycles. For the SiG ratio of 20/75, a relative expansion of 20% occurred after the initial formation cycles. This expansion behavior remained constant during the further cycles, with little deviation. The specific capacity increased from a ratio of 0/95 to 20/75 from 326.55   m Ah / g AM to 925.62   m Ah / g AM. The authors also showed that the lithiation of silicon took place after the graphite lithiation was completed.
While both Moyssari et al. and Rieger et al. were able to gain valuable insights into the expansion behavior of individual electrochemical components, dilatometry measurements of the anode and cathode individually are not necessarily representative of expansion of an assembled cell. When the expansion of the entire battery cell is to be investigated, in operando measurements should be performed. The expansion of the complete battery cell is measured during charging and discharging cycles. The in operando measurements refer to those made during the operation of an assembled cell, unlike in situ measurements, which are performed on an assembled cell, but not necessarily during operation. The direct expansion at one point of the battery cell or at multiple points can be measured with linear displacement sensors, as shown in Figure 3. Alternatively, the pressure exerted by the expansion inside the battery cell can also be measured with pressure sensors and load cells [96,97,98,99].
In Figure 3b, a common test stand for measuring the complete thickness change of battery cells is shown. Most of these setups consist of frames above and below the battery cell (3) held together by parallel screws (6). The battery cell (7) is typically placed on the bottom frame (3). A pressure plate (5) is placed on top of the cell to create a constant pressure over the entire surface. The swelling over the complete surface of the battery cell is measured. The screws also constrain the springs (2), which exert force on the pressure plate. The dial gauge (4) is located in the middle of the top frame. The electrical contact (1) is directly connected to a battery cell testing device [95]. Apparatuses similar to that in Figure 3b were also used to investigate expansion in pouch cells in several references [12,13,60,64,95,100,101,102,103,104,105,106,107]. Some apparatuses exclude the springs (2) and pressure plate (5). In such cases, the expansion of a single point of an uncompressed battery cell is measured [108,109].
This apparatus allows for the measurement of the complete cell. The measurement of the complete battery cell gives information about all electroactive layers, separators, and the electrolyte. In 2003, Lee et al. demonstrated one of the first test stands for the measurement of 1D battery expansion [110]. A data logger with a dial gauge was equipped to a constant load of 300 g . The dial gauge was connected to a data logger system, and the complete rig was placed inside a climate chamber. The formation of the SEI layer in the initial charge was shown. The irreversible swelling was reported to account for up to 2% of the initial thickness, and the overall expansion was up to 4% of the initial thickness of the cell.
Rieger et al. [94] expanded on the measurement made by Lee et al. [110] by incorporating a second displacement sensor on the opposite side, with both sensors placed at the center of the cell. The cell being investigated was a commercial 2.3   Ah LCO/G cell. The measurements made were compared with the mean values of a 3D structured light camera system. Rieger et al. concluded that 1D dilatometry can be used to calculate the SoC-dependent electrode swelling for electrochemically and mechanically coupled models for battery cells.
Louli et al. [111] used a 1D dilatometer setup to investigate the volume change of an NCA/SiO-G cell with a capacity of 260 m Ah . The cathode material had x and y values of the single components between 0.05 < x < 0.15 and 0.02 < y < 0.10 . A single stacked battery cell consisting of only one positive and one negative electrode was built for this measurement. As with the previous studies cited thus far, the displacement sensor was positioned in the middle of the cell. Unlike the previous studies, a spring was installed to exclude local expansion due to gas formation. The applied pressure was limited to 30 k Pa , which has no impact on the cell behavior. The resulting expansion, shown in Figure 4b, demonstrated asymmetric behavior for the charge and discharge. This asymmetry is a sign of hysteresis between the charge and discharge cycles. Louli et al. also demonstrated that the thickness change is not linear with the SoC for the battery cell they were investigating.
The previously mentioned studies considered cells under relatively normal operating conditions. Vorwerk et al. [64] used 1D dilatometry measurements to measure cell expansion during abuse testing. They performed tests under critical cell conditions with overcharging, reaching an SoC of over 100%. NMC/G cells with a capacity of 75 Ah were investigated. The measurement setup was similar to the one shown in Figure 3b. It was discovered that there was a significant increase in the cell expansion at an SoC of 112% up to 2.2   m m (17% of the initial cell thickness). This expansion could be explained by gas production due to decomposition reactions of the active material. After the cycle was stopped, the cell was allowed to relax for 45 h to ensure that no cell bursting or fire occurred. In this time, the expansion increased by a further 5%. This study resulted in the important finding that cell expansion begins far before catastrophic events, such as cell bursting. The expansion of battery cells could be an indicator for monitoring the safety of battery cells.
Dilatometry measurements can also be used to assess the force exerted by the cell expansion rather than measuring the expansion itself. Berckmans et al. [112] investigated the influence of external pressure on battery cells by measuring the force exerted by the cell undergoing expansion. Two different chemistry types where evaluated. The first cell was constructed with an NMC532 cathode, and the second with an NMC622 cathode. Both cells used an anode made of a silicon–graphite alloy. The measurement apparatus used was similar to that demonstrated in Figure 3b; however, the dial gauge was replaced with a force sensor between the top mounted plate, and a pressure plate was placed on top of the battery cell. Figure 5 shows the voltage and current in the top graph from the OCV test, whereas the lower graph shows the exerted force. The measurements demonstrated that the force curve could be divided into three main stages. The first stage (colored red in Figure 5) shows nearly constant force. This could be explained by the quantity of graphite in the anode alloy, which experiences less volume expansion than silicon during intercalation [113]. Delithiation in graphite occurs at potentials of 0.1– 0.2   V vs. Li/Li+, whereas in silicon, lithium deintercalates at potentials of 0.3– 0.5   V vs. Li/Li+ [42,114,115,116]. Berckmans et al. [112] also demonstrated that there was no C-rate dependency on the induced force due to intercalation.
Jin et al. [117] used a similar setup to Berckmans et al. [112] in order to measure the stress exerted by constrained cells during cycling. Jin et al. expanded on the measurements made by Berckmans et al. by also evaluating the thickness evolution of battery cells under constant force. The thickness measurement was performed with constant load applied to the top of the cell and was recorded with a high-speed camera. An NMC532/G cell with a nominal capacity of 1.6   Ah was chosen for these measurements. The applied stresses were 34.5   k Pa and 172.4   k Pa . For the thickness measurement, the applied stress was 103.4   k Pa , as determined from previous experiments. The cells were charged at different C rates and upper cut-off voltages. As a result, for the stress measurement, it was concluded that the stress increased with a higher upper cut-off voltage but decreased if the initial stress or the C rate was increased. The thickness, on the other hand, increased if the C rate or the upper cut-off voltage was increased, but the thickness evolution was decreased if the initial stress was increased.
Louli et al. also performed a study where thickness measurements and force measurements were executed in two different experiments. Louli et al. [111] investigated both 1D dilatometer measurements and the force exerted by an NCA cell. Two additional chemistries were also investigated: LCO/Si and NCA/nano SiC with capacities of 230 m Ah and 165 m Ah , respectively. The NCA cathode material had x and y values of the single components between 0.05 < x < 0.15 and 0.02 < y < 0.10 . For this measurement, a setup with two enclosure walls was used, in which a defined pressure can be generated through a screw with one adjustable enclosure wall. Between this casing, the pouch cell is placed with a pressure plate and the pressure sensor. The cells were cycled for more than 1000 h at 40 °C and charged with a C rate of C/3. An irreversible increase in pressure was observed over time. The LCO/SiG-alloy battery cell had a much higher irreversible volume expansion. The reversible pressure for the two different cycles is shown in Figure 4b in orange and violet. The pressure measured had a similar asymmetric behavior as the measurement with the 1D displacement sensor mentioned earlier.
While dilatometry is often used to assess the expansion of cells on the whole, dilatometry can also be used to assess expansion with a specific cause. Stock et al. [12] measured the gas production and the swelling of a cell with a 1D dilatometer. An adjustable pressure plate was fixed by four springs onto the surface of the cell with a pressure of 200 k Pa . A tactile displacement sensor was located at the center of the plate to measure the swelling behavior of the cell. A second plate was placed on the gas bag, which was attached to the cell without any extra pressure applied. This plate is free to move in one direction, and a second tactile sensor is placed in the center of the cell. Through the applied pressure on the cell, the gas is forced to move into the attached gas bag. Through calibration, the accuracy of the volume measurement was 0.6 μL. The authors showed that the most gas production and expansion in NMC622/G cells and NCA/SiC cells occurs during the formation cycles. Another result was that the gas production with respect to the cell voltage in NMC/G cells diminishes when the dilation begins to increase. This is explained by the fact that the formation of the SEI layer begins before the lithiation of the graphite anode.
Stock et al. used dilatometry to evaluate expansion that can be attributed to gas formation, but dilatometry can also be used to evaluate expansion from other negative effects in lithium-ion cells. Bitzer and Gruhle [13] used 1D dilatometry to detect lithium plating in operando in NMC pouch cells. The state of the art to detect lithium plating was to measure the negative anode potential vs. Li/Li+ with a reference electrode or in a half-cell configuration. Initially, they started with calculating the molar masses of the transferred charge. They found that plating should lead to an increase in volume expansion, since the intercalation of lithium ions in graphite results in a lower expansion than the deposition of metallic lithium on the anode surface.
Figure 6 shows the expansion behavior of the transferred charge with and without plating measured with the 1D dilatometer. It can be seen that the absolute expansion with high current (red) was much higher than with a low current (blue). The peak rose at the constant voltage phase and decreased when the charge was stopped. Through decomposition of the electrolyte, gas is produced. The presence of gas can introduce errors with respect to the measurement of the expansion of electrodes. In order to differentiate the swelling of the pouch cell caused through gas production or electrode expansion, Bitzer and Gruhle [13] proposed a method that included a spring directly coupled to the dial gauge. The spring adds a defined force against the battery cell, any gas will move sideways, and only solid expansion will generate enough force to contract the spring.
Grimsmann et al. [85] performed 1D expansion measurements with a setup similar to the one in Figure 3b. They compared the expansion of calendaric and cycle-aged cells, as well as cells with provoked lithium plating. To induce lithium plating, 22 Ah NMC cells were placed in a climate chamber at 0 °C and were charged with high currents. As a result, they confirmed and expanded on the findings of Bitzer and Gruhle [13]. The expansion of the cells with lithium plating was found to be higher than the expansion from cycle aging under normal conditions. There was also a difference in the expansion behavior based on the dominant degradation mechanism in the cell. The three tested mechanisms showed different swelling behaviors.
Oh et al. [8] studied the expansion of a 5 Ah prismatic NMC/G cell. Instead of measuring expansion at a single point as demonstrated by the previously reviewed studies, five contact displacement sensors were mounted on the surface of the cell. One was placed at the center of the surface, and the other four were located in a cross pattern on the top, the bottom, left, and right of the center probe. On the opposing side, one extra displacement sensor was located in the center of the surface. They came to the conclusion that the greatest expansion took place in the center of the cell with 1.5% expansion with respect to the initial thickness and around 0.75% for the other positions. The measured expansion on the left and right side was smaller than on the upper and lower sensors. Also, the expansion decreased toward the edges with a maximum expansion of 0.55% on the right and left side and around 0.3% for the top and bottom. This difference could be caused by the mechanical constraints of the cell housing. The variation in the ratio between the center and the other locations was similar. Therefore, it was concluded that one sensor in the center can accurately quantify the cell swelling. This justifies the single-point approach used in the previously mentioned studies.
Electrochemical dilatometry is an inexpensive approach that covers a broad range of expansion measurements for battery cells. As shown, dilatometry covers dial gauges, tactile distance sensors, and load cells to measure the pressure built up due to expansion. The setup, independent of the sensor used, can be designed to only measure the expansion behavior of a single working electrode up to the measurement of a whole cell. The overall setup is easy to implement and integrate with other devices used in battery characterization, such as a battery cycler. The resolution and measurement range for dilatometry measurements is varied and depends on the selected sensor. This method of expansion measurement is nondestructive and is considered to be a noninvasive measurement technique.

3.1.2. Buoyancy Measurements

Dilatometry measurements have been demonstrated as a way to both directly measure expansion at a point and to indirectly measure expansion by measuring the exerted force. Another type of indirect measurement of expansion is to measure the change in buoyancy of the cell when it is suspended in a fluid. Aiken et al. [118] were the first to use the Archimedes principle to measure the amount of produced gas in the formation cycling of battery cells. The purpose of this measurement was to understand the behavior of gas production during formation cycling and in undefined conditions, such as electrode/electrolyte redox reactions. They made use of an apparatus resembling the the left image in Figure 7. They immersed a cell in a nonconductive fluid and hung it from a balance on the top of the apparatus. By placing the cell into liquid, a buoyant force F b acts on the cell.
F b = ρ F l u i d · g · V C e l l
where ρ F l u i d describes the mass density of the fluid, g defines the acceleration due to gravity, and V C e l l is the volume of the cell. In Figure 7, the right side displays the active forces acting on the cell. In stationary conditions, the balance of forces is, according to ref. [12], as follows:
F g = F b + F t + F w , | |
where F g is the measured force, F t is the tension force by the hook, and F w , | | is the force due to the connection wires. Since the measured force and the wire force remain constant due to the same mass, changes in the measured force are only a function of the volume of the cell. This leads to changes in the buoyant force and therefore in the tension force. F t can be represented as
Δ F t = Δ m b a l a n c e · g = ρ F l u i d · g · Δ V C e l l = Δ F b
Rearranging Equation (3) according to the change in volume gives
Δ V C e l l = Δ m b a l a n c e ρ F l u i d
With this equation, the volume change of the cell can be derived from the mass measurement registered on the balance.
Aiken et al. [118] investigated gas formation with different kinds of electrolytes with the apparatus shown in Figure 7. They used NMC111/G cells with a capacity of 225 m Ah . Nine cells were investigated. Five cells were clamped between pressure plates to ensure a constant force on the cells surface, and the remaining four cells were cycled unconstrained. During formation, the immersion bath was placed inside a climate chamber and heated up to 40 °C. In the first cycle, the clamped cells produced a large amount of gas in a short time and then remained constant. The unrestrained cells, on the other hand, formed an initially higher quantity of gas, which then decreased very quickly. This is explained by the fact that the gas is diverted into the gas pocket in the clamped condition and has little time to react with the electrodes. In a second test, formation cycles with different currents were performed. They concluded that during the formation cycle, the composition and the quantity of the gas produced were similar as long as the currents remained below C/3.
Stock et al. [12] made a similar measurement to Aiken et al. in addition to a 1D dilatometry measurement to compare the gas production of two different cells in the formation cycle. One cell had an NCA cathode with a SiC anode, and the other had an NMC cathode and a graphite anode. Similar to the Aiken et al. study, the authors investigated gas formation in both compressed and uncompressed cells. Measurements on the compressed cells were made using 1D dilatometry with a pressure plate on the cell surface to apply pressure. Measurements on uncompressed cells were made using the Archimedes principle, as was done in the Aiken et al. study. Figure 8 shows the expansion measured for both measurement techniques with the NCA/SiC cell on the left-hand side and the NMC/G cell on the right-hand side. For the NCA cell, both measurements provided similar results. For the NMC cell, however, the two measurements provided different results. This is explained by the fact that the unstressed cell initially produces a large amount of gas in the liquid phase of the graphite intercalation, which later reacts to form liquid or solid components in the graphite structure. In the tensioned structure, no reduction reaction can take place due to the applied pressure. Cell dilation is described as the main expansion influence.
Leißing et al. [119] investigated the influence of the C rate on the gassing behavior of NMC622/graphite cells with a nominal capacity of 5 Ah . To determine the amount of gas produced during the formation cycles, the same apparatus as Aiken et al. was used [118]. They charged the cells at different C rates and measured the volume differences due to gas production directly after reaching the lower cutoff voltage. The most gas was produced (7.7 mL) with a C rate of 2 C, and the least amount of gas (1.6 mL) was produced with a C rate of 0.1 C. The lowest C rate of 0.05 C produced, in contrast, a comparatively high amount of gas (4.2 mL). This is explained due to the long time spent at lower potentials. The extended formation time leads to an increase in electrolyte reduction and more parasitic reactions.
Louli et al. [111] used the principle of buoyancy force, in addition to pressure measurements and the 1D dilatometry measurement, to measure the volume change of battery cells during charge and discharge cycles after formation. They compared all three measurement techniques, as shown in Figure 4. All three techniques demonstrated similar behavior in volume expansion, thereby leading to the conclusion that all techniques are suitable for this type of measurement.
Many of the proposed methods for applying Archimedes’ principle use the technique to measure gas evolution in battery cells during the formation cycles with different electrolyte compositions [120,121,122,123,124,125,126] or with electrodes with different chemical compositions [127].
For safety reasons, expansion measurement according to Archimedes’ principle requires a nonelectrically conductive fluid in which the cell is immersed. This type of measurement offers a good opportunity to measure the gas formation caused by decomposition processes between the electrode and the electrolyte. Due to the nonelectrically conductive liquid in which the cell is immersed, this technique offers the possibility of in operando measurements. A disadvantage of measuring the buoyancy force is that only volume changes due to gas formation can be detected. Additional sensor technology is required to be able to assign the volume changes to individual processes. In addition, the cell being interrogated will become contaminated with the fluid.

3.1.3. Strain Measurement

To establish reliable condition monitoring for lithium-ion batteries, it is advantageous to integrate strain measurement into the classical electrical measurements of the battery cells [128]. The expansion of the cell induces deformation in the housing due to strain. In their study, Hickey and Jahns [129] demonstrated a correlation between cell expansion and the strain on the cell’s housing. The strain imposed on the cell’s housing by internal expansion mechanisms can be quantified using either strain gauges or optical solutions such as Fiber Braggs Grating (FBG) sensors.

Strain Gauges

Strain gauges convert distortions from stress and strain into electrical resistance, which can be measured. Hickey and Jahns [129] combined measurements with strain gauges and tactile displacement sensors to assess the feasibility of SoC estimation. For this purpose, 5.5   Ah prismatic cells were cycled. Three strain gauges were placed, with two gauges on the opposing side near the center of the cell and the third gauge near the exhaust vent. The tactile sensor served as a reference placed at the center of the cell. Figure 9 shows that the strain measurements at the vent position on prismatic cells were comparable with the 1D displacement measurements during a discharge pulse measurement with a current of 0.5 C. Moreover, SoC estimation of the battery cells is possible with this apparatus.
While Hickey and Jahns established a relationship between the SoC and strain, Willenberg et al. [130] investigated the correlation of the overall impact of the cell expansion on the cell aging. They cycled 51 commercially available 18,650 cylindrical cells with an NCA cathode and an anode made of graphite and a small amount of silicon. The nominal capacity of the cell was 3350 m Ah . The cell had an initial diameter of 18.55   m m and was wound 19 times in the housing. The cell was aged at 0.5 C with an average SoC of 50% and a cycle depth of 50%. They found that there was a discrepancy in the diameter change between the charge and the discharge cycles. The authors explained this behavior as being caused by the different intercalation stages of lithium ions during charge and discharge. For the 51 cycled cells, they found an average diameter change in the cells of 10.7 μm with a standard deviation of 4.4 μm. Up until the cell diminished to a state of health (SoH) of 80%, there was a slight increase in the irreversible diameter change. In contrast, a large increase in the irreversible change occurred when the cell approached an SoH of 60%. After 700 cycles, they found a significant increase in the cell diameter, as well as in the temperature of the cell. Postmortem analyses showed the irreversible diameter change in the form of a deformation of the inner windings. The authors concluded that there was a correlation between the capacity fade of the battery cell and the change in the battery cell diameter. They also showed that it is possible to measure both the reversible and irreversible volume change in cylindrical battery cells using strain gauges.
Strain gauges can also be used to measure the expansion of cells under abuse conditions. Choi et al. [131] performed tests under extreme temperature conditions using carbon nanotube (CNT)-based strain sensors to measure the volume change of a pouch bag caused by excessive temperature fluctuations. A cell was heated to approximately 90 °C until gas leakage occurred due to excessive gas production. The complete deformation of the cell was measured with high temporal resolution, thereby leading to the conclusion that this setup could be used for real-time measurements.
The strain gauge measurement approach has been demonstrated to effectively measure the expansion behavior of cylindrical and prismatic cells. The state of charge of the battery cell can be determined based on the strain of the housing material. One disadvantage is that the sensor has to be attached tightly to the cell, which can lead to changes in stiffness. This is mostly a concern when attempting to make measurements on the comparatively soft material of a pouch bag.

Optical Fiber Sensors

Fiber Braggs Grating (FBG) has been established as a standard fiber optic sensor for monitoring battery conditions. Typically employed for measuring in situ strain and temperature, this sensor type is based on an optical fiber with a grating featuring a defined period [132].
Figure 10a shows the unloaded FBG sensor on the left side. A broadband light source is used to send a certain light intensity I I through the optical fiber. The grating then acts as a filter and reflects a light intensity I B with a predefined wavelength, referred to as the Bragg wavelength. The remaining light intensity I T , composed of the unfiltered wavelengths, is transmitted and monitored using an optical sensor. The Bragg wavelength can be represented as
λ B = 2 n e f f Λ
with λ B as the Bragg wavelength, n e f f as the effective refractive index of the grating, and Λ as the period of the grating [133]. The Bragg wavelength can be influenced by external effects such as strain or temperature [134]. In the case of an applied strain on the optical fiber, the period of the grating λ U V changes. As a result, the reflected Bragg wavelength changes as well. The wavelength increases for tensile forces and decreases for pressure forces applied on the length of the fiber, as shown in Figure 10b. The resulting wavelength shift can be described as
Δ λ B λ B = 1 p e · ε
with p e as the photoelastic coefficient and ε as the strain Δ l / l 0 [135].
A secondary influence on the reflected wavelength is the external temperature, as shown in Figure 10c. A change in temperature results in a change in the effective refractive index n e f f [136]. The change due to thermal influences is effectively a superposition of a change of the refractive index and thermal expansion. The shift in the refractive index has a dominant effect and accounts for up to 95% of the expansion, with thermal expansion playing a minor role [137].
FBG sensors are immune to electromagnetic interference, chemically inert, mechanically robust, and allow for the use of multiple sensors [132,134]. Many of the proposed methods, including optical fiber sensors, were developed to measure the temperature of the battery cell and not the strain induced due to reversible and irreversible expansion [132,138,139,140,141]. Since the main focus of this review is the expansion behavior of lithium-ion battery cells, the strain measurement of optical fiber sensors is of greater relevance.
Yang et al. [142] were the first to apply FBG sensors onto the surface of battery cells. Their aim was to monitor the external temperature of the battery cell surface. For this purpose, seven Bragg sensors on one string were installed and coupled to the top and the bottom of three cells. The seventh sensor was installed in the climate chamber to measure the ambient temperature. They were able to measure the temperature under different charging conditions. Compared to thermocouples, this sensor was also able to response to dynamic inputs.
Sommer et al. [143] extended the measurements beyond temperature monitoring to the characterization of intercalation stages of lithium-ion batteries during charging and discharging cycles. They installed two FBG sensors on the top of a 15 Ah NMC/G pouch cell. They used a temperature compensation method, based on a reference FBG sensor, which was proposed by Rao [144]. This method makes use of one FBG sensor bonded directly to the surface of the cell to measure both thermal and strain effects and a second FBG sensor that is loosely attached to measure only thermal influences. The measurement from the second sensor is subtracted from the first to isolate for strain. The cell was then clamped between two pressure plates with foam on either side to allow the cell to undergo reversible expansion during charge and discharge. A correlation was established between the derivative of the SoC and the shift of wavelengths with respect to the measured voltage during cycling under normal conditions. The authors concluded that the shift in wavelengths, which define the strain on the surface of the cell due to cell expansion, can indicate the different intercalation stages for charging and discharging. In a second publication [145], they monitored the relaxation behavior of the same cell with the same sensor configuration but without the pressure plate. They demonstrated that it is possible to measure the ion diffusion of lithium ions intercalating into the graphite host lattice. For higher temperature values at a higher SoCs, the wavelength shift is less than at lower temperatures. In these experiments, the wavelength shift began to differ for SoC levels of approximately 65%. They concluded that the ion diffusion in the host lattice is a thermodynamic process, and the higher temperature helps to overcome the van der Waals gap between two adjacent graphite layers. After a longer period of rest, the ions were distributed homogeneously in the lattice, and consequently, the wavelength shift decreased.
Meyer et al. [146] also observed the strain behavior and consequently the volume change of a battery cell with two FBG sensors.This study has a larger focus on the aging behaviour of the cells. Similar to Sommer et al., one sensor was used to measure strain, while the other was used for temperature compensation. Unlike the Summer et al. study, the second sensor was mounted in a rigid, heat-conductive tube on the cell’s surface to isolate for thermal influences. Measurements were made on a 40 Ah NMC/G battery cell, and cycling was performed under normal and accelerated aging conditions. To accelerate the aging of the cell, tests were performed under increased temperature conditions. The normal condition tests were not heat-compensated and showed the superposition of both the external strain and thermal influences. In the accelerated aging tests, the thermal influences were compensated, and a correlation between the relative capacity loss and increases in the strain difference was observed over 400 cycles.
Whereas the previously mentioned studies installed the FBG sensors externally, Raghavan et al. [147] investigated a solution to embed FBG sensors inside a pouch cell. The sensors were placed in the middle of the cell area in the middle of the electrode stack. To measure strain and temperature, one sensor was located in a thermally conductive housing tube, and one was attached directly on the separator. The number of cycles to reach the end-of-life for the cell with embedded FBG sensors was approximately 200 cycles less than for an equivalent cell without the embedded sensors. Regardless, the cell reached a cycle life of more than 1100 cycles. They concluded that estimations of SoC and SoH made with information from the embedded sensors are more accurate than predictions made without.
Bae et al. [148] extended the strain monitoring of battery cells by embedding the FBG sensor directly into the graphite structure of the negative electrode. They compared this solution with a configuration where the sensor was attached between the graphite and separator layer on the negative electrode, as was done in the Raghavan et al. study. Electrochemical performance tests confirmed that there is no significant influence of the implanted sensor on the performance of the electrode. Figure 11 compares the wavelength shift for a charging cycle for both the attached sensor (left) and the implanted sensor (right). The shift occurred with an increasing SoC toward longer wavelengths. In the implanted approach, the shift was observed in addition to a split in the observed wavelengths. This is explained as the superposition of two different applied stresses on the sensor. The attached sensor is only influenced by the longitudinal stress in the direction of the fiber. The transversal stress is relieved by the flexible separator foil. In contrast, the implanted sensor is influenced by the longitudinal stress, as well as by the transverse stress due to its location in the more rigid structure of the graphite. Since the sensor diameter is on the same order of magnitude as the thickness of the negative electrode, the authors suggest that the results are qualitative.
Nascimento et al. [149] extended the FBG sensor with a Fabry–Pérot (FP) cavity sensor. Fabry–Pérot (FP) cavity sensors are typically used for strain or pressure measurements. This sensor is robust against temperature shifts. It is designed with two parallel reflecting surfaces, and the phase of the reflective wavelength is measured. Any shift in the phase can give insights into the applied longitudinal strain or pressure. If the FBG sensor is located near the fabry-perot (FP) sensor, it is possible to measure temperature and strain with a single hybrid sensor. To test this sensor, the authors placed three sensors close to the tabs of the cell, in the center of the cell, and on opposing sides of the tabs. The sensors were located between two separator layers inside the cell. It was then possible to measure internal strain and temperature. Single FBG sensors were placed on the surface of the cell in same location as the hybrid sensors to compare the temperature results. The hybrid sensors showed a slightly higher temperature increase than a single sensor mounted on the surface. The authors concluded that with this hybrid sensor, it is possible to monitor the internal temperature and strain in battery cells. This is a significant benefit compared to the sensors used in the previously mentioned studies.
Most of these solutions focus on extended safety measurements for battery management systems (BMSs) in automotive applications [143,145,146,147,150,151,152,153]. The objective of these measurements is to improve the SoC and SoH estimations, thereby increasing safety in dynamic use applications, like EVs. Future efforts will involve leveraging the machine learning (ML) and artificial intelligence (AI) to gain better insights from FBG sensor measurements into the estimation of critical conditions [154].
FBG sensors are capable of measuring both temperature and strain with a single fiber optic cable. The sensor offers the advantage of easy multiplexing by inserting several measuring points within a single fiber optic cable. This allows for different points to be measured in a temperature-compensated manner. It is possible to install the sensor on the cell surface rather than on the electrode itself, thereby enabling local strain measurements. The disadvantage of this type of sensor is the special equipment for imprinting the grating into the fiber optic cable, as well as the light source and evaluation unit. In addition, the sensor needs to be fixed to the cell.
Table 1. Summary of the advantages and disadvantages of various contact measurement techniques. The associated references that are covered in this review are also included.
AdvantagesDisadvantagesRefs
Dilatometer
  • Low cost
  • In situ measurement
  • Fast measurement acquisition
  • Nondestructive method
  • 1D measurement
  • Global overview for whole cell on macro scale
[99,107]
Buoyancy
  • Assess internal gas formation
  • 3D measurement
  • High resolution measurements possible
  • Global Overview on volume expansion
  • Use of an electrically nonconductive fluid
[118,123,155]
Strain Gauge
  • Fast measurement acquisition
  • Low cost
  • Easy to implement
  • Requires adhesive fixation on cell surface
[156]
Optical Fiber Sensor
  • Easy to multiplex several sensors in one wire
  • Fast measurement acquisition
  • Requires adhesive fixation
  • Requires second sensor with different fixation to exclude temperature influences
[154,157]

3.2. Noncontact Approaches

In many use cases, it is preferable to make use of a noncontact approach to measure volume expansion on battery cells. Noncontact approaches have the advantage of not influencing the expansion of the cell by inducing local pressure spots, where local degradation might be induced and error in the measurements introduced. In addition, noncontact sensors experience effectively no wear due to the lack of contact. These approaches can be mainly divided into radiological and optical measurement techniques. A summary of the advantages and disadvantages of the noncontact approaches covered in this review is given in Table 2.

3.2.1. Radiological Imaging

Radiological measurements can make use of either X-ray or neutron beams. By using radiological techniques, the inner components of the battery cells can be visualized at a microscopic level without causing damage. Radiological imaging can be performed ex situ, where the part to be imaged is extracted from the battery, or in situ, where the imaging is performed on the entire cell, as well as in operando, where the imaging is performed during cycling [158].

X-ray Imaging

X-ray imaging is widely used to characterize lithium-ion battery components. The investigation can vary from individual electrodes to defects in the cell casings. The X-ray beam is generated by either electrons accelerated in an X-ray tube or by a synchrotron particle accelerator. Synchrotrons are capable of providing much greater acceleration than an X-ray tube, thereby resulting in orders of magnitude of greater brilliance in the resulting beam [159]. The higher brilliance beam enables greater material penetration, the imaging of smaller features, and much faster imaging than is possible with beams generated by an X-ray tube [160]. Naturally, these advantages come at an extremely high cost, thus requiring a dedicated facility, rather than a lab-compatible X-ray tube apparatus [160,161].
In situ or in operando measurements are generally more desirable, as neither require the disassembly of the cell. However, the measurement quality of the interior of the cell is often poor due to the attenuation of the X-ray radiation by the metallic battery casing [162]. To reduce X-ray attenuation, some researchers design special battery casings [163,164,165]. These solutions introduce an X-ray penetrable window, which is often made of materials like kapton or thin metal films, to minimize attenuation from the case in the resulting X-ray image. The cell casing ultimately exists to ensure good mechanical and electrical contact between the battery components, such as electrodes and electrolytes, and to keep the cell free from oxygen and moisture. By introducing a special window, it is possible that the permeability increases for long-term cycling or that the mechanical properties will be compromised. As a result, the expansion behavior and cell performance might be affected, thus meaning that the results may not be entirely similar to those from conventional commercial cells. Even with the special casings, it is often necessary to use synchrotron-generated beams to achieve the required contrast in imaging [163,165].
Bond et al. [14] made use of synchrotron radiation to evaluate geometry changes in situ in the electrodes after overdischarging a pouch cell to induce gas formation. A 200 m Ah LCO/G pouch cell was imaged first at 50% SoC and then was discharged to 500   m V , with initial swelling becoming apparent as the cell reached a potential of 0 V . After holding the cell in overdischarge, computed tomography (CT) imaging was performed using a synchrotron beam line with an energy range of 30 k e V to 40 k e V . Given an X-ray beam size of 2 m m , Bond et al. performed multiple measurements and then stitched the resulting images together, thus resulting in a total imaging time of about 30 min . This study revealed greater separation between electrodes in the center of the battery cell. A total 6.3% expansion was observed in the axis perpendicular to the flat sections of the jelly roll, with electrode layers closer to the outside contributing the most to the cell expansion. Even with high-energy X-rays from a synchrotron, the graphite electrode is difficult to differentiate from other components, because it is a light element. The cathode can be visualized, as it is composed of relatively heavier elements [14].
Pietsch et al. [158] demonstrated in operando simultaneous X-ray diffraction and X-ray tomographic microscopy on an experimental lithium-ion half cell using a synchrotron beam. The half cell was composed of a silicon powder electrode, a glass fiber separator, and a metallic lithium electrode, which were contained within a thermoplastic casing. Silicon was selected as the anode due to its high degree of volume expansion and academic relevance. Silicon electrodes have shown volumetric expansion during cycling of up to 280% of their initial volume [166,167]. Not only were Pietsch et al. able to demonstrate the volume change in both the anode and cathode during cycling, but they were also able to demonstrate the structural change in the silicon electrode. The transitions from pure silicon to a lithium–silicon alloy in the silicon anode during lithiation can be observed through X-ray diffraction [168]. This experiment required a 42 k e V beam. A tomographic scan requires 20 min , and X-ray diffraction requires 1 min . For each image type, 48 scans were taken.
In cases where X-ray imaging is used to characterize changes in the casing of battery cells, lower intensity X-rays can be applied [169]. Wang et. al performed in situ imaging using an X-ray tube-based system. The X-ray beam intensity was not sufficient to penetrate through the whole battery cell; therefore, only distortions in the pouch cell casing were detected. When X-rays with low intensity were used to image the casing, the images obtained were similar to those that can be taken with a standard optical camera.
Due to the attenuation of X-rays through the metallic casing and separator foils, it may be preferable to take an ex situ approach to obtain high contrast electrode images [170,171]. The disadvantage of using an ex situ approach is that the cell must be disassembled. The disassembly of the cell must be done in an environment with low moisture content, like a glove box, to prevent uncontrolled chemical reactions on the electrode.
Finegan et al. [170] performed both in operando CT measurements using a synchrotron X-ray source during overcharge abuse testing of a LCO pouch cell, and afterwards they performed ex situ X-ray CT measurements as a part of postmortem analysis. The authors were able to observe from the ex situ measurements evidence of cobalt deposition on the cathode. However, the majority of the cell expansion could be attributed to gas formation, as observed in the in operando measurements.
X-ray imaging has proven to be an invaluable tool for characterizing the inside of lithium-ion cells without requiring disassembly to inspect individual components. When high-resolution images are required, even with a high energy synchrotron beam, long acquisition times are required. This points to the technique being more suitable for measurements that are to be made in situ rather than in operando. Unfortunately, the synchrotron beam time is typically prohibitively expensive and requires a visit to one of only a handful of dedicated facilities that have the capability of producing sufficiently high energy beams.

Neutron Imaging

In contrast to X-ray, neutron imaging offers good transmission through heavy elements and lower transmission through light elements. This means that neutron imaging has a better ability to “see” through the metallic battery casing [172]. Siegal et al. applied neutron imaging to detect changes in the anode and cathode layers during charge and discharge cycles. In addition to yielding information about the deformation of the electrodes, Siegal et al. was also able to observe the in operando movements of lithium ions during cycling. Unlike X-rays, which are blocked by heavier elements, neutron beams have low transmission through lighter elements, such as lithium. When high concentrations of lithium ions are present, lower neutron counts are detected. This is particularly useful for identifying the location of lithium ions at various states of charge [173]. For example, when the battery cell is in a charged state, due to the intercalation of lithium ions, there will be fewer neutrons detected at the anode [20]. Though neutron imaging is advantageous for in situ imaging, it requires fission reactions from a nuclear reactor. This makes the imaging technique expensive and generally inaccessible in nearly all commercial and many academic environments [174]. For this reason, neutron imaging has not been widely adopted for the measurement of expansion of lithium-ion cells.

3.2.2. Optical Imaging

Optical approaches offer the advantage of being more easily deployable than radiological techniques. Optical approaches are generally limited to measuring changes at external surfaces. In the literature, researchers have typically made use of one of three imaging technologies: laser triangulation, interferometry, or camera-based 3D imaging techniques.

Laser Triangulation

Laser triangulation has been used to create 1D and 3D profiles of the expansion of lithium-ion cells during cycling [4,175]. Due to the small imaging spot, a high spatial resolution is achievable. In addition, modern laser triangulation sensors offer positional measurements with high accuracy. However, like most measurement techniques, there is a tradeoff between field-of-view and resolution. In the case of 1D imaging, high sampling rates are possible, as the only limitation in acquisition speed is the exposure time of the camera. Laser triangulation makes use of a relatively simple measurement principle, where only a source laser, a lens, and a line detector, as shown in Figure 12, are required [176,177].
In an ideal system, the position c d , measured on the line detector, will solely be a nonlinear function of the distance d, given by the following equation:
d = f cos α 1 + a 2 + a tan α f cos α 2 c d a tan α l
where f is the focal length of the lens, α is the angle between the z axis and the centerline of the lens, a is the vertical distance between the incident beam propagation axis and the center of the lens, and l is the horizontal distance between the laser and the center of the lens, as demonstrated in Figure 12 [178].
Laser triangulation sensors require a non-negligible footprint due to the offset between the lens and the laser source. This offset is ultimately determined by the desired measurement range. Though it is possible to use Equation (7) to map c d to d, calibration procedures are typically used instead to handle the influence of optical aberrations and mechanical tolerances [179]. Even micron-scale mechanical instabilities and thermal gradients can lead to shifts in the measurement beyond the scope of the calibrations [176]. To a certain extent, these issues can be handled using compensation techniques; however, vibrations and temperature gradients should be avoided whenever possible [178].
Clerici et al. [4] used laser triangulation to make 1D measurements of the thickness change of a battery cell to validate an electrochemical–mechanical multiscale model. The battery cells used in this study had an LFP cathode and a graphite anode contained in a 70 m m by 27 m m by 180 m m prismatic case. The cell had a nominal capacity of 25 Ah . One-dimensional laser triangulation sensors were placed on either side of the 70 m m by 180 m m surface. The sensor used in this study has a measurement accuracy of 8 μm and an acquisition speed of 20 μs. At a discharge rate of 2 C, the authors observed contractions of up to 0.25   m m . During charge, a maximum increase in thickness of 0.25   m m was observed when performed at 1 C. The authors observed similar maximum expansion and contraction values, even by varying charge rates from 0.1 C to 1 C, and discharge rates between 0.1 C and 2 C.
For 3D measurements, it is often necessary to scan the imaging spot over the part being imaged. This makes the acquisition time for 3D images significantly longer than for 1D images, as the part needs to be physically moved relative to the imaging spot. One approach to make 3D imaging faster is to make use of a line camera, as demonstrated by Rieger et al., who demonstrated a 3D imaging approach where laser profile sensors are placed on either side of a pouch cell [175]. The profile sensors used are capable of simultaneously measuring distances over an 85 m m line projected onto the surface of the battery cell with an accuracy of 8 μm. A linear stage was then used to scan the pouch cell, thereby yielding a 3D image of both sides of the pouch cell. Charging was performed using a CC-CV scheme at 1 C at ambient temperatures of 17 °C, 25 °C, and 40 °C. In the tests at 17 °C and 25 °C, a local maximum in expansion was observed when the voltage of the cell reached 4.2   V , and charging transitioned to a constant voltage mode. This local maximum was attributed to limited lithium diffusion at a higher SoC. This effect was most significant in locations close to the tabs. After the transition to constant voltage charging, the cell contracted slightly, which the authors attribute to charge homogenization in the electrode. At all temperatures, the final average expansion at the end of charging was about 150 μm. The cells used in this study had an LCO cathode and a graphite anode with a capacity of 2.28   Ah , as well as a cell thickness of 6.4   m m . Rieger’s use of a line camera facilitated in operando 3D imaging; however, the line implementation of laser triangulation systems are more complex, and therefore more costly than their spot implementation counterparts.
Laser triangulation has been demonstrated to be an effective method for measuring the volume expansion of lithium-ion cells. Rapid measurement acquisition is possible in 1D and 2D measuring applications, and the measurement can be extended to three dimensions by moving the part being scanned. The measurement apparatus can typically be executed relatively inexpensively due to the simplicity of the measurement principle. The measurement apparatus can be configured to have an appropriate field of view and resolution for the application. However, the sensor can have a large footprint that is fixed based on the required measurement geometry. This may pose an issue when attempting to make measurements in confined spaces.

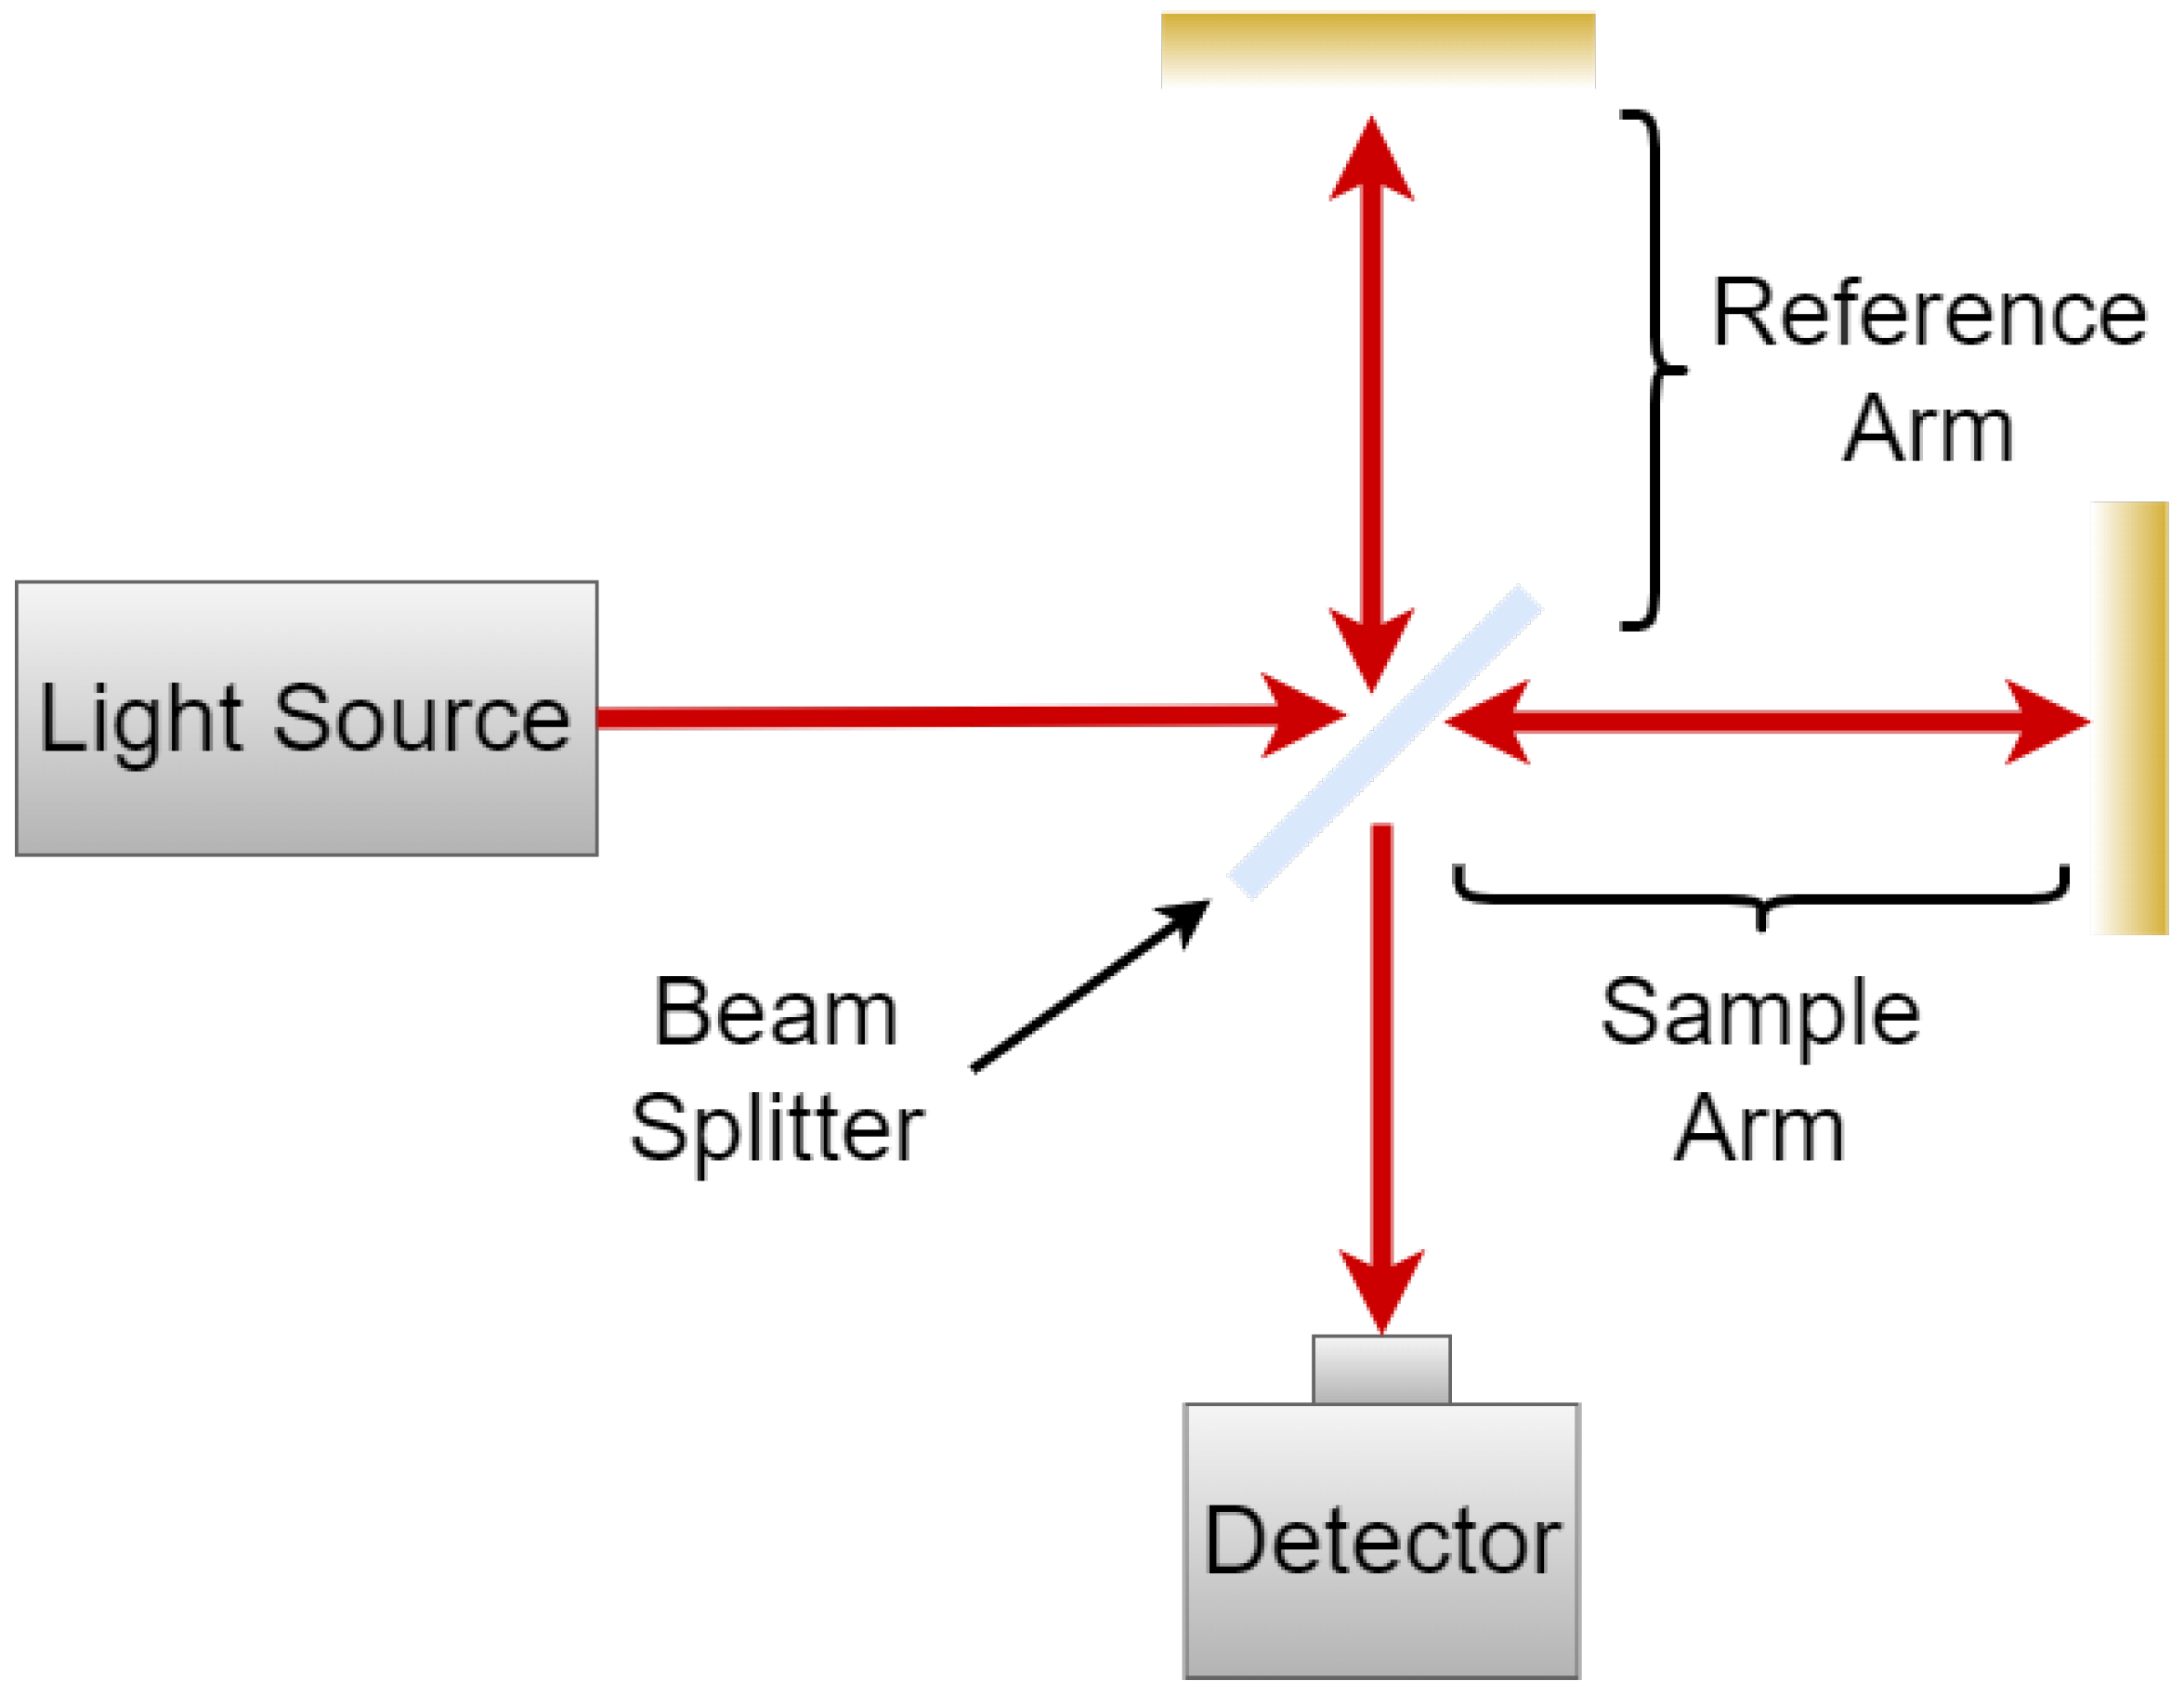
Interferometric Measurements

In contrast to laser triangulation, which makes use of geometry to determine the location of an object, one could also exploit the interferometric nature of light to measure the position of a surface. Bohn et al. demonstrated a white light interferometry approach for measuring both small 2 Ah and larger 56 Ah cells [180,181]. White light interferometry is a coherent imaging technique, which requires a reference arm and a sample arm. In the simplest case, the light is split using a Michelson interferometer, as demonstrated in Figure 13. When the optical path length difference between the reference arm and sample arm is less than the coherence length of the light source, an interference spectra will be observed at the detector. By observing shifts in the interference, one can determine the change in optical path length in the sample arm, and therefore the position of the object being measured. Even without additional fitting or averaging, the resolution can be in the range of single nanometers [182,183].
Bohn et al. [181] made use of a light-emitting diode (LED) source with a coherence length of 12 μm, meaning that the measurement range was limited to the coherence length of the light source. A scanning component with a high resolution encoder was added to the sample arm to allow for measurements beyond the coherence length. Since the measurement was made by attaching a mirror to a free-moving metal block applying pressure to the cell, all measurements were taken on a single point. Expansion measurements of the battery cell were captured both from 0% to 100% SoC but also over short 6 s pulses. The maximum cell expansion at full charge was approximately 200 μm, which slowly increased over 100 min . As such, the axial resolution was likely higher than required for this application. The high resolution of interferometric imaging was more useful for the measurements taken over 6 s , where expansions of only 0.2 μm were registered. This small expansion would not be quantifiable without a high-resolution imaging system.
Yang et al. [185] made use of a different interferometric approach that has the capability of measuring multiple points on the surface instantaneously. Similar to white light interferometry, electronic speckle pattern interferometry (ESPI) makes use of an interferometer with a reference arm and a sample arm. ESPI uses a diverging (typically monochromatic) beam to illuminate the sample surface [186]. When the diverging beams from the reference and sample arm are recombined, the result is a fringe pattern on the detector camera. The intensity at each pixel as a function of time is given by
I ( t ) = I 0 ( t ) + I 0 ( t ) V cos ( ϕ ( t ) ) = I 0 ( t ) 1 + V cos ϕ 0 + 4 π z ( t ) λ
where I 0 ( t ) is the speckle pattern intensity bias, V is the visibility of the surface being imaged, ϕ is the phase in the speckle pattern, ϕ 0 is the random phase, and z ( t ) is the plane deformation of the surface being imaged [186]. Ultimately, z ( t ) is the variable of interest; however, V, ϕ 0 , and I 0 ( t ) are often not precisely known at each pixel. To resolve this, a phase-shifting approach can be used to improve measurement sensitivity. The four-step phase shifting algorithm is implemented by taking four fringe patterns, with each taken with a phase shift separated by π / 2 . The phase shift is typically implemented by using a piezoelectric stage to induce movements on the scale of a quarter of the wavelength of the light source for each subsequent image. This approach is only valid when the movement in the surface being interrogated is static in the time scale of the frame rate of the camera. When implemented, this yields four intensities for each pixel: I ( t , 0 ) , I ( t , π / 2 ) , I ( t , π ) , and I ( t , 3 π / 2 ) . We can combine the intensities to give
ϕ ( t ) = arctan I ( t , 3 π / 2 ) I ( t , π / 2 ) I ( t , 0 ) I ( t , π ) .
Filtering approaches can be applied to Equation (9), followed by phase unwrapping, to extract the phase at a specific pixel. By determining the difference of ϕ ( t 1 ) and ϕ ( t 0 ) , unwrapped phases at the same pixel taken at different times, one can then determine the displacement as long as one knows the wavelength of light being used for imaging.
Yang et al. [185] made use of an apparatus that is capable of measuring both sides of a pouch cell through the use of additional mirrors during imaging. Since battery expansion is relatively static on the scale of micrometers and the time scale of seconds, the authors were able to make use of the four-step phase-shifting approach, thereby leading to higher sensitivity. The authors were ultimately able to generate 3D images of both sides of cells with a sensitivity of under 10 μm.
In this section, we consider two different interferometric approaches to measuring the surface displacement of a lithium-ion cell. The first technique makes use of a scanning white light interferometry approach, which is capable of measurements accurate to single nanometers. This measurement technique has the best resolution of any of the measurement approaches detailed in this review. This comes with the drawback of a small imaging range, without the addition of additional mechanical stages and postprocessing. Additional scanning optics or stages would be required to produce 3D images. In contrast, ESPI allows for the simultaneous measurement of the entire cell to generate 3D images. ESPI measurements typically have much lower resolution and a larger field of view than those possible with white light interferometry. Interferometric approaches are typically costly due to specialized light sources, cameras, and the mechanical precision and stability required to maintain interference. Finally, the interferometric approaches detailed in this review both require significant postprocessing of the sensor data to extract displacement measurements.

Structured Light

Another approach for achieving 3D imaging of the expansion of battery cells has been demonstrated by Rieger et al. through the use of structured light cameras [94]. Structured light cameras work by projecting a geometry on an object and then imaging this geometry. Any distortions in the geometry can be mapped as deviations from a flat plane. How these deviations are mapped to deformation depends on the selected geometry [187,188]. The selection of the geometry is application-specific and determines the complexity of calculating the distortion, accuracy, and the resolution of the resulting measurement. Geometries can be as simple as monochromatic stripes or as complex as pseudorandom binary arrays [189]. The choice of geometry will determine whether measurements can be made using a multiple-shot, or a single-shot imaging scheme. Multiple-shot imaging is suitable for systems that are static in the time scale of the frame rate, whereas single-shot approaches are necessary when considering measurements in dynamic systems [189,190,191].
Rieger et al. [94] made use of a structured light camera that projects multiple fringe projection geometries and therefore requires multiple-shot imaging. Given the charge time of just over 90 min , and an acquisition time of 3 s , the cell expansion could be assumed to be effectively static during the acquisition. The measurements had a resolution in the direction perpendicular to the battery surface of 2 μm and a distance of 60 μm between measurements in the plane of battery surface. By using 3D imaging, the authors were able to identify that at a lower SoC, the expansion of the battery cell tended to have a more spatially homogeneous distribution, whereas at a higher SoC, the expansion showed variation across the surface. The obtained spatial resolution of the measurements was high, with 800,000 data points taken over the 60 m m × 50 m m surface.
Structured light imaging offers the capability of taking simultaneous 3D displacement measurements across the surface of a battery cell. Structured light cameras can be configured to have sufficient resolution to characterize cell expansion. The main drawback with structured light cameras are the computational expense of converting the images to 3D displacement measurements. In addition, structured light cameras typically have a large footprint due to the requirements of the projector/camera combination. The cost of an apparatus for structured light imaging is dependent on the resolution of the projector and camera, as well as the imaging rate of the camera. These factors determine the measurement resolution and the measuring rate, respectively.

Digital Image Correlation

Digital image correlation (DIC) is an imaging technique that has also been used to generate 3D profiles of lithium-ion battery cells during cycling. Instead of projecting a geometry on the surface to be investigated, digital image correlation (DIC) makes use of existing or applied texture on the surface to calculate displacement. The texture is typically created by coating the surface to be imaged in a speckled paint pattern. In DIC, measurements are typically all with reference to an initial reference measurement. By using at least two cameras, the displacement of the texture pattern in the vertical and horizontal directions can be computationally inferred. To extract the displacement of the surface, spatial crosscorrelation calculations are required to match the real features on the surface in the images obtained from both cameras [192]. Temporal correlations can then be used to track features across frames taken by an individual camera. After crosscorrelation, stereotriangulation can be used to track the 3D position of points in each feature as a function of time [193,194]. Both crosscorrelation and stereotriangulation across the entire imaging field are computationally expensive procedures, though a number of researchers are attempting to improve the performance [195,196,197,198]. As battery expansion is a relatively slow-moving process, DIC is still used by researchers to make measurements in this field.
Both Luo et al. [199] and Leung et al. [200], have demonstrated DIC for characterizing displacement and strain in lithium-ion batteries during cycling. Luo et al. took displacement and strain measurements over 55 cycles on a 54.5 mm by 56.5 mm LCO pouch cell. The measurements were taken at 1 Hz , though the measurement apparatus is capable of measurements up to 15 Hz . Leung et al. measured a maximum expansion of 197 μm at the end of charging during the 55th cycle. Similar work was demonstrated by Leung et al., however, over fewer cycles and using a NMC pouch cell. The maximum displacement measured by Leung et al. was 200 μm.
Digital image correlation offers a good solution for generating 3D images of lithium-ion cells during cycling. The biggest advantage of this measuring technique is that it is highly configurable depending on the distortion one wants to measure. Like structured light imaging, DIC is computationally expensive to go from a pair of images to displacement as a function of the position. The other disadvantage is that the surface must either already be textured or have a texture applied. As most lithium-ion battery casing are not sufficiently textured, this means applying either a patterned film or paint to enable DIC measurement. This may not be possible in industrial environments.
Table 2. Summary of the advantages and disadvantages of various noncontact measurement techniques. The associated references that are covered in this review are also included.
AdvantagesDisadvantagesRefs
X-ray
  • Assesses internal structure nondestructively
  • Assesses structural changes in electrodes
  • Radiation safety concerns
  • High cost
  • Slow image acquisition
[14,158,159,160,161,162,163,164,165,169,170,171]
Neutron
  • Assesses internal structure nondestructively
  • Assesses structural changes in electrodes
  • Visualizes lithium transport during cycling
  • Radiation safety concerns
  • Prohibitively high cost
  • Slow image acquisition
[20]
Laser Triangulation
  • Easy to implement
  • Configurable measurement range and resolution
  • Relatively low cost
  • Fast measurement acquisition
  • Challenging to reduce footprint
  • 3D measurement requires scanning
[4,175]
White Light Interferometry
  • Very high resolution measurements possible
  • Fast measurement acquisition
  • Precision motion control required to extend measurement range
  • 3D measurement requires scanning
[180,181,185]
*ESPI
  • Fast measurement acquisition
  • Simultaneous 3D measurement
  • Computationally expensive
  • Resolution limited by camera resolution
[185]
Structured Light
  • Simultaneous 3D measurement
  • Configurable measurement range and resolution
  • Computationally expensive
  • Challenging to reduce sensor footprint
[94]
Digital Image Correlation
  • Simultaneous 3D measurement
  • Configurable measurement range and resolution
  • Requires texturing of surface
  • Computationally expensive
  • Challenging to reduce sensor footprint
[199,200]

4. Comparison of Techniques

As outlined in Section 3, there are a number of measurement approaches for characterizing the expansion of lithium-ion battery cells. There are a variety of factors that must be considered when selecting a measurement technique for a specific application. These factors could include the required information from the measurement, the effect of the measurement on the battery cell expansion, ease of use, the footprint of the measurement device, required measurement range and resolution, and cost, among others.
As demonstrated in this review, the data collected to assess battery cell expansion can vary depending on what researchers are hoping to glean from the measurements. The goal of the measurement is an important consideration when selecting a suitable measurement technique. When simultaneous three-dimensional measurements of the cell casing with high spatial resolution are desired, image based techniques, such as digital image correlation and structured light or an electronic speckle pattern approach, are likely the most suitable techniques. When simultaneous measurement is not required, techniques such as laser triangulation or white light interferometry may be suitable. By implementing multiple sensors, dilatometry and strain-based measurements can also produce simultaneous three-dimensional images, albeit with less spatial resolution. When the goal of the measurement is to observe expansion in individual components within the cell, one must use a radiological technique. If fast measurements are required, such that in operando measurements are possible, this will limit the selection to X-ray synchrotron or neutron beam sources.
Contact measurements, by their nature, require contact between the sensor and battery cell, which can influence the expansion behavior. In the case of 1D dilatometry measurements, displacement sensors are either in contact with the cell or electrode materials directly or in contact with a surface, such as a pressure plate that is in contact with the cell [59,64,95]. Though this type of sensor is typically designed to minimize the applied force by the probe, additional forces, however small, will be introduced into the system. Measurements made using both electrical and optical fiber strain gauges require the use of an adhesive on the surface of the material being measured. Though effects are likely small, the adhesive layer on the surface could affect the measurement. Optical fiber strain sensors are often embedded in the cell, either on the surface of, or within the electrode. Placing the optical fiber in the cell causes the cell to perform differently than a cell without an embedded sensor [147,148]. This means that findings from these studies may not be transferable to standard cells without an embedded strain sensor. When considering buoyancy measurements, the expansion behavior could be influenced due to the battery cell being submerged in oil. In contrast, noncontact measurements, such as those shown in the bottom tree in Figure 14, are at no risk of influencing the expansion measurement by introducing additional mechanical forces into the system. The greatest concern when considering the influences of noncontact measurements is introducing heat into the battery cell through the absorption and scattering of electromagnetic radiation or particles. In the case of radiological measurements that make use of X-rays, interactions between the beam and absorptive materials, such as the current collector, could cause heat input into the system [201]. In the case of neutron imaging, inelastic scattering or absorption of the particle beam could have thermal influences. Optical imaging techniques can also heat the sample through the absorption of electromagnetic radiation. Thermal effects are minimized by limiting the energy that is transferred into the cell. For X-ray and neutron imaging, this is generally achieved by limiting exposure time. In optical measurements, low intensity light is used to minimize thermal effects.
The ease of use for a particular measurement technique can consider both the simplicity of installing the sensor for measurement, as well as how easily the relevant information can be extracted from the sensor data. Dilatometry and laser triangulation measurements are easy to implement, and the sensor data can be directly mapped to displacement with minimal computational post processing. Techniques like strain, buoyancy, and digital image correlation measurement all have the disadvantage of contaminating the surface of the battery cell. In the case of strain measurements, the surface is contaminated with an adhesive, with oil in the case of buoyancy measurements, and with paint in the case of digital image correlation. In addition, sensor outputs from these three techniques require additional information and calculation to extract battery expansion [118,129,131,134]. Both of the interferometric techniques outlined in this review are relatively complex to implement and require significant postprocessing to extract the relevant information [180,181,186]. Structured light imaging is relatively easy to implement; however, the computation of deformation from the resulting images is complex and computationally expensive [193]. Radiological techniques are difficult to implement due to the shielding requirements to protect users from the resulting radiation. Generating the beams required for radiological approaches can also be challenging [201,202]. Finally, in the case of CT imaging, the computations required to construct a measurements are intensive.
Particularly when considering the simultaneous measurement of multiple cells or measurement in confined spaces (such as in a temperature chamber), the footprint of the measurement device must be considered. Contact approaches such as dilatometry or strain gauge measurements can be achieved using a small measurement device placed directly on the part being measured. In contrast, methods such as laser triangulation and image-based approaches require a specified offset from the battery cell, which must be accounted for when designing test environments for taking measurements. Radiological methods of measurement often have a large footprint due to the required shielding [201,202]. In addition, neutron sources and synchrotron sources for X-rays require entire separate facilities to supply the measurement beam [174,203].
Battery cells are diverse in their compositions, their size, and their internal structure. All of these characteristics will inform how much the cell is going to expand during both normal and abnormal operating conditions, as outlined in this review. In addition, some make measurements that are taken over an entire charge and discharge cycle, whereas others only investigate expansion over short time scales. When selecting the correct measuring approach, it is important to consider the maximum expansion one will need to measure and to assess the required resolution of the measurement. Most of the measurement technologies presented in this review can be configured to have sufficient resolution and range for the measurement of expansion in battery cell casings. When one wants to measure very small deformations, such as those taken over short time scales, the options for measurement techniques are more limited.
Cost is a major consideration when selecting a measurement technique. Contact approaches tend to be less expensive than noncontact approaches. Measurement using X-ray synchrotron or neutron beam sources are prohibitively expensive for most applications, and use is typically confined to measurements made in an academic context. For the other techniques detailed in this review, the cost is highly dependent on the specification of the measurement system. Unfortunately, cost cannot be a major metric of evaluation in this review, due to the lack of information that is publicly available.
A tree diagram is included in Figure 14 demonstrates the different measurement options available, categorized by type. A summary of the benefits of each measurement option is given in Table 3.
As demonstrated by the large body of academic literature presented in this review, dilatometry measurement approaches are the most prevalent. This is likely due to their ease of use, comparatively low cost, and configurable resolution and field of view.
Table 3. Overview table summarizing the benefits of selecting each measurement technology.
Measurement TechniqueInternal StructureNo Surface ContaminationAutomatic 3D Measurement3D Measurement by ScanningHigh Resolution (<1 μm)Small Footprint SensorLow Computational Requirement
Dilatometry
Buoyancy
Strain
X-ray
Neutron
Laser Triangulation
White Light Interferometry
ESPI
Structured Light
Digital Image Correlation

5. Conclusions

This review strives to give a complete overview of the different techniques and technologies that are used to characterize volume expansion in lithium-ion battery cells. Prior to discussion of the measurement techniques, the different expansion mechanisms were explored. Reversible expansion due to lithium intercalation into and out of the electrodes during charging and discharging was considered in a variety of both established and up-and-coming electrode materials. Thermal expansion in lithium-ion battery cells was also discussed as a reversible expansion mechanism. It is also important to consider irreversible expansion mechanisms, as the causes of irreversible expansion can have negative effects on the performance and safety of the cell. These expansion mechanisms include the formation of an SEI layer, lithium plating, and gas generation.
After establishing the causes of volume expansion in lithium-ion cells, methods for measuring expansion were considered. To better distinguish between different types of measurement, techniques were divided into contact and noncontact approaches. Contact approaches were further divided into dilatometry, strain gauge, and buoyancy-based measurements. Dilatometry was, by a large margin, the most common method for characterizing volume expansion in the literature evaluated for this review. Noncontact approaches were further divided into radiological and optical measurements. Radiological measurements were generally only used when internal structures of either the cell or cell components were desired. Optical approaches were utilized to make both 1D and 3D contactless measurements of the surface of the cell.
Finally, the different measurement techniques were compared and contrasted according to a variety of factors that could be important when selecting an approach for characterizing the expansion of lithium-ion cells. The factors evaluated include the required information from the measurement, the effect of the measurement on the battery cell expansion, ease of use, footprint of the measurement device, required measurement range and resolution, and cost.
The lithium-ion battery cell is being used in increasingly demanding use cases ranging from green energy storage to electric mobility. As a result, there is increasing interest in both developing new cell chemistries and the development of techniques for characterizing battery cells. The characterization of volume expansion in lithium-ion battery cells offers useful insights into the quality, safety, and performance capabilities. As such, it is likely that more measurement options will continue to be developed as we strive to better understand existing and next generation lithium-ion battery configurations.

Author Contributions

Conceptualization, M.V., M.S. and C.H.; investigation, T.K. and D.N.; writing—original draft preparation, T.K. and D.N.; writing—review and editing, T.K., D.N., L.P.B., M.V., M.S. and C.H.; visualization, T.K. and D.N.; supervision, C.H., M.V. and M.S.; project administration, L.P.B.; funding acquisition, L.P.B. and M.S.; final approval, M.V., M.S. and C.H. All authors have read and agreed to the published version of the manuscript.

Funding

This research was funded by the Federal Ministry for Economic Affairs and Climate Action under the project acronym QUAZE and number 16BZF361B.

Conflicts of Interest

Authors Tessa Krause and Marcel Schäferis were employed by the company Precitec GmbH & Co., KG. The remaining authors declare that the research was conducted in the absence of any commercial or financial relationships that could be construed as a potential conflict of interest.

References

  1. Geels, F.W. Disruption and low-carbon system transformation: Progress and new challenges in socio-technical transitions research and the Multi-Level Perspective. Energy Res. Soc. Sci. 2018, 37, 224–231. [Google Scholar] [CrossRef]
  2. Budde-Meiwes, H.; Drillkens, J.; Lunz, B.; Muennix, J.; Rothgang, S.; Kowal, J.; Sauer, D.U. A review of current automotive battery technology and future prospects. Proc. Inst. Mech. Eng. Part D J. Automob. Eng. 2013, 227, 761–776. [Google Scholar] [CrossRef]
  3. Liu, Y.; Zhang, R.; Wang, J.; Wang, Y. Current and future lithium-ion battery manufacturing. iScience 2021, 24, 102332. [Google Scholar] [CrossRef]
  4. Clerici, D.; Mocera, F.; Somà, A. Electrochemical-mechanical multi-scale model and validation with thickness change measurements in prismatic lithium-ion batteries. J. Power Sources 2022, 542, 231735. [Google Scholar] [CrossRef]
  5. Sahraei, E.; Hill, R.; Wierzbicki, T. Calibration and finite element simulation of pouch lithium-ion batteries for mechanical integrity. J. Power Sources 2012, 201, 307–321. [Google Scholar] [CrossRef]
  6. Lai, W.J.; Ali, M.Y.; Pan, J. Mechanical behavior of representative volume elements of lithium-ion battery cells under compressive loading conditions. J. Power Sources 2014, 245, 609–623. [Google Scholar] [CrossRef]
  7. Lander, L.; Tagnon, C.; Nguyen-Tien, V.; Kendrick, E.; Elliott, R.J.; Abbott, A.P.; Edge, J.S.; Offer, G.J. Breaking it down: A techno-economic assessment of the impact of battery pack design on disassembly costs. Appl. Energy 2023, 331, 120437. [Google Scholar] [CrossRef]
  8. Oh, K.Y.; Siegel, J.B.; Secondo, L.; Kim, S.U.; Samad, N.A.; Qin, J.; Anderson, D.; Garikipati, K.; Knobloch, A.; Epureanu, B.I.; et al. Rate dependence of swelling in lithium-ion cells. J. Power Sources 2014, 267, 197–202. [Google Scholar] [CrossRef]
  9. Gupta, P.; Gudmundson, P. Modeling of local electrode stresses and pressures in lithium-ion battery packs using three-dimensional homogenization. J. Power Sources 2023, 582, 233514. [Google Scholar] [CrossRef]
  10. Maiorino, A.; Cilenti, C.; Petruzziello, F.; Aprea, C. A review on thermal management of battery packs for electric vehicles. Appl. Therm. Eng. 2024, 238, 122035. [Google Scholar] [CrossRef]
  11. Sun, Y.; Lu, H.; Jin, Y. Experimental and Numerical Study on Mechanical Deformation Characteristics of Lithium Iron Phosphate Pouch Battery Modules under Overcharge Conditions. Energy Fuels 2021, 35, 15172–15184. [Google Scholar] [CrossRef]
  12. Stock, S.; Diller, F.; Böhm, J.; Hille, L.; Hagemeister, J.; Sommer, A.; Daub, R. Operando Analysis of the Gassing and Swelling Behavior of Lithium-ion Pouch Cells during Formation. J. Electrochem. Soc. 2023, 170, 060539. [Google Scholar] [CrossRef]
  13. Bitzer, B.; Gruhle, A. A new method for detecting lithium plating by measuring the cell thickness. J. Power Sources 2014, 262, 297–302. [Google Scholar] [CrossRef]
  14. Bond, T.; Zhou, J.; Cutler, J. Electrode Stack Geometry Changes during Gas Evolution in Pouch-Cell-Type Lithium Ion Batteries. J. Electrochem. Soc. 2017, 164, A6158–A6162. [Google Scholar] [CrossRef]
  15. Popp, H.; Koller, M.; Jahn, M.; Bergmann, A. Mechanical methods for state determination of Lithium-Ion secondary batteries: A review. J. Energy Storage 2020, 32, 101859. [Google Scholar] [CrossRef]
  16. Michael, H.; Jervis, R.; Brett, D.J.L.; Shearing, P.R. Developments in Dilatometry for Characterisation of Electrochemical Devices. Batter. Supercaps 2021, 4, 1378–1396. [Google Scholar] [CrossRef]
  17. Zou, B.; Zhang, L.; Xue, X.; Tan, R.; Jiang, P.; Ma, B.; Song, Z.; Hua, W. A Review on the Fault and Defect Diagnosis of Lithium-Ion Battery for Electric Vehicles. Energies 2023, 16, 5507. [Google Scholar] [CrossRef]
  18. Tran, M.K.; Fowler, M. A Review of Lithium-Ion Battery Fault Diagnostic Algorithms: Current Progress and Future Challenges. Algorithms 2020, 13, 62. [Google Scholar] [CrossRef]
  19. Ren, D.; Xie, L.; Wang, L.; He, X. A practical approach to predict volume deformation of lithium-ion batteries from crystal structure changes of electrode materials. Int. J. Energy Res. 2021, 45, 7732–7740. [Google Scholar] [CrossRef]
  20. Siegel, J.B.; Stefanopoulou, A.G.; Hagans, P.; Ding, Y.; Gorsich, D. Expansion of Lithium Ion Pouch Cell Batteries: Observations from Neutron Imaging. J. Electrochem. Soc. 2013, 160, A1031–A1038. [Google Scholar] [CrossRef]
  21. Heubner, C.; Schneider, M.; Michaelis, A. Detailed study of heat generation in porous LiCoO2 electrodes. J. Power Sources 2016, 307, 199–207. [Google Scholar] [CrossRef]
  22. Liu, X.M.; Arnold, C.B. Effects of Cycling Ranges on Stress and Capacity Fade in Lithium-Ion Pouch Cells. J. Electrochem. Soc. 2016, 163, A2501–A2507. [Google Scholar] [CrossRef]
  23. Sturm, J.; Spingler, F.B.; Rieger, B.; Rheinfeld, A.; Jossen, A. Non-Destructive Detection of Local Aging in Lithium-Ion Pouch Cells by Multi-Directional Laser Scanning. J. Electrochem. Soc. 2017, 164, A1342–A1351. [Google Scholar] [CrossRef]
  24. Bernhard, R.; Metzger, M.; Gasteiger, H.A. Gas Evolution at Graphite Anodes Depending on Electrolyte Water Content and SEI Quality Studied by On-Line Electrochemical Mass Spectrometry. J. Electrochem. Soc. 2015, 162, A1984–A1989. [Google Scholar] [CrossRef]
  25. Deich, T.; Storch, M.; Steiner, K.; Bund, A. Effects of module stiffness and initial compression on lithium-ion cell aging Deich 2021//Effects of module stiffness and initial compression on lithium-ion cell aging. J. Power Sources 2021, 506, 230163. [Google Scholar] [CrossRef]
  26. Deich, T.; Hahn, S.L.; Both, S.; Birke, K.P.; Bund, A. Validation of an actively-controlled pneumatic press to simulate automotive module stiffness for mechanically representative lithium-ion cell aging. J. Energy Storage 2020, 28, 101192. [Google Scholar] [CrossRef]
  27. Mukhopadhyay, A.; Sheldon, B.W. Deformation and stress in electrode materials for Li-ion batteries. Prog. Mater. Sci. 2014, 63, 58–116. [Google Scholar] [CrossRef]
  28. Nazari, P.; Bäuerle, R.; Zimmermann, J.; Melzer, C.; Schwab, C.; Smith, A.; Kowalsky, W.; Aghassi-Hagmann, J.; Hernandez-Sosa, G.; Lemmer, U. Piezoresistive Free-standing Microfiber Strain Sensor for High-resolution Battery Thickness Monitoring. Adv. Mater. 2023, 35, e2212189. [Google Scholar] [CrossRef] [PubMed]
  29. Pfrang, A.; Kersys, A.; Kriston, A.; Scurtu, R.G.; Marinaro, M.; Wohlfahrt-Mehrens, M. Deformation from Formation Until End of Life: Micro X-ray Computed Tomography of Silicon Alloy Containing 18,650 Li-Ion Cells. J. Electrochem. Soc. 2023, 170, 030548. [Google Scholar] [CrossRef]
  30. Piątek, J.; Afyon, S.; Budnyak, T.M.; Budnyk, S.; Sipponen, M.H.; Slabon, A. Sustainable Li-Ion Batteries: Chemistry and Recycling. Adv. Energy Mater. 2021, 11, 2003456. [Google Scholar] [CrossRef]
  31. Oh, K.Y.; Epureanu, B.I. A novel thermal swelling model for a rechargeable lithium-ion battery cell. J. Power Sources 2016, 303, 86–96. [Google Scholar] [CrossRef]
  32. Adenusi, H.; Chass, G.A.; Passerini, S.; Tian, K.V.; Chen, G. Lithium Batteries and the Solid Electrolyte Interphase (SEI)—Progress and Outlook. Adv. Energy Mater. 2023, 13, 2203307. [Google Scholar] [CrossRef]
  33. Placke, T.; Kloepsch, R.; Dühnen, S.; Winter, M. Lithium ion, lithium metal, and alternative rechargeable battery technologies: The odyssey for high energy density. J. Solid State Electrochem. 2017, 21, 1939–1964. [Google Scholar] [CrossRef]
  34. Das, D.; Manna, S.; Puravankara, S. Electrolytes, Additives and Binders for NMC Cathodes in Li-Ion Batteries—A Review. Batteries 2023, 9, 193. [Google Scholar] [CrossRef]
  35. Graae, K.V.; Li, X.; Sørensen, D.R.; Ayerbe, E.; Boyano, I.; Sheptyakov, D.; Jørgensen, M.R.V.; Norby, P. Time and space resolved operando synchrotron X-ray and Neutron diffraction study of NMC811/Si-Gr 5 Ah pouch cells. J. Power Sources 2023, 570, 232993. [Google Scholar] [CrossRef]
  36. Gantenbein, S.; Schönleber, M.; Weiss, M.; Ivers-Tiffée, E. Capacity Fade in Lithium-Ion Batteries and Cyclic Aging over Various State-of-Charge Ranges. Sustainability 2019, 11, 6697. [Google Scholar] [CrossRef]
  37. Sethuraman, V.A.; Hardwick, L.J.; Srinivasan, V.; Kostecki, R. Surface structural disordering in graphite upon lithium intercalation/deintercalation. J. Power Sources 2010, 195, 3655–3660. [Google Scholar] [CrossRef]
  38. Nitta, N.; Wu, F.; Lee, J.T.; Yushin, G. Li-ion battery materials: Present and future. Mater. Today 2015, 18, 252–264. [Google Scholar] [CrossRef]
  39. Birkenmaier, C.; Bitzer, B.; Harzheim, M.; Hintennach, A.; Schleid, T. Lithium Plating on Graphite Negative Electrodes: Innovative Qualitative and Quantitative Investigation Methods. J. Electrochem. Soc. 2015, 162, A2646–A2650. [Google Scholar] [CrossRef]
  40. Mercer, M.P.; Peng, C.; Soares, C.; Hoster, H.E.; Kramer, D. Voltage hysteresis during lithiation/delithiation of graphite associated with meta-stable carbon stackings. J. Mater. Chem. A 2021, 9, 492–504. [Google Scholar] [CrossRef]
  41. Clerici, D.; Mocera, F.; Somà, A. Experimental Characterization of Lithium-Ion Cell Strain Using Laser Sensors. Energies 2021, 14, 6281. [Google Scholar] [CrossRef]
  42. Asenbauer, J.; Eisenmann, T.; Kuenzel, M.; Kazzazi, A.; Chen, Z.; Bresser, D. The success story of graphite as a lithium-ion anode material—Fundamentals, remaining challenges, and recent developments including silicon (oxide) composites. Sustain. Energy Fuels 2020, 4, 5387–5416. [Google Scholar] [CrossRef]
  43. Ghosh, A.; Ghamouss, F. Role of Electrolytes in the Stability and Safety of Lithium Titanate-Based Batteries. Front. Mater. 2020, 7, 186. [Google Scholar] [CrossRef]
  44. He, Y.B.; Li, B.; Liu, M.; Zhang, C.; Lv, W.; Yang, C.; Li, J.; Du, H.; Zhang, B.; Yang, Q.H.; et al. Gassing in Li4Ti5O12-based batteries and its remedy. Sci. Rep. 2012, 2, 913. [Google Scholar] [CrossRef] [PubMed]
  45. Sauerteig, D.; Ivanov, S.; Reinshagen, H.; Bund, A. Reversible and irreversible dilation of lithium-ion battery electrodes investigated by in-situ dilatometry. J. Power Sources 2017, 342, 939–946. [Google Scholar] [CrossRef]
  46. Nemeth, T.; Schröer, P.; Kuipers, M.; Sauer, D.U. Lithium titanate oxide battery cells for high-power automotive applications—Electro-thermal properties, aging behavior and cost considerations. J. Energy Storage 2020, 31, 101656. [Google Scholar] [CrossRef]
  47. Song, T.; Jeon, Y.; Paik, U. Si nanotubes array sheathed with SiN/SiOxNy layer as an anode material for lithium ion batteries. J. Electroceramics 2014, 32, 66–71. [Google Scholar] [CrossRef]
  48. Zhang, X.; Weng, J.; Ye, C.; Liu, M.; Wang, C.; Wu, S.; Tong, Q.; Zhu, M.; Gao, F. Strategies for Controlling or Releasing the Influence Due to the Volume Expansion of Silicon inside Si-C Composite Anode for High-Performance Lithium-Ion Batteries. Materials 2022, 15, 4264. [Google Scholar] [CrossRef]
  49. Shen, T.; Yao, Z.; Xia, X.; Wang, X.; Gu, C.; Tu, J. Rationally Designed Silicon Nanostructures as Anode Material for Lithium-Ion Batteries. Adv. Eng. Mater. 2018, 20, 591. [Google Scholar] [CrossRef]
  50. Liu, X.; Zhu, X.; Pan, D. Solutions for the problems of silicon-carbon anode materials for lithium-ion batteries. R. Soc. Open Sci. 2018, 5, 172370. [Google Scholar] [CrossRef]
  51. Zuo, X.; Zhu, J.; Müller-Buschbaum, P.; Cheng, Y.J. Silicon based lithium-ion battery anodes: A chronicle perspective review. Nano Energy 2017, 31, 113–143. [Google Scholar] [CrossRef]
  52. Zhao, X.; Lehto, V.P. Challenges and prospects of nanosized silicon anodes in lithium-ion batteries. Nanotechnology 2021, 32, 042002. [Google Scholar] [CrossRef]
  53. Dou, F.; Weng, Y.; Wang, Q.; Chen, G.; Liu, H.; Shi, L.; Zhang, D. In situ imaging analysis of the inhibition effect of functional coating on the volume expansion of silicon anodes. Chem. Eng. J. 2021, 417, 128122. [Google Scholar] [CrossRef]
  54. Luo, W.; Chen, X.; Xia, Y.; Chen, M.; Wang, L.; Wang, Q.; Li, W.; Yang, J. Surface and Interface Engineering of Silicon–Based Anode Materials for Lithium–Ion Batteries. Adv. Energy Mater. 2017, 7, 1083. [Google Scholar] [CrossRef]
  55. Noerochim, L.; Suwarno, S.; Idris, N.H.; Dipojono, H.K. Recent Development of Nickel-Rich and Cobalt-Free Cathode Materials for Lithium-Ion Batteries. Batteries 2021, 7, 84. [Google Scholar] [CrossRef]
  56. Rieger, B.; Schlueter, S.; Erhard, S.V.; Jossen, A. Strain Propagation in Lithium-Ion Batteries from the Crystal Structure to the Electrode Level. J. Electrochem. Soc. 2016, 163, A1595–A1606. [Google Scholar] [CrossRef]
  57. Li, L.; Luo, C.; Zou, J.; Ran, Q.; Chen, P.; Wang, X.; Zhao, Y.; Wang, L.; Zheng, J.; Niu, X. Prelithiated FeS2 cathode with alleviated volume expansion toward improved cycling performance. Solid State Ionics 2021, 368, 115696. [Google Scholar] [CrossRef]
  58. Mao, C.; An, S.J.; Meyer, H.M.; Li, J.; Wood, M.; Ruther, R.E.; Wood, D.L. Balancing formation time and electrochemical performance of high energy lithium-ion batteries. J. Power Sources 2018, 402, 107–115. [Google Scholar] [CrossRef]
  59. Hemmerling, J.; Guhathakurta, J.; Dettinger, F.; Fill, A.; Birke, K.P. Non-Uniform Circumferential Expansion of Cylindrical Li-Ion Cells—The Potato Effect. Batteries 2021, 7, 61. [Google Scholar] [CrossRef]
  60. Zhang, X.; He, J.; Zhou, J.; Chen, H.; Song, W.; Fang, D. Thickness evolution of commercial Li-ion pouch cells with silicon-based composite anodes and NCA cathodes. Sci. China Technol. Sci. 2021, 64, 83–90. [Google Scholar] [CrossRef]
  61. Li, T.; Yuan, X.Z.; Zhang, L.; Song, D.; Shi, K.; Bock, C. Degradation Mechanisms and Mitigation Strategies of Nickel-Rich NMC-Based Lithium-Ion Batteries. Electrochem. Energy Rev. 2020, 3, 43–80. [Google Scholar] [CrossRef]
  62. Zhang, G.; Li, M.; Ye, Z.; Chen, T.; Cao, J.; Yang, H.; Ma, C.; Jia, Z.; Xie, J.; Cui, N.; et al. Lithium Iron Phosphate and Layered Transition Metal Oxide Cathode for Power Batteries: Attenuation Mechanisms and Modification Strategies. Materials 2023, 16, 5769. [Google Scholar] [CrossRef]
  63. Mei, W.; Duan, Q.; Lu, W.; Sun, J.; Wang, Q. An investigation on expansion behavior of lithium ion battery based on the thermal-mechanical coupling model. J. Clean Prod. 2020, 274, 122643. [Google Scholar] [CrossRef]
  64. Vorwerk, P.; Hahn, S.K.; Daniel, C.; Krause, U.; Keutel, K. Detection of Critical Conditions in Pouch Cells Based on Their Expansion Behavior. Batteries 2022, 8, 42. [Google Scholar] [CrossRef]
  65. Liu, G.; Ouyang, M.; Lu, L.; Li, J.; Han, X. Analysis of the heat generation of lithium-ion battery during charging and discharging considering different influencing factors. J. Therm. Anal. Calorim. 2014, 116, 1001–1010. [Google Scholar] [CrossRef]
  66. Piłatowicz, G.; Marongiu, A.; Drillkens, J.; Sinhuber, P.; Sauer, D.U. A critical overview of definitions and determination techniques of the internal resistance using lithium-ion, lead-acid, nickel metal-hydride batteries and electrochemical double-layer capacitors as examples. J. Power Sources 2015, 296, 365–376. [Google Scholar] [CrossRef]
  67. Yoo, K.; Kim, J. Thermal behavior of full-scale battery pack based on comprehensive heat-generation model. J. Power Sources 2019, 433, 226715. [Google Scholar] [CrossRef]
  68. Zhai, Q.; Xu, X.; Kong, J.; Liu, M.; Xu, P.; Heidarshenas, B.; Wang, Q.; Zhou, F.; Wei, H. 3D Simulation Study on Thermal Behavior and Thermal Stress of Lithium–Ion Battery. Energy Technol. 2023, 11, 795. [Google Scholar] [CrossRef]
  69. Mei, W.; Chen, H.; Sun, J.; Wang, Q. Numerical study on tab dimension optimization of lithium-ion battery from the thermal safety perspective. Appl. Therm. Eng. 2018, 142, 148–165. [Google Scholar] [CrossRef]
  70. Wang, S. Entropy and heat generation of lithium cells/batteries. Chin. Phys. B 2016, 25, 010509. [Google Scholar] [CrossRef]
  71. Bree, G.; Hao, H.; Stoeva, Z.; John Low, C.T. Monitoring state of charge and volume expansion in lithium-ion batteries: An approach using surface mounted thin-film graphene sensors. RSC Adv. 2023, 13, 7045–7054. [Google Scholar] [CrossRef]
  72. McBrayer, J.D.; Apblett, C.A.; Harrison, K.L.; Fenton, K.R.; Minteer, S.D. Mechanical studies of the solid electrolyte interphase on anodes in lithium and lithium ion batteries. Nanotechnology 2021, 32, 502005. [Google Scholar] [CrossRef]
  73. Jankowski, P.; Wieczorek, W.; Johansson, P. SEI-forming electrolyte additives for lithium-ion batteries: Development and benchmarking of computational approaches. J. Mol. Model. 2017, 23, 6. [Google Scholar] [CrossRef]
  74. Zhao, X.; Chen, Y.; Sun, H.; Yuan, T.; Gong, Y.; Liu, X.; Chen, T. Impact of Surface Structure on SEI for Carbon Materials in Alkali Ion Batteries: A Review. Batteries 2023, 9, 226. [Google Scholar] [CrossRef]
  75. Lv, W.; Gu, J.; Niu, Y.; Wen, K.; He, W. Review—Gassing Mechanism and Suppressing Solutions in Li4Ti5O12-Based Lithium-Ion Batteries. J. Electrochem. Soc. 2017, 164, A2213–A2224. [Google Scholar] [CrossRef]
  76. Han, C.; He, Y.B.; Liu, M.; Li, B.; Yang, Q.H.; Wong, C.P.; Kang, F. A review of gassing behavior in Li4Ti5O12-based lithium ion batteries. J. Mater. Chem. A 2017, 5, 6368–6381. [Google Scholar] [CrossRef]
  77. Zhu, T.; Hu, Q.; Yan, G.; Wang, J.; Wang, Z.; Guo, H.; Li, X.; Peng, W. Manipulating the Composition and Structure of Solid Electrolyte Interphase at Graphite Anode by Adjusting the Formation Condition. Energy Technol. 2019, 7, 1900273. [Google Scholar] [CrossRef]
  78. Schomburg, F.; Drees, R.; Kurrat, M.; Danzer, M.A.; Röder, F. Characterization of the Solid-Electrolyte Interphase Growth During Cell Formation Based on Differential Voltage Analysis. Energy Technol. 2023, 11, 688. [Google Scholar] [CrossRef]
  79. Peled, E.; Menkin, S. Review—SEI: Past, Present and Future. J. Electrochem. Soc. 2017, 164, A1703–A1719. [Google Scholar] [CrossRef]
  80. Louli, A.J.; Ellis, L.D.; Dahn, J.R. Operando Pressure Measurements Reveal Solid Electrolyte Interphase Growth to Rank Li-Ion Cell Performance. Joule 2019, 3, 745–761. [Google Scholar] [CrossRef]
  81. Pinson, M.B.; Bazant, M.Z. Theory of SEI Formation in Rechargeable Batteries: Capacity Fade, Accelerated Aging and Lifetime Prediction. J. Electrochem. Soc. 2013, 160, A243–A250. [Google Scholar] [CrossRef]
  82. Cannarella, J.; Arnold, C.B. The Effects of Defects on Localized Plating in Lithium-Ion Batteries. J. Electrochem. Soc. 2015, 162, A1365–A1373. [Google Scholar] [CrossRef]
  83. Janakiraman, U.; Garrick, T.R.; Fortier, M.E. Review—Lithium Plating Detection Methods in Li-Ion Batteries. J. Electrochem. Soc. 2020, 167, 160552. [Google Scholar] [CrossRef]
  84. Lin, X.; Khosravinia, K.; Hu, X.; Li, J.; Lu, W. Lithium Plating Mechanism, Detection, and Mitigation in Lithium-Ion Batteries. Prog. Energy Combust. Sci. 2021, 87, 100953. [Google Scholar] [CrossRef]
  85. Grimsmann, F.; Brauchle, F.; Gerbert, T.; Gruhle, A.; Parisi, J.; Knipper, M. Impact of different aging mechanisms on the thickness change and the quick-charge capability of lithium-ion cells. J. Energy Storage 2017, 14, 158–162. [Google Scholar] [CrossRef]
  86. Waldmann, T.; Hogg, B.I.; Wohlfahrt-Mehrens, M. Li plating as unwanted side reaction in commercial Li-ion cells—A review. J. Power Sources 2018, 384, 107–124. [Google Scholar] [CrossRef]
  87. Münster, P.; Diehl, M.; Frerichs, J.E.; Börner, M.; Hansen, M.R.; Winter, M.; Niehoff, P. Effect of Li plating during formation of lithium ion batteries on their cycling performance and thermal safety. J. Power Sources 2021, 484, 229306. [Google Scholar] [CrossRef]
  88. Rowden, B.; Garcia-Araez, N. A review of gas evolution in lithium ion batteries. Energy Rep. 2020, 6, 10–18. [Google Scholar] [CrossRef]
  89. James, J.D.; Spittle, J.A.; Brown, S.G.R.; Evans, R.W. A review of measurement techniques for the thermal expansion coefficient of metals and alloys at elevated temperatures. Meas. Sci. Technol. 2001, 12, R1–R15. [Google Scholar] [CrossRef]
  90. Moyassari, E.; Roth, T.; Kücher, S.; Chang, C.C.; Hou, S.C.; Spingler, F.B.; Jossen, A. The Role of Silicon in Silicon-Graphite Composite Electrodes Regarding Specific Capacity, Cycle Stability, and Expansion. J. Electrochem. Soc. 2022, 169, 010504. [Google Scholar] [CrossRef]
  91. Biberacher, W.; Lerf, A.; Besenhard, J.O.; Möhwald, H.; Butz, T. A high resolution dilatometer for in situ studies of the electrointercalation of layered materials. Mater. Res. Bull. 1982, 17, 1385–1392. [Google Scholar] [CrossRef]
  92. Huesker, J.; Froböse, L.; Kwade, A.; Winter, M.; Placke, T. In Situ Dilatometric Study of the Binder Influence on the Electrochemical Intercalation of Bis(trifluoromethanesulfonyl) imide Anions into Graphite. Electrochim. Acta 2017, 257, 423–435. [Google Scholar] [CrossRef]
  93. Bazlen, S.; Heugel, P.; von Kessel, O.; Commerell, W.; Tübke, J. Influence of charging protocols on the charging capability and aging of lithium-ion cells with silicon-containing anodes. J. Energy Storage 2022, 49, 104044. [Google Scholar] [CrossRef]
  94. Rieger, B.; Schlueter, S.; Erhard, S.V.; Schmalz, J.; Reinhart, G.; Jossen, A. Multi-scale investigation of thickness changes in a commercial pouch type lithium-ion battery. J. Energy Storage 2016, 6, 213–221. [Google Scholar] [CrossRef]
  95. Bauer, M.; Wachtler, M.; Stöwe, H.; Persson, J.V.; Danzer, M.A. Understanding the dilation and dilation relaxation behavior of graphite-based lithium-ion cells. J. Power Sources 2016, 317, 93–102. [Google Scholar] [CrossRef]
  96. Göttlinger, M.; Daubinger, P.; Stracke, W.; Hartmann, S.; Giffin, G.A. Influence of external pressure on silicon electrodes in lithium-ion cells. Electrochim. Acta 2022, 419, 140354. [Google Scholar] [CrossRef]
  97. Cannarella, J.; Arnold, C.B. Stress evolution and capacity fade in constrained lithium-ion pouch cells. J. Power Sources 2014, 245, 745–751. [Google Scholar] [CrossRef]
  98. Oh, K.Y.; Epureanu, B.I.; Siegel, J.B.; Stefanopoulou, A.G. Phenomenological force and swelling models for rechargeable lithium-ion battery cells. J. Power Sources 2016, 310, 118–129. [Google Scholar] [CrossRef]
  99. Chae, S.; Ko, M.; Kim, K.; Ahn, K.; Cho, J. Confronting Issues of the Practical Implementation of Si Anode in High-Energy Lithium-Ion Batteries. Joule 2017, 1, 47–60. [Google Scholar] [CrossRef]
  100. Grimsmann, F.; Brauchle, F.; Gerbert, T.; Gruhle, A.; Knipper, M.; Parisi, J. Hysteresis and current dependence of the thickness change of lithium-ion cells with graphite anode. J. Energy Storage 2017, 12, 132–137. [Google Scholar] [CrossRef]
  101. Jahn, L.; Katzer, F.; Danzer, M.A. Combined dilatometry and voltage analysis for a reliable detection of lithium deposition on graphitic anodes. J. Power Sources 2022, 520, 230870. [Google Scholar] [CrossRef]
  102. Michelini, E.; Höschele, P.; Heindl, S.F.; Erker, S.; Ellersdorfer, C. Experimental Investigation on Reversible Swelling Mechanisms of Lithium-Ion Batteries under a Varying Preload Force. Batteries 2023, 9, 218. [Google Scholar] [CrossRef]
  103. Mohtat, P.; Lee, S.; Siegel, J.B.; Stefanopoulou, A.G. Towards better estimability of electrode-specific state of health: Decoding the cell expansion. J. Power Sources 2019, 427, 101–111. [Google Scholar] [CrossRef]
  104. Müller, V.; Scurtu, R.G.; Richter, K.; Waldmann, T.; Memm, M.; Danzer, M.A.; Wohlfahrt-Mehrens, M. Effects of Mechanical Compression on the Aging and the Expansion Behavior of Si/C-Composite|NMC811 in Different Lithium-Ion Battery Cell Formats. J. Electrochem. Soc. 2019, 166, A3796–A3805. [Google Scholar] [CrossRef]
  105. Nagayama, M.; Ariyoshi, K.; Yamamoto, Y.; Ohzuku, T. Characterization of Lithium Insertion Electrodes by Precision Dilatometer: Area-Specific Deformation of Single Electrode. J. Electrochem. Soc. 2014, 161, A1388–A1393. [Google Scholar] [CrossRef]
  106. Sauerteig, D.; Hanselmann, N.; Arzberger, A.; Reinshagen, H.; Ivanov, S.; Bund, A. Electrochemical-mechanical coupled modeling and parameterization of swelling and ionic transport in lithium-ion batteries. J. Power Sources 2018, 378, 235–247. [Google Scholar] [CrossRef]
  107. Schmider, D.; Bessler, W.G. Thermo-Electro-Mechanical Modeling and Experimental Validation of Thickness Change of a Lithium-Ion Pouch Cell with Blend Positive Electrode. Batteries 2023, 9, 354. [Google Scholar] [CrossRef]
  108. Grimsmann, F.; Gerbert, T.; Brauchle, F.; Gruhle, A.; Parisi, J.; Knipper, M. Determining the maximum charging currents of lithium-ion cells for small charge quantities. J. Power Sources 2017, 365, 12–16. [Google Scholar] [CrossRef]
  109. Waluś, S.; Offer, G.; Hunt, I.; Patel, Y.; Stockley, T.; Williams, J.; Purkayastha, R. Volumetric expansion of Lithium-Sulfur cell during operation—Fundamental insight into applicable characteristics. Energy Storage Mater. 2018, 10, 233–245. [Google Scholar] [CrossRef]
  110. Lee, J.H.; Lee, H.M.; Ahn, S. Battery dimensional changes occurring during charge/discharge cycles—Thin rectangular lithium ion and polymer cells. J. Power Sources 2003, 119–121, 833–837. [Google Scholar] [CrossRef]
  111. Louli, A.J.; Li, J.; Trussler, S.; Fell, C.R.; Dahn, J.R. Volume, Pressure and Thickness Evolution of Li-Ion Pouch Cells with Silicon-Composite Negative Electrodes. J. Electrochem. Soc. 2017, 164, A2689–A2696. [Google Scholar] [CrossRef]
  112. Berckmans, G.; de Sutter, L.; Marinaro, M.; Smekens, J.; Jaguemont, J.; Wohlfahrt-Mehrens, M.; van Mierlo, J.; Omar, N. Analysis of the effect of applying external mechanical pressure on next generation silicon alloy lithium-ion cells. Electrochim. Acta 2019, 306, 387–395. [Google Scholar] [CrossRef]
  113. Yoon, D.-h.; Marinaro, M.; Axmann, P.; Wohlfahrt-Mehrens, M. Communication—Quantitative Analysis of Consumption of Fluoroethylene Carbonate Additives on Silicon Alloy Anodes. J. Electrochem. Soc. 2018, 165, A2467–A2469. [Google Scholar] [CrossRef]
  114. Marinaro, M.; Yoon, D.h.; Gabrielli, G.; Stegmaier, P.; Figgemeier, E.; Spurk, P.C.; Nelis, D.; Schmidt, G.; Chauveau, J.; Axmann, P.; et al. High performance 1.2 Ah Si-alloy/Graphite|LiNi 0.5 Mn 0.3 Co 0.2 O 2 prototype Li-ion battery. J. Power Sources 2017, 357, 188–197. [Google Scholar] [CrossRef]
  115. Wang, Y.; Zhang, Q.; Li, D.; Hu, J.; Xu, J.; Dang, D.; Xiao, X.; Cheng, Y.T. Mechanical Property Evolution of Silicon Composite Electrodes Studied by Environmental Nanoindentation. Adv. Energy Mater. 2018, 8, 2578. [Google Scholar] [CrossRef]
  116. Li, J.Y.; Xu, Q.; Li, G.; Yin, Y.X.; Wan, L.J.; Guo, Y.G. Research progress regarding Si-based anode materials towards practical application in high energy density Li-ion batteries. Mater. Chem. Front. 2017, 1, 1691–1708. [Google Scholar] [CrossRef]
  117. Jin, C.; Wang, Y.; Borujerdi, A.S.; Li, J. Stress evolution and thickness change of a lithium-ion pouch cell under various cycling conditions. J. Power Sources Adv. 2022, 16, 100103. [Google Scholar] [CrossRef]
  118. Aiken, C.P.; Xia, J.; Wang, D.Y.; Stevens, D.A.; Trussler, S.; Dahn, J.R. An Apparatus for the Study of In Situ Gas Evolution in Li-Ion Pouch Cells. J. Electrochem. Soc. 2014, 161, A1548–A1554. [Google Scholar] [CrossRef]
  119. Leißing, M.; Horsthemke, F.; Wiemers-Meyer, S.; Winter, M.; Niehoff, P.; Nowak, S. The Impact of the C-Rate on Gassing During Formation of NMC622 II Graphite Lithium-Ion Battery Cells. Batter. Supercaps 2021, 4, 1344–1350. [Google Scholar] [CrossRef]
  120. Self, J.; Aiken, C.P.; Petibon, R.; Dahn, J.R. Survey of Gas Expansion in Li-Ion NMC Pouch Cells. J. Electrochem. Soc. 2015, 162, A796–A802. [Google Scholar] [CrossRef]
  121. Liu, Q.Q.; Xiong, D.J.; Petibon, R.; Du, C.Y.; Dahn, J.R. Gas Evolution during Unwanted Lithium Plating in Li-Ion Cells with EC-Based or EC-Free Electrolytes. J. Electrochem. Soc. 2016, 163, A3010–A3015. [Google Scholar] [CrossRef]
  122. Xiong, D.J.; Petibon, R.; Madec, L.; Hall, D.S.; Dahn, J.R. Some Effects of Intentionally Added Water on LiCoO2/Graphite Pouch Cells. J. Electrochem. Soc. 2016, 163, A1678–A1685. [Google Scholar] [CrossRef]
  123. Ellis, L.D.; Allen, J.P.; Thompson, L.M.; Harlow, J.E.; Stone, W.J.; Hill, I.G.; Dahn, J.R. Quantifying, Understanding and Evaluating the Effects of Gas Consumption in Lithium-Ion Cells. J. Electrochem. Soc. 2017, 164, A3518–A3528. [Google Scholar] [CrossRef]
  124. Krause, L.J.; Chevrier, V.L.; Jensen, L.D.; Brandt, T. The Effect of Carbon Dioxide on the Cycle Life and Electrolyte Stability of Li-Ion Full Cells Containing Silicon Alloy. J. Electrochem. Soc. 2017, 164, A2527–A2533. [Google Scholar] [CrossRef]
  125. Milien, M.S.; Hoffmann, J.; Payne, M.; Lucht, B.L. Effect of Electrolyte Additives on Li4Ti5O12 Cycling Performance and Gas Evolution. J. Electrochem. Soc. 2018, 165, A3925–A3931. [Google Scholar] [CrossRef]
  126. Guillot, S.L.; Usrey, M.L.; Peña-Hueso, A.; Kerber, B.M.; Zhou, L.; Du, P.; Johnson, T. Reduced Gassing In Lithium-Ion Batteries With Organosilicon Additives. J. Electrochem. Soc. 2021, 168, 030533. [Google Scholar] [CrossRef]
  127. Rodrigues, M.T.F.; Trask, S.E.; Shkrob, I.A.; Abraham, D.P. Quantifying gas generation from slurries used in fabrication of Si-containing electrodes for lithium-ion cells. J. Power Sources 2018, 395, 289–294. [Google Scholar] [CrossRef]
  128. Peng, J.; Zhou, X.; Jia, S.; Jin, Y.; Xu, S.; Chen, J. High precision strain monitoring for lithium ion batteries based on fiber Bragg grating sensors. J. Power Sources 2019, 433, 226692. [Google Scholar] [CrossRef]
  129. Hickey, R.; Jahns, T.M. Measuring Individual Battery Dimensional Changes for State-of-Charge Estimation using Strain Gauge Sensors. In Proceedings of the ECCE 2019, Piscataway, NJ, USA, 29 September–3 October 2019; pp. 2460–2465. [Google Scholar] [CrossRef]
  130. Willenberg, L.K.; Dechent, P.; Fuchs, G.; Sauer, D.U.; Figgemeier, E. High-Precision Monitoring of Volume Change of Commercial Lithium-Ion Batteries by Using Strain Gauges. Sustainability 2020, 12, 557. [Google Scholar] [CrossRef]
  131. Choi, W.; Seo, Y.; Yoo, K.; Ko, T.J.; Choi, J. Carbon Nanotube-Based Strain Sensor for Excessive Swelling Detection of Lithium-Ion Battery. In Proceedings of the 2019 20th International Conference on Solid-State Sensors, Actuators and Microsystems & Eurosensors XXXIII (TRANSDUCERS & EUROSENSORS XXXIII), Berlin, Germany, 23–27 June 2019; IEEE: New York, NY, USA, 2019; pp. 2356–2359. [Google Scholar] [CrossRef]
  132. Wahl, M.S.; Spitthoff, L.; Muri, H.I.; Jinasena, A.; Burheim, O.S.; Lamb, J.J. The Importance of Optical Fibres for Internal Temperature Sensing in Lithium-ion Batteries during Operation. Energies 2021, 14, 3617. [Google Scholar] [CrossRef]
  133. Helsztynski, J.; Lewandowski, L.; Jasiewicz, W.; Jedrzejewski, K.P. Interferometric fiber Bragg gratings. Proc. SPIE 2004, 5576, 37–41. [Google Scholar] [CrossRef]
  134. Cheng, X.; Pecht, M. In Situ Stress Measurement Techniques on Li-ion Battery Electrodes: A Review. Energies 2017, 10, 591. [Google Scholar] [CrossRef]
  135. Peng, J.; Zhou, X.; Jia, S.; Xu, S.; Chen, J. Design of a sensitivity-enhanced FBG strain sensor and its application in state estimation for lithium-ion battery. In Proceedings of the AOPC 2019: Optical Fiber Sensors and Communication, Beijing, China, 5–8 August 2019; Zhang, J., Fu, S., Yang, J., Eds.; SPIE: Bellingham, WA, USA, 2019; p. 10. [Google Scholar] [CrossRef]
  136. Komma, J.; Schwarz, C.; Hofmann, G.; Heinert, D.; Nawrodt, R. Thermo-optic coefficient of silicon at 1550 nm and cryogenic temperatures. Appl. Phys. Lett. 2012, 101, 041905. [Google Scholar] [CrossRef]
  137. Kersey, A.D.; Davis, M.A.; Patrick, H.J.; LeBlanc, M.; Koo, K.P.; Askins, C.G.; Putnam, M.A.; Friebele, E.J. Fiber grating sensors. J. Light. Technol. 1997, 15, 1442–1463. [Google Scholar] [CrossRef]
  138. Novais, S.; Nascimento, M.; Grande, L.; Domingues, M.F.; Antunes, P.; Alberto, N.; Leitão, C.; Oliveira, R.; Koch, S.; Kim, G.T.; et al. Internal and External Temperature Monitoring of a Li-Ion Battery with Fiber Bragg Grating Sensors. Sensors 2016, 16, 1394. [Google Scholar] [CrossRef] [PubMed]
  139. Alcock, K.M.; Grammel, M.; González-Vila, Á.; Binetti, L.; Goh, K.; Alwis, L.S. An accessible method of embedding fibre optic sensors on lithium-ion battery surface for in-situ thermal monitoring. Sens. Actuators A Phys. 2021, 332, 113061. [Google Scholar] [CrossRef]
  140. Unterkofler, J.; Glanz, G.; Koller, M.; Klambauer, R.; Bergmann, A. Strain Compensation Methods for Fiber Bragg Grating Temperature Sensors Suitable for Integration into Lithium-Ion Battery Electrolyte. Batteries 2023, 9, 34. [Google Scholar] [CrossRef]
  141. Nascimento, M.; Ferreira, M.; Pinto, J. Simultaneous Sensing of Temperature and Bi-Directional Strain in a Prismatic Li-Ion Battery. Batteries 2018, 4, 23. [Google Scholar] [CrossRef]
  142. Yang, G.; Leitão, C.; Li, Y.; Pinto, J.; Jiang, X. Real-time temperature measurement with fiber Bragg sensors in lithium batteries for safety usage. Measurement 2013, 46, 3166–3172. [Google Scholar] [CrossRef]
  143. Sommer, L.W.; Raghavan, A.; Kiesel, P.; Saha, B.; Schwartz, J.; Lochbaum, A.; Ganguli, A.; Bae, C.J.; Alamgir, M. Monitoring of Intercalation Stages in Lithium-Ion Cells over Charge-Discharge Cycles with Fiber Optic Sensors. J. Electrochem. Soc. 2015, 162, A2664–A2669. [Google Scholar] [CrossRef]
  144. Rao, Y.J. In-fibre Bragg grating sensors. Meas. Sci. Technol. 1997, 8, 355–375. [Google Scholar] [CrossRef]
  145. Sommer, L.W.; Kiesel, P.; Ganguli, A.; Lochbaum, A.; Saha, B.; Schwartz, J.; Bae, C.J.; Alamgir, M.; Raghavan, A. Fast and slow ion diffusion processes in lithium ion pouch cells during cycling observed with fiber optic strain sensors. J. Power Sources 2015, 296, 46–52. [Google Scholar] [CrossRef]
  146. Meyer, J.; Nedjalkov, A.; Doering, A.; Angelmahr, M.; Schade, W. Fiber optical sensors for enhanced battery safety. In Proceedings of the Fiber Optic Sensors and Applications XII, Baltimore, MD, USA, 22–23 April 2015; Pickrell, G., Udd, E., Du, H.H., Eds.; SPIE: Bellingham, WA, USA, 2015; p. 94800Z. [Google Scholar] [CrossRef]
  147. Raghavan, A.; Kiesel, P.; Sommer, L.W.; Schwartz, J.; Lochbaum, A.; Hegyi, A.; Schuh, A.; Arakaki, K.; Saha, B.; Ganguli, A.; et al. Embedded fiber-optic sensing for accurate internal monitoring of cell state in advanced battery management systems part 1: Cell embedding method and performance. J. Power Sources 2017, 341, 466–473. [Google Scholar] [CrossRef]
  148. Bae, C.J.; Manandhar, A.; Kiesel, P.; Raghavan, A. Monitoring the Strain Evolution of Lithium–Ion Battery Electrodes using an Optical Fiber Bragg Grating Sensor. Energy Technol. 2016, 4, 851–855. [Google Scholar] [CrossRef]
  149. Nascimento, M.; Novais, S.; Ding, M.S.; Ferreira, M.S.; Koch, S.; Passerini, S.; Pinto, J.L. Internal strain and temperature discrimination with optical fiber hybrid sensors in Li-ion batteries. J. Power Sources 2019, 410–411, 1–9. [Google Scholar] [CrossRef]
  150. Yu, Y.; Vincent, T.; Sansom, J.; Greenwood, D.; Marco, J. Distributed internal thermal monitoring of lithium ion batteries with fibre sensors. J. Energy Storage 2022, 50, 104291. [Google Scholar] [CrossRef]
  151. Ghannoum, A.; Nieva, P. Graphite lithiation and capacity fade monitoring of lithium ion batteries using optical fibers. J. Energy Storage 2020, 28, 101233. [Google Scholar] [CrossRef]
  152. Gardner, C.; Langhammer, E.; Du, W.; Brett, D.J.L.; Shearing, P.R.; Roberts, A.J.; Amietszajew, T. In-Situ Li-Ion Pouch Cell Diagnostics Utilising Plasmonic Based Optical Fibre Sensors. Sensors 2022, 22, 738. [Google Scholar] [CrossRef]
  153. Bonefacino, J.; Ghashghaie, S.; Zheng, T.; Lin, C.P.; Zheng, W.; Blanquer, L.A.; Huang, J.; Gervillié, C.; Tam, H.Y.; Tarascon, J.M.; et al. High-Fidelity Strain and Temperature Measurements of Li-Ion Batteries Using Polymer Optical Fiber Sensors. J. Electrochem. Soc. 2022, 169, 100508. [Google Scholar] [CrossRef]
  154. Chen, D.; Zhao, Q.; Zheng, Y.; Xu, Y.; Chen, Y.; Ni, J.; Zhao, Y. Recent Progress in Lithium-Ion Battery Safety Monitoring Based on Fiber Bragg Grating Sensors. Sensors 2023, 23, 5609. [Google Scholar] [CrossRef] [PubMed]
  155. Gauthier, R.; Luscombe, A.; Bond, T.; Bauer, M.; Johnson, M.; Harlow, J.; Louli, A.; Dahn, J.R. How do Depth of Discharge, C-rate and Calendar Age Affect Capacity Retention, Impedance Growth, the Electrodes, and the Electrolyte in Li-Ion Cells? J. Electrochem. Soc. 2022, 169, 020518. [Google Scholar] [CrossRef]
  156. Ren, W.; Zheng, T.; Piao, C.; Benson, D.E.; Wang, X.; Li, H.; Lu, S. Characterization of commercial 18,650 Li-ion batteries using strain gauges. J. Mater. Sci. 2022, 57, 13560–13569. [Google Scholar] [CrossRef]
  157. Matuck, L.; Pinto, J.L.; Marques, C.; Nascimento, M. Simultaneous Strain and Temperature Discrimination in 18650 Li-ion Batteries Using Polarization-Maintaining Fiber Bragg Gratings. Batteries 2022, 8, 233. [Google Scholar] [CrossRef]
  158. Pietsch, P.; Hess, M.; Ludwig, W.; Eller, J.; Wood, V. Combining operando synchrotron X-ray tomographic microscopy and scanning X-ray diffraction to study lithium ion batteries. Sci. Rep. 2016, 6, 27994. [Google Scholar] [CrossRef] [PubMed]
  159. Withers, P.J.; Bouman, C.; Carmignato, S.; Cnudde, V.; Grimaldi, D.; Hagen, C.K.; Maire, E.; Manley, M.; Du Plessis, A.; Stock, S.R. X-ray computed tomography. Nat. Rev. Methods Prim. 2021, 1, 18. [Google Scholar] [CrossRef]
  160. Maire, E.; Withers, P.J. Quantitative X-ray tomography. Int. Mater. Rev. 2014, 59, 1–43. [Google Scholar] [CrossRef]
  161. Brunke, O.; Brockdorf, K.; Drews, S.; Müller, B.; Donath, T.; Herzen, J.; Beckmann, F. Comparison between X-ray tube-based and synchrotron radiation-based mCT. In Proceedings of the Developments in X-ray Tomography VI; Stock, S.R., Ed.; SPIE: Bellingham, WA, USA, 2008; p. 70780U. [Google Scholar] [CrossRef]
  162. Brant, W.R.; Schmid, S.; Du, G.; Gu, Q.; Sharma, N. A simple electrochemical cell for in-situ fundamental structural analysis using synchrotron X-ray powder diffraction. J. Power Sources 2013, 244, 109–114. [Google Scholar] [CrossRef]
  163. Su, L.; Choi, P.; Parimalam, B.S.; Litster, S.; Reeja-Jayan, B. Designing reliable electrochemical cells for operando lithium-ion battery study. MethodsX 2021, 8, 101562. [Google Scholar] [CrossRef]
  164. Lim, J.; Li, Y.; Alsem, D.H.; So, H.; Lee, S.C.; Bai, P.; Cogswell, D.A.; Liu, X.; Jin, N.; Yu, Y.-S.; et al. Origin and hysteresis of lithium compositional spatiodynamics within battery primary particles. Science 2016, 353, 566–571. [Google Scholar] [CrossRef]
  165. Borkiewicz, O.J.; Shyam, B.; Wiaderek, K.M.; Kurtz, C.; Chupas, P.J.; Chapman, K.W. The AMPIX electrochemical cell: A versatile apparatus for in situ X-ray scattering and spectroscopic measurements. J. Appl. Crystallogr. 2012, 45, 1261–1269. [Google Scholar] [CrossRef]
  166. Beattie, S.D.; Larcher, D.; Morcrette, M.; Simon, B.; Tarascon, J.M. Si Electrodes for Li-Ion Batteries—A New Way to Look at an Old Problem. J. Electrochem. Soc. 2008, 155, A158. [Google Scholar] [CrossRef]
  167. Obrovac, M.N.; Krause, L.J. Reversible Cycling of Crystalline Silicon Powder. J. Electrochem. Soc. 2007, 154, A103. [Google Scholar] [CrossRef]
  168. Fister, T.T.; Goldman, J.L.; Long, B.R.; Nuzzo, R.G.; Gewirth, A.A.; Fenter, P.A. X-ray diffraction microscopy of lithiated silicon microstructures. Appl. Phys. Lett. 2013, 102, 131903. [Google Scholar] [CrossRef]
  169. Wang, X.; Sone, Y.; Kuwajima, S. In Situ Investigation of the Volume Change in Li-ion Cell with Charging and Discharging. J. Electrochem. Soc. 2004, 151, A273. [Google Scholar] [CrossRef]
  170. Finegan, D.P.; Scheel, M.; Robinson, J.B.; Tjaden, B.; Di Michiel, M.; Hinds, G.; Brett, D.J.L.; Shearing, P.R. Investigating lithium-ion battery materials during overcharge-induced thermal runaway: An operando and multi-scale X-ray CT study. Phys. Chem. Chem. Phys. 2016, 18, 30912–30919. [Google Scholar] [CrossRef]
  171. Trease, N.M.; Ko ster, T.K.J.; Grey, C.P. In Situ NMR Studies of Lithium Ion Batteries. Interface Mag. 2011, 20, 69–73. [Google Scholar] [CrossRef]
  172. Le Houx, J.; Kramer, D. X-ray tomography for lithium ion battery electrode characterisation—A review. Energy Rep. 2021, 7, 9–14. [Google Scholar] [CrossRef]
  173. Zhou, H.; An, K.; Allu, S.; Pannala, S.; Li, J.; Bilheux, H.Z.; Martha, S.K.; Nanda, J. Probing Multiscale Transport and Inhomogeneity in a Lithium-Ion Pouch Cell Using In Situ Neutron Methods. ACS Energy Lett. 2016, 1, 981–986. [Google Scholar] [CrossRef]
  174. Calzada, E.; Schillinger, B.; Grünauer, F. Construction and assembly of the neutron radiography and tomography facility ANTARES at FRM II. Nucl. Instruments Methods Phys. Res. Sect. A Accel. Spectrometers Detect. Assoc. Equip. 2005, 542, 38–44. [Google Scholar] [CrossRef]
  175. Rieger, B.; Schuster, S.F.; Erhard, S.V.; Osswald, P.J.; Rheinfeld, A.; Willmann, C.; Jossen, A. Multi-directional laser scanning as innovative method to detect local cell damage during fast charging of lithium-ion cells. J. Energy Storage 2016, 8, 1–5. [Google Scholar] [CrossRef]
  176. Yang, H.; Tao, W.; Zhang, Z.; Zhao, S.; Yin, X.; Zhao, H. Reduction of the Influence of Laser Beam Directional Dithering in a Laser Triangulation Displacement Probe. Sensors 2017, 17, 1126. [Google Scholar] [CrossRef] [PubMed]
  177. Ding, D.; Ding, W.; Huang, R.; Fu, Y.; Xu, F. Research progress of laser triangulation on-machine measurement technology for complex surface: A review. Measurement 2023, 216, 113001. [Google Scholar] [CrossRef]
  178. Kienle, P.; Batarilo, L.; Akgül, M.; Köhler, M.H.; Wang, K.; Jakobi, M.; Koch, A.W. Optical Setup for Error Compensation in a Laser Triangulation System. Sensors 2020, 20, 4949. [Google Scholar] [CrossRef] [PubMed]
  179. Zhao, H.; Wang, Z.; Jia, G.; Li, X.; Zhang, Y. Field imaging system for hyperspectral data, 3D structural data and panchromatic image data measurement based on acousto-optic tunable filter. Opt. Express 2018, 26, 17717–17730. [Google Scholar] [CrossRef] [PubMed]
  180. Bohn, G.; Taub, J.; Linke, A.; Bayer, S.; Oeser, D.; Ziegler, A.; Ettl, P.; Ackva, A. High-resolution Interferometric Measurement of Thickness Change on a Lithium-Ion Pouch Battery. IOP Conf. Ser. Earth Environ. Sci. 2019, 281, 012030. [Google Scholar] [CrossRef]
  181. Bohn, G.; Taub, J.; Oeser, D.; Ziegler, A.; Gielinger, S. Fast and High Resolution Expansion Measurement at an Audi e-tron Battery Cell. In Proceedings of the 2022 IEEE Vehicle Power and Propulsion Conference (VPPC), Merced, CA, USA, 1–4 November 2022; IEEE: New York, NY, USA, 2022; pp. 1–6. [Google Scholar] [CrossRef]
  182. Xu, Z.; Shilpiekandula, V.; Youcef-toumi, K.; Yoon, S.F. White-light scanning interferometer for absolute nano-scale gap thickness measurement. Opt. Express 2009, 17, 15104–15117. [Google Scholar] [CrossRef] [PubMed]
  183. Lehmann, P.; Tereschenko, S.; Xie, W. Fundamental aspects of resolution and precision in vertical scanning white-light interferometry. Surf. Topogr. Metrol. Prop. 2016, 4, 024004. [Google Scholar] [CrossRef]
  184. Krause, T.J.H. Self-Witnessing Coherent Imaging for Automatic Noise Filtering and Artifact Removal in Laser Process Monitoring. Master’s Thesis, Queen’s University, Kingston, ON, Canada, 2022. [Google Scholar]
  185. Yang, K.; Sheng, Z.; Chen, B.; Li, X.; Fu, Y. Dual-surface li-ion battery deformation measurement by temporal electronic speckle pattern interferometry. In Proceedings of the International Conference on Optical and Photonic Engineering (icOPEN 2022), Nanjing, China, 24–27 November 2022; Zuo, C., Wang, H., Feng, S., Kemao, Q., Eds.; SPIE: Bellingham, WA, USA, 2022; p. 94. [Google Scholar] [CrossRef]
  186. Yang, L.; Xie, X.; Zhu, L.; Wu, S.; Wang, Y. Review of electronic speckle pattern interferometry (ESPI) for three dimensional displacement measurement. Chin. J. Mech. Eng. 2014, 27, 1–13. [Google Scholar] [CrossRef]
  187. Zhang, Z.; Towers, C.E.; Towers, D.P. Time efficient color fringe projection system for 3D shape and color using optimum 3-frequency Selection. Opt. Express 2006, 14, 6444–6455. [Google Scholar] [CrossRef]
  188. van der Jeught, S.; Dirckx, J.J.J. Deep neural networks for single shot structured light profilometry. Opt. Express 2019, 27, 17091–17101. [Google Scholar] [CrossRef]
  189. Geng, J. Structured-light 3D surface imaging: A tutorial. Adv. Opt. Photon. 2011, 3, 128. [Google Scholar] [CrossRef]
  190. Ishii, I.; Yamamoto, K.; Doi, K.; Tsuji, T. High-speed 3D image acquisition using coded structured light projection. In Proceedings of the 2007 IEEE/RSJ International Conference on Intelligent Robots and Systems, San Diego, CA, USA, 29 October–2 November 2007; IEEE: New York, NY, USA, 2007; pp. 925–930. [Google Scholar] [CrossRef]
  191. Wang, Z. Review of real-time three-dimensional shape measurement techniques. Measurement 2020, 156, 107624. [Google Scholar] [CrossRef]
  192. Pan, B.; Qian, K.; Xie, H.; Asundi, A. Two-dimensional digital image correlation for in-plane displacement and strain measurement: A review. Meas. Sci. Technol. 2009, 20, 062001. [Google Scholar] [CrossRef]
  193. Salvi, J.; Fernandez, S.; Pribanic, T.; Llado, X. A state of the art in structured light patterns for surface profilometry. Pattern Recognit. 2010, 43, 2666–2680. [Google Scholar] [CrossRef]
  194. Schreier, H.; Orteu, J.J.; Sutton, M.A. Image Correlation for Shape, Motion and Deformation Measurements; Springer: Boston, MA, USA, 2009. [Google Scholar] [CrossRef]
  195. Gao, Y.; Cheng, T.; Su, Y.; Xu, X.; Zhang, Y.; Zhang, Q. High-efficiency and high-accuracy digital image correlation for three-dimensional measurement. Opt. Lasers Eng. 2015, 65, 73–80. [Google Scholar] [CrossRef]
  196. Pan, B. Digital image correlation for surface deformation measurement: Historical developments, recent advances and future goals. Meas. Sci. Technol. 2018, 29, 082001. [Google Scholar] [CrossRef]
  197. Boukhtache, S.; Abdelouahab, K.; Berry, F.; Blaysat, B.; Grédiac, M.; Sur, F. When Deep Learning Meets Digital Image Correlation. Opt. Lasers Eng. 2021, 136, 106308. [Google Scholar] [CrossRef]
  198. Wang, G.; Zhang, L.; Yao, X. StrainNet-3D: Real-time and robust 3-dimensional speckle image correlation using deep learning. Opt. Lasers Eng. 2022, 158, 107184. [Google Scholar] [CrossRef]
  199. Luo, J.; Dai, C.Y.; Wang, Z.; Liu, K.; Mao, W.G.; Fang, D.N.; Chen, X. In-situ measurements of mechanical and volume change of LiCoO2 lithium-ion batteries during repeated charge—Discharge cycling by using digital image correlation. Measurement 2016, 94, 759–770. [Google Scholar] [CrossRef]
  200. Leung, P.K.; Moreno, C.; Masters, I.; Hazra, S.; Conde, B.; Mohamed, M.R.; Dashwood, R.J.; Bhagat, R. Real-time displacement and strain mappings of lithium-ion batteries using three-dimensional digital image correlation. J. Power Sources 2014, 271, 82–86. [Google Scholar] [CrossRef]
  201. Mutscheller, A. Safety Standards of Protection against X-ray Dangers. Radiology 1928, 10, 468–476. [Google Scholar] [CrossRef]
  202. Keshavamurthy, R.S.; Kumar, D.S. Radiation safety and radiation shielding design. In Physics of Nuclear Reactors; Elsevier: Amsterdam, The Netherlands, 2021; pp. 635–694. [Google Scholar] [CrossRef]
  203. Bilderback, D.H.; Elleaume, P.; Weckert, E. Review of third and next generation synchrotron light sources. J. Phys. B At. Mol. Opt. Phys. 2005, 38, S773–S797. [Google Scholar] [CrossRef]
Figure 1. Illustration of the components and working principle of lithium-ion battery cells. Reproduced under Creative Commons License without any changes (CC BY-NC-ND 4.0 by Adenusi et al. [32]).
Energies 17 01566 g001
Figure 2. Graphite potential and schematic lithium (purple dots) intercalation during (dis−) charging; Reproduced under Creative Commons License without any changes (CC BY 3.0 by Asenbauer et al. [42]).
Energies 17 01566 g002
Figure 3. Two different dilatometer setups. (a) Thickness measurement of a single working electrode with a stiff glass separator between both electrodes (b) Typical in situ dilatometry measurement of the whole cell on a macro scale (Own representation based on (a) [56,94] and (b) [13,95]).
Energies 17 01566 g003
Figure 4. Calculated volume change of each electrode at charge and discharge cycle (a). Results of measured volume, pressure, and thickness change for NCA/SiG cell (b); Reproduced under Creative Commons License without any changes (CC BY 4.0 by Louli et al. [111]).
Energies 17 01566 g004
Figure 5. Quasiopen circuit test: Voltage, current, and caused force variation on NMC/Si-G pouch cell at 25 °C. The area of constant force (red), discharged (blue) and charge (yellow) are higlighted in different colors; reproduced under Creative Commons License without any changes (CC BY-NC-ND 4.0 by Berckmans et al. [112]).
Energies 17 01566 g005
Figure 6. Expansion behavior of a pouch cell with and without lithium plating while charging (own representation based on data from [13]).
Energies 17 01566 g006
Figure 7. Setup for immersion bath measurement. Reproduced under Creative Commons License without any changes (CC BY 4.0 by Stock et al. [12]).
Energies 17 01566 g007
Figure 8. Comparison between 1D dilatation measuring of gas production through pressure plate and immersion bath. Normalized volume for NCA/SiC cells (a). Normalized volume for NMC/G cells (b); reproduced under Creative Commons License without any changes (CC BY 4.0 by Stock et al. [12]).
Energies 17 01566 g008
Figure 9. Response of the cell voltage, the cell expansion (1D dilatometer or thickness gauge ), and the strain of the cell surface (strain gauge) to a 0.5 C discharge pulse of a prismatic cell; reproduced under Creative Commons License without any changes (CC BY 4.0 by Popp et al. [15] with Data from [129]).
Energies 17 01566 g009
Figure 10. Functionality of a FBG sensor. No external strain and ambient temperature FBG sensors with specific inputs, outputs, and reflected profiles (a). External stress and ambient temperature with different outputs and reflected profile due to a shift in the grating profile (b). No external stress and different temperature with different outputs and reflected profile due to a shift in the grating profile (c). n 2 is a different refraction index than n 2 and the red line is red dotted line is for peak comparison. Own representation based on Wahl et al. [132] under Creative Commons License (CC BY 4.0).
Energies 17 01566 g010
Figure 11. Wavelength shift over SoC for attached FBG sensor on graphite anode (A) and implanted sensor (B). Each spectrum shows different SoC stages: 0% = red, 50% = blue, 100% = green; reproduced under Creative Commons License without any changes (CC BY 4.0 by Popp et al. [15] with Data from [148].
Energies 17 01566 g011
Figure 12. Basic apparatus for laser triangulation for objects with a diffuse surface [176,178,179].
Energies 17 01566 g012
Figure 13. Michelson interferometer implementation of a white light measurement system. Figure reproduced without any changes from reference [184].
Energies 17 01566 g013
Figure 14. Tree diagrams outlining the numerous contact (top) and noncontact (bottom) approaches for measuring volume expansion in lithium-ion batteries, as covered in this publication.
Energies 17 01566 g014
Disclaimer/Publisher’s Note: The statements, opinions and data contained in all publications are solely those of the individual author(s) and contributor(s) and not of MDPI and/or the editor(s). MDPI and/or the editor(s) disclaim responsibility for any injury to people or property resulting from any ideas, methods, instructions or products referred to in the content.

