Author Contributions
Conceptualisation, J.W., L.R., S.D., M.G., S.N. and C.R.; data curation, J.W., L.R., S.D., M.G., S.N. and C.R.; formal analysis, J.W., L.R., S.D. and S.N.; funding acquisition, L.R. and M.G.; investigation, J.W., L.R., S.D., M.G., S.N., and C.R.; methodology, J.W., L.R., S.D., M.G., S.N. and C.R.; project administration, L.R.; resources, J.W., L.R., M.G. and C.R.; software, S.D.; supervision, L.R. and M.G.; validation, J.W., L.R., S.D. and S.N.; visualization, J.W., L.R., S.D. and S.N.; writing—original draft, J.W., L.R., S.D. and S.N.; writing—review and editing, J.W., L.R., S.D. and C.R. All authors have read and agreed to the published version of the manuscript.
Acknowledgments
The authors would like to acknowledge the contribution of the Estates, Sustainability, Infrastructure, and Security teams from the University of Nottingham, who provided support, data, and feedback for this research. The authors would like to thank the EV-elocity project partners Cenex, University of Warwick, Leeds City Council, Nottingham City Council and CrowdCharge; and AMiCC project partners Sprint Power, 4th Dimension Technology, Leeds City Council, Loughborough University, and the University of Warwick. The authors would like to acknowledge the University of Warwick and the Centre for Postdoctoral Development in Infrastructure, Cities and Energy (C-DICE).
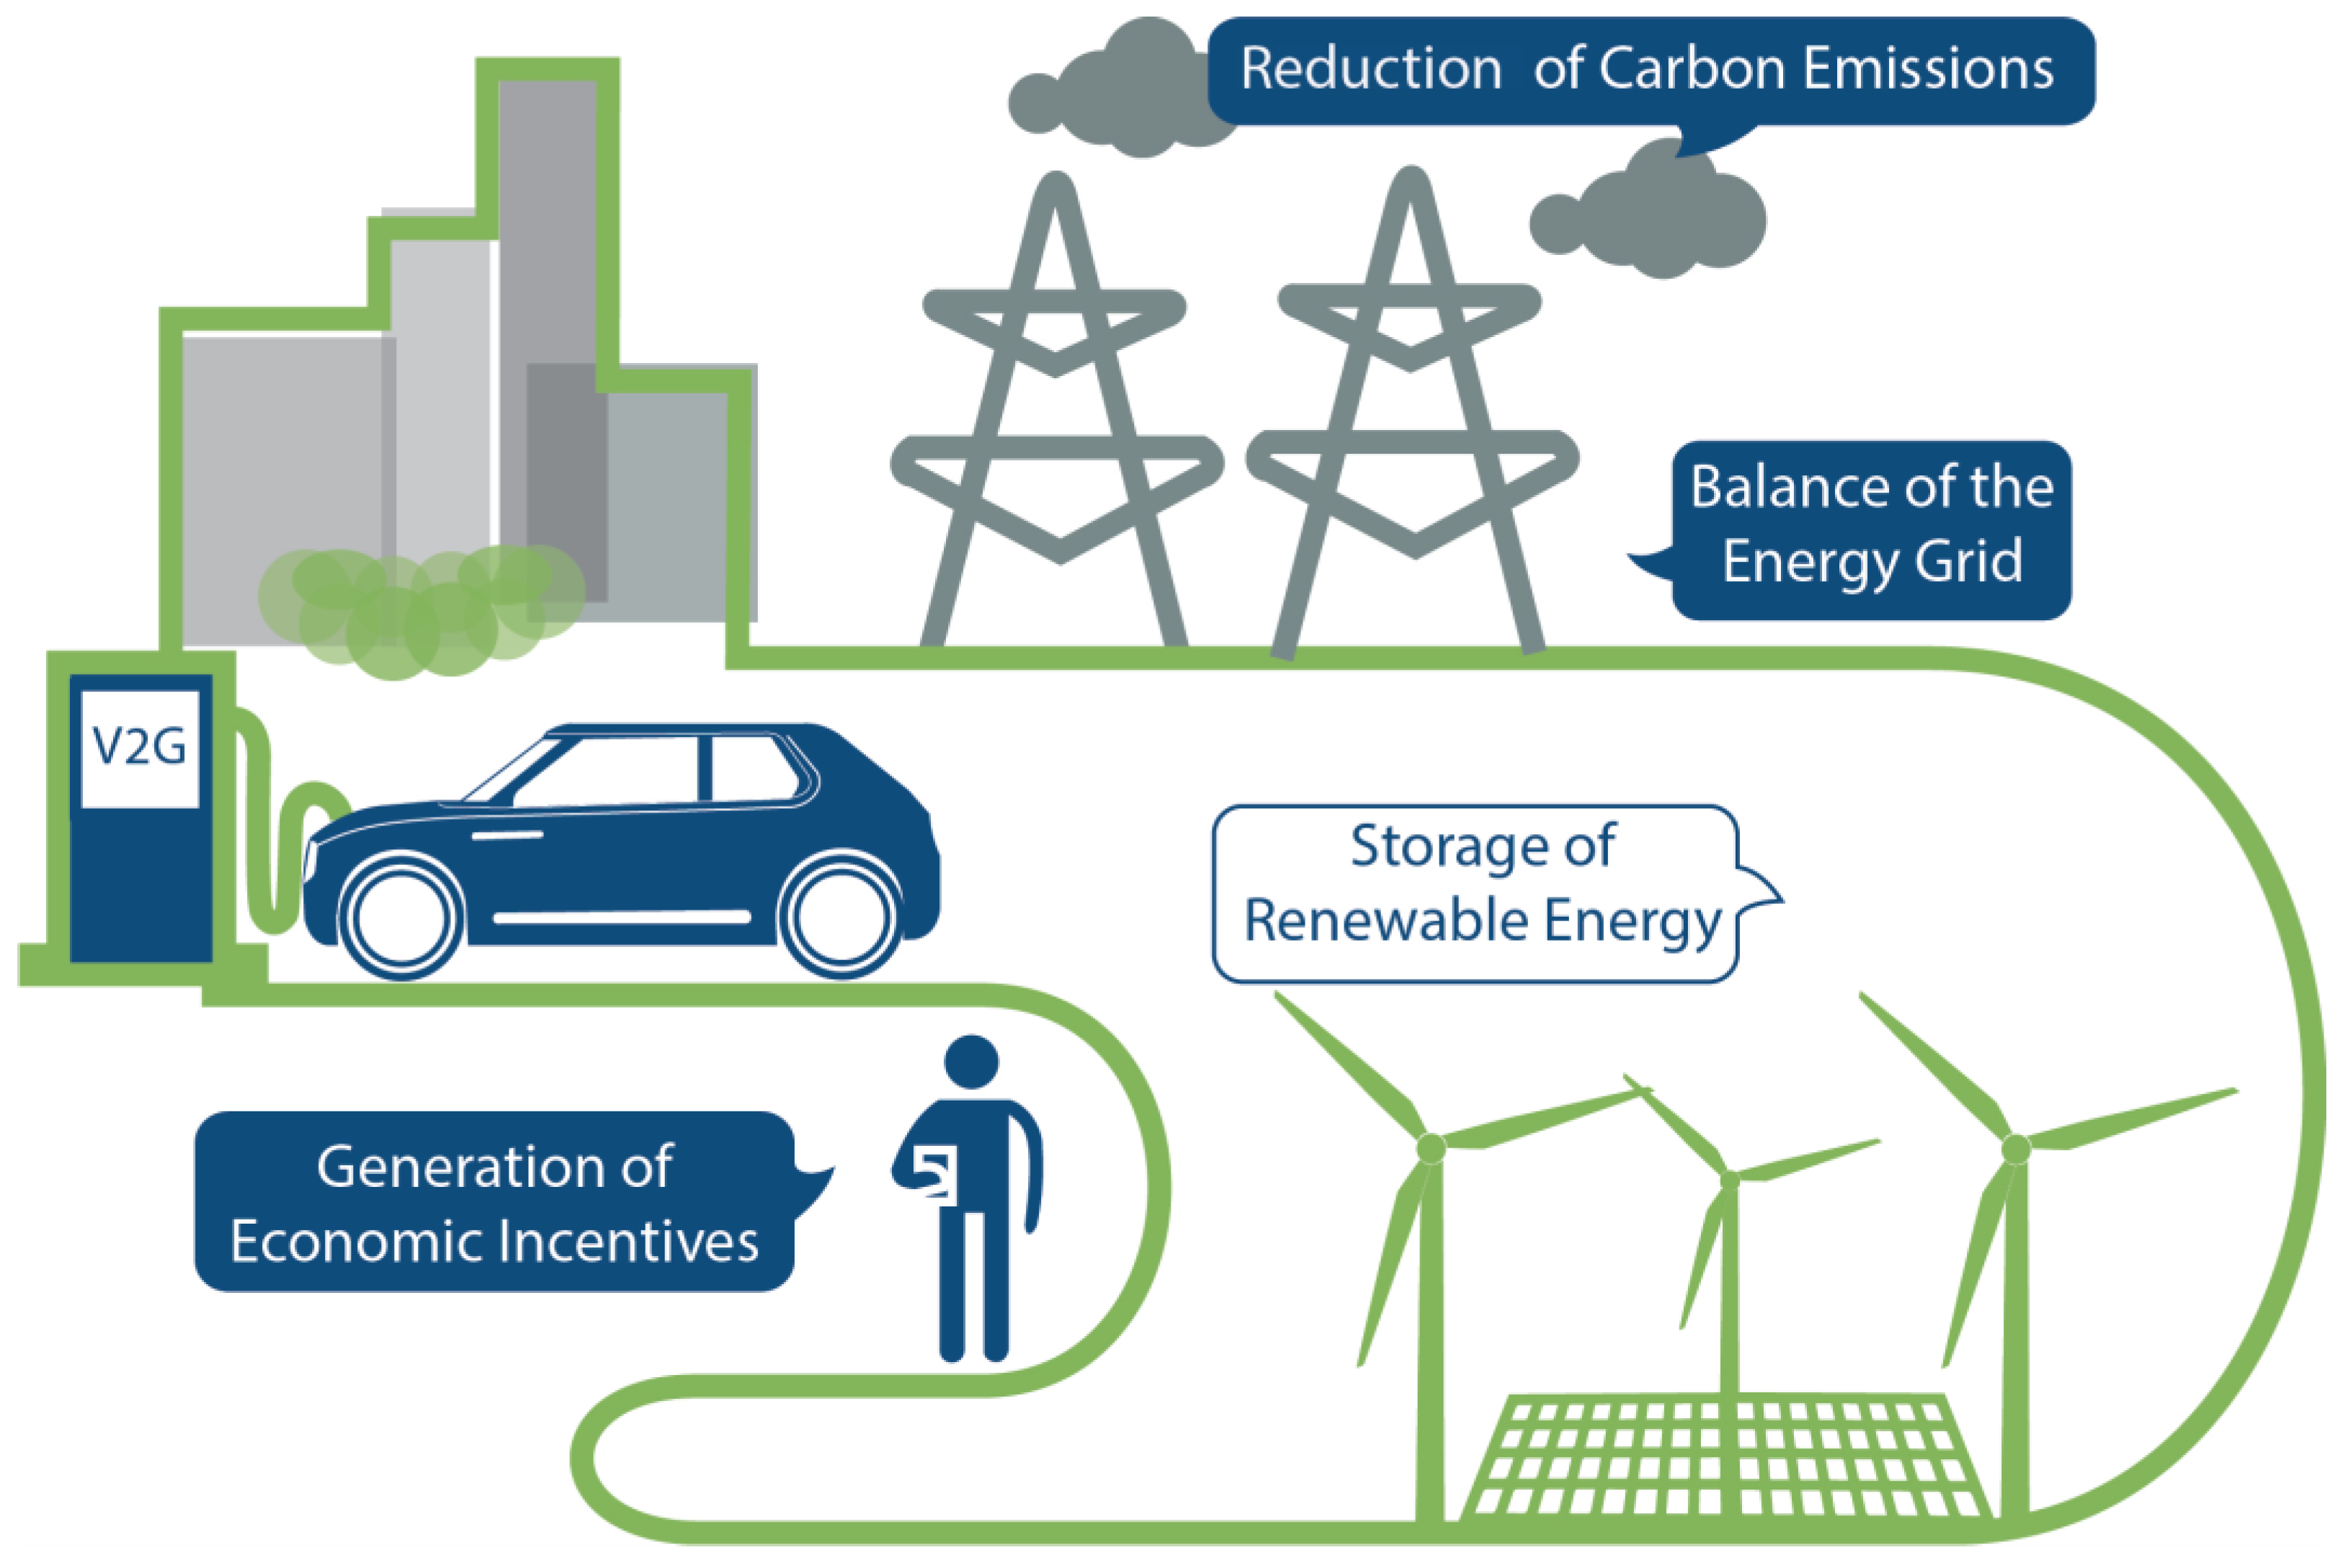
Figure 1.
Overview of the V2G architecture.
Figure 1.
Overview of the V2G architecture.
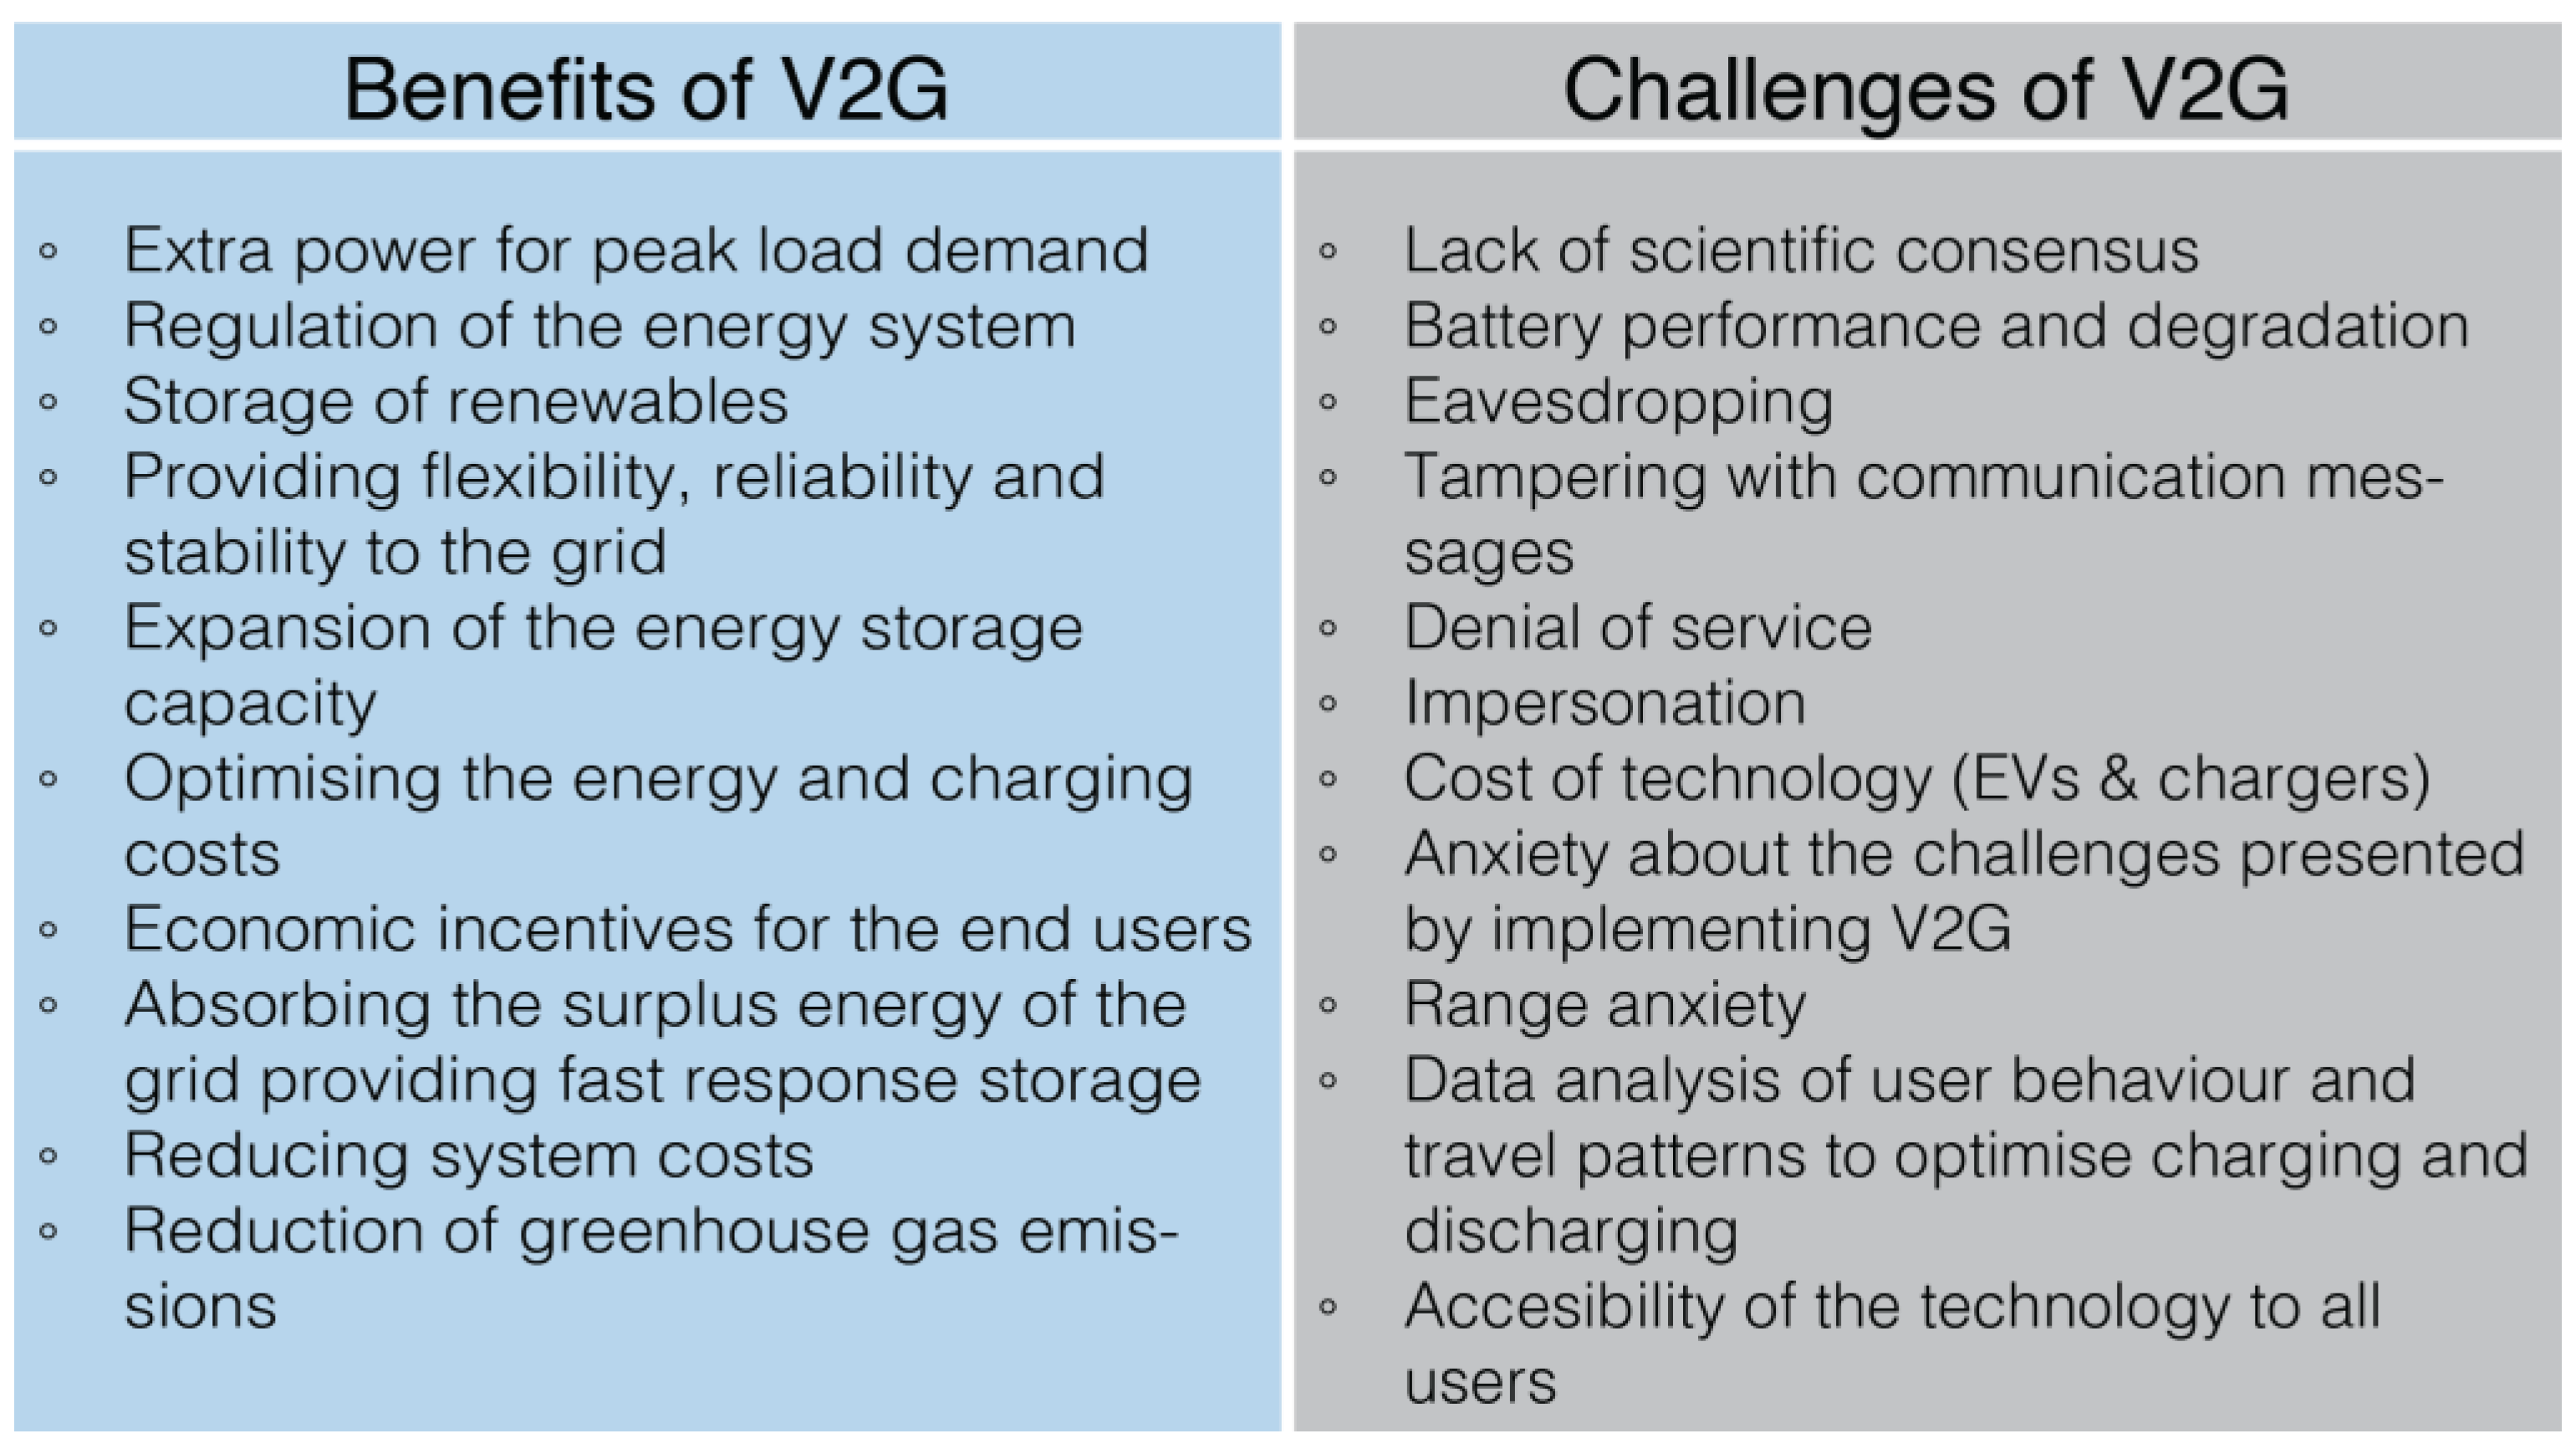
Figure 2.
Benefits and Challenges of V2G [
32,
33].
Figure 2.
Benefits and Challenges of V2G [
32,
33].
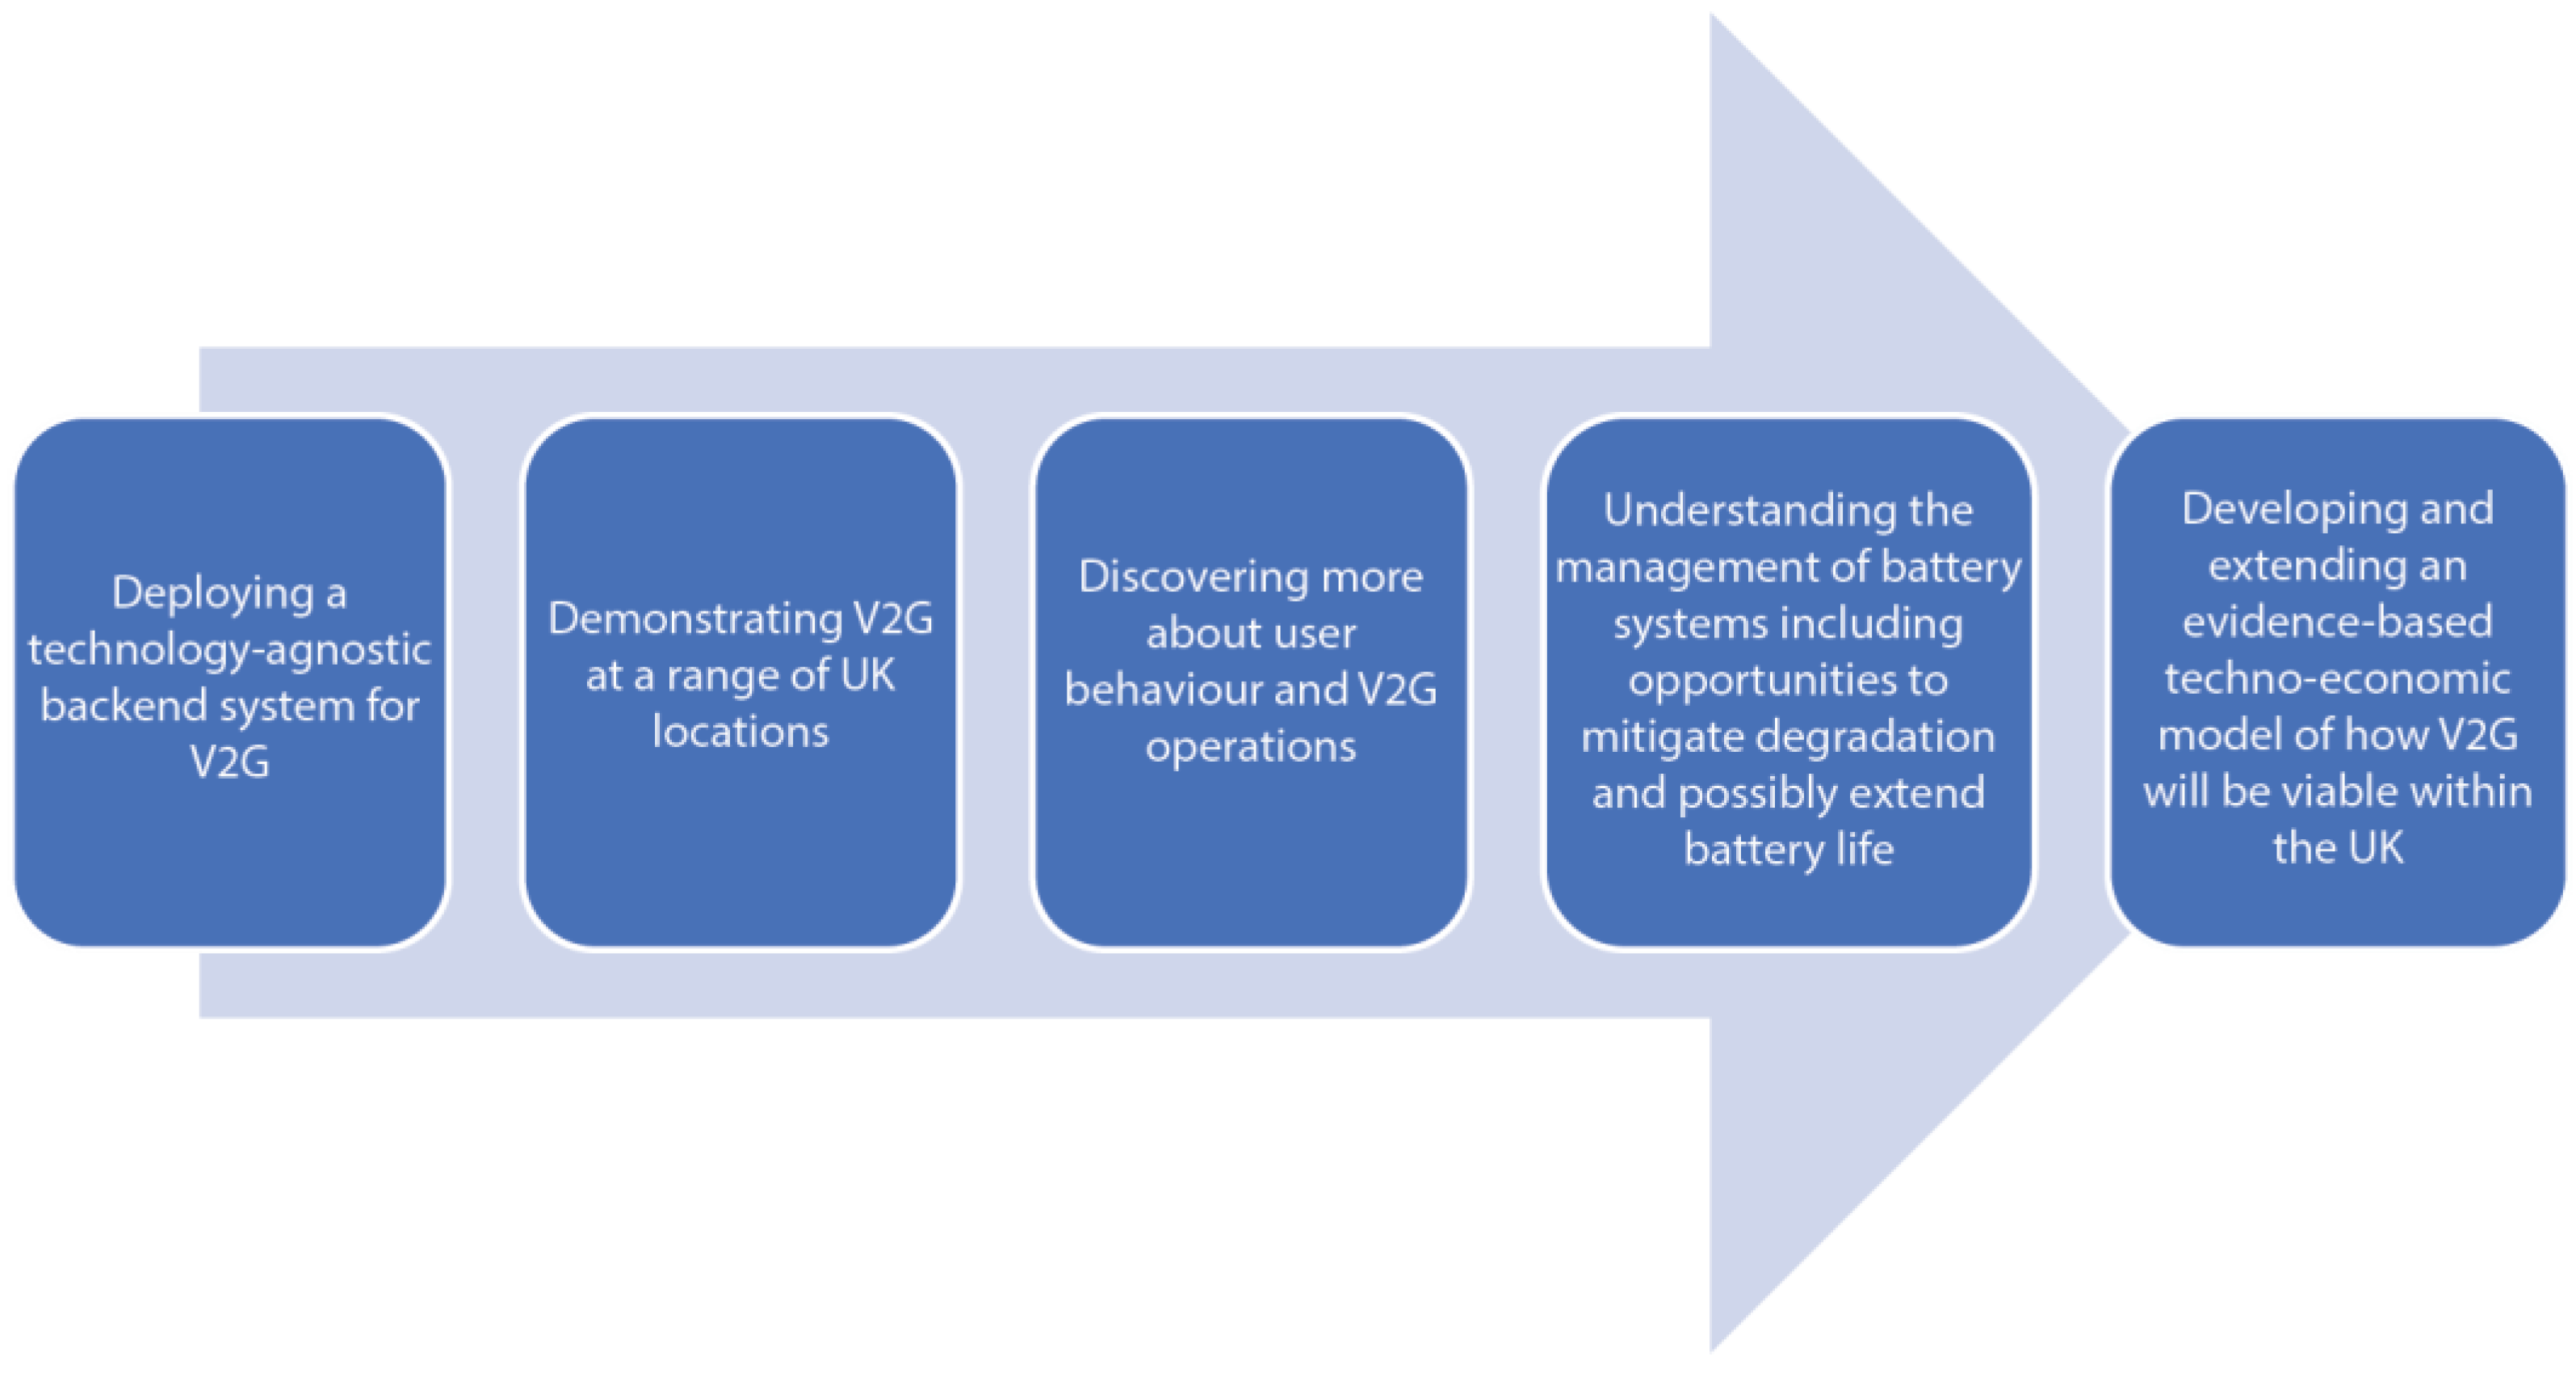
Figure 3.
Objectives of EV-elocity project [
35].
Figure 3.
Objectives of EV-elocity project [
35].
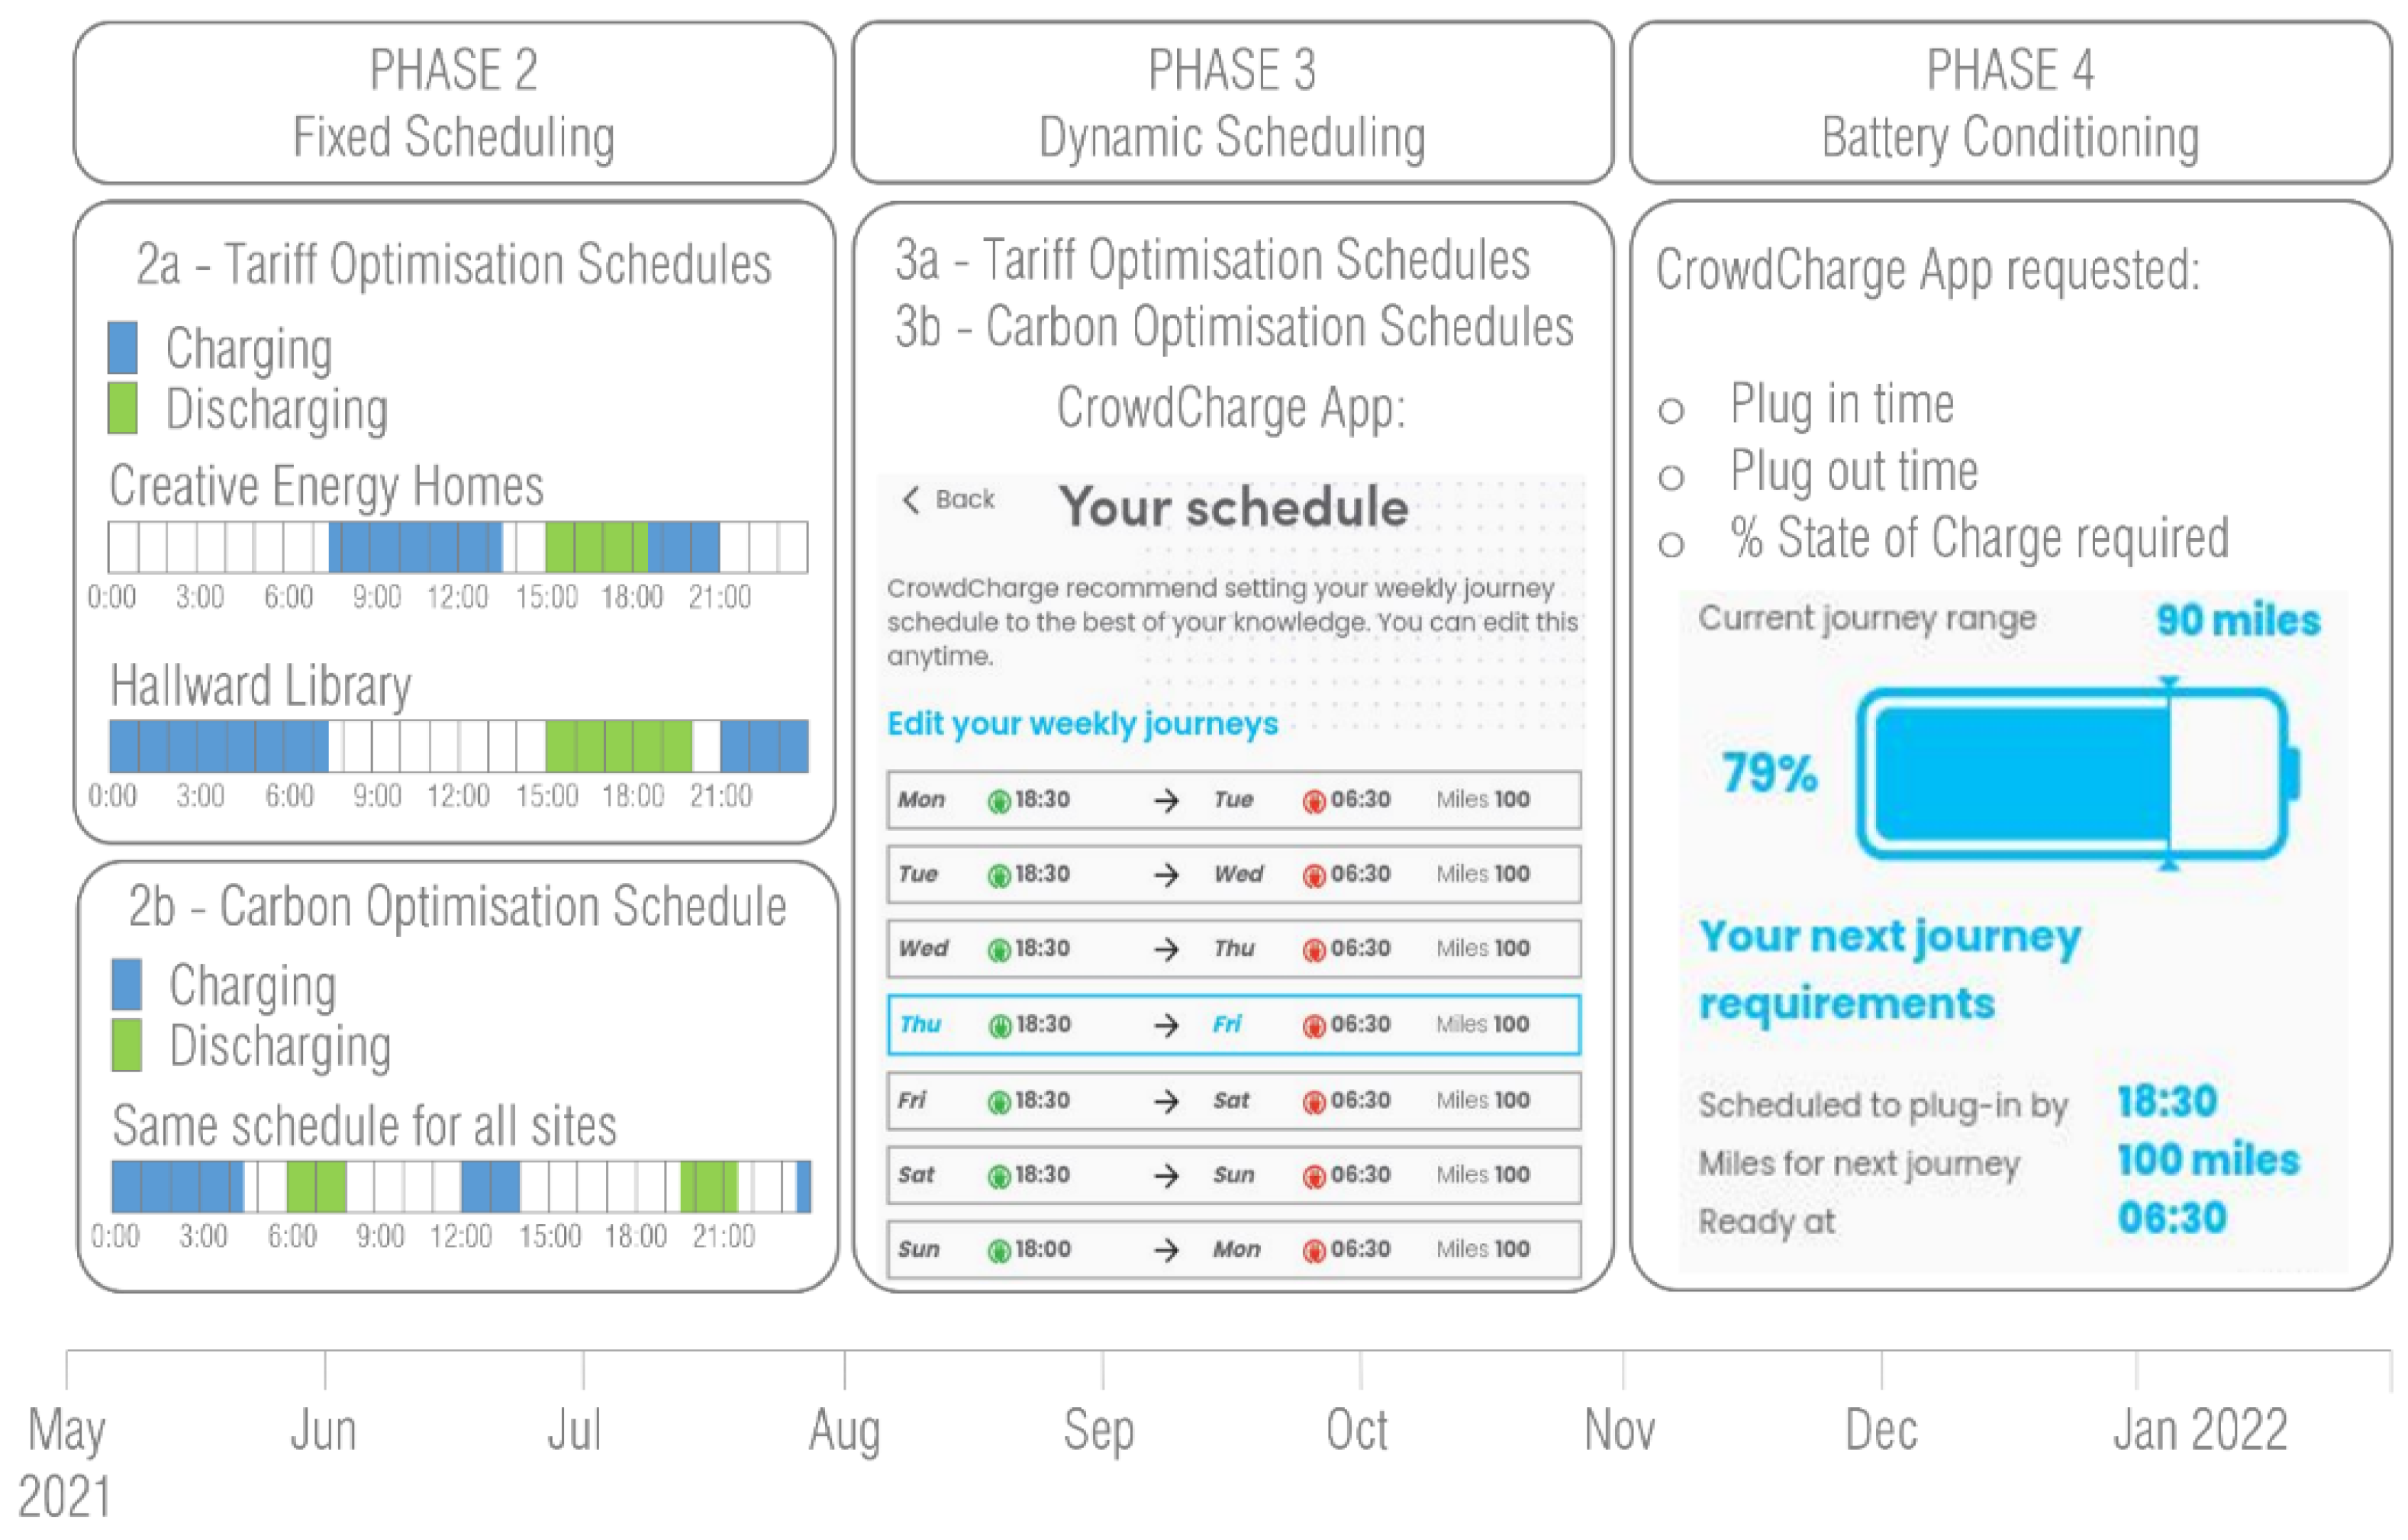
Figure 4.
Different trial phases of EV-elocity project [
35]. This figure only includes the phases of data collection; Phase 1 is not included as it was the time allocated for installing and testing the chargers.
Figure 4.
Different trial phases of EV-elocity project [
35]. This figure only includes the phases of data collection; Phase 1 is not included as it was the time allocated for installing and testing the chargers.
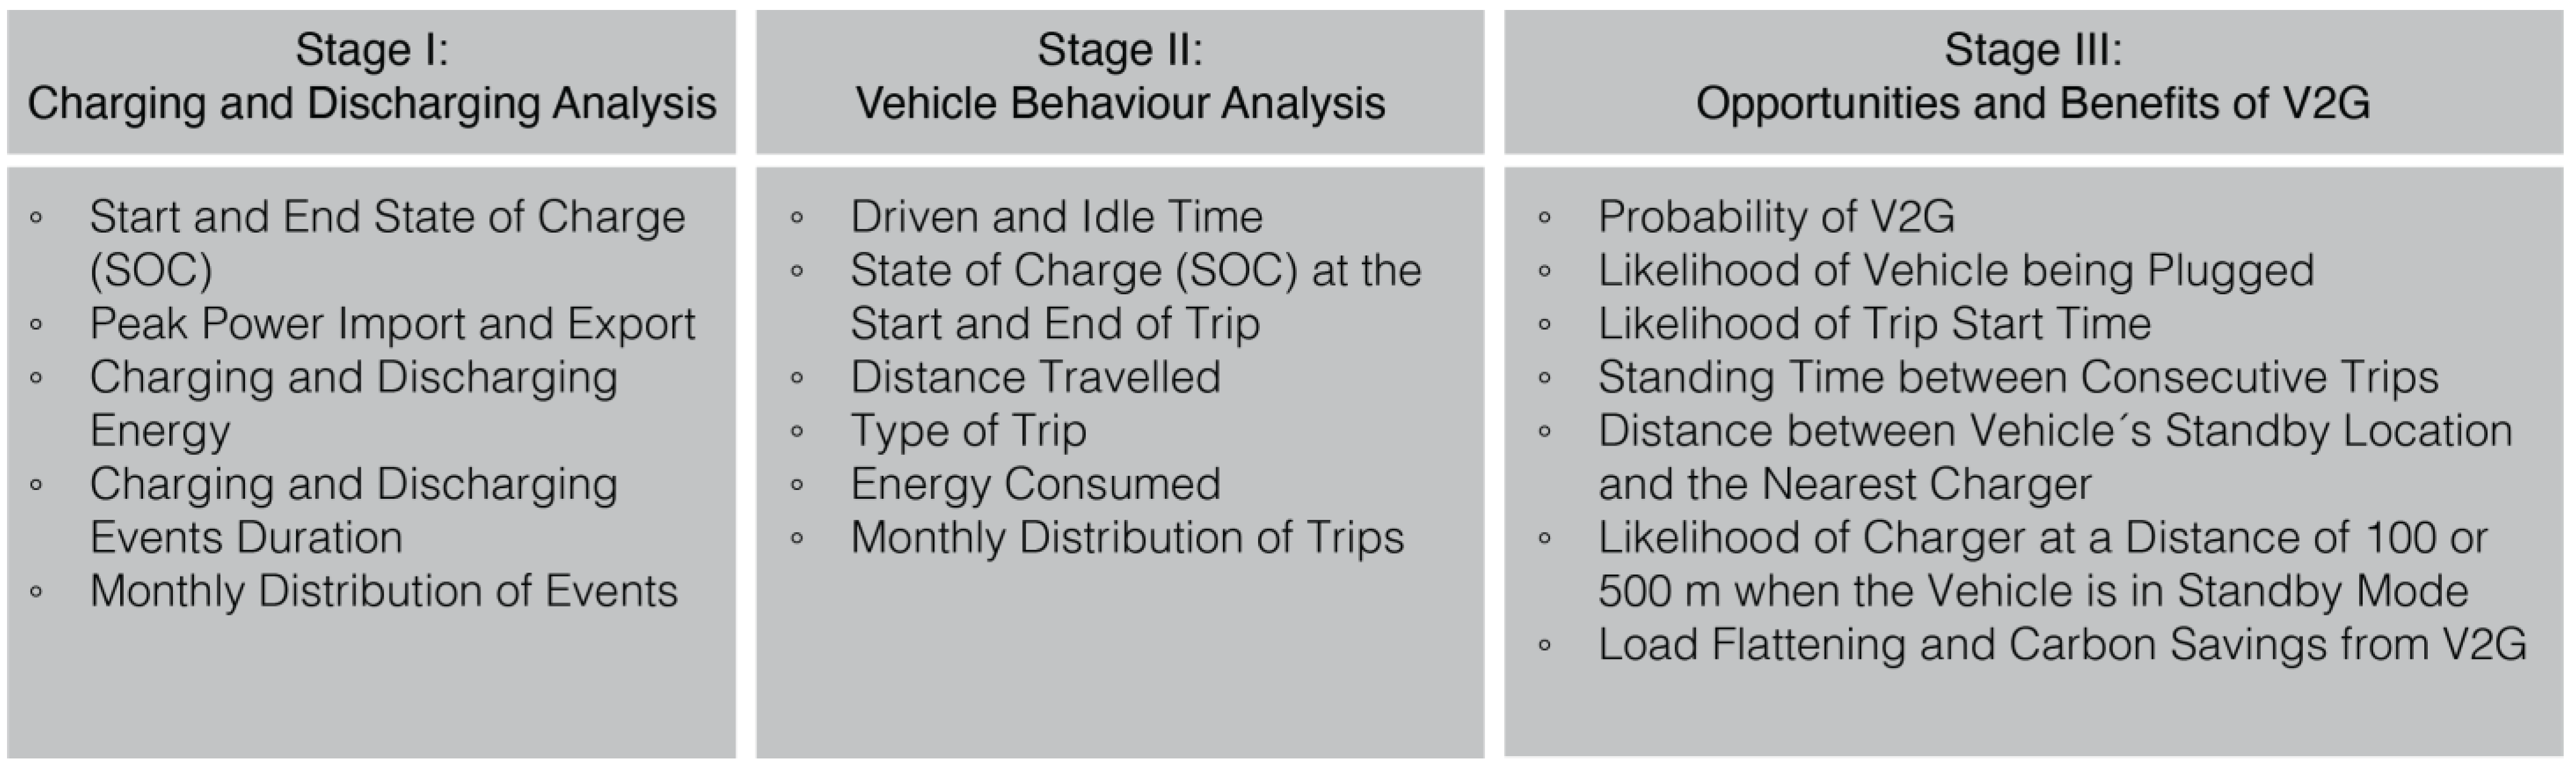
Figure 5.
Methodology illustrating the three stages.
Figure 5.
Methodology illustrating the three stages.
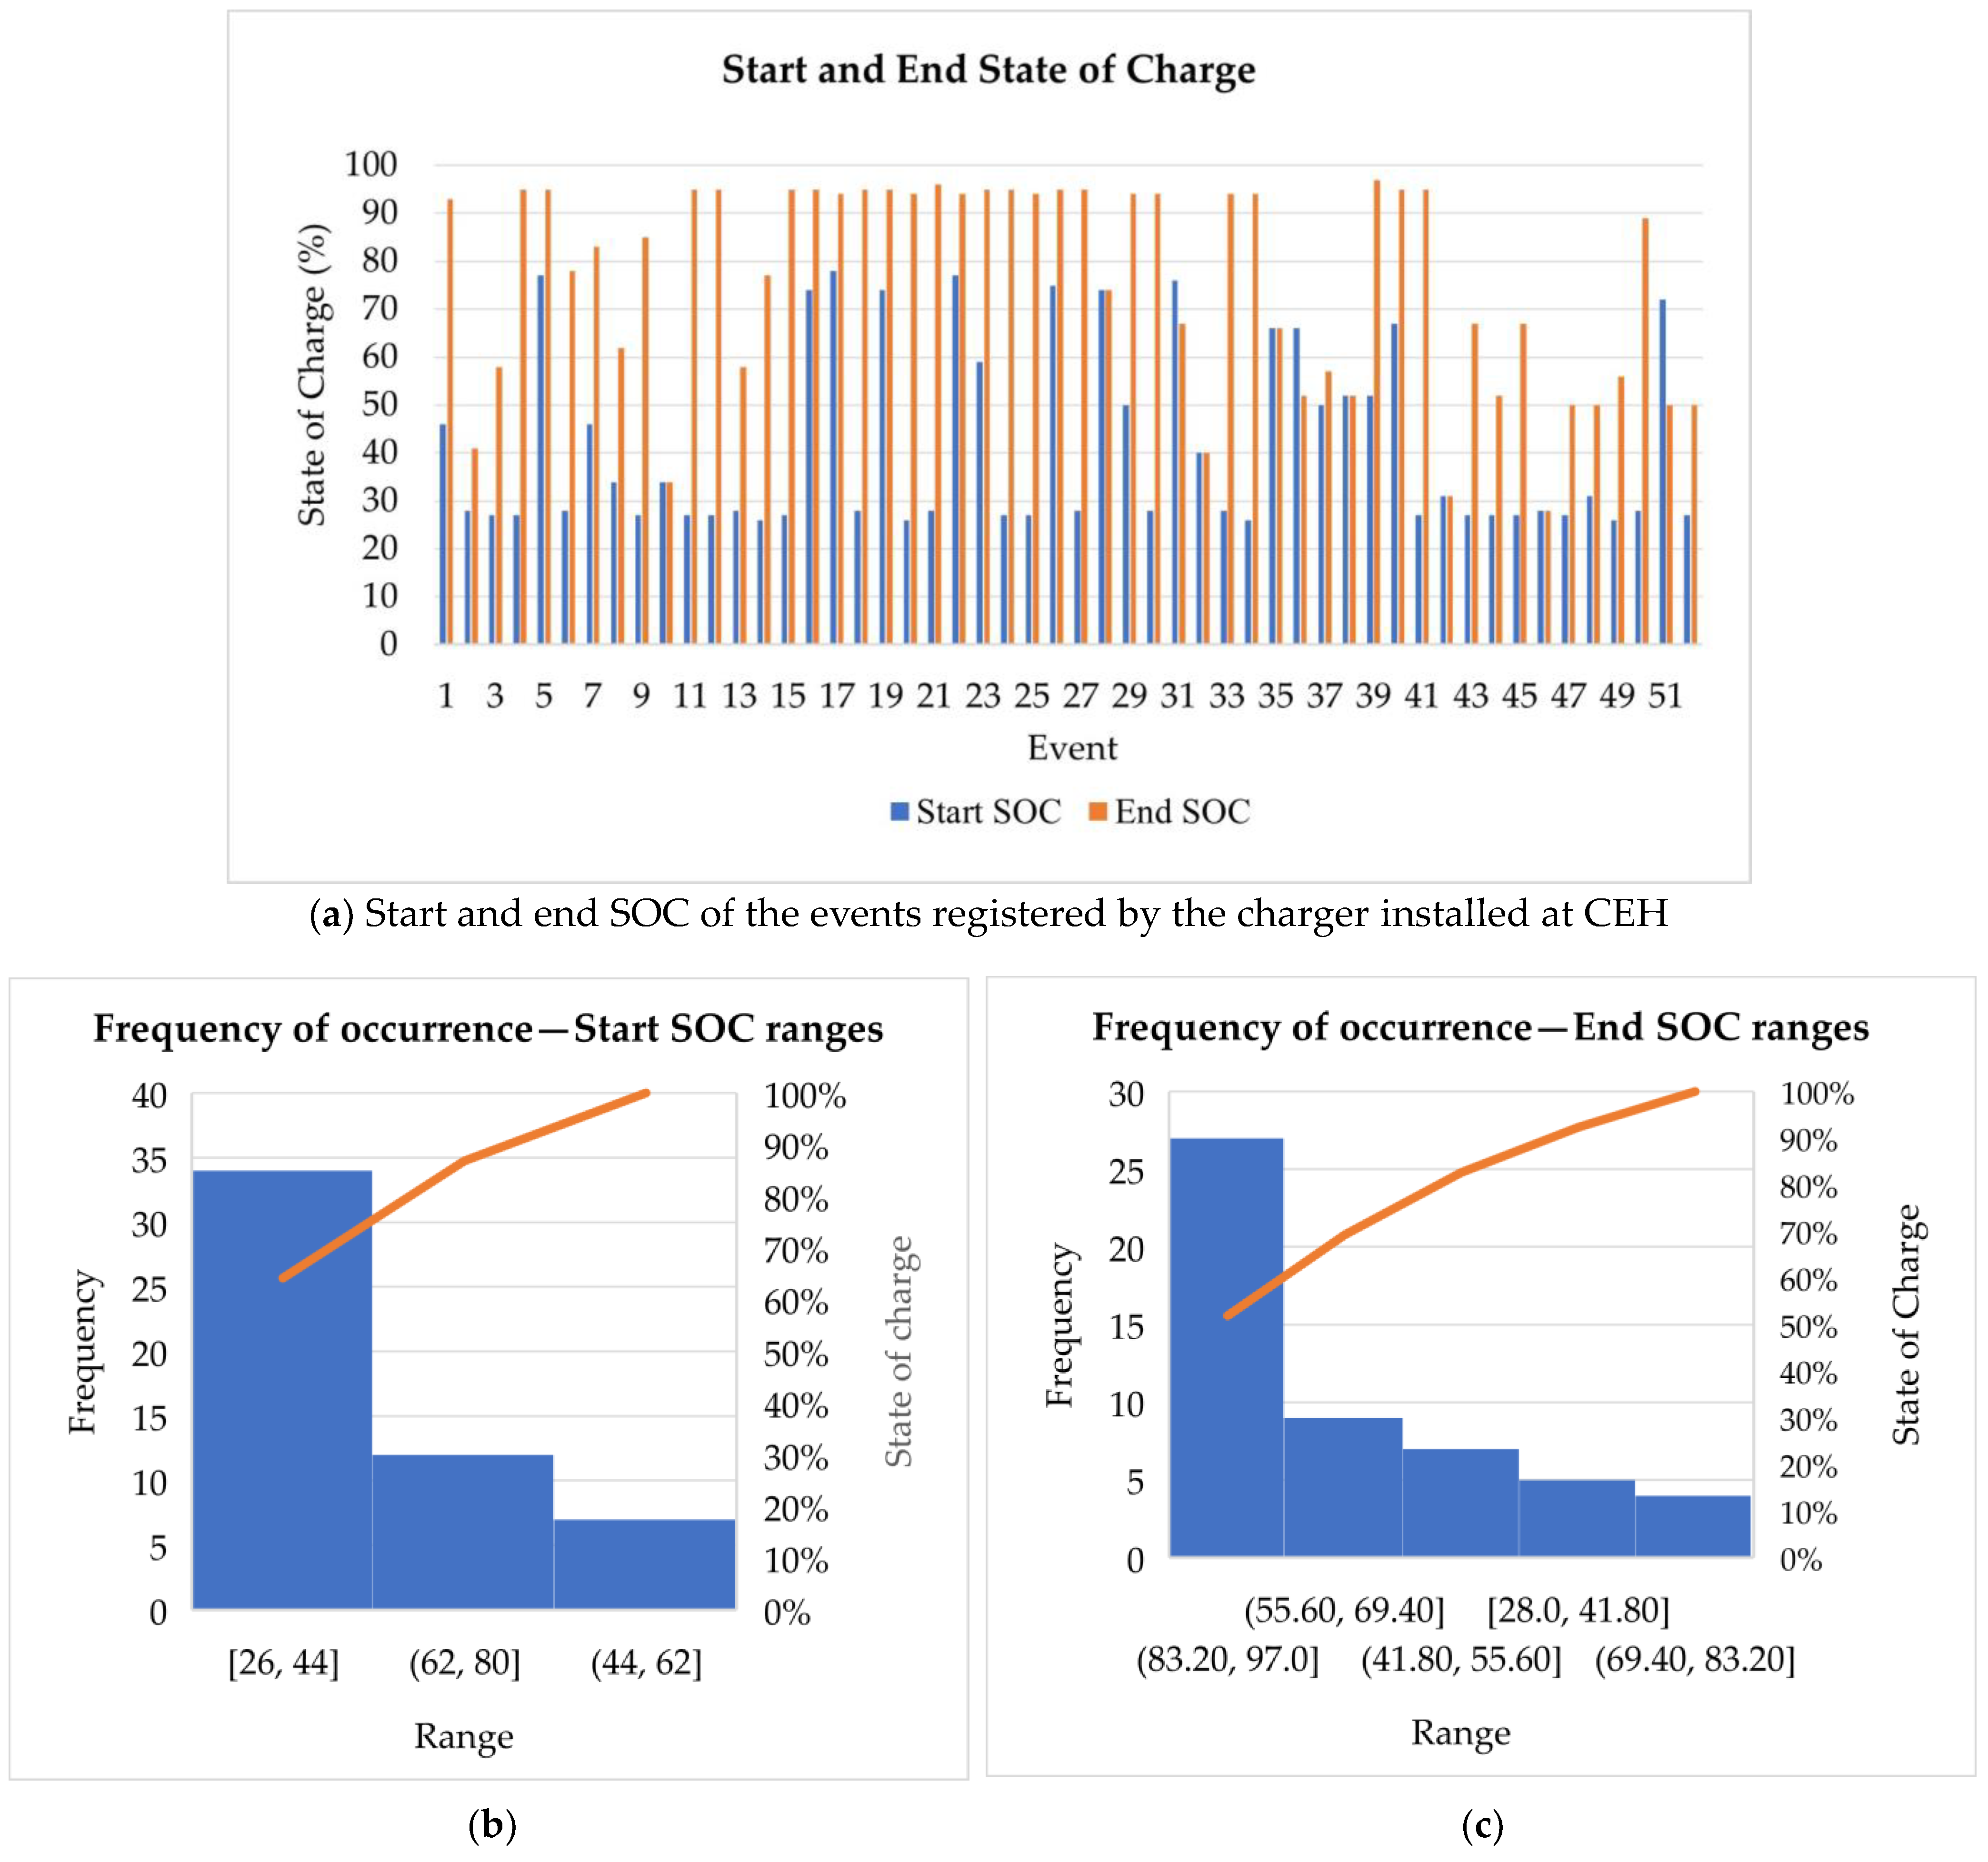
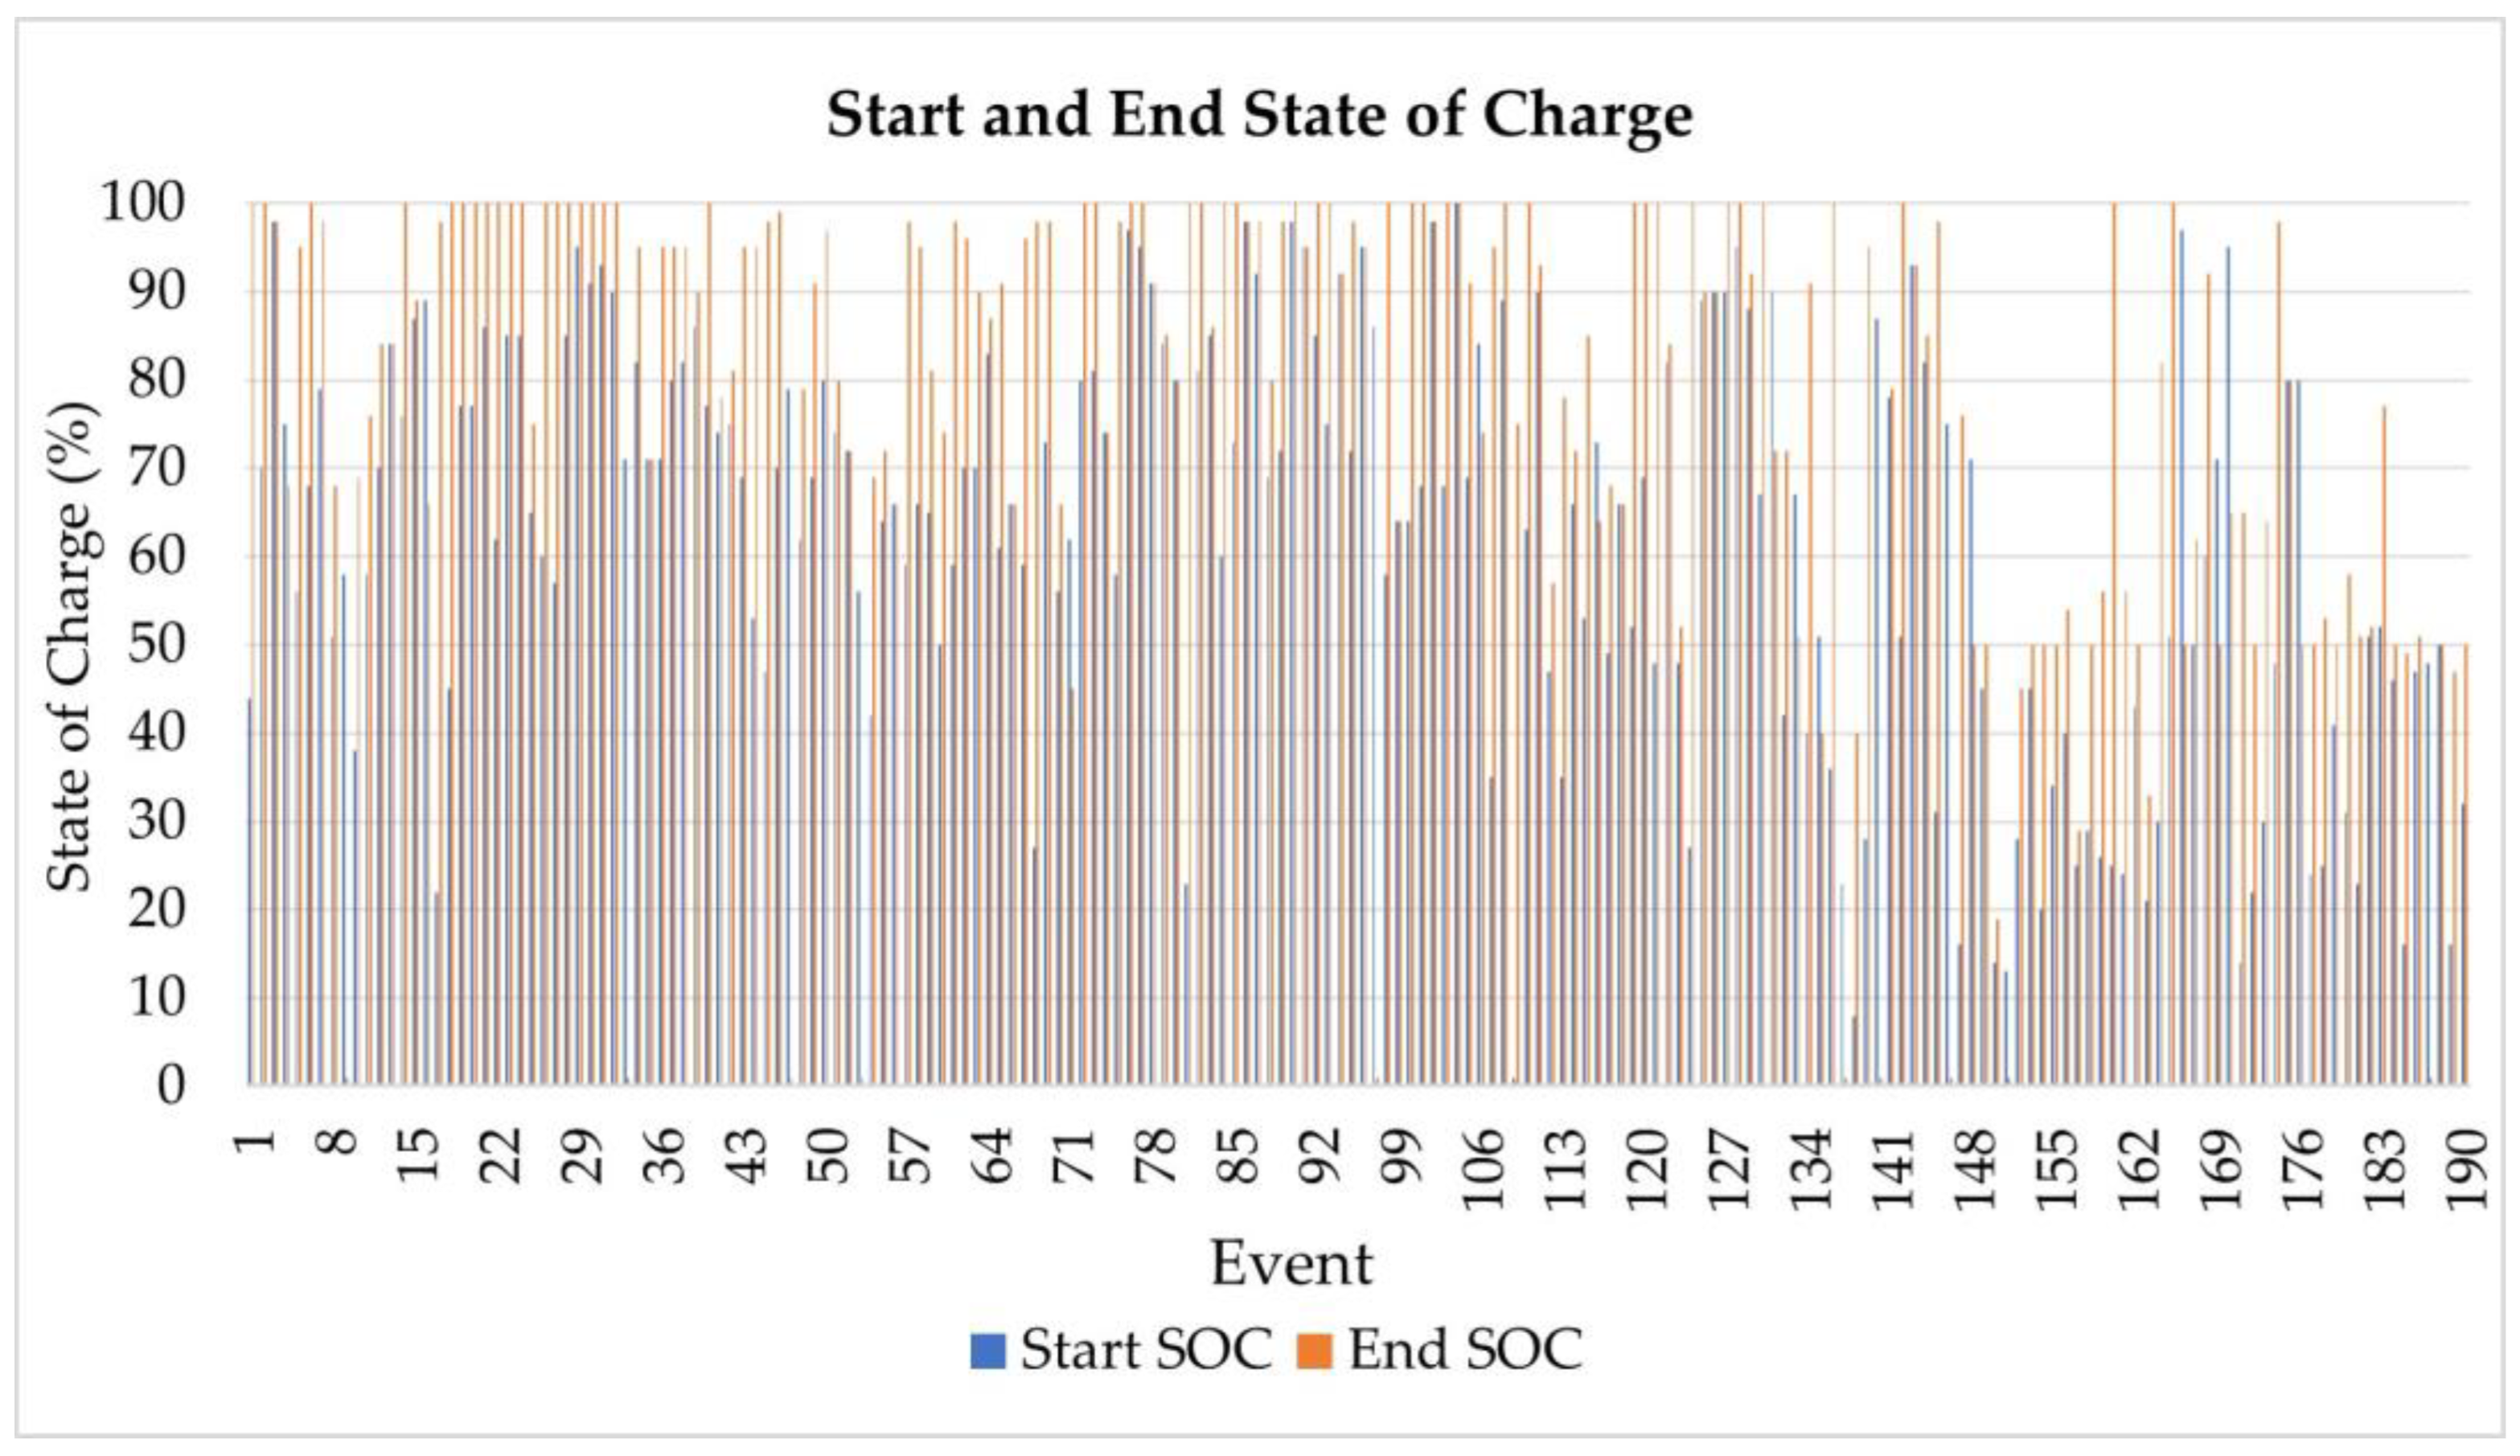
Figure 6.
Plot of Start and End State of Charge for the events at CEH (a) and the pareto charts showing the Frequency of Occurrence of the Start and End SOC at different ranges, with each column representing a range of SOC (b,c).
Figure 6.
Plot of Start and End State of Charge for the events at CEH (a) and the pareto charts showing the Frequency of Occurrence of the Start and End SOC at different ranges, with each column representing a range of SOC (b,c).
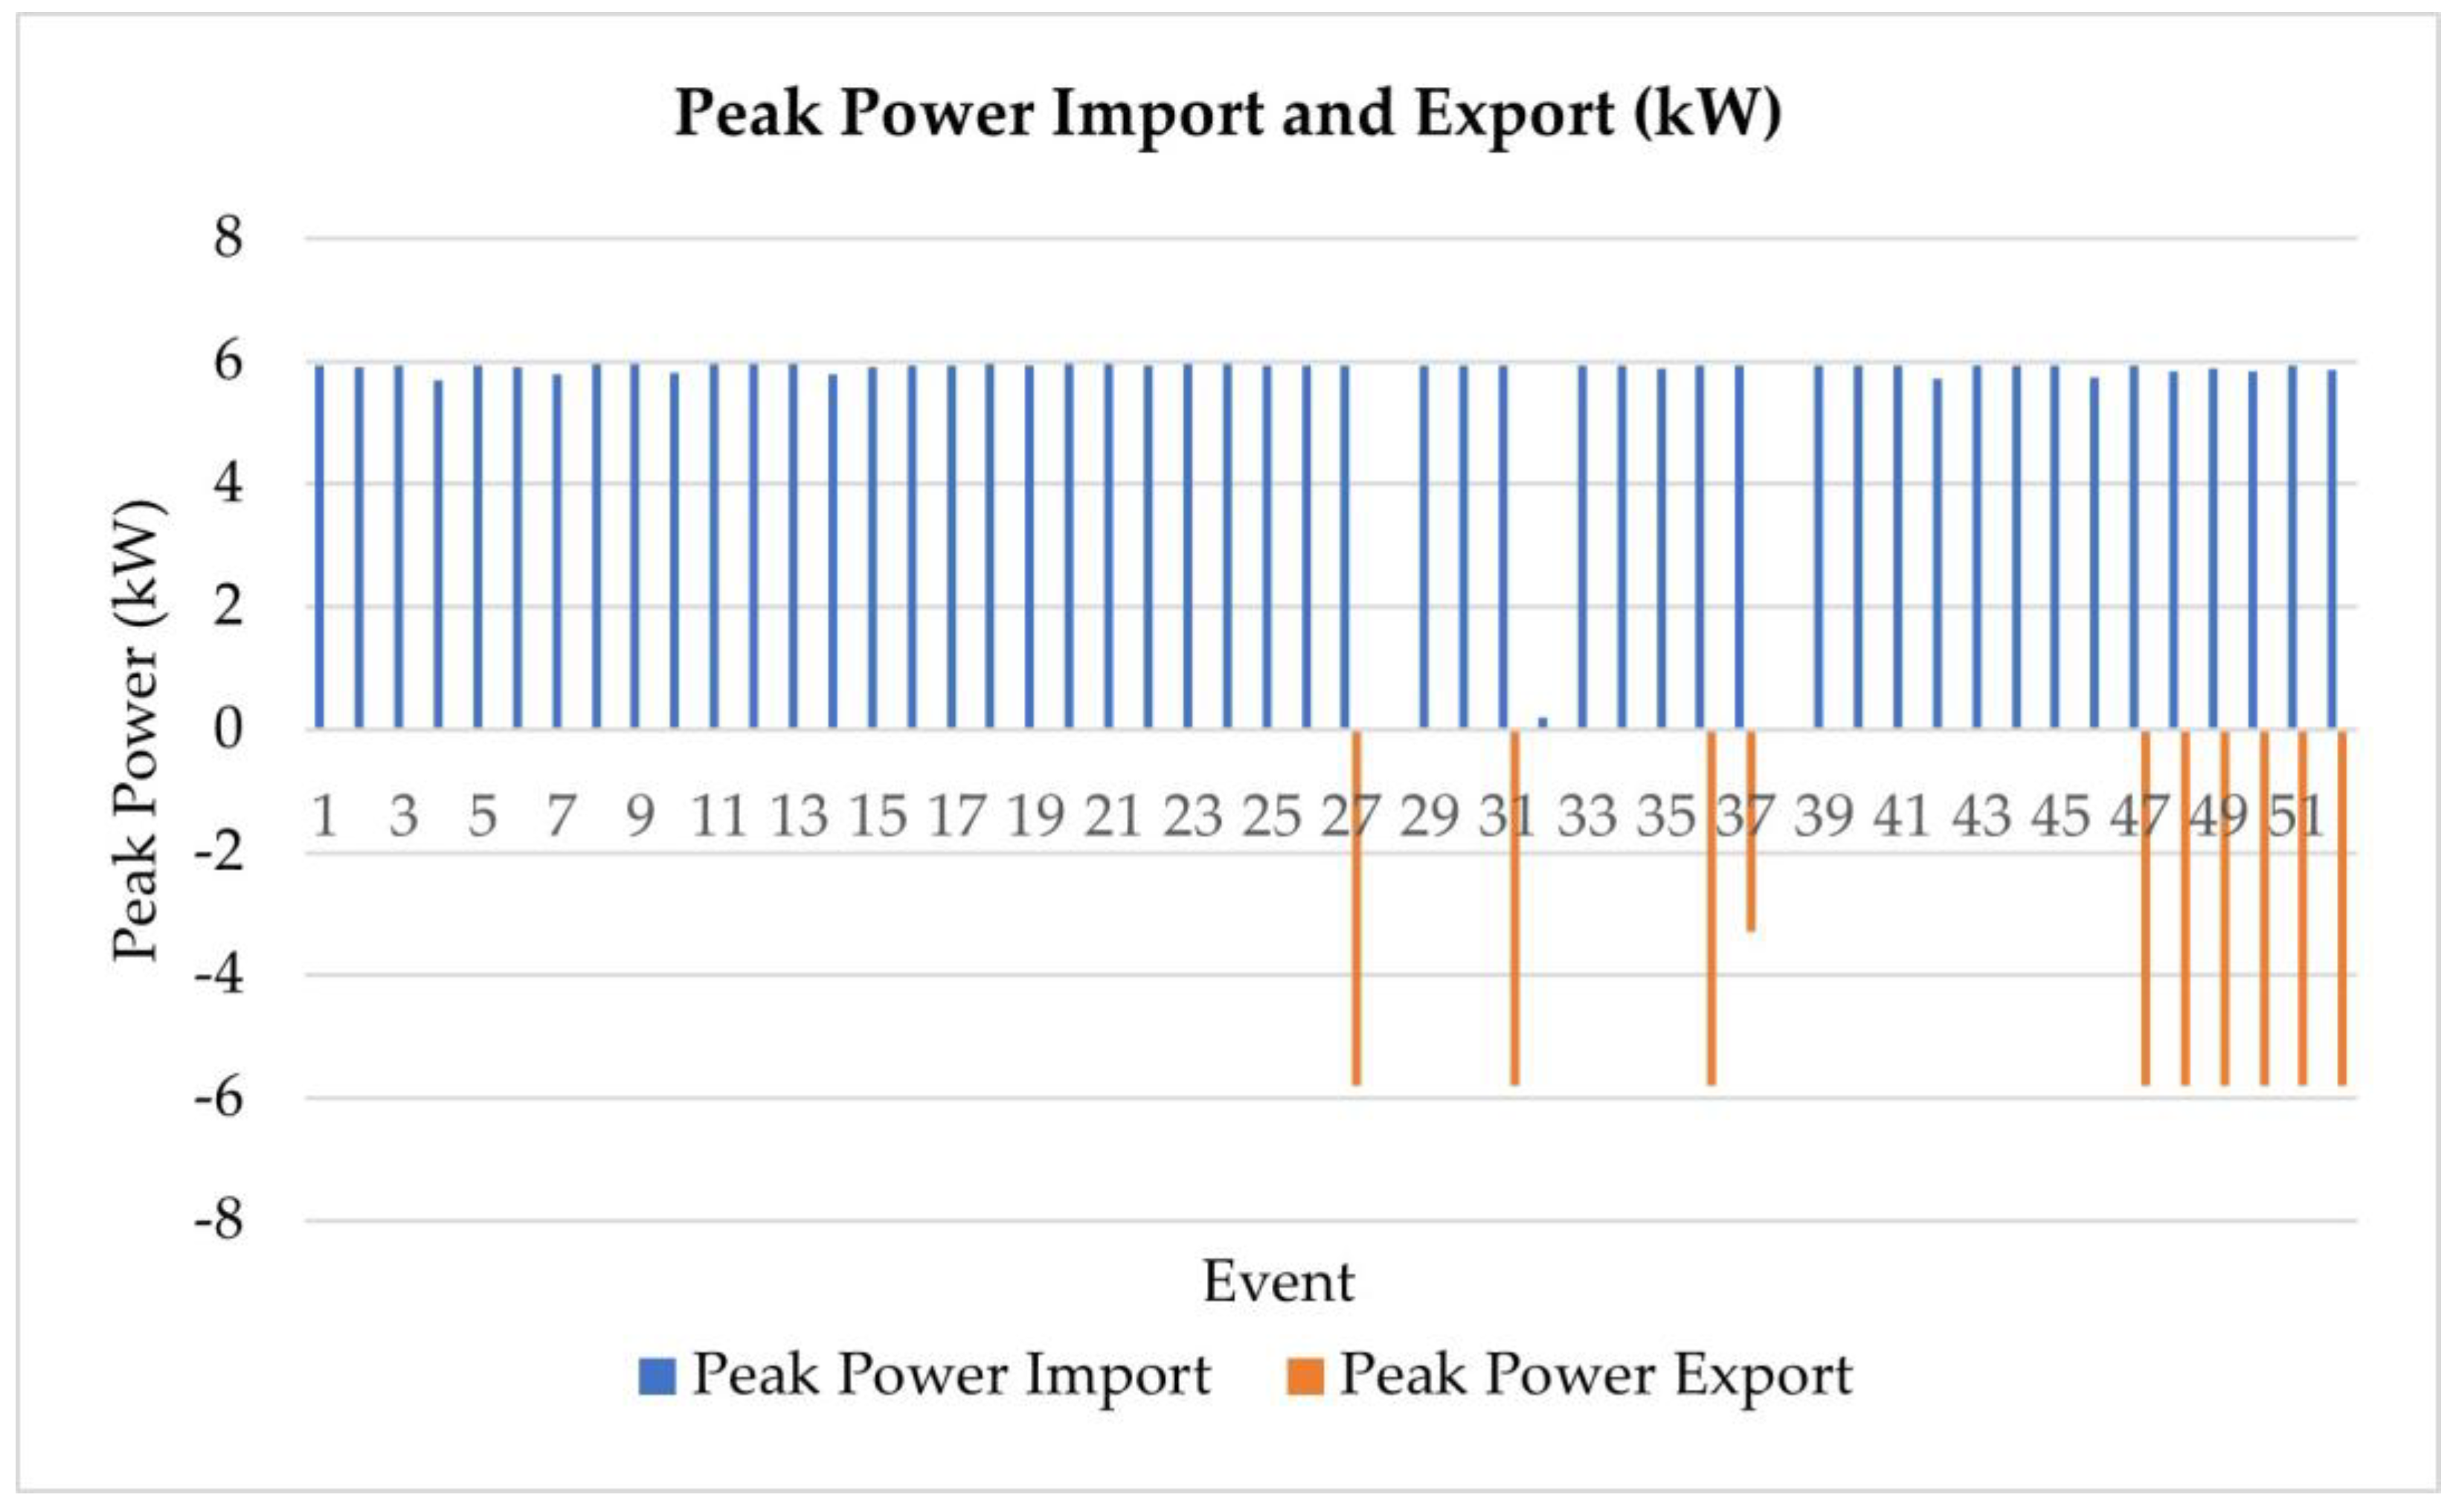
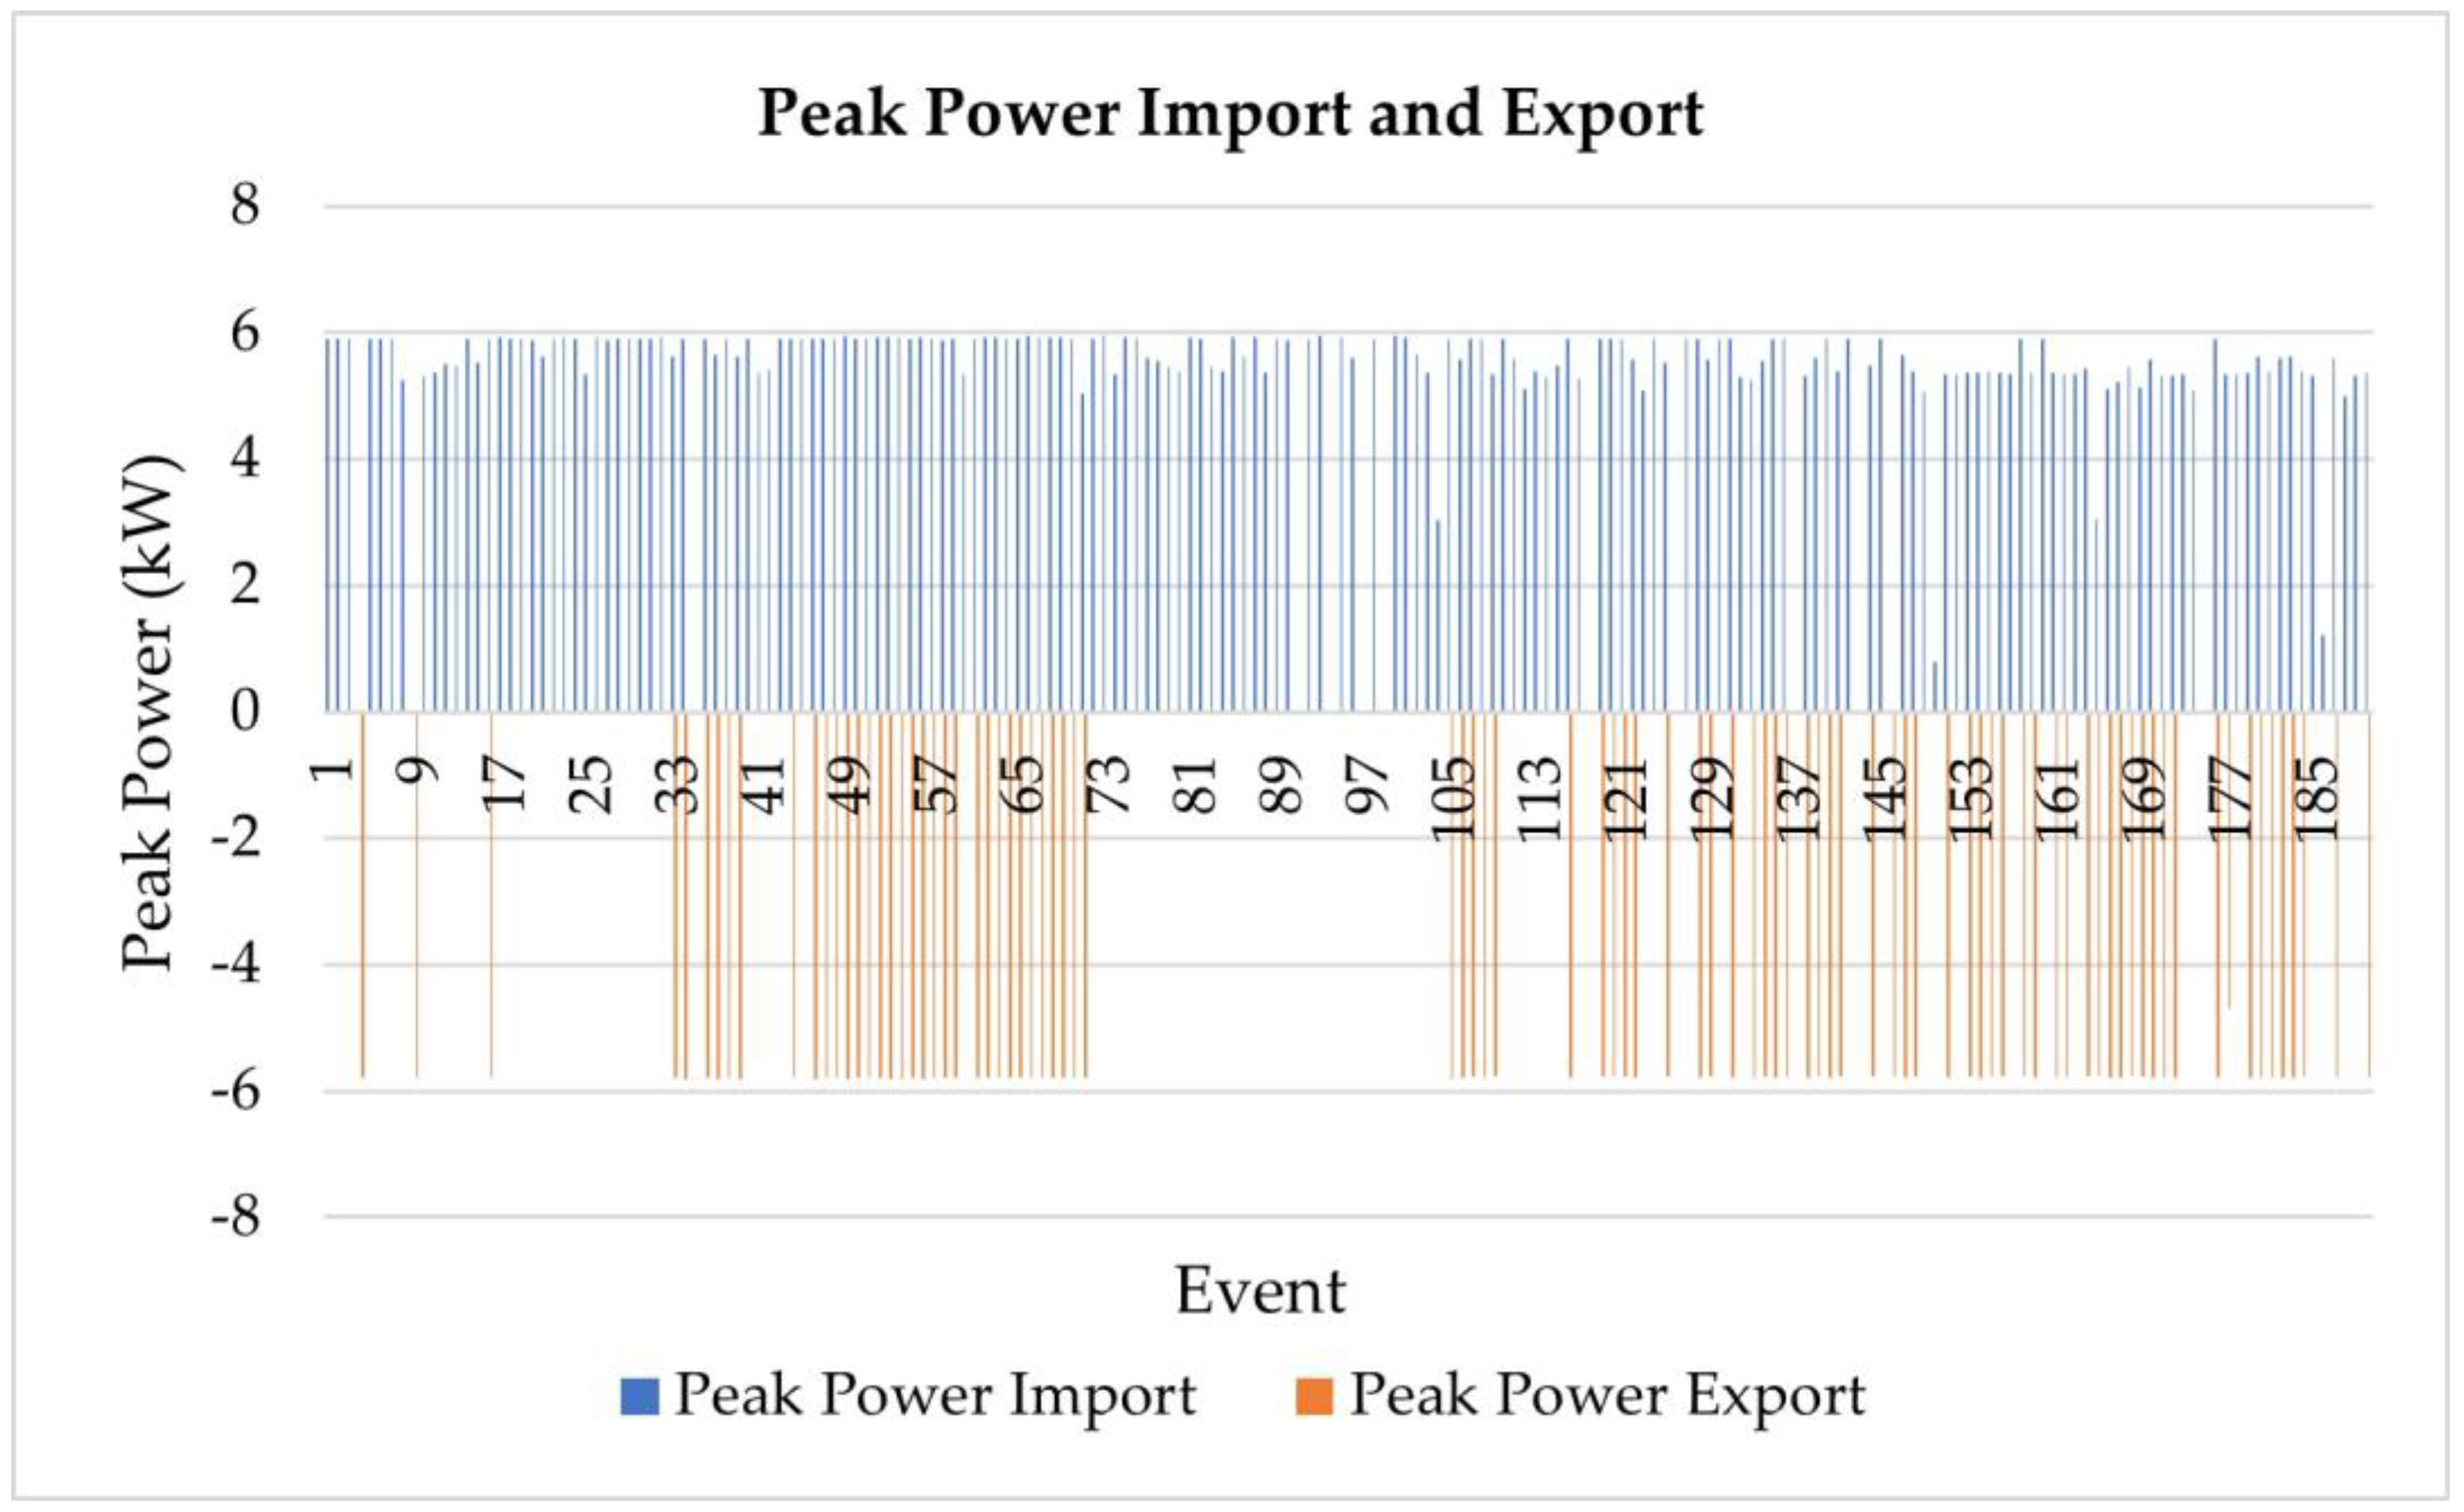
Figure 7.
Plot of peak power import and export for the events registered by the charger at Creative Energy Homes.
Figure 7.
Plot of peak power import and export for the events registered by the charger at Creative Energy Homes.
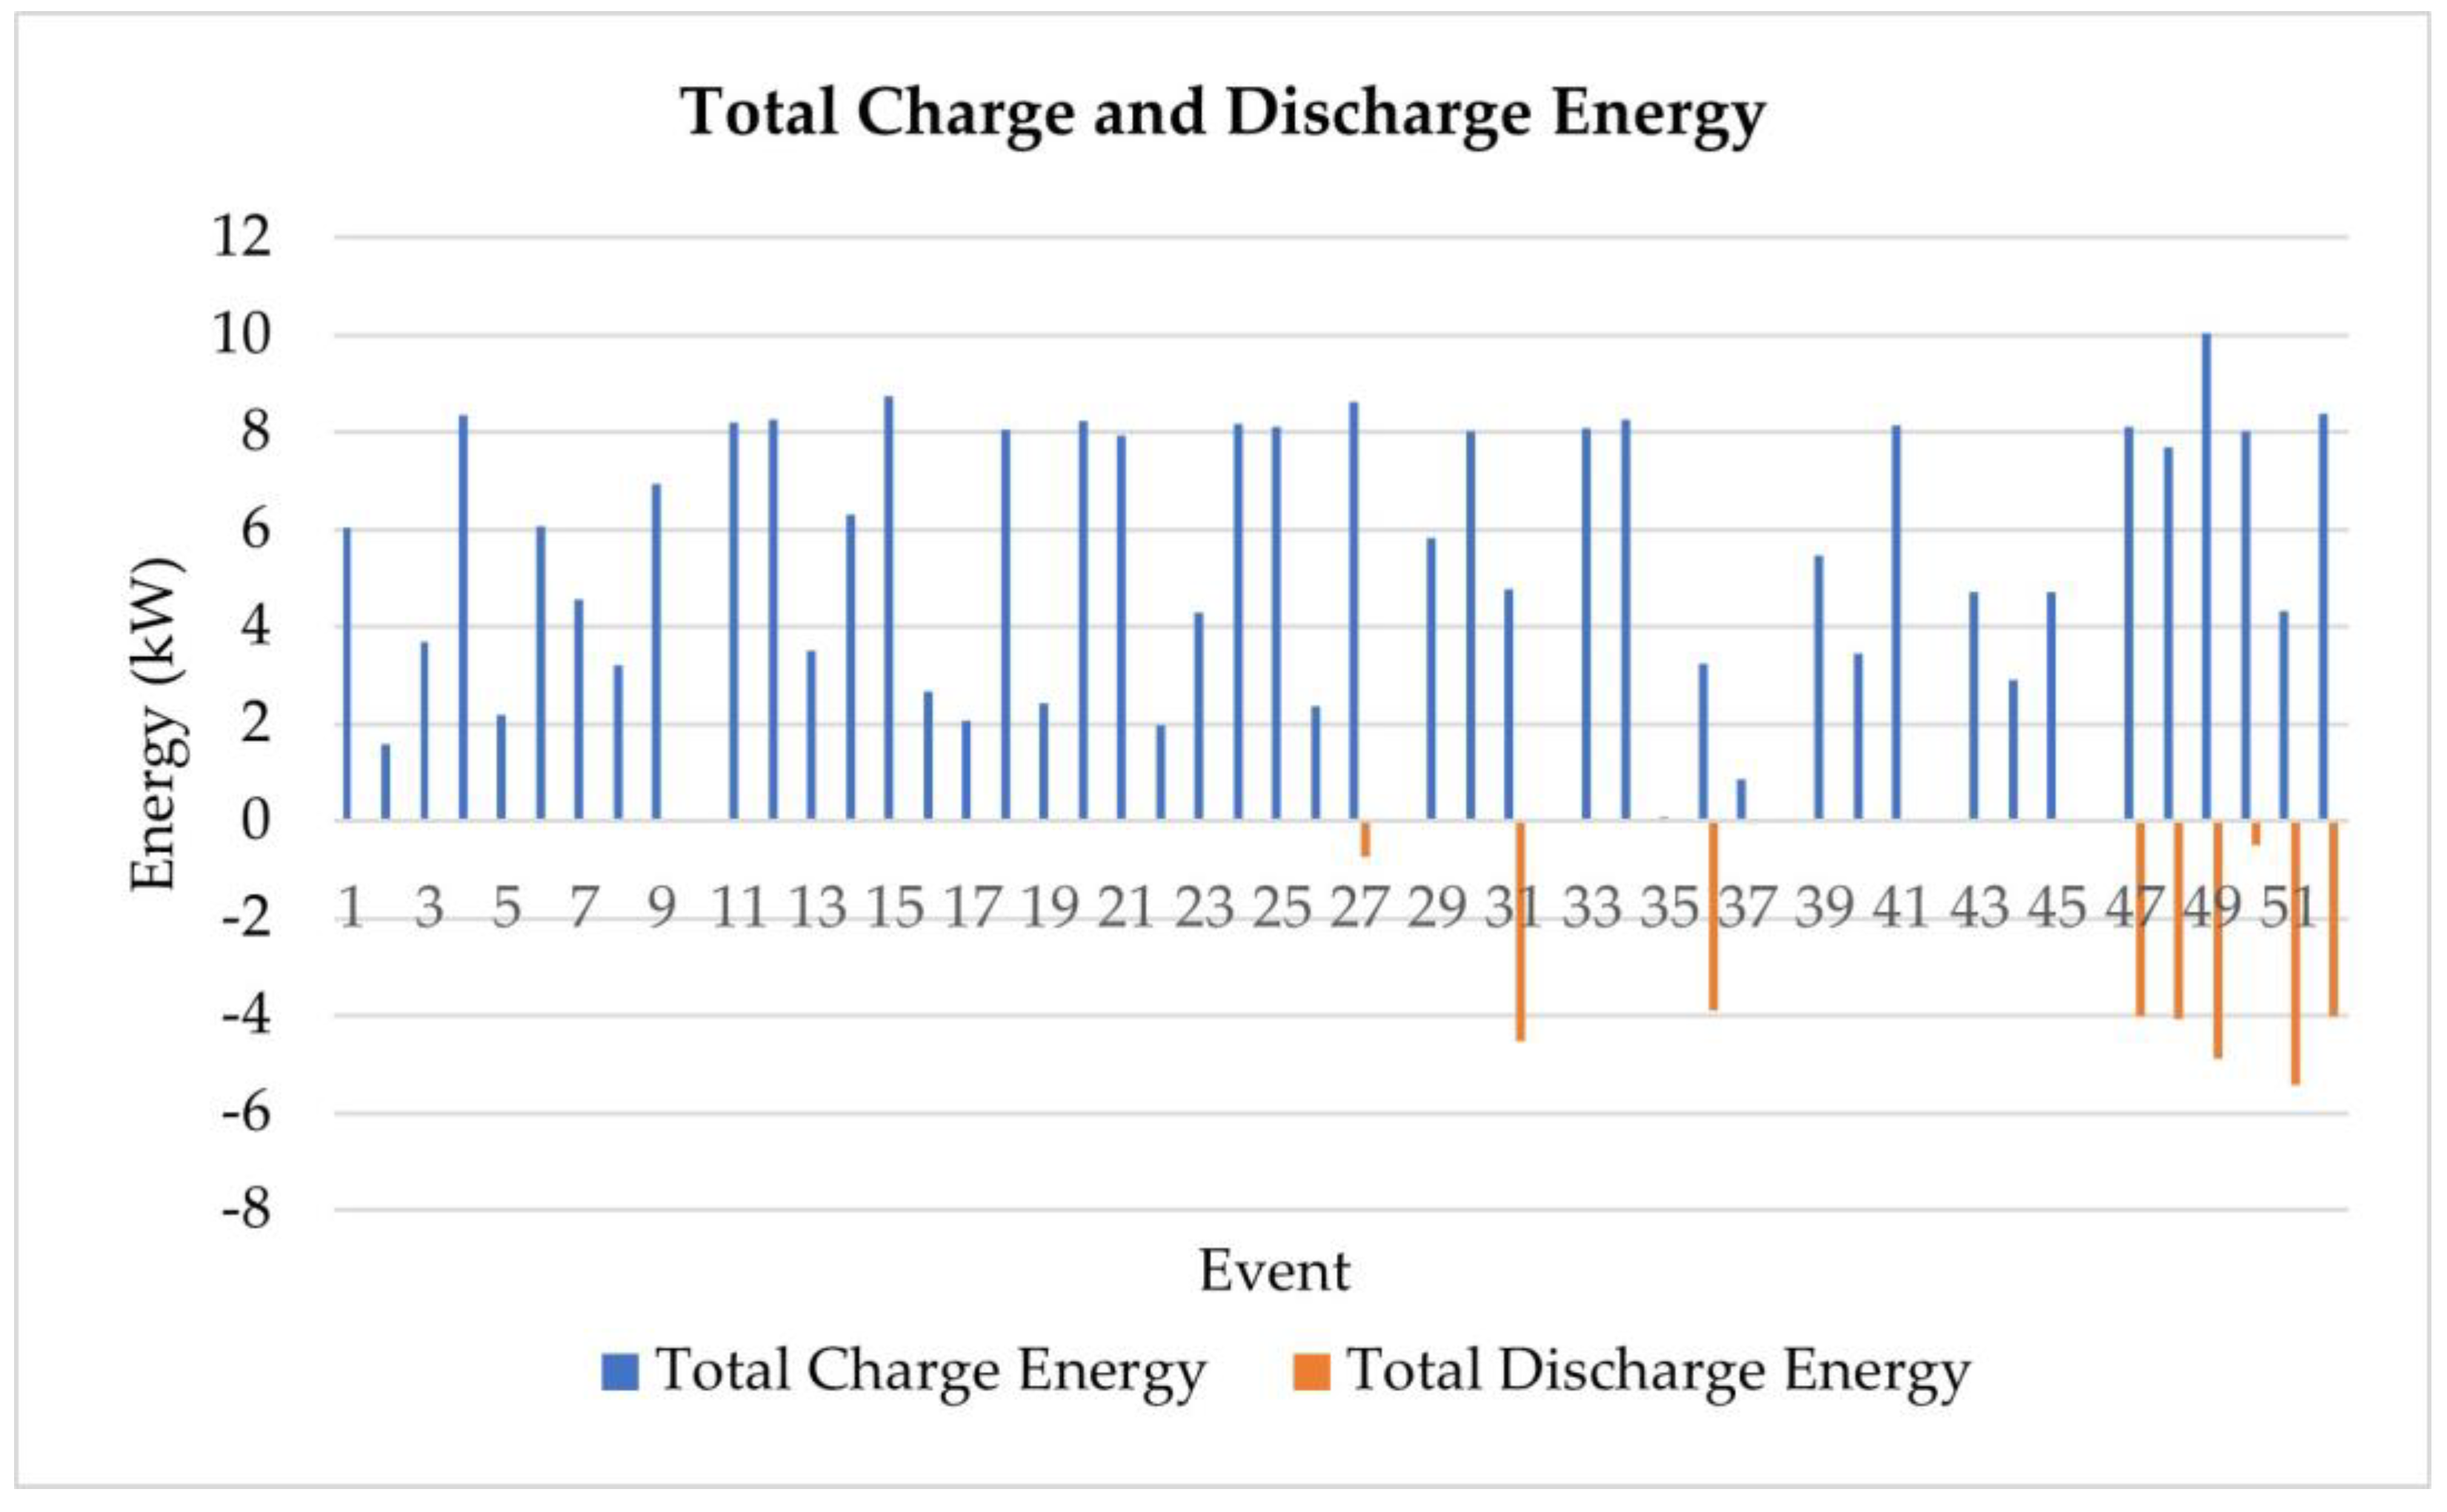
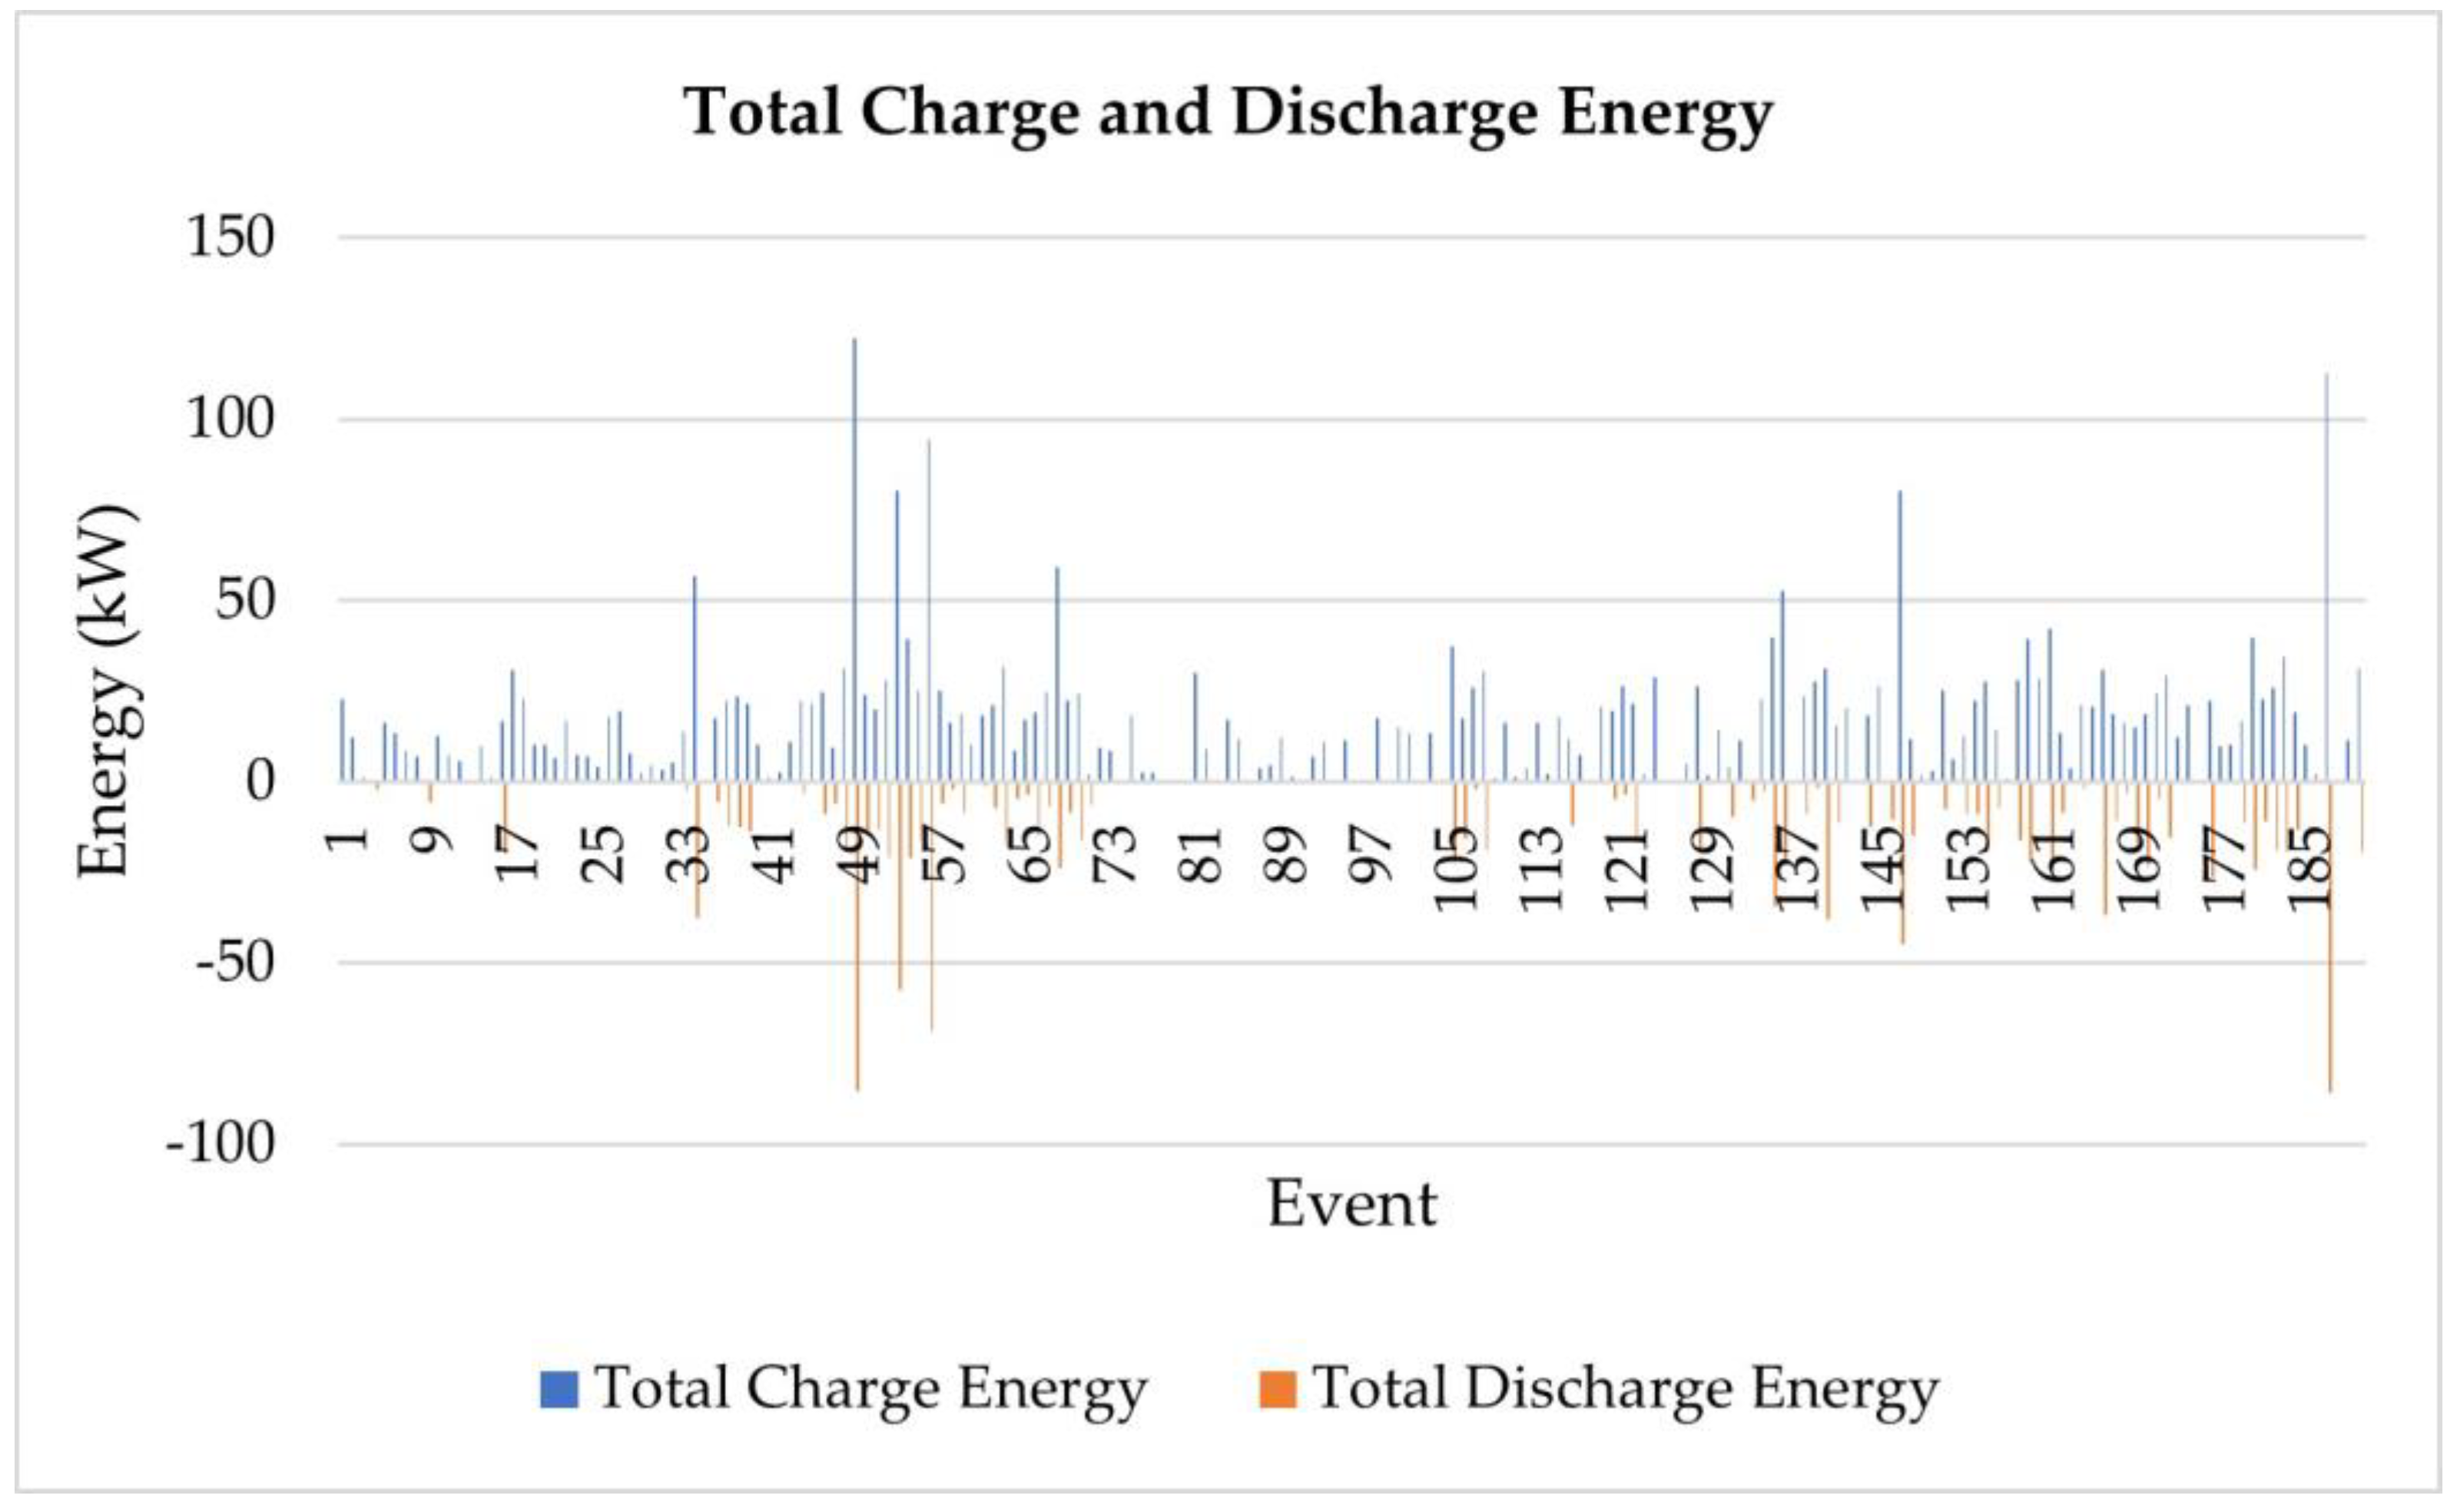
Figure 8.
Plot of total charging and discharging energies for Creative Energy Homes.
Figure 8.
Plot of total charging and discharging energies for Creative Energy Homes.
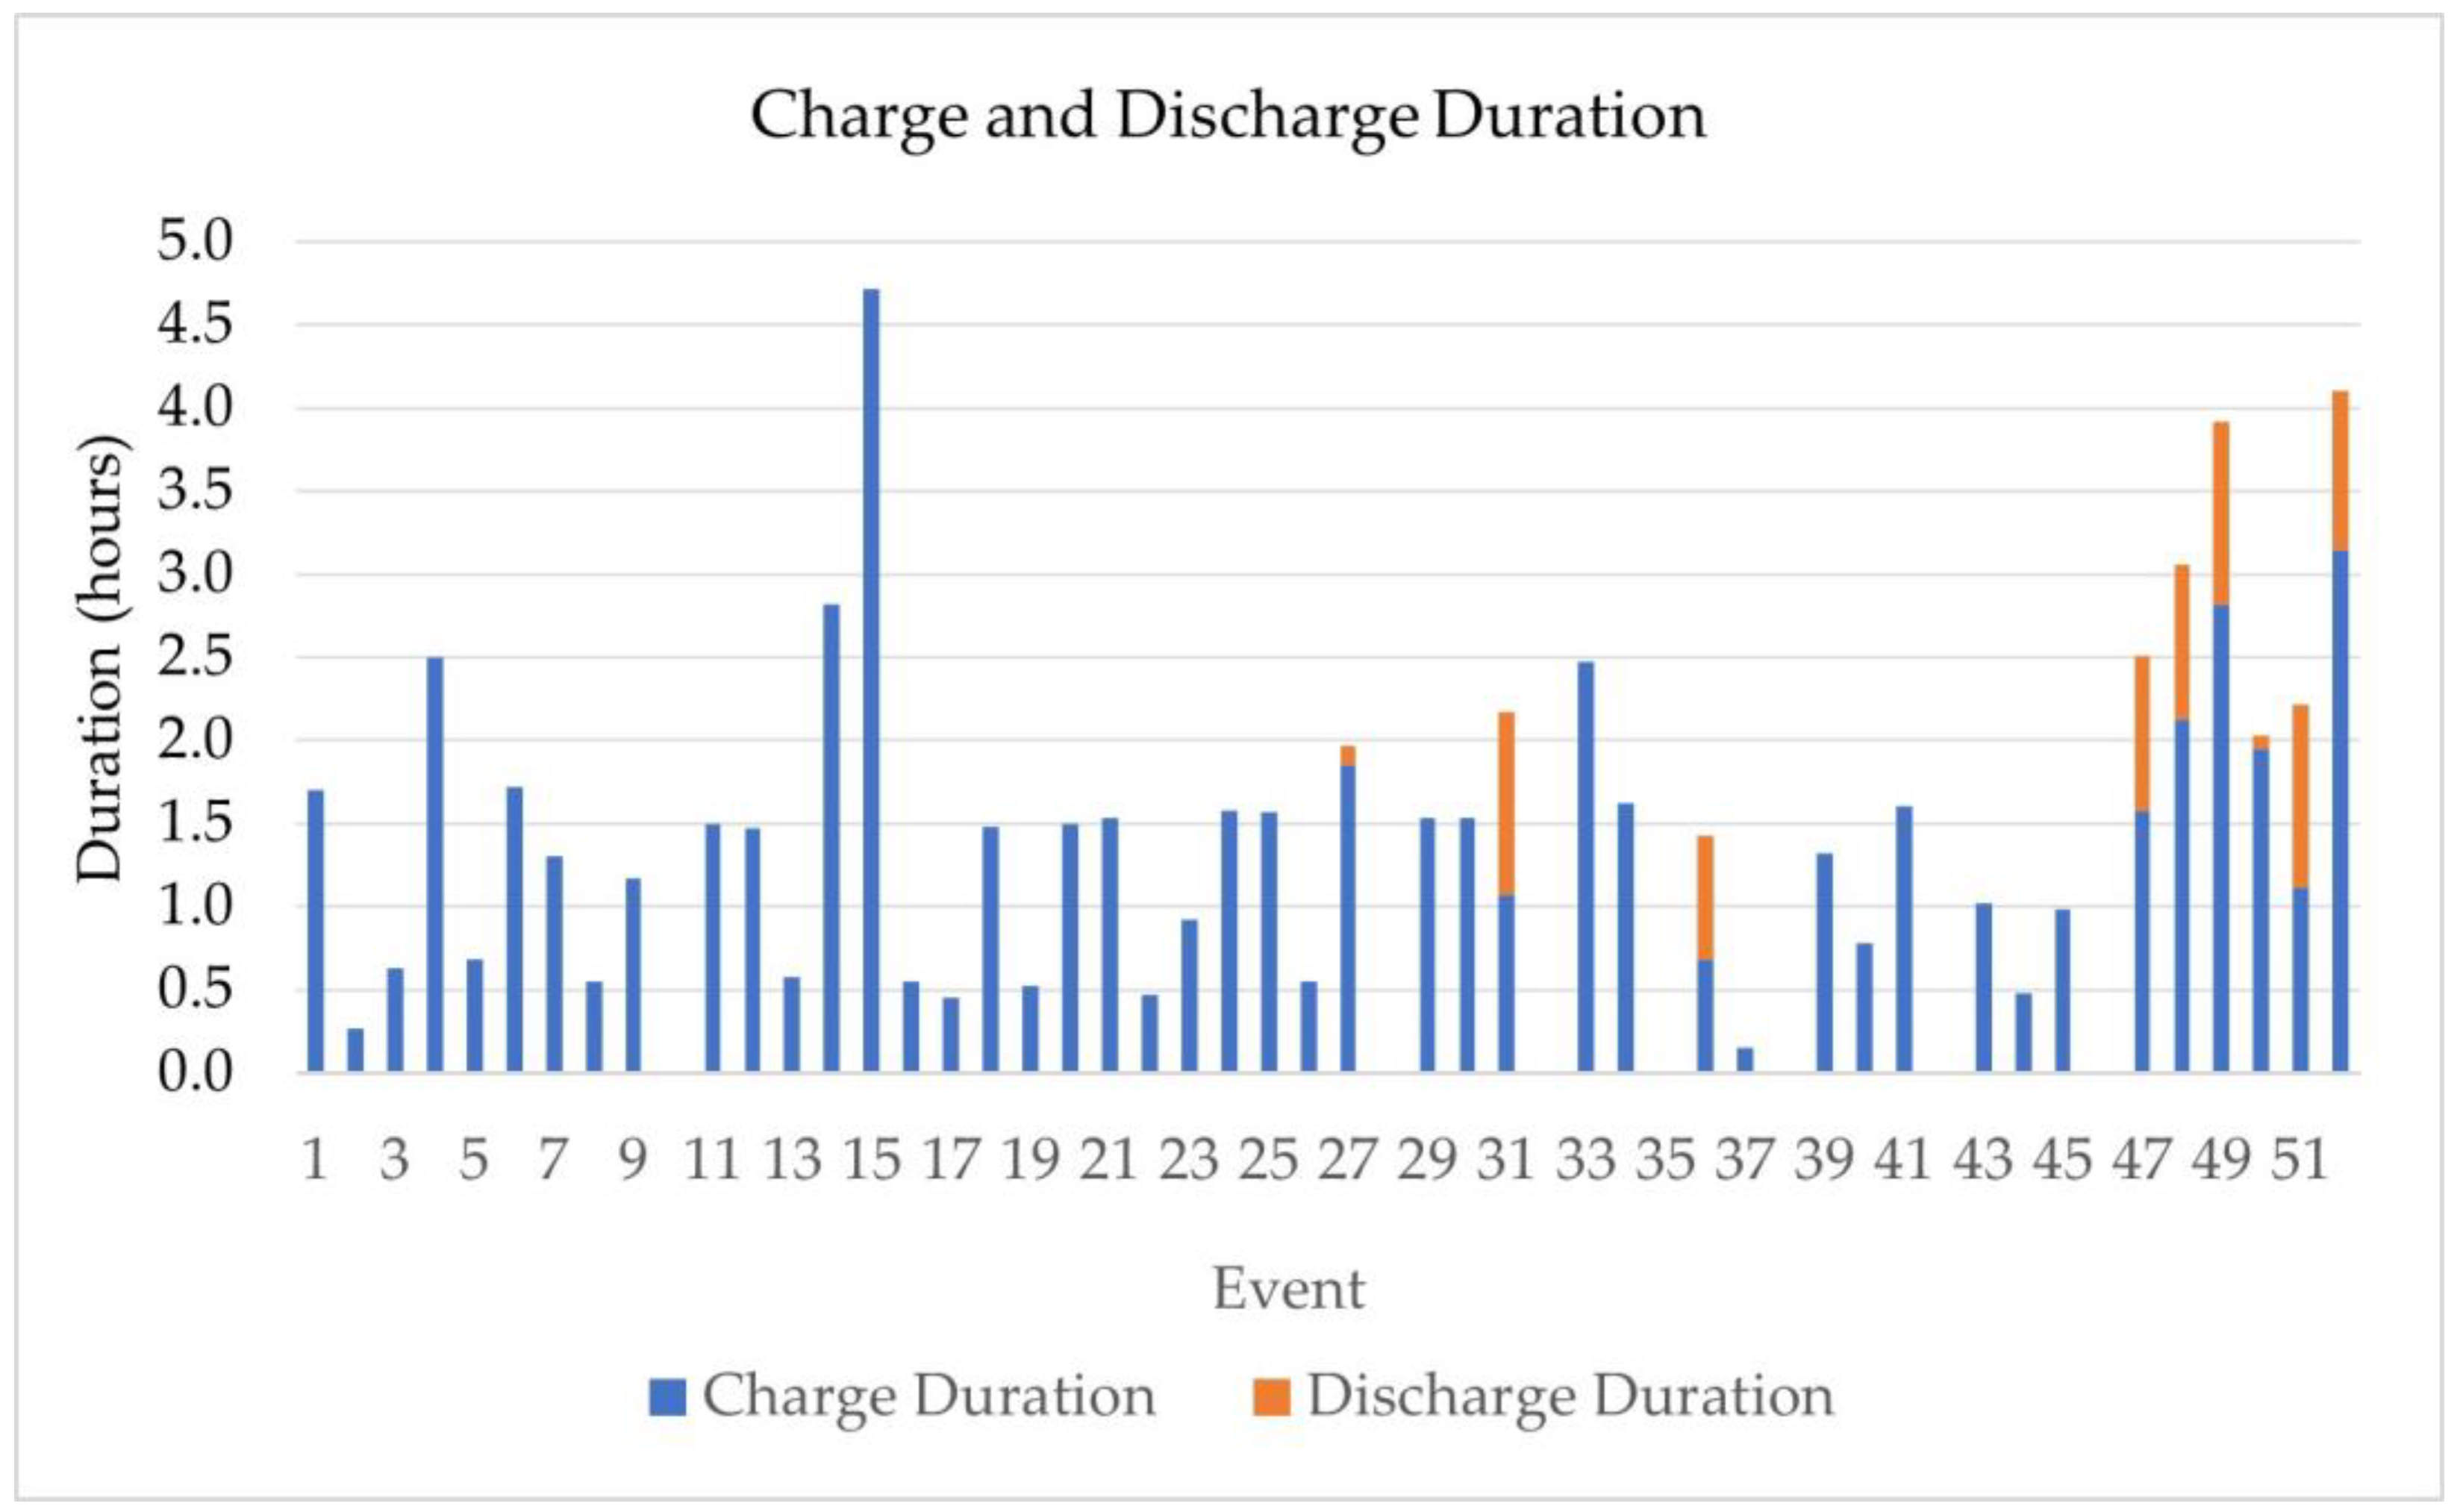
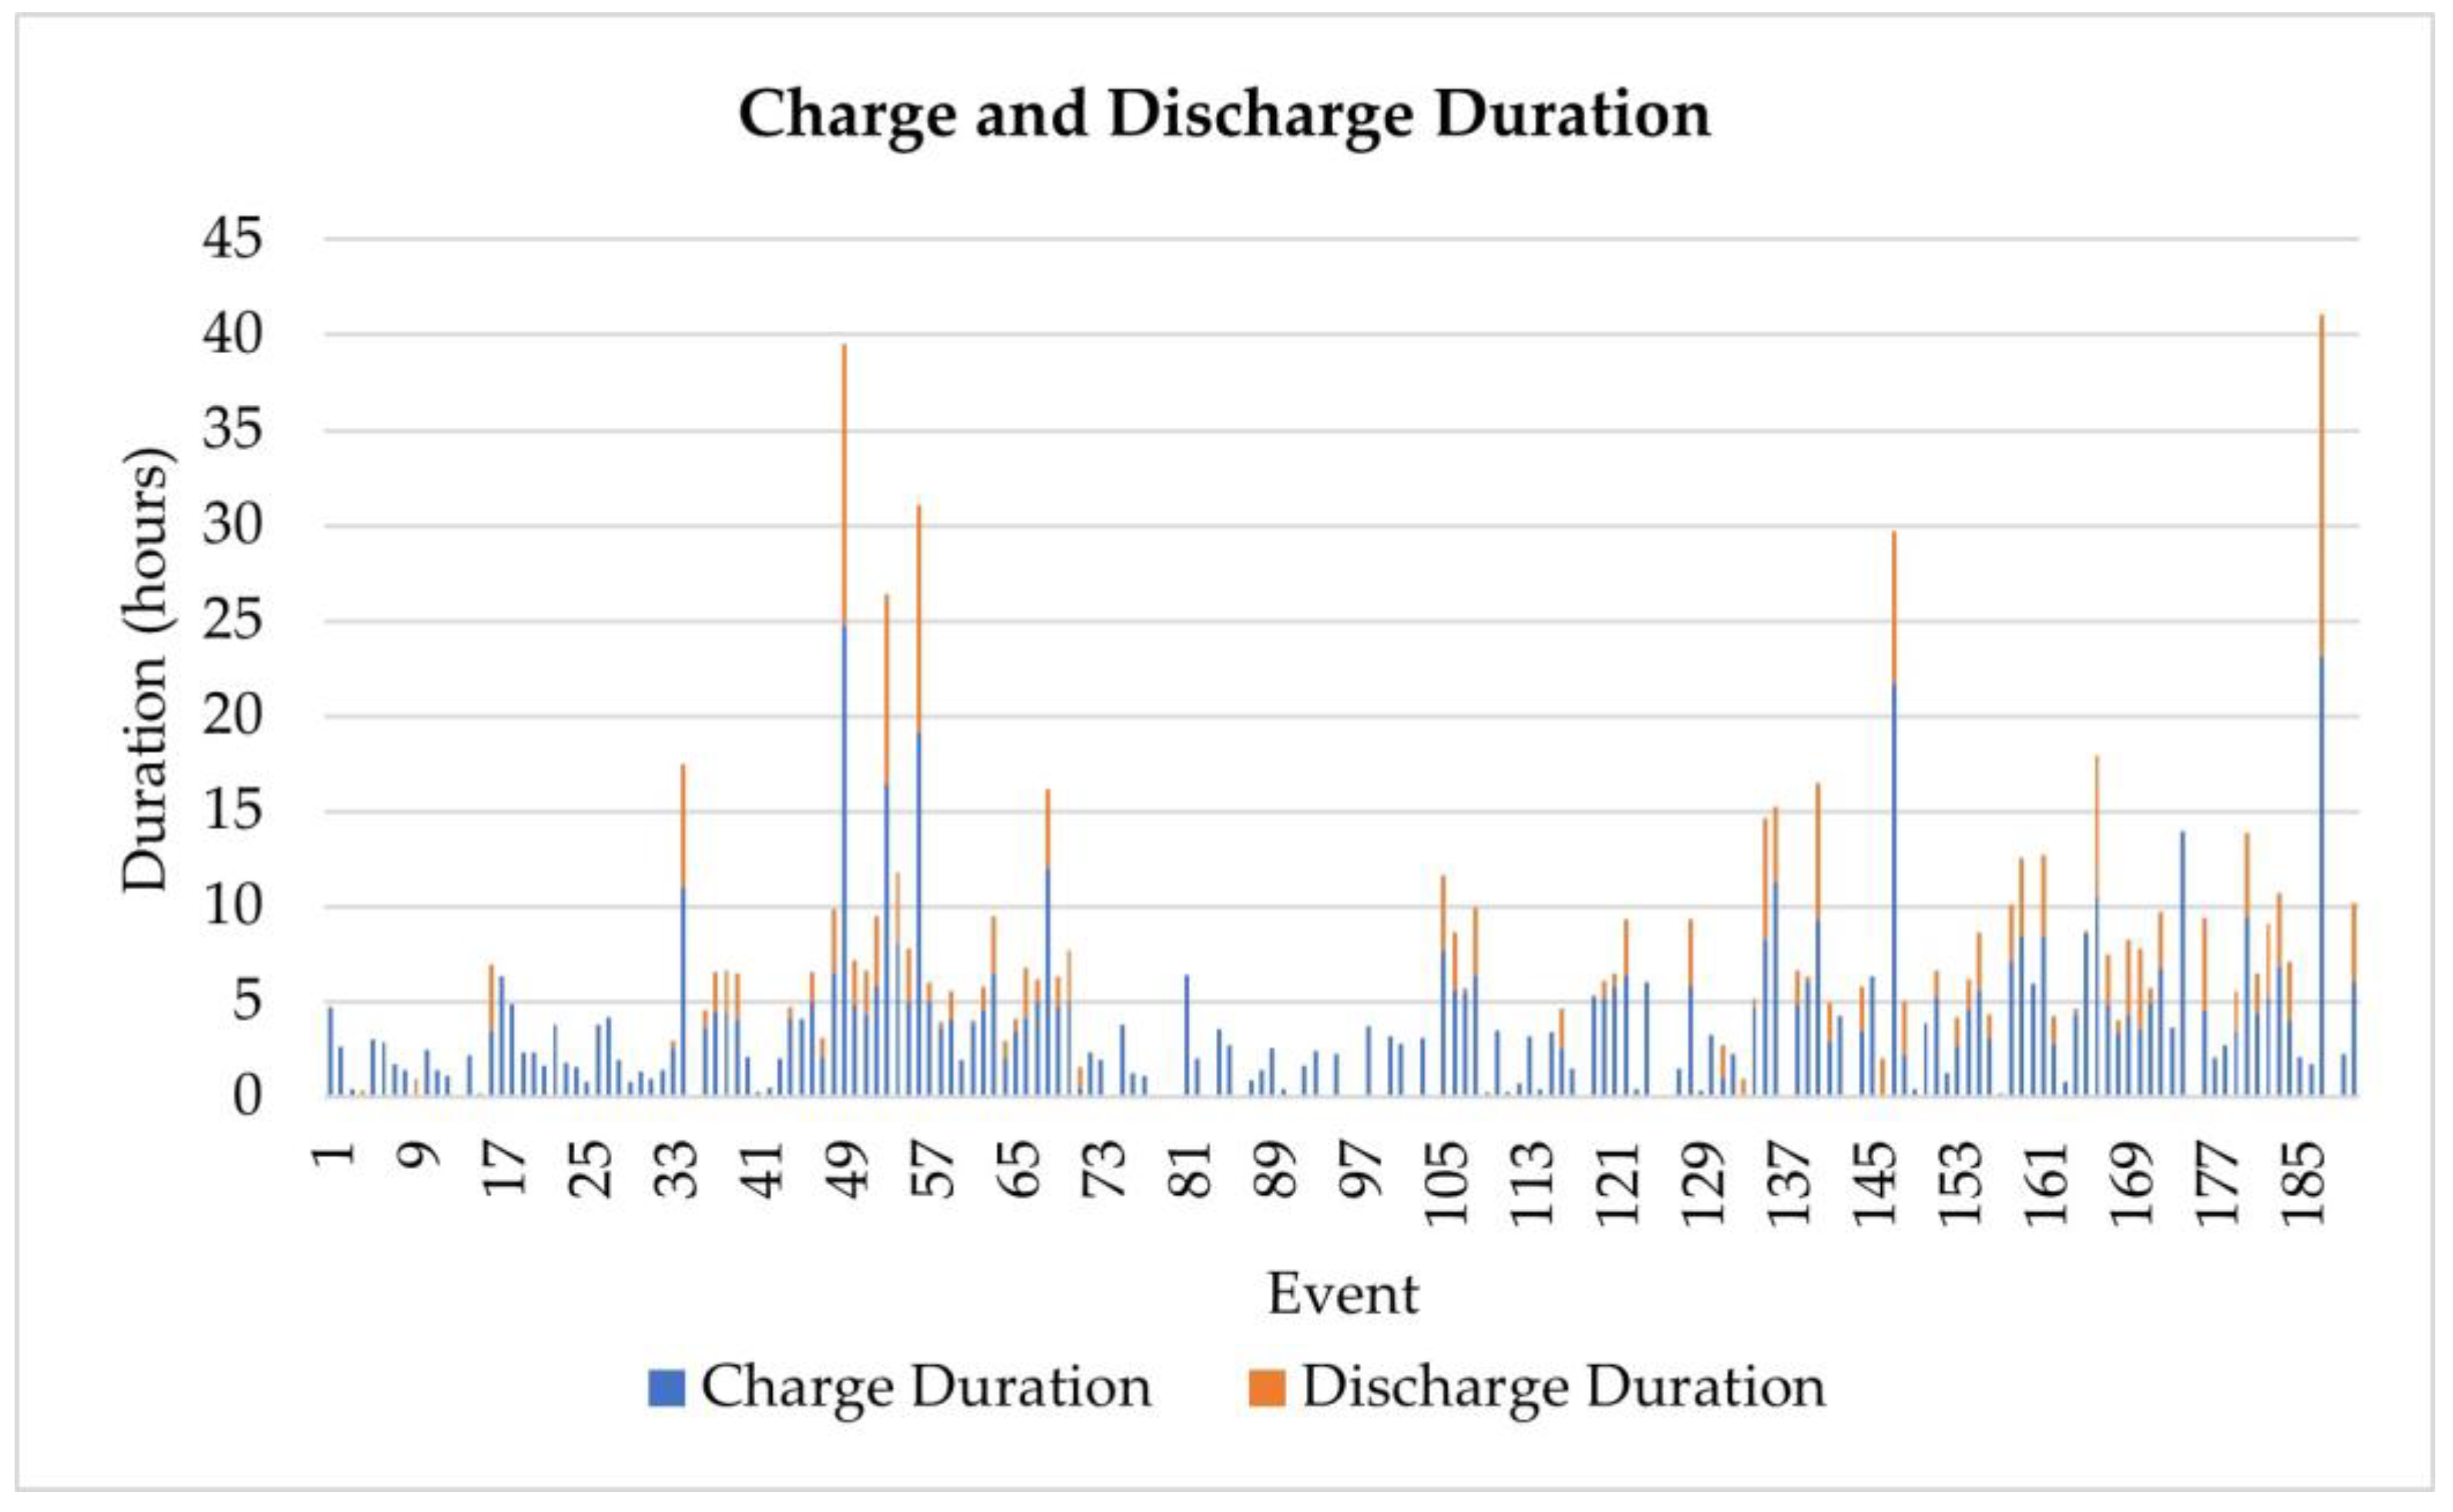
Figure 9.
Plot of total charging and discharging durations for Creative Energy Homes.
Figure 9.
Plot of total charging and discharging durations for Creative Energy Homes.
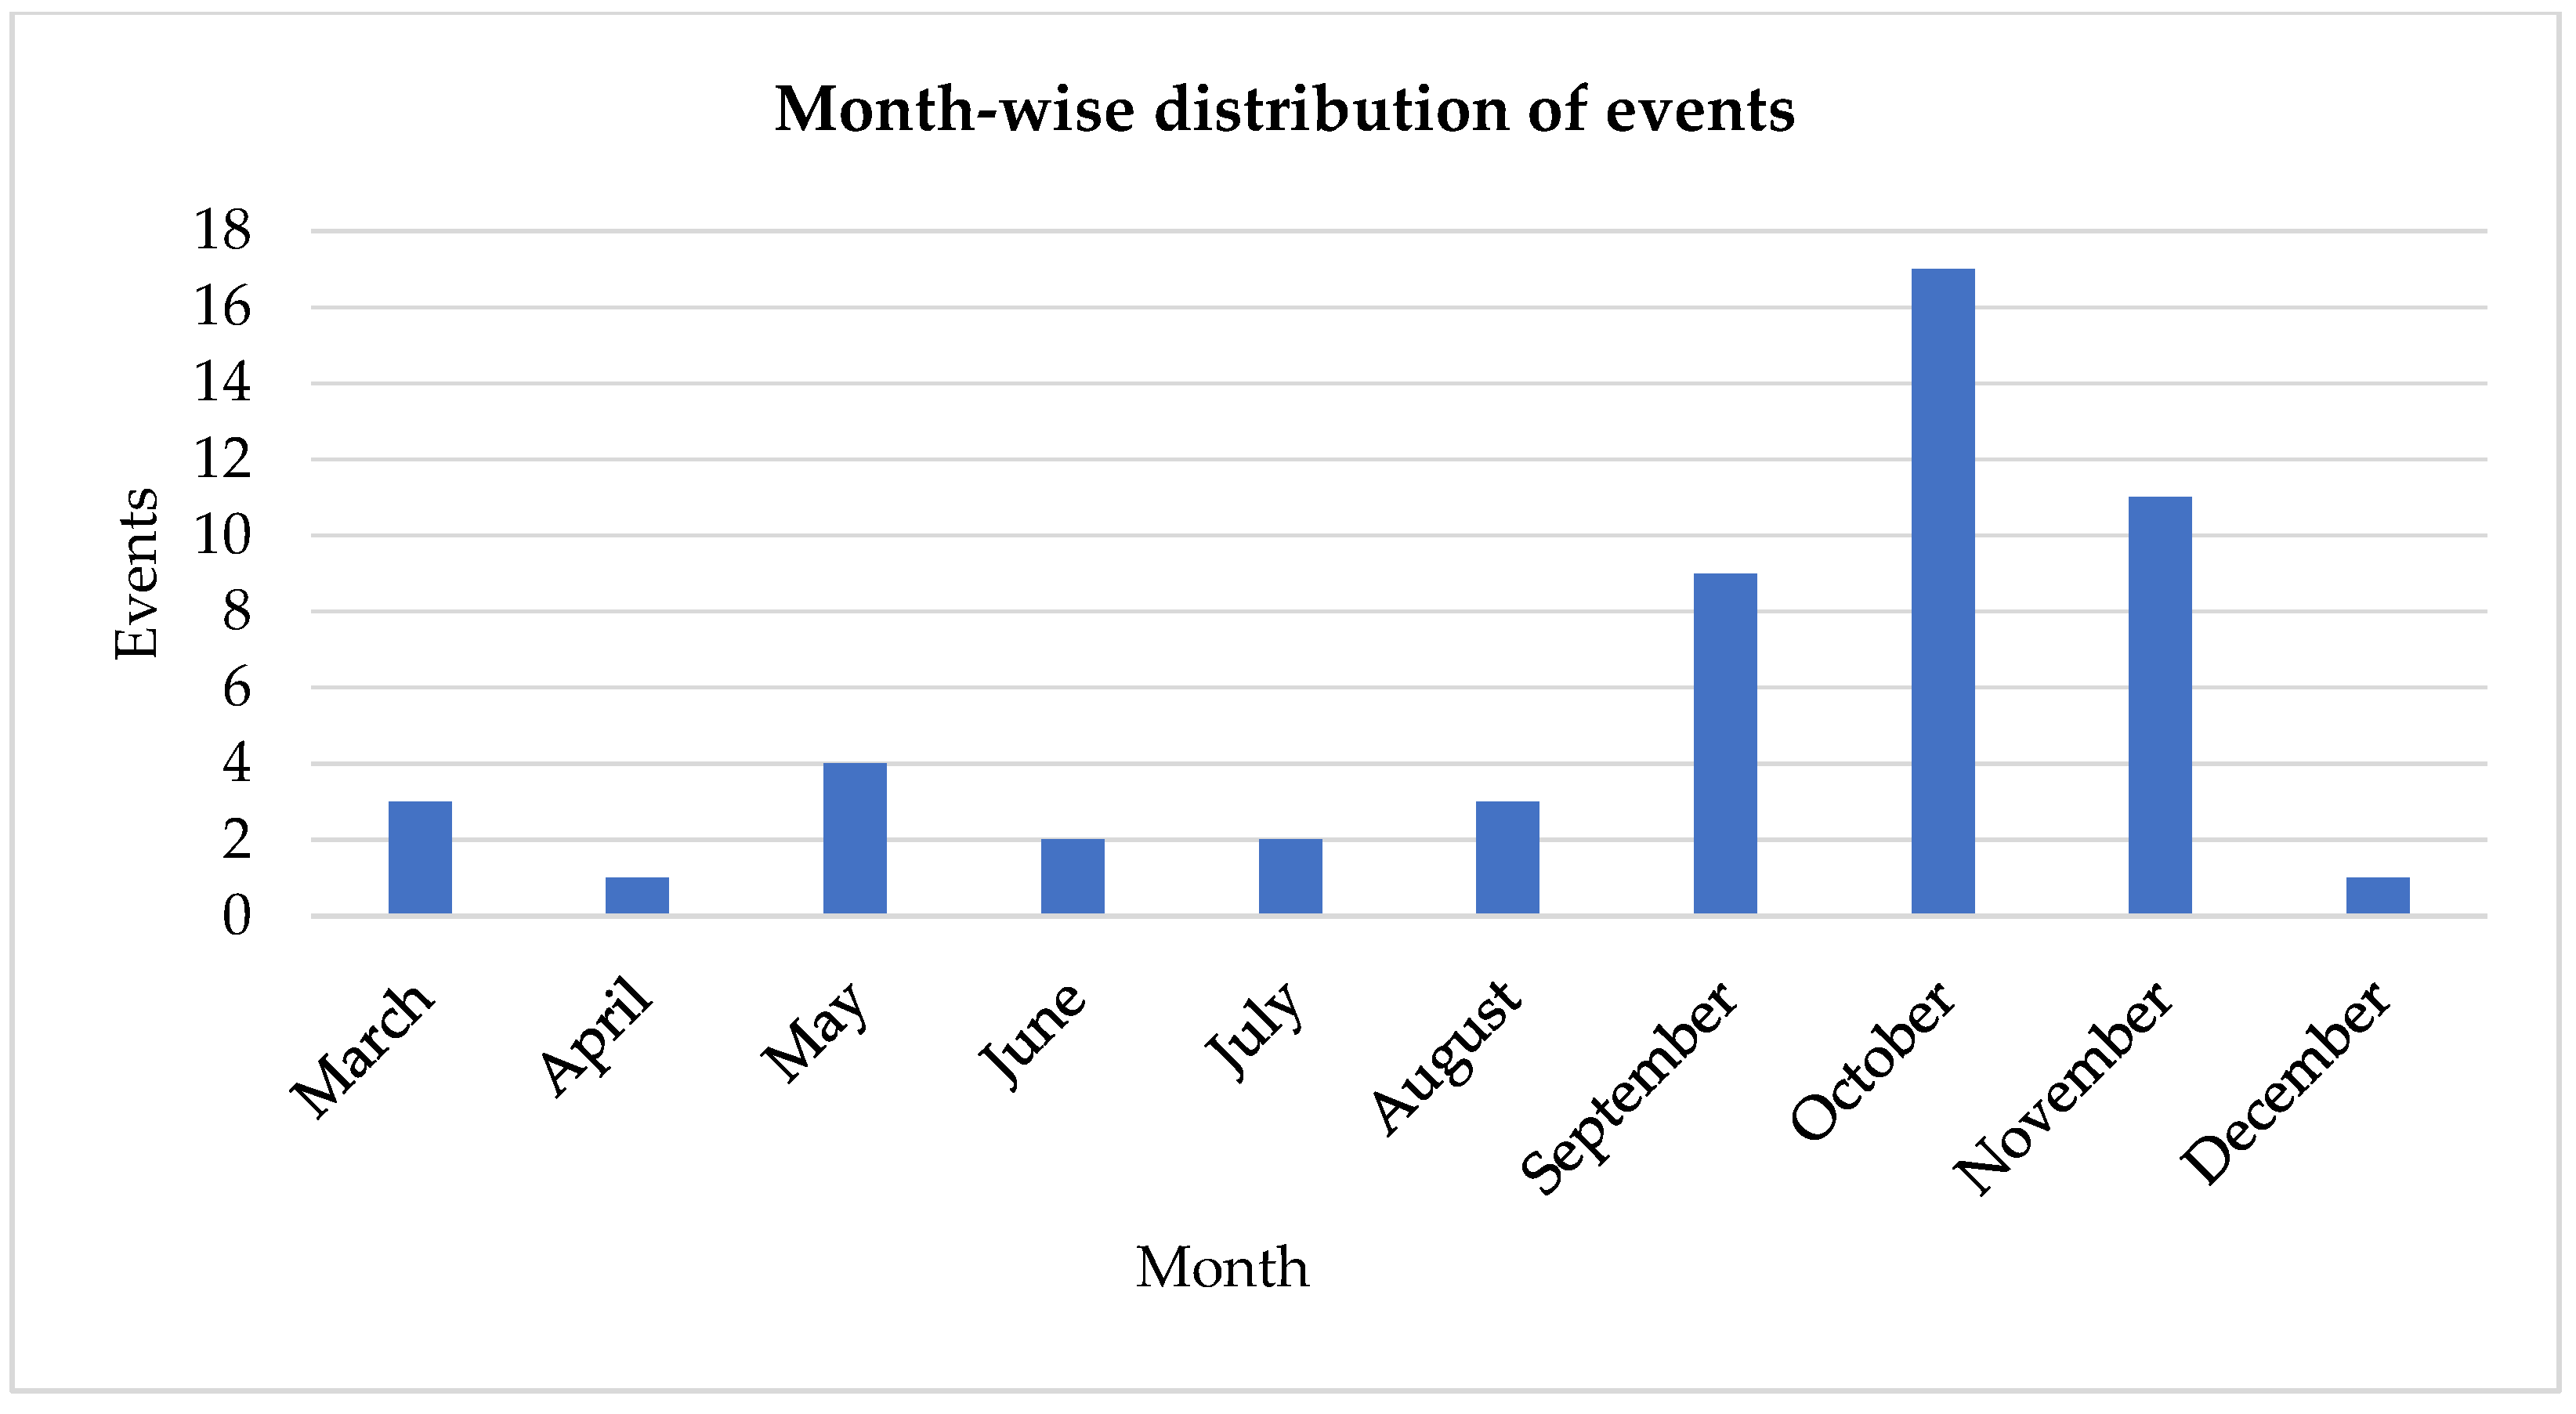
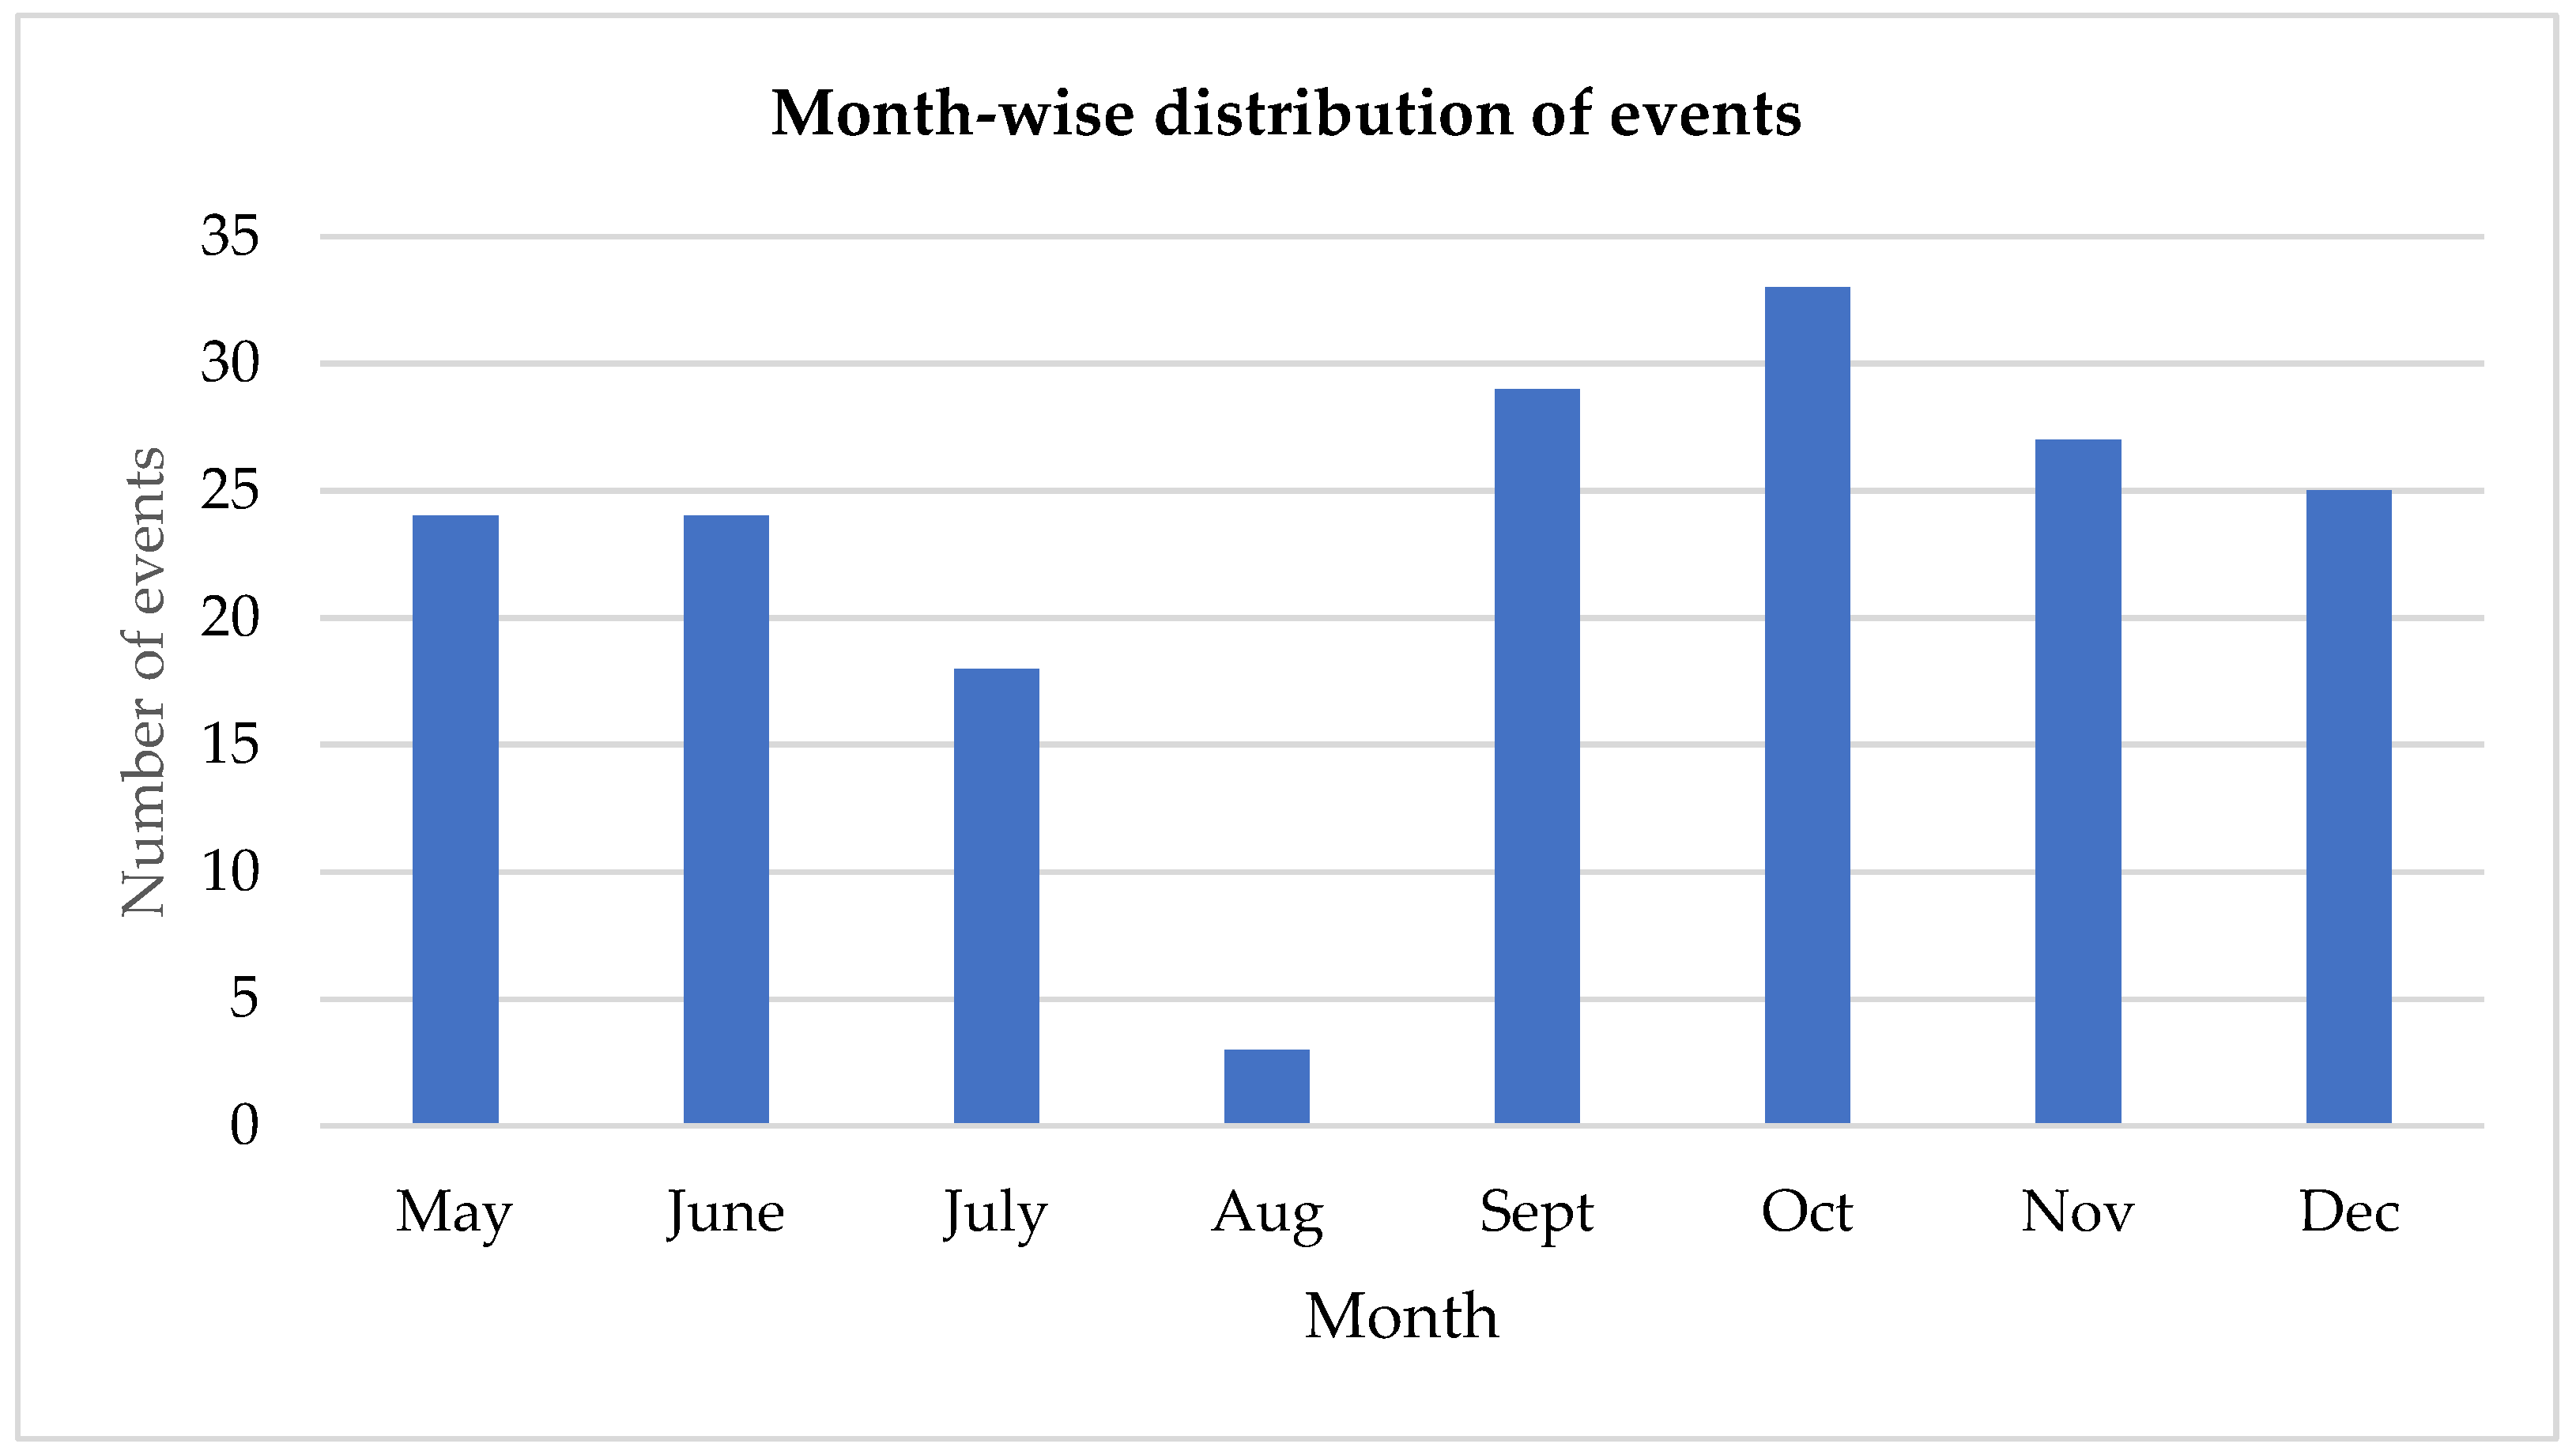
Figure 10.
Month-wise distribution of events at Creative Energy Homes.
Figure 10.
Month-wise distribution of events at Creative Energy Homes.
Figure 11.
Start and End SOCs of the events registered by the charger installed at Hallward Library.
Figure 11.
Start and End SOCs of the events registered by the charger installed at Hallward Library.
Figure 12.
Plot of Start and End States of Charge for the events at Hallward Library. (a) Pareto chart showing the frequency of occurrence of different ranges of start SOC at Hallward Library. Each column represents a range of SOC. (b) Pareto chart showing the frequency of occurrence of different ranges of end SOC at Hallward Library. Each column represents a range of SOC.
Figure 13.
Plot of peak power import and export for the events registered at Hallward Library.
Figure 13.
Plot of peak power import and export for the events registered at Hallward Library.
Figure 14.
Plot of total charging and discharging energy for the events at Hallward Library.
Figure 14.
Plot of total charging and discharging energy for the events at Hallward Library.
Figure 15.
Plot of total charging and discharging durations for the events at Hallward Library.
Figure 15.
Plot of total charging and discharging durations for the events at Hallward Library.
Figure 16.
Month-wise variation of the events at Hallward Library.
Figure 16.
Month-wise variation of the events at Hallward Library.
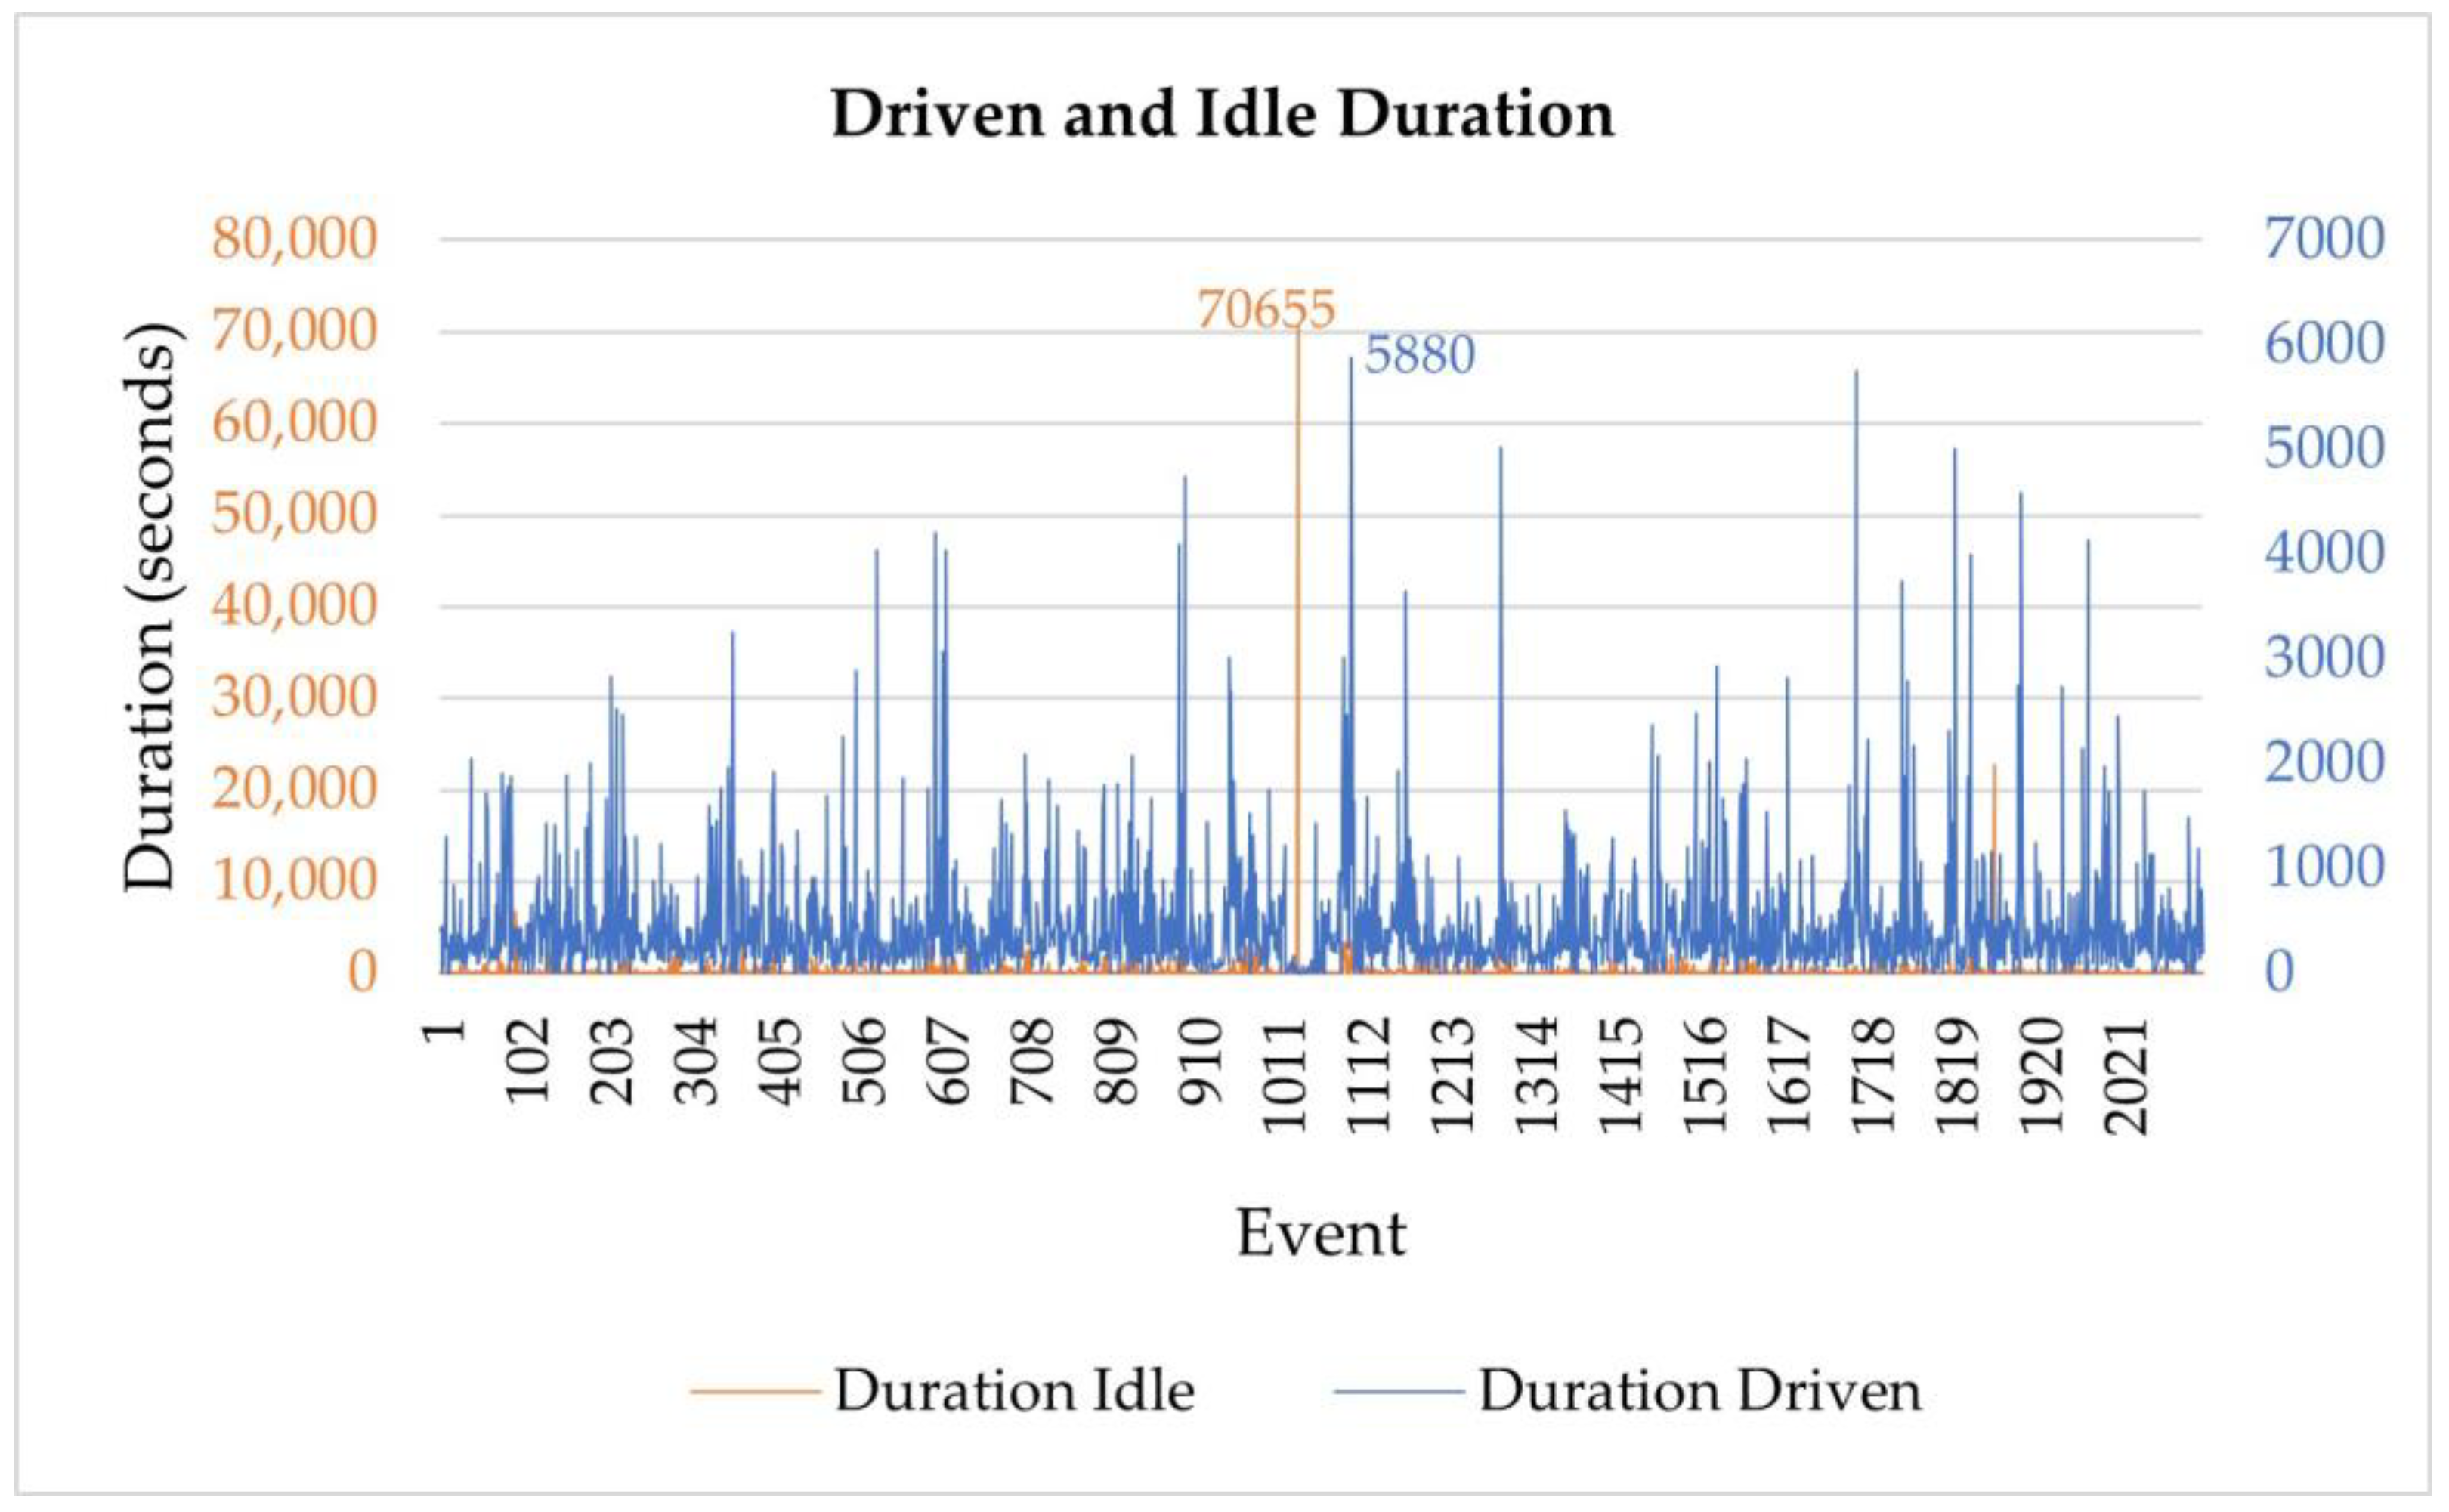
Figure 17.
Plot of idle and driven times of the recorded trips.
Figure 17.
Plot of idle and driven times of the recorded trips.
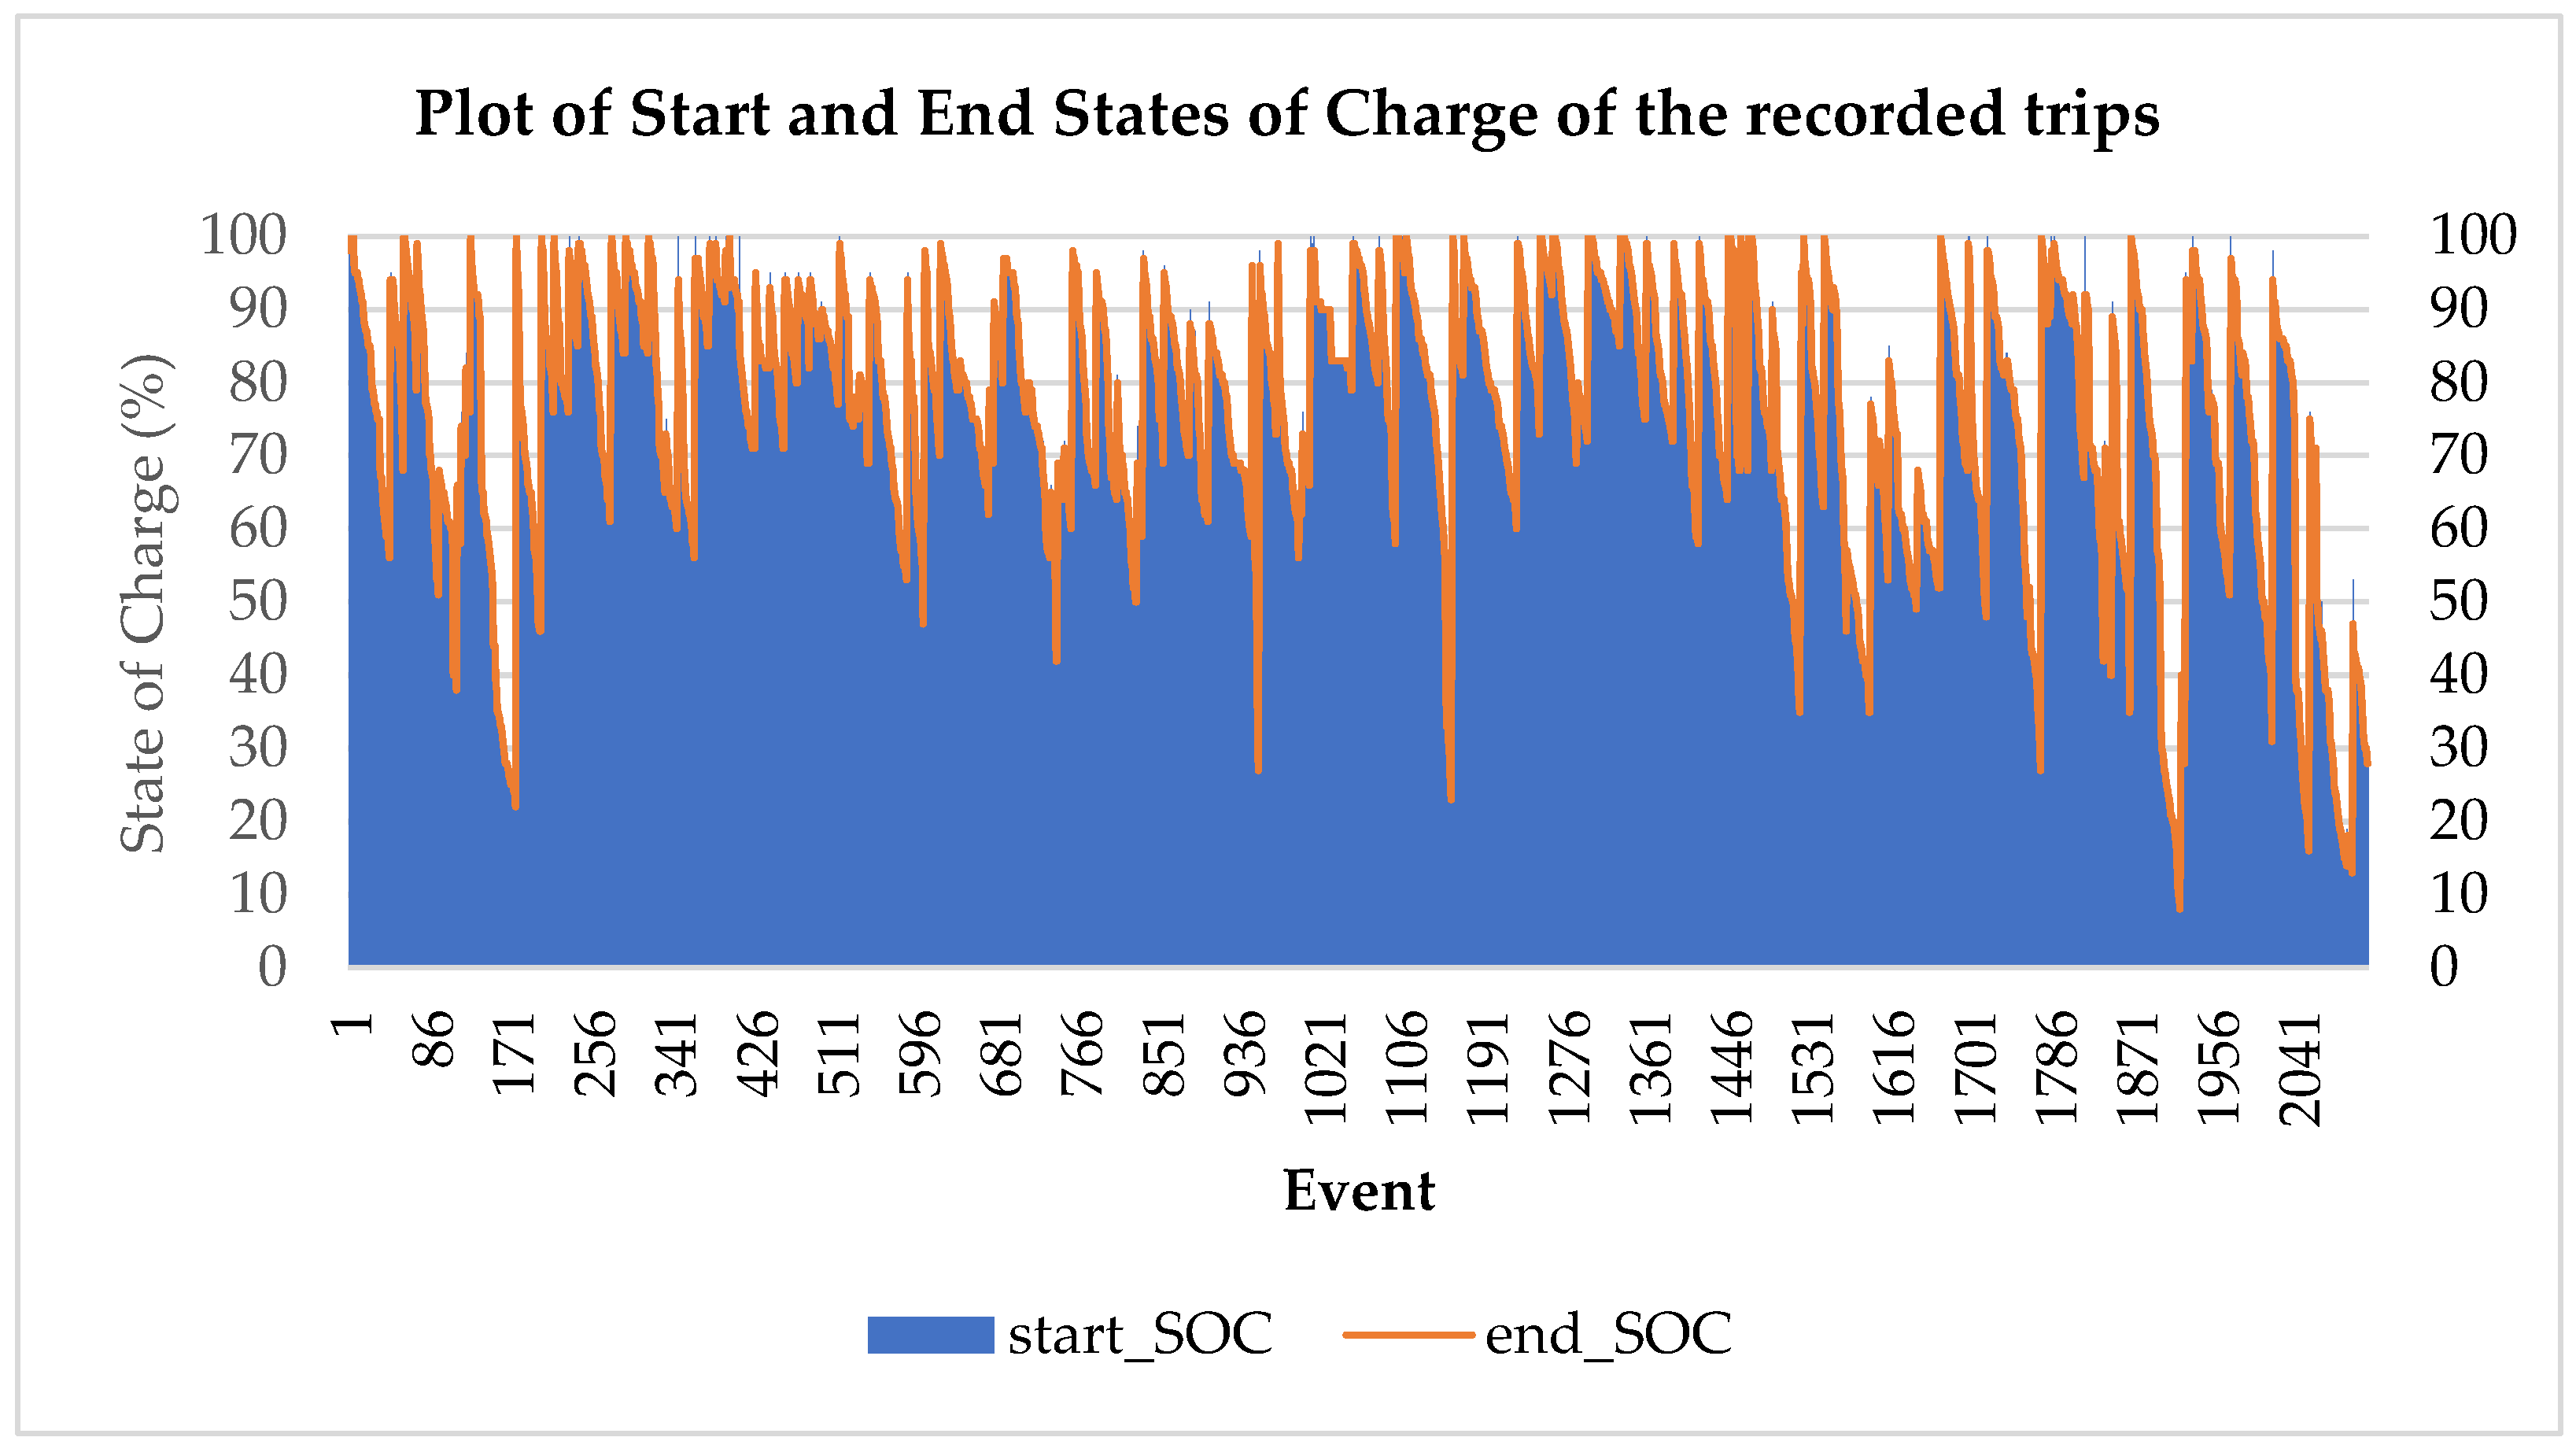
Figure 18.
Plot of start and end States of Charge of the recorded trips.
Figure 18.
Plot of start and end States of Charge of the recorded trips.
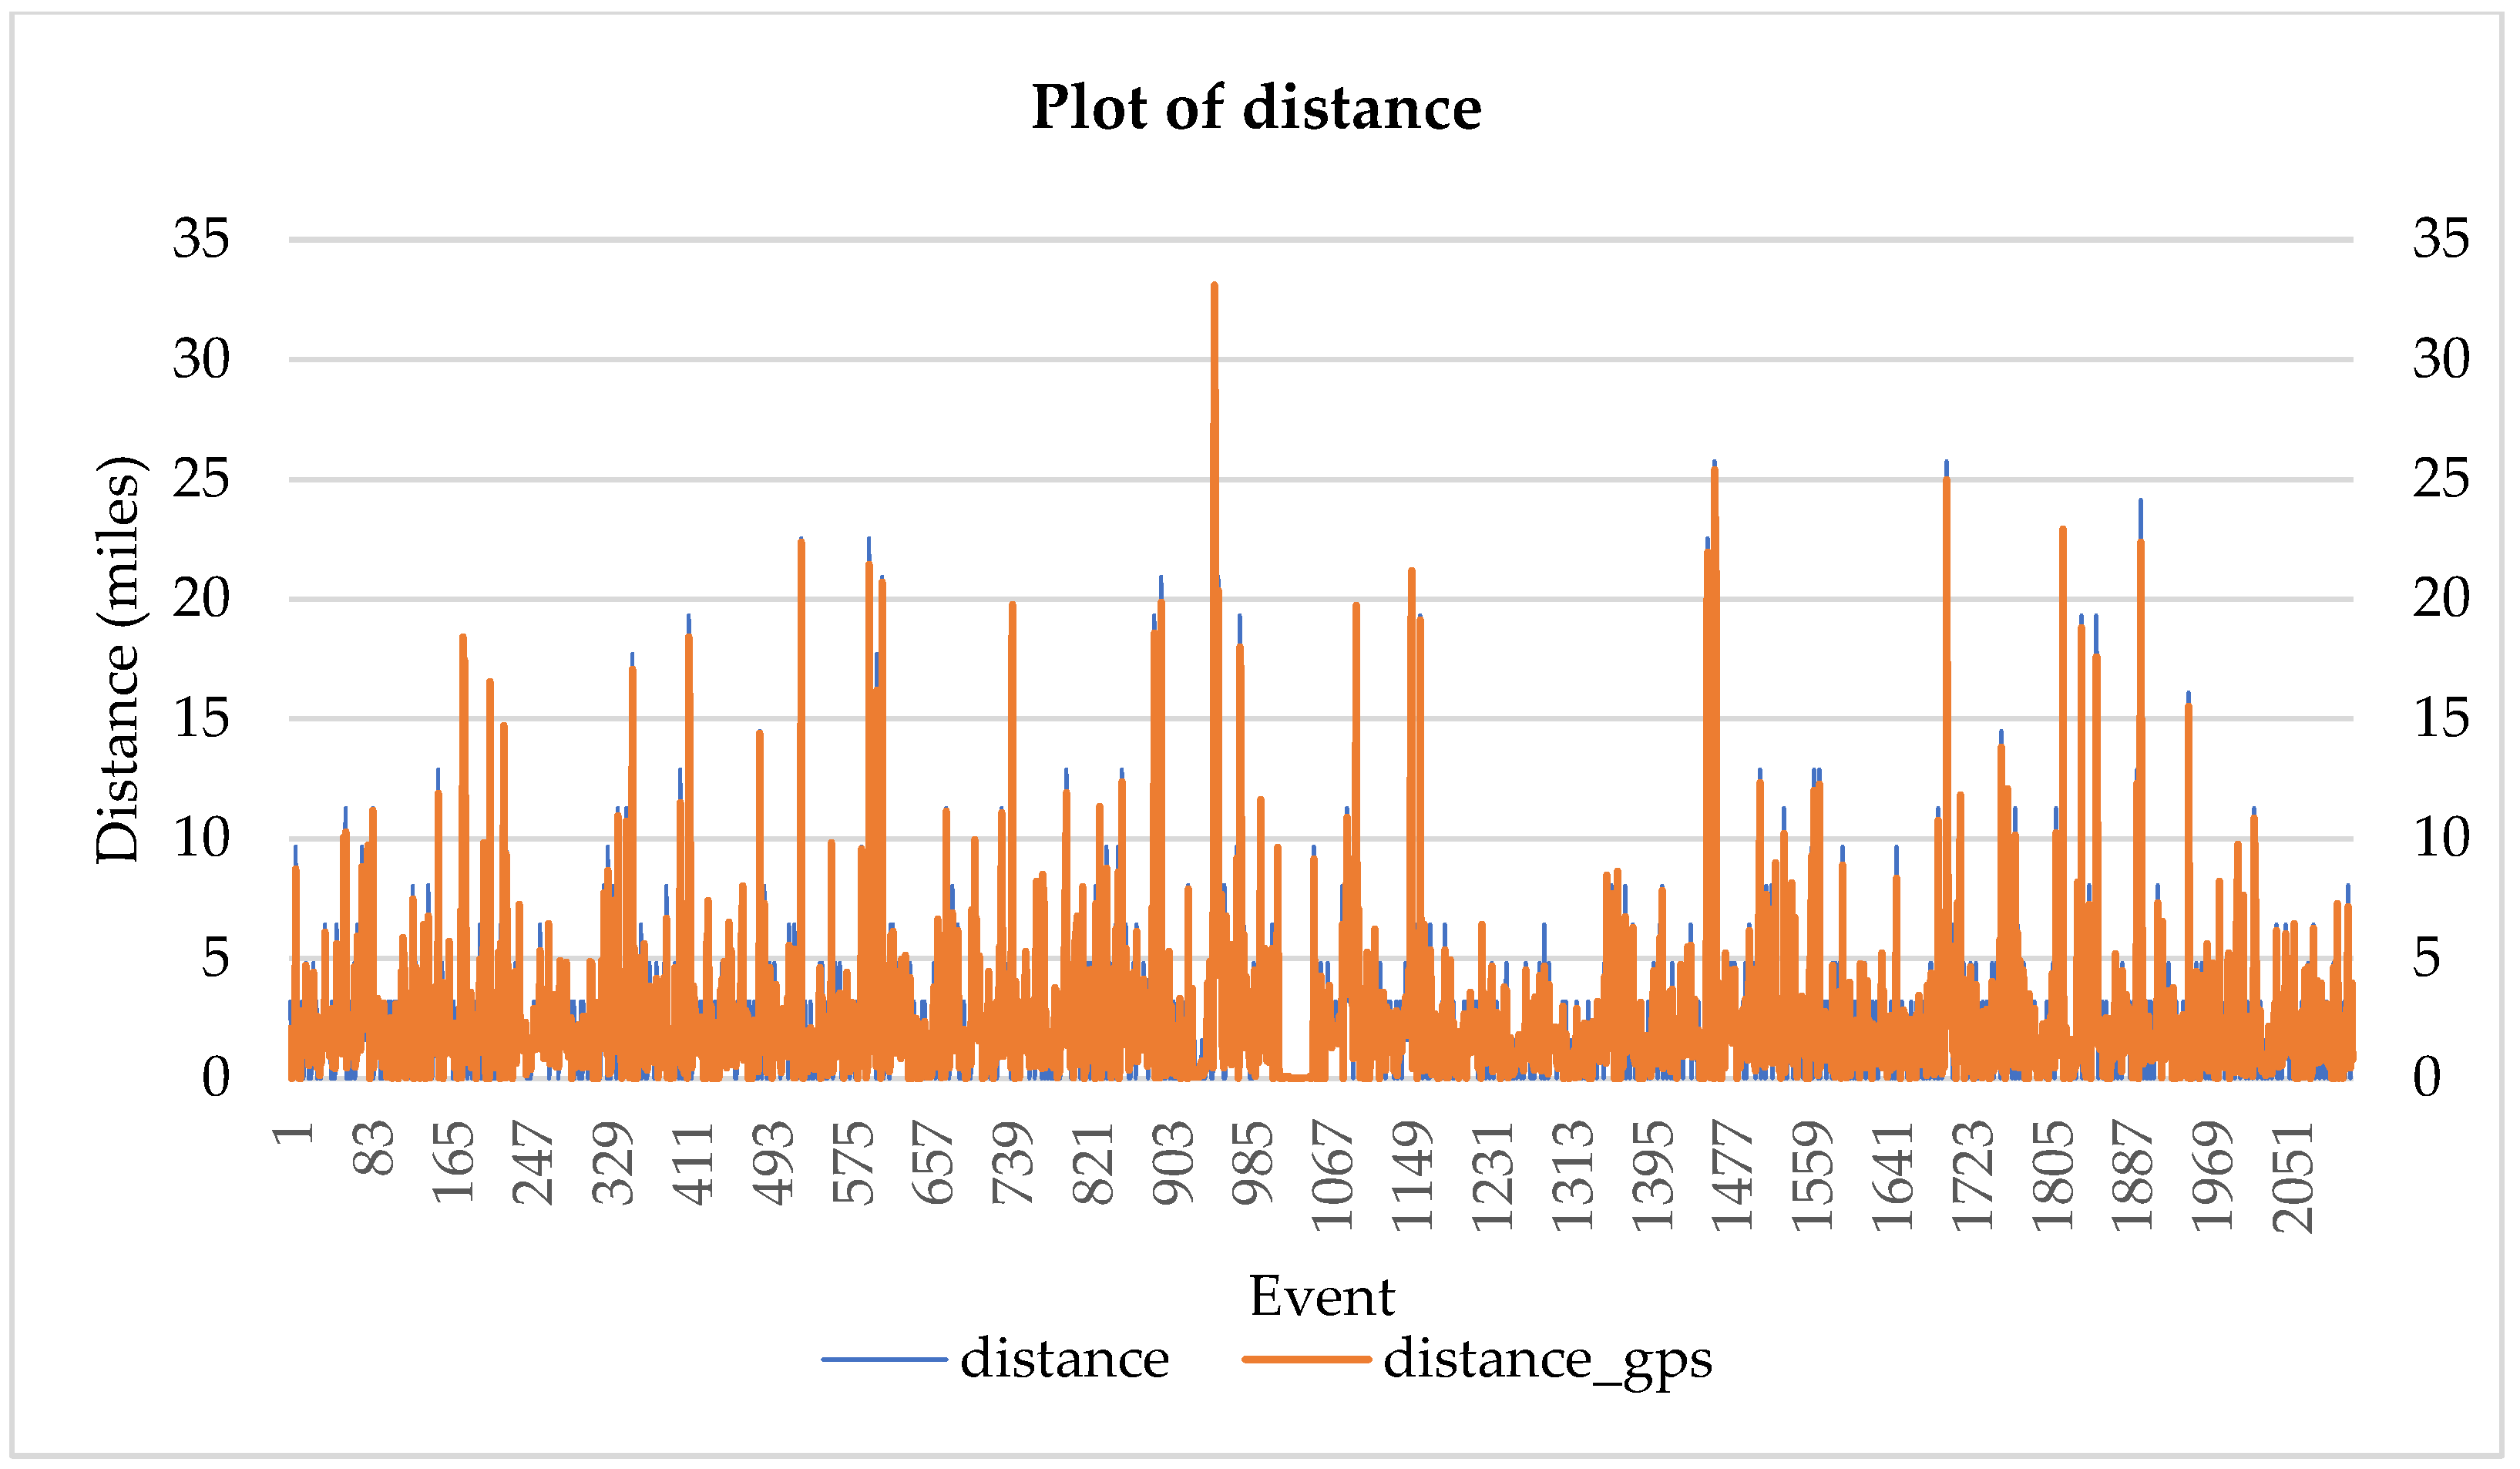
Figure 19.
Plot of distance travelled.
Figure 19.
Plot of distance travelled.
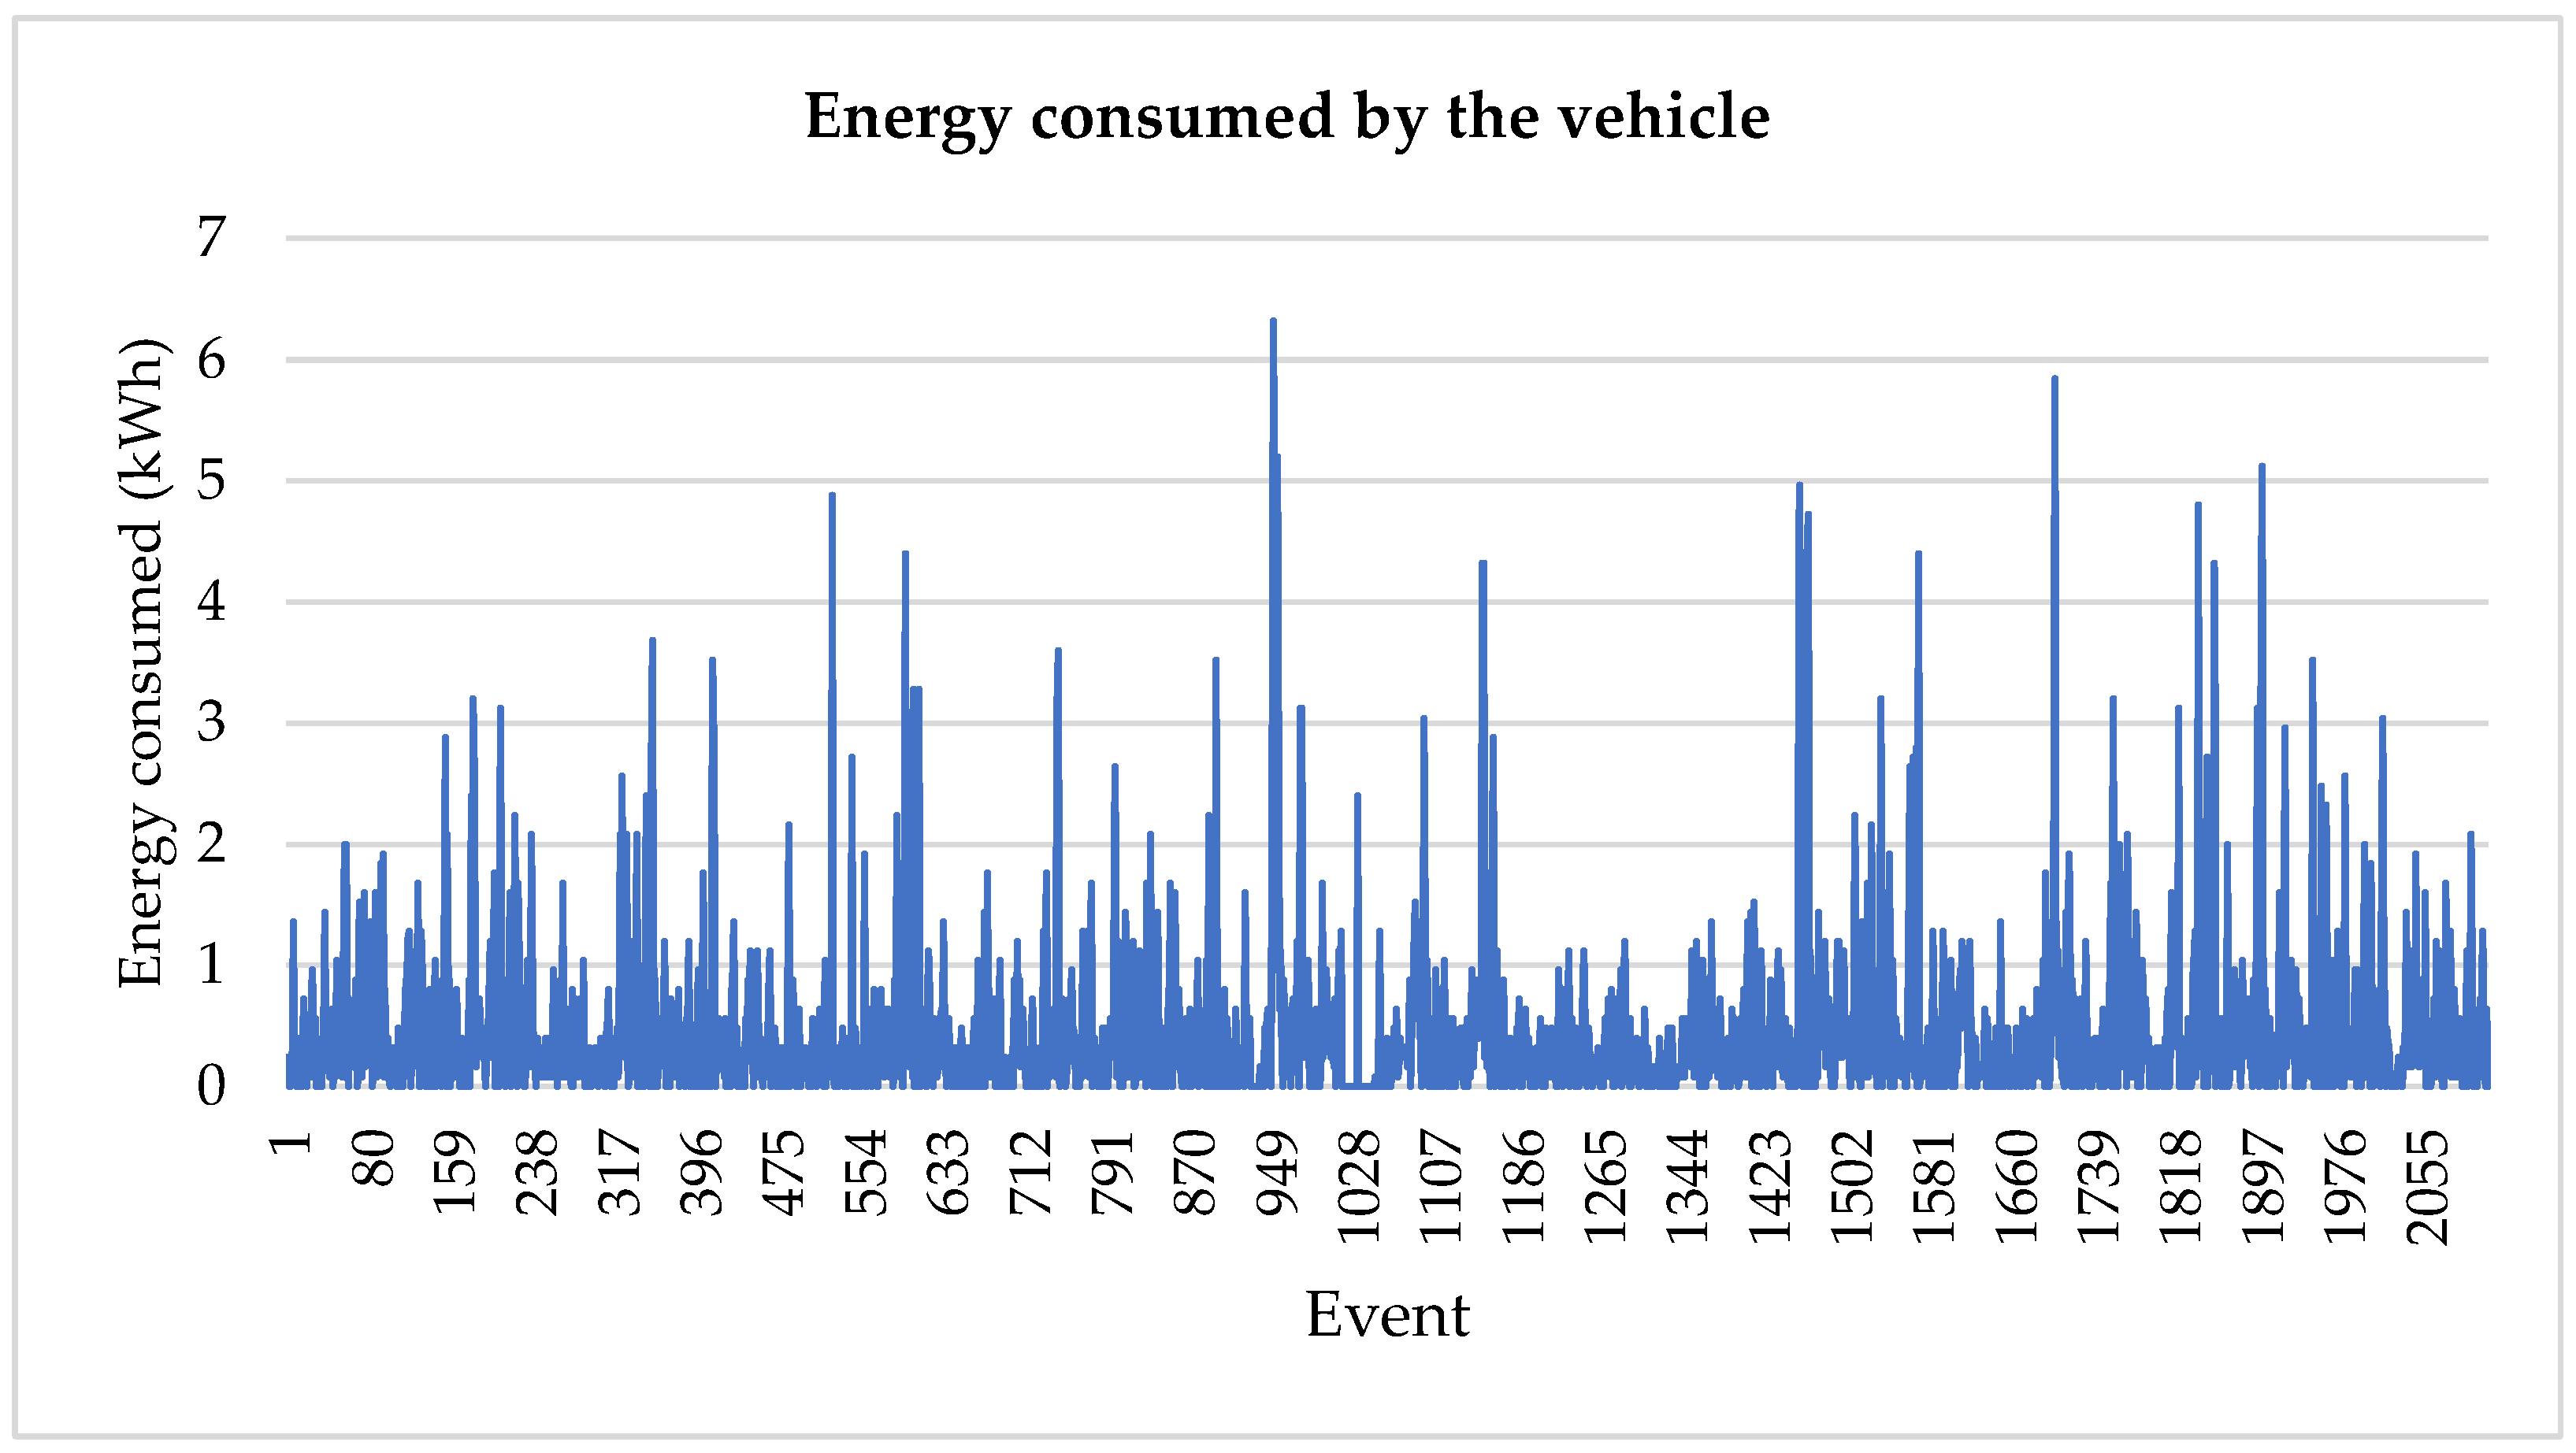
Figure 20.
Plot of energy consumed by the vehicle per trip.
Figure 20.
Plot of energy consumed by the vehicle per trip.
Figure 21.
Month-wise distribution of trips.
Figure 21.
Month-wise distribution of trips.
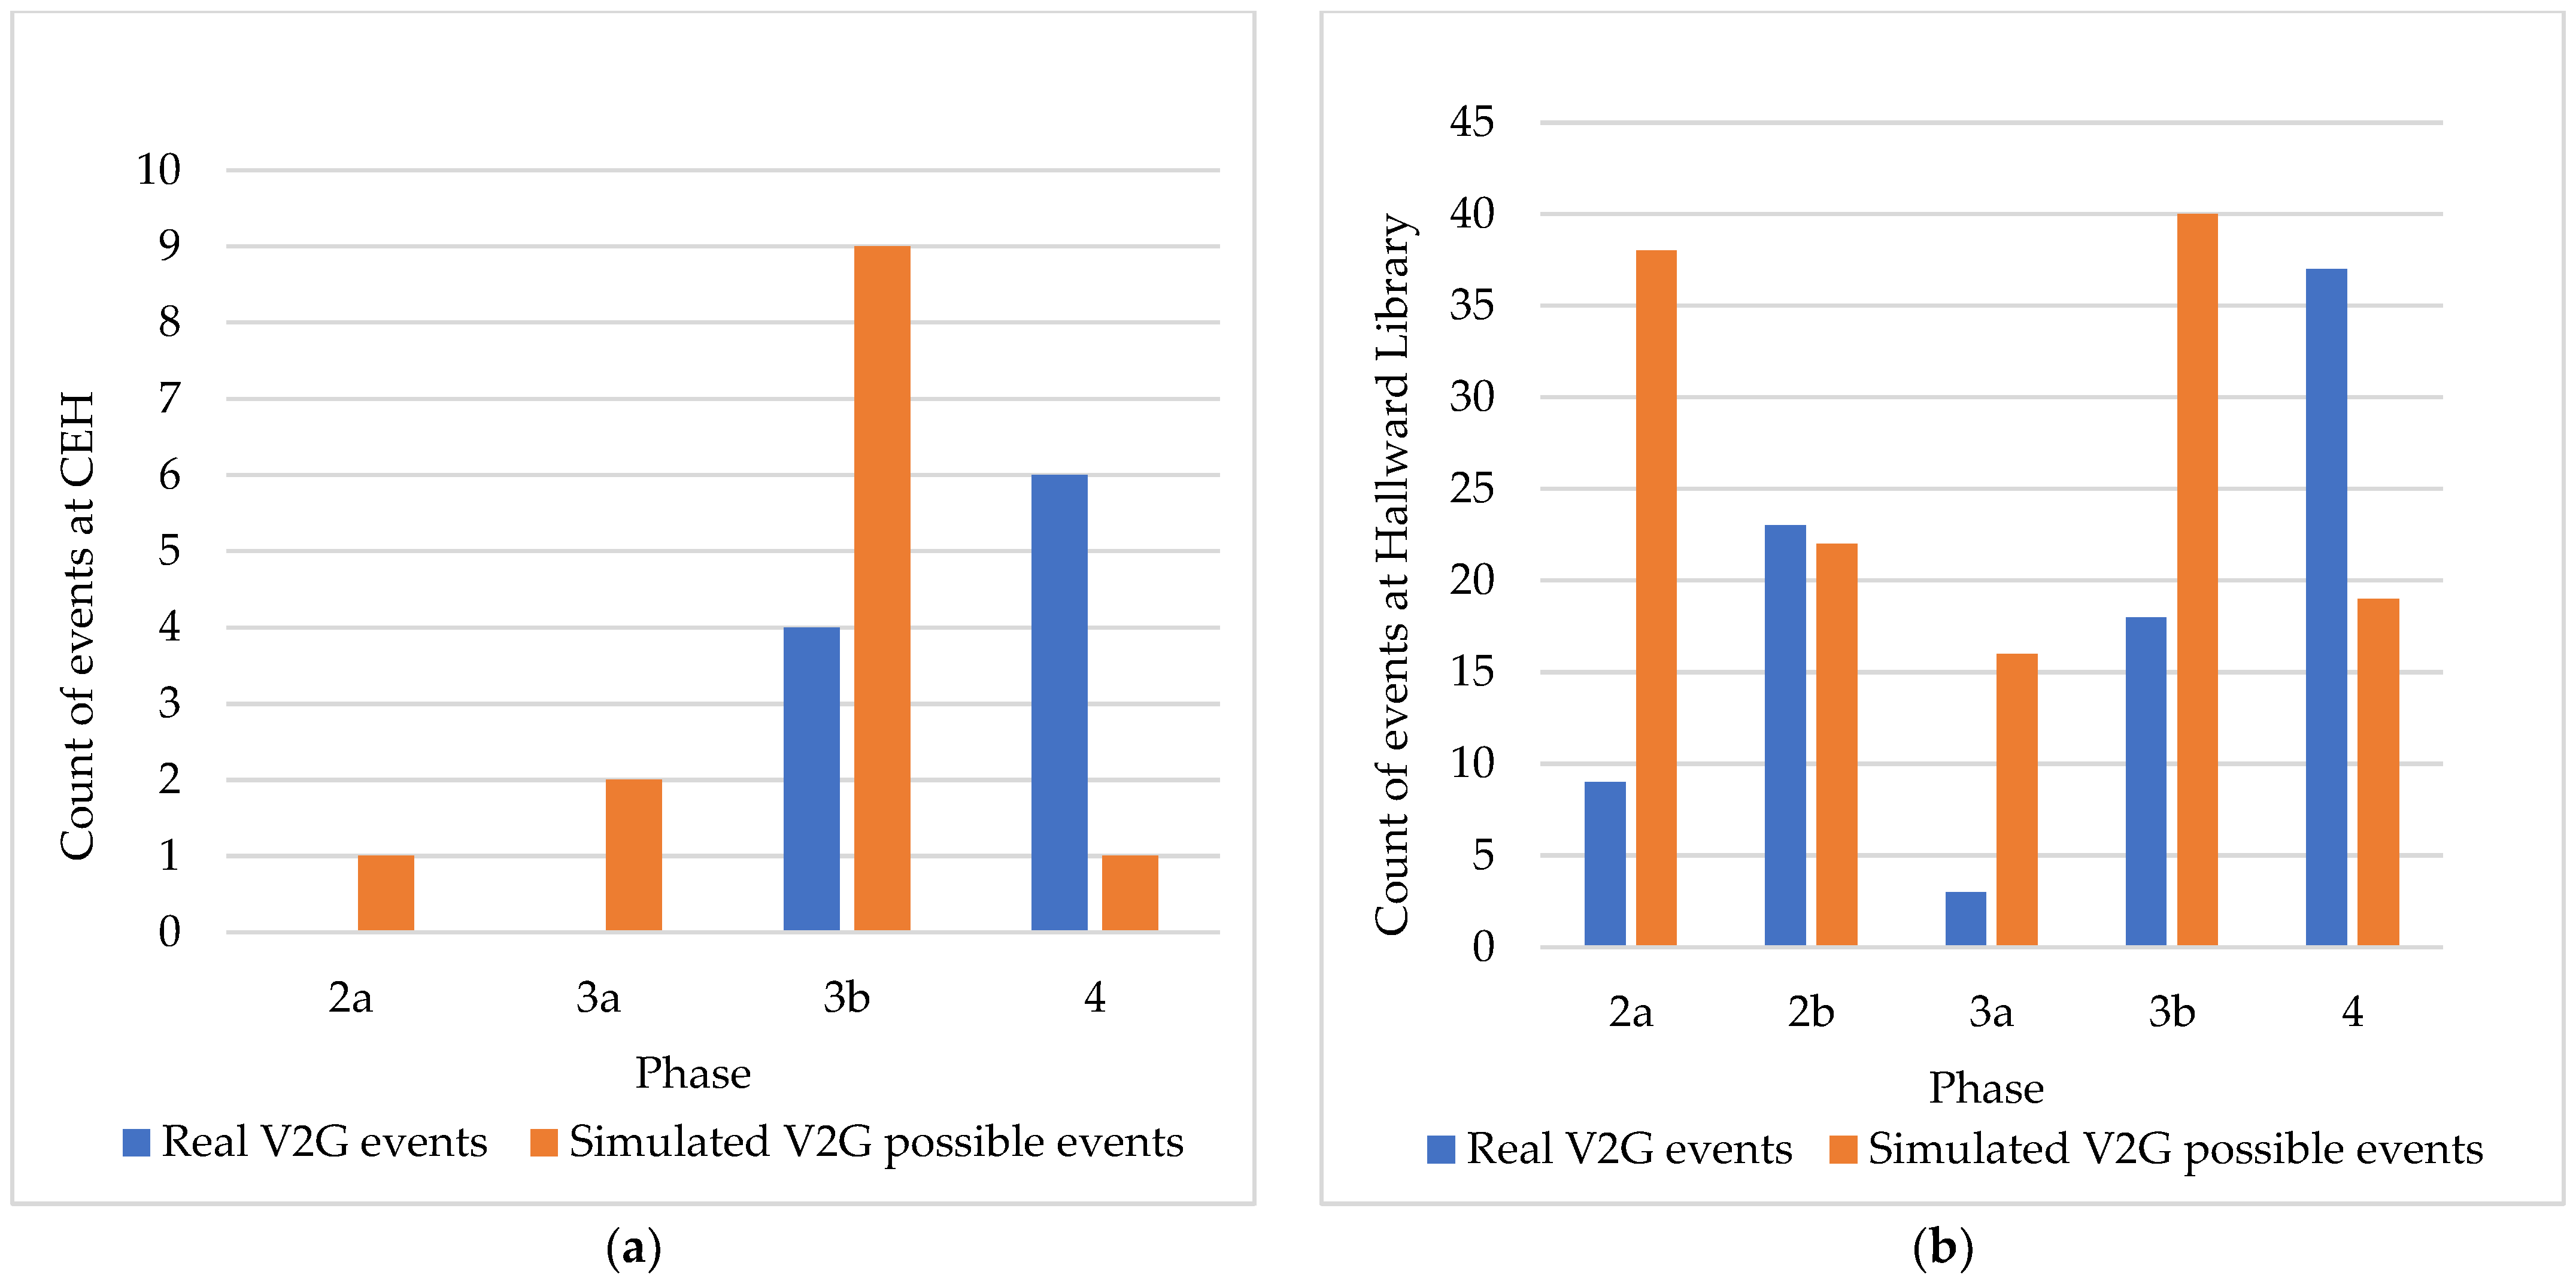
Figure 22.
Distribution of V2G possible events over different phases for Creative Energy Homes (a); (b) Distribution of V2G possible events for Hallward Library.
Figure 22.
Distribution of V2G possible events over different phases for Creative Energy Homes (a); (b) Distribution of V2G possible events for Hallward Library.
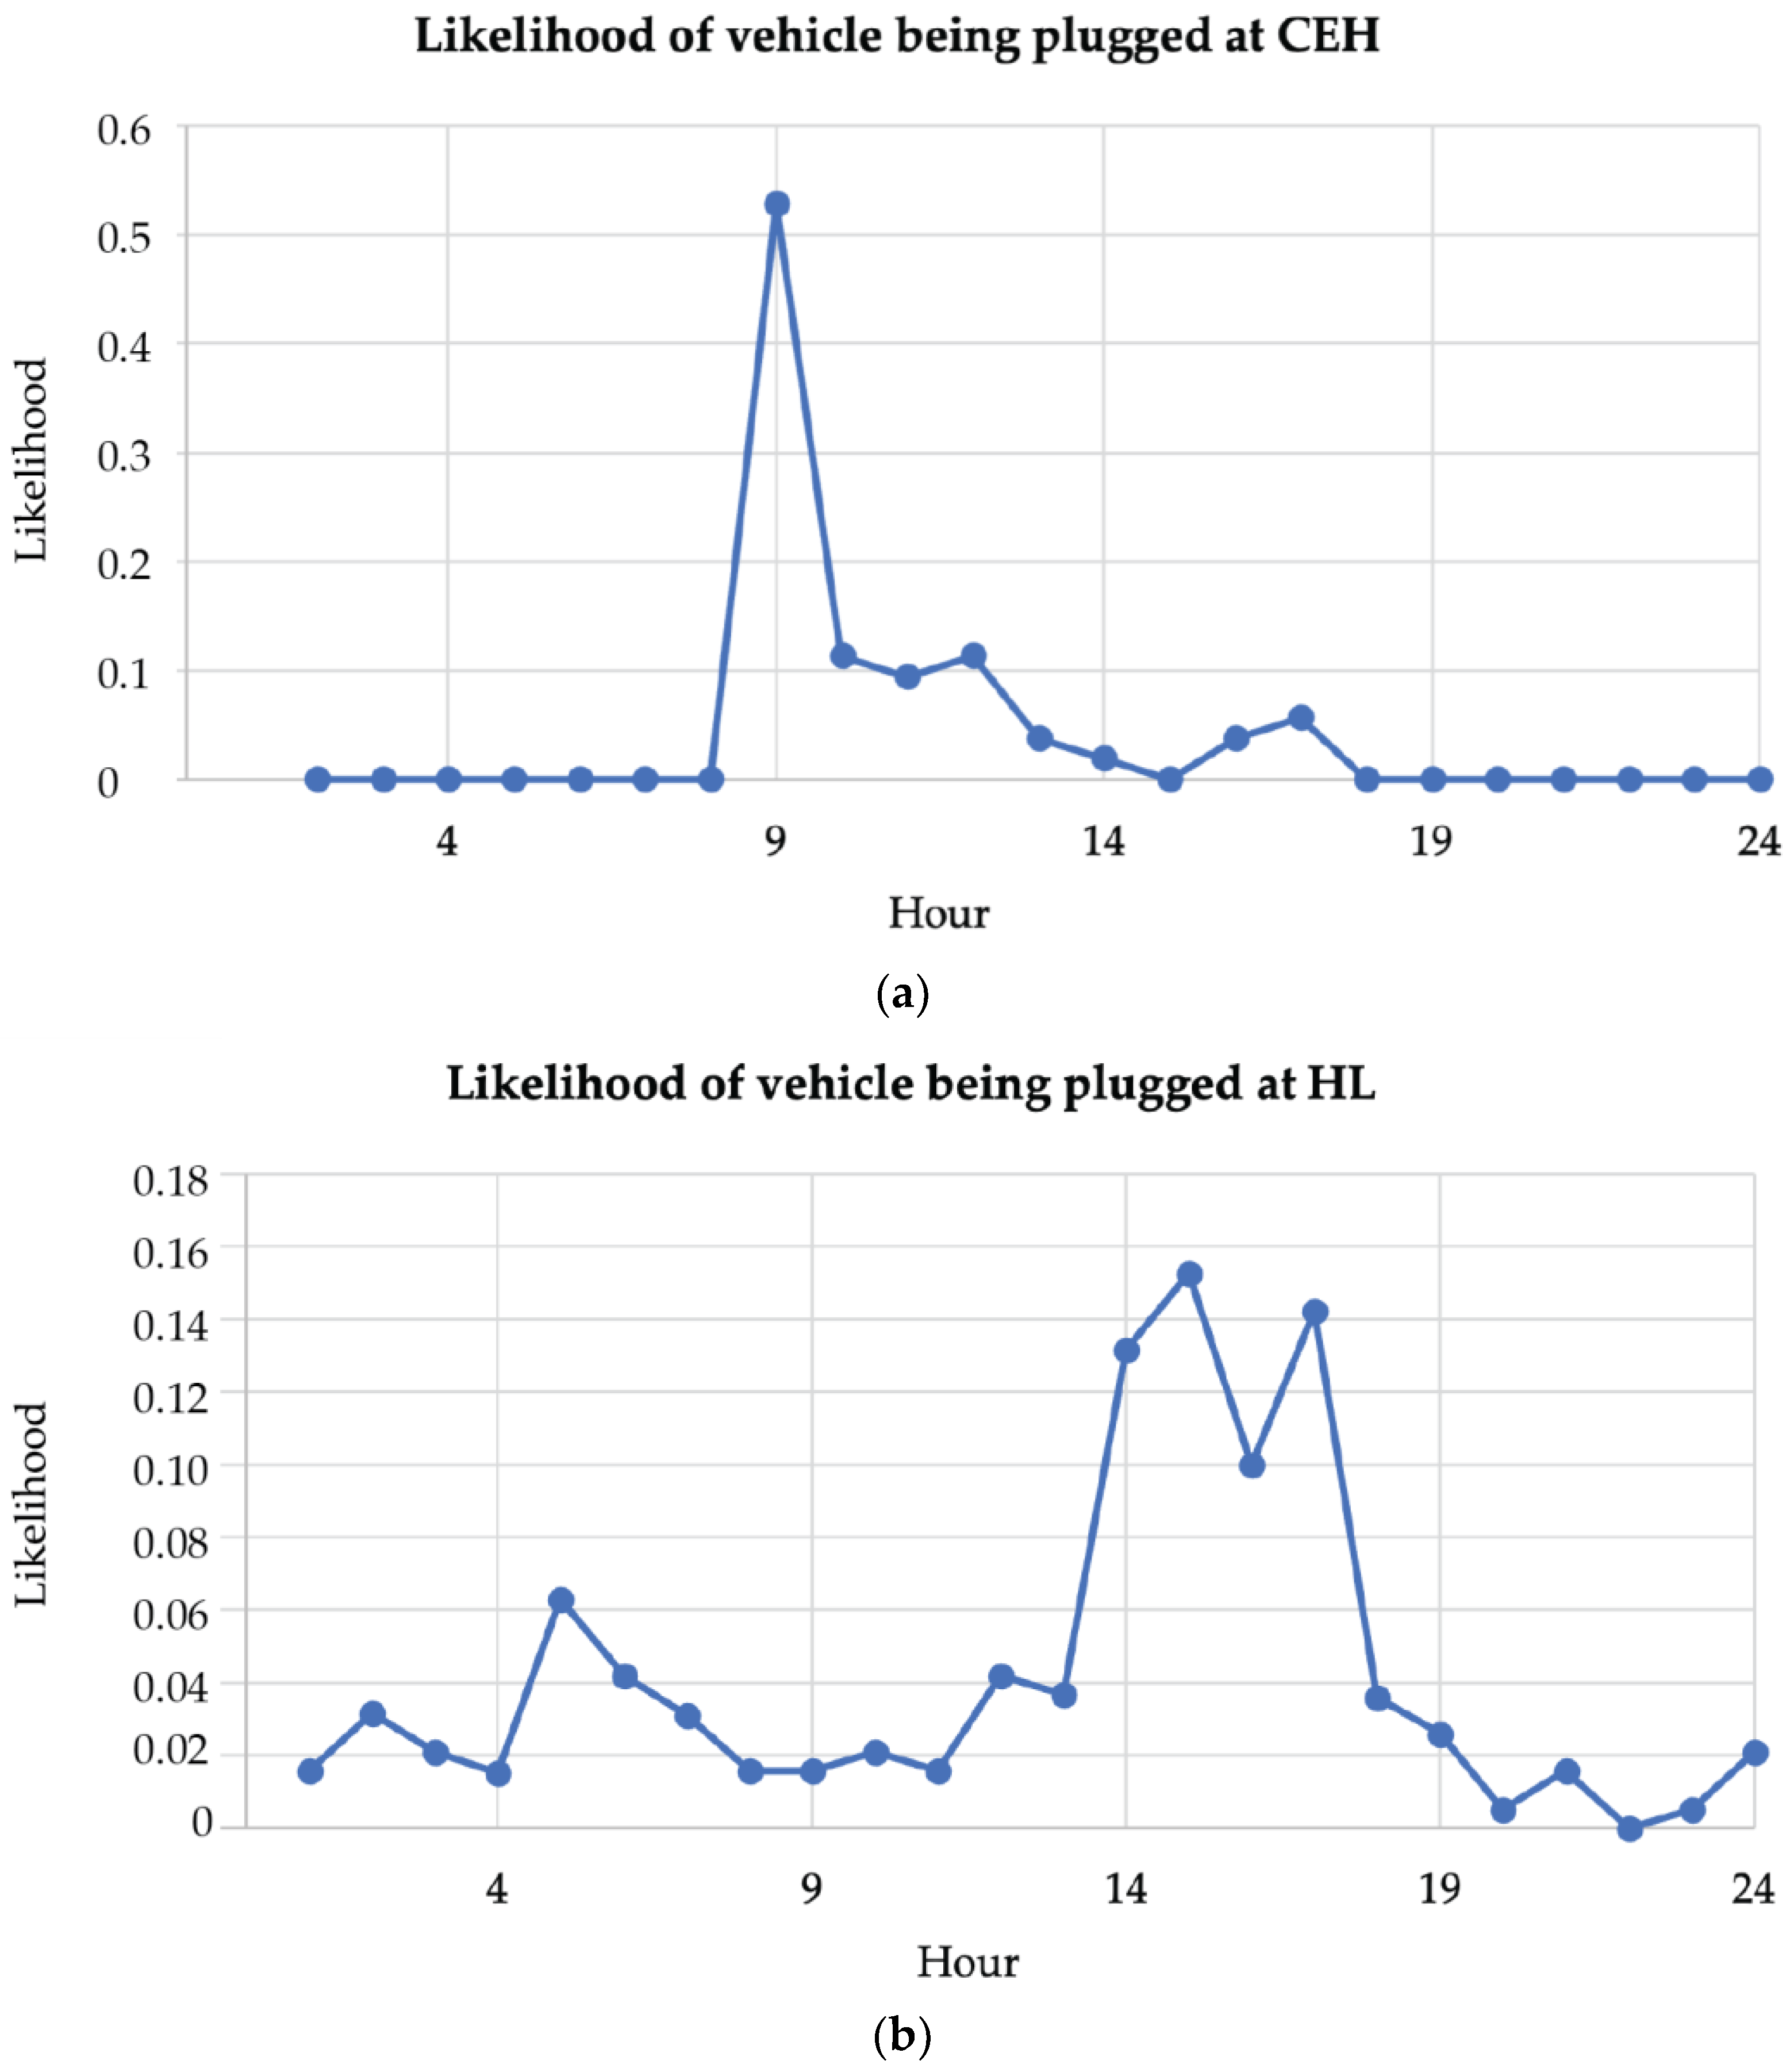
Figure 23.
Likelihood of vehicle being plugged in for (a) CEH and (b) Hallward Library.
Figure 23.
Likelihood of vehicle being plugged in for (a) CEH and (b) Hallward Library.
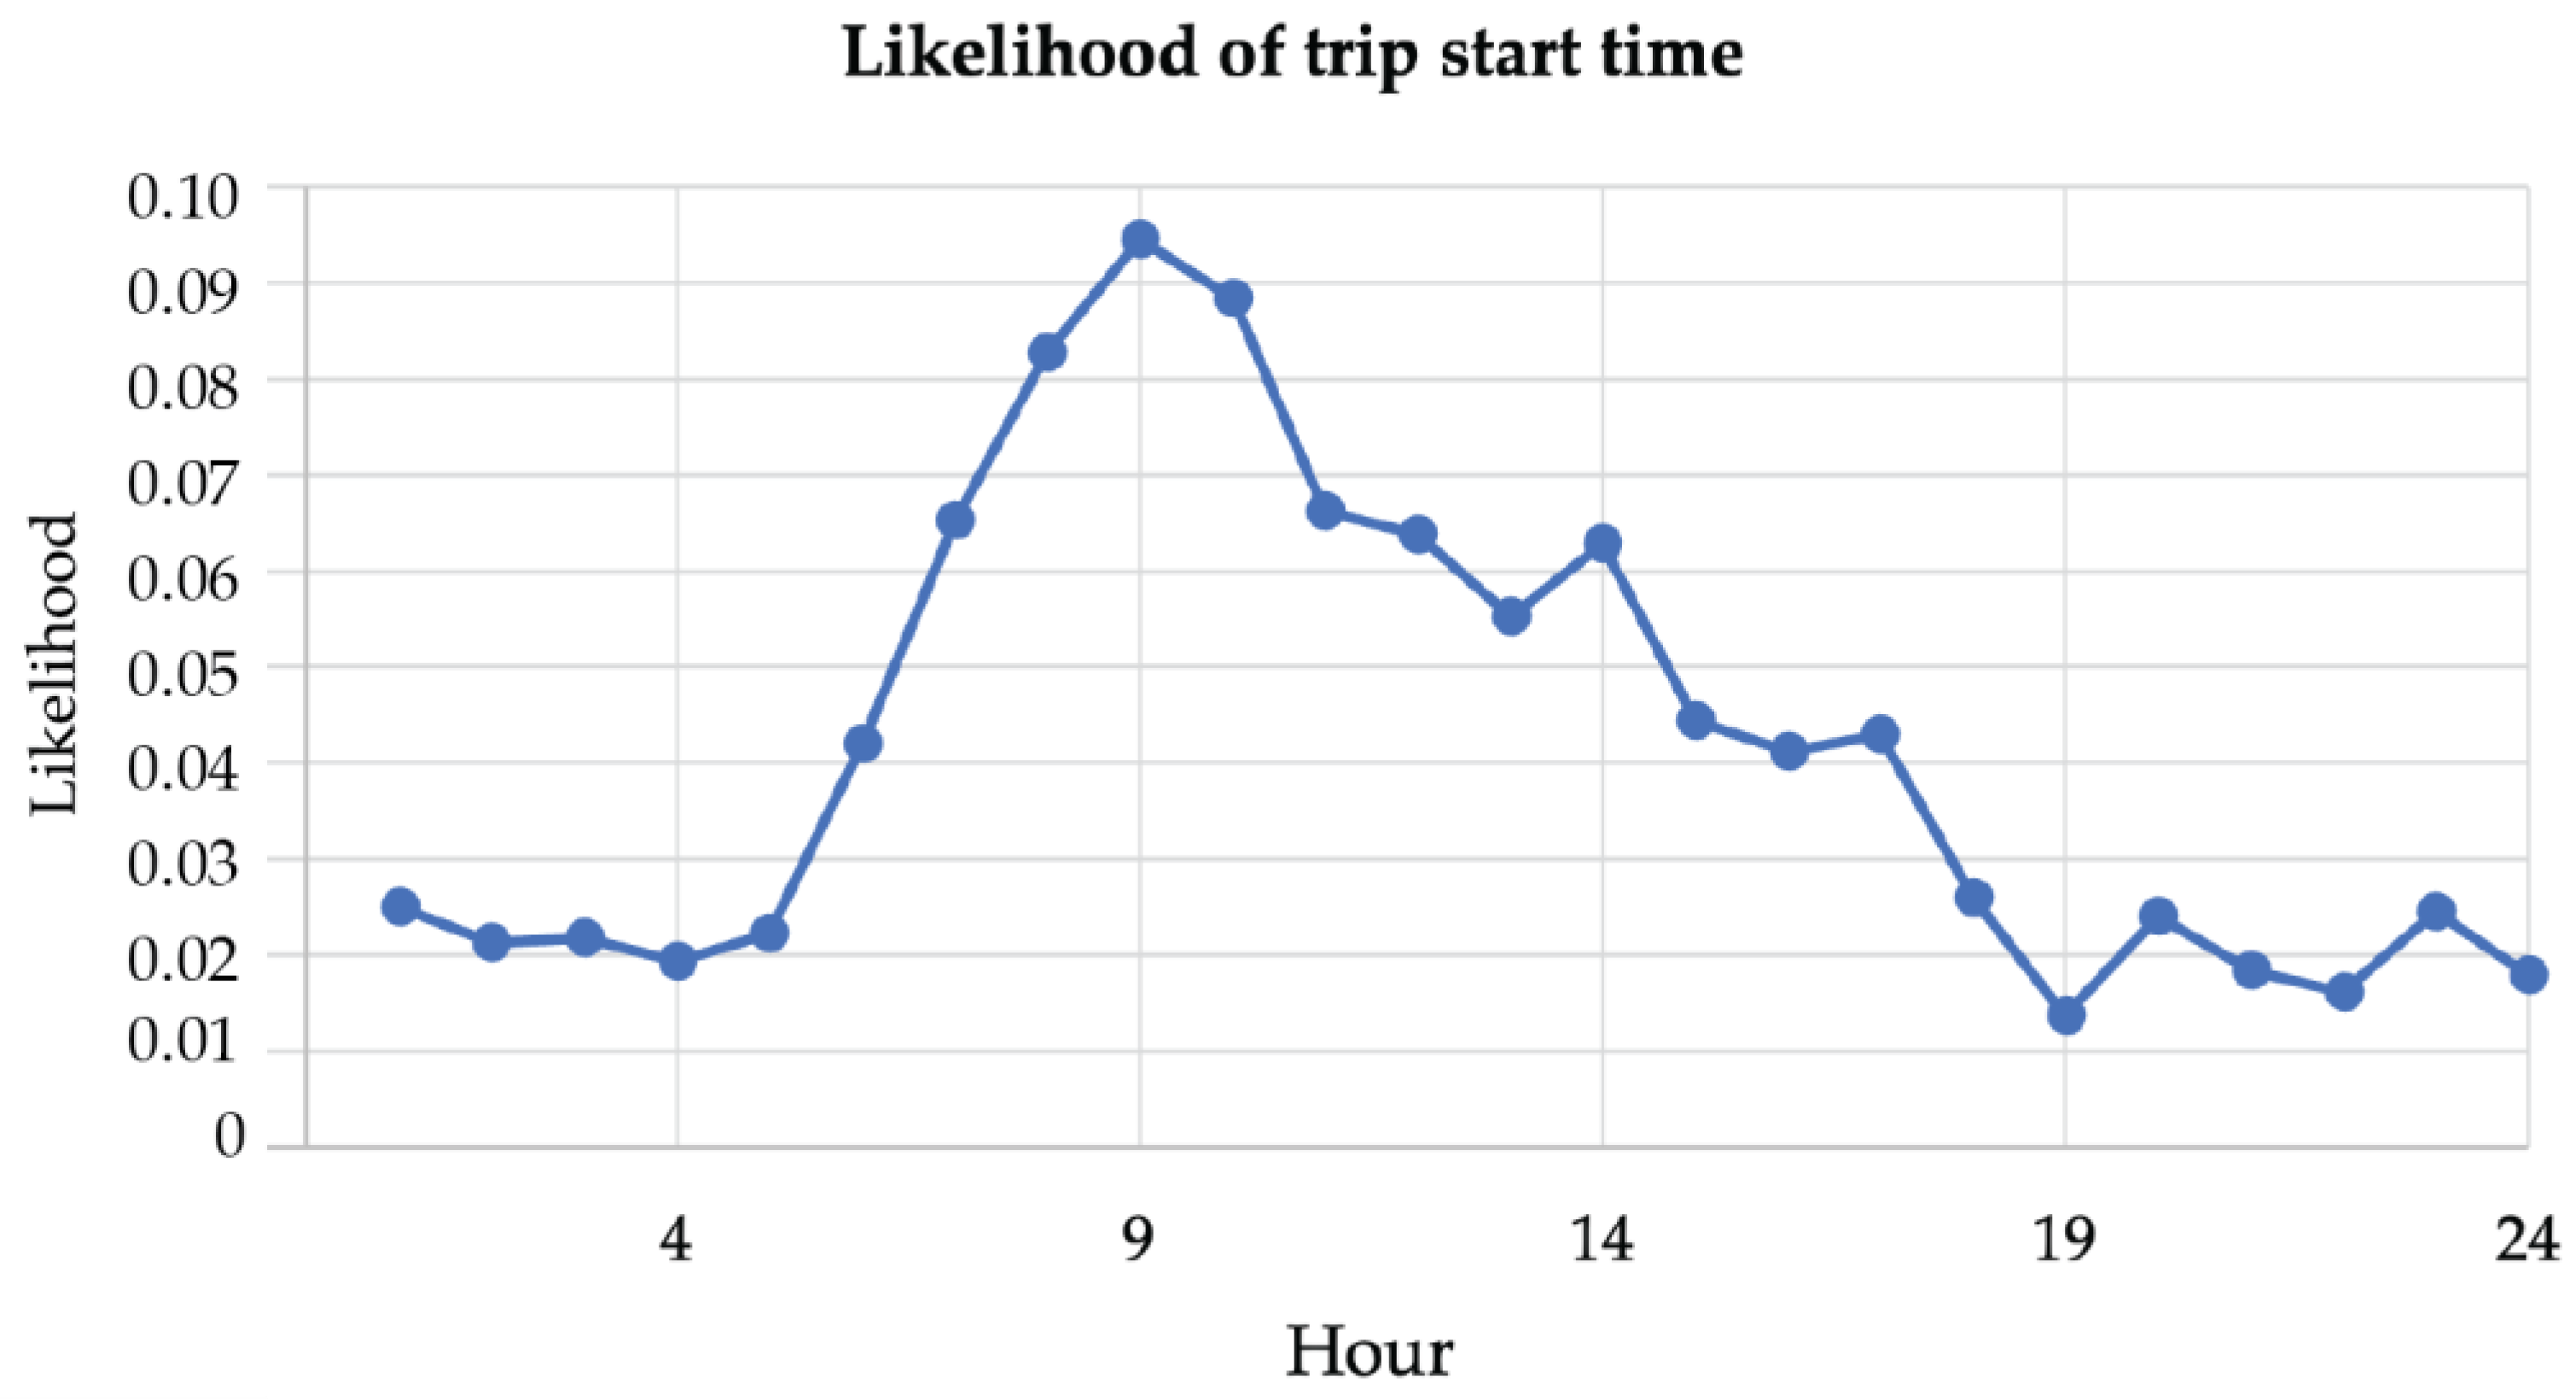
Figure 24.
Likelihood of trip start time.
Figure 24.
Likelihood of trip start time.
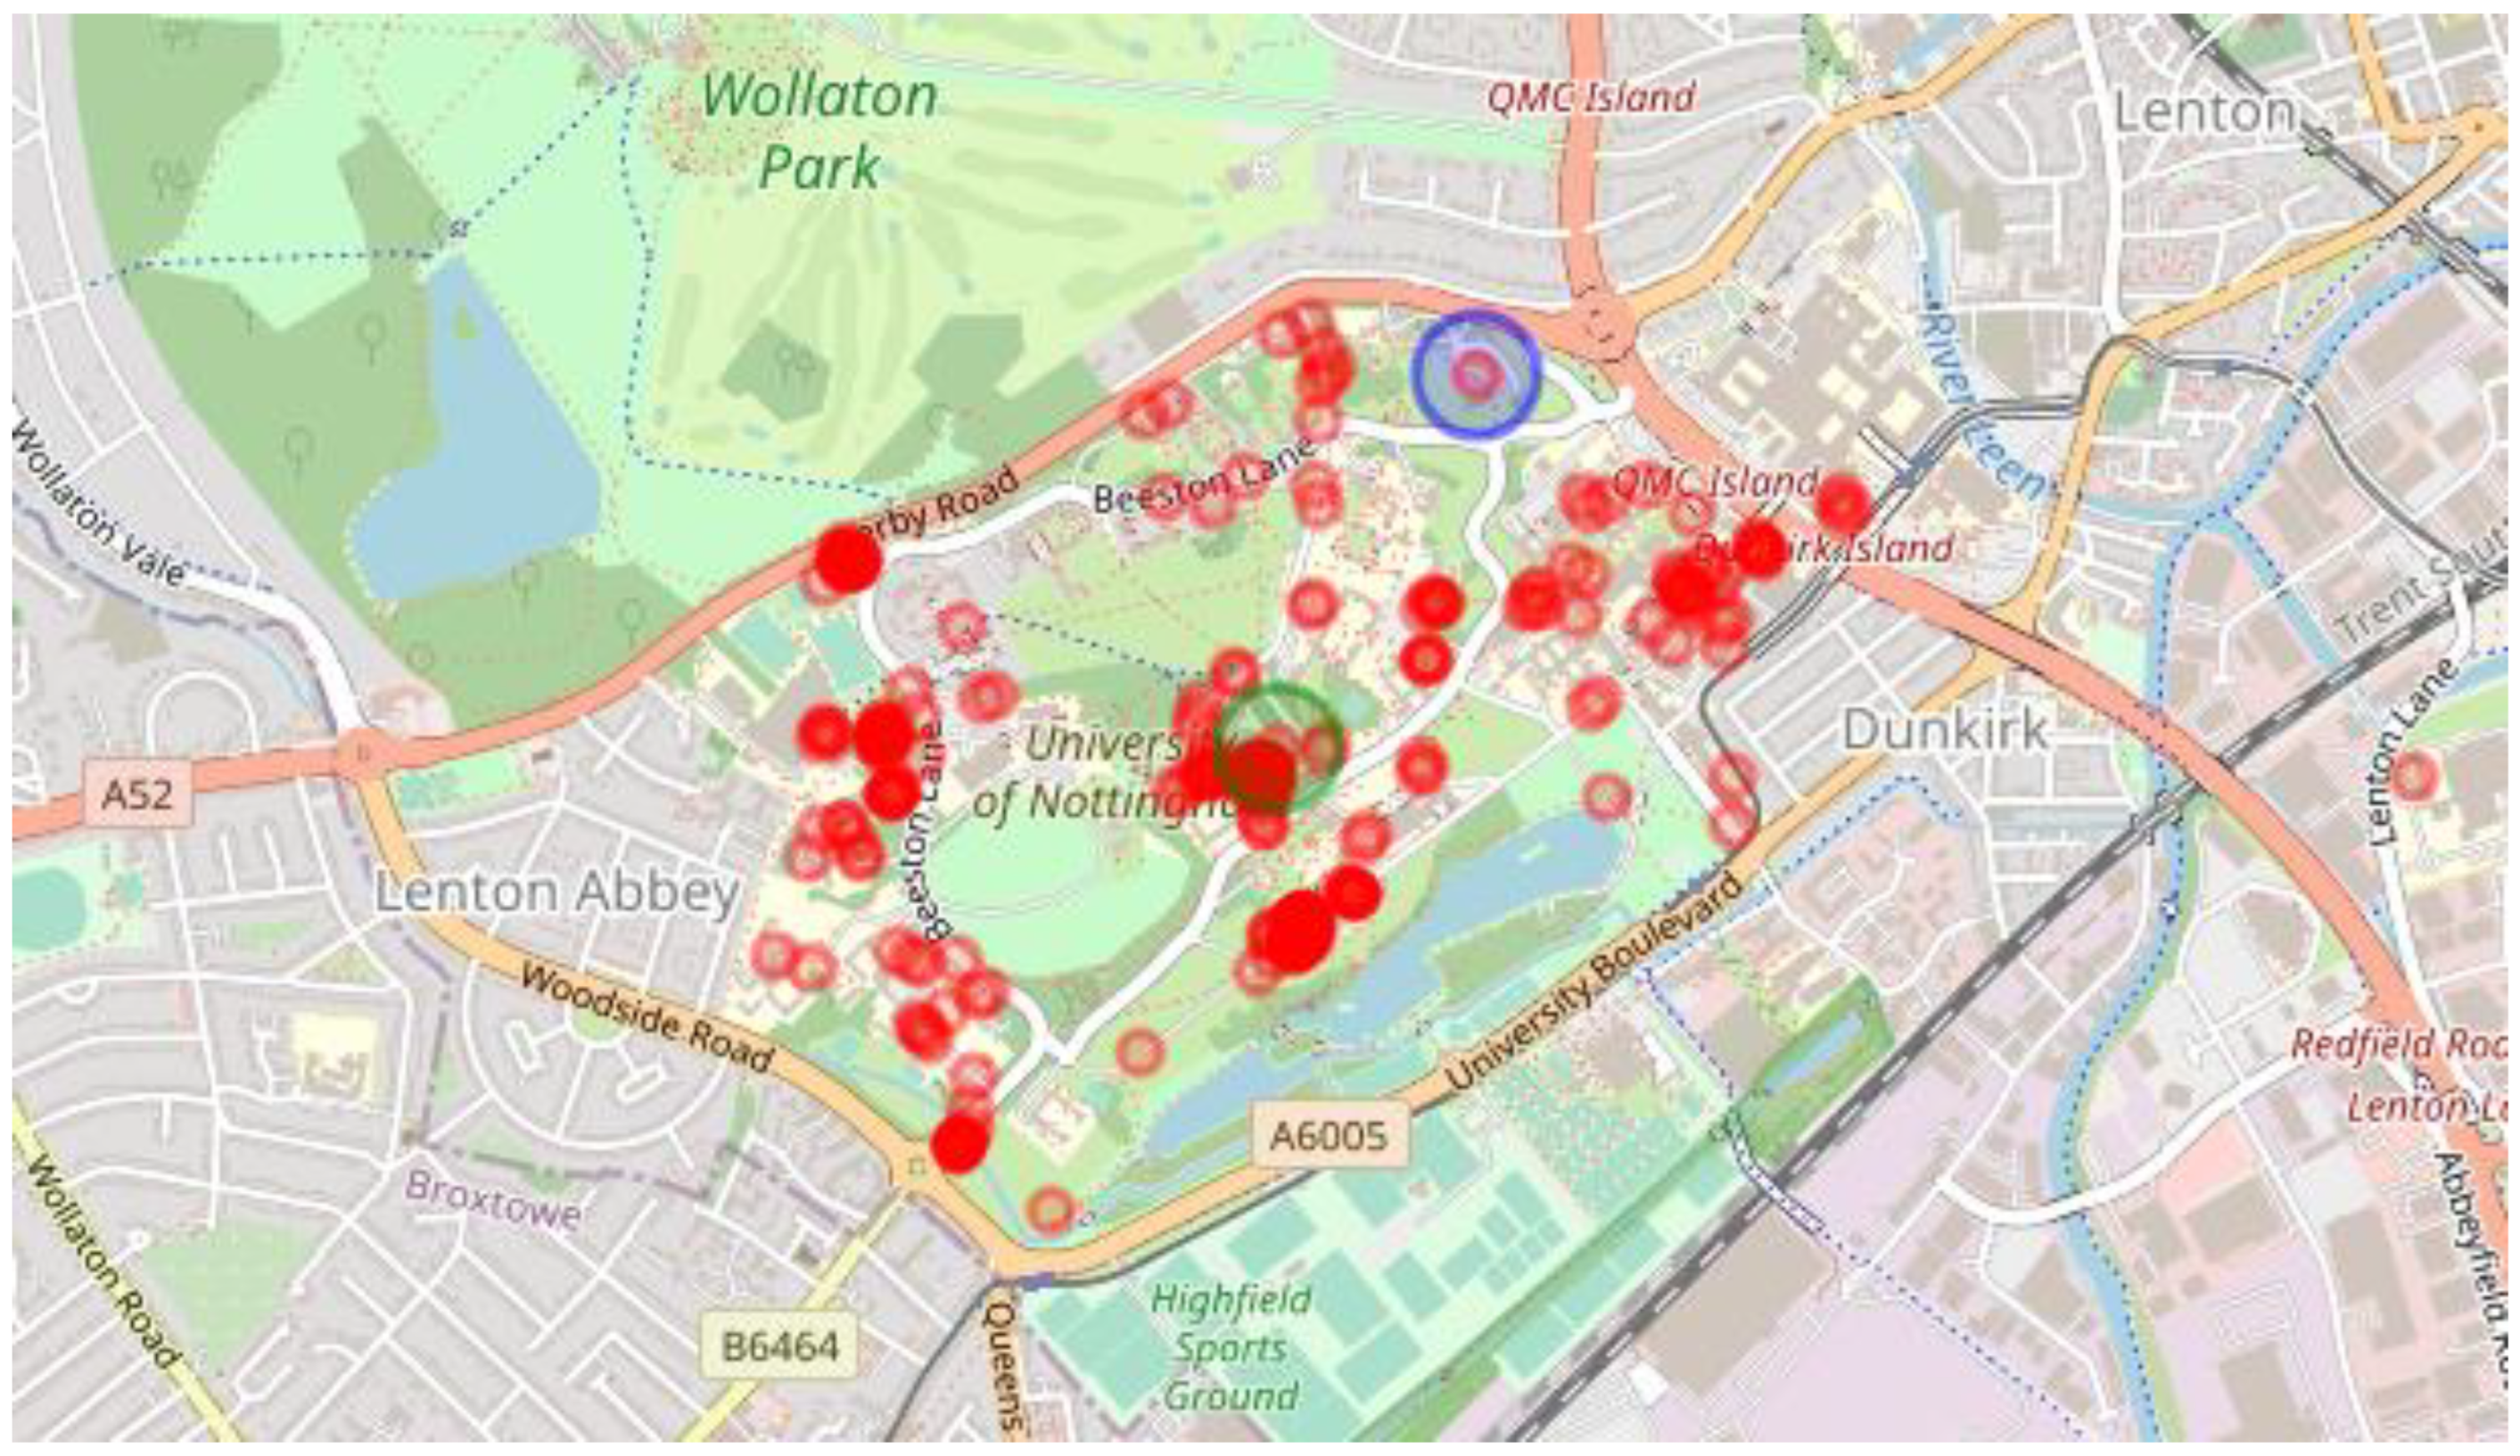
Figure 25.
Locations of the vehicle with standing time more than 30 min. In blue is marked the location of the Creative Energy Homes charger, and in green the location of the Hallward Library charger. The red colour represents the places where the vehicles remain idle.
Figure 25.
Locations of the vehicle with standing time more than 30 min. In blue is marked the location of the Creative Energy Homes charger, and in green the location of the Hallward Library charger. The red colour represents the places where the vehicles remain idle.
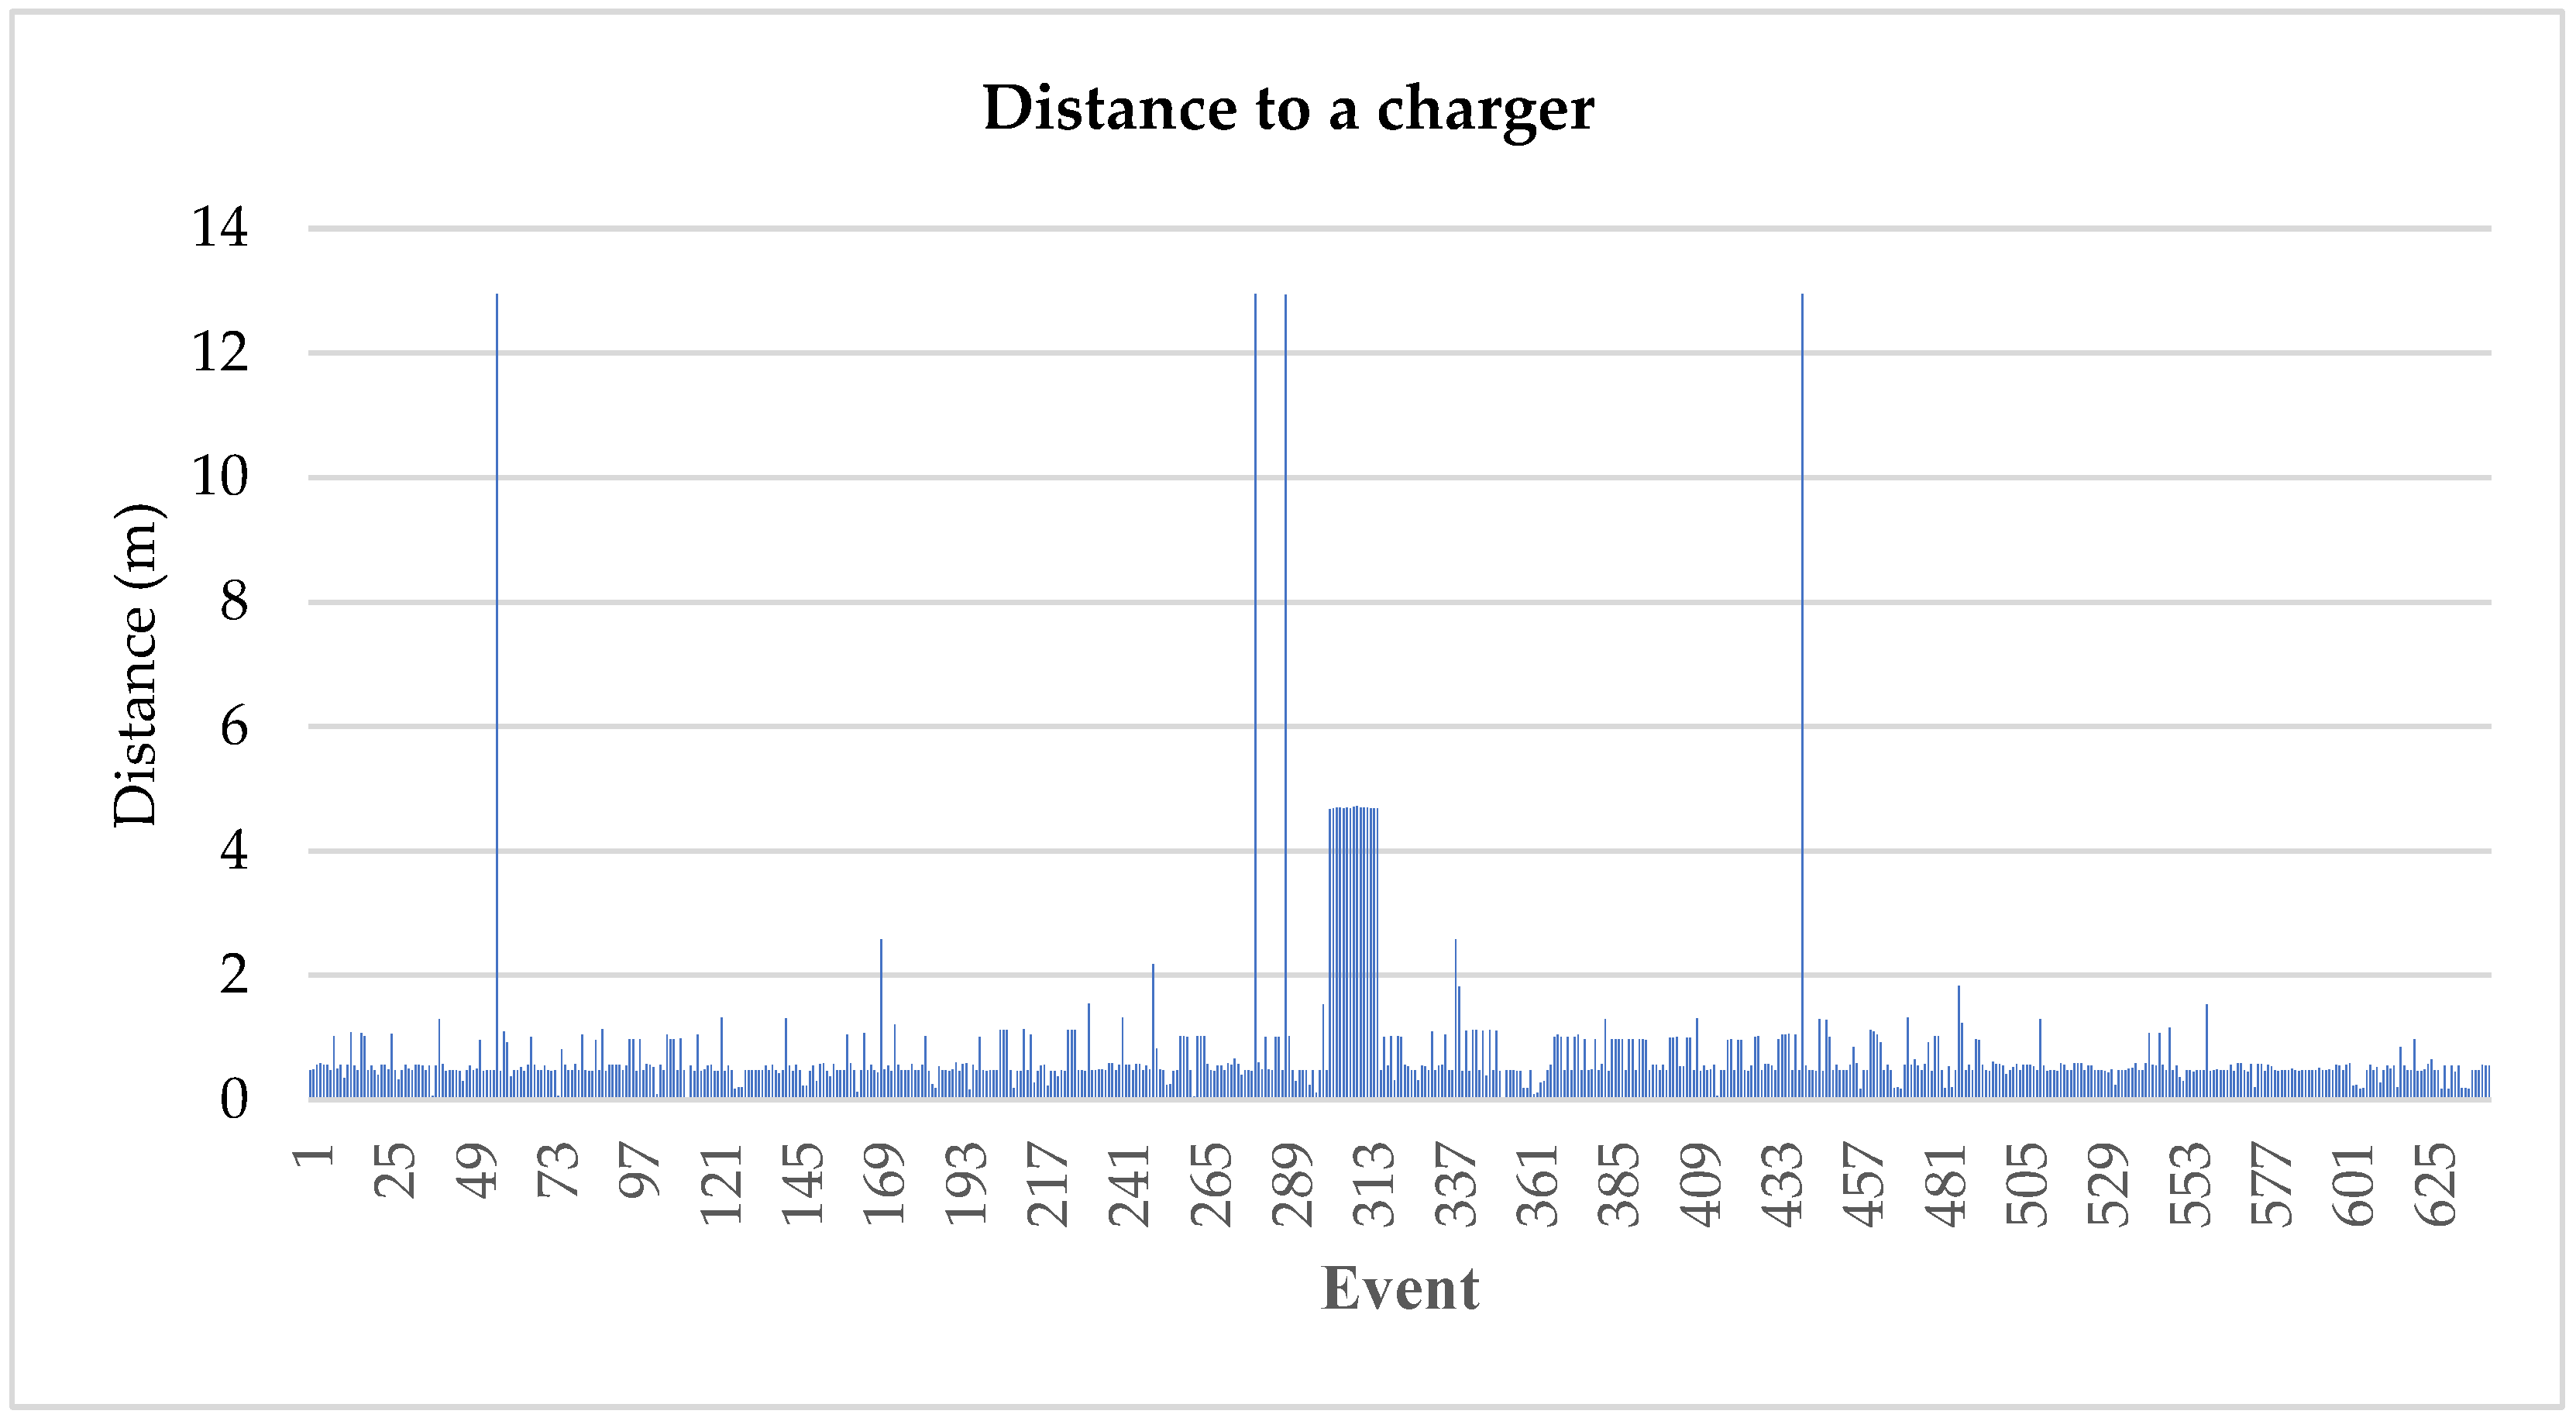
Figure 26.
Distance between standby locations and chargers.
Figure 26.
Distance between standby locations and chargers.
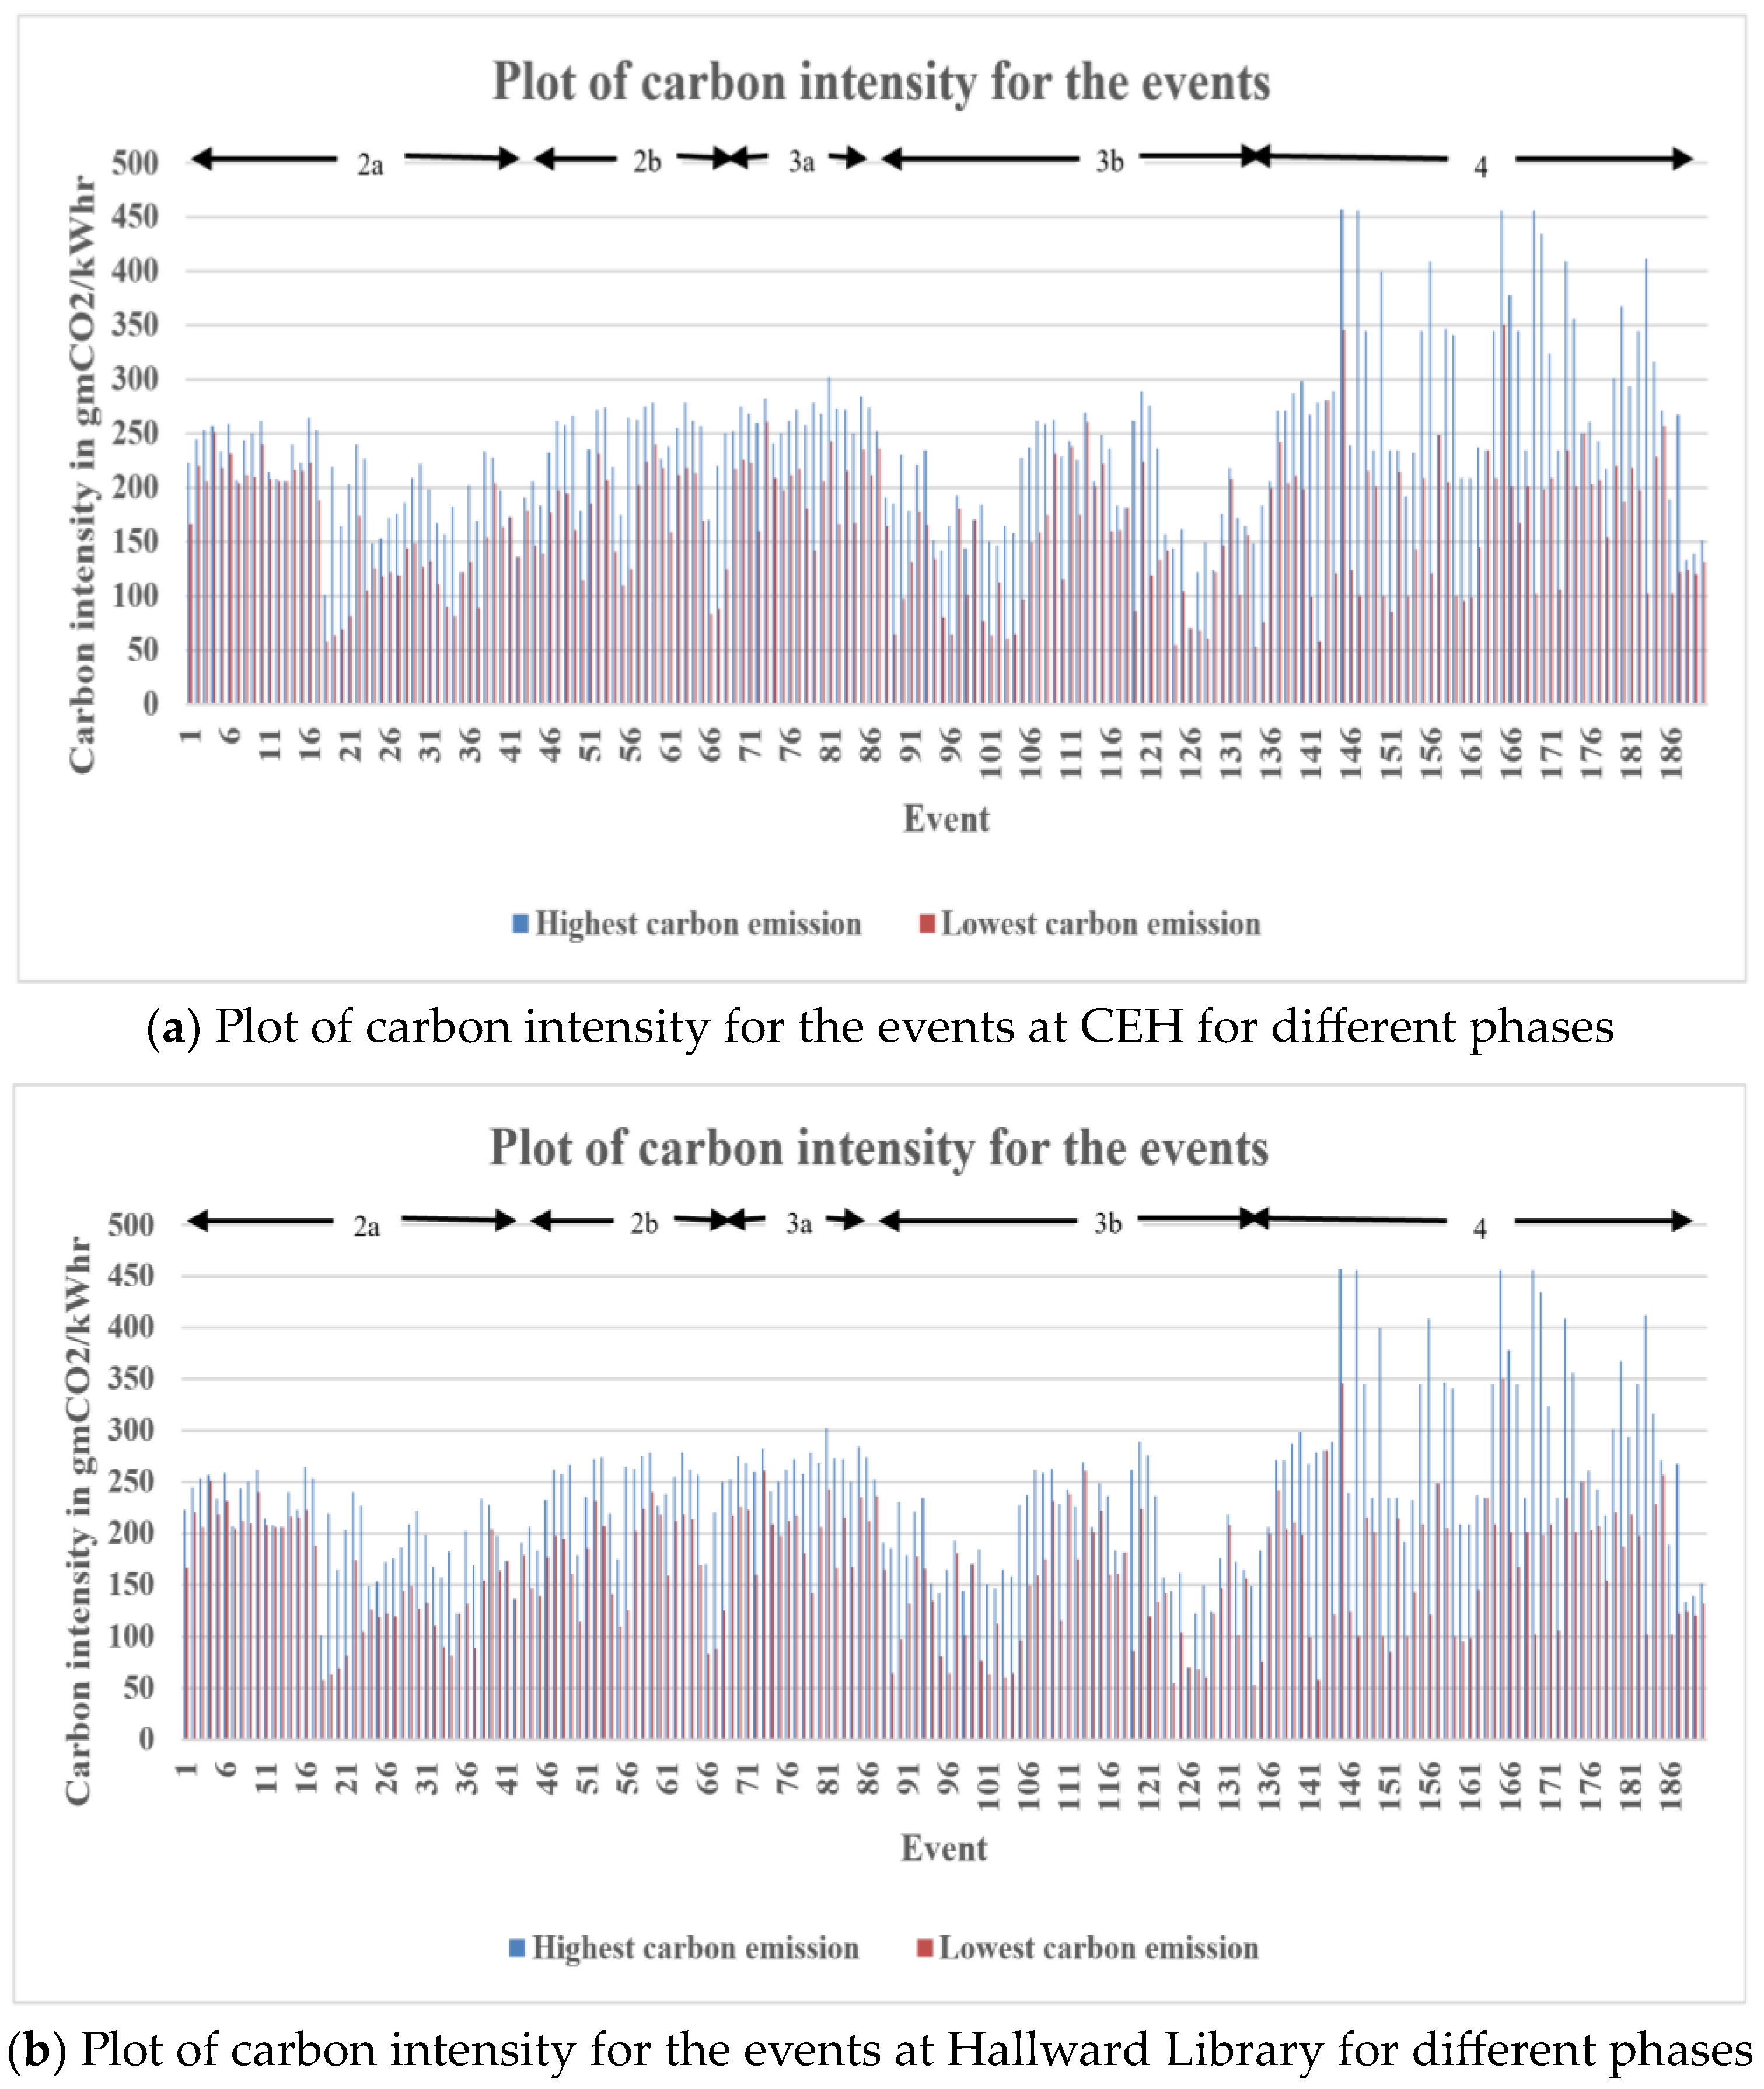
Figure 27.
Plot of carbon intensity for the events.
Figure 27.
Plot of carbon intensity for the events.
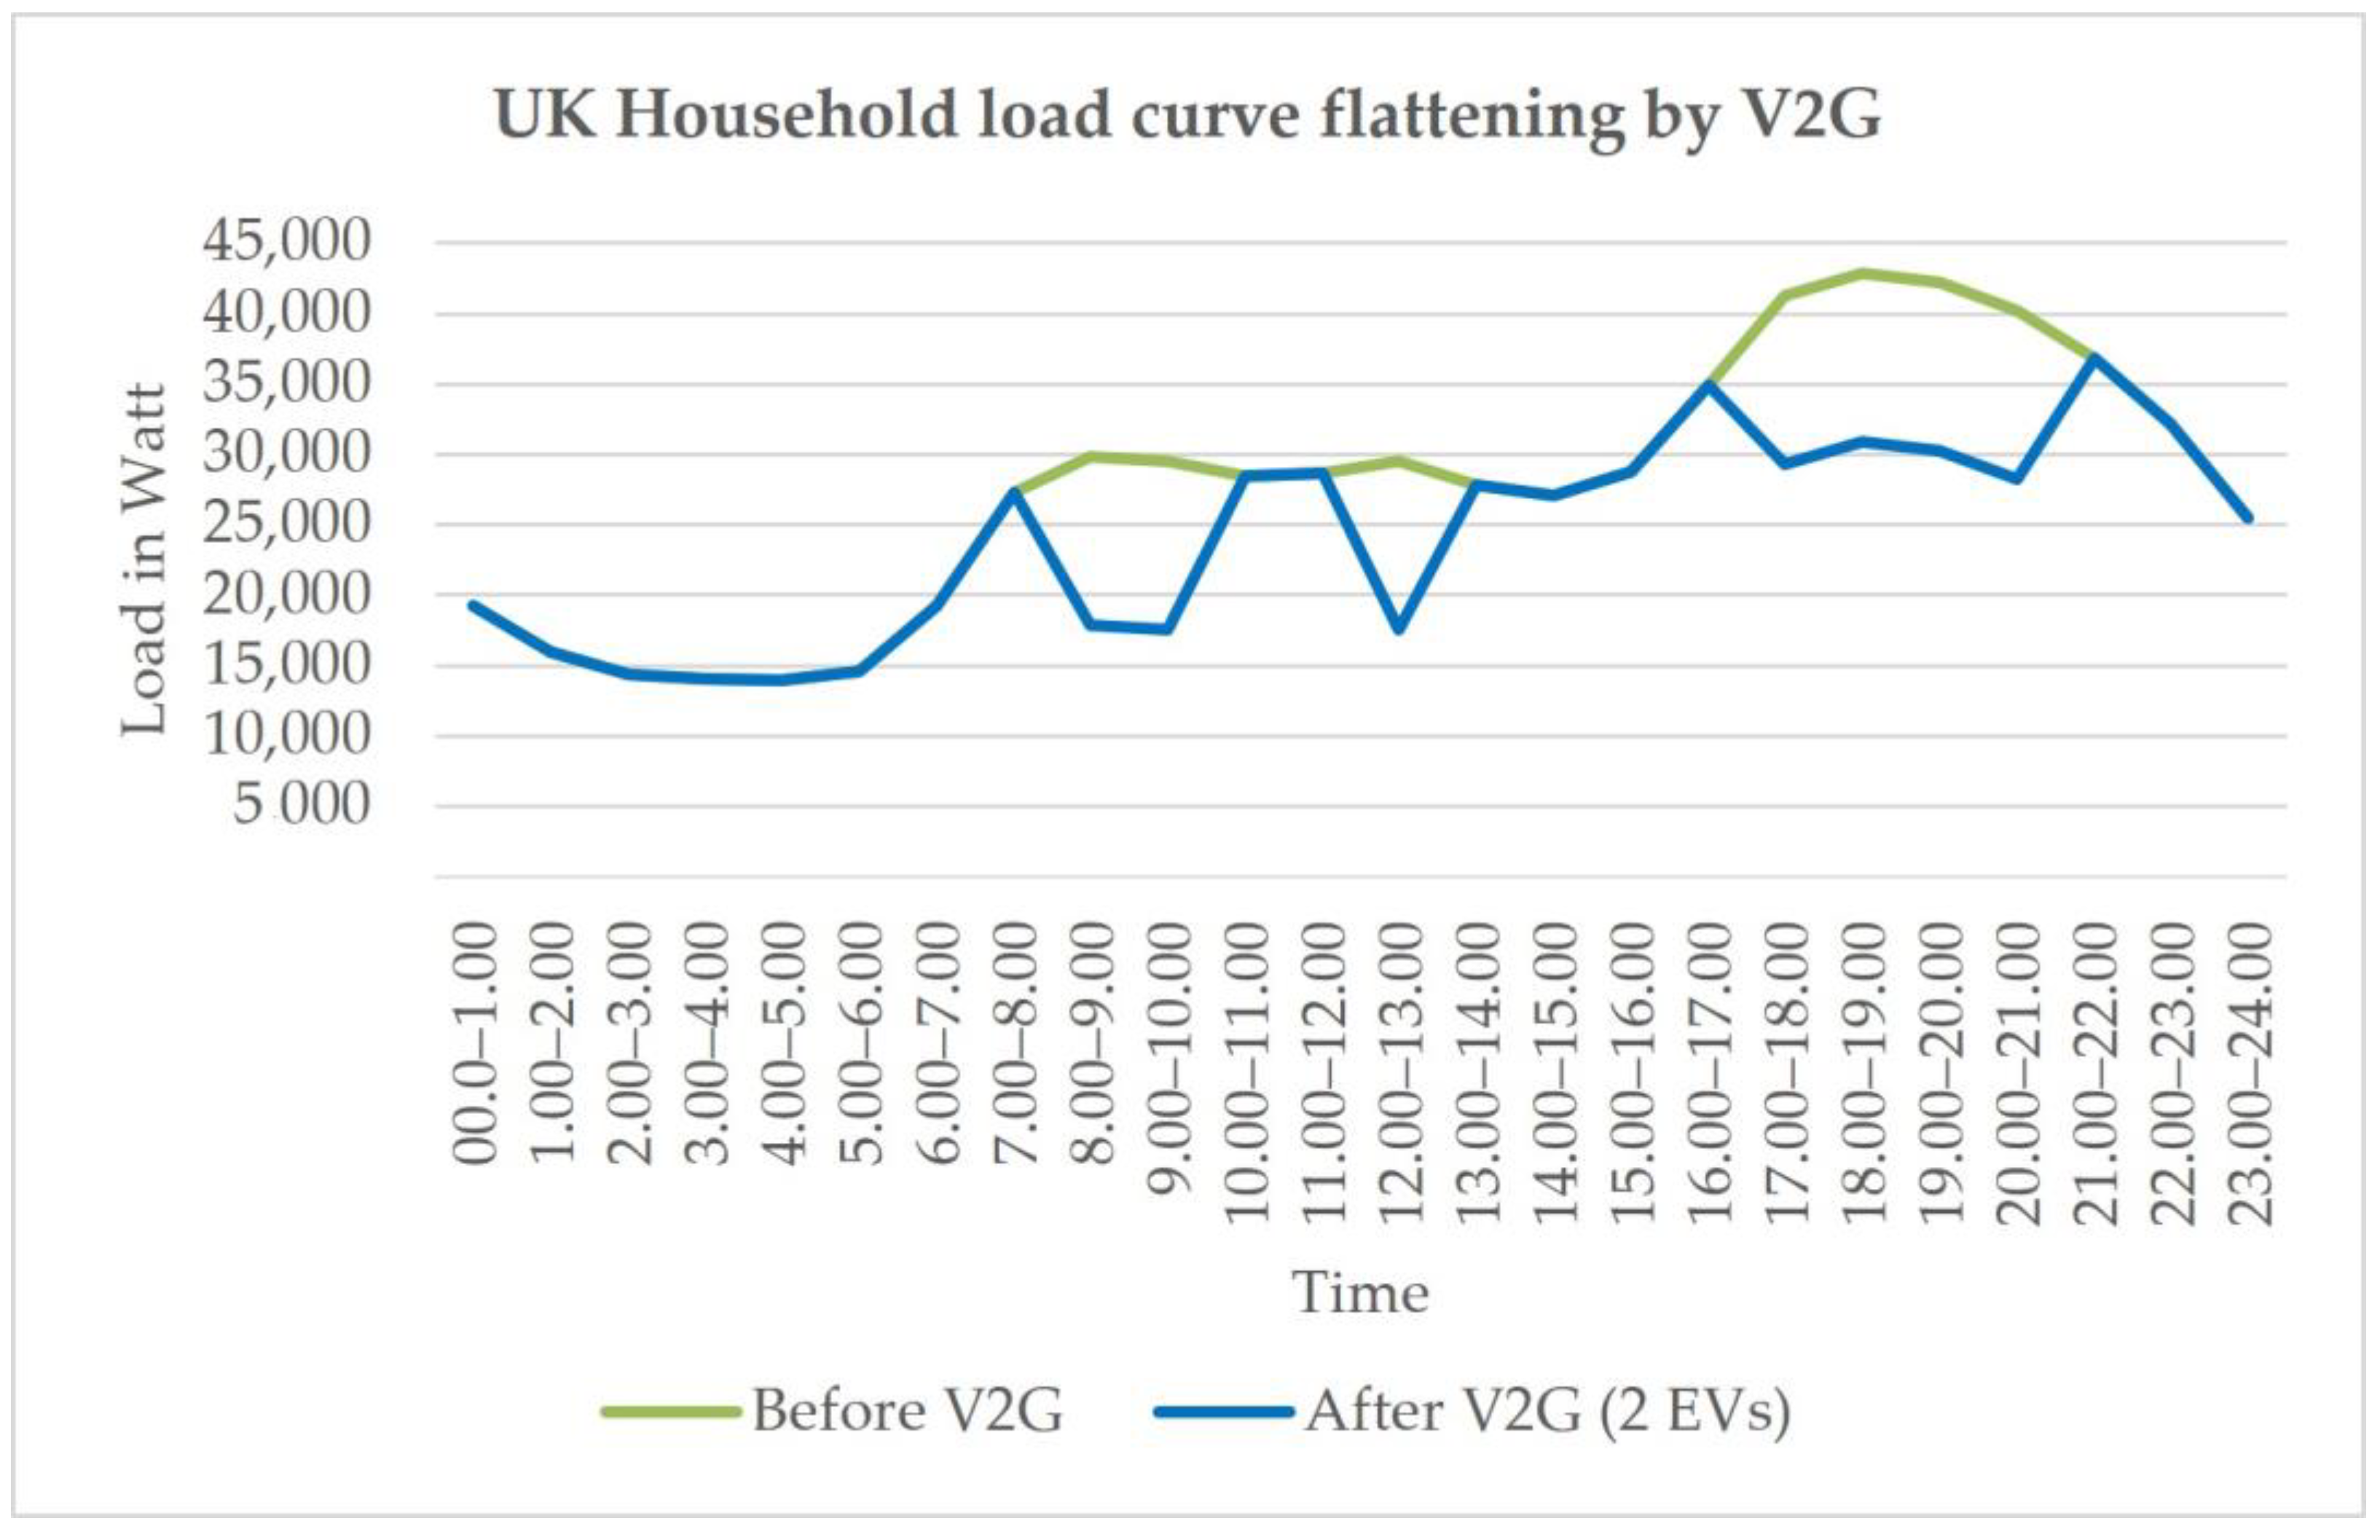
Figure 28.
UK Household-Load-Curve Flattening by V2G.
Figure 28.
UK Household-Load-Curve Flattening by V2G.
Table 1.
Details of the demonstrators at University of Nottingham [
35].
Table 1.
Details of the demonstrators at University of Nottingham [
35].
| UoN V2G Sites | Type of Vehicles | Type of Chargers |
|---|
| Creative Energy Homes (CEH) | 1 Mitsubishi Outlander PHEV, Battery: 13.8 kW | 1 × Nichicon 7 kW V2G, ground mounted |
| Hallward Library | 1 Nissan eNV200, Battery 40 kW | 1 × Nichicon 7 kW V2G, ground mounted |
Table 2.
Timeline of different trial phases [
35].
Table 2.
Timeline of different trial phases [
35].
| Phase | Description | Time of Data Collection |
|---|
| 1 | Installing and testing chargers | 4 January 2021–30 April 2021 |
| 2a | Fixed scheduling tariff optimisation | 3 May 2021–20 June 2021 |
| 2b | Fixed scheduling carbon optimisation | 21 June 2021–1 August 2021 |
| 3a | Dynamic scheduling tariff optimisation | 2 August 2021–19 September 2021 |
| 3b | Dynamic scheduling carbon optimisation | 20 September 2021–31 October 2021 |
| 4 | Conditioning battery health | 1 November 2021–31 January 2022 |
Table 3.
Distribution of the events recorded for Creative Energy Homes and Hallward Library.
Table 3.
Distribution of the events recorded for Creative Energy Homes and Hallward Library.
| Creative Energy Homes |
| Phase | No. of Events | No. of Charging Events | No. of Discharging Events |
| 2a | 4 | 4 | 0 |
| 2b | 4 | 4 | 0 |
| 3a | 6 | 6 | 0 |
| 3b | 23 | 23 | 4 |
| 4 | 12 | 12 | 6 |
| Hallward Library |
| Phase | No. of Events | No. of Charging Events | No. of Discharging Events |
| 2a | 43 | 40 | 9 |
| 2b | 25 | 25 | 23 |
| 3a | 17 | 17 | 3 |
| 3b | 51 | 51 | 18 |
| 4 | 54 | 53 | 37 |
Table 4.
Distribution of vehicle trips over the phases (data from the Nissan eNV200).
Table 4.
Distribution of vehicle trips over the phases (data from the Nissan eNV200).
| Phase | Number of Recorded Trips |
|---|
| 2a | 585 |
| 2b | 388 |
| 3a | 275 |
| 3b | 619 |
| 4 | 249 |
Table 5.
Descriptive statistics of peak power import and export for CEH.
Table 5.
Descriptive statistics of peak power import and export for CEH.
| Peak Power Import (kW) | Peak Power Export (kW) |
|---|
| Maximum | Minimum | Mean | Maximum | Minimum | Mean |
|---|
| 5.97 | 0 | 5.5 | 5.80 | 0 | 5.5 |
Table 6.
Descriptive statistics of peak power import and export for Hallward Library.
Table 6.
Descriptive statistics of peak power import and export for Hallward Library.
| Peak Power Import (kW) | Peak Power Export (kW) |
|---|
| Maximum | Minimum | Mean | Maximum | Minimum | Mean |
|---|
| 5.9 | 0 | 5.2 | 5.8 | 0 | 5.7 |
Table 7.
Descriptive statistics comparing driven and idle times.
Table 7.
Descriptive statistics comparing driven and idle times.
| Driven Duration (Seconds) | Idle Duration (Seconds) |
|---|
| Mean | Max. | Min. | Total | Mean | Max. | Min. | Total |
|---|
| 896 | 5880 | 0 | 949,425 | 520 | 70,655 | 0 | 550,496 |
Table 8.
Probability of V2G before and after charging.
Table 8.
Probability of V2G before and after charging.
| Site | Probability of V2G
before Charging | Probability of V2G
after Charging |
|---|
| CEH | 0.25 | 0.81 |
| Hallward Library | 0.69 | 0.82 |
Table 9.
Descriptive statistics related to standing time between two consecutive trips.
Table 9.
Descriptive statistics related to standing time between two consecutive trips.
| Mean | Maximum | Minimum |
|---|
| 1 h 57 min | 6 days 22 h 19 min | 0 h |
Table 10.
Likelihood of standing time.
Table 10.
Likelihood of standing time.
| Standing Time | Likelihood |
|---|
| Greater than 30 min | 0.30 |
| Between 30 min to 60 min | 0.13 |
| Greater than 60 min | 0.17 |
Table 11.
Likelihood of distance between charger location and standby location of vehicles when standing time is more than 30 min.
Table 11.
Likelihood of distance between charger location and standby location of vehicles when standing time is more than 30 min.
| Distance to the Charger | Likelihood |
|---|
| Likelihood of charger at 100 m | 0.01 |
| Likelihood of charger at 500 m | 0.53 |
Table 12.
Carbon savings achieved by discharging.
Table 12.
Carbon savings achieved by discharging.
| Creative Energy Homes |
| Net carbon emission (gmCO2) | Highest | Lowest |
| 52,600 | 46,293 |
| Savings in carbon emissions by discharging (gmCO2) | 14,844 | 13,095 |
| Hallward Library |
| Net carbon emissions (gmCO2) | 823,631 | 498,498 |
| Savings in carbon emissions by discharging (gmCO2) | 372,346 | 211,089 |


 ,
, 


