Article

Experimental Investigation of Injection and Production Cycles for Limestone Reservoirs via Micro-CT: Implications for Underground Gas Storage

1
E&P Research Institute of Southwest Oil & Gas Field Company of CNPC, Chengdu 610041, China
2
ICORE GROUP Inc., Shenzhen 518057, China
3
Petro China Southwest Oil & Gasfield Company, Chengdu 610051, China
4
Research Institute of Tsinghua University in Shenzhen, Shenzhen 518057, China
*
Author to whom correspondence should be addressed.
Energies 2024, 17(6), 1503; https://doi.org/10.3390/en17061503
Submission received: 19 December 2023 / Revised: 25 January 2024 / Accepted: 17 February 2024 / Published: 21 March 2024

Abstract

:
Global demand for underground gas storage (UGS) is steadily increasing, with the limestone-based UGS system situated in the Sichuan Basin of China gathering considerable interest in recent years. However, studies focusing on the fundamental mechanisms of the injection-production process in these systems are limited. Moreover, existing studies utilizing physical experimental methods frequently fall short in effectively visualizing micro-flow or incorporating real core samples from the reservoir. To address these gaps, we performed a coreflood experiment, integrating micro-Computed Tomography (CT) scanning to investigate mechanisms of fluid flow and storage capacity during the injection and production cycles in limestone reservoirs. Our approach involved utilizing core plugs with artificially engraved fracture-vuggy structures, which mimic the characteristics of the reservoir. Micro-CT scans were performed to visualize the microscopic changes in fractured-vuggy structures and the distribution of irreducible water during each cycle. This study reveals that increased cycles correspondingly affect gas storage capacity, particularly by expanding it in relative larger vuggy structures while reducing it in finer fissure network structures. The amount of irreducible water decreases after injection-production cycles, likely being expelled alongside the extracted dry gas. This plays a critical role in expanding the storage capacity in larger vuggy systems. Conversely, there is a decrease in storage capacity within fissure network systems, as the irreducible water is replaced by gas. This leads to a reduction in the opening force of the fine conduit. The dense matrix has a very limited effect on the flow mechanism and its influence on storage capacity. Overall, these findings offer practical insights for optimizing injection and production strategies in limestone UGS systems within the Sichuan Basin, contributing to a deeper understanding and efficient utilization of this vital infrastructure.

1. Introduction

With the rapid advancement of the oil and gas industry and the continued rise in energy consumption, the demand for UGS has increased significantly. The history of UGS development dates back over a century, with the world’s first UGS facility established in Canada’s Welland gas field in 1915 [1,2]. Subsequently, Western countries began conducting gas injection experiments and initiated the early constructions of such storage facilities. This was followed by a rapid phase of UGS development starting in the 1950s [3]. According to the International Gas Union UGS database, there are currently 927 UGS facilities worldwide, with three primary types: depleted gas/oil reservoirs, salt caverns, and aquifers. The majority of these UGS sites are situated in geologically simple structures, characterized by shallow burial depths and favorable reservoir properties [4,5,6].
China commenced its foray into UGS construction relatively late, with its first facility established in 1999, marking the onset of the country’s UGS development journey. In China, UGS site selection faces challenges due to complex geological structures, deeper burial depths, high pressures, and intricate reservoir characteristics, making many of the existing experiences in UGS development unsuitable for direct application. By 2022, after over 20 years of development, China had completed 28 UGSs with a gas production capacity exceeding 150 × 108 m3 [7]. However, the majority of these sites, feature low porosity and permeability and are situated at depths exceeding 2500 m. The gas reservoirs that can be converted to UGS in the Sichuan Basin are predominantly characterized by carbonate reservoirs. These often exhibit well-developed fractured-vuggy systems, coupled with a low porosity and permeability matrix, a typical dual-media with significant heterogeneity, which complicates the fluid flow mechanism during the cyclic injection and production. The M UGS, situated in Sichuan, China, is converted from a depleted limestone gas reservoir. This reservoir is part of the Permian Maokou Formation, characterized by thick bioclastic limestone with platform facies. Due to various structural phases, surface karstification, and diagenesis, both the storage capacity and permeability of the reservoir have significantly improved, resulting in the formation of a fractured-vuggy type reservoir. However, extensive core petrophysical property data from the area reveals that approximately 80% of the samples have a porosity of less than 2%, and 82% exhibit a permeability of less than 0.1 mD, indicating overall low porosity and permeability of the reservoir [8]. Carbonate UGS, particularly limestone reservoirs with substantial heterogeneity, constitute a relatively small proportion of global UGS. Consequently, limited experience and knowledge from previous worldwide developments are applied as reference. This highlights the urgent need for further investigation into the pore-scale injection and production for better understanding of flow characteristics and the storage capacity of highly heterogeneous limestone UGS.
Currently, research focusing on the fundamental mechanism of the injection-production process in limestone UGS is limited. The most direct and effective approach is through physical experimental evaluation techniques [9,10,11]. These techniques primarily include microscopic visualization and coreflood experiments. Microscopic visualization experiments, in particular, enable the examination of fluid flow characteristics at a microscopic level. This is achieved by replicating the pore structure of reservoir cores onto optical glass plates [12,13]. However, models based on idealized pore structures are too abstract to accurately replicate the complex structure of underground reservoirs. In contrast, coreflood experiments for UGS utilize actual reservoir cores to conduct injection and production operation experiments [9,14,15]. This method offers valuable insights into fluid flow characteristics and storage capacity during these processes. Yet, a limitation of this approach is its inability to visually capture the physical changes at the pore scale, as it primarily records data from the coreflood experiment.
In this research, we conducted pore-scale coreflood experiments utilizing micro-Computed Tomography (CT) scanning on limestone core plugs. The primary objective of this approach was to explore the underlying mechanisms governing fluid flow and storage capacity within highly heterogeneous fractured-vuggy systems, while considering the influence of various injection and production cycles. The identification of fractured-vuggy structures was accomplished through seismic interpretation employing ant tracking attribute techniques, as well as traditional outcrop observations. Following the identification of these distinctive patterns, a meticulous approach was employed to replicate them onto authentic core plugs using precise laser engraving techniques. This study facilitated the precise visualization and assessment of injection and production capacity at the pore scale, thereby providing crucial insights for comprehensive reservoir-scale investigations. Furthermore, this research can contribute significantly towards the improved selection of parameters for carbonate underground gas storage (UGS) operations. It can also support the optimization of injection and production well designs, and further enhance the technological advancements associated with the conversion of complex carbonate gas reservoirs into UGS facilities.

2. Methods

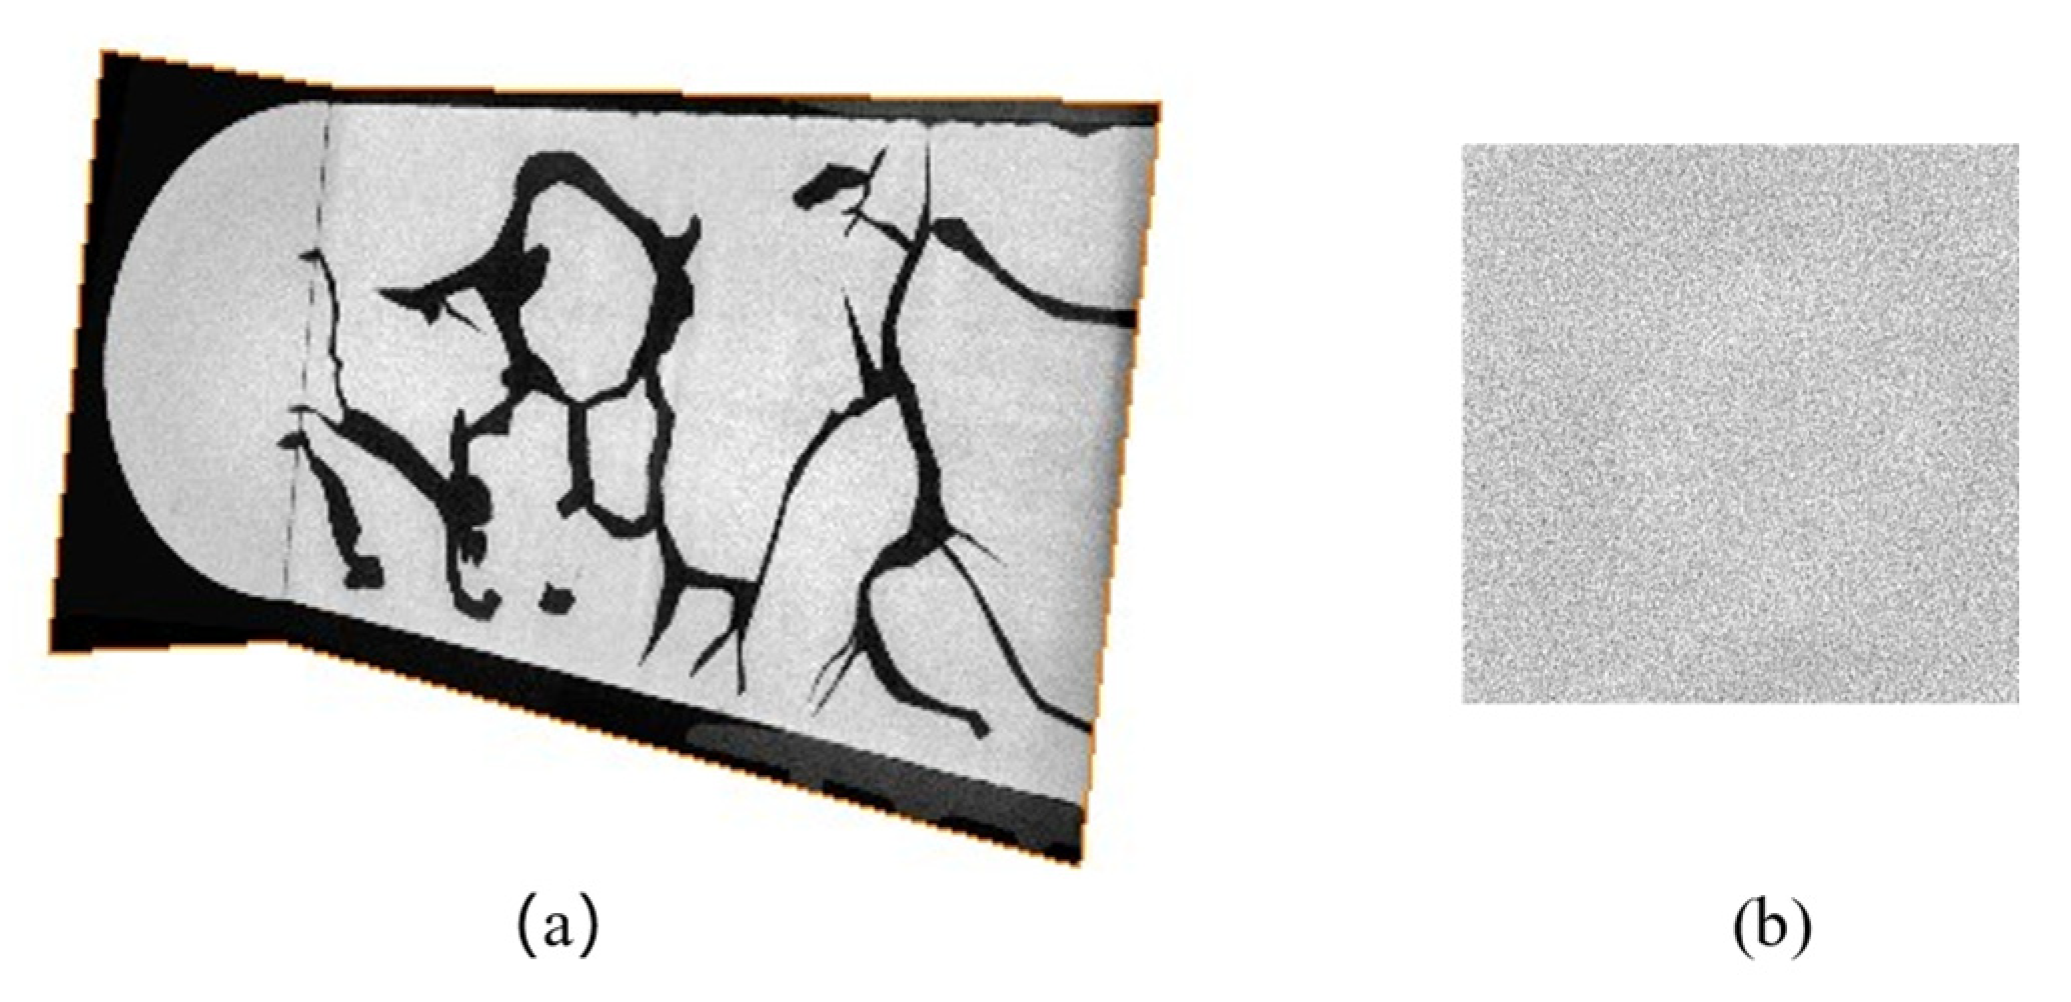
2.1. Fractured Vuggy Core Samples and Engraving

This experiment utilized core plug samples obtained from the limestone reservoir of the Permian Maokou Group. The reservoir contains large fracture and cave systems, as indicated by frequent venting and loss of circulation during drilling operations, as well as analysis of production data. However, the core samples recovered from the existing wells and the newly drilled Well M-UGS-1 predominantly showcase the properties of the dense matrix, lacking descriptive information about the characteristics of the developed fractured-vuggy reservoir. Therefore, obtaining effective core samples for experimental purposes becomes challenging. Micro-CT scans of conventional cores from existing Well M-11 and the newly drilled Well M-UGS-1 further validate this observation.
In order to replicate the reservoir characteristics, physical experiments on carbonate reservoir cores often resort to artificial fracturing methods to imitate the desired features [16]. However, commonly employed pressurization fracturing methods fail to accurately represent the complex structure of the actual fractured-vuggy system found in carbonate reservoirs. To better simulate the fluid flow mechanism and storage capacity during the injection and production processes, this study proposes a solution based on the principle of similarity. Utilizing seismic interpretation data and outcrop data, three types of reservoir fractured-vuggy schemes were designed (refer to Figure 1). The seismic data utilized in this study encompassed a frequency band ranging from 8 to 55 Hz, with the dominant frequency centered around 35 Hz. This frequency range is suitable for the prediction of reservoir properties. Figure 1a,d showcase the Ant Tracking attribute, which is a fault-enhancing attribute specifically designed to identify fracture corridors and karst features within carbonate formations. This attribute is particularly effective in revealing the subsurface morphology of fractures and vugs present in limestone gas reservoirs. To emulate the characteristics of the reservoir, artificial engravings of fracture-vuggy structures were carefully applied to the core plugs obtained from the reservoir. These engravings were strategically created to replicate the patterns observed in the reservoir, allowing for a representative representation of its unique features [17,18].
Specifically, Scheme A represents a distal fracture connected to larger vugs, simulating the plan for a single well in a distal location (Figure 1a–c). Scheme B illustrates a fracture penetrating a circular vuggy system, serving as an analogy for a penetrated horizontal well plan (Figure 1d–f). Scheme C depicts a fracture network, representing a plan without any controlled well (Figure 1g,h). To engrave these three schemes onto the core plugs, laser engraving technology was utilized. Table 1 provides an overview of the physical parameters associated with the three core plugs. The diameters of the core plugs range from 24.81 to 24.90 mm, while the lengths range from 43.73 to 49.89 mm.

2.2. Micro-CT Scan

Micro-CT (Computed Tomography) is a non-destructive imaging technique that provides high-resolution 3D images of objects. In this study, we used the nanoVoxel-3502E micro-CT system, manufactured by QingNengSanYing, a leading Chinese manufacturer. The use of CT scanning technology facilitated the creation of three-dimensional digital cores, accurately depicting the intricate pore structures of rock samples. This approach not only enables the visualization of internal structures but also supports various numerical simulations and the calculation of petrophysical parameters through detailed analysis of the acquired data [19,20,21,22,23]. Utilizing this technique, researchers can gain a deeper understanding of the physical characteristics and qualities of rock samples, which is crucial in fields such as geology and petroleum engineering [24,25].
The process involves several steps: sample preparation, setting the scanning resolution, image processing, three-dimensional reconstruction modeling, selecting target areas for pore structure recognition, establishing a three-dimensional model, and calculating petrophysical parameters. The watershed algorithm was used for threshold segmentation on the three-dimensional grayscale data, facilitating the separation of distinct regions within the data. This led to the creation of a binarized three-dimensional model representing the rock samples, which serves as a foundation for subsequent calculations of petrophysical properties.
We configured the resolution of the CT scan for the core plug samples to 20 μm to capture the pore structures at sub-millimeter scales (Figure 2a). For high-resolution scanning, micro-samples measuring approximately 2 mm on each side were carefully chosen. A scanning resolution of 1.5 μm (Figure 2b) was used to capture the intricate pore structures at the micron scale. This meticulous approach allowed for a detailed examination and analysis of the microscopic features and characteristics of the selected samples.
In this study, the petrophysical evaluation incorporated the upscaled porosity method [26] and the upscaled permeability method [27]. These methods offer a more comprehensive understanding of the porosity and permeability characteristics of the porous media under investigation. The results of the micro-sample scan revealed that the matrix of the core samples exhibited high density, with porosities ranging from 0.47% to 0.84% and permeabilities ranging from 0.087 mD to 0.105 mD (Table 2). The calculated total porosity varied from 2.22% to 4.32%, with the upscaled permeability ranging from 23 mD to 116 mD. The tortuosity values for Schemes A, B, and C were calculated as 2.26, 2.15, and 2.82, respectively. Remarkably, these values exhibit a significant correlation with permeability, indicating a strong relationship between the two variables. Figure 3 illustrates the detailed internal structure of the core plug samples after applying three different threshold-processing techniques. This technique reveals the presence of pores, irreducible water, and matrix in both two-dimensional and three-dimensional views.

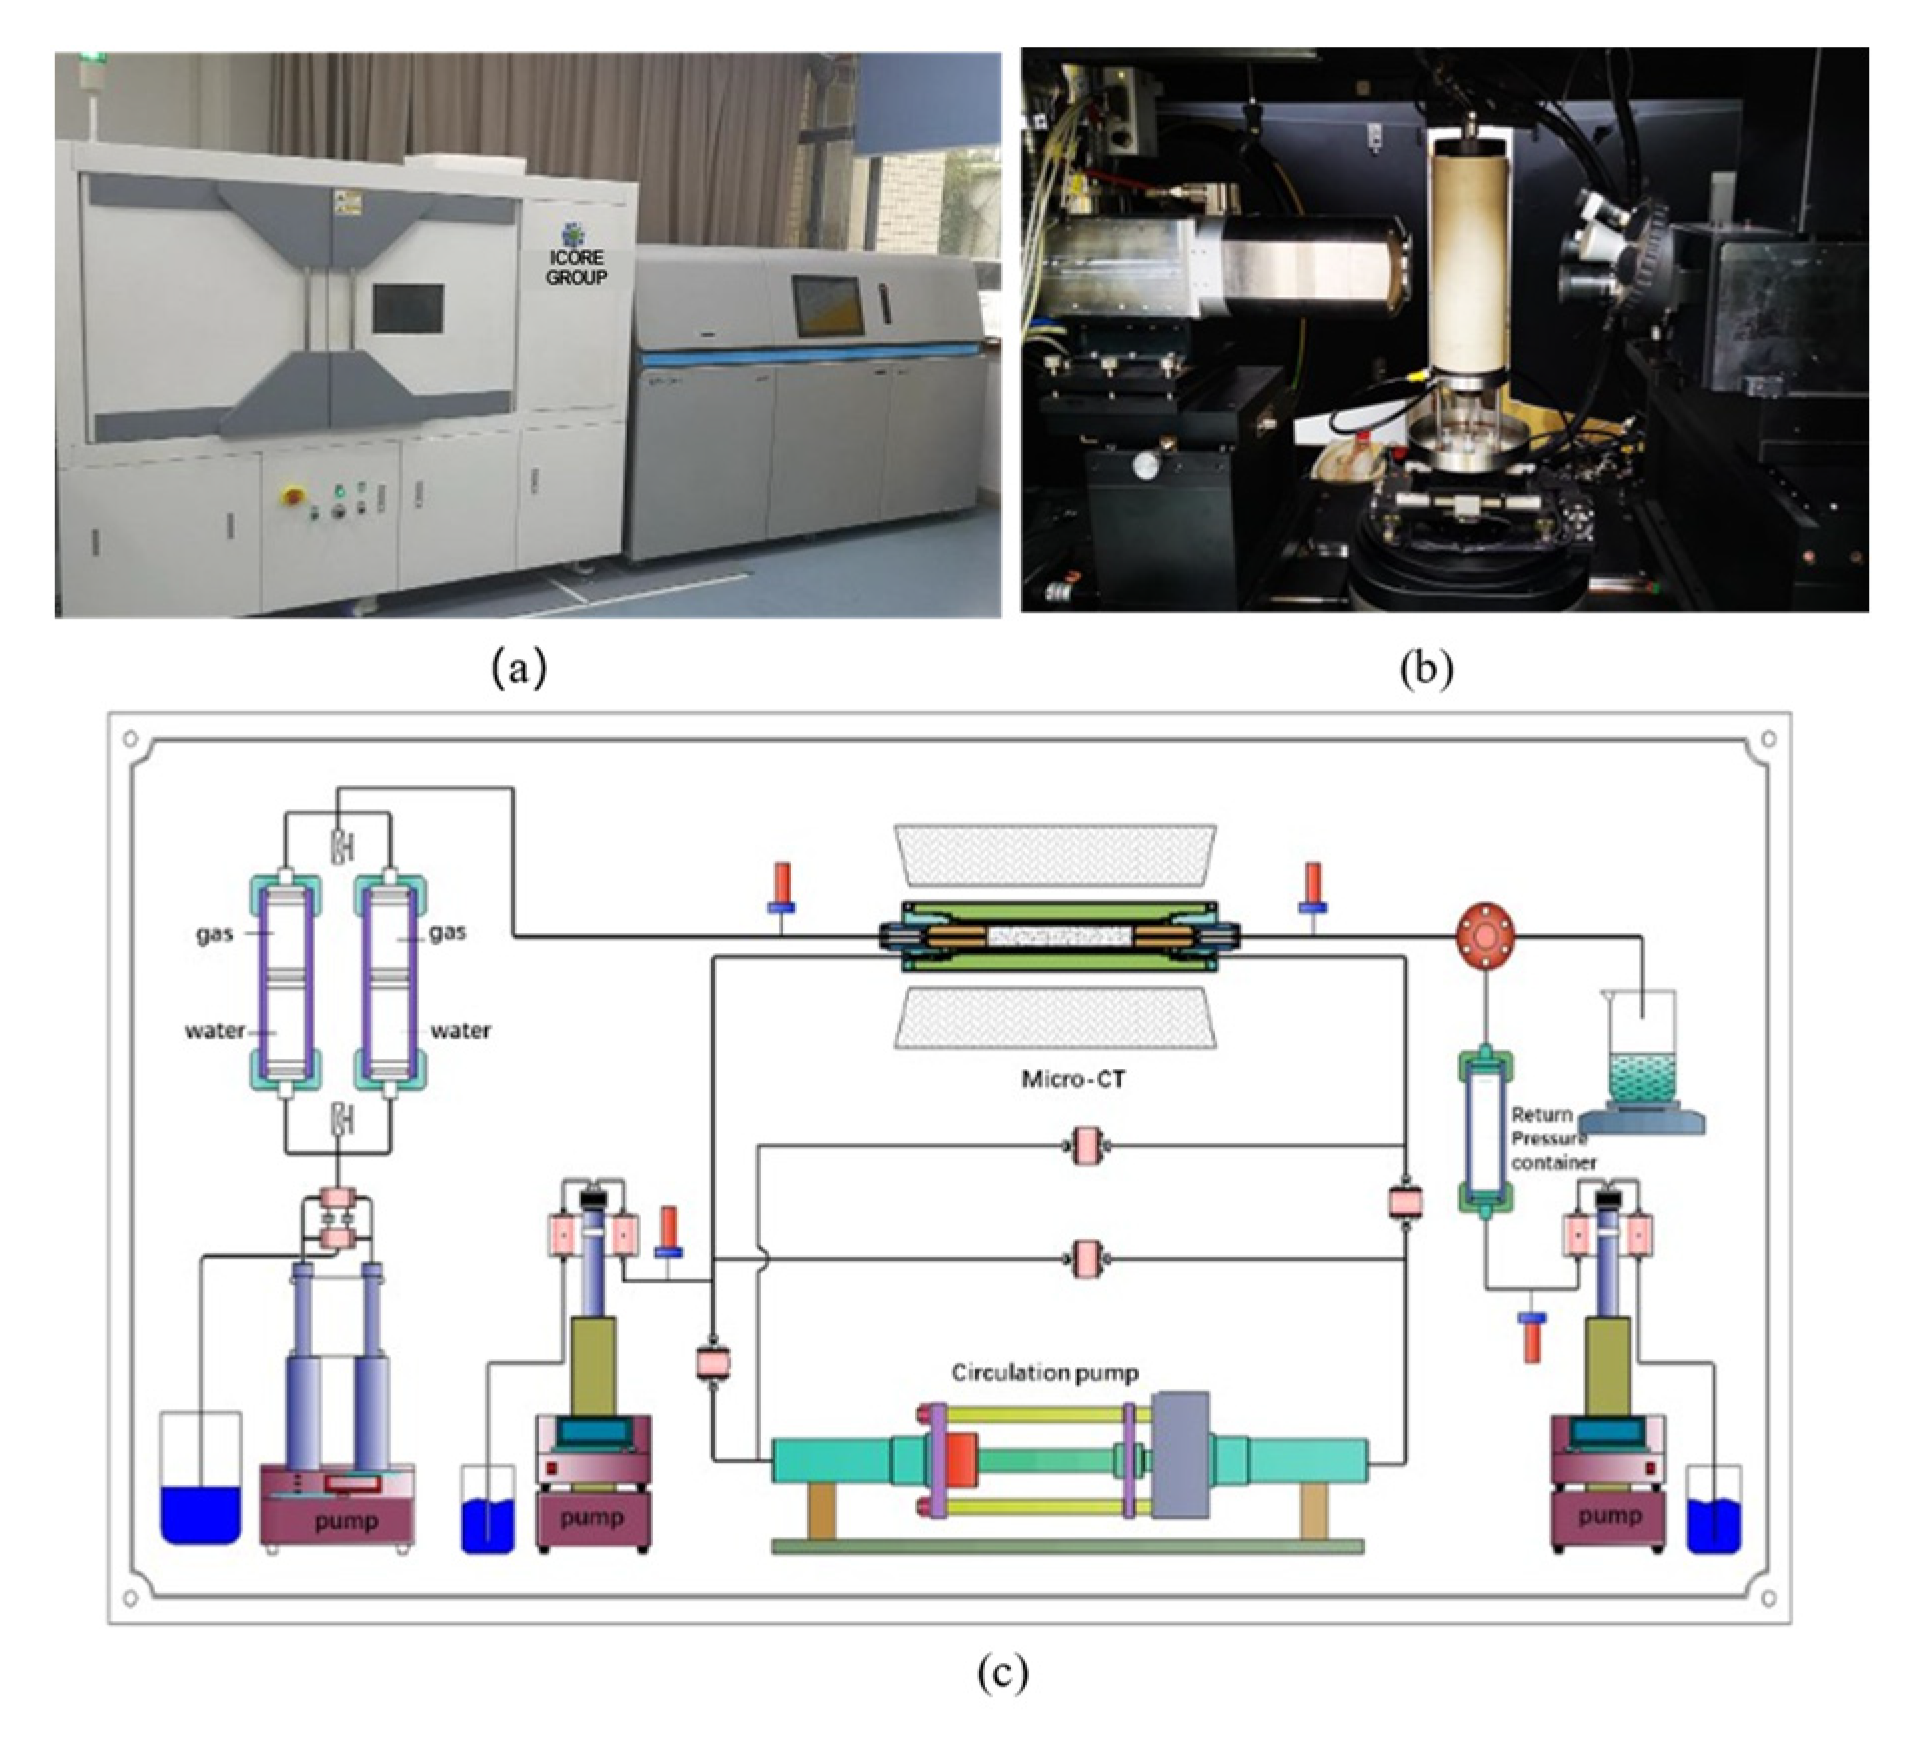
2.3. Coreflood Experiment with CT Scan

For this research, an experimental apparatus named the Micro Flow Visualizer (MFV-1000), manufactured by QingNengSanYing, was developed. This apparatus integrates a coreflood system with a micro-CT scanner, enabling comprehensive analysis (Figure 4). Specifically designed for applications in the oil, gas, and environmental protection industries, the MFV-1000 serves as a highly precise digital core analysis system. It offers an exceptional scanning resolution of up to 0.5 μm and boasts a multitude of advantages.
This equipment comprises several indispensable components, including a flooding system that maintains a constant temperature and pressure, a core holder, a confining pressure system, a micro-CT scan system, and visualization and analysis software. It operates effectively within a working pressure range of 0–25 MPa and supports a flow rate of 0–200 mL/min. The heating temperature is adjustable from room temperature to 200 °C, while the cooling temperature can be set from room temperature down to −20 °C. The equipment requires a power supply of 380 V at 50 Hz. Additionally, the core holder is compatible with core diameters of 5 mm and 25 mm cylinders.

2.4. Experimental Setups and Procedures

The experiment on the injection and production process of underground gas storage (UGS) used high-purity nitrogen (99.99%) to simulate natural gas present in the reservoir. To replicate the presence of irreducible water in the formation and enhance the micro-CT imaging of irreducible water in the core plugs, a 10% concentration solution of potassium iodide was used. The confining pressure for the core sample was set at 15 MPa, while the pore pressure during the injection and production process ranged from 5 MPa to 13 MPa. The physical experiment for each core plug involved the following specific steps:
1. Weigh the core plug and place it in the core holder. Increase the confining pressure to 15 MPa and close the outlet. Raise the pore pressure to 13 MPa and maintain it for certain period, after which a micro-CT scan is performed.
2. Saturate the core plug with a 10% potassium iodide solution for the formation of irreducible water and weigh it. Place the core plug in the holder, increase the confining pressure to 15 MPa, and use nitrogen to displace the water until none is visible. After a 10-min stabilization period, remove the sample and reweigh the core plug.
3. For the first cycle of UGS injection and production, place the core plug in the core holder, close the outlet, and increase the confining pressure to 15 MPa. Raise the pore pressure to 13 MPa and maintain it for 10 min before proceeding with a micro-CT scan. Withdraw gas from bottom to top while maintaining a pressure differential of 1 MPa. Stop the gas withdrawal when the pore pressure drops to 5 MPa. Record the pressure changes over time and the cumulative volume of withdrawn gas over time. Additionally, perform a micro-CT scan when the pore pressure is 5 MPa.
4. For the second cycle of UGS injection and production, inject gas at a flow rate of 10 mL/min from top to bottom until the pore pressure reaches 13 MPa. Record pressure changes over time and perform a micro-CT scan when the pore pressure is 13 MPa. Then, set outlet pressure at 5 MPa, withdraw gas until the pore pressure drops to 5 MPa. Record the pressure changes and cumulative volume of gas withdrawn over time and conduct another micro-CT scan when the pore pressure is 5 MPa.

3. Results and Discussion

Three schemes with distinct fractured-vuggy structures, based on seismic interpretation and outcrop observation, have been devised. These schemes facilitate the execution of physical experiments aimed at elucidating the mechanisms underlying fluid flow and storage capacity during increasing injection and production cycles. Production data from depleted gas reservoirs reveal that the Permian Maokou limestone reservoir, located within the M gas field, contains only a negligible amount of water, with minimal water production. Consequently, the impact of water invasion on the converted underground gas storage (UGS) is considered to be insignificant. In the physical experiment, the flow can be approximated as a single-phase gas flow. We examined the characteristics of gas flow in carbonate UGS operations by conducting simulations of injection and production processes on reservoir core plugs under irreducible water conditions. To evaluate the storage capacity mechanism, we employed the well-established material balance method, specifically the p/z plot, as described by Elahmdy and Wattenbarger (2007), Khor et al. (2017), Jongkittinarukorn and Last (2019), and Payne (1996) [28,29,30,31].

3.1. The Effect of Cycles on UGS

3.1.1. First Cycle of Injection and Production

Scheme A—The distal single well plan exhibits a linear trend in pressure change over time during the gas production process, with minor fluctuations. A slight delay in pressure drop is observed in the initial and middle-late stages (Figure 5). Additionally, the cumulative gas production follows a nearly straight line, with a slight delay noted in the early and middle-late stages. The relationship between cumulative gas production and pressure is linear, indicating the steady nature of gas flow and production in the reservoir. The slight delays may be attributed to the characteristics of the reservoir rock and its interaction with the gas. From the p/z plot, the calculated storage capacity is determined to be 214.38 mL (Figure 6), with a utilization rate of 61.58%, and a cushion gas volume of 82.37 mL.
Scheme B—The penetrated horizontal well plan also shows a nearly linear pressure change over time, although with slight fluctuations during the decline. In the initial stage, there is a slight lead in pressure change, followed by a minor lag in the middle to late stages, and then a lead again in the later stages (Figure 5). Similarly, the cumulative gas production over time demonstrates a linear relationship, with a slight lead in the early stage, a mild delay afterwards, and then a lead in the mid-to-late stages. The relationship between cumulative gas volume and pressure remains linear. Through the p/z plot analysis, the estimated storage capacity for this scheme is 176.46 mL (Figure 6), with a utilization rate of 61.44% and a cushion gas volume of 68.05 mL.
Scheme C—In the absence of a controlled well plan, the pressure change over time follows an approximately linear relationship. However, there is a slight lead in pressure drop during the mid-early stage, followed by a minor lag in the late stage (Figure 5). The cumulative gas production volume over time also exhibits a roughly linear relationship, with a mild lead in the mid-early stage and a delay in the late stage. The relationship between cumulative gas volume and pressure is linear, with a slight fluctuation. Extrapolating from the p/z plot, the storage capacity for this scheme is estimated at 122.30 mL (Figure 6), with a utilization rate of 61.09% and a cushion gas volume of 47.59 mL.
When comparing the three schemes, it is observed that Scheme C has the smallest storage capacity, at 122.30 mL. All three schemes demonstrate similar utilization rates, around 61%. This suggests that all schemes have comparable efficiency in utilizing the active storage capacity relative to the total capacity. The p/z plot for all three schemes shows linear trends, indicating that fractured-vuggy systems are the primary flow storage and pathways. The dense matrix, characterized by low porosity and permeability, appears to have a minimal impact on flow and storage capacity. The utilization rate of the storage capacity is mainly influenced by the working pressure range.
During the first cycle of injection and production, the p/z plot exhibits a linear trend for all three schemes, albeit with varying slopes. Schemes A, B, and C demonstrate consecutive increases in slope, resulting in storage capacities of 214.38 mL, 176.46 mL, and 122.30 mL, respectively. For Schemes A and B, the data points generally align with their respective trend lines, although a slight upward deviation is observed in the final point of Scheme B. Scheme C exhibits minimal fluctuation, with its data points oscillating along the trend line.
In all three schemes, there is a consistent decrease in pressure over time. Scheme C shows the fastest decline in pressure, followed by Scheme A. Scheme B initially exceeds Scheme A in terms of pressure decrease but falls behind in the later stages. Cumulative gas production increases over time for all three schemes. Scheme A withdraws the second-highest volume, followed by Scheme B with a slightly lower volume, and Scheme C with the lowest volume withdrawn.
During the initial phase, the gas production rate is similar across all three schemes. However, in the mid-to-later stages, Scheme A outperforms the others, with Scheme B slightly lagging behind Scheme C.

3.1.2. Second Cycle of Injection and Production

Scheme A involves a distal single well plan, where the change in pressure over time exhibits an approximately linear trend. However, there is a slight lag in pressure decline during the early stage, followed by a leading trend in the mid-stage, and then a lagging trend again in the last stage. The cumulative withdrawn gas volume also follows an approximately linear trend, with a slight lag in the initial stage, leading in the mid-to-late stage, and then lagging in the last stage. Additionally, the cumulative production gas volume demonstrates a linear relationship with pressure. Based on the p/z plot, the simulated storage capacity is estimated at 264.87 mL, with a utilization rate of 61.22% and a cushion gas volume of 103.70 mL.
Scheme B involves a plan with a horizontal well, where pressure decreases as time progresses. The rate of decrease accelerates initially and then slows down over time. The cumulative amount of gas extracted displays a surge ahead trend during the early stage and lagging trend in the later stages. The relationship between cumulative extracted gas and pressure is linear. Based on the p/z plot, the estimated storage capacity is 191.49 mL, with a utilization rate of 61.80% and a cushion gas volume of 73.16 mL.
Scheme C involves a plan without controlled wells, where pressure decreases as time increases. A surge ahead is observed in the mid-stage, followed by a lagging behind in the later stage. The cumulative amount of gas produced displays a surge ahead trend during the mid-early stage and a lagging trend later on. The relationship between the cumulative amount of gas withdrawn and pressure is linear, albeit with slight fluctuations throughout the process. According to the p/z plot, the estimated storage capacity is 116.61 mL, with a utilization rate of 62.59% and a cushion gas volume of 43.62 mL.
Upon comparing the three schemes, it is evident that Scheme C has the smallest storage capacity, at 116.61 mL. However, the utilization rate of the storage capacity remains consistently effective across all three schemes, with values around 61%. This indicates that the active use of storage capacity is steady throughout the three schemes. Analyzing the pressure versus gas deliverability plot for all three schemes in the first cycle, straight lines are observed, emphasizing the role of fractured-vuggy systems in both storage and flow capabilities. In contrast, the dense matrix, characterized by low porosity and permeability, plays a limited role in this context. It is important to note that the utilization rate of the storage capacity is primarily determined by the working pressure range.
In the second cycle of injection and production, the pressure versus gas deliverability plots in all three schemes maintain a linear relationship, similar to the first cycle. However, the slopes vary and increase sequentially. According to the analysis, the estimated storage capacities for this cycle are 264.87 mL, 191.49 mL, and 116.61 mL, respectively (as shown in Table 3 and Figure 6).
Over time, the pressure decreases in all three schemes. Scheme C reaches the lower pressure limit first, followed closely by Scheme B, while Scheme A is the last to reach this limit. In the early stage, the pressure decline in Scheme C lags slightly behind Scheme B, but then slightly leads in the middle and later stages.
Regarding cumulative gas production volume, all three schemes show an increase over time. In the early stage, Schemes A and B exhibit similar increasing trends. However, in the middle and later stages, Scheme A outperforms Scheme C. Scheme B leads both Schemes A and C in the early stages but then falls behind Scheme A and remains ahead of Scheme C in the later stages.

3.1.3. Comparison of Two Cycles

During the experimental processes, the relationship between pressure and cumulative gas production volume in all three schemes follows an approximately linear trend, although with varying slopes that increase sequentially. The p/z plots provide insights into the estimated storage capacities from the first and second cycles of gas production.
In the first cycle, the estimated storage capacities for the three schemes were 214.38 mL for Scheme A, 176.46 mL for Scheme B, and 122.30 mL for Scheme C. In the second cycle, these storage capacities increased to 264.87 mL, 191.49 mL, and 116.61 mL, respectively (as depicted in Table 3 and Figure 7). Notably, Scheme A exhibited a higher storage capacity after the second cycle compared to the first, indicating a 23.55% expansion rate. Similarly, Scheme B showed a slight increase in storage capacity after the second cycle, with an expansion rate of 8.51%. In contrast, Scheme C displayed a slightly lower storage capacity after the second cycle, indicating a reduction rate of 4.66%. This phenomenon can potentially be attributed to the complex network fractured structure in Scheme C. It is likely that during the injection and production cycles, certain fractures, especially minor and distal ones, might have closed at specific locations.

3.2. The Effect of Cycles on Irreducible Water

During the experiment involving the injection and production of core plugs, a collaborative micro-CT scanning method was employed. The grayscale data from the digital three-dimensional reconstruction were analyzed using a three-phase segmentation technique. This analysis was designed to enable the observation and analysis of structural changes, including those in the fractured-vuggy system, irreducible water, and matrix. Additionally, a micro-CT scan focusing specifically on the matrix section of the core was performed. The results revealed a dense matrix structure with extremely low porosity and permeability.
Following the micro-CT scan, regions with a higher concentration of irreducible water within the grayscale data were clearly distinguished from the pore spaces and matrix. The three-phase segmentation data indicated that the gas phase, represented by the color blue, primarily occupied the pore space. The color green represented areas occupied by irreducible water (Figure 8). The gas phase was found to be predominant within the fractured-vuggy system, while irreducible water was primarily distributed along the edges of the fractured-vuggy system, particularly in regions with higher curvature. It mainly surrounded the exterior of the pore spaces occupied by the gas phase.
For Scheme A, after saturating the core plug with a potassium iodide solution, the irreducible water saturation was determined to be 18.75%. During the initial stage of the first injection and production cycle, the gas phase predominantly occupied the fractured-vuggy space, while the irreducible water was observed along the walls of the fractured-vuggy system. Notably, in the upper part closer to the inlet, an isolated vug filled with water was observed. this indicated that the outlet had become blocked after saturation, preventing water drainage (refer to Figure 8a). However, after undergoing two cycles of injection and production, the gas phase progressively occupied a larger proportion of the vug (refer to Figure 8a,b). Additionally, the proportion of irreducible water in the core plug slightly decreased after these cycles. In areas of higher curvature, various locations exhibited a noticeable reduction in irreducible water compared to the initial state. Overall, the distribution of irreducible water tended to shift toward the opening.
For Scheme B, the irreducible water saturation was measured at 30.43%. Observations indicate that the gas phase occupies the majority of the fractured-vuggy system, with irreducible water primarily distributed along the edges of the system. In areas of high curvature, the presence of irreducible water is more pronounced and sparsely distributed in the matrix portion. After two cycles of injection and production, there is a slightly increase in gas phase porosity and a corresponding decrease in irreducible water percentage. Notably, in areas with high curvature, several locations show a significant decrease in irreducible water percentage compared to the initial state (refer to Figure 8c,d). The change in the distribution of the gas phase porosity, with noticeable increases in a few areas, is primarily associated with isolated vugs. The locations where changes in irreducible water occur are mostly opposite to those of the changes in gas phase porosity.

3.3. The Effect of Fracture on UGS

For Scheme C, the core plug is initially saturated with irreducible water induced by potassium iodide, resulting in a saturation level of 14.29%. The fractured-vuggy space is predominantly occupied by the gas phase, while irreducible water is primarily distributed along the walls of the fractured-vuggy system, especially in areas of high curvature. Contrary to Schemes A and B, after two cycles of injection and production, there is a slight decrease in gas phase porosity and a slight increase in the percentage of irreducible water.
Micro-CT scan gray scale data, as shown in Figure 9, reveals the presence of complex fracture networks in Scheme C, including numerous fissure fractures. Some of these fine fractures and distal fractures become closed by the end of the injection and production process. The closure of these distal fine fissure fractures can be attributed to the displacement of water by gas during the injection and production cycles. Water provides more support for keeping fractures open compared to gas. This phenomenon suggests a slightly decreased storage capacity, as indicated by the p/z plots.

4. Conclusions

In the realm of physical experimentation aimed at simulating UGS systems, we have devised meticulously crafted fractured-vuggy configurations that closely emulate the patterns derived from seismic interpretation and outcrop data. These configurations were precisely engraved onto core plugs using laser technology to ensure that the simulated experiments faithfully replicated the desired characteristics and behavior of UGS systems. The experiments entailed the injection and production of gas on the engraved core plugs, during which we meticulously recorded changes in pressure and gas volume over time. Our analysis primarily focused on elucidating the mechanisms underlying flow and storage capacity during these processes. To augment our understanding, we adopted a synchronized approach involving micro-CT scans conducted at the initial and final stages of the experiment. This approach played a pivotal role in comprehending and analyzing the influence of structural alterations within the rock matrix on flow and storage capacity mechanisms during the injection and production cycles. The findings of this study led to the following conclusions:
1. The laboratory physical measurements with micro-CT scanning revealed that the porosity and permeability of the fracture-vuggy system significantly exceed those of the matrix. During the injection and production processes, pressure changes display a linear behavior, and the material balance method p/z plot also exhibits a linear trend. This suggests that the fractured-vuggy system is the primary storage space and flow pathway. The storage and flow abilities of matrix are minimal, and its hysteretic effect is negligible in the core plug scale. The utilization rate of the storage capacity is mainly dependent on the working pressure range.
2. Utilizing the material balance method and the p/z plot analysis of two injection and production cycles, we inferred the changes in storage capacity in different rock structures. The results indicate that after two cycles, rock structures with larger fracture and vug sizes, like Schemes A and B, experienced increased storage capacities of 23.55% and 8.51%, respectively. In contrast, Scheme C, characterized by network and fissure fractures, experienced a slight loss in storage capacity of 4.66%.
3. Throughout the gas production process, the dry gas mobilizes some of the irreducible water within the core plugs. The proportion of irreducible water decreases with pressure drop, likely due to compression, which in turn expands the space available for gas, enhancing storage capacity.
The results of this study have practical implications for decision-making related to gas storage. Expanding the operational pressure range within established safety standards has the potential to enhance gas storage capacity. This adjustment enables efficient fulfillment of the working gas volume required during peak demand periods. Additionally, gradually increasing the frequency of injection and production cycles can lead to incremental improvements in storage capacity. This approach presents advantageous opportunities for enhancing the overall efficiency of gas storage systems.
Nonetheless, it is crucial to acknowledge the constraints and ascertain feasible avenues for future research. This study was based on two injection-production cycles, whereas UGS typically undergoes multiple cycles in practice. Consequently, future research should consider additional cycles for a more comprehensive analysis. Additionally, while the micro-CT scanning technique used in this study had a resolution of 20μm, suitable for capturing fluid flow in the fracture-vuggy system, employing higher resolution such as the scanning electron microscope (SEM) in future studied could provide more detailed insights into fluid flow within the matrix.

Author Contributions

Methodology, M.W.; Software, W.L. (Wei Li); Formal analysis, G.W.; Investigation, D.H.; Resources, Y.H., Y.Z., Z.Z., X.W. and L.L.; Writing—original draft, W.L. (Wei Long). All authors have read and agreed to the published version of the manuscript.

Funding

This research was funded by the Program for Guangdong Introducing Innovative and Entrepreneurial Teams (No. 2017ZT07G264); Shenzhen Peacock Plan (No. KQTD2017033114582189) and The Shenzhen Science and Technology Innovation Committee (JCYJ20170817152743178).

Data Availability Statement

The data presented in this study are available on request from the corresponding author.

Conflicts of Interest

The authors declare the research was conducted in the absence of any commercial or financial relationships that could be construed as a potential conflict of interest.

Abbreviations

UGSUnderground Gas Storage
CTComputed Tomography
MFVMicro Flow Visualizer
LBMLattice Boltzmann Method
NSNavier-Stokes
DVBEDiscrete Velocity Boltzmann Equation
CEChapman-Enskog
SEMScanning Electron Microscopy

References

  1. Xiao, G.; Zhimin, D.; Ping, G.; Yuhong, D.; Yu, F.; Tao, L. Design and demonstration of creating underground gas storage in a fractured oil depleted carbonate reservoir. In Proceedings of the SPE Russian Petroleum Technology Conference, Moscow, Russia, 3–6 October 2006; p. SPE-102397. [Google Scholar]
  2. Huo, H.; Li, J.; Li, Z.; Zhang, X.; He, S.; Xu, J.; Dou, P. The Feasibility Analysis of an Underground Natural Gas Storage Using a Depleted Offshore Gasfield. In Proceedings of the International Petroleum Technology Conference, Virtual, 23 March–1 April 2021; p. D071S025R003. [Google Scholar]
  3. Azin, R.; Nasiri, A.; Entezari, A.J.; Montazeri, G.H. Investigation of underground gas storage in a partially depleted gas reservoir. In Proceedings of the SPE Unconventional Resources Conference/Gas Technology Symposium, Calgary, AB, Canada, 7–19 June 2008; p. SPE-113588. [Google Scholar]
  4. Huan, Q.; Yiqiang, L.; Samba, M.A.; Yu, S.; Tong, L. Multi-Round Development of Underground Gas Storage Converted from Depleted Oil Reservoirs: Physical Properties Changes and Capacity Expansion. In Proceedings of the ARMA US Rock Mechanics/Geomechanics Symposium, Atlanta, GA, USA, 25–28 June 2023; p. ARMA-2023. [Google Scholar]
  5. Mao, C.; Zheng, Z. Site selection for underground gas storage rebuilt on the depleted Xiangguosi Carboniferous gas reservoirs in Sichuan and Chongqing areas. Nat. Gas Ind. 2010, 30, 72–75. [Google Scholar]
  6. Wu, J.; Zhong, B.; Feng, X.; Liu, Y.; Hao, C.; He, Y. Operation parameter design of Xiangguosi Underground gas storage based on the Carboniferous gas reservoir. Nat. Gas Ind. 2012, 32, 91–94. [Google Scholar] [CrossRef]
  7. Ma, X.; Zheng, D.; Wei, G. Development directions of major scientific theories and technologies for underground gas storage. Nat. Gas Ind. 2022, 42, 93–99. [Google Scholar]
  8. Zou, X.; Fan, T.; Peng, Z.; He, J. Comprehensive Evaluation of Gas Reservoir Reconstruction in Maokou Formation of Moujiaping Gas Field. In Proceedings of the 32nd Chinese Natural Gas Research Annual Meeting (2020), Chongqing, China, 12–14 November 2020; pp. 2581–2587. [Google Scholar]
  9. Li, C.; Wang, J.; Xu, H.; Tang, L.; Sun, C. Study on fluids flow characteristics of water-gas mutual flooding in sandstone underground gas storage with edge water. In Proceedings of the International Petroleum Technology Conference, Beijing, China, 26–28 March 2013; p. IPTC-17093. [Google Scholar]
  10. Shi, L.; Shao, L.Y.; Wang, J.M. The microscopic mechanism of operating loss in underground gas storage rebuilt from water-drive gas reservoir. Oil Gas Storage Transp. 2018, 37, 658–663. [Google Scholar]
  11. Jadhawar, P.; Saeed, M. Fluid-Fluid and Rock-Fluid Parametric Investigation of The Underground Storage of Hydrogen in a Deep North Sea Aquifer. In Proceedings of the SPE Offshore Europe Conference and Exhibition, Aberdeen, UK, 5–8 September 2023; p. D031S010R002. [Google Scholar]
  12. Tang, L.; Ding, G.; Sun, S.; Mi, L.; Qi, H.; Guo, K.; Wang, J.; Bai, F. Method for deliverability prediction of well in gas storage converted from gas reservoir in China. In Proceedings of the SPE Asia Pacific Oil and Gas Conference and Exhibition, Perth, Australia, 25–27 October 2016; p. SPE-182465. [Google Scholar]
  13. Wang, L.; Yang, S.; Peng, X.; Deng, H.; Meng, Z.; Qian, K.; Wang, Z.; Lei, H. An improved visual investigation on gas-water flow characteristics and trapped gas formation mechanism of fracture–cavity carbonate gas reservoir. J. Nat. Gas Sci. Eng. 2018, 49, 213–226. [Google Scholar] [CrossRef]
  14. Da Silva Moreira, P.H.; Gomes da Silveira, T.M.; Drexler, S.; Couto, P. Application of MCMC Optimization Method to Estimate Relative Permeability of Carbonate Rocks from Unsteady-State Core Flood Experiments. In Proceedings of the SPE Europec Featured at 81st EAGE Conference and Exhibition, London, UK, 3–6 June 2019; OnePetro: Richardson, TX, USA, 2019. [Google Scholar]
  15. Ahmed, M.E.; Sultan, A. Optimization of Sp Flooding Design Using Simulation Calibrated with Lab Core Flooding. In Proceedings of the SPE EOR Conference at Oil and Gas West Asia, Muscat, Oman, 21–23 March 2022; p. D011S002R002. [Google Scholar]
  16. Sun, K.; Liu, H.; Leung, J.Y.; Wang, J.; Feng, Y.; Liu, R.; Kang, Z.; Zhang, Y. Impact of effective stress on permeability for carbonate fractured-vuggy rocks. J. Rock Mech. Geotech. Eng. 2023. [Google Scholar] [CrossRef]
  17. Guido, G.; Francesco, M.; Warner, M. Practical application of fractal analysis: Problems and solutions. Geophys. J. Int. 1998, 132, 275–282. [Google Scholar] [CrossRef]
  18. Turcotte, D.L. Fractals and Chaos in Geology and Geophysics, 2nd ed.; Cambridge University Press: Cambridge, UK, 1997. [Google Scholar]
  19. Geng, C.; Yang, Y.; Gao, Y. Optimization of image processing method based on rock CT images of different resolutions. Sci. Technol. Eng. 2014, 14, 1–4. [Google Scholar]
  20. Peng, C. Multi-resolution Storage of Digital Core and Analysis of Connected Area. Sci. Technol. Eng. 2022, 22, 14608–14616. [Google Scholar]
  21. Qu, L.; Sun, W.; Du, H.-H.; Zhang, C.; Jiang, L.-M.; Wei, H. Characterization technique of pore structure by 3D digital core based on CT scanning and its application: An example from Sangonghe Formation of 116 well field in Mobei Oilfield. Geoscience 2014, 28, 190. [Google Scholar]
  22. Sheng, J.; Yang, X.; Li, G.; Xu, L.; Li, Y.; Wang, J.; Zhang, C.; Cui, H. Application of multiscale X-CT imaging digital core technique on observing micro-pore structure of carbonate reservoirs. Geoscience 2019, 33, 653. [Google Scholar]
  23. Zhao, J.; Pan, J.; Hu, Y.; Li, J.; Yan, B.; Li, C.; Sun, L.; Liu, X. Digital rock physics-based studies on effect of pore types on elastic properties of carbonate reservoir Part 1: Imaging processing and elastic modelling. Chin. J. Geophys. 2021, 64, 656–669. [Google Scholar]
  24. Xiong, Z.; Wang, G.; Zhang, Y.; Cheng, H.; Chen, F.; Long, W. Application of digital rock technology for formation damage evaluation in tight sandstone reservoir. J. Pet. Explor. Prod. Technol. 2023, 13, 803–812. [Google Scholar] [CrossRef]
  25. Sun, H.; Belhaj, H.; Bera, A. New insight of correlation between digital rock analysis and petrographic study for rock type classification within carbonate reservoir transition zone. Arab. J. Geosci. 2021, 14, 1–13. [Google Scholar] [CrossRef]
  26. Xiong, T.; Chen, M.; Jin, Y.; Zhang, W.; Shao, H.; Wang, G.; Long, E.; Long, W. A New Multi-Scale Method to Evaluate the Porosity and MICP Curve for Digital Rock of Complex Reservoir. Energies 2023, 16, 7613. [Google Scholar] [CrossRef]
  27. Xu, Q.; Guan, L.; Zhang, W.; Shi, L.; Shao, H.; Wang, G.; Long, W. Multiscale Digital Rock Imaging and Modeling for Measuring the Heterogeneous Carbonate and Conglomerate Permeability at the Laboratory Plug Scale. Energy Fuels 2022, 36, 11025–11039. [Google Scholar] [CrossRef]
  28. Elahmady, M.; Wattenbarger, R.A. A Straight Line p/z Plot is Possible in Waterdrive Gas Reservoirs. In Proceedings of the SPE Rocky Mountain Petroleum Technology Conference/Low-Permeability Reservoirs Symposium, Denver, CO, USA, 16–18 April 2007; p. SPE-103258. [Google Scholar]
  29. Khor, Y.Y.; Shrivastava, S.K.; Borhan, N.A.; Baghdadi, F.; Motaei, E.; Kadir, Z.; Supaat, S.F.; Anasir, N.; Mithani, A.H. Pushing Boundaries through Simplification of Complex Carbonate Reservoir Modeling: Small Investment, Big Gains. In Proceedings of the SPE Asia Pacific Oil and Gas Conference and Exhibition, Jakarta, Indonesia, 17–19 October 2017; p. D011S001R003. [Google Scholar]
  30. Jongkittinarukorn, K.; Last, N. A straight line p/z plot in multilayer tight gas reservoirs. In Proceedings of the SPE/IATMI Asia Pacific Oil & Gas Conference and Exhibition, Jakarta, Indonesia, 20–22 October 2020; OnePetro: Richardson, TX, USA, 2020. [Google Scholar]
  31. Payne, D.A. Material-balance calculations in tight-gas reservoirs: The pitfalls of P/Z plots and a more accurate technique. SPE Reserv. Eng. 1996, 11, 260–267. [Google Scholar] [CrossRef]
Figure 1. Fractured-vuggy system scheme based on seismic interpretation and outcrop data: (a) Seismic interpretation of M9 area; (b) fractured-vuggy system design of Scheme A; (c) Scheme A laser engraving; (d) seismic interpretation data of M8 area; (e) fractured-vuggy system design of Scheme B; (f) Scheme B laser engraving; (g) outcrop data of M area; (h) fractured-vuggy system design of Scheme C; (i) Scheme C laser engraving.
Energies 17 01503 g001
Figure 2. Multi-scale micro-CT scan: (a) core plug CT scan at a resolution of 20 μm; (b) subdomain CT scan at a resolution of 1.5 μm.
Energies 17 01503 g002
Figure 3. Three-threshold segmentation of digital core plugs: (a) 2D view; (b) 3D view (green represents the irreducible water, blue represents the pore).
Energies 17 01503 g003
Figure 4. Equipment of UGS injection and production: (a) product photo of MFV-1000; (b) micro-CT inside view; (c) schematic diagram for MFV-1000.
Energies 17 01503 g004
Figure 5. Pressure and gas volume changes over time for three schemes in two cycles of injection and production: (a) first cycle—pressure vs. time; (b) first cycle—cumulative gas volume vs. time; (c) second cycle—pressure vs. time; (d) second cycle—cumulative gas volume vs. time.
Energies 17 01503 g005
Figure 6. Pressure and gas volume changes over time for three schemes in two cycles of injection and production: (a) first cycle—p/z plots; (b) second cycle—p/z plots.
Energies 17 01503 g006
Figure 7. Comparison p/z plots for two cycles of injection and production: (a) Scheme A p/z plot of two cycles; (b) Scheme B p/z plot of two cycles; (c) Scheme C p/z plot of two cycles.
Energies 17 01503 g007
Figure 8. Irreducible water and gas phase changes during two cycles of injection and production: (a) Scheme A—first cycle at the initial stage; (b) Scheme A—second cycle at the final stage; (c) Scheme B—first cycle at the initial stage; (d) Scheme B—second cycle at the final stage.
Energies 17 01503 g008
Figure 9. Fracture closure (highlight area with yellow and red circles) during two cycles of injection and production: (a) Scheme C—first cycle at the initial stage; (b) Scheme C—second cycle at the final stage.
Energies 17 01503 g009
Table 1. Physical parameters of core plugs from Permian Maokou Formation in Well M-UGS-1.
Engraved Core PlugDiameter/mmLength/mmTortuosityMeasured PorosityMeasured Permeability/mD
Scheme A24.8344.952.264.67%87.39
Scheme B24.9043.732.153.85%105.51
Scheme C24.8149.892.822.24%15.96
Table 2. Petrophysical parameters of digital core plugs from Permain Maokou Formation in Well M-UGS-1.
Engraved Core PlugMicro-PorositySub-Millimeter PorosityTotal PorosityMicro-Permeability/mDUpscale Permeability/mD
Scheme A0.84%3.51%4.32%0.096100
Scheme B0.49%3.13%3.61%0.087116
Scheme C0.47%1.76%2.22%0.10523
Table 3. Storage capacity parameter changes in injection and production cycles.
First CycleSecond CycleExpansion Rate of Storage Capacity
Engraved Core PlugStorage Capacity/mLProduction Gas/mLCushion Gas/mLUtilization Rate of Storage CapacityStorage Capacity/mLProduction Gas/mLCushion Gas/mLUtilization Rate of Storage Capacity
Scheme A214.38132.0082.3761.58%264.87162.17102.7061.22%23.55%
Scheme B176.46108.4268.0561.44%191.49118.3373.1661.80%8.51%
Scheme C122.3074.7147.5961.09%116.6172.9943.6262.59%−4.66%
Disclaimer/Publisher’s Note: The statements, opinions and data contained in all publications are solely those of the individual author(s) and contributor(s) and not of MDPI and/or the editor(s). MDPI and/or the editor(s) disclaim responsibility for any injury to people or property resulting from any ideas, methods, instructions or products referred to in the content.

