Article

Towards Reducing the Consumption of Drinking Water in Buildings as Part of the Circular Economy Model: Strengths–Weaknesses–Opportunities–Threats Analysis and Perspectives for Implementation

Faculty of Environmental Engineering and Energy, Cracow University of Technology, 24 Warszawska Street, 31-155 Krakow, Poland
*
Author to whom correspondence should be addressed.
Energies 2024, 17(6), 1444; https://doi.org/10.3390/en17061444
Submission received: 2 February 2024 / Revised: 7 March 2024 / Accepted: 11 March 2024 / Published: 17 March 2024

Abstract

:
Progressive climate changes, drought resulting from them and the prospect of problems with access to water for people in cities mean that actions are being taken to minimize water use in buildings and to implement a circular economy in the water and wastewater sector. Within the water circular economy model, there is also a stage of “water consumption”. Minimizing water use in buildings undoubtedly has a number of advantages. However, it should be borne in mind that it may also have weaknesses, and if implemented on a large scale, it may be associated with certain threats. For these reasons, the aim of this paper is to critically analyze the possible directions of water management in buildings in order to reduce water consumption and increase the efficiency of its use. As part of the introduction, the model “towards a water circular economy for households” is presented and the possibilities of minimizing water consumption in buildings are discussed. The prospects for reducing the consumption of tap water are discussed in terms of existing opportunities, but also threats, barriers and limitations. A SWOT analysis of the implementation of drinking-water consumption reduction in cities is presented. The challenges faced by engineers, constructors, policy makers and consumers, and the potentialities for the development of this stage of the water life cycle, are considered. The conclusions summarize the current state and perspectives of water management in buildings. Based on the conducted analysis, suggested directions of activities for cities of the future in the technical, technological as well as socio-economic fields are indicated. There should be broad-based education, and efforts should be made to change the approach to designing and developing new guidelines. The implementation of minimizing water consumption should be accompanied by the control of possible negative effects and actions to mitigate them. In the transformation towards clean and available energy, future success should be seen in minimizing the consumption of drinking water in buildings.

1. Introduction

The need to protect water resources and quality, especially in the face of ongoing climate change, is undeniable. Among others, increasingly frequent drought and the more and more likely prospect of significant water shortages or lack of water delivery in cities contribute to this. This task can be accomplished in many ways. An important role in this regard is played, among others, by the implementation of the water circular economy into cities. Practices and solutions used within the various stages of the water circular economy model are being improved. Various kinds of innovations are being introduced. This also applies to the stage of water consumption. In accordance with the 12th goal of sustainable development, i.e., responsible production and consumption, efforts should be made to ensure the sustainable management and effective use of natural resources [1], including water. The use of environmental resources through the use of water should take place in accordance with both the present and future needs of society. It should be implemented in such a way that, in accordance with the idea of sustainable development defined in Brundtland Report [2], the chances of meeting the needs of future generations are not diminished. In turn, the sustainable use of water and its effective use are achieved through saving the raw material, i.e., minimizing the consumption of tap water. On the other hand, this reduction fits into smart circular water management [3]. The sustainable management of water resources by increasing water use efficiency in all sectors and ensuring sustainable consumption and access to safe drinking water also constitutes the implementation of Sustainable Development Goal 6 [4].
It is extremely important to disseminate knowledge about the latest innovations in this field in order to facilitate and accelerate their acceptance by society and their subsequent introduction to common use. When evaluating the perspectives for the introduction of minimizing water consumption into buildings, it is also pivotal to determine the implementation potential through an assessment of the current water consumption in larger cities and establishing a water circular economy model for households. The latter should be carried out taking into account all the latest scientific achievements in this area.

Research Motivation

Apart from the obvious need to save water, this issue should also be looked at from a different angle. It should be borne in mind that minimizing the consumption of tap water in households or public buildings in cities, implemented on a large scale, may also lead to other, not necessarily expected results. These include, among others, the possibility of microbiological changes caused by water stagnation in the pipes of building installations [5,6], and an increase in energy consumption caused by additional equipment, for instance, for rainwater use [7]. There are many studies and articles related to the topic of minimizing tap water consumption in buildings, but they usually refer only to a selected issue. These works concern the following: ways and methods of minimizing water consumption, i.e., [8], selected devices generating water consumption (for instance, dishwashers [9,10]), or activities aimed at minimizing the consumption of tap water, such as the use of rainwater or gray water, e.g., [11,12,13], and introducing circular water management [14]. There are also works analyzing a section of the issue of reducing tap water consumption in a selected aspect. An example is the work [15] analyzing strategies for saving drinking water in buildings in terms of environmental benefits. There are many works analyzing the issue of minimizing the consumption of tap water, but in specific locations, for instance in Brazil [15,16] and Sri Lanka [17]. Works assessing methods of encouraging residents to reduce water consumption, for instance [18], can also be found. Most of the existing work focuses on the advantages of minimizing water consumption or the need to introduce it, while the number of studies taking a critical look at this issue, including the possible undesirable effects of reducing consumption or restrictions in this area, remains insufficient. For instance, the topic of the secondary contamination of tap water in the water supply system is mainly discussed in the context of water safety, rather than the potential negative effects of minimizing water consumption. The works relating to the undesirable effects of minimizing water consumption include [19,20]. Moreover, there is a lack of research analyzing the possibilities of implementing water consumption minimization through the prism of both benefits and inconveniences. A research gap can also be identified in the ways of approaching the issue of minimizing the consumption of tap water in buildings. There is still a lack of research carried out in a broader context and with a holistic approach to the topic, taking into account both strengths and opportunities, as well as weaknesses and threats. It is necessary to simultaneously compare, in addition to the obvious positive sides, the negative ones in the implementation of water saving. Only this will allow the adoption of the right strategy to overcome barriers and face challenges.
Owing to the professional experience of the authors, this paper uses multiple points of view, ranging from such stakeholder groups as water users, scientists, and academic teachers in the design of installations and networks and ensuring water safety, to water supply company management. The work takes into account both positive and potentially negative aspects of minimizing water consumption in buildings.
For the aforementioned reasons, the research question “What are the perspectives for implementing minimization of tap water consumption in buildings in the era of climate change?” and the following objectives were chosen for the article: (i) a discussion of the potential for implementing water consumption minimization in urban households, (ii) an assessment of the prospects for implementing water consumption reduction in a broader context through SWOT (strengths–weaknesses–opportunities–threats) analysis, (iii) a critical analysis of possible trends in activities in the field of water management in buildings, indicating their prospective directions, with particular emphasis on the impact of the transformation towards clean and available energy.

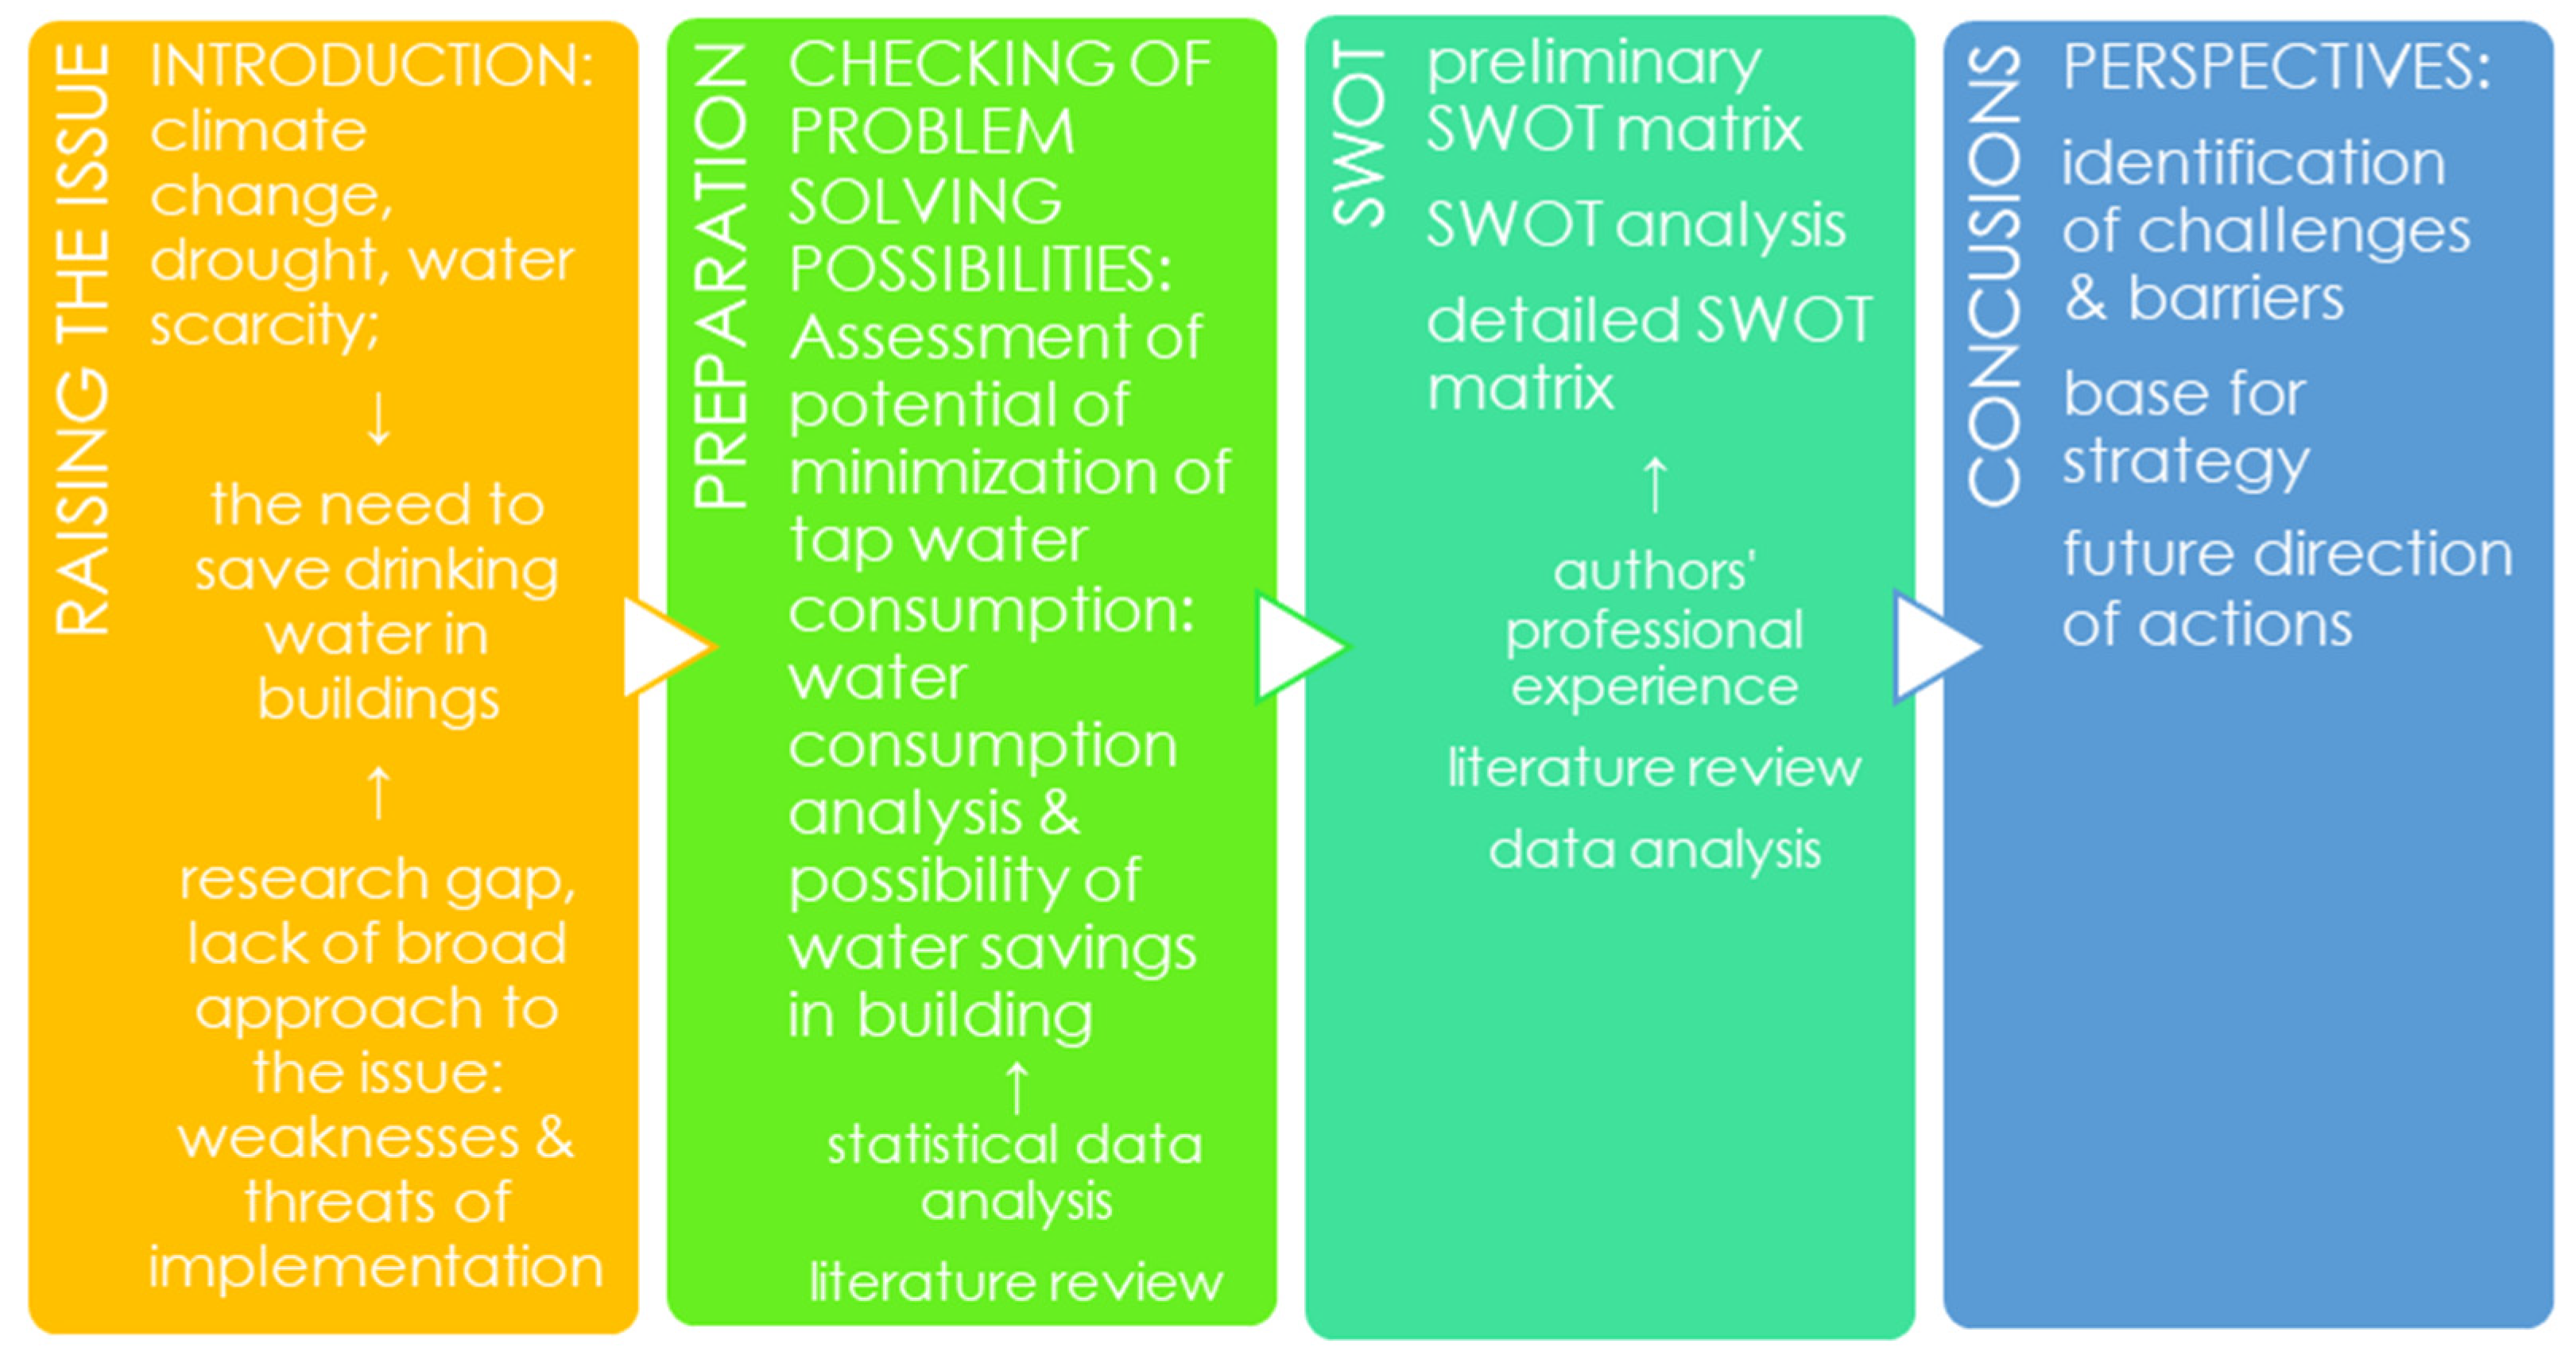
2. Materials and Research Methodology

The research material consisted of data from Eurostat, the Statistical Office of the European Union and data from the Central Statistical Office (GUS—Statistics Poland) in Poland from the Local Data Bank (BDL) and the Statistical Yearbook. In terms of Eurostat data, the category of water statistics at the national level was used, and within it, data sets on water use by category of supply and economical sector, as well as water use balance. In addition, a set of data on demographic change was also used—the demographic balance sheet and raw indicators at the national level in the category of demographics, population, and balance. Data from the field of housing economy and municipal infrastructure were used from BDL in the scope of information regarding network devices (water consumption in households—in general and in cities). Population data (population balance) were also used. Data obtained from a municipal water supply company in Poland were also used. The research material also included the available scientific literature, studies and documents, as well as other source materials.
The basic method used was the SWOT analysis, which was employed to later determine the perspectives and suggested courses of action in the implementation of minimizing the consumption of tap water in buildings. The purpose of using this heuristic technique is to correctly organize information in the examined scope [21] by creating a SWOT matrix in which information is collected regarding strengths, weaknesses, opportunities, and threats related to, for instance, a given project [22,23] (in this case, the activity, which is to minimize the consumption of tap water in buildings in cities). The SWOT matrix is the result of an analysis with a high ability to reflect reference elements with internal potential (strengths and weaknesses) and the ambient (opportunities and threats) [24]. According to [25], the SWOT technique allows providing an integrated and structured analysis of perceived strengths and weaknesses, as well as external opportunities and threats that may bring benefits or hinder further development. Furthermore, following an example from the literature [25], adopting such a method helps to begin to develop a strategy to overcome existing and future challenges for the project.
Previous applications of the SWOT method in the scientific literature in the context of various issues in the field of environmental engineering, for instance [13,26,27,28], justify the selection of this tool for analyzing the implementation of minimizing water consumption in buildings.
The selected SWOT method is one of the basic analyses regarding the current and future situation of a given project [29], which influenced the grouping of factors in the constructed matrix. In the interpretation of the factors building the SWOT matrix adopted in this work, in accordance with [30,31], strengths and weaknesses are features of the current state, while opportunities and threats are expected future phenomena (future) [32].
For this reason, selected issues are repeated in the SWOT matrix, i.e., they appear, for example, in the context of both weaknesses and threats. A similar approach was used in [13].
Figure 1 shows the research design for analyzing the implementation of minimizing water consumption in buildings in the era of climate change. Raising the problem and the resulting need to save water in buildings allowed for identifying the research gap, i.e., the lack of a comprehensive approach to the topic, taking into account weaknesses and threats. The next stage was to check the possibility of solving the problem by analyzing the current water consumption in households and reviewing available ways to save water. After its confirmation, a SWOT analysis was carried out, which allowed for a structured and integrated analysis characterized by a comprehensive approach to the topic. As a result, the main barriers and challenges were identified, future directions of action were indicated, and the foundations were laid for developing a strategy and plans for its implementation (strategy deployment).
As indicated in Figure 1, available Polish and international scientific and technical literature was also analyzed. Moreover, when collecting and grouping information, comparative analysis was used using standard analysis tools (MS Office 365 Excel version 2402). The Statistica 10 program was used for statistical calculations. Complementarily, the professional experience of one of the authors in the management staff of a large municipal water supply company was also used in the work.

3. Potential for Minimizing Tap Water Consumption in Buildings

In order to determine the prospects for implementing the minimization of tap water consumption in buildings, it is necessary to determine the potential we have in this regard, i.e., among others, current water consumption and methods of realization of minimizing its use among others. At the scale of a settlement unit, the demand for water for housing, next to the demand for water for industry, constitutes a significant share of the overall water demand. This can be proven by, for instance, the values of the unit water demand indicators for the integrated indicators method from the Polish guidelines [33,34]. Although there is no update in the scope of these guidelines, due to technical and technological progress in all areas, it can be assumed that the structure of water consumption in settlement units has not changed significantly to this day, especially in terms of the dominance of water consumption in housing and industry compared to other needs. An example, and at the same time a confirmation of this progress, can be, for instance, a tram wash in Krakow, Poland, where rainwater and a closed water circuit are used [35]. Similarly, according to [36], at the European level, consumers such as households and manufacturing industries constitute important water users. It should be added that in some European countries water consumption by the manufacturing industry clearly exceeds consumption in households, in others these consumptions are equal, and in some geopolitical entities the water consumption in households definitely exceeds consumption of this raw material by the manufacturing industry [36]. In the further part of the work, only water consumption in households was analyzed due to the significant share of housing in the overall water demand (water consumption) for settlement units (apart from units dominated by industry) and similar purposes of water consumption in all households, in contrast to industry. The justification for this course of action is that in Europe, water use by households is much more uniform than by industry, as the basic water needs of the population are the same regardless of the country, while the industrial structure—and therefore water use—can vary significantly [36].

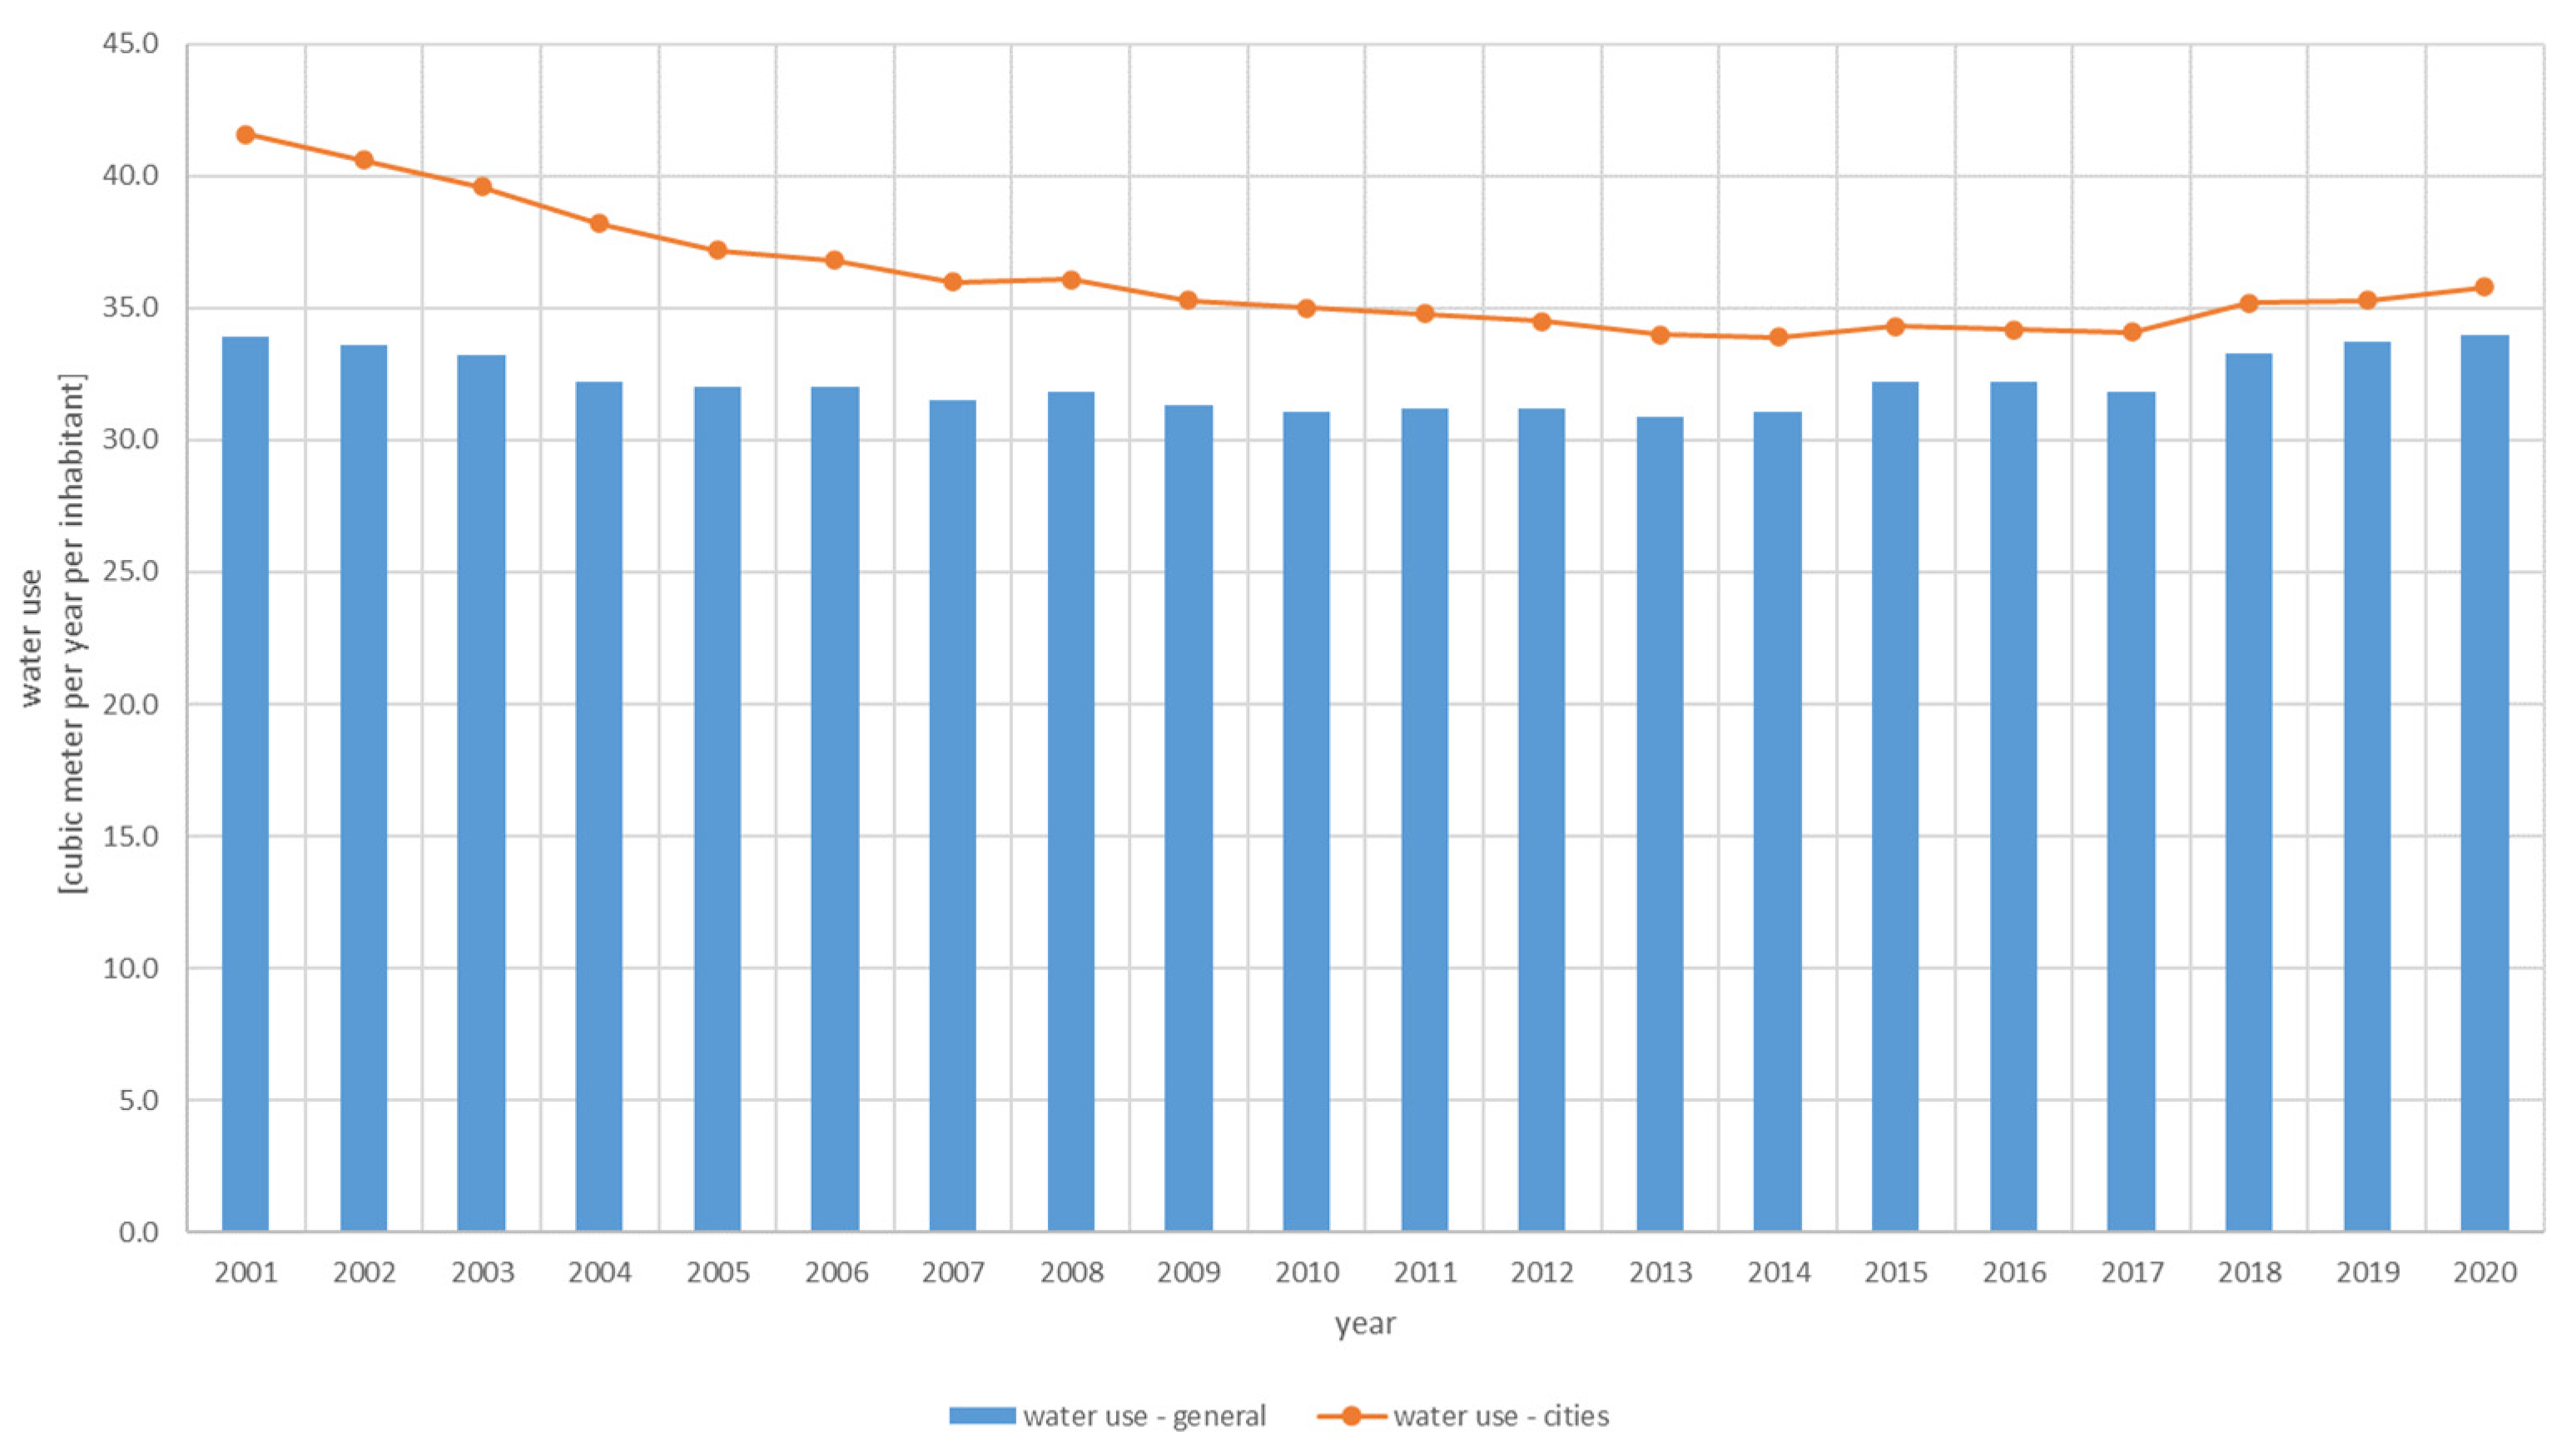
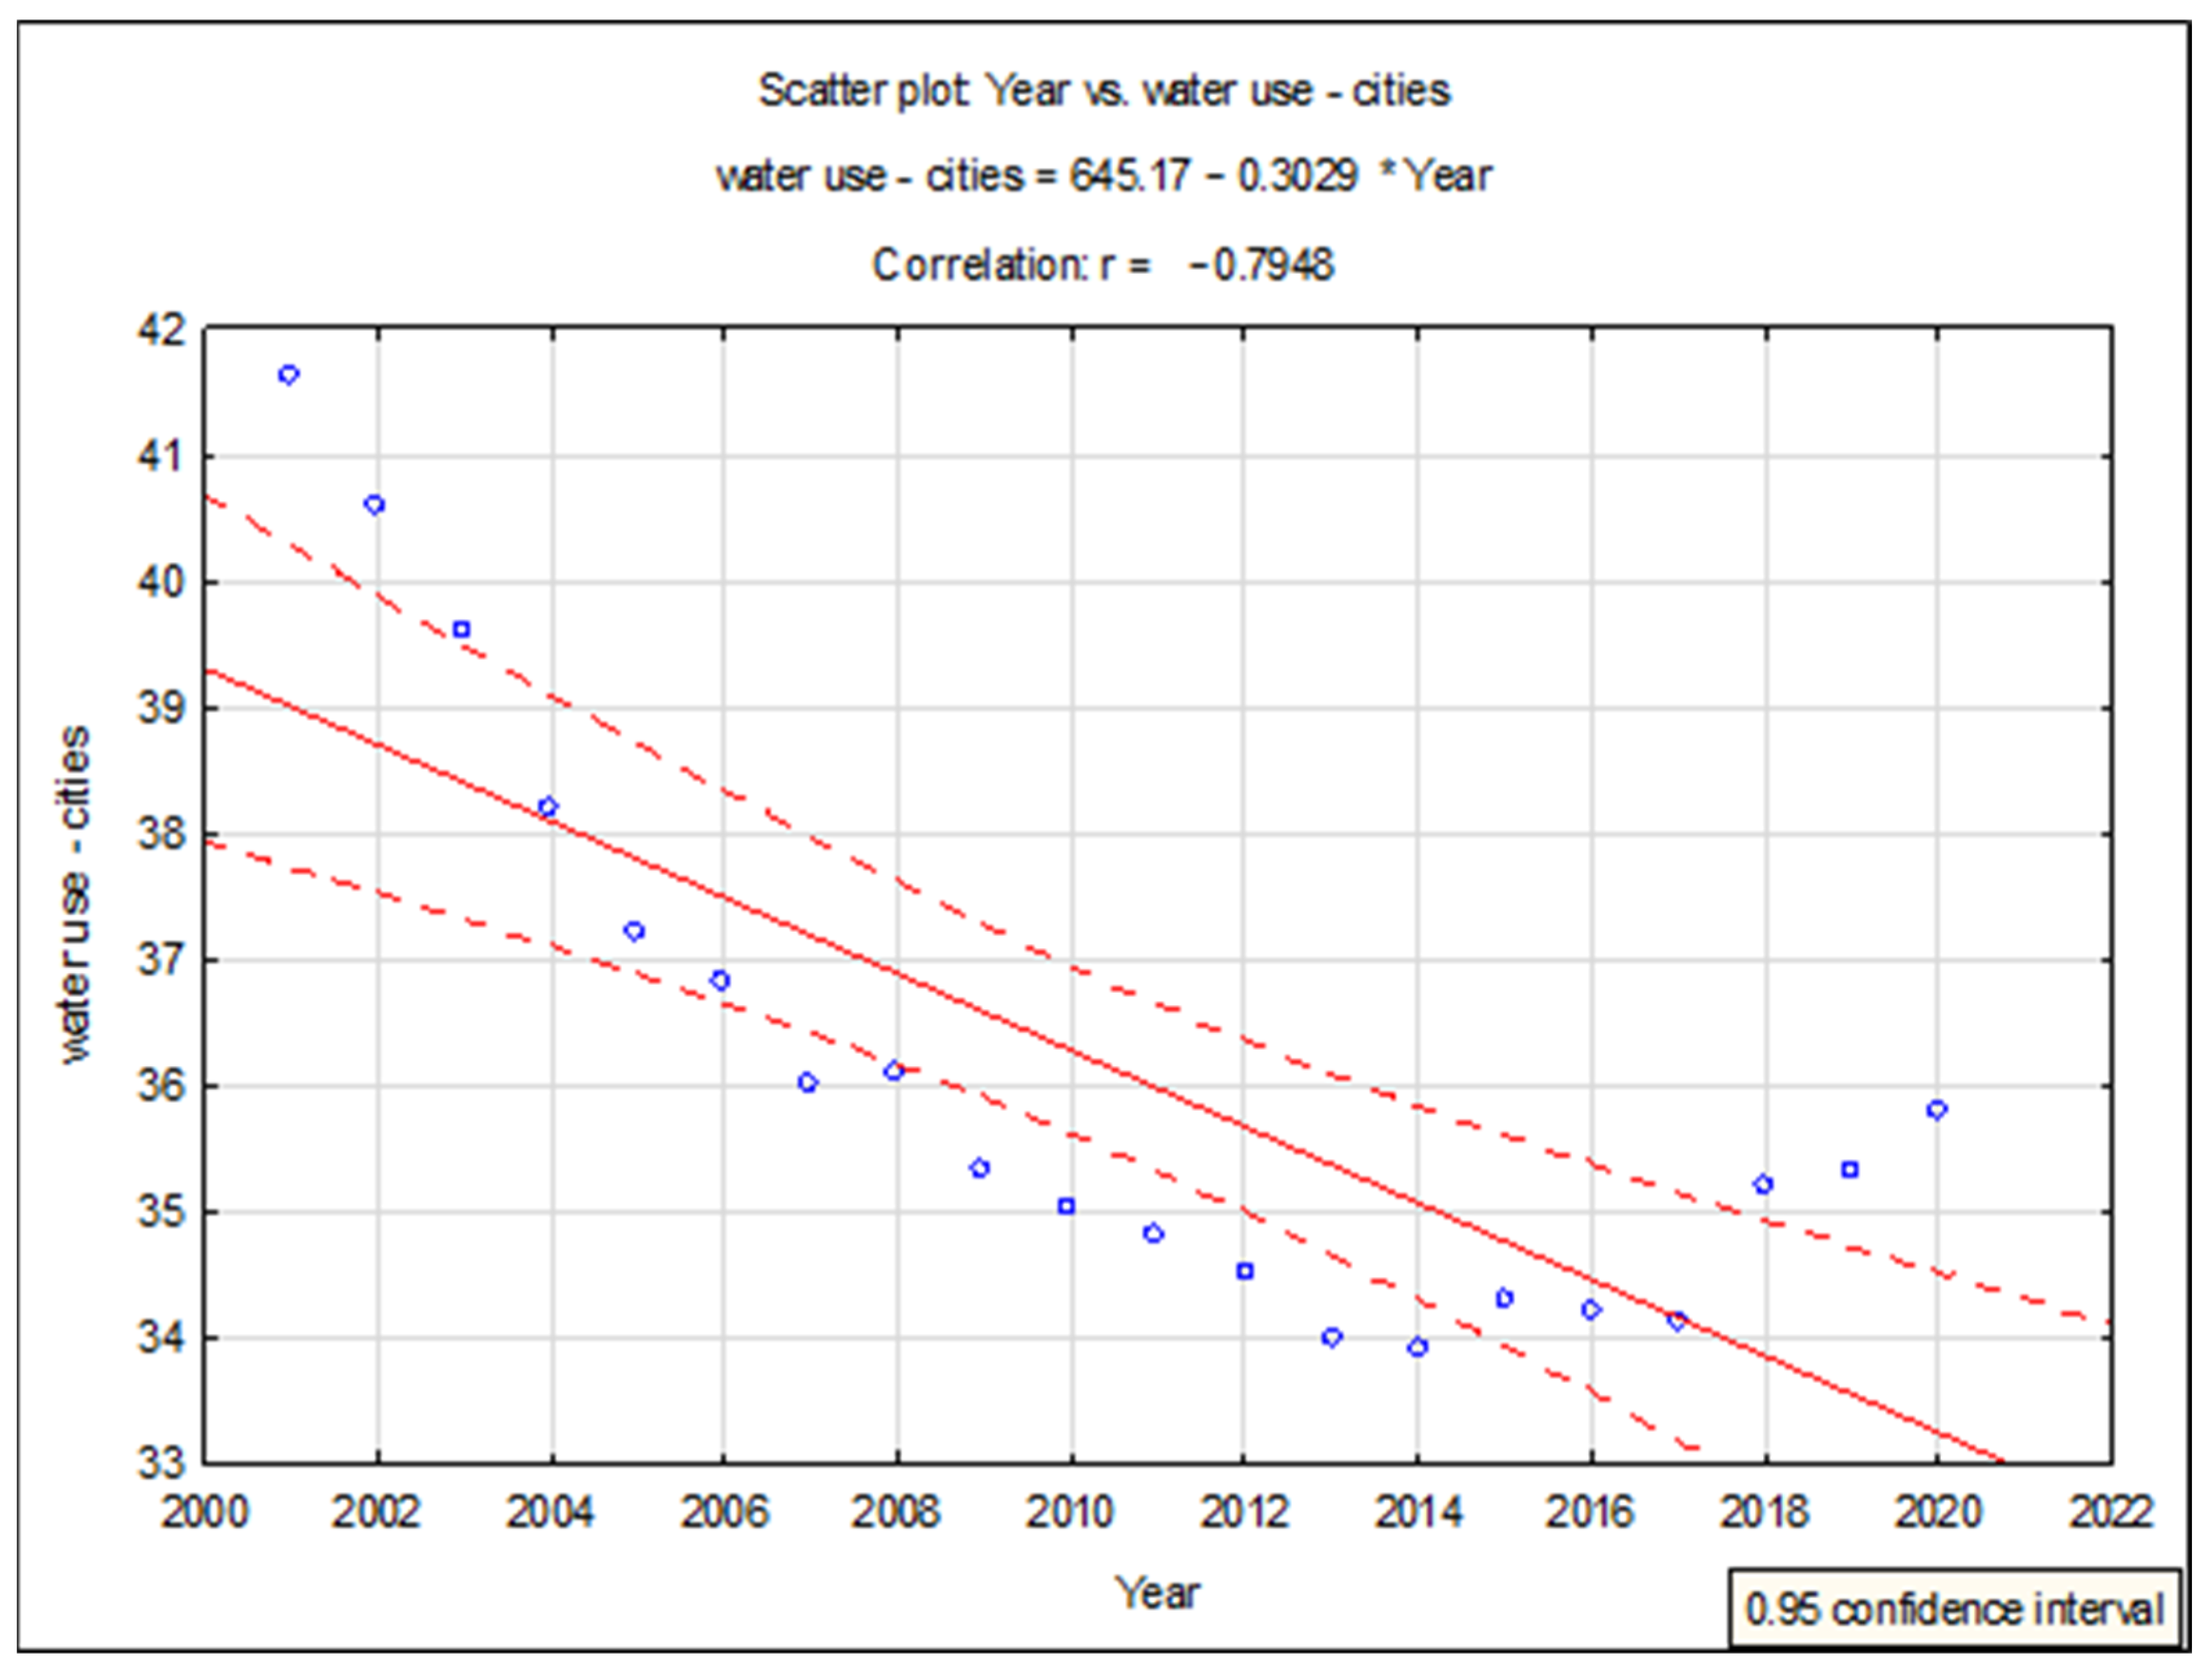
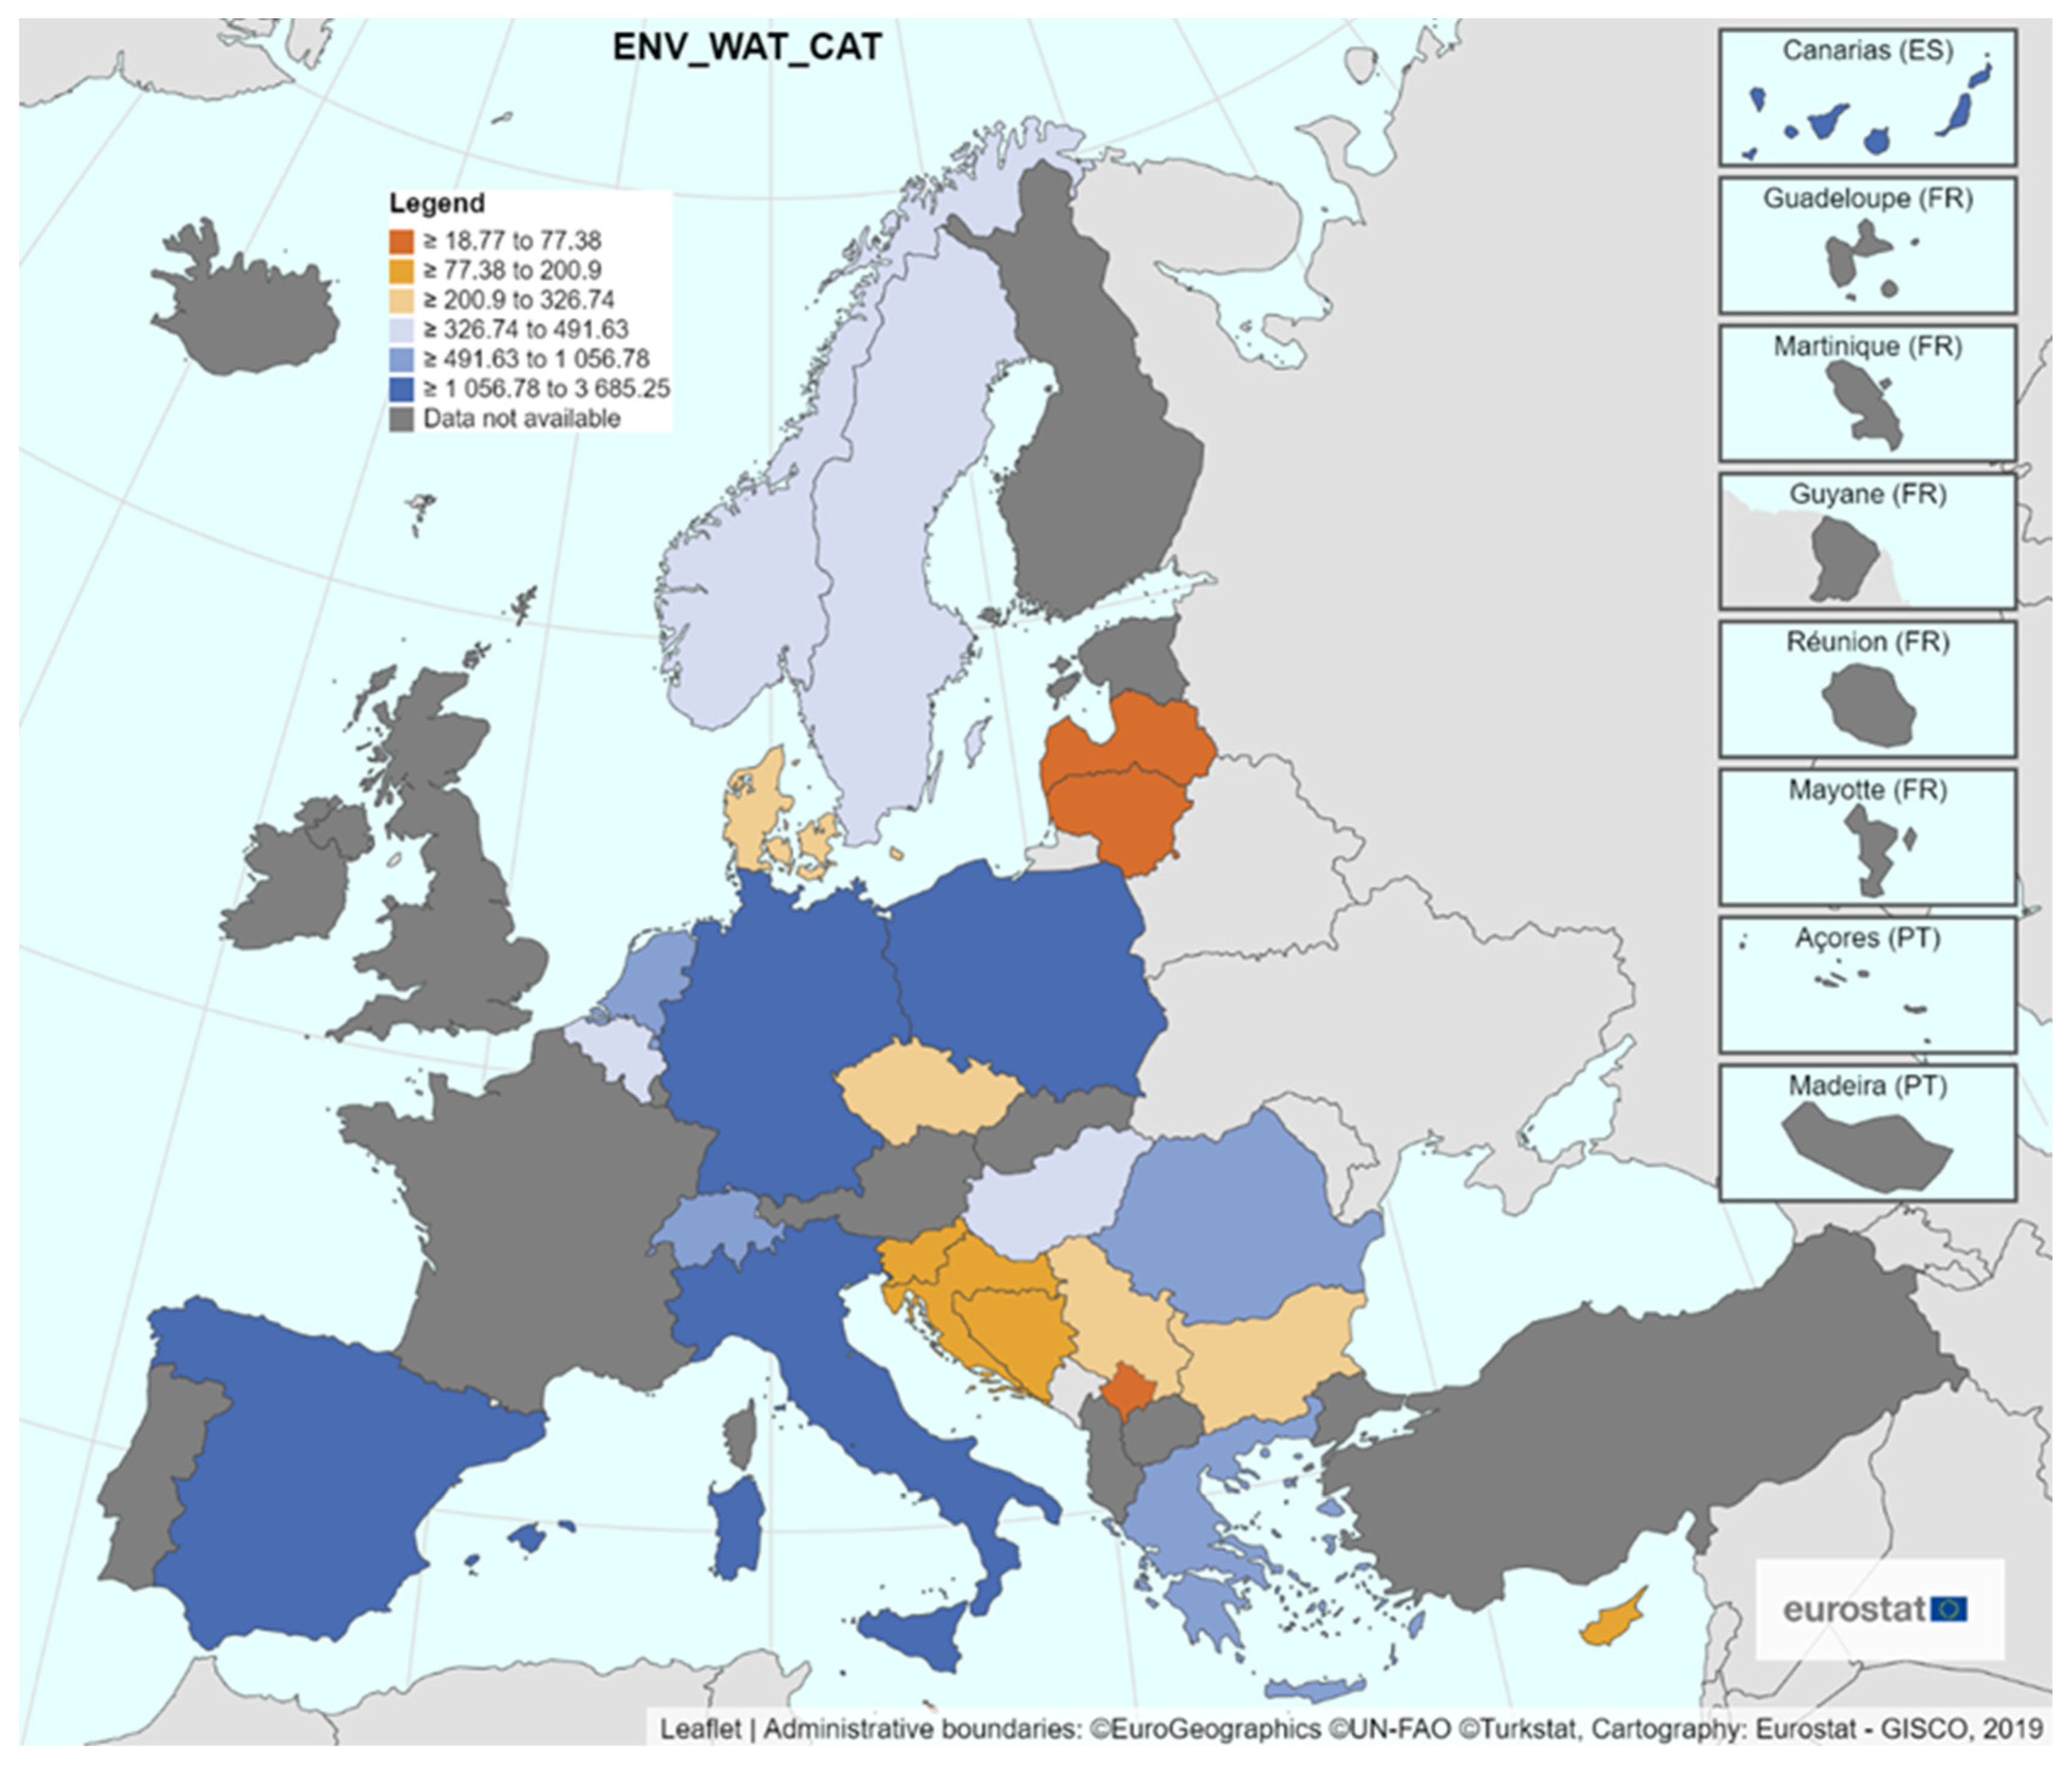
3.1. Current Water Consumption in Households for the Example of Cities in Poland

In order to estimate the potential possibilities of savings in terms of the use of water resources, especially tap water, in households, and to subsequently indicate prospective directions of action in this area, an analysis of the current consumption of water and the ongoing changes in this area is needed.
Analyzing the Eurostat data and estimates presented in [37] regarding the use of water for the needs of households from public water supplies for 2020, it can be noted that for 21 geopolitical entities (out of the 25 taken into account), water consumption in relation to per inhabitant is in the range of 25–50 m3 per year, for two countries it remains in the range of 50–75 m3 per inhabitant per year, for one it is in the range of 75–100 m3 per inhabitant per year, while in another one it reaches a value exceeding 100 m3 per year per inhabitant. Table 1 lists this data in tabular form. At this point, it is worth comparing these data with the minimum water demands specified in the literature. According to [38], the recommended minimum basic water requirement for the population (excluding water for growing food) is 50 dm3 per person per day and includes purposes such as drinking water, bathing, sanitation services, cooking and the kitchen. Annual consumption at this level amounts to over 18 m3 per person. In turn, another source [39] specifies the basic water requirement for survival in the range of 7.5–15 dm3 per person per day, which includes survival needs in terms of survival needs—water intake (drinking and food), basic hygiene practices and basic cooking needs. This range per person per year is 2.7–5.5 m3. Comparing the recommended minimum basic annual demand of 18 m3 to the statistical range of 25–50 m3 of water consumption per year in the vast majority of European countries, it can be seen that there is still significant potential to introduce savings in water consumption in households in Europe. However, it should be emphasized that this observation was made on the basis of a comparison of statistical water consumption and the recommended minimum basic water demand from [38].
Due to the fact that most European countries fall within the statistical range of water consumption between 25 and 50 m3 per year per inhabitant, as shown by the analysis [36], and Poland is among this majority, a more detailed analysis of water consumption in households is presented on the example of Poland in the next part of the work. Moreover, Poland was chosen as an exemplary country because, according to [40], it is a medium-sized country in terms of territorial size and material resources. Moreover, it is located in mid-latitudes (54°50′–49°00′) and has a temperate (warm transitional) climate [41].
The analysis included annual water consumption in households per capita in general and in cities in Poland in the last two decades based on data from the Local Data Bank (BDL) of the Central Statistical Office in Poland [42] and data from Statistical Yearbook 2002 of the Central Statistical Office in Poland [43]. Figure 2 shows the analyzed data.
Water consumption in households in general in Poland in the years 2001–2020 fluctuated in the range of 30.9–34.0 m3. Pearson’s linear correlation coefficients were calculated for the analyzed data, according to the formula [44]:
r x y = i = 1 n ( x i x ¯ ) ( y i y ¯ ) i = 1 n ( x i x ¯ ) 2 i = 1 n ( y i y ¯ ) 2
The Pearson’s linear correlation coefficient calculated for the year and annual water consumption in general is −0.01 and is not significant. Considering the data from [42,43] only for cities in Poland in the same period, it can be observed that they are slightly higher than the value in general (from 1.6 to 7.7 m3) and vary within a wider range (from 33.9 to 41.6 m3). The correlation coefficient for data for cities in Poland and for the year is negative, while its absolute value of 0.795 indicates a very high correlation according to the Stanisz scale [44] and a high correlation according to the Guilford scale [45,46].
These results are consistent with the source [36], according to which many EU Member States for which data were available reported more or less stable values for household water consumption from public water supplies over the last three decades (1990–2020). It is worth noting, however, that the same source [36] includes Poland among the countries recording a moderate or strong decline in water consumption (with the analysis period covering three decades). In turn, by analyzing in detail the scatterplot (Figure 3), it can be observed that, in recent years, the value of water consumption in cities has been increasing again.
Comparing the values of annual water consumption in households on the example of Poland with the recommended minimum basic water demand for the population specified in [38], it can be concluded that the lowest values recorded over the last two decades exceed this value by 12.9 m3 (in total) and 15.9 m3 (for cities). This may confirm the existence of the potential for minimizing water consumption in buildings, but it is greater in cities. However, when comparing the statistical ranges of water consumption in Europe from [36] to the absolute basic consumption (ABC) defined in [47] of 33.6 m3 per inhabitant per year, the potential for implementing further minimization of water consumption in households is not look so promising. Moreover, for instance in Poland, the statistical average water consumption over the last two decades (2001–2020) in urban households based on data from [42,43] is 36.1 m3 per inhabitant, which is much lower than the realistic daily acceptable consumption for limited needs defined in [47] as 63.9 m3 per year per inhabitant. A similar situation is in the previously mentioned 21 European countries with consumption ranging from 25 to 50 m3. It should be noted, however, that the values specified in [47] are defined for a 1-person household, assuming that as the size of the household increases, the demand per inhabitant decreases in accordance with the specified formula [47,48]. Therefore, the difference between the value of 63.9 m3 determined for a single-person household and the consumption values for European countries is explained by the fact that the water consumption values in individual countries mainly reflect multi-person households [47].
However, it can be stated that there is potential for implementing the minimization of tap water consumption in households. In some countries, it is larger, in others smaller, and it depends, among others, on the current sanitary equipment and its level of technical and technological advancement. It should also be noted that one issue is to achieve the lowest possible water consumption in the household while maintaining the comfort of users, and an other is to minimize the consumption of high-quality tap water at the expense of, among others, the use of rainwater or gray water.
In order to determine the volume of water the discussed issue concerns, the analysis based on Eurostat data [49] also calculated the sums of available data on water consumption as part of the public water supply, and self, and other water supply in Europe in the individual years of the decade 2011–2020. The results of the calculations are presented in Table 2. Moreover, to illustrate the issue, the map (Figure 4) shows the amount of water used by households from public, selfand other water supply in 2015 by individual countries in Europe.
In the analyzed decade, out of the 37 geopolitical entities taken into account, annual data were available for a maximum of 24 entities, and it should be added that these were not the same 24 countries every year. The largest sum was received in 2015 and amounted to 17,300.54 million cubic meters of water. Second in line was the total from available data from 2016, which amounted to 16,853.6 million cubic meters of water. For both 2015 and 2016, available data came from 24 countries, of which 22 geopolitical entities were the same countries. In 2015, data from Italy and Sweden were available, while in 2016, data from Austria and Turkey appeared in their place. Taking into account the 2016 total, adding to it the latest available data for Italy (2015), Sweden (2015) and the United Kingdom (2011), as well as adding data for Albania from the year closest to 2016, i.e., for 2017, we calculate the annual consumption of water in households in Europe to be equal to 24,385.85 million cubic meters of water (based on available data and assumptions).
This value includes data from only 28 countries and excludes countries such as France, Portugal, Finland or Ireland. It can therefore be estimated on this basis that the volume of water consumption in European households exceeds 25,000 million cubic meters of water per year.
In this context, it is also worth providing data for Europe regarding reused water. Figure 5 shows the amount of water reused for European countries for which data were available and greater than 0. These values were also related to the number of inhabitants of a given country, expressing the amount of water reused per capita. It can be noted that Spain is the country where the highest amount of reused water has been recorded. Whereas, in Cyprus, the amount of reused water per capita is the highest. Analyzing the number of countries with data on reused water and the amount of this water, it can be concluded that, in this respect, there is also potential for implementing the minimization of the consumption of tap water in buildings.

3.2. The Possibilities of Minimizing Water Consumption in the Household

In addition to analyzing the current water consumption, in order to assess the prospects for implementing the minimization of tap water consumption in buildings, it is necessary to determine the methods for the realization of this task. There are many possibilities to minimize water consumption in buildings, starting from changing the habits of users, through replacing or installing additional accessories for sanitary equipment (including flow regulators, aerators), replacing sanitary equipment (fittings, sanitary devices), to the use of water from alternative sources as opposed to water from the water supply network (including gray water, rainwater, water from air humidity). The transformation towards a circular water economy for households can also be described as one of the ways to minimize the consumption of high-quality tap water. Nevertheless, maintaining water safety and comfort for water users should be remembered.

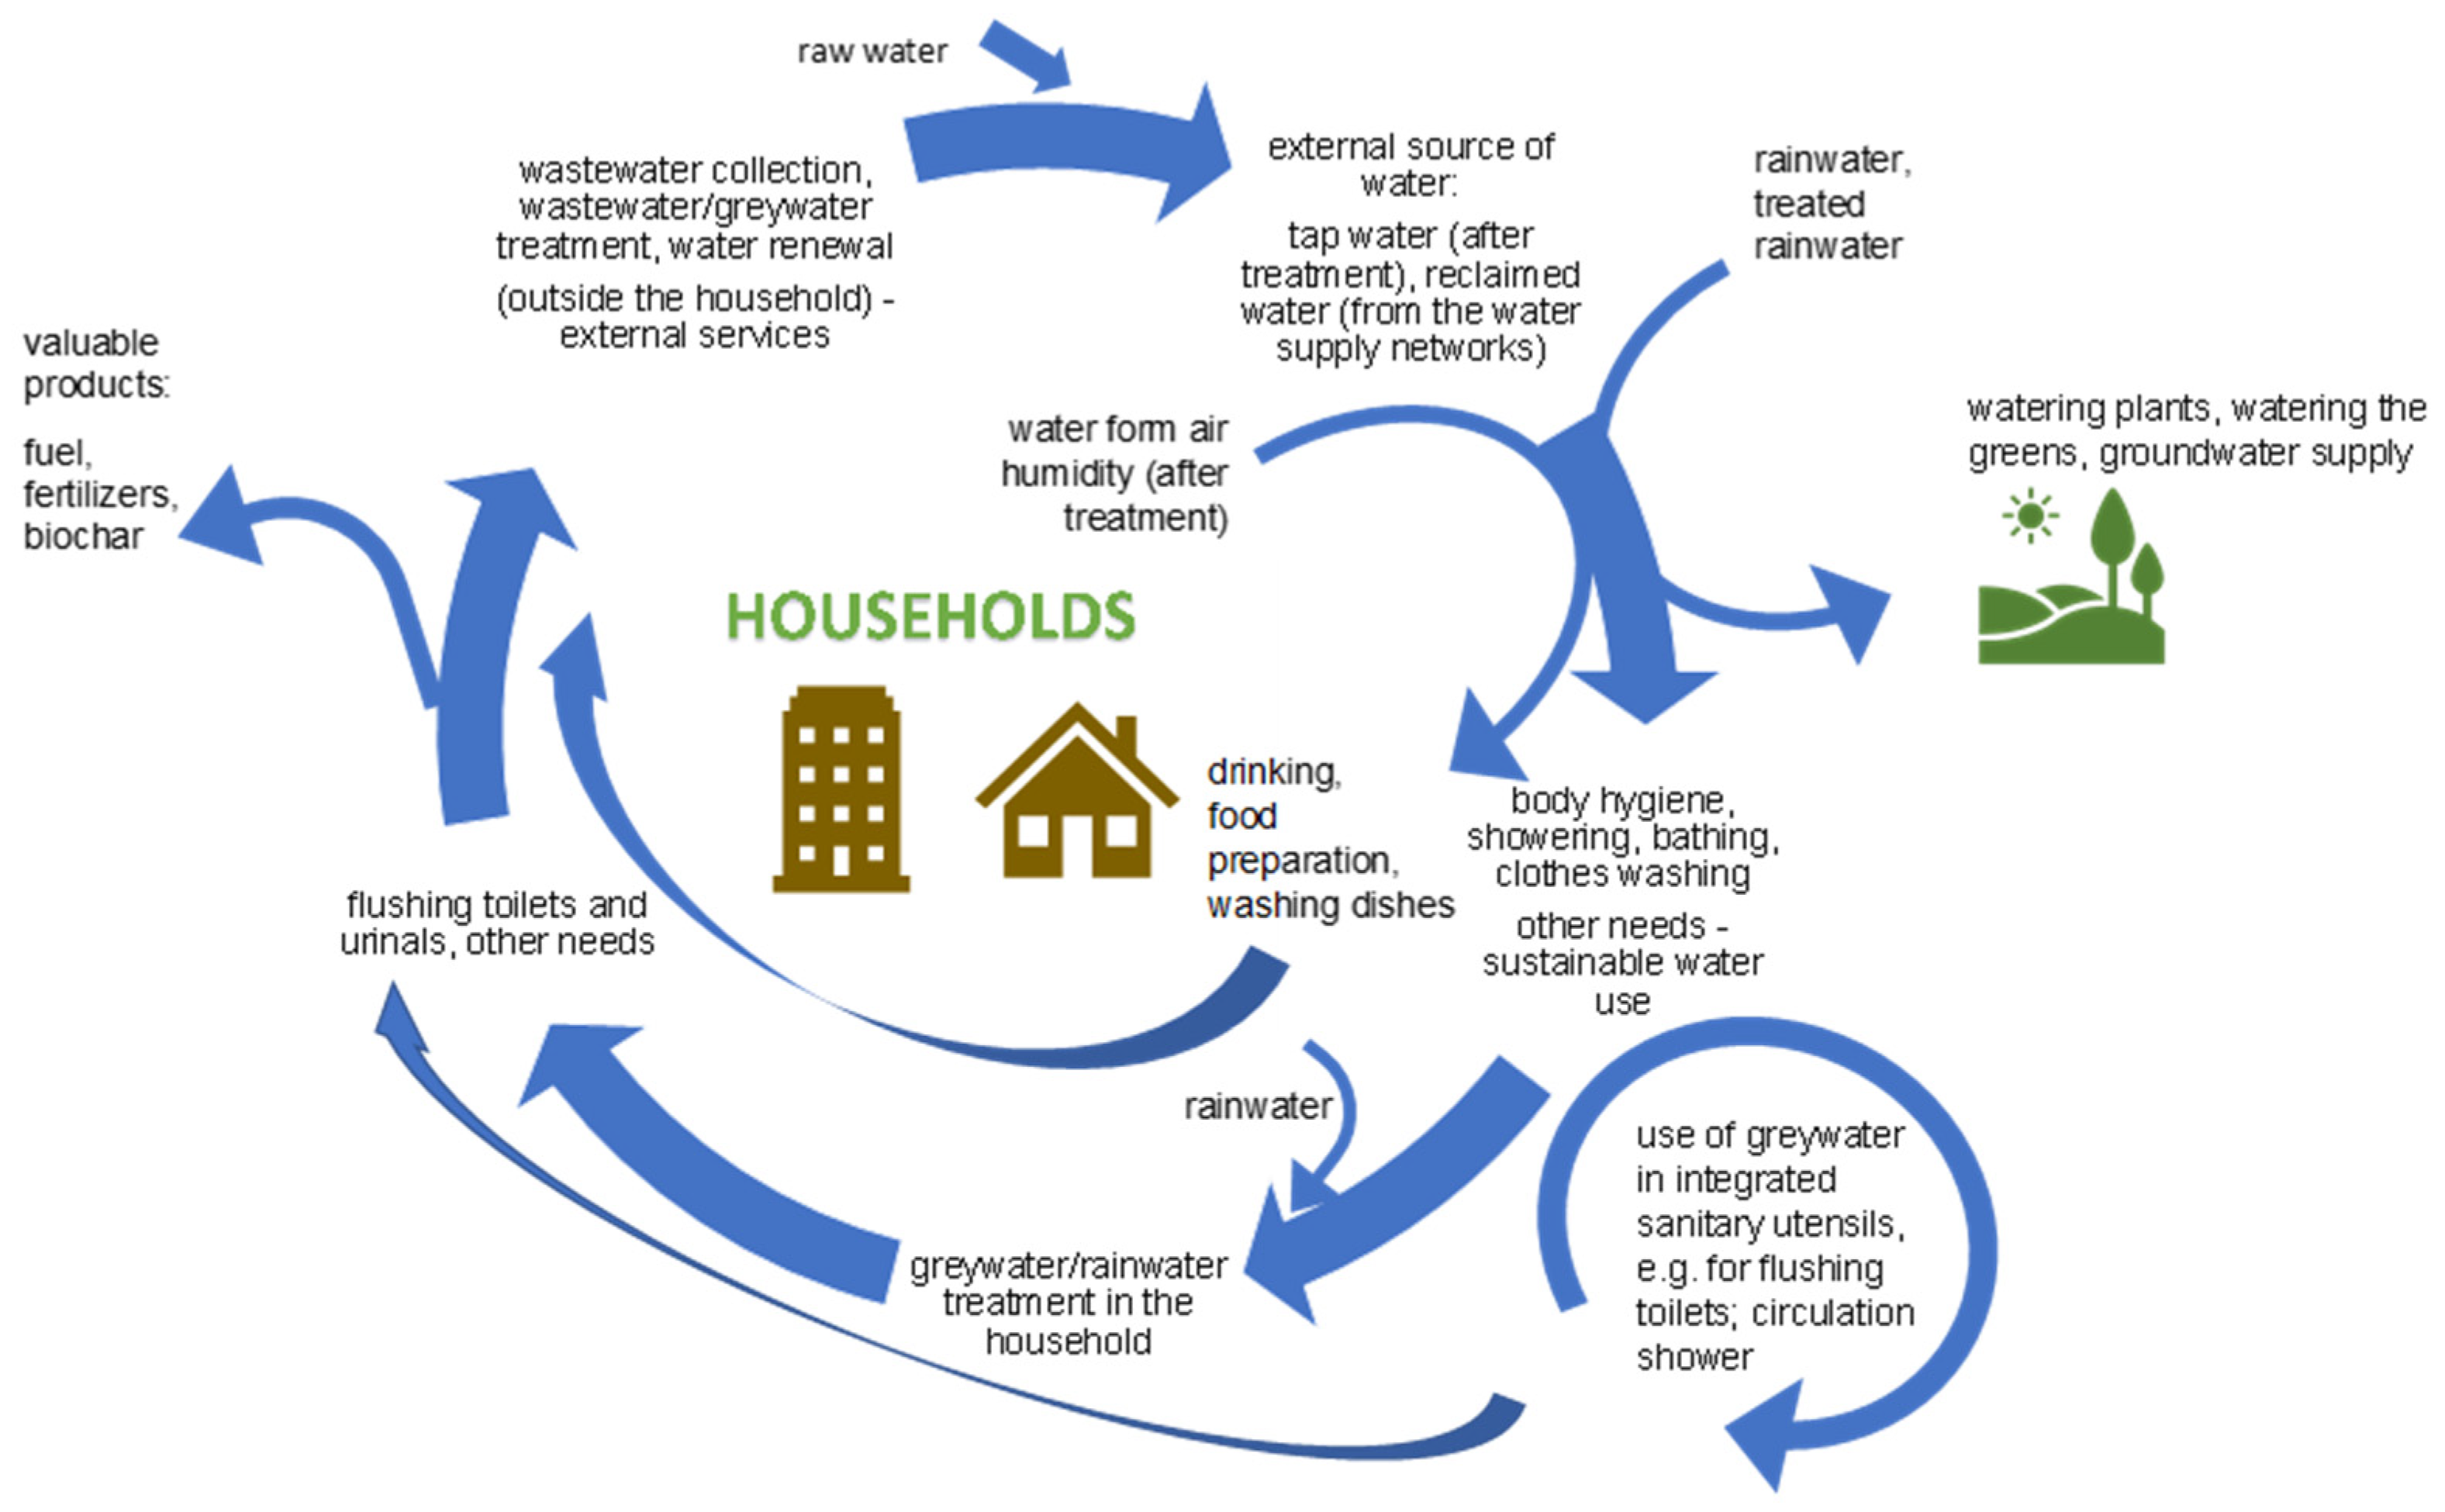
Circular Water Management at the Household Level

When assessing the prospects for minimizing water consumption, one should take into account not only the currently existing possibilities for minimizing the consumption of this raw material in buildings but also those that already exist but are not yet widespread, as well as those that may appear in the near future. In addition to the previously mentioned solutions, it is necessary to look for a way to combine them and the possibility of intensifying savings while checking what negative operational effects may accompany them. To illustrate the possibilities in this area, a model of water circular management is proposed, with particular emphasis on the household. The starting point for the proposed model was, among others, a circular economy model for water and wastewater management [3] and a circular economy model for the water and wastewater sector [14]. The model “towards” water circular management at the household level is presented in Figure 6.
Most of the solutions taken into account are not new. They include, among others, the use of gray water (through integrated sanitary facilities or dual installations) or the use of rainwater for irrigation and toilet flushing. They are successfully used in various locations, but their level of dissemination is still insufficient. Moreover, whenever possible, one should strive to apply as many solutions as possible in one place to maximize the effect, without forgetting to control possible negative effects. The model also assumed the existence of dual water systems. Supplying households through, among others, water coming from the process of water renewal from external sources is rare, although not impossible. The work concerning trends in dual water supply systems [50] confirms this. A less typical solution included in the model is the use of water from air humidity. In this respect, we may consider water that is a by-product of air conditioners, but also water obtained from air humidity solely for the purpose of its use. The existence of such a possibility is confirmed, among others, by the availability on the market of devices intended for this purpose [51,52,53,54]. Research was also carried out on a new concept of a process consisting of two parts—the absorption of moisture from the air by a highly concentrated salt solution (moisture binding), and then the distillation of the diluted salt solution and condensation of water (desorption) [55]. Special panels have also been developed that produce water from air humidity using solar energy and an adsorbent [56].

4. SWOT Analysis of the Implementation of Minimizing Tap Water Consumption in Households

Based on the available materials described in previous chapter, a SWOT analysis was carried out for the implementation of minimizing the consumption of tap water in households in order to determine the prospects for this action. Figure 7 provides a general SWOT analysis of the implementation of minimizing tap water consumption in urban buildings.

4.1. The Strengths of Introducing the Reduction in Tap Water Consumption

The most important strengths of introducing a minimization of tap water consumption in residential buildings is the realization of the main goal, i.e., reducing water consumption through its sustainable use. At the same time, it is the implementation of the 12th goal (Responsible consumption and production) of the 17 sustainable development goals (SGDs) adopted by the United Nations’ member states in 2015 as part of the 2030 Agenda for Sustainable Development [1]. Implementing minimization helps to achieve the effective use of natural resources, which include water (specific objective 12.2), and therefore, it is also the protection of the natural environment (protection of water resources). It should be added that source [3] includes the sustainable use of water as part of smart water circular management.
The implementation of minimizing the consumption of tap water in buildings will allow for saving raw materials (water, chemicals) as well as energy and energy resources. First, this will take place at the household level, and in the long run, at the city level (water treatment plants, pumping stations, or wastewater treatment plants). By minimizing the use of tap water in a household, the demand for both cold and hot water is usually reduced. In Germany, the consumption of hot water for residential purposes, depending on the standard of the apartment, ranges from 10 to 80 dm3/d per inhabitant [57]. According to the source [58], the average consumption of hot water in a household can be assumed to be in the range of 30–60 dm3/d for one inhabitant. Approximately and for the design purposes of the installation, the consumption of hot water at a temperature of 55 °C is assumed to be 50 dm3/d per 1 resident [59]. This corresponds to approximately 3 kWh of demand for thermal energy per inhabitant, so for simplicity, it can be assumed that one person consumes 1000 kWh of final energy per year to prepare hot water, regardless of the source of its production [59]. Reducing the demand for tap water will result in a reduction in the consumption of energy/energy raw materials used to heat hot water at the household level. Importantly, the preparation of domestic hot water may constitute up to 35% of the total energy demand for currently constructed energy-efficient single-family buildings [59]. In passive houses, the share of energy used to prepare domestic hot water may constitute up to half of the total energy balance [60]. In turn, according to Eurostat statistical data, water heating accounts for 15% of energy consumption by households in the European Union [61]. For instance, in studies conducted for a household consuming approximately 235 dm3 of hot water and inhabited by four adults, the average month–day performance for an electric water heater was 22.2 kWh [62]. As a result, a reduction in energy/energy raw materials bills is expected. The same applies to water bills—at least from a short-term perspective. Reducing household bills for water and energy/energy resources may be subject to other impacts, which will be discussed in the section on the weaknesses of implementing a water consumption reduction in buildings.
It is also worth mentioning showers with water recirculation, which ensure savings in both water and the energy used to heat it. Feasibility studies and market analyses of such a solution were conducted as part of a project supported by the European Union [63]. Currently, materials concerning recirculating showers are available, such as [61,64].
Introducing the minimization of tap water consumption in buildings on a large scale in a city (macro scale) will result in a reduction in the demand for water. As a result, in addition to reduced raw water consumption, reduced consumption of chemicals used in the water treatment process, as well as reduced energy demand, among others, can be expected for water and wastewater transport devices. As the amount of water supplied to buildings decreases, the amount of wastewater may also decrease (unless tap water is replaced by an alternative water source). At the same time, the amount of waste (sludge) from water purification should also decrease.
Another important strength of implementing water consumption minimization into buildings is the low investment cost, starting from just a few euros. Such costs are typical for simple solutions that are also very effective. For instance, the use of an aerator can save up to 62% of water, and a shower head up to 55% of water [65]. Obviously, these are sample data, depending on the flow from the current aerator or shower and the solution used. The simplicity and ease of installation of this type of solution are also important. The less complicated ones can be installed by each user themselves. It is also worth mentioning that there are solutions that allow for achieving the first effects with zero investment costs, namely by changing users’ habits regarding the use of water in buildings.
Minimizing the consumption of tap water also means diversifying the sources of water supply for buildings, i.e., using, among others, rainwater. In the case of rainwater collection, storage, treatment, and subsequent use, this also means relieving the sewage systems at the time of peak flows in the sewerage. It is a way of managing rainfall in the place where it occurs, which, in the light of extreme rainfall phenomena related to climate change, is a way of adapting city inhabitants to climate change.
The introduction of a minimization of water consumption in buildings also gives society the ability to prepare for periodic water shortages, so as not to lead to the situation experienced by Cape Town in 2018 before “day zero”, experiencing the so-called slow disaster according to [66]. Earlier implementation of solutions enabling the reduction in water consumption in households will reduce the risk of lack of water in the event of periodic water shortages, as well as a less noticeable reduction in user comfort caused by possible restrictions. At the same time, the specter of “Day Zero” will be postponed. According to [66], in the case of “Day Zero” reversal, the decisive factor is the change in behavior at the individual household level, not political leadership, smart management or quick technical repair.

4.2. Weaknesses of Implementing Water Consumption Minimization

The weaknesses of introducing water consumption minimization include the fact that, in certain situations, there may be a reduction in users’ comfort when using water. This applies to situations when, among others, restrictions are enforced—as in aforementioned example of Cape Town—instead of a slow process of implementation preceded by the education of society. Another example of such a situation may be a poorly selected solution that does not meet the current needs of users.
According to some, significant reductions in water usage over an extended period of time with current technology raise concerns, and limiting toilet flushing and hand washing may have a negative impact on hygiene [47]. This may have a negative impact on the quality of life and health of people, which, in the light of the COVID-19 pandemic, becomes even more important.
When introducing more comprehensive solutions, such as a dual installation or a gray water recovery system, the investment costs are much higher than in the case of simple solutions. With such solutions using alternative water sources (rainwater, gray water), additional operating costs related to the consumption of energy/energy raw materials, the replacement of consumables, and the possible need to manage the generated waste should also be expected. It should also be borne in mind that in the case of using rainwater for household purposes (excluding the irrigation of green areas), a fee for the generated sanitary sewage must be taken into account, although its determination may also generate difficulties in the range of determining the amount of wastewater.
Among the weaknesses, it should also be borne in mind that some solutions involve additional energy consumption; these include, for example, electronic faucets and electronic flushers. This does not involve significant consumption in every case, but it should not be forgotten and should be taken into account in the overall profit and loss balance.
Reduced water consumption from a building’s water supply system, caused either by reducing water consumption or by replacing part of the tap water with water from another source (rainwater, gray water), results in a reduced water flow rate and an extended residence time of water in the water supply system. The threat of reducing the flow rate and increasing the retention time of water in the drinking-water installation due to its limited use when using recycled water is indicated by source [67]. If the reduction in tap water consumption is implemented on a larger scale, this phenomenon will also apply to the water supply network. In turn, these conditions favor the occurrence of secondary water contamination in the water network and installation (the contamination of tap water). For instance, the development of microorganisms that pose a threat to drinking-water installations, such as Legionella or Pseudomonas bacteria, is favored by low flow rates, water stagnation, and elevated temperatures [67]. In the case of water supply networks, increasing the age of water makes it necessary to rinse the water supply network. In turn, high-quality water is also used for this activity. In such cases, the water company is deprived of profits due to the water consumption by residents and incurs costs related to the more frequent rinsing of the network—the costs of water treatment and transport as well as environmental fees for its intake. It should be added that the fixed costs of water supply companies include, among others, property tax [68]. The consequence of this state of affairs may be an increase in water prices (unless the reduction in water consumption by households is compensated for by connecting new customers).
To demonstrate what order of amount of water is used in cities for rinsing the water supply network, Figure 8 presents data for the years 2019–2022 from a large water supply company in one of the largest cities in Poland. Water for rinsing after failures and water for rinsing networks due to the risk of secondary water contamination are illustrated.
It should also be added that some networks and installations were designed in the last century and for much higher flow rates than those currently occurring in water supply systems. Therefore, the systems may already be slightly oversized. From this perspective, special attention should be paid to the fact that in the event of water stagnation, corrosion processes may occur faster [67]. This, in turn, also contributes to the possibility of water contamination. Chemical hazards may come from, among others, corrosion processes of pipes and fittings used in water installations [67].
In case of effective implementation of reducing the consumption of tap water in buildings (without replacing it with an alternative water source), an increase in the concentration of pollutants discharged into the sewage system and directed to wastewater treatment plants can be expected in the long term. This may have an impact on the long-term prospects of the wastewater treatment process. However, if there is a simultaneous increase in rainfall caused by climate change, the potential increase in concentration may be offset (for combined sewage systems). It should be remembered that the type of contaminants and the amount of load on the treatment system are complex functions of many factors, including water and sewage installations, atmospheric quality, deposition and runoff, as well as usage patterns [70]. Reducing water consumption in households will result in reduced wastewater flow, which in turn may generate operational problems in the sewage network of the settlement unit. However, the share of water consumption by households in the overall water consumption of the settlement unit and the load on individual sections of the sewage network are also important here. For example, in the Netherlands and Belgium, water consumption by the manufacturing industry is clearly (3–4 times) higher than in households [36], so in such locations, the location of industrial plants in relation to housing is crucial.
On the weakness side, the substantial difficulties encountered during trials of the introduction of installations for the use of an alternative water source (rainwater, gray water) into existing buildings should also be mentioned. These include, among others, a lack of space to run additional pipes. This topic is discussed in detail in [71]. These difficulties can be classified as a barrier to the implementation of minimizing the consumption of tap water in buildings. The source [67] also indicates the possibility of the occurrence of conditions and situations referred to as dangerous events, leading to the occurrence of threats. Among them, [67] lists connections to independent water installations or recycled water installations. It should be added that the risk of incorrect connection between drinking water and non-potable water installations increases with the size and complexity of the building [67], so it is particularly dangerous in the case of multi-family buildings.

4.3. Opportunities for Introducing Water Minimization in Households

In terms of the possibilities that are opening up or may arise for the implementation of reducing water consumption in households, several of them can be distinguished that support the introduction of solutions to the sustainable use of environmental resources in cities. Among them is, above all, public education. This is conducted in various ways and addressed to various social and age groups. The range of methods is very wide. These include various types of social campaigns; organized action, for example, on the occasion of World Water Day (March 22 every year); or scientific conferences. It also comprises education in kindergartens, schools, and universities, as well as outside them. As examples, it is worth mentioning the Hydropolis water knowledge center in Wroclaw [72] and the ecological workshop of “Droplet’s Academy” organized by a water supply company in Krakow for the initial grades of primary school [73]. Television advertisements that reach a wide audience and are placed, for example, by dishwasher manufacturers, also ought to be mentioned. To this should be added the wealth of internet resources, including websites (e.g., [74]) or entire sets of websites (e.g., [75]) devoted to saving water.
The policies, strategies, and programs developed also serve the same purpose, i.e., creating opportunities to reduce water consumption. They are worked out through a series of meetings, an example of which was the United Nations Water Conference in New York accompanying the celebration of World Water Day in 2023. It was a place for a debate in favor of water in the face of the ever-increasing global water resources crisis [76]. Also, new legal acts (or amendments to existing ones) may prove to be an opportunity to accelerate the implementation of water consumption reduction. The direction of action here may be guidelines obliging designers and investors to take into account the possibility of introducing gray water or rainwater installations into new buildings. The transformation towards the European Green Deal (EGD) or the implementation of the assumptions of a smart water circular economy may also create potential opportunities for the further implementation of minimizing water consumption in buildings, especially since the EGD should be viewed not only as a domestic policy of the European Union but also as a foreign policy, as argued in the work [77]. The EGD is an ambitious action plan covering climate action, supporting the development of renewable energy sources and promoting energy efficiency, and encouraging a circular economy [77]. In turn, the development of renewable energy sources and increasing energy efficiency is a great opportunity to use alternative water sources and thus minimize tap water consumption in buildings. Moreover, the effective and economical use of a raw material, which in the case discussed in this article is water, fits into the circular economy model for the water sector.
An interesting example both in terms of developing government strategies and raising public awareness of water protection is Jordan—a country ranked second in terms of water scarcity in the world [78]. The work [78] analyzes in detail the strategies that aim to shape citizens’ water-related behavior.
The increase in social awareness related to education conducted in various fields regarding the need to limit climate change and adapt cities to its effects is not without significance here. It is extremely important for society to understand the need to minimize the consumption of water and learn how to save it.
In addition to education, it is also worth mentioning sanitary fittings assessment systems, both mandatory and voluntary. They play an educational role in the implementation of minimizing water and energy consumption. They enable consumers to make a more conscious choice of sanitary equipment from the point of view of saving natural resources (water and energy/energy raw materials). The purpose of these systems is also to mobilize sanitary fittings manufacturers to develop and sell products that minimize water consumption. These include, among others, such systems as Mandatory Water Efficiency Labeling (WELS) [79], the Water Efficiency Label (WELL) [80], or the Water Efficient Product Labeling Scheme (WEPLS) [81].
Multi-criteria building assessment systems, such as BREEAM [82] or LEED [83], may also provide opportunities to introduce solutions that minimize water consumption in buildings. In these systems, buildings receive points in the assessment for solutions enabling a reduction in tap water consumption. In addition, the dissemination of environmental management systems, such as those according to ISO 14001 [84] or the Eco-Management and Audit Scheme (EMAS) [85] standards, may contribute to the implementation of minimizing water consumption in buildings, but this will only apply to company buildings.
Opportunities for implementation may also be developed through scientific research and technical and technological development. In this way, new, more effective solutions can be developed to maintain user comfort, health, and quality of life while limiting water consumption. The widespread availability of these solutions to a wide range of users is also extremely important. Examples of modern solutions include recirculating showers [61,64] and a cistern with a rotating chamber that consumes from 1 L to 5 L of water, and the return on this investment ranges from 3 to 12 months [86,87]. Also worth mentioning is the Swiss innovation that allows mixing water, soap, and air when washing hands, thus allowing for significant water savings [88]. Also, development in the use of renewable energy sources (RESs) may contribute to the dissemination of solutions that minimize the consumption of tap water, because installations for the use of rainwater or gray water require energy.
In addition to research aimed at creating innovative solutions, it is also worth mentioning research projects involving society. An example here is Milton Keynes in the United Kingdom and a trial called Water Monitor, which aimed to better understand what helps people save water. Registered households could check their water consumption and compare it with other study participants [89].
The availability of financing for the introduction of solutions that save tap water also has an impact on the implementation of this type of installation. As an example, the Polish priority program “My Water” can be mentioned, which aims to counteract drought and retain rainwater at the place where it occurs. It allows for co-financing the purchase of solutions for collecting rainwater on the property and for irrigation or other rainwater use [90].
The search for savings by building owners and consumers themselves may also contribute to the introduction of solutions that minimize the consumption of tap water, because the effects can be achieved with very low financial outlays.
Paradoxically, the intensification of the effects of climate change (from which we want to protect ourselves) may also contribute to the boosting of introducing methods of minimizing water consumption in buildings to adapt society to these effects. The same may happen with the increase in water prices. After determining the price increase for tap water, residents should also be expected to look for ways to minimize water consumption and increase their use in households.
An opportunity to implement the minimization of water consumption in buildings may also be the development of new guidelines for designing networks and installations for newly constructed buildings and housing estates. This guidance would need to take into account residents’ new reduced water demand and decrease the risk of secondary water contamination occurring in the system. At the same time, the guidelines should allow for shortening the residence time of water in the system and limiting the number of times the network must be rinsed. It should be emphasized that such actions would be consistent with the goals of water safety plans proposed by the World Health Organization (WHO).

4.4. Threats to Implementing Water Consumption Minimization

When discussing the implementation of minimizing water consumption in buildings in cities, one should also bear in mind the threats that may arise during such activities. Some of the first ones include uncertain geopolitical situations or wars, which pose a threat to this type of activity in cities, although paradoxically, they can also have a catalyzing effect.
An important point of view in this regard is the social aspect. The possible lack of social acceptance for some solutions, such as the use of gray wastewater or liquid from water renewal processes, may pose a threat to the large-scale implementation of this type of installation. Social awareness and a sense of social responsibility are also essential. Their absence may also lead to a threat to the implementation of minimization in the future.
Progressing climate change may also pose a threat to the implementation of minimizing consumption in households. The results in [91] show that temperature has a certain influence on water demand. Therefore, it can be expected that future water demand will depend on climate change conditions, especially in the case of temperature increases [91]. Other authors [92] point out that many scientific works confirm that an increase in air temperature results in an increase in water consumption by users of water supply networks. Therefore, increasing air temperature in the future may result in increased water consumption. On the one hand, this situation may pose a threat to the implementation of minimization, because why introduce solutions that reduce consumption when there is an increased demand for water? On the other hand, it can accelerate the development and implementation of solutions that enable the efficient use of water while maintaining user comfort. Meanwhile, climate change may also mean long periods without rainfall, making it difficult to use rainwater as an alternative water source.
We should also take into account the occurrence of contaminants that will be difficult to remove in water renewal processes. For this reason, possible technological problems in achieving the required degree of purification (e.g., drinking-water quality) may also pose a threat to the implementation of such a method of minimizing tap water consumption (by diversifying water supply sources).
In addition, failure to introduce regulations regarding the use of alternative water sources or regulations that are not adapted to the current situation may also pose a threat to the implementation of such solutions, including blocking potential investments. At the same time, the lack of regulations regarding the obligation that new building design enables the introduction of rainwater/gray water utilization installations poses a threat to the implementation of minimizing water consumption in this way.
Another threat may be the lack of sources of financing or co-financing for this type of investment, which in turn may be related to the current geopolitical situation mentioned earlier.
Minimizing tap water consumption in households in cities, applied on a large scale from a long-term perspective, may involve the need to introduce changes in water treatment plants (due to a reduction in their efficiency) and wastewater treatment plants (due to the possibility of increasing the concentration of sanitary sewage). This situation will require observation, research, and thorough analysis. A significant reduction in sewage flow will also affect the operating conditions of the sewage network. If minimization is introduced on a large scale, problems with the operation of the water and sewage installations should also be expected, as well as an increase in the risk of secondary contamination in the water supply network, which should be particularly controlled in the face of the introduction of water safety plans (WSPs). All these conditions may occur only after large-scale implementation, so they do not pose a threat to the process of introducing such solutions. However, these threats may accompany its introduction and occur after their implementation, and are therefore classified as threats. At the same time, they constitute a challenge for scientists and designers.

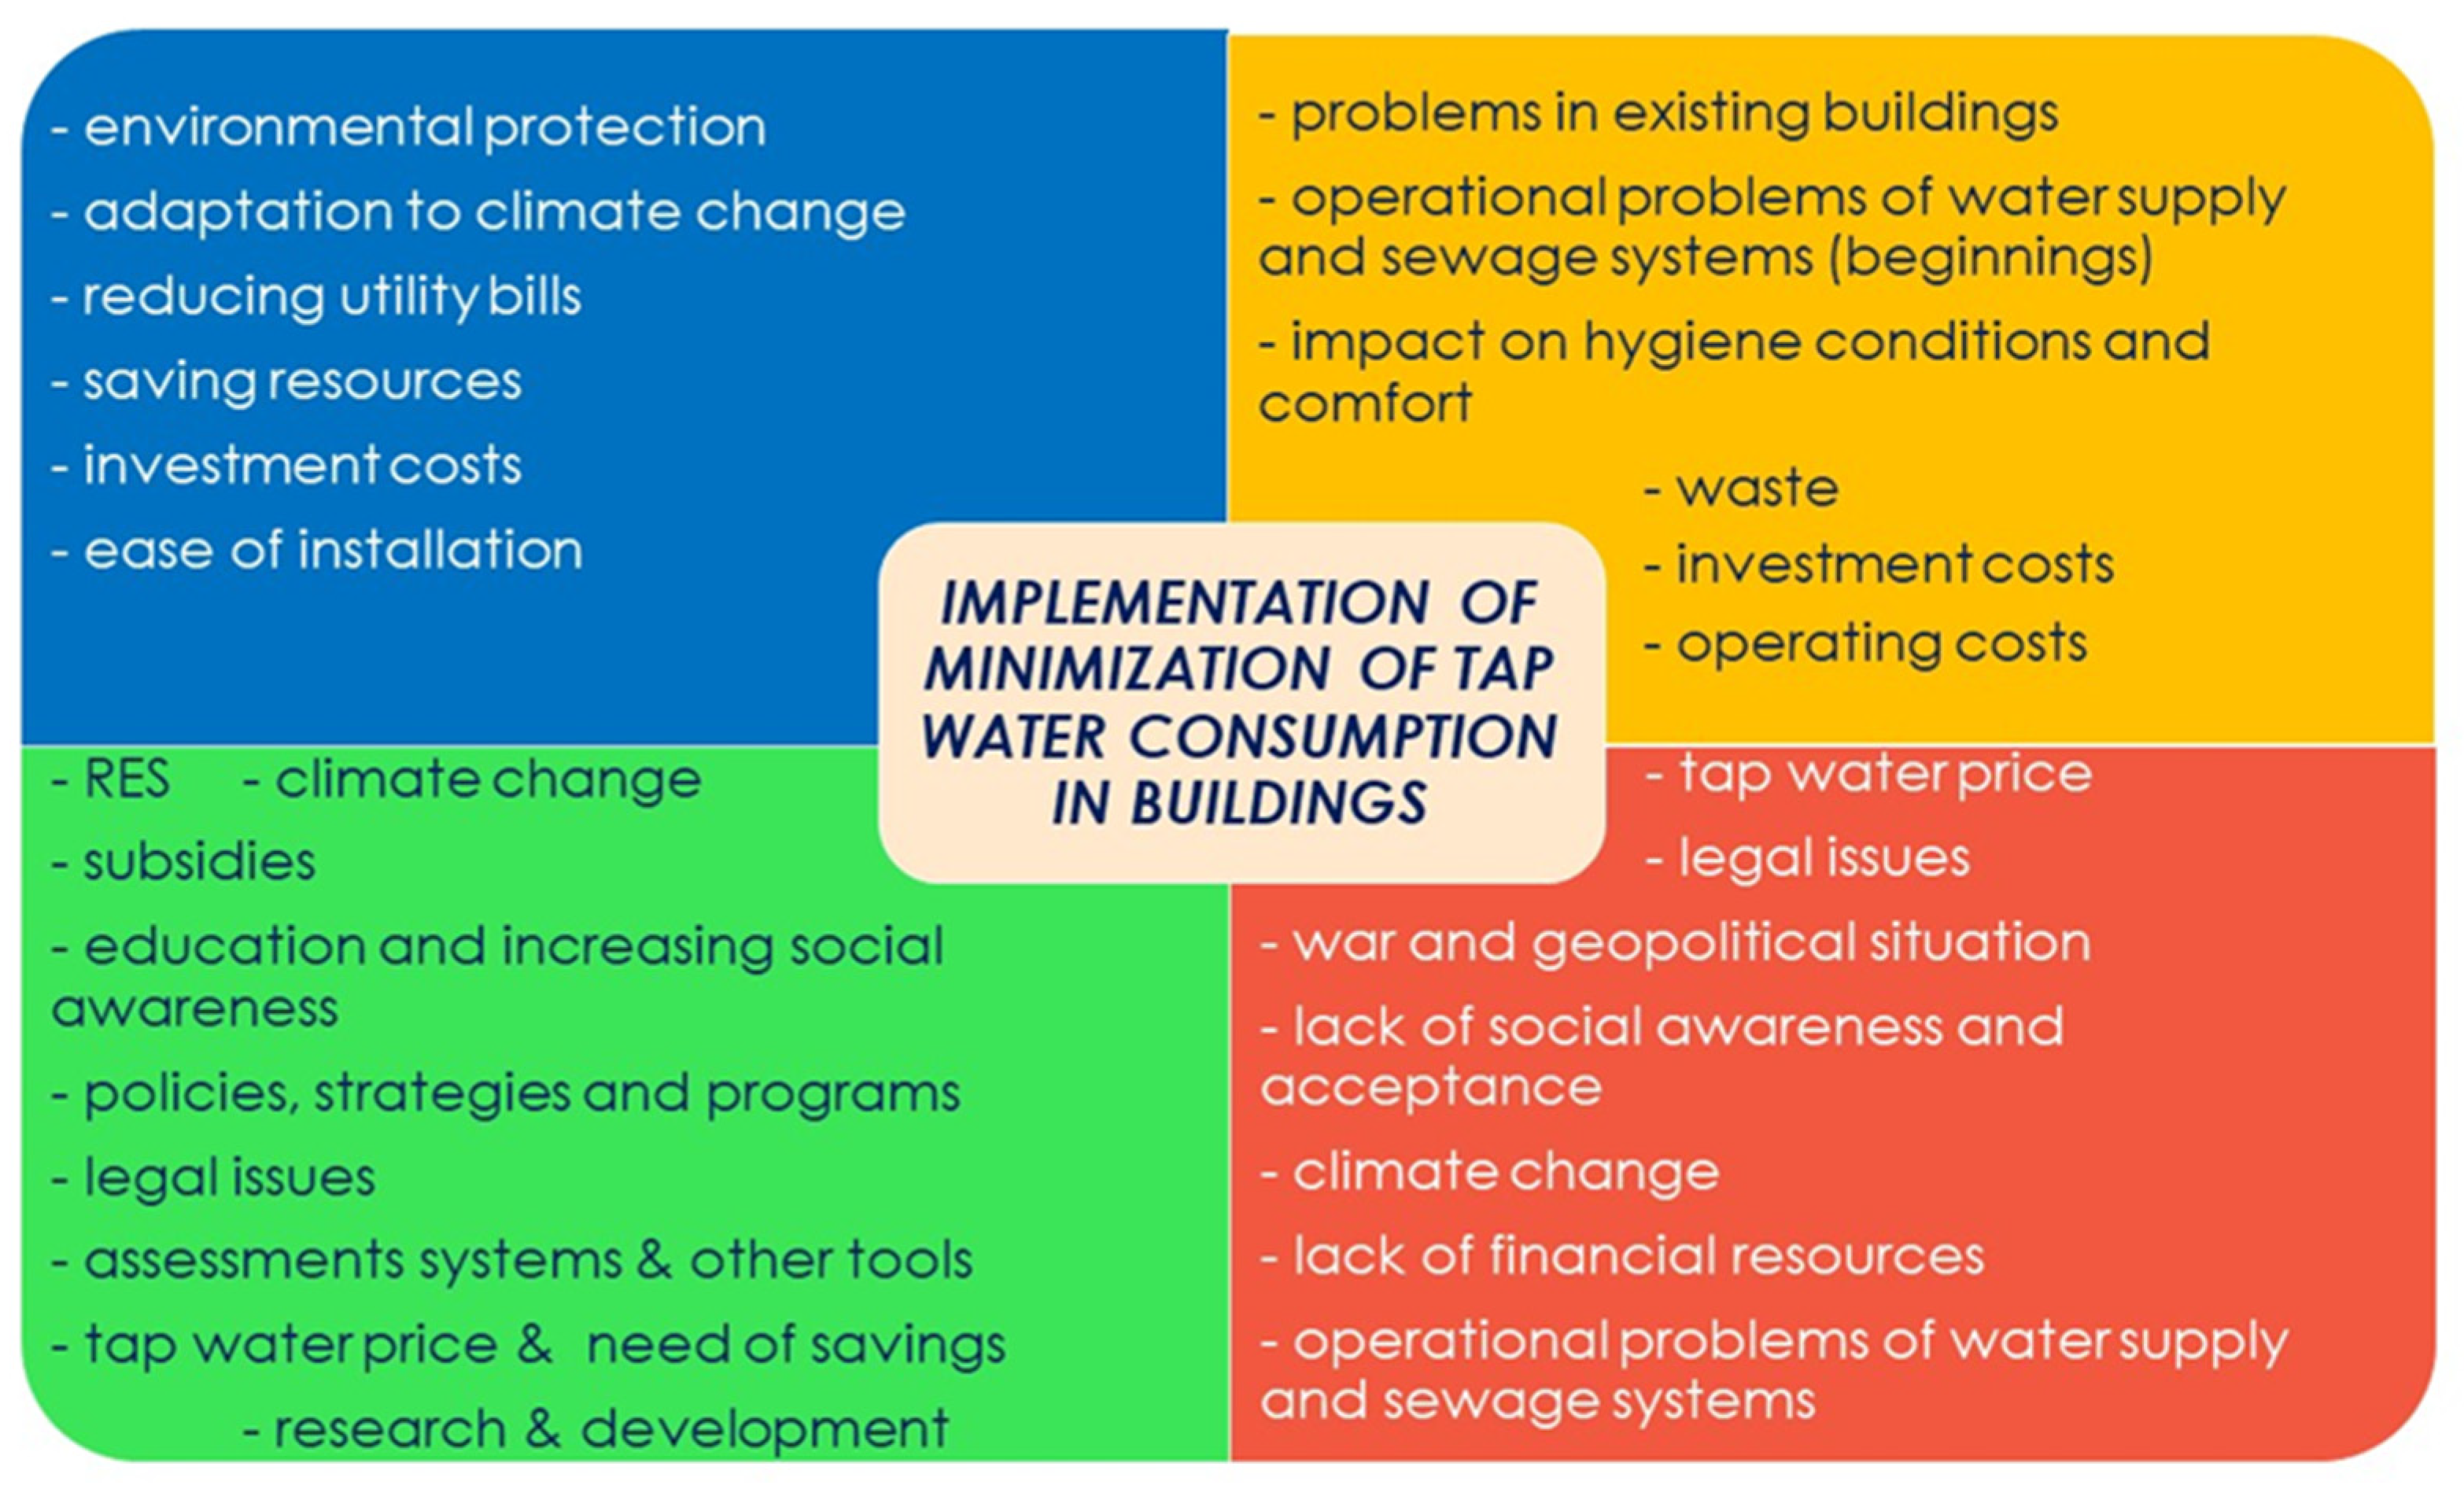
4.5. SWOT Analysis Matrix

Individual analytical categories are discussed in detail above. Thenhen groups of factors has been listed in a common matrix and presented as Table 3.

5. Prospects for the Implementation of Minimizing Water Consumption in Buildings in Cities

The prospects for the implementation of reducing water consumption in buildings in cities are determined by the possibilities arising for this task. In turn, existing barriers and limitations along with threats set challenges and, at the same time, suggest directions of action, both now and in the future.

5.1. Possibilities

The SWOT analysis made it possible to identify opportunities for implementing the minimization of water consumption in buildings in cities. The greatest opportunities for reducing water consumption should be seen in society education and research and development work conducted by representatives of business and science. With technological progress, newer solutions appear that allow the use of water in an increasingly more effective manner while reducing energy consumption, an example of which is recirculating showers [53,56]. Regulations and strategies will also be a driving force, an example of which may be the implementation of the assumptions of the European Green Deal or the transformation towards a smart circular water economy. The development of renewable energy sources will provide clean energy while diversifying water supply sources.

5.2. Barriers and Limitations

The basic limitation in the implementation of minimizing water consumption in buildings in cities is the limiting value to which the demand for water can be reduced while maintaining quality of life and health. Various authors (including in [38,39,47]) provide different threshold values, but the conditions accompanying them differ. According to [47], performance improvements are limited by aspects such as current practices, behavior, available technology, and affordability. At the same time, we are observing enormous technological progress in this area, and it is expected that the amount of water demand for residents, while maintaining their quality of life and health as well as their comfort, may be reduced by using solutions enabling the sustainable and efficient use of water. However, there is a limit that we will reach at some point, which determines the minimum human needs in terms of water supply.
At the same time, it should be noted that as the demand for water decreases, the time of water retention in the system increases, and therefore, the risk of secondary water contamination or the costs associated with rinsing the network increase. Therefore, from overcoming quantitative problems, qualitative problems arise. In each of these cases, there is a risk of a lack of maintaining the safety of water supplies. It is important to maintain limits in this area and achieve balance in the current conditions.
A serious barrier, and one difficult to overcome, is the hindrance or impossibility of introducing gray water or rainwater utilization installations into existing buildings. This is mainly due to the lack of space for additional installations and devices. The suggested direction in this regard is to change the approach to design and provide space for this at least in new buildings.
A barrier that is difficult, but not impossible, to overcome is the lack of social awareness, sense of responsibility, and acceptance of new solutions on the part of society, as well as the lack of commitment of some people. Combined with reluctance or a lack of interest on the part of decision-makers, they too create a stronger barrier.

5.3. Challenges

Based on the SWOT analysis, primarily, the main challenges related to the implementation of minimizing water consumption in buildings in cities can be demonstrated. This is due to the long list of both strengths and weaknesses of this activity. It is extremely important to find solutions that respond to the identified weaknesses in the implementation of minimization while maintaining the benefits resulting from it.
One of the most important challenges is the need to reconcile the benefits from reduced water consumption in buildings, which is also an adaptation to new conditions in cities, with the extension of the retention time of tap water in the water supply system, resulting directly from the minimization of water consumption and the current dimensions of the system.
Another challenge closely related to the previous one is to reconcile the need to supply water to residents (even during drought), i.e., to maintain an appropriate amount of water, with the need to maintain its quality in the water supply system. Providing both water parameters (quantity and quality), along with the appropriate pressure, is the basic task of a water supply system.
From the point of view of ongoing climate change and its increasing effects, the challenge is to find an answer, on the one hand, to the possible need to increase the demand for water resulting from the increase in temperature, and, on the other hand, to the need to minimize water consumption due to drought and reduced rainfall.
Due to one of the main barriers to the dissemination of the implementation of rainwater utilization systems in existing buildings, it is also a challenge to introduce solutions at the municipal or national level that will result in taking into account the needs for the usage of installations for rainwater and gray water use in newly constructed buildings. It is also important to take into account the possibility of using several water sources in a building (not just two), i.e., combining several systems in one building. In this respect, a change in the approach to designing buildings in terms of sanitary installations is required.
Introducing minimization on a large scale may result in operational problems in the water supply and sewage system (due to reduced water flow and an increased concentration of sanitary sewage). The related challenge is to organize and conduct observations in this range, monitor, and search for solutions to respond to possible changes.

6. Summary and Conclusions

The aim of this work was to present the perspectives and possible directions of action in the field of water use in buildings in order to introduce a reduction in water consumption and increase the efficiency of water use, along with a discussion of various practices used, with a particular emphasis on innovative solutions. Special attention was paid to the weaknesses and threats to this activity, which are usually omitted or discussed in other works. Moreover, in the context of climate change, attention was also paid to issues related to energy consumption.
We are commonly encouraged to limit tap water consumption in buildings in cities, but it is extremely important to pay attention to the implications of introducing water reduction in cities on a large scale. In the conducted SWOT analysis, the lists of strengths and weaknesses have a similar number of important arguments. The situation is similar in terms of opportunities and threats to the process of the implementation of water consumption limitation in buildings. While the benefits of minimizing water consumption are known and are often the subject of various types of studies, the weaknesses and threats related to the implementation of water consumption reduction are less frequently mentioned. In this paper, the analysis was conducted in a broader context. Through comparing strengths and weaknesses, as well as opportunities and threats, the greatest barriers and challenges in this area were identified. They indicate the suggested directions for future actions, while outlining prospects for the implementation of minimizing tap water use in cities. The most important of the suggested future directions of action in respect of the implementation of minimizing water consumption in buildings in cities are indicated below.
(i)
One of the main directions is the education of society conducted using various methods and addressed to various age and social groups, with a particular emphasis on the youngest age groups.
(ii)
The suggested direction of research and development is searching for solutions that increase the efficiency of water use while maintaining users’ quality of life, health, and comfort, as well as system solutions that allow for the further implementation of water consumption reduction without increasing the risk of compromising water quality.
(iii)
It is necessary to change the approach to building design to take into account space for installations for the use of rainwater and gray water, even if they were to be used only as an emergency during periodic tap water shortages. It is also necessary to consider revising the guidelines for designing water supply networks and installations for new buildings and housing estates.
(iv)
Further research should be carried out on the possibility of introducing gray water recycling and using rainwater in existing buildings.
(v)
The minimization of water consumption should continue, but the possible negative effects of introducing water consumption minimization in water supply and sewage disposal systems should be controlled and monitored, while solutions to counteract them should be sought. Controls and monitoring should be treated as a checking step in the PDCA (Plan–Do–Check–Act) plan (in Deming’s plan).
(vi)
Particular care should be taken in terms of minimizing the water footprint to ensure that it does not lead to an undue increase in the carbon footprint.
(vii)
The development of RESs and the transformation towards clean and available energy may prove to be a facilitator of the implementation of minimizing water consumption.

Author Contributions

Conceptualization, J.B. and T.Ż.; methodology, J.B.; formal analysis, J.B.; investigation, J.B.; data curation, J.B. and T.Ż; writing—original draft preparation, J.B.; writing—review and editing, J.B.; visualization, J.B.; supervision, J.B. and T.Ż. All authors have read and agreed to the published version of the manuscript.

Funding

This research received no external funding.

Data Availability Statement

Data are contained within the article.

Acknowledgments

The author would like to thank the anonymous Reviewers for their helpful comments.

Conflicts of Interest

The authors declare no conflict of interest.

References

  1. United Nations. General Assembly. Resolution: Transforming Our World: The 2030 Agenda for Sustainable Development A/RES/70/1. 2015. Available online: https://documents.un.org/doc/undoc/gen/n15/291/89/pdf/n1529189.pdf?token=avFziuwKBgoKHZc8LP&fe=true (accessed on 4 January 2024).
  2. Brundtland, G.H. Our Common Future: Report of the World Commission on Environment and Development; United Nations General Assembly Document A/42/427; United Nations: Geneva, Switzerland, 1987. [Google Scholar]
  3. Zvimba, J.N. Circular economy model for water and wastewater management. In Proceedings of the UJ—Montipilier Workshop: New Frontiers in Separation Processes & Membrane Development, Johannesburg, South Africa, 17–19 July 2019. [Google Scholar]
  4. UNIC Warsaw. Goal 6: Ensure Access to Water and Sanitation for All People through Sustainable Management of Water Resources; UN Information Center: Warszawa, Poland; Available online: https://www.un.org.pl/cel6 (accessed on 4 January 2024). (In Polish)
  5. Lautenschlager, K.; Boon, N.; Wang, Y.; Egli, T.; Hammes, F. Overnight stagnation of drinking water in household taps induces microbial growth and changes in community composition. Water Res. 2010, 44, 4868–4877. [Google Scholar] [CrossRef]
  6. Ling, F.; Whitaker, R.; LeChevallier, M.W.; Liu, W.T. Drinking water microbiome assembly induced by water stagnation. ISME J. 2018, 12, 1520–1531. [Google Scholar] [CrossRef]
  7. Rose, H.S.; Upshaw, C.R.; Webber, M.E. Evaluating Energy and Cost Requirements for Different Configurations of Off-Grid Rainwater Harvesting Systems. Water 2018, 10, 1024. [Google Scholar] [CrossRef]
  8. Chudzicki, J.; Sosnowski, S. Water Supply Installations. Design, Construction, Operation, 3rd ed.; Wydawnictwo Seidel–Przywecki: Warszawa, Poland, 2011. (In Polish) [Google Scholar]
  9. Venkatesh, G. Dishwashers: Literature Review to Summarise the Multi-Dimensionality of Sustainable Production and Consumption. Sustainability 2022, 14, 10302. [Google Scholar] [CrossRef]
  10. Tewes, T.J.; Harcq, L.; Bockmühl, D.P. Use of Automatic Dishwashers and Their Programs in Europe with a Special Focus on Energy Consumption. Clean Technol. 2023, 5, 1067–1079. [Google Scholar] [CrossRef]
  11. López Zavala, M.Á.; Castillo Vega, R.; López Miranda, R.A. Potential of Rainwater Harvesting and Greywater Reuse for Water Consumption Reduction and Wastewater Minimization. Water 2016, 8, 264. [Google Scholar] [CrossRef]
  12. Ewa Burszta-Adamiak, E.; Spychalski, P. Water savings and reduction of costs through the use of a dual water supply system in a sports facility. Sustain. Cities Soc. 2021, 66, 102620. [Google Scholar] [CrossRef]
  13. Bąk, J. The Use of Precipitation in the Cities of the Future—Problems, Barriers and Challenges. Sustainability 2023, 15, 14381. [Google Scholar] [CrossRef]
  14. Bąk, J. Circular Water Management in Smart Cities. In Water in Circular Economy. Advances in Science, Technology & Innovation; Smol, M., Prasad, M.N.V., Stefanakis, A.I., Eds.; Springer: Cham, Switzerland, 2023. [Google Scholar] [CrossRef]
  15. Marinoski, A.K.; Forgiarini Rupp, R.; Ghisi, E. Environmental benefit analysis of strategies for potable water savings in residential buildings. J. Environ. Manag. 2018, 206, 28–39. [Google Scholar] [CrossRef] [PubMed]
  16. Cureau, R.J.; Ghisi, E. Reduction of Potable Water Consumption and Sewage Generation on a City Scale: A Case Study in Brazil. Water 2019, 11, 2351. [Google Scholar] [CrossRef]
  17. Edirisinghe, R.D.; Pathirana, S. Reduction potential of potable water consumption at urban households: A case study in Sri Lanka. Environ. Dev. Sustain. 2021, 23, 13689–13706. [Google Scholar] [CrossRef]
  18. Aitken, C.K.; Mcmahon, T.A.; Wearing, A.J.; Finlayson, B.L. Residential Water Use: Predicting and Reducing Consumption1. J. Appl. Soc. Psychol. 1994, 24, 136–158. [Google Scholar] [CrossRef]
  19. Reichardt, K. Downside to Reducing Water Use. August 2018. Available online: https://www.buildings.com/building-systems-om/plumbing/article/10186059/downside-to-reducing-water-use (accessed on 4 January 2024).
  20. Gorączko, M.; Pasela, R. Causes and Effects of the Water Consumption Drop by the Population of Cities in Poland—Selected Aspects; Szymańska, D., Rogatka, K., Eds.; Bulletin of Geography, Socio-Economic Series, No. 27; Nicolaus Copernicus University: Toruń, Poland, 2015; pp. 67–79. [Google Scholar] [CrossRef]
  21. Szałata, Ł.; Zwoździak, J. SWOT analysis as a primary tool for environmental management. Rocz. Ochr. Sr. 2011, 13, 1105–1112. [Google Scholar]
  22. Raeburn, A. SWOT Analysis: What It Is and How to Conduct It (with Examples). 2023. Available online: https://asana.com/pl/resources/swot-analysis (accessed on 10 December 2023).
  23. CIPD. SWOT Analysis, Factsheet, July 2023. Available online: https://www.cipd.org/uk/knowledge/factsheets/swot-analysis-factsheet/#the-swot-framework (accessed on 30 September 2023).
  24. Verboncu, I.; Condurache, A. Diagnostics vs. SWOT Analysis. Rev. Int. Comp. Manag. 2016, 17, 114–122. [Google Scholar]
  25. Bull, J.W.; Jobstvogt, N.; Böhnke-Henrichs, A.; Mascarenhas, A.; Sitas, N.; Baulcomb, C.; Lambini, C.K.; Rawlins, M.; Baral, H.; Zähringer, J.; et al. Strengths, Weaknesses, Opportunities and Threats: A SWOT analysis of the ecosystem services framework. Ecosyst. Serv. 2016, 17, 99–111. [Google Scholar] [CrossRef]
  26. Smol, M.; Marcinek, P.; Koda, E. Drivers and barriers for a circular economy (CE) implementation in Poland—A case study of raw materials recovery sector. Energies 2021, 14, 2219. [Google Scholar] [CrossRef]
  27. Kordana, S.; Słyś, D. An analysis of important issues impacting the development of stormwater management systems in Poland. Sci. Total Environ. 2020, 727, 138711. [Google Scholar] [CrossRef] [PubMed]
  28. Afsari, N.; Murshed, S.B.; Uddin, S.M.N.; Hasan, M. Opportunities and Barriers Against Successive Implementation of Rainwater Harvesting Options to Ensure Water Security in Southwestern Coastal Region of Bangladesh. Front. Water 2022, 4, 811918. [Google Scholar] [CrossRef]
  29. Matusiak, K.B. (Ed.) Glossary of Terms; Innovation and Technology Transfer; Polska Agencja Rozwoju Przedsiębiorczości: Warszawa, Poland, 2011. Available online: https://www.parp.gov.pl/storage/publications/pdf/12812.pdf (accessed on 4 January 2024). (In Polish)
  30. SWOT Analysis. Available online: https://pl.wikipedia.org/wiki/Analiza_SWOT (accessed on 30 September 2023). (In Polish).
  31. Tomasik, M.; Tomasik, R. Planning and Writing Projects, FAOW, Towarzystwo Rozwoju Gminy Płużnica. 2014. Available online: https://trgp.org.pl/images/DSDOC/planowanie_i_zarzazanie_projektami_wsparcia.pdf (accessed on 4 January 2024).
  32. RedCart. SWOT Analysis—What Is It, When Is It Used and How to Do It? Available online: https://redcart.pl/blog/analiza-swot-co-to-kiedy-sie-ja-stosuje-i-jak-ja-wykonac-przyklady (accessed on 30 September 2023). (In Polish).
  33. Guidelines for Programming Water Demand and Sewage Amounts in Urban Settlement Units; Instytut Gospodarki Przestrzennej i Komunalnej: Warszawa, Poland, 1991. (In Polish)
  34. Guidelines for Programming Water Demand and the Amount of Sewage in Settlement Units; Ministerstwo Administracji, Gospodarki Terenowej i Ochrony Środowiska, Departament Gospodarki Komunalnej: Warszawa, Poland, 1978. (In Polish)
  35. Kraków.pl. The Tram Service Station Will Use Solar Energy. 2022. Available online: https://www.krakow.pl/aktualnosci/256743,26,komunikat,stacja_obslugi_tramwajow_wykorzysta_energie_sloneczna.html?_ga=2.246806144.521630657.1643699533-20742731.1641200630 (accessed on 25 February 2023).
  36. Water Statistics. Water Uses. Available online: https://ec.europa.eu/eurostat/statistics-explained/index.php?title=Water_statistics#Water_uses (accessed on 19 February 2023).
  37. Water Statistics. Water Uses. Newest Version, Another Texts. Available online: https://ec.europa.eu/eurostat/statistics-explained/index.php?title=Water_statistics#Water_uses= (accessed on 17 January 2024).
  38. Gleick, P.H. Basic Water Requirements for Human Activities: Meeting Basic Needs. Water Int. 1996, 21, 83–92. [Google Scholar] [CrossRef]
  39. Sphere Association. The Sphere Handbook: Humanitarian Charter and Minimum Standards in Humanitarian Response, 4th ed.; Sphere Association: Geneva, Switzerland, 2018; Available online: www.spherestandards.org/handbook (accessed on 4 January 2024).
  40. Zając, J. Role Międzynarodowe Państwa Średniego—Aspekty Teoretyczne, Krakowskie Studia Międzynarodowe, X. No. 4. 2013. Available online: https://repozytorium.ka.edu.pl/server/api/core/bitstreams/8c517477-e7df-4ee0-b363-fcf009eb898a/content (accessed on 2 March 2024).
  41. ZPE MeiN. Czynniki Kształtujące Klimat Polski, Zintegrowana Platforma Edukacyjna Ministerstwa Edukacji i Nauki. Available online: https://zpe.gov.pl/a/czynniki-ksztaltujace-klimat-polski/DbIZrZd6v (accessed on 4 January 2024).
  42. GUS. Bank Danych Lokalnych, Baza Danych Dostępna Pod Adresem. Available online: https://bdl.stat.gov.pl/bdl/start (accessed on 30 March 2023).
  43. GUS. Statistical Yearbook 2002; The Central Statistical Office: Warsaw, Poland, 2002. [Google Scholar]
  44. Stanisz, A. An Accessible Statistics Course Using STATISTICA PL on Examples from Medicine; Basic Statistics; StatSoft Polska: Kraków, Poland, 2006; Volume 1. (In Polish) [Google Scholar]
  45. Aswegen, A.; Engelbrecht, A. The relationship between transformational leadership, integrity and an ethical climate in organisations. South Afr. J. Hum. Resour. Manag. 2009, 7, 175. [Google Scholar] [CrossRef]
  46. Tredoux, C.T.; Durheim, K. Numbers, Hypotheses and Conclusions: A Course in Statistics for the Social Sciences; UCT Press: Cape Town, South Africa, 2002. [Google Scholar]
  47. Crouch, M.L.; Jacobs, H.E.; Speight, V.L. Defining domestic water consumption based on personal water use activities. J. Water Supply Res. Technol.-Aqua 1 2021, 70, 1002–1011. [Google Scholar] [CrossRef]
  48. Jacobs, H.E. A Conceptual End-Use Model for Residential Water Demand and Return Flow. Ph.D. Thesis, Department of Civil Engineering, Rand Afrikaans University (now University of Johannesburg), Johannesburg, South Africa, 2004. [Google Scholar]
  49. Eurostat. Database. Available online: https://ec.europa.eu/eurostat/data/database?gclid=EAIaIQobChMI34_vlcvkgwMVeJJoCR0hEg98EAAYASAAEgIR1fD_BwE (accessed on 30 March 2023).
  50. Rogers, P.D.; Grigg, N.S. Trends in dual water systems. J. Water Reuse Desalination 2015, 5, 132–141. [Google Scholar] [CrossRef]
  51. Watergen. Creating Drinking Water from Air. Available online: https://www.watergen.com (accessed on 12 January 2024).
  52. AKVO. You’ve Probably Heard of This Revolutionary Technology Before—Condensation. Available online: https://akvosphere.com/air-to-water-technology (accessed on 12 January 2024).
  53. RainMaker. Air-to-Water: Creating Fresh Water Where None Exists. Available online: https://rainmakerww.com/technology-air-to-water/ (accessed on 12 January 2024).
  54. Airtowater. Purest Form of Water? Water Made from Air! Available online: https://www.airowater.com/ (accessed on 12 January 2024).
  55. Fraunhofer Institute for Interfacial Engineering and Biotechnology IGB, WaLu—Producing Drinking Water from Air Humidity. Available online: https://www.igb.fraunhofer.de/en/research/thermal-separation-processes/sorptive-dehumidification/WaLu.html (accessed on 30 March 2023).
  56. Agua de Sol. Drinking Water Directly from the Air and the Sun. Available online: https://en.agua-de-sol.com (accessed on 2 January 2024).
  57. Instalacje budowlane.pl. Obliczanie Zapotrzebowania Ciepła na Przygotowanie c.w.u. Available online: https://instalacje-budowlane.pl/obliczanie-zapotrzebowania-ciepla-przygotowanie-c/ (accessed on 30 March 2023).
  58. Zagórska, P. Jakie Jest Średnie Zużycie Wody na Osobę? Wyjaśniamy, Jak Wyliczyć Zużycie. Available online: https://kb.pl/inne/oszczedzanie/jakie-jest-srednie-zuzycie-wody-na-osobe-wyjasniamy-jak-wyliczyc-zuzycie (accessed on 17 January 2024).
  59. Jankowski, C. Trzy Sposoby na Ciepłą Wodę Użytkową. Available online: https://budownictwob2b.pl/instalacje/baza-wiedzy/urzadzenia-i-akcesoria-grzewcze/52104-trzy-sposoby-na-ciepla-wode-uzytkowa (accessed on 30 March 2023).
  60. Vaillant. Jak Obliczyć Koszt Podgrzania Wody Użytkowej? Available online: https://www.vaillant.pl/klienci-indywidualni/porady-i-wiedza/poradnik/inne/jak-obliczyc-koszt-podgrzania-wody-uzytkowej/ (accessed on 17 January 2024).
  61. GROHE_White_Paper_Future_of_Sustainable_Showering. Available online: https://www.grohe-x.com/en/inspiration/article/recycling-shower (accessed on 30 March 2023).
  62. Peter, S.; Kambule, N.; Tangwe, S.; Yessoufou, K. Quantification of the Impact of Solar Water Heating and Influence of Its Potential Utilization through Strategic Campaign: Case Study in Dimbaza, South Africa. Energies 2022, 15, 8283. [Google Scholar] [CrossRef]
  63. European Comission CORDIS EU Research Results, Cost-Effective and Resource-Saving Smart Shower. Available online: https://cordis.europa.eu/article/id/422217-smart-shower-aims-to-get-europe-cleaner-in-a-greener-way/pl (accessed on 30 March 2023).
  64. Flow Loop. Loop is a Circular Shower System. Available online: https://flow-loop.com/function/ (accessed on 17 January 2024).
  65. Savinga. Available online: https://www.savinga.pl/ (accessed on 30 March 2023).
  66. Shepherd, N. Making Sense of “Day Zero”: Slow Catastrophes, Anthropocene Futures, and the Story of Cape Town’s Water Crisis. Water 2019, 11, 1744. [Google Scholar] [CrossRef]
  67. Cunliffe, D.; Bartram, J.; Briand, E.; Chartier, Y.; Colbourne, J.; Drury, D.; Lee, J.; Schaefer, B.; Surman-Lee, S. Water Safety in Buildings; WHO: Geneva, Switzerland, 2011. [Google Scholar]
  68. Dzida, D. Should We Save Water? PZITS Webinarium’s Material. Kraków. 11 October 2022; not published. (In Polish) [Google Scholar]
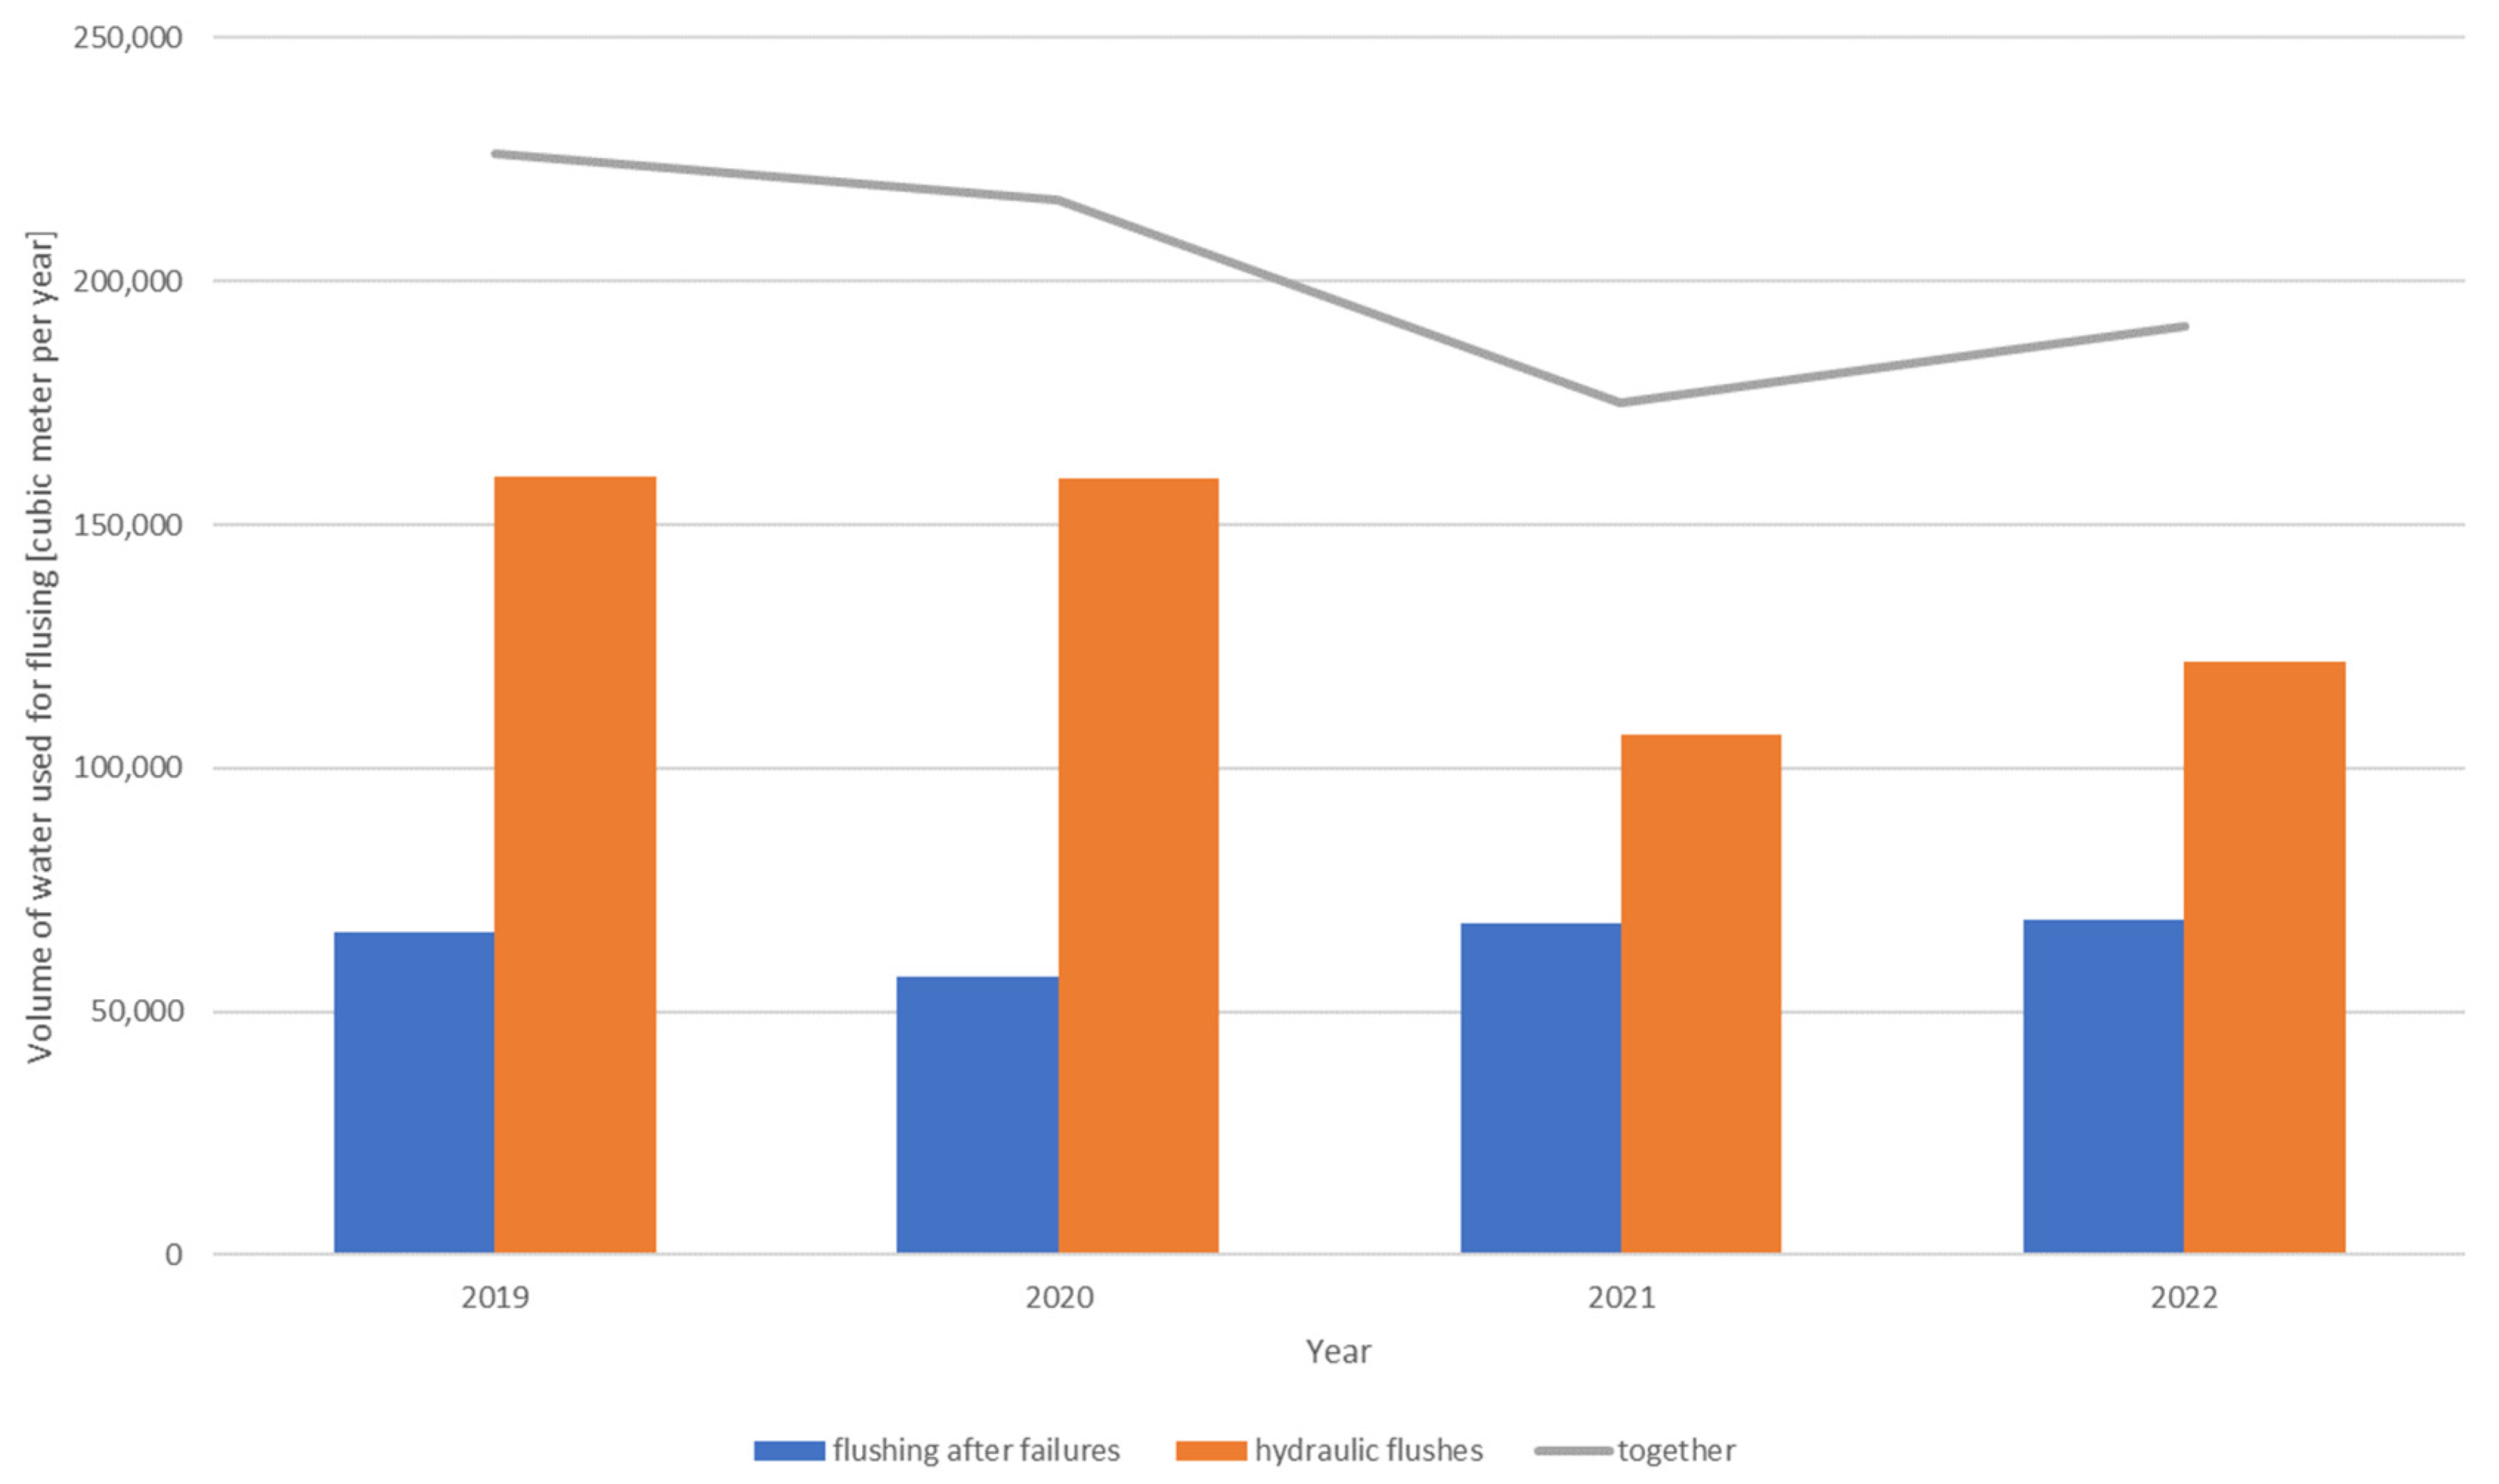
  69. Waterworks of the City of Krakow. Data on Rinsing the Water Supply Network. 2023; not published.
  70. Butler, D.; Docx, P.; Hession, M.; Makropoulos, C.; McMullen, M.; Nieuwenhuijsen, M.; Pitman, A.; Rautiu, R.; Sawyer, R.; Smith, S.; et al. Pollutants in Urban Waste Water and Sewage Sludge; Thornton, I., Scientific Co-Ordinator; Final Report; ICON I C Consultants Ltd.: London, UK; European Communities: Maastricht, The Netherlands, 2001. [Google Scholar]
  71. Bąk, J.; Głód, K.; Gontar, Ł.; Rybicki, S.M. Possibilities of Implementing Solutions for Sharing Rainwater into Existing Buildings; CUT: Krakow, Poland, 2023; manuscript in preparation, to be submitted. [Google Scholar]
  72. Hydropolis. Available online: https://hydropolis.pl/ (accessed on 30 March 2023).
  73. Waterworks of the City of Krakow, Droplet’s Academy, Educational Workshops for Grades 1–3. Available online: https://akademiakropelki.krakow.pl/ (accessed on 30 March 2023). (In Polish).
  74. IMGW—PIB. Water Is Our Greatest Treasure—DECALOGUE of Saving Water IMGW-PIB. Available online: https://stopsuszy.imgw.pl/dekalog/ (accessed on 30 March 2023). (In Polish).
  75. Water Saving. Available online: https://oszczednosc-wody.pl/index.html (accessed on 4 January 2024). (In Polish).
  76. PAP MediaRoom. MI: UN Water Conference on World Water Day 2023 (Communication). Available online: https://pap-mediaroom.pl/biznes-i-finanse/mi-konferencja-wodna-onz-w-swiatowy-dzien-wody-2023-komunikat (accessed on 30 March 2023).
  77. Sandri, S.; Hussein, H.; Alshyab, N.; Sagatowski, J. The European Green Deal: Challenges and opportunities for the Southern Mediterranean. Mediterr. Politics 2023, 1–12. [Google Scholar] [CrossRef]
  78. Benedict, S.; Hussein, H. An Analysis of Water Awareness Campaign Messaging in the Case of Jordan: Water Conservation for State Security. Water 2019, 11, 1156. [Google Scholar] [CrossRef]
  79. PUB Singapore’s National Water Agency. Water Efficiency Labelling Scheme. Available online: https://www.pub.gov.sg/Public/WaterLoop/Water-Conservation/WELS (accessed on 17 January 2024).
  80. WELL. Water Efficiency Label. Available online: https://www.well-online.eu/home/index.html?changelang=2 (accessed on 30 March 2023).
  81. Public Sector Assurance. Case Study. Water Efficient Product Labelling Scheme (WEPLS) by the National Water Services Commission (SPAN). Available online: https://publicsectorassurance.org/case-study/water-efficient-product-labelling-scheme-wepls-by-the-national-water-services-commission-span/ (accessed on 30 March 2023).
  82. BRE. BREEAM Technical Standards. Available online: https://bregroup.com/products/breeam/breeam-technical-standards/ (accessed on 30 March 2023).
  83. USGBC. LEED Rating System. Available online: https://www.usgbc.org/leed (accessed on 30 March 2023).
  84. ISO 14001:2015; Environmental Management Systems—Requirements with Guidance for Use. ISO: Geneva, Switzerland, 2015.
  85. Commission Regulation (EU) 2017/1505 of 28 August 2017 Amending Annexes I, II and III to Regulation (EC) No 1221/2009 of the European Parliament and of the Council on the voluntary participation by organisations in a Community eco-management and audit scheme (EMAS) (Text with EEA relevance). C/2017/5792, OJ L 222, 29 August 2017; pp. 1–20. Available online: https://eur-lex.europa.eu/legal-content/EN/TXT/?uri=CELEX%3A32017R1505 (accessed on 30 March 2023).
  86. WaterFlush by EcoNeves. Available online: https://www.waterflush.fr/fr/ (accessed on 17 January 2024).
  87. EcoNeves. Waterflush, an Eco-Friendly Toilet Tank. Available online: https://www.econeves.com/en/home/ (accessed on 17 January 2024).
  88. Smixin. Our Solutions. Available online: https://smixin.com/compact-2/ (accessed on 30 March 2023).
  89. MK: Smart. Water. Available online: https://www.mksmart.org/water/ (accessed on 30 March 2023).
  90. Serwis Rzeczypospolitej Polskiej, My Water—Support for Activities Carried out by WFOŚiGW. Available online: https://www.gov.pl/web/nfosigw/moja-woda--wsparcie-dzialan-realizowanych-przez-wfosigw (accessed on 30 March 2023).
  91. Haque, M.M.; Egodawatta, P.; Rahman, A.; Goonetilleke, A. Assessing the significance of climate and community factors on urban water demand. Int. J. Sustain. Built Environ. 2015, 4, 222–230. [Google Scholar] [CrossRef]
  92. Bergel, T.; Młyńska, A. Analysis of the Impact of the Air Temperature on Water Consumption for Household Purposes in Rural Households. J. Ecol. Eng. 2021, 22, 289–302. [Google Scholar] [CrossRef]
Figure 1. The research design for analysis of the implementation of minimizing water consumption in buildings in the era of climate change.
Energies 17 01444 g001
Figure 2. Annual water consumption in households per capita in Poland in general and in cities in the years 2001–2020, own study based on BDL data of the Central Statistical Office [42] and data of the Central Statistical Office [43]—year 2001.
Energies 17 01444 g002
Figure 3. Scatter chart for the correlation of year and annual water consumption per city resident in Poland, own study based on BDL data of the Central Statistical Office [42] and data of the Central Statistical Office [43]—year 2001.
Energies 17 01444 g003
Figure 4. Annual water consumption in households from public, selfand other water supply in 2015 in millions of cubic meters. Online data code: Water use by supply category and economical sector [ENV_WAT_CAT]. Source of data: Eurostat [49]. Disclaimer: This map was created automatically by ESTAT/EC software according to external user specifications for which ESTAT/EC is not responsible; [49] data as of 30 March 2023.
Energies 17 01444 g004
Figure 5. Reused water in European countries in 2018—own study based on Eurostat data [49], online data codes [DEMO_GIND], [ENV_WAT_BAL].
Energies 17 01444 g005
Figure 6. Circular economy model for the household—own study based on [3,14].
Energies 17 01444 g006
Figure 7. SWOT analysis matrix for the implementation of minimizing tap water consumption in buildings (general).
Energies 17 01444 g007
Figure 8. The volume of water used for rinsing networks after failures and hydraulic rinse in the years 2019–2022 in a large water supply company in one of the largest cities in Poland—own study based on data [69].
Energies 17 01444 g008
Table 1. Household water use from public water supply in 2020 in Europe per ranges (own elaboration based on data from [37]).
Water Consumption Range
in Cubic Meters
Number of
Geopolitical Entities
25 ÷ 50 (in Poland: 34)21
50 ÷ 752
75 ÷ 1001
over 1001
Table 2. Total water consumption in households in 2011–2020 in Europe for available data from public, selfand other water supply—own elaboration based on Eurostat data [49]. Online data code: [ENV_WAT_CAT]; data as of 30 March 2023.
YearAnnual Household Water Consumption in Millions of Cubic Meters from Public,
Self and Other Sources
Number of Geopolitical Entities from Europe for Which Data Are Included
201116,082.6723
201216,342.6824
201313,520.323
201416,083.0624
201517,300.5424
201616,853.624
201714,048.8724
201813,665.3424
20197134.3620
202010,044.1819
Table 3. In-depth SWOT matrix for the implementation of minimizing water consumption in buildings in cities.
StrengthsWeaknesses
  • The sustainable use of water, i.e., the effective use of high-quality tap water;
  • Protection of the natural environment through the effective use of natural resources (the protection of water resources);
  • Saving resources (water, chemicals) and energy/energy raw materials on a micro (household) and macro (city) scale;
  • Reducing bills for water and possibly sewage (at least in the short term) and energy/energy raw materials used to heat domestic hot water for households/buildings;
  • Low investment costs in the case of simple solutions with relatively high efficiency (e.g., aerators, flow regulators, single-lever faucets, two-volume flushing systems) or zero investment costs (in the event of changes in consumer habits);
  • The ease and simplicity of implementing some solutions (possibility of the self-installation of some solutions by consumers);
  • The management of rainwater where it occurs (if used as an alternative water source) and reducing problems with overloading sewage networks during periods of peak inflows;
  • Preparing residents for drought events (“Day Zero”);
  • Minimizing the risk of a lack of water in buildings in the event of periodic water shortages;
  • The adaptation of city residents to climate change (drought, extreme rainfall events in sealed areas).
  • A possible reduction in users’ comfort in certain situations (restrictions, poorly selected solutions);
  • A possible negative impact on maintaining hygienic conditions;
  • High investment costs in the case of more comprehensive solutions;
  • Operating costs (in the case of some solutions, e.g., energy costs related to the operation of pumps or gray water/rainwater treatment systems—if applicable);
  • An increase in energy consumption for some solutions (i.e., grey/rainwater treatment and transport);
  • Fees for sanitary sewage disposal (in the case of using rainwater for household purposes other than irrigation);
  • The need to manage the waste generated (applies to the treatment of alternative water sources);
  • The increased risk of secondary contamination of tap water in the water supply network and installation;
  • The need to rinse water supply networks more frequently (costs and additional consumption of tap water);
  • Reduced water consumption on a larger scale may result in an increase in water prices (as long as the reduction in water consumption is not compensated by an increase in the number of inhabitants, i.e., the connection of new customers);
  • Possible operational problems in the sewage system if minimization is introduced on a larger scale;
  • Impossibility or great difficulties in introducing some solutions to existing buildings (e.g., dual installation).
OpportunitiesThreats
  • Society education (directed in various ways to different social and age groups);
  • Developing policies, strategies, and programs;
  • New legal acts (or amendments to existing ones), for instance, obliging designers/investors to take into account the possibility of introducing installations for the use of gray water/rainwater in new buildings;
  • Increasing public awareness of the need to counteract climate change and adapt to its effects;
  • Sanitary fitting assessment systems (e.g., WELL, WEPLS, WELS);
  • Multi-criteria building assessment systems (e.g., BREEAM, LEED);
  • Environmental management systems (e.g., according to the ISO 14001series of standards, EMAS);
  • An increase in the price of tap water;
  • Intensification of the effects of climate change;
  • Scientific research;
  • Technical and technological progress;
  • The development of renewable energy sources (RESs);
  • The possibility of obtaining various types of funding (e.g., the “My Water” program in Poland);
  • Implementation of the assumptions of the European Green Deal and smart circular water economy;
  • Searching for savings by building owners;
  • New guidelines for designing networks and installations taking into account reduced demand for water.
  • Uncertain geopolitical situations, war;
  • The lack of social acceptance for some solutions (e.g., the use of gray water);
  • The lack of social awareness and social responsibility;
  • Climate changes (a lack of precipitation, increased air temperature);
  • The lack of regulations regarding the use of gray water/rainwater in some countries/unsuited regulations;
  • The lack of regulations/guidelines regarding the introduction of water recovery installations/rainwater installations for new buildings—if applicable;
  • Long-term prospects—possible operational problems at wastewater treatment plants (due to the increased concentration of sanitary sewage) and water treatment plants (due to their reduced efficiency);
  • Long-term perspective—operational problems in the sewage network caused by reduced sewage flow;
  • Increasing the risk of secondary water contamination in the water supply network;
  • The lack of financial resources for investment and operating costs.
Disclaimer/Publisher’s Note: The statements, opinions and data contained in all publications are solely those of the individual author(s) and contributor(s) and not of MDPI and/or the editor(s). MDPI and/or the editor(s) disclaim responsibility for any injury to people or property resulting from any ideas, methods, instructions or products referred to in the content.

