1. Introduction
One of the most promising ways to reduce the levelized cost of energy (LCOE) of solar energy technologies is concentrating photovoltaics (CPV) [
1]. Nevertheless, besides system cost reduction, global efficiency improvement must be considered as a key factor for the success of this technology. In this way, the constant increase in CPV cell efficiency [
2] should be followed by a reduction in losses at the module and system levels. Although CPV dense array receivers require active, efficient and intelligent cooling to maintain low and uniform receiver temperatures in the receiver [
3], they have great potential for system optimization due to the integration of all major components in a single receiver.
Major challenges in the optimization of CPV systems encompass issues such as electrical current mismatch losses, optical misalignments and the Joule effect. Current mismatch losses occur when distinct cells, operating under varying conditions, are electrically connected into a unified circuit. In the scenario of series-connected PV cells, where all cells share the same current, this is limited by the lowest average irradiance. Consequently, not all cells can operate at their maximum power points (MPPs), resulting in a power reduction compared with the maximum they could potentially deliver.
Besides the loss in power performance, the electrical current mismatch has a huge impact in some adverse cases due to reverse bias operation [
4], where the system absorbs energy instead of producing it, resulting in heat buildup and potential damage to the cells. This state can be mitigated by incorporating a bypass diode in parallel to each cell, representing an initial passive measure in the polarization of the solar cell and enhancement of its electrical output.
Mismatch losses are closely linked to the operating temperature of the cells and increase with higher temperature and nonuniformity of irradiance, thereby affecting the overall system performance [
5,
6,
7,
8]. Consequently, addressing these losses is essential to enhance the efficiency and reliability of the system. This dependence applies to all types of CPV systems [
9], with a more pronounced impact on triple-junction cells. In densely packed CPV systems, mismatch losses become even more critical due to nonuniformities caused by the illumination profile and temperature variations across the array of PV cells [
10].
Until now, strategies to mitigate these losses have primarily centered on achieving uniformity in the optical flux over the receiver. This has been achieved through the use of a secondary optical device [
11] or, in the case of central tower systems, by dispersing the heat flux from each heliostat [
12] over the CPV cell array. However, optical concentrators inherently introduce nonuniformities, resulting in Gaussian lighting profiles and large irradiance gradients.
Nonuniformities in the solar flux also lead to nonuniformities in the temperature pattern, which aggravate mismatch losses, often referred to as “voltage mismatching”. Enhancing thermal uniformity has emerged as a crucial strategy, drawing the attention of various research groups. Barrau et al. [
13,
14] and Riera et al. [
15,
16,
17] proposed cooling systems to improve the receiver temperature uniformity by using a hybrid jet impingement/microchannel cooling device that tailors the distribution of its heat extraction capacity to the illumination profile. They demonstrated that this type of cooling device was able to generate a temperature dispersion, quantified as the standard deviation of the temperature, lower than 0.7 K across the entire CPV receiver. Laguna et al. [
18,
19] presented a cooling technology based on an array of microfluidic cells with individual thermostatic valves that tailors the flow rate at each cooling cell to reduce temperature nonuniformities and required pumping power, which increased the reliability of the system and the PV production. Yishuang et al. [
20] compared three typical CPV cooling methods based on air, water and heat pipe cooling. The work determined that the highest CPV cell output power was reached with the heat pipe cooling method. However, considering the pump consumption, the water-cooled CPV cell could provide higher net electrical efficiency and electrical exergy efficiency.
The electrical connections between the PV cells [
10] play a relevant role in the reduction of the energy losses. Vivar et al. [
21] demonstrated that the use of PV cells of different shapes and sizes in the receiver array, combined with the optimization of the electrical configuration, allowed them to drastically reduce the mismatch losses. Steiner et al. [
22], in a CPV point-focusing Fresnel lens system, assessed different array configurations to determine the one that provided better results in terms of efficiency and feasibility. Parallel–series connections based on groups of four cells in parallel (referred to hereafter as modules) and 15 modules in series between them achieved an efficiency increase of 3.7% compared with a pure series connection.
To further increase the efficiency using module configuration, Norman et al. [
23] proposed to overlap the foci of single-axis mirrors into an oblong compound focus to minimize gaps in the receptive surface, resulting in a series configuration by direct contact. This configuration allowed a direct electrical connection between modules with almost null surface losses. Other authors [
24,
25,
26] proposed an algorithm to determine, in each case and for each concentrator, the best cell array electrical configuration. Working with 1 cm
2 metamorphic multijunction high-efficiency cells, they identified, for several illumination profiles, the optimized electrical configuration. They demonstrated that the chosen configuration could influence the global efficiency of the CPV receiver by more than 5%. Ju et al. [
27] analyzed the multi-physics effects of various optical, electrical and thermal conditions on the performance of dense array CPV systems employing different module configurations. Results obtained with quartered rotational symmetry (QRS) showed decreases in the average module temperature and central module temperature by 5 and 12 °C, respectively. Additionally, there was an increase in output power by at least 48.29% compared with total-cross-tied connections.
An alternative approach involves the use of one DC-DC converter per cell to polarize each cell at its maximum power point, aiming to reduce current mismatch and maximize system performance [
28]. In an experimental study, a CPV cell string was examined, with each cell connected to a dedicated DC-DC converter, resulting in approximately a 10% gain in power transfer efficiency. However, it is worth noting that these DC-DC converters only supply the mismatch current between the series current and the maximum power point current of each CPV cell. Consequently, their efficiency and power output are reduced compared with traditional converters that facilitate full power conversion [
29,
30,
31].
Another configuration involves the use of partial DC-DC converters to avoid voltage mismatch between strings in concentrating photovoltaic (CPV) systems [
32]. By allowing each string’s voltage to be independent, these converters help to mitigate voltage discrepancies arising from factors such as partial shadowing and varying irradiance levels, thereby enhancing the overall efficiency of the CPV system.
Moreover, to address both current mismatch between cells and voltage mismatch between strings, a novel partial power cascaded DC/DC topology has been explored by Philipps et al. [
33]. Additionally, they developed a smart, mirror-based high-concentrating photovoltaic (HCPV) module incorporating various advanced technologies, including DC-DC converters [
34].
In a previous work [
35], the performance of a dense CPV array cooled by a matrix of microfluidic cells with individual variable flow rates was assessed for three different electrical configurations, polarized with diodes: series, parallel and matrix configurations (parallel–series). That work also compares at each electrical configuration the electrical performance when it was cooled by microchannels or microfluidic cells with tailored flow. The best energetic results were achieved by cooling with the self-adaptive microfluid cells and with the parallel configuration. However, both low voltage and high electrical currents were generated, indicating significant losses due to the Joule effect and requiring large wire sizes, making it unfeasible. Subsequently, the matrix configuration yielded improved results compared with the series configuration in terms of net power, efficiency and overall feasibility of the system.
This study proposes the polarization of a dense PV array by incorporating a unique DC-DC converter at each cell or module, aligning them to operate at the same current for optimized performance. A comparative analysis is conducted between a module configuration (parallel–series) and a series configuration, both integrated with the DC-DC power converter. Additionally, a 48-cell series configuration, as explored in [
35], serves as a reference. The system is assumed to be cooled using a self-adaptive microfluidic cell heat sink to enhance thermal efficiency, with a bypass diode added to each cell to prevent potential cell damage. The investigation and comparison of the behavior of the different electrical configurations proposed are conducted under various solar illumination profiles.
2. Modeling
2.1. CPV Cooling Device and Illumination Profiles
The CPV cell used in this study is the triple-junction cell “C4MJ Metamorphic Fourth Generation CPV Technology” from Spectrolab [
36]. The geometrical structure of the dense array CPV receiver (
Figure 1), the distribution of irradiance on the receiver and the distribution of temperatures considered (
Figure 2) are detailed in [
35].
The cooling system (
Figure 1) is based on an array of microfluidic cells (dimensions 1.2 mm × 2.0 mm each) with a thermally activated microvalve in each cell, which tailor the coolant flow rate to the needed heat extraction capacity, avoiding overcooling and improving the temperature uniformity [
19]. The main advantage of this cooling scheme is that it allows us to determine the working temperature as a function of the energy received by each thermal cell, as it decouples the temperature of each point of the receiver from its position, contrarily to microchannel coolers, where the points at the end of each channel have, along the flow path direction, a higher temperature than those at the beginning. The receiver is made up of 48 CPV cells, encapsulated in a matrix form of 6 × 8 cells that covers an area of 6.7 × 8.9 cm
2. The irradiance distribution over the receiver is based on a single central maximum with peripheral dispersion, ranging from 225 up to 1115 kW/m
2 (
Figure 2, P1). This radiation pattern was selected for the comparative study of the 5 electrical configurations, because it presents one of the highest percentages of discrepancy losses of the 6 scenarios shown in
Figure 2. The temperature profiles (
Figure 2) are determined [
35] by considering the cooling system of an array of microfluidic cells with thermally activated microvalves achieving a temperature oscillation between 343.6 and 365.6 K.
These irradiance profiles correspond to a variety of situations that can occur in experimental practice. They are situations that are due to defects in the solar tracking or defects in the position and shape of the concentrator system used and are intended to reflect different extreme working conditions. Their names reflect the main characteristics of each of the six scenarios chosen: P0, uniform; P1, one central maximum; P2, two maximums; P3, dispersion within modules; P4, large dispersion between modules; and P5, off-axis illumination. It should be noted that the average irradiance is the same in all selected scenarios.
2.2. CPV Cell Electrical Model
The experimental CPV cell characteristic IV curve was used to calibrate the reduced one-diode model [
7,
37] applied for the assessment of the CPV cell power output under different irradiance and temperature conditions. This reduced model, used for standard CPV cells, has already been used for triple-junction CPV cells [
38], where the band gap is called effective energy gap
Eg. Assuming a constant light spectrum, a comparable serial resistance and a very large shunt resistance, the model can be defined using the following equation:
And its reverse expression is as follows:
where
V and
I are the electrical potential and the electrical current of the CPV cell, respectively,
IL is the photogenerated current,
C0 is the reference solar irradiance (500 kW/m
2),
C is the incident solar irradiance on the CPV cell,
VT is the thermal voltage and
I0 is the reverse diode electrical current:
where
kB is the Boltzmann constant,
T is the cell mean temperature,
I0′ is the coefficient independent from the temperature of the reverse diode current and
Eg is the effective energy gap. The thermal voltage
VT is defined as the following expression, where
n is the effective ideality factor and e
− is the electron charge.
The reduced model was fitted using the least square error and changing 4 parameters: the light-generated electrical current
IL, the reverse diode current coefficient
I0′, the effective ideality factor
n and the effective energy gap
Eg. This calibration was carried out simultaneously with the direct and reverse model equations in order to reduce the errors that would appear when shifting from one calibrated model (the direct one) to the other (the inverse one). To do this, the effective ideality factor and reverse diode current coefficient (
Table 1) were modified by using an error reduction algorithm. The root mean squared error (RMSE) obtained in the calibration of the direct model was 0.18 A (R
2 = 0.994), and it was 0.074 V (R
2 = 0.999) for the reverse model. These values help to assess the goodness of fit of the simplified model used.
The values of the different coefficients appearing in Equations (1)–(4) calibrated for the triple-junction cell used in this work [
33] are shown in
Table 1.
2.3. Cell Connection with DC–DC Converters or Diode
The phenomenon of current mismatch arises when CPV cells or modules interconnected in series are submitted to difference irradiance concentrations. In a serial configuration, the current is shared among the various subelements within the string, leading to current mismatches due to nonuniform illumination. This misalignment shifts the maximum power point of the receiver relative to the subelements in the string.
To address this issue, a solution involves employing constant output voltage DC-DC converters tuned at the voltage of the maximum power point of each parallel connection. This ensures the supply of mismatched current of each subelement in the string with respect to the series current.
Equations (5)–(7) are utilized to define the output current and voltage of the receiver, extending these considerations to an array of
Nm modules in series. Each module comprises
Nc cells and either one DC-DC converter or one diode.
where
Iout_reciver,
Vout_reciver and
Pout_reciver represent the receiver current, voltage and power, respectively. Meanwhile,
Ii,j and
IDC,i denote the current of each CPV cell and DC-DC converter, respectively. Here,
j refers to each of the
Nc cells interconnected in parallel within each
i module of the
Nm modules interconnected in series. It is important to note that these equations include the electrical power generated by the CPV cells and the electrical power delivered by the DC-DC converters.
The electrical power consumed by the DC-DC converters and the net power of the receiver are defined using Equations (8)–(10).
The terms Pin_DC, Pout_receiver and Pnet refer to the power consumption of the DC-DC converters, total receiver power output and net receiver power, respectively. The term Pin_DC,i signifies the input power supplied to each DC-DC converter, accounting for an internal efficiency () set to 0.9 for all units. Given that the DC-DC converters are connected in each parallel connection, the previously defined Nm, denoting the number of modules, is equal to the number of DC-DC converters.
In addition, as an alternative to the DC-DC converters, the utilization of bypass diodes was modeled. These diodes are idealized with a forward bias voltage of 0.6 V.
2.4. Electrical System Configurations
The electrical configurations analyzed in this work are three basic connections: The first one is a series connection, with 48 cells interconnected in series and with a parallel DC-DC converter in each one (S48). In the second one, 48 cells are connected in series, like the first one, but with one DC-DC converter in every group of 6 series cells (S8). The third one (M8) is a parallel–series connection, with 6 parallel cells in each module and 8 modules in series, coupled with a parallel DC-DC converter in each module (
Figure 3). This last configuration, referred to as module configuration, is usually used in a dish or central receiver CPV system [
39]. The number in the name configuration specifies the nc number of DC-DC converters used in the configuration and the letter specifies the electrical base configuration: S series and M modules. As a reference, the S0 and M0 configurations have similar structures to S48 and M8, respectively, but replace the DC-DC converters with bypass diodes.
Then, the five configurations analyzed are S0, M0 (without DC-DC converters and with 48 and 8 bypass diodes, respectively), S8, M8 and S48 (without bypass diodes and with 8, 8 and 48 DC-DC converters, respectively).
As the current generated by a CPV cell depends strongly on the incoming irradiance, a variation in irradiance between cells connected in series produces a current mismatch that results in a current constraint around the current value from the cell with the lowest irradiance. Therefore, the way that the cells are interconnected affects the power transfer efficiency of the receiver. While in a series connection the current is kept as low as possible, reducing Joule-effect losses, the main problem appears in the series current mismatch caused by the illumination nonuniformities. On the other side, when the cells are connected in parallel, the current restriction disappears but the cells are subjected to the same voltage whose value is mismatched depending mainly on the working temperature of each cell.
The operating conditions of irradiance and temperature used are those shown in
Figure 2. At a fixed irradiance and ambient temperature, the cell temperature value varies according to the electrical working conditions of the conversion, exactly with the amount of solar energy transformed into electrical energy and extracted from the device. However, thanks to the thermal characteristics of the cooler used, the variation in the cell temperature due to different energy extractions from the cell working under different electrical conditions is below the uncertainty value of the measured temperature. The temperature values presented in
Figure 2 were used for all the studied cases by entering the error as within the uncertainty of the experimental measurements. Nevertheless, the use of more precise cell temperature values in the calculations would make the difference between the relative values of the different configurations rise, increasing the advantages in net power obtained in the results of this work.
As a reference value, independent from the connection type, maximum electrical power (
Pmax) is defined as the sum of the maximum powers produced by each cell individually and working within the same operating conditions of radiation and temperature as in the receiver [
28].
The receiver efficiency
ε is defined as the ratio between the net power delivered by the receiver and the solar power entering in the system (Equation (8)).
In configurations where DC-DC converters are not used, the external power is equal to zero (Pext = 0).
The total electrical efficiency can be written as
where
εmax is the maximum electrical efficiency defined by the uniform illumination profile, which is independent of the electrical configuration of the array. It is defined as the ratio between
Pmax, determined by the uniform illumination profile, and
Psun, which is the solar power incident on the receiver (Equation (10)).
The variable
εT is the power transfer efficiency, defined as the fraction of
Pmax transferred to the load:
where
εT depends on the configuration type, as the net power term
Pnet is also dependent. According to Equation (9), the maximum electrical efficiency (
εmax) is only achievable if
εT = 1, which means that all the cells in the array generate the same power as if they were operating individually in the receiver.
Finally, results are obtained by numerically solving the system of equations that appears when applying Kirchhoff’s laws to the different electrical circuits discussed above and with each of the CPV cells of the receiver working under the irradiance and temperature conditions relevant to each scenario under study.
3. Results
The electrical power produced by the CPV receiver is assessed for each of the electrical configurations (
Figure 3) with the microfluidic cell cooling system (
Figure 1) under the irradiance and temperature conditions defined in
Figure 4. In
Section 3.1 and
Section 3.2, the different electrical configurations are studied and compared under the illumination and temperature profile named P1, which represents a very common experimental profile, with a single nonsymmetrical central maximum and with illumination variations in both rows and columns of the cell array.
The heat maps of the irradiance (in kW/m
2,
Figure 4a) and temperature (in K,
Figure 4b) distributions for the illumination profile P1 are detailed in
Figure 4.
In
Section 3.3, the behavior of the electrical configuration that has previously given the best performance (M8 profile) is analyzed under the six different irradiance and temperature scenarios shown in
Figure 2.
As the main objective of this work is to compare the impact of DC-DC converter polarization in similar conditions, the spread in the actual cell performances, which ranges from 1% to 3% [
36], has not been taken into account. Indeed, the additional nonuniformities of the CPV receiver conditions due to this effect are much lower than the irradiance ones.
In previous measurements, it was observed that for the maximum power point of the system, some cells are biased with negative electric potential difference and consume power through the bypass diode. This occurs when the short-circuit current of a cell, which depends on the irradiance received and its temperature, is lower than the string current. In a dense CPV array connected in series, temperature dispersion over a constant average value does not affect power generation [
35]. Similarly, in a dense CPV array connected in parallel, irradiance dispersion over the array does not affect electricity production either.
The steps appearing in the I-V and P-V curves in the S0 series (
Figure 5 and
Figure 6) and M0 module (
Figure 7 and
Figure 8) base configurations are due to the current through the bypass diode in some cells, as the nonuniform distribution of irradiance affects the current produced in each cell. In the series configuration, all cells share the same electrical current, which in some cells is higher than the short-circuit current, which results in a negative electrical potential difference and the activation of the bypass diode, which leads to the appearance of one of the steps mentioned above. In the S0 configuration, 48 diodes are connected to the system, while in the M0 case there are 8 diodes, one for each module in the series. These values are represented in the number of steps that appear in each configuration.
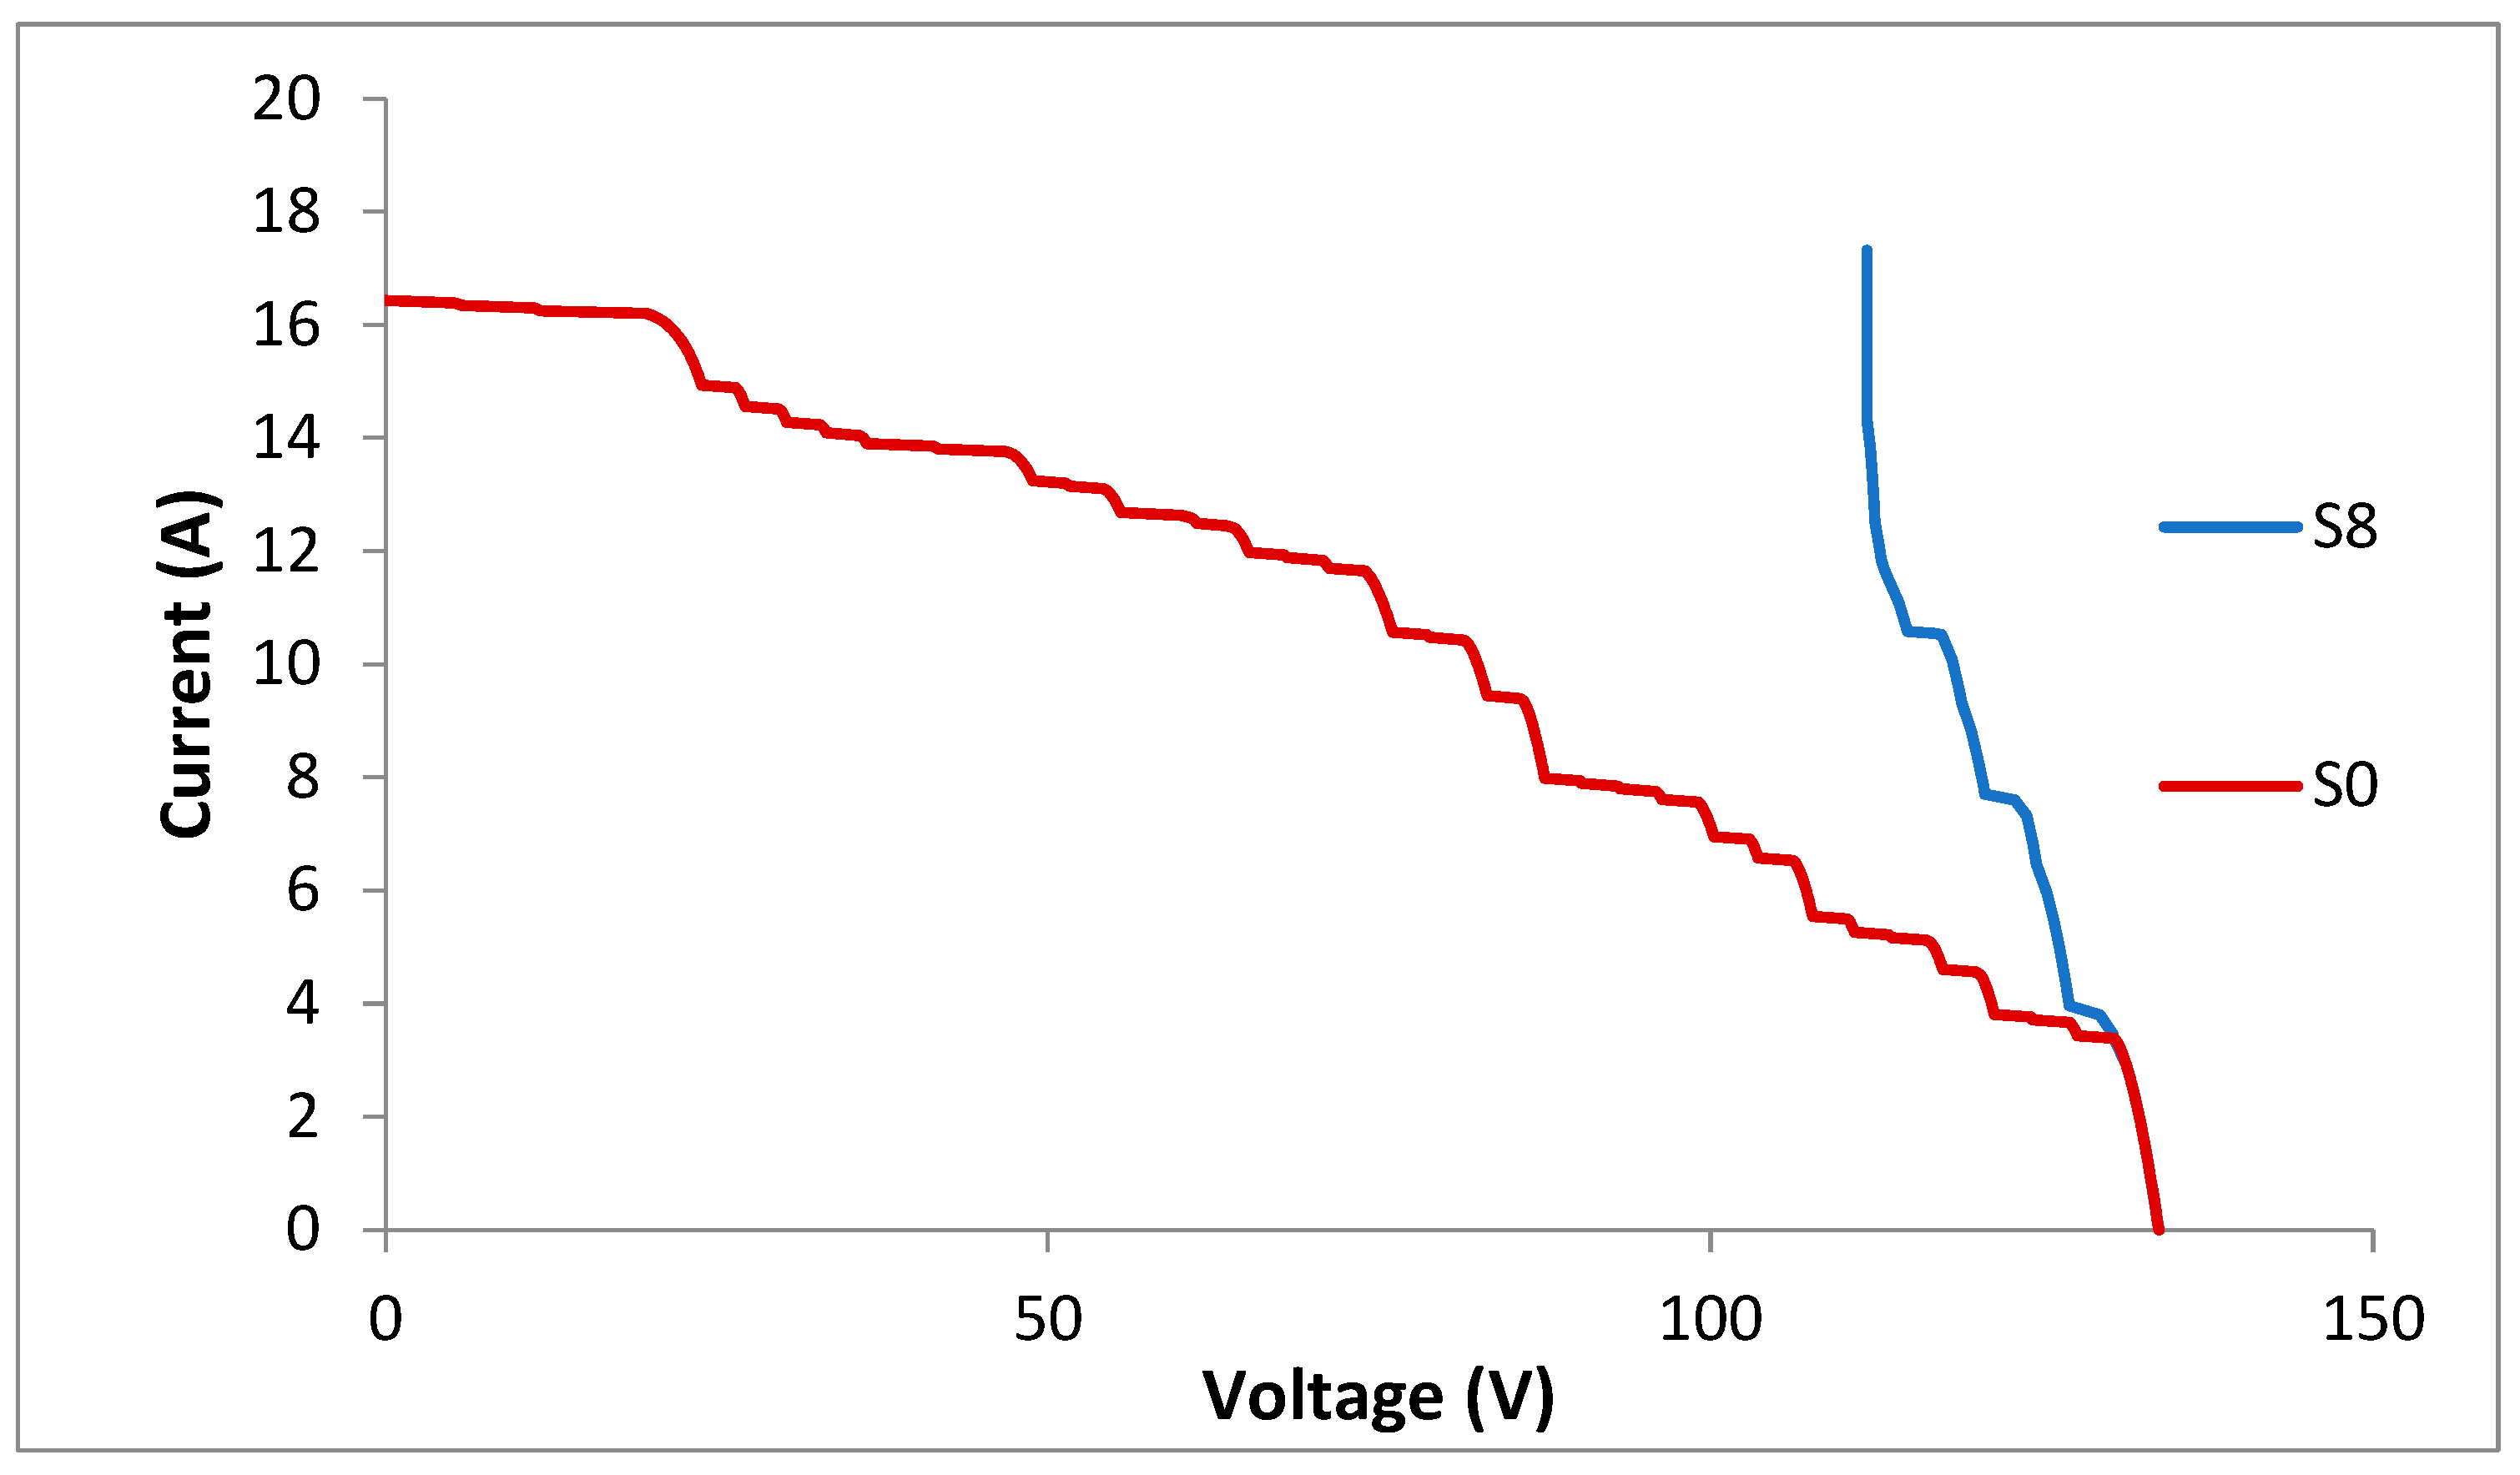
In configurations without bypass diodes (S8 and M8), the electrical model indicates that the steps are caused by the activation of the DC-DC converters. As the activation electrical potentials of the DC-DC converters depend on each cell (but without negative values in any case), the steps for these configurations are smaller in size and, as in the previous cases, coincide in number with the number of converters. Note that in these configurations, the range of definition for the electrical potential of the I-V characteristic curve is limited to a narrow range of values. This is because, when one or more of the DC-DC converters are activated, they are able to generate the needed electric current to maintain the established working conditions. This current is injected into the CPV receiver, increasing significantly the current produced by it, as shown in
Figure 5 and
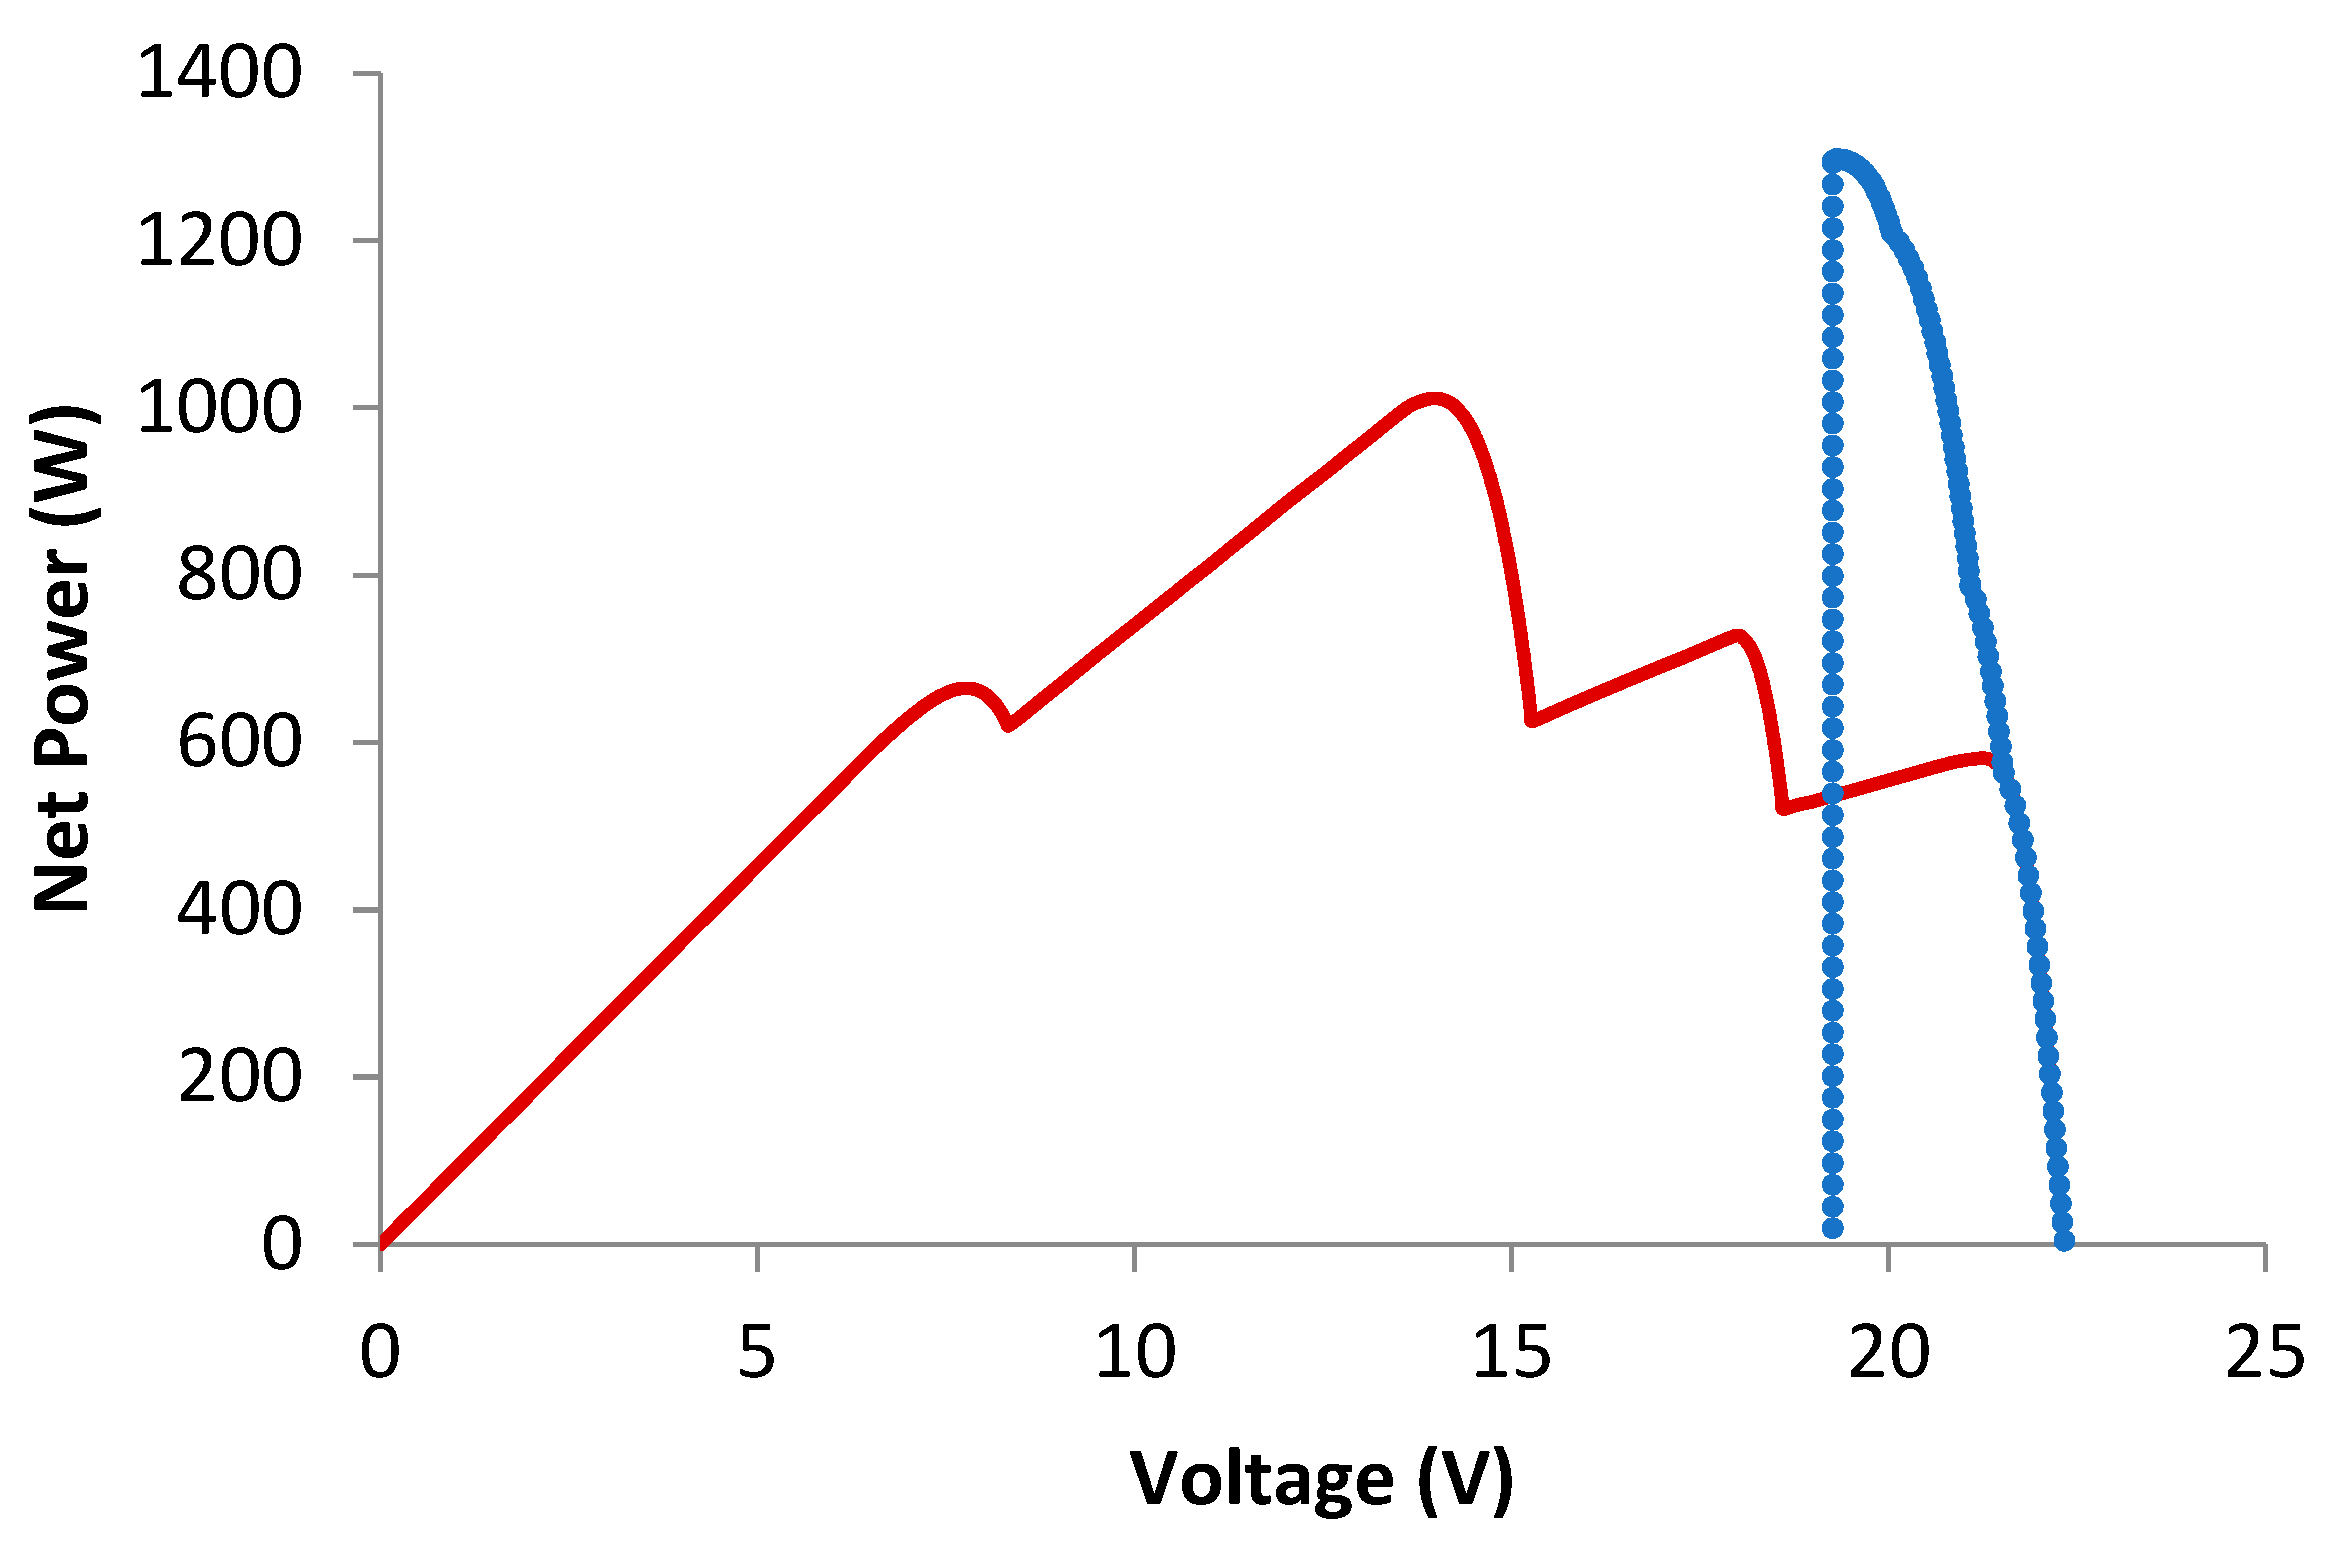
Figure 7 for the curves of the S8 and M8 systems. As can be seen in the equivalent representations of the net power characteristic curve (
Figure 6 and
Figure 8, configurations S8 and M8, respectively), the power injected by the converters is already subtracted from the power delivered by the receiver for the assessment of the net power output of the CPV receiver. Thus, the graph tends rapidly toward zero for electrical potential values lower than the predetermined working values.
3.1. Series Configurations
The characteristic curve of the base case S0 (
Figure 5 and
Figure 6) shows an important deterioration as a result of the high nonuniformity of the irradiance patterns, and as mentioned above, the successive activation of the bypass diodes with the appearance of the steps in the graph. The significant values of the curve are I
sc = 16.43 A, V
oc = 133.79 V, I
max = 11.46 A, V
max = 75.1 V, P
max = 861 W and the power transfer efficiency ε
T = 0.685. This last value is significantly low and contrasts (
Table 2) with the ones obtained for the S8 case (ε
T = 0.813) and S48 case (ε
T = 0.96).
In the series configuration and under the nonuniform irradiance distribution, the CPV power increase obtained by using DC-DC converters is remarkably significant (
Table 2). Both the configuration based on 8 converters (S8), with a 26% increase, and the one based on 48 converters (S48), with a 48.8% increase, show significant changes in electricity production. Undoubtedly, the S48 configuration is the one that obtains the best results, almost doubling the production of the base configuration, because of the polarization produced in each of the cells that results in all of them working at their optimum point. The high value of the external power used (difference between the values of P
out_receiver and P
net) is noteworthy in this configuration, mainly due to the high number of DC-DC converters used in the design. This high value causes a relative increase in the energy losses through the efficiency value of the converters.
In the S0 curve in
Figure 5, it may be appreciated that as the current increases, the receiver voltage decreases until the least productive module loses all its voltage to reach −0.5 V to activate its bypass diode. Consequently, the module’s short-circuit current stops restricting the series current to let the diode drive the series current but at the cost of consuming the forward bias polarization voltage. Whenever a module activates its diode, there is a corresponding increase in current along the I–V curve. This increment is evident in the peaks of the S0 configuration curve.
To overcome this issue, the DC-DC converters supply the current mismatch with respect to the series current when the module voltage reaches the value of 2.4 V set as closest to the module’s maximum power point. When this occurs (S8 curve in
Figure 5), the DC-DC converter applies its almost constant operating voltage to keep the modules close to the voltage of their maximum power point, allowing the PV cells to work in their optimal operating conditions despite submitting the modules to irradiance deviations. This is appreciated at the S8 curve in
Figure 5 where the absence of voltage loss within each module allows the series current to increase, but at the voltage of its maximum power point. In the model, the DC-DC converter’s voltage is set at the same value because of the uniform temperature profile offered by the self-adaptive cooling device.
3.2. Module Configurations
The module configuration consists of series of eight modules or banks of six cells in parallel (
Figure 3), assuming that all modules share the same current. In the configuration M0, each module has one diode in parallel, while in the M8 configuration each module has a DC-DC converter in parallel. Each module, as a set of cells connected in parallel, is not sensitive to the nonuniformity in irradiance on its cells, but it is very sensitive to the nonuniformity in temperature.
In the M0 configuration, the high temperature uniformity generated by the microfluidic cell cooling device implies a 17.4% increase in CPV power compared with the S0 configuration. (Pnet = 1011.7 W for M0 in front of Pnet = 861.0 W for S0 configuration).
In a dense CPV array connected in the module configuration, the bank which receives the least radiation and therefore has the lowest short-circuit current is the one that causes the highest power losses. In this scenario, the use of DC-DC converters produces an improvement in electricity production of 28.3% compared with the base configuration (M0) and 50.75% compared with S0. The value of the net power generated is 1298.2 W, the highest of all the studied configurations, which can be attributed to the lower external power used in this case to feed the converters,
Pext = 333.0 W. In this case, the power transfer efficiency is ε
T = 0.973, very close to 1 (see
Table 3).
Also, in the M0 module configuration, the irregularities of the I-V and P-V curves occur due to the current passing through the bypass diodes in some modules (
Figure 7 and
Figure 8). As in the series case, the I-V and P-V characteristic curves of the M8 configuration are defined in a limited range, as for low electrical potential values the current injection by the converters becomes so large that the net power produced by the array decays to zero or negative values. In any case, the maximum power falls within this interval of existence of the curves (
Figure 8). The value of net power
Pnet = 1298.2 W for this configuration is the greatest of all the configurations tested in this work.
Figure 9 shows the differences between the five electrical configurations reviewed. The two configurations without DC-DC converters, S0 and M0, appear on the same 1:1 line (
Figure 9b). The horizontal distance between a point and the 1:1 line represents the
Pext used by the configuration, with the M8 configuration producing the highest net power. The highest
Pout_receiver is produced by the S48 configuration; however, it has larger production losses than the previous one (greater distance point to the 1:1 line in
Figure 9b).
Of the five configurations studied, M8 is found to be the optimum, as it produces the highest net power with a reduced number of DC-DC converters and, consequently, the energy lost in feeding them is lower than in the S48 case. Additionally, this configuration is easy to implement, due to its geometrical characteristics, in a practical device. Indeed, each module can share the same electrical contact without electrical insulation problems.
Finally, the S8 configuration can be a good working option due to the use of a relatively small device current, although it produces a net power lower than that obtained with the optimal configuration (Pnet = 1084.4 W).
3.3. Other Irradiance and Temperature Scenarios
The five electrical configurations were tested under the conditions of the six lighting scenarios shown in
Figure 2. The scenarios were selected to represent a wide variety of experimental situations, and all of them have the same mean irradiance value. The different values of the
Pnet for each scenario and electrical configuration compared with the value obtained with the P0 scenario (uniform irradiance) allow us to clearly identify the matching losses.
In all cases, the M8 configuration gives better net outputs than S48.
Figure 10 shows the
Pnet results produced by the M8 configuration versus the power produced by the reference M0 configuration for all the lighting scenarios studied. It shows that the improvement obtained by using the converters in the M8 configuration is greater in scenarios where the power produced by the M0 configuration is more degraded.
Table 4 shows the values of the net power delivered to the load by the CPV receiver with the M0 and M8 configurations under the different irradiance and temperature conditions shown in
Figure 2. The worst scenario is P4, where the mismatch losses, compared with the uniform illumination scenario P0, are 33.9% and only 4.1% for the M0 and M8 configurations, respectively.
The power transfer efficiency εT improves from 66.1% (M0) to 95.8% (M8) with the use of DC-DC converters in this case. It should be noted that this last value of εT is the lowest value obtained with the M8 configuration under the different scenarios analyzed, which means that the range of variation in the studied conditions of the εT value is 100–95%. This range is significantly narrower than that obtained for the M0 configuration (100–66.1%).
4. Conclusions
This study presents an analysis of the impact of electrical polarization through DC-DC converters on the performance of a CPV dense matrix receiver, revealing consistent improvements in electrical output compared with base configurations.
Two different basic electrical connections, series and parallel–series (modules), were analyzed for integration in five different configurations depending on the number of DC-DC converters used. The injected power used to feed the sources and polarize the photovoltaic cells is recovered at the output of the receiver except for the loss of performance of the sources. The combination of DC-DC converters and a self-adaptive microfluidic cell cooling system emerges as a potent strategy to enhance the electrical production of dense array CPV receivers.
The mismatch losses arising from the nonuniformity of the light profile for each electrical configuration and lighting scenario are benchmarked against the output power of individual cells operating independently under identical light conditions and temperature. These losses are quantified at 35.4% for the S0 series configuration and 24.1% for the M0 module configuration. Notably, these values represent the mismatch losses in the two standard configurations commonly employed by the industrial sector, which include bypass diodes.
In all cases, the incorporation of DC-DC converters enhances the electrical output of the receiver in comparison with the corresponding base configurations (S0 or M0). Specifically, for the illumination profile designated as 1 central maximum (P1), two distinct configurations were evaluated within the serial arrangement. First, implementing a DC-DC converter in parallel with each cell (S48) resulted in the most substantial improvement, registering at 48.8%. The second approach involved integrating a DC-DC converter in parallel with every six cells in series (S8), yielding a notable improvement of 26.0%.
In the module configuration scheme (M8), the integration of converters leads to a substantial 28.3% improvement in net power. This configuration’s ease of assembly, applicable to both experimental and industrial devices, positions it as one of the most favorable schemes for implementation.
The performance of the M8 electrical configuration was analyzed across six common lighting scenarios, all characterized by the same average irradiance (as described in
Section 2). The findings consistently revealed that, in all examined cases, the net power generated by the M8 configuration surpassed that of the S48. Specifically, under the P4 scenario, characterized by concentrated irradiance variations among different modules, M8 production was comparatively lower. However, it was noteworthy that this scenario also exhibited the most substantial improvement introduced by the use of DC-DC converters (M8) relative to the standard configuration (M0, with bypass diodes). The net power increased from 885 W (M0) to 1283 W (M8).
In contrast to the P4 lighting profile, the configuration exhibited minimal impact on production under the P3 lighting profile, showcasing the insensitivity of parallel connections to irradiance nonuniformity. However, temperature fluctuations, a persisting sensitivity factor, were effectively managed by the cooling system.
It should be noted that the electrical interconnections from each module to the external DC-DC converters pose a significant challenge in dense matrix receivers, as the limited space for these interconnections can result in nonactive surfaces.
This study demonstrates that the use of DC-DC converters combined with a tailored microfluidic cell cooling system has a great potential for the improvement of electrical production of dense array CPV receivers. The results obtained open a new way for future studies to assess the reduction in the levelized cost of electricity (LCOE) in dense array CPV receivers.

 ,
, 


