Article

Economic Pricing in Peer-to-Peer Electrical Trading for a Sustainable Electricity Supply Chain Industry in Thailand

by
Adisorn Leelasantitham
,
Thammavich Wongsamerchue
and
Yod Sukamongkol
*
Technology of Information System Management Division, Faculty of Engineering, Mahidol University, 25/25 Phutthamonthon Sai 4 Road, Salaya, Phutthamonthon, Nakhon Pathom 73170, Thailand
*
Author to whom correspondence should be addressed.
Energies 2024, 17(5), 1220; https://doi.org/10.3390/en17051220
Submission received: 8 January 2024 / Revised: 7 February 2024 / Accepted: 16 February 2024 / Published: 4 March 2024
(This article belongs to the Topic Energy Economics and Sustainable Development)

Abstract

:
The state-owned power Electricity Generating Authority of Thailand (EGAT), a monopoly market in charge of producing, distributing, and wholesaling power, is the focal point of Thailand’s electricity market. Although the government has encouraged people to install on-grid solar panels to sell electricity as producers and retail consumers, the price mechanism, i.e., purchasing price and selling prices, is still unilaterally determined by the government. Therefore, we are interested in studying the case where blockchain can be used as a free trading platform. Without involving buying or selling from the government, this research presents a model of fully traded price mechanisms. Based on the study results of the double auction system, data on buying and selling prices of electrical energy in Thailand were used as the initial data for the electricity peer-to-peer free-trading model. Then, information was obtained to analyze the trading price trends by using the law of demand and supply in addition to the principle of the bipartite graph. The price trend results agree well with those of price equilibrium equations. Therefore, we firmly believe that the model we offer can be traded in a closed system of free-trade platforms. In addition, the players in the system can help to determine the price trend that will occur according to various parameters and will cause true fairness in the sustainable electricity supply chain industry in Thailand.

1. Introduction

Over the last three decades, energy production and transmission along the transmission line were the responsibility of the Electricity Generating Authority of Thailand (EGAT). The electricity was then distributed and retailed to residential, commercial, and industrial electricity users by the Provincial Electricity Authority (PEA) and the Metropolitan Electricity Authority (MEA). In the mid-to-late 1990s, to address the rising demand for electricity, Independent Power Producer (IPP), Small Power Producer (SPP), and Very Small Power Producer (VSPP) programs were established. Their primary objective was to assist in lowering the EGAT’s investment burden and reducing the total cost of electricity generation to levels below public sector generation costs. However, all of the generated electrical energy from the IPPs, SPPs, and VSPPs must be fed into the EGAT as an enhanced single buyer (ESB), which is a centralized system. This system has been operating in this manner until now.
In addition, the Energy Regulatory Commission (ERC) was established on 1 February 2008 [1]. The regulatory organization is in charge of regulating the energy industry, which includes gas and electricity. Actually, it is anticipated that an independent regulatory body will contribute to greater accessibility, reliability, and public involvement in the energy sector. Figure 1 illustrates the current structure of the Thai electricity industry [2].
One of the responsibilities of the ERC is to regulate the electrical energy price that the EGAT will pay for each producer. The electrical energy pricing rate depends on the energy source for generating electricity such as natural gas, coal, and renewable energy. Normally, the energy cost generated from renewable energy, i.e., solar, wind, or biomass, is lower than that generated from fuel, trash, or industrial waste. Therefore, the ERC has announced the purchasing price of electrical energy as summarized in Table 1 [3].
On the other hand, the PEA and the MEA, who distribute electricity to consumers, also gather electrical energy fees. The current electrical energy tariff for selling to residential consumers is a ladder method [4]. The more electricity that is used, the more bills that must be paid. Electricity tariffs are classified into two groups, namely, those who consume no more than 400 units per month and those who use more than 400 units per month. The electricity tariff information is shown in Table 2.
Nevertheless, in recent years, the establishment of small-scale distributed generation systems from solar energy and wind energy has taken place rapidly. In many nations, including Thailand, prosumers are becoming more and more popular as both producers and consumers of electrical energy. Additionally, a new paradigm has been introduced known as peer-to-peer (P2P) electrical energy trading, in which local prosumers and consumers can trade electricity with one another. Thus, P2P energy free trade is currently in its infancy in Thailand. However, from the above information, it is obviously seen that Thailand’s electricity market is still with the ESB, where the electrical energy purchasing rate is fixed, while the electrical energy selling rate is varied due to the ladder price, which leads to a 1–2 times higher purchasing price for renewable energy.
As mentioned above, the consumer electrical energy expense is about 1–2 times higher than the selling income from renewable energy, especially from solar energy. The price difference may result from operating costs, management costs, maintenance costs, administrative costs, and other overhead profits that are formed to be the structure of electricity costs in Thailand, as presented by Leelasantitham [2]. For the genuine equity and sustainability of all parties involved in Thailand’s electrical energy trade, the objective of this study is to develop a model of fully free-trade price mechanisms where a blockchain can be used as a peer-to-peer free-trading platform.
Moreover, the main contribution of this paper is its minimization of the previous research gaps, which will be discussed in Section 2, by developing the P2P energy trading model based on the mix of the double-auction technique, pricing optimization, the demand and supply economic law, and bipartite graph theory. Then, the benefits of the practical implications to the economic pricing in the P2P electrical trading for the Sustainable Electricity Supply Chain Industry (SESCI) in Thailand are presented in Section 6.
Additionally, the scope of this study is narrow and clear. Attention is paid to the buying and selling of electrical energy rates from renewable energy only. According to the previous study results of the double auction system [5], randomly simulating the generated and the consumed electrical energy data of four houses, consumers, and prosumers, are used as the initial data along with the buying and the selling prices of electrical energy. At that time, the procedures replicate the data re-established with the sale of N houses in the form of a double auction, then, the results are obtained to analyze the trading price trends by using the law of demand and supply in addition to the principle of the bipartite graph.

2. Related Work/Literature Review

2.1. P2P Energy Trading

According to the emerging trends in digitalization, de-centralization, and the concept of the sharing economy, P2P energy trading is a type of local energy trading where prosumers can directly exchange extra energy with their neighbors, individuals, or local communities’ energy consumers [2]. In P2P trading, a peer can be a single energy user or a collection of users, such as producers and prosumers. A group of energy users can exist on a variety of scales, such as a single family, a community, or a local distribution network. In addition, through reduced peak demand, lower capital and operating costs, and increased power system reliability, grid distribution system operators can also profit from this model, which can encourage the use of renewable energy in communities like cooperatives, where residents can benefit collectively from photovoltaic (PV) solar rooftop systems.
Furthermore, in the context of the current energy markets, the P2P model has the ability to alter some existing roles, resulting in the formation of new roles, brokers, and representatives in future P2P trades. With the recent advancements in decentralized blockchain technology (BT), distributed ledger technologies are being used to introduce transaction security in peer-to-peer energy trading. With the use of a consensus algorithm, like the Proof-of-Work (PoW), Proof-of-Stake (PoS), or Proof-of-Authority (PoA) algorithm, BT can be applied to P2P transactions in a way that ensures security, transparency, and unchangeable records without the need for a central authority. These characteristics of BT make it a suitable candidate for implementing P2P trading in the electricity market. In fact, this technology has been applied and established in various areas in many countries and has also been demonstrated in many studies.
P2P electricity trading has been established to be a viable way to promote and manage proliferated prosumers in distribution systems through a significant amount of research and pilot programs. Table 3 shows a short summary of the related research works on energy trading platforms that used blockchain technology. It is obvious that some researchers studied an electrical energy trading scenario on local distribution networks and microgrids [6,7,8,9,10,11,12] with various methods such as game theory and double auction trade to set P2P energy trading platforms [5,13,14,15], whilst others used case studies to prove their hypotheses and frameworks [5,16,17]. However, there were some limitations such as the exclusion of certain information from their works about prosumer trade confidentiality, economic conditions, and pricing optimization.
For this study, a blockchain-based business model guideline for Thai electrical utility systems, as provided by Leelasantitham [2], was also utilized in the BT double-auction prepaid electricity trading platform [5,21]. The case study found that P2P transactions were direct purchases between the electricity producers and the consumers, which led to fewer operating steps and reduced electrical energy costs in the network. The structure of the electricity trading industry presented in that research is shown in Figure 2. For the double-auction trading platform, in competitions for both bidders and sellers, in the case of an offeror, the highest bidder will match each other. Once the winner’s price is determined, the seller who offers the fastest bid will win the auction. In that research, a four-house model was used to represent the consumers and the prosumers in the P2P trading system network, as shown in Figure 3.
As mentioned above, one of the gaps in the related studies is pricing optimization. Thus, the pricing optimizations for energy trading were also reviewed, and their summary is provided in Table 4. Some studies used the optimization approach to prevent energy loss for the suppliers, including power balance and energy management systems [22,23,24]. The others used the profit maximization algorithm (PMA) to increase productivity along with increasing profits for the electricity producers [21,25,26,27]. According to their results, it can be seen that, in the near future, the free trading market for electricity trading may open, and the energy trading market may shift from ESB to P2P energy trading.

2.2. Demand and Supply Theory

The idea that supplies and demands interact to determine prices is known as the law of supply and demand. It is predicated on the law of supply and the law of demand, which are two other economic laws [8,34]. While the law of demand claims that when prices rise, consumers buy fewer products and services, the law of supply asserts that when prices rise, companies see higher profit margins and increase their supplies of goods and services. These suggest that prices will decrease when there is a surplus of items or services compared with demand, and prices are likely to increase when demand surpasses supply. Theoretically, as supply and demand converge, a free market should aim for an equilibrium quantity and price. Supply and demand prices are exactly equal at that point. This means suppliers meet their clients’ demands by producing just enough items or services at the appropriate cost. In regard to P2P power trading, this equilibrium point was discovered in this study. Table 5 presents the related research works on the pricing model in which the law of supply and demand was applied.
Corresponding to the demand response based on real-time prices, some studies implemented P2P energy trading in smart homes, which minimized consumers’ electricity costs because of reduced wastage and management of the supply and demand of electricity in the microgrids [31]. Allowing for a reduction in the maximum net load, the results of one study showed that offline processing was as fast as online processing [35]. A dynamic supplier price setting was used to write smart contracts using BT along with an energy management system model to increase the efficiency of sky usage cost-effectively. The study [36] found that electricity bills could be reduced by as much as 44.73%. It was also found that electricity costs could be reduced by 51.80% when using the scheduling algorithm.
Table 5. Related research works on the pricing model.
ResearchersHighlightsMethodsResultsLimitations
Lin et al. [34]Bidding strategiesDemand and supplyk-double auctionBenefit contribution
Zheng et al. [35]Residential sharingContent filteringReduced costsLimited energy supply
Lohachab et al. [37]Smart cyber–physical systemsHyperledger caliperScalabilityCapability of CPS
An et al. [38]An appropriate trading priceOptimal tradingModel applicationNo auction mechanism
Wu et al. [39]Multi-scale flexibilityMulti-level marketReduced costsNeed to develop platform
Zhang et al. [40]Hybrid random walkDouble auctionReducing peakConfidential trading
Zhang et al. [41]Interative double auctionDemand and supplyTrading modelTwenty procumers
Wu et al. [42]Sharing economyLiterature reviewPricing mechanismNo pricing optimization

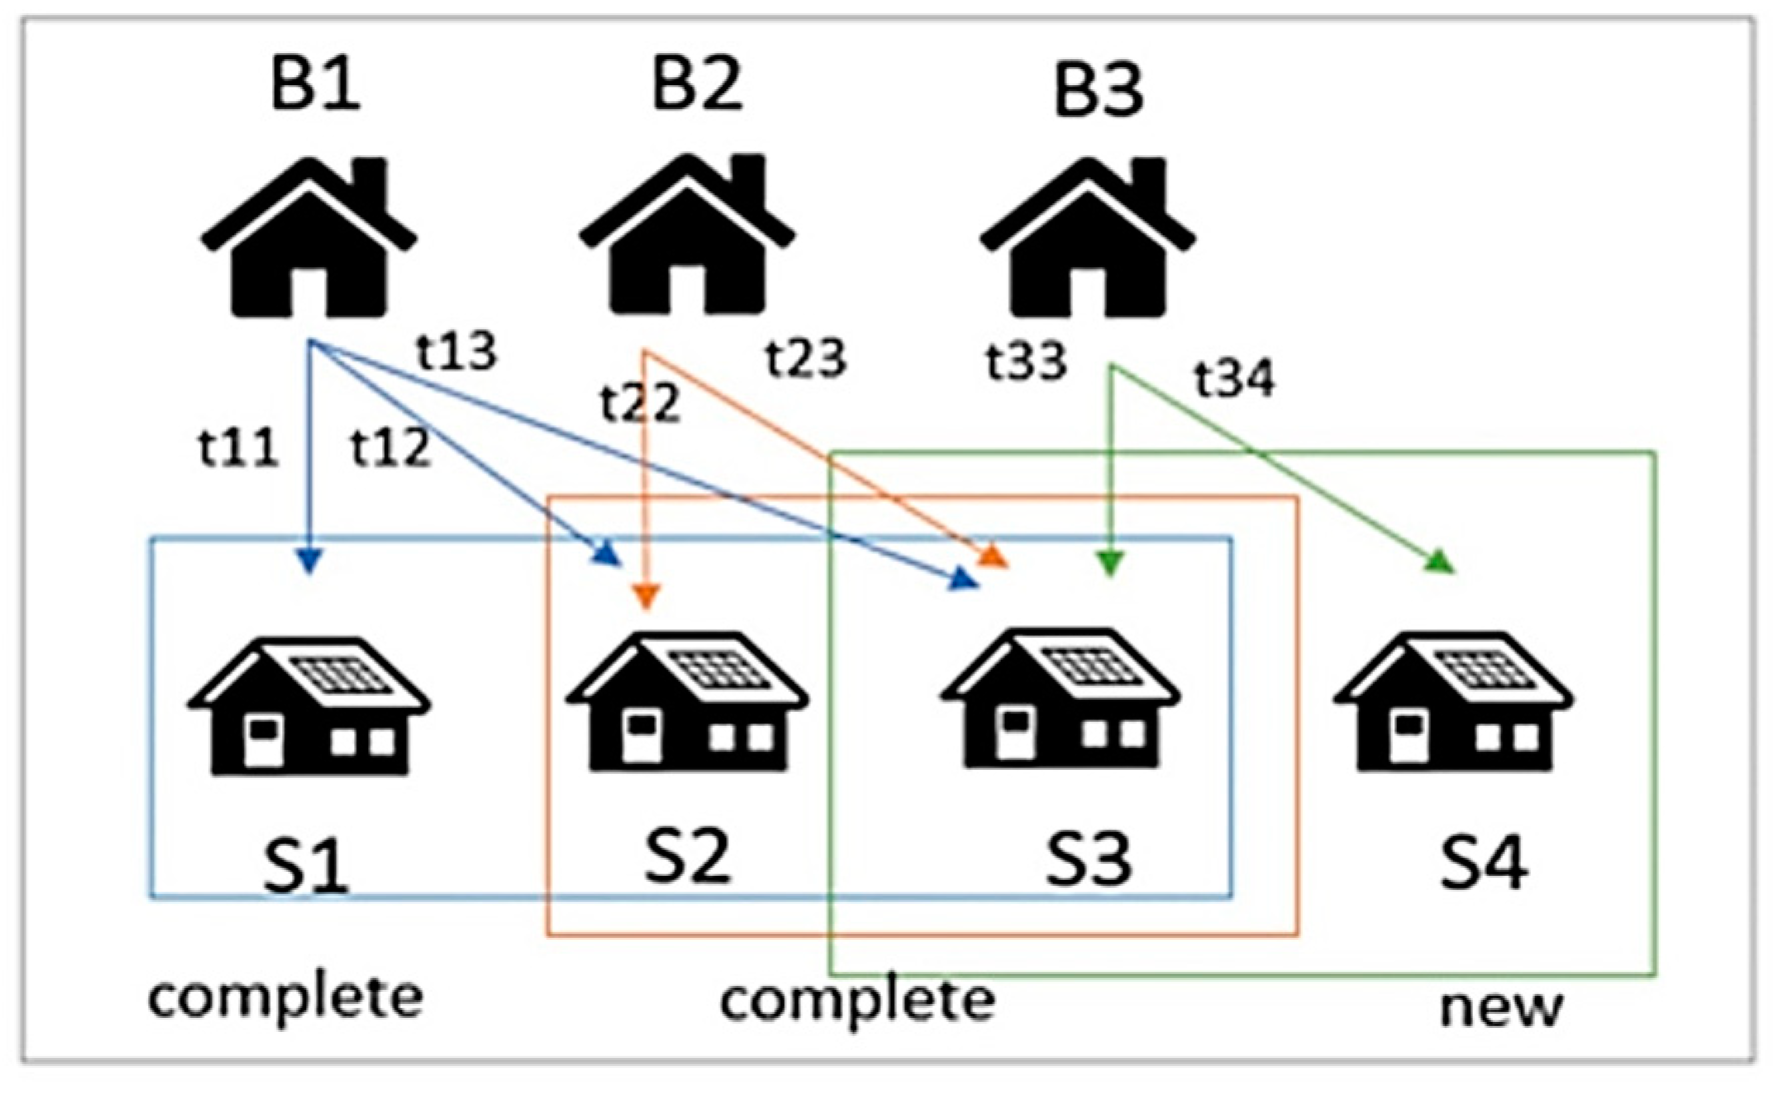
2.3. Bipartite Graph Theory

A bipartite graph is a type of graph that describes the relationship between two sets of data such that there are never two adjacent vertices in the same set. In other words, this is a graph where each edge joins a vertex from one set to another. Generally, this type of graph is often used to describe a one-to-one relationship and to solve matching problems. Some researchers have used bipartite graph theory to help determine the case of a one-to-one relationship, for example, P2P trading or the double-auction matching platform.
Some studies presented a decision-supporting model for P2P lending investment to help make investment decisions using the principles of the bipartite graph [36,43]. For simultaneous recalculation, they used real data from America’s largest P2P lending marketplace to estimate the loans from unknown people. The results of these studies can prove that the model helped the borrowers choose good loans from the lenders. Similarly, it helped the loan owners to lend profitably. The bipartite correlation diagrams led to the calculation of the decision model for the investment; example case studies for selling and buying are shown in Figure 4 and Figure 5, respectively.
The equation used to calculate the buyer’s confidence, LS, is shown as follows:
L S i = j = 1 m e i j × s t a t u s j j = 1 m e i j ,   i = 1 ,   2 , , n
The equation used to calculate the seller’s confidence, BS, is shown as follows:
B S i = i = 1 n e i j × L S j i = 1 n e i j ,   i = 1 ,   2 , , m
where statusj = {0, 1}; m = the number of completed purchases; n = the number of sellers; and e = the amount of energy that sellers have sold to buyers.

2.4. Contents and Contributions

According to the literature review, it is obvious that blockchain technology is suitable for the P2P electricity trading platform with various pricing mechanisms. However, we do not know what the trend will be if the electrical treading market in Thailand is completely free. Thus, this study focuses on this issue for both sides, the buyers and the sellers, along with the pricing scenarios for the P2P electrical trading in Thailand to discover their sentiment in the market. Based on the relevant research studies mentioned above, the comparative P2P energy trading models, with various techniques and methods, are shared in Table 6.
Therefore, the primary contributions of this paper to the literature are described as follows:
(1)
In this study, the P2P energy trading model, based on the mix of the double-auction technique, the pricing optimization, the demand-and-supply law, and bipartite graph theory, is presented to minimize the previous research gaps. Several N-house case studies that take the responsive demand and the varied numbers of participating prosumers into account are carried out in order to demonstrate the efficacy of the studied model.
(2)
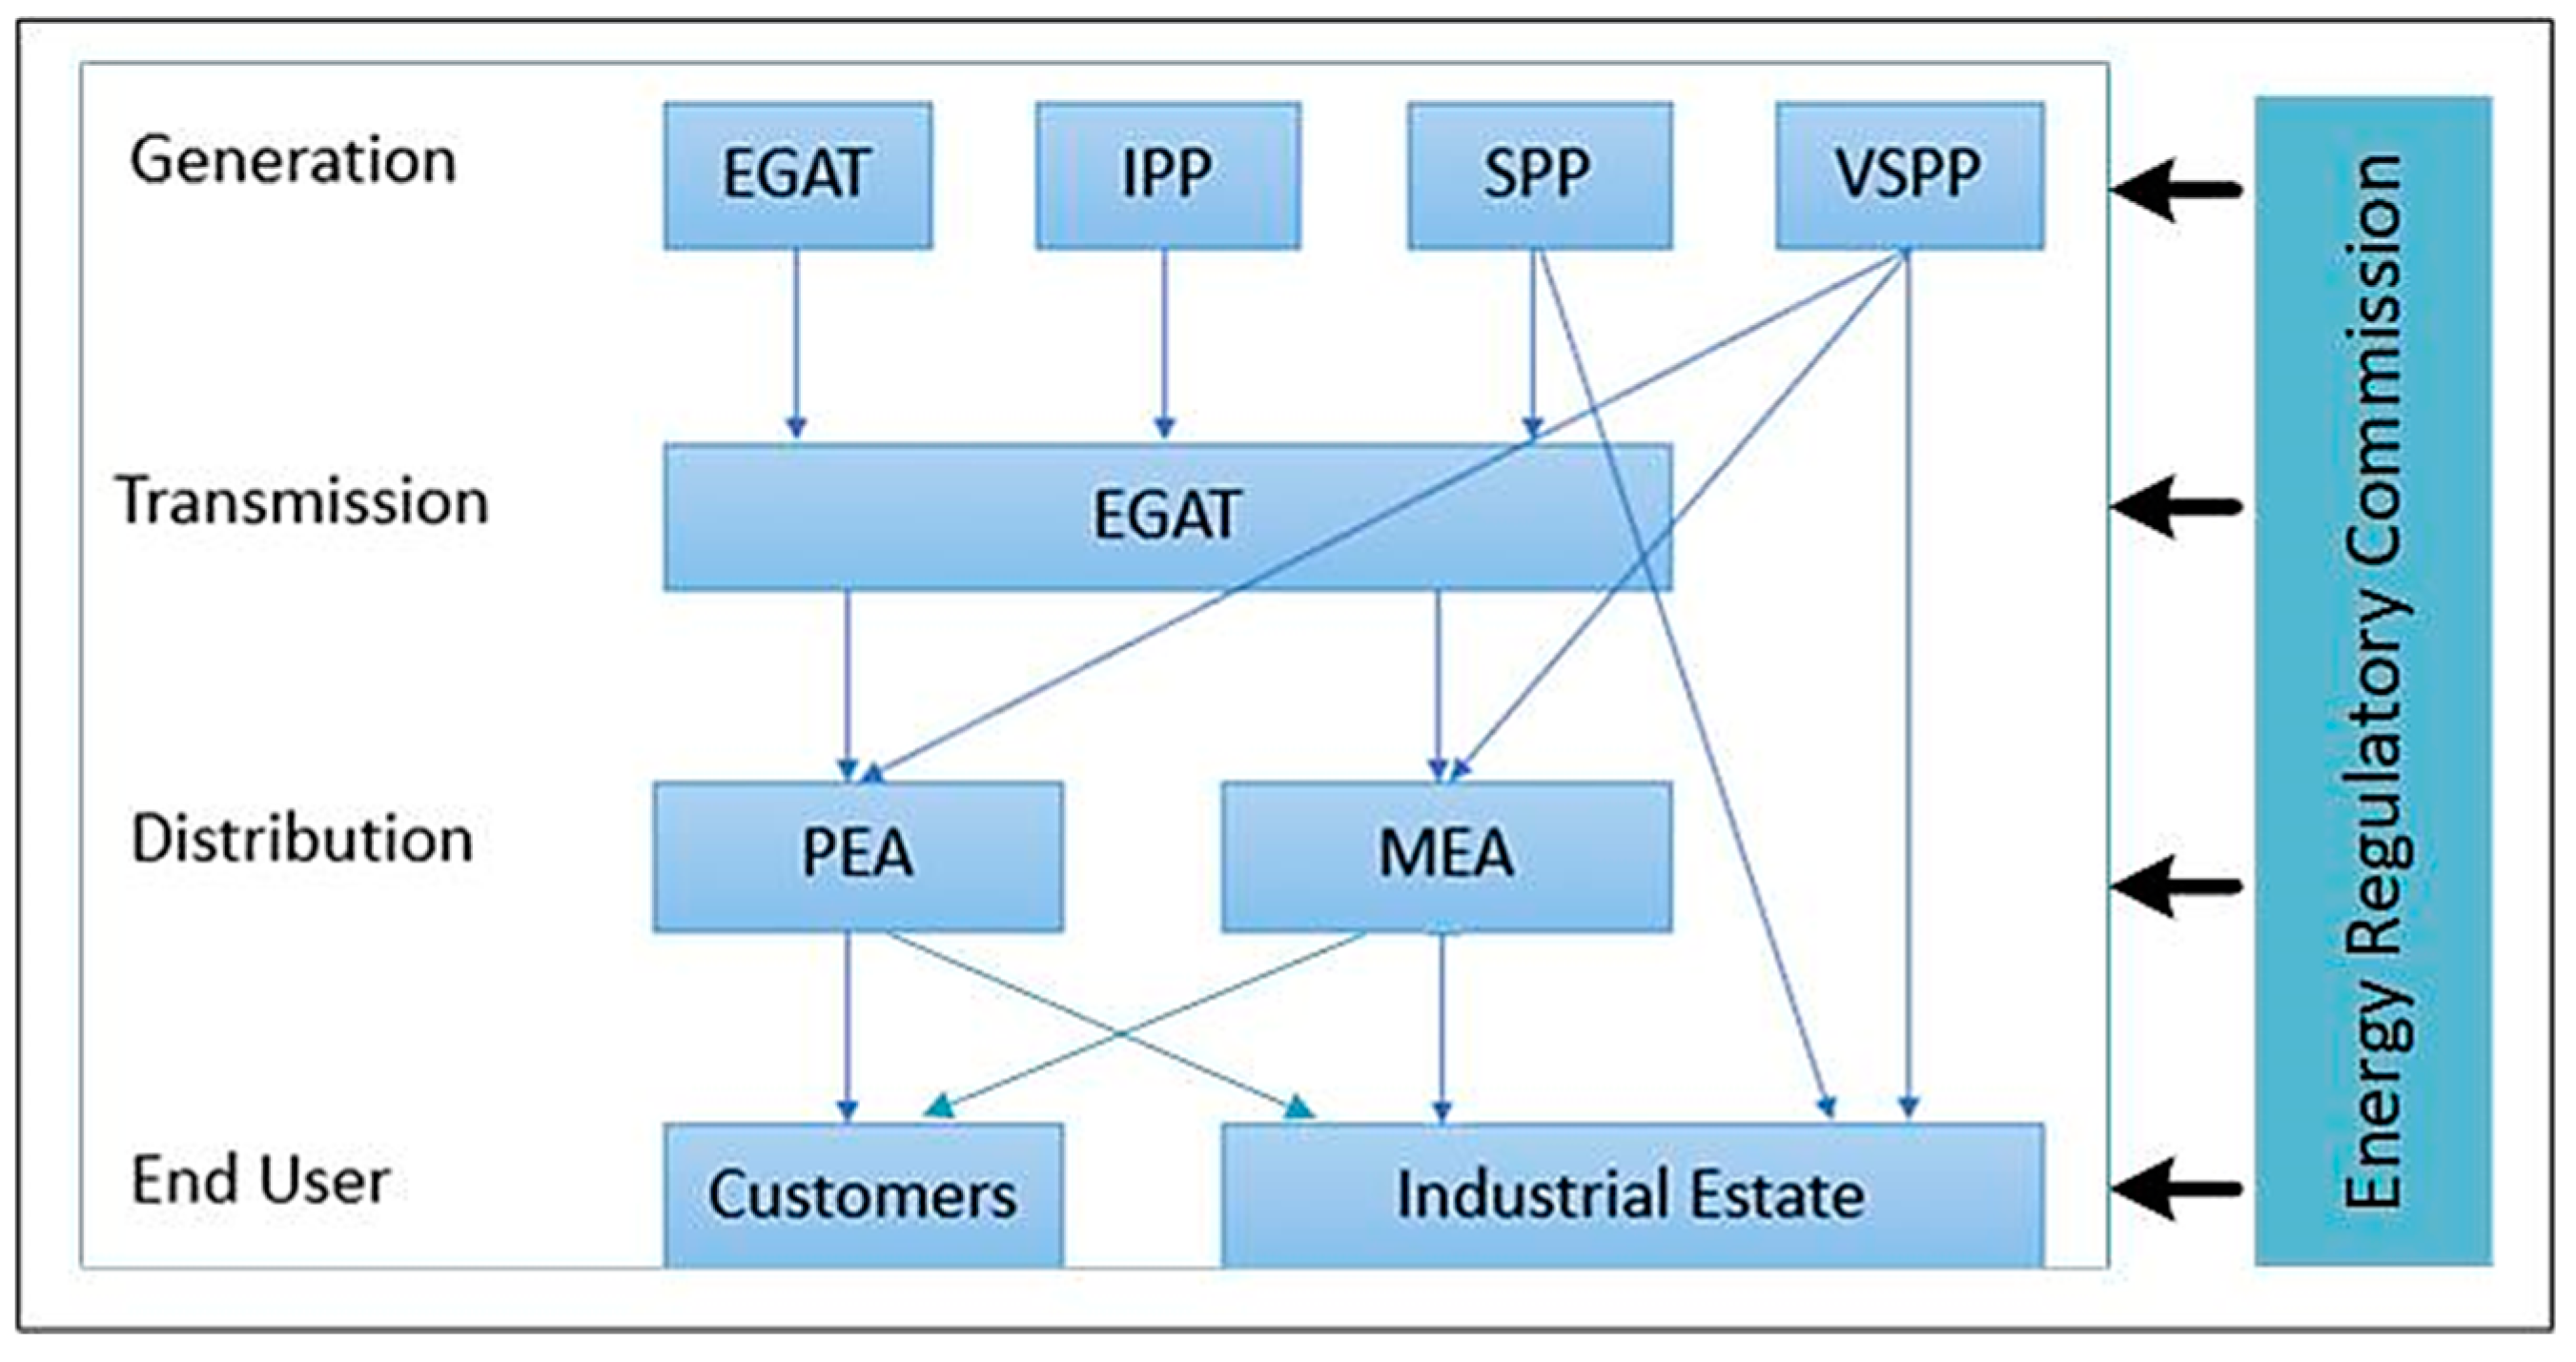
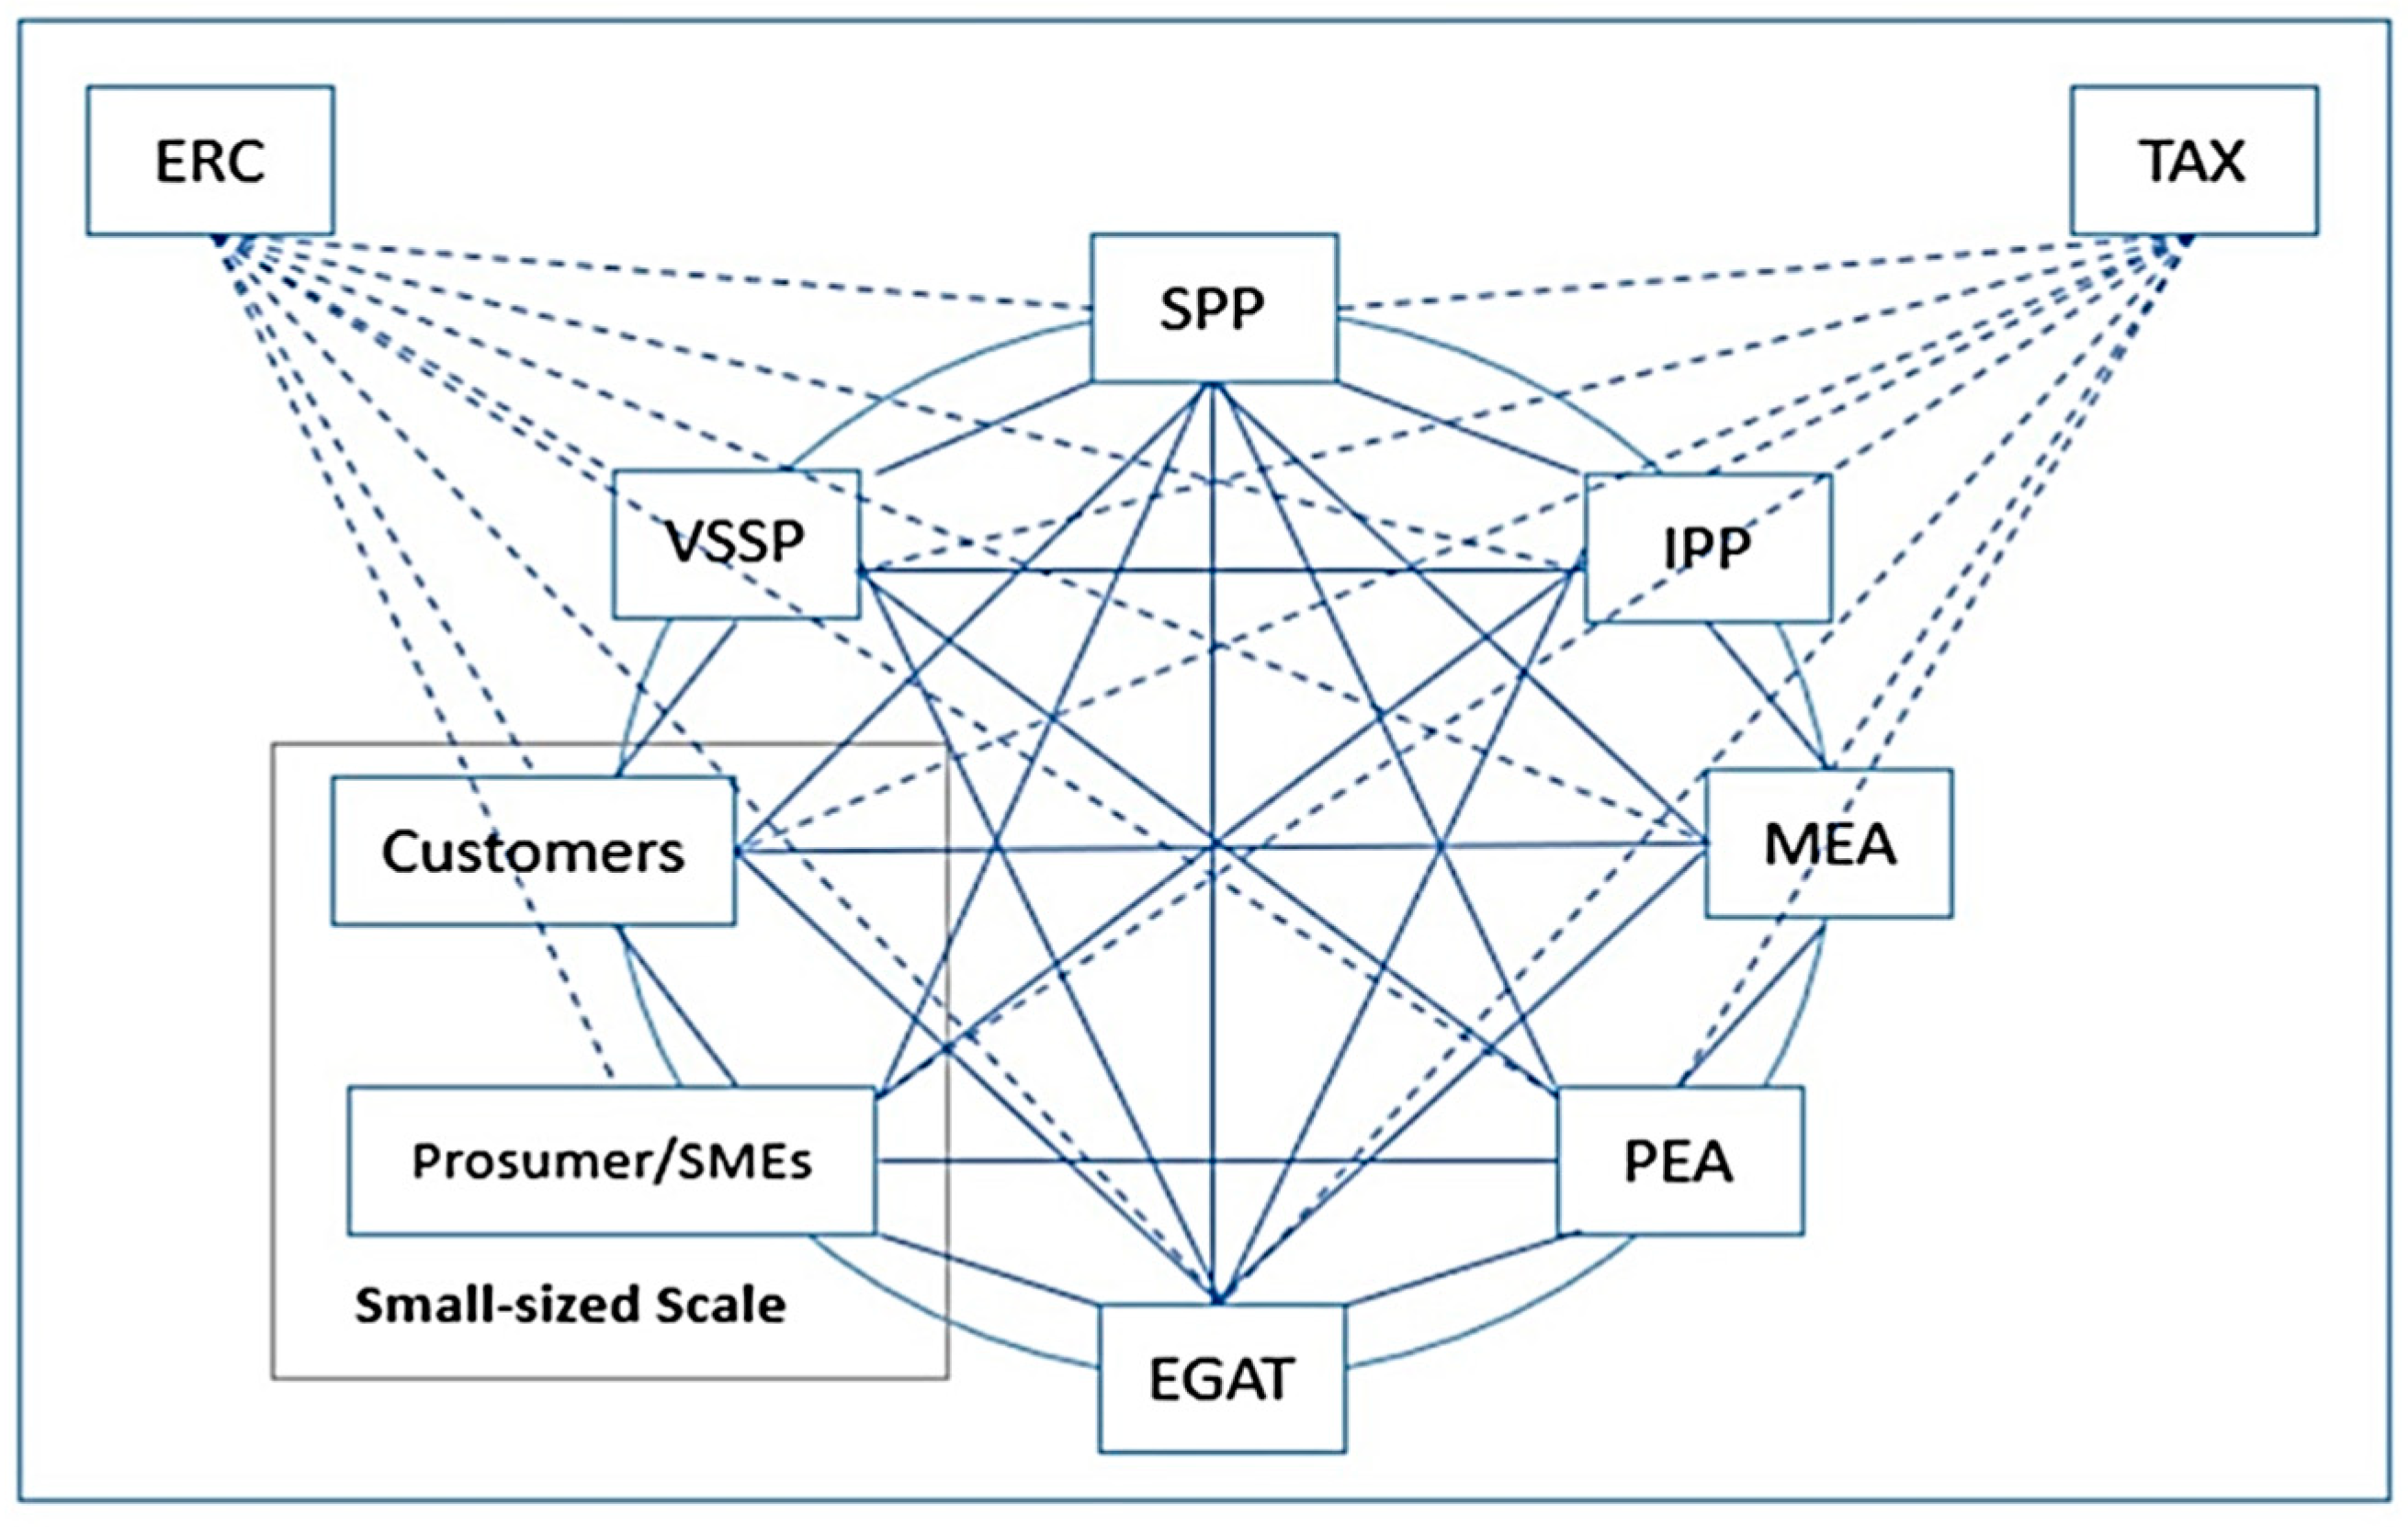
After the developed model is conducted and verified, the benefits of the practical implications to the economic pricing in P2P electrical trading for the SESCI in Thailand are explored in terms of the social environment and the economic area. In addition, the SESCI consists of five main processes in the electrical industry, i.e., fuel procurement, electricity production, electrical transmission system, electricity transportation in the distribution system, and electrical retail.

3. Research Methodology

To achieve the objective, the pricing model scenarios for P2P electrical trading in Thailand were studied in two steps, which were the 4-house P2P trading model and the N-house P2P trading model.

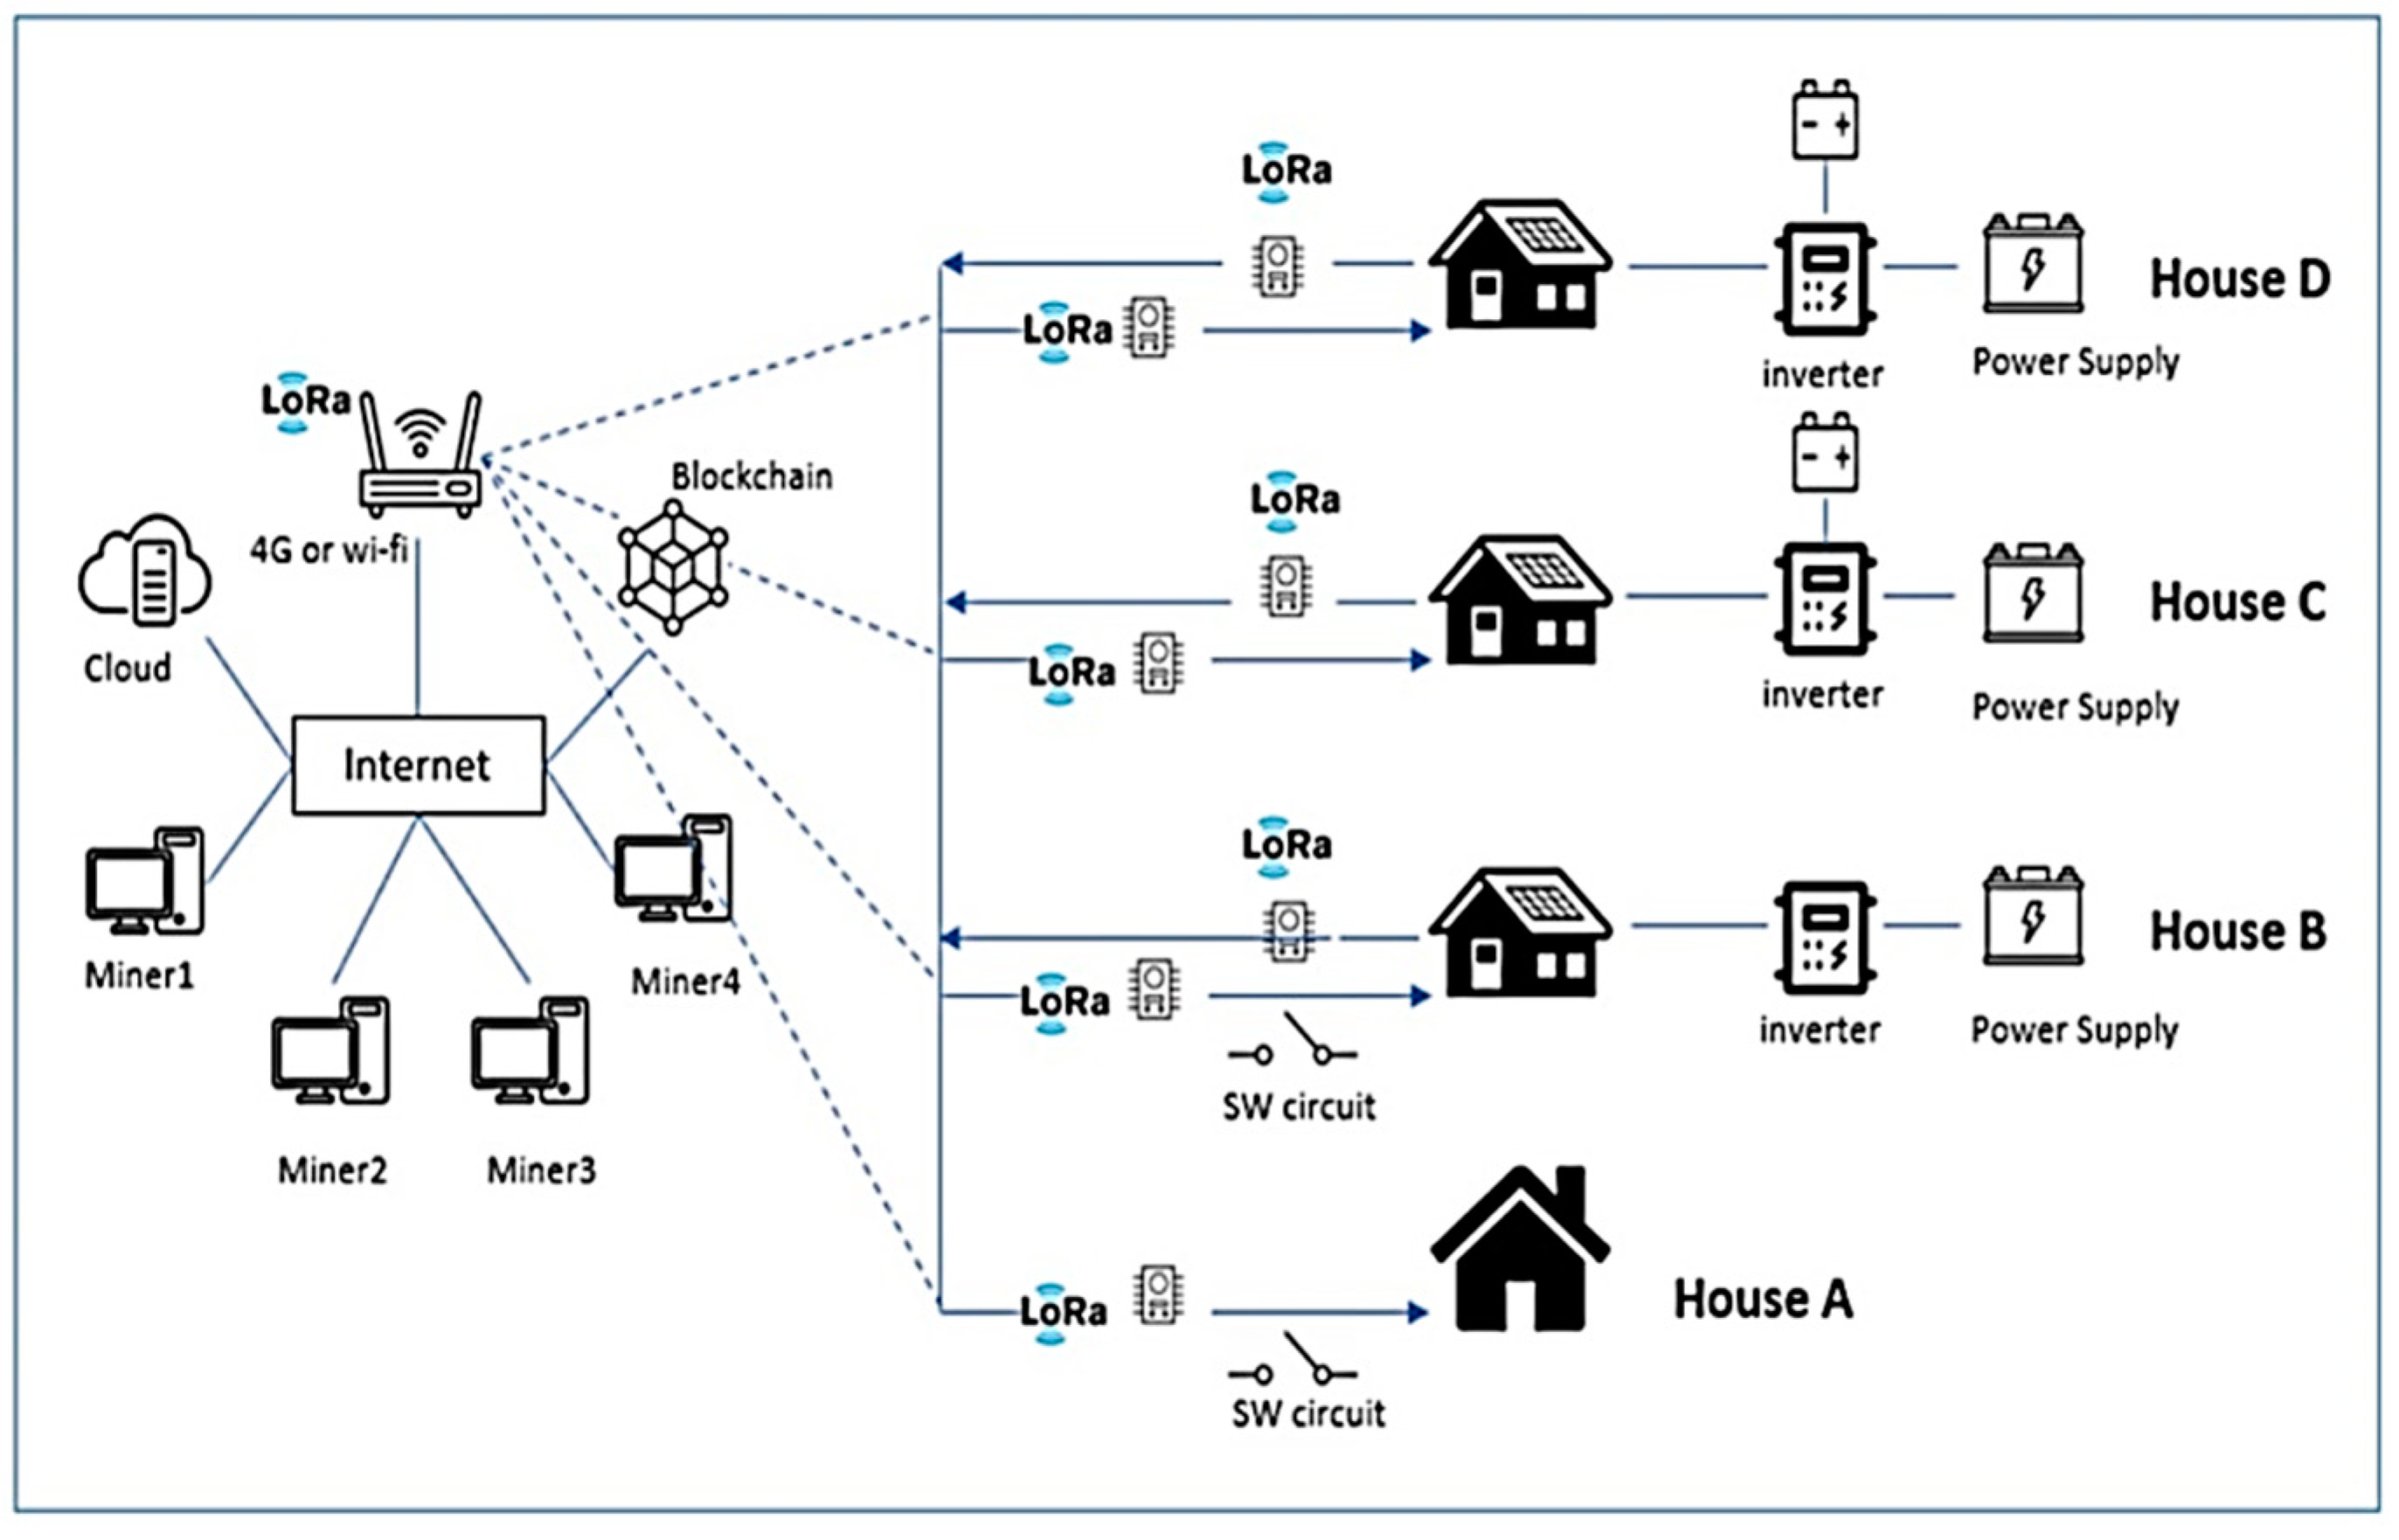
3.1. The 4-House P2P Trading Model

Wongsamerchue [5] studied the 4-house P2P electricity trading model by using a simulation model and verified it with the experimental data. The double-auction model was extended and used in this study along with the supply and demand law to discover the pricing pattern and the equilibrium price in the free-trade market. The study procedures are as follows:

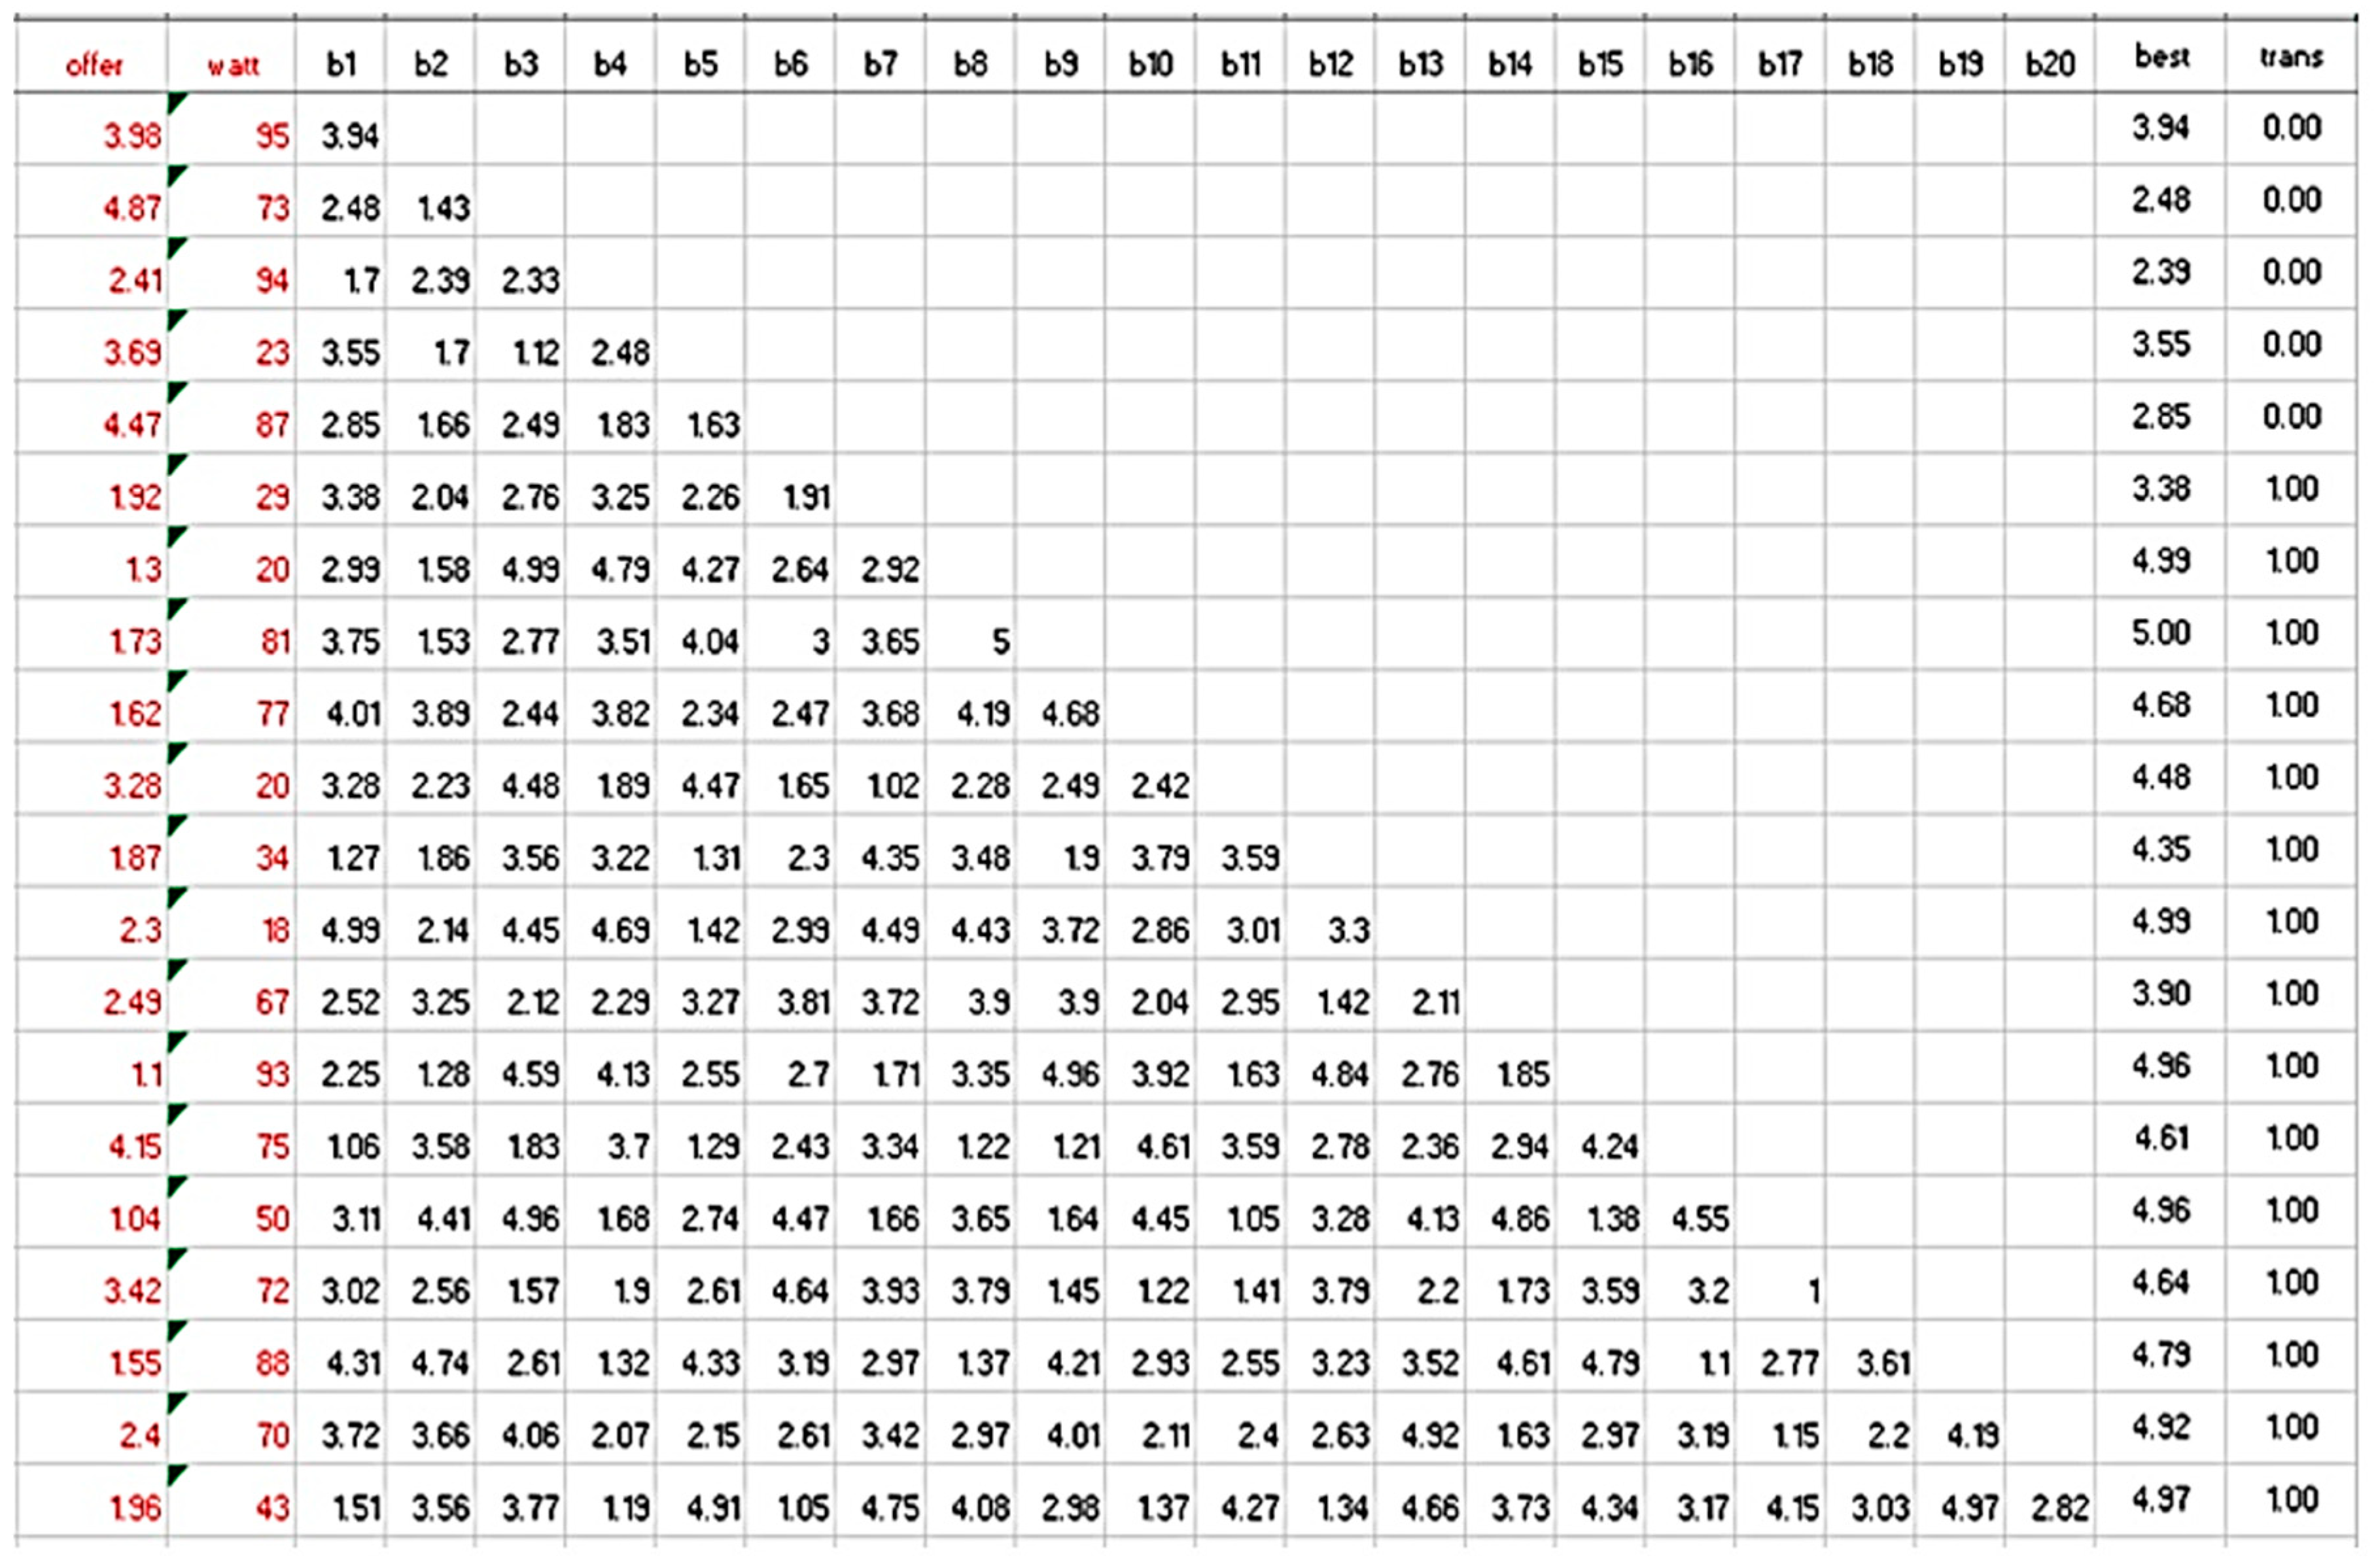
3.1.1. Random Price Numbers in Double-Auction Bidding for 4 Houses

To randomize the numbers for this experiment, the randomized function in the Python computer language program was used to generate random values of the electrical energy purchasing prices between 0.2 and 5.0 THB/unit, which represent the prices of the electrical energy generated from solar energy and fuel or thermal energy, respectively. Moreover, the amount of energy demanded was also random between 10 and 50% of the supplied energy. For this test, the total electrical energy was 50 kWh. Generally, the conditions for winning in the double auction are the first highest bidding price and the first lowest offering price for the buyer and the seller, respectively.
The Python function that was used to generate the uniform randomization was in the following format [45]:
random.uniform (a, b)
For example, to randomize a number between 0.2 and 5.0, the following command was used:
From random import random, uniform
random.uniform (0.2, 5.0)
random.randint (10, 100)
The sample of the data obtained by the uniform random sampling in the auction sales is illustrated in Figure 6. The bidding and the offering prices were random for 20 auction times. The winner’s bidding price, i.e., the highest price, is shown in the second-last column.

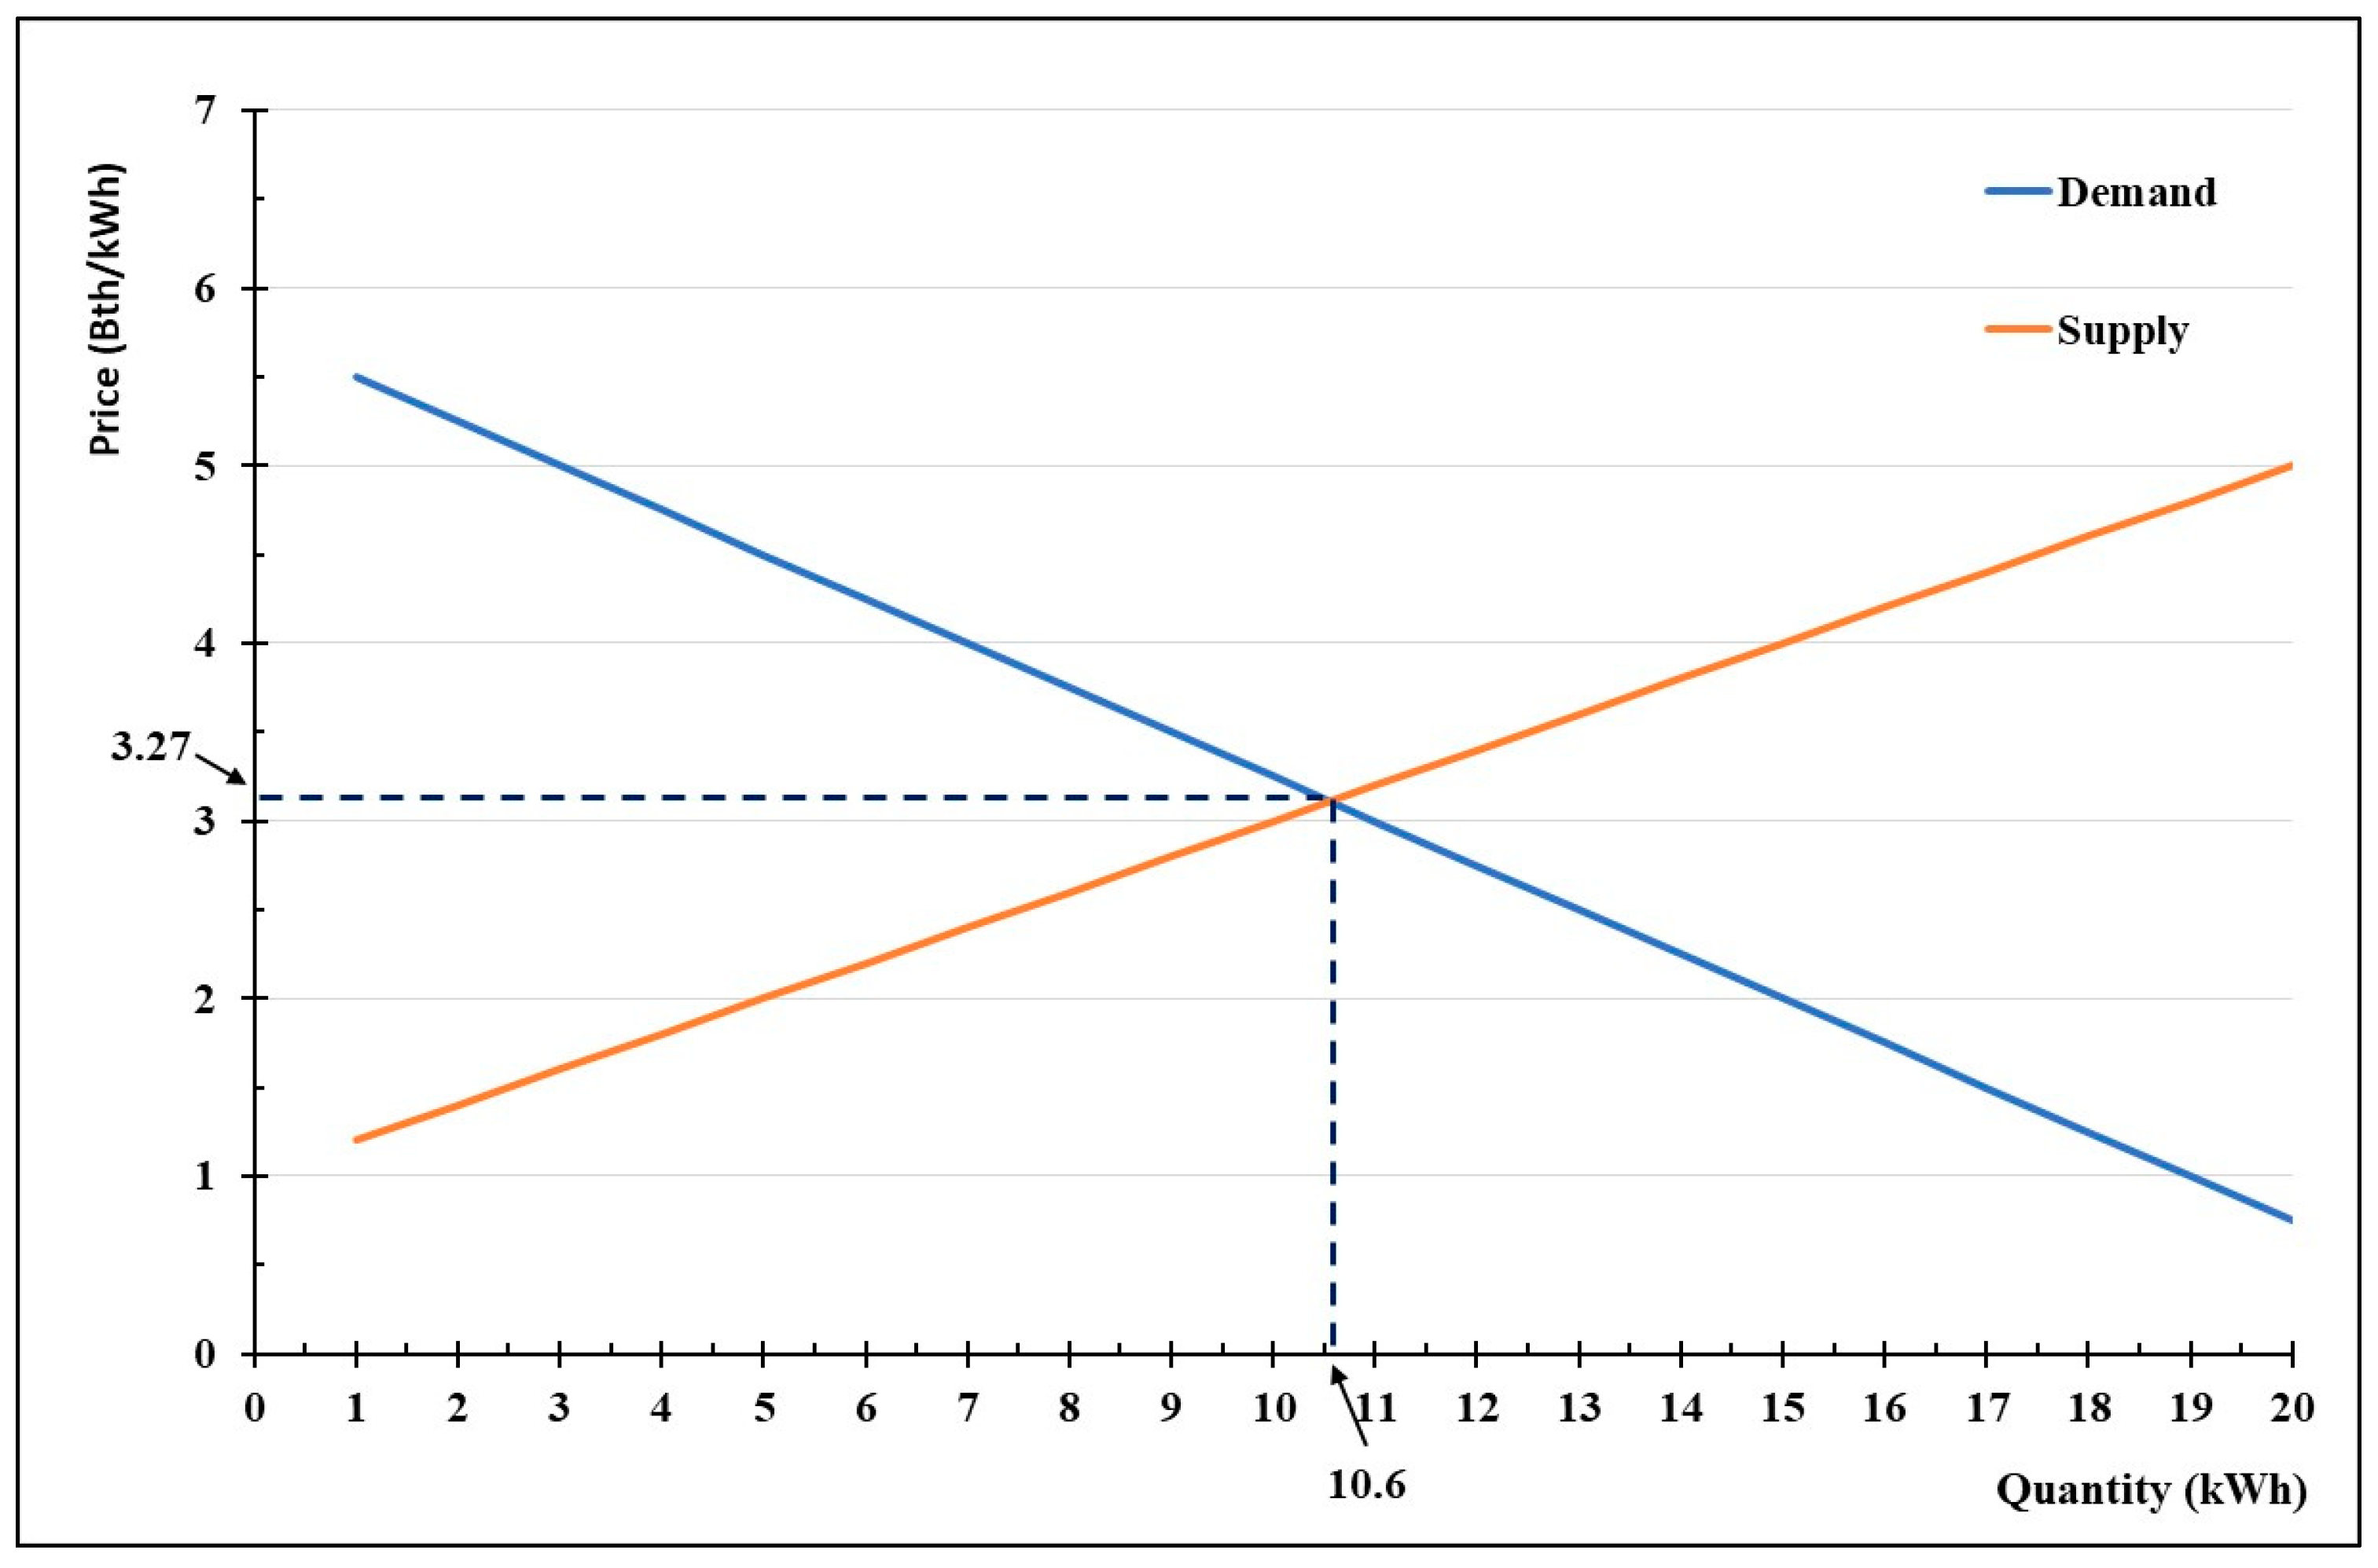
3.1.2. Price at the Equilibrium State

The price, Px, at the equilibrium point can be determined by using the theory of demand and supply [18]. The linear supply and demand equations are shown as follows:
The equation for the supply curve is
Qs = a + bPx
where Qs = the amount of supply; a = the quality of supplied products; and b = the price of each supplied product.
The equation for the demand curve is
Qd = cdPx
where Qd = the amount of demand; c = the quality of demanded products; and d = the price of each demanded product.
In order to find the equilibrium price, the supply function is set to equal to the demand function so that
Qs = Qd

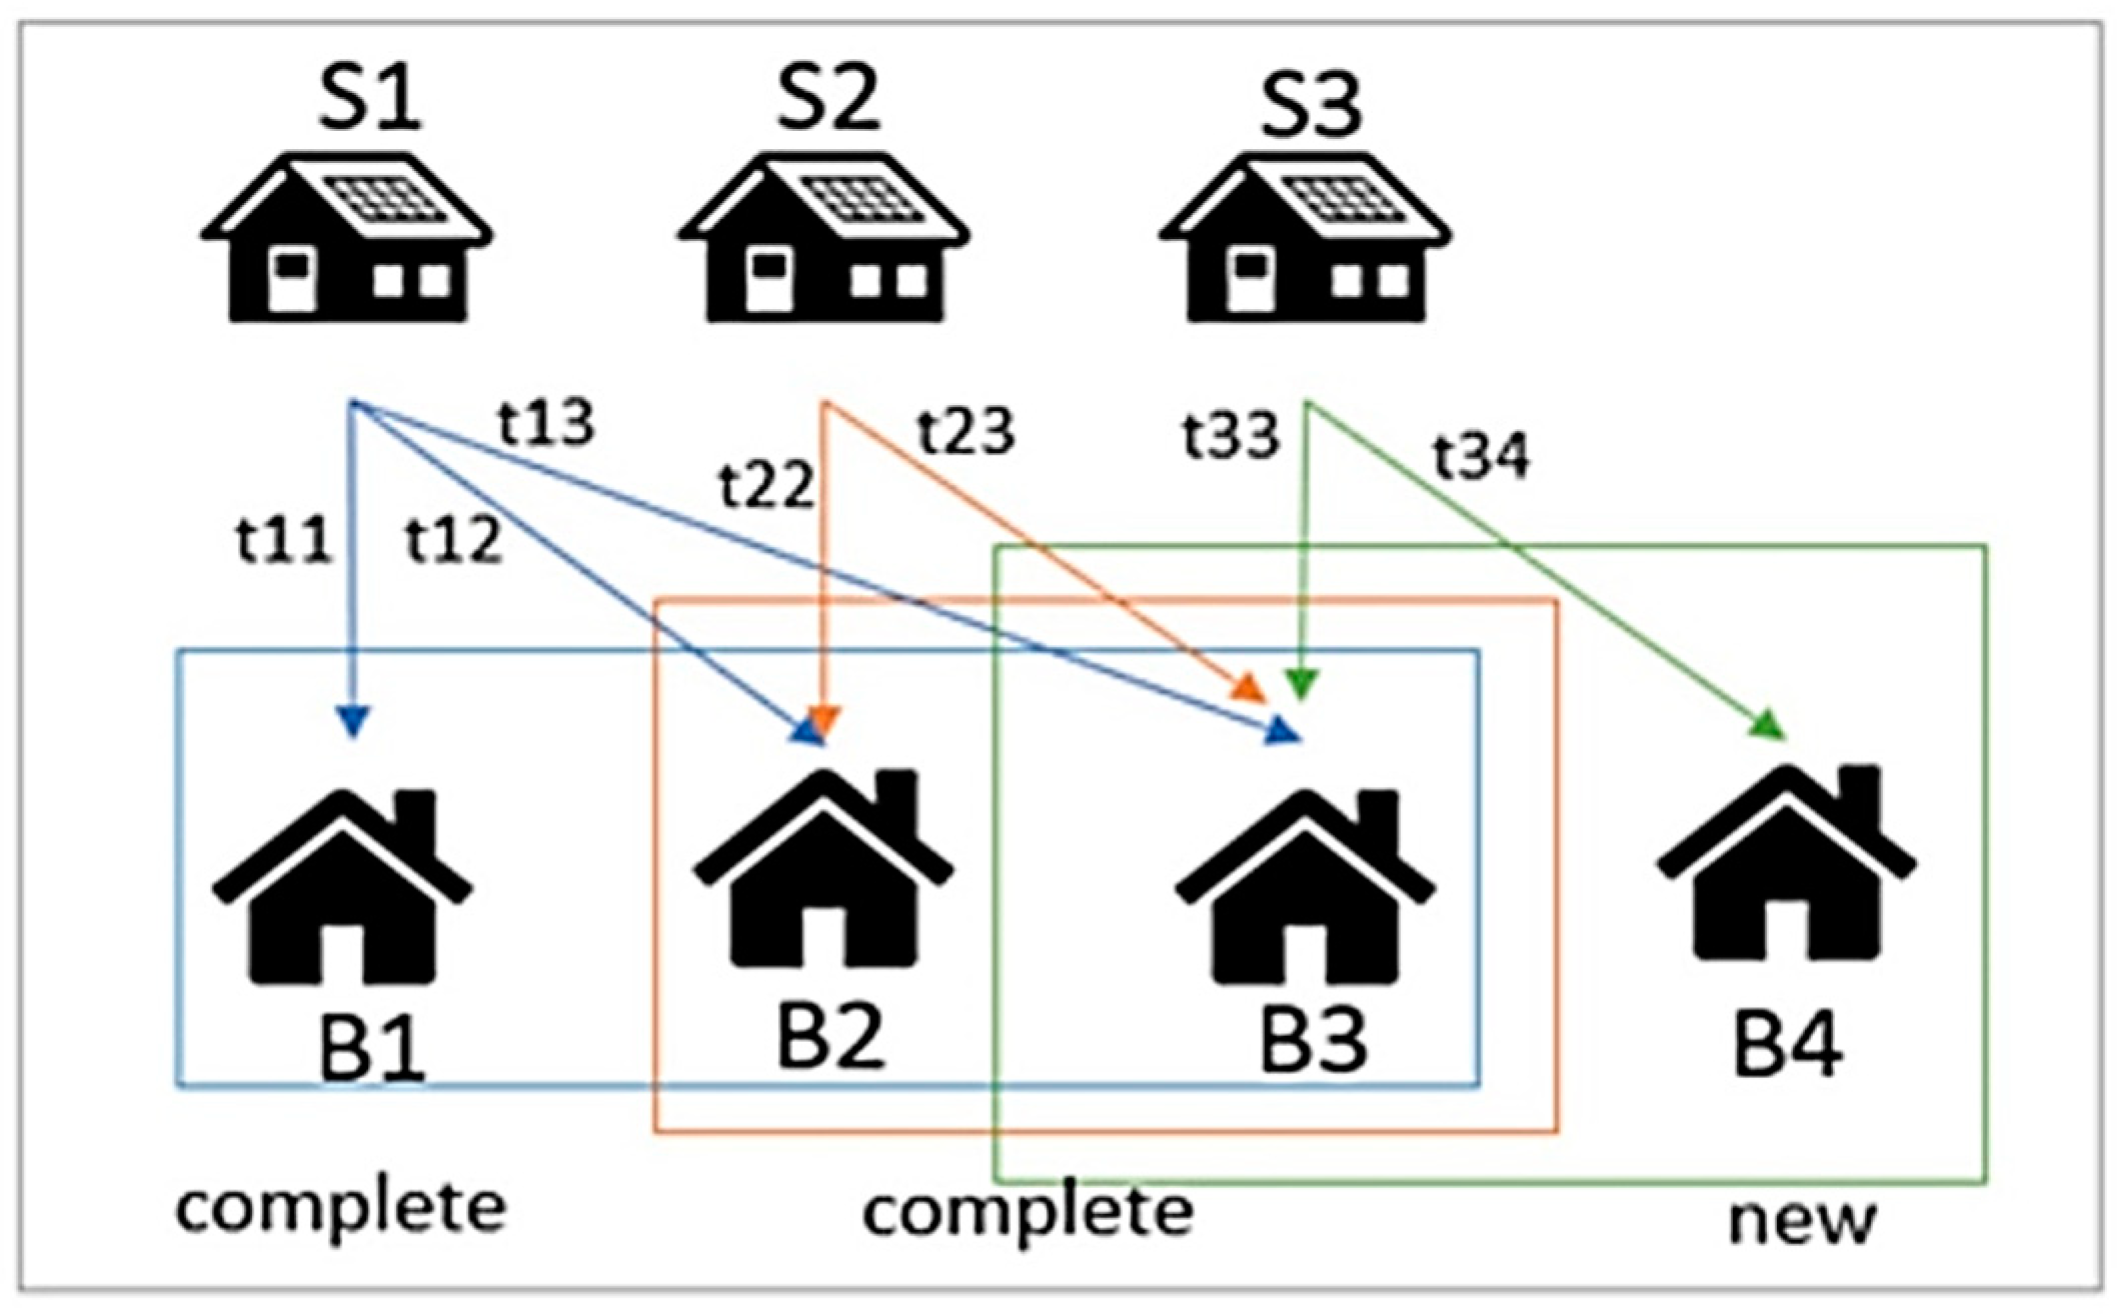
3.2. The N-House P2P Trading Model

After the 4-house P2P trading model in Section 3.1 was verified, it was extended to become the N-house P2P trading model where buyers and sellers were completely free to trade. The study procedures are as follows:
  • Random numbers for use of double-auction bids for more than 4 houses.
  • Determination of purchasing sentiment and selling using the bipartite graph principle.
  • Determining the probability of winning an auction compared to the price.
  • Finding the equilibrium price using the principle of supply and demand.

4. Tested Results

4.1. The Four-House P2P Trading Model

From the random sampling data on buying demand and selling supply, according to Figure 3, House A and House B made bids, while House C and House D made offers. The prices of the electrical energy for buying and selling were between THB 1.00 and 5.00 per unit and the total demand and supply of the electrical energy in those four houses was 20 kWh; the data are shown in Table 7.
According to the information in Table 7, the calculation of the demand and supply equations was completed as follows:
Supply Equation (3) was calculated as:
b = |ΔQsPx|
= |(15.00–20.00)/(4.00–5.00)| = 5
Demand Equation (4) was calculated as:
d = |ΔQdPx|
= |(7.00–3.00)/(4.00–5.00)| = 4
At the equilibrium state, the price, Px, was determined by Equation (5) as:
Qd = Qs
23 − 4 Px = −5 + 5 Px
Then, Px = 3.27 and Qd = Qs = 10.6.
From Equations (3) and (4), we predicted the related price between demand and supply, which led to the forecasting results. The numerical distribution model for the four-house experimental test was used, and its related price demand and supply graph is shown in Figure 7.
After the data obtained from the experiment were represented in the chart, it was found that the relationship between buying and selling demand was in accordance with the theory of supply and demand. For the demand curve, when a product’s price drops, the demand curve’s trend also declines. This means that consumers will consume more electrical energy if its price is low. On the other hand, the trend in the supply curve rises when the product’s price increases. This implies that suppliers want to sell more energy as they perceive higher profit margins if the price is high. However, it is obviously seen from the graph that the equilibrium price was 3.27 THB/kWh when the amount of electrical energy was 10.6 kWh.

4.2. The N-House P2P Trading Model

In this experimental scenario, it was assumed that the P2P free-trade electrical power market consists of 100 houses that made random 10,000 bids and 10,000 offers. The relationship between buying confidence and selling confidence was observed; their frequencies of buying success and of selling success are shown in Figure 8.

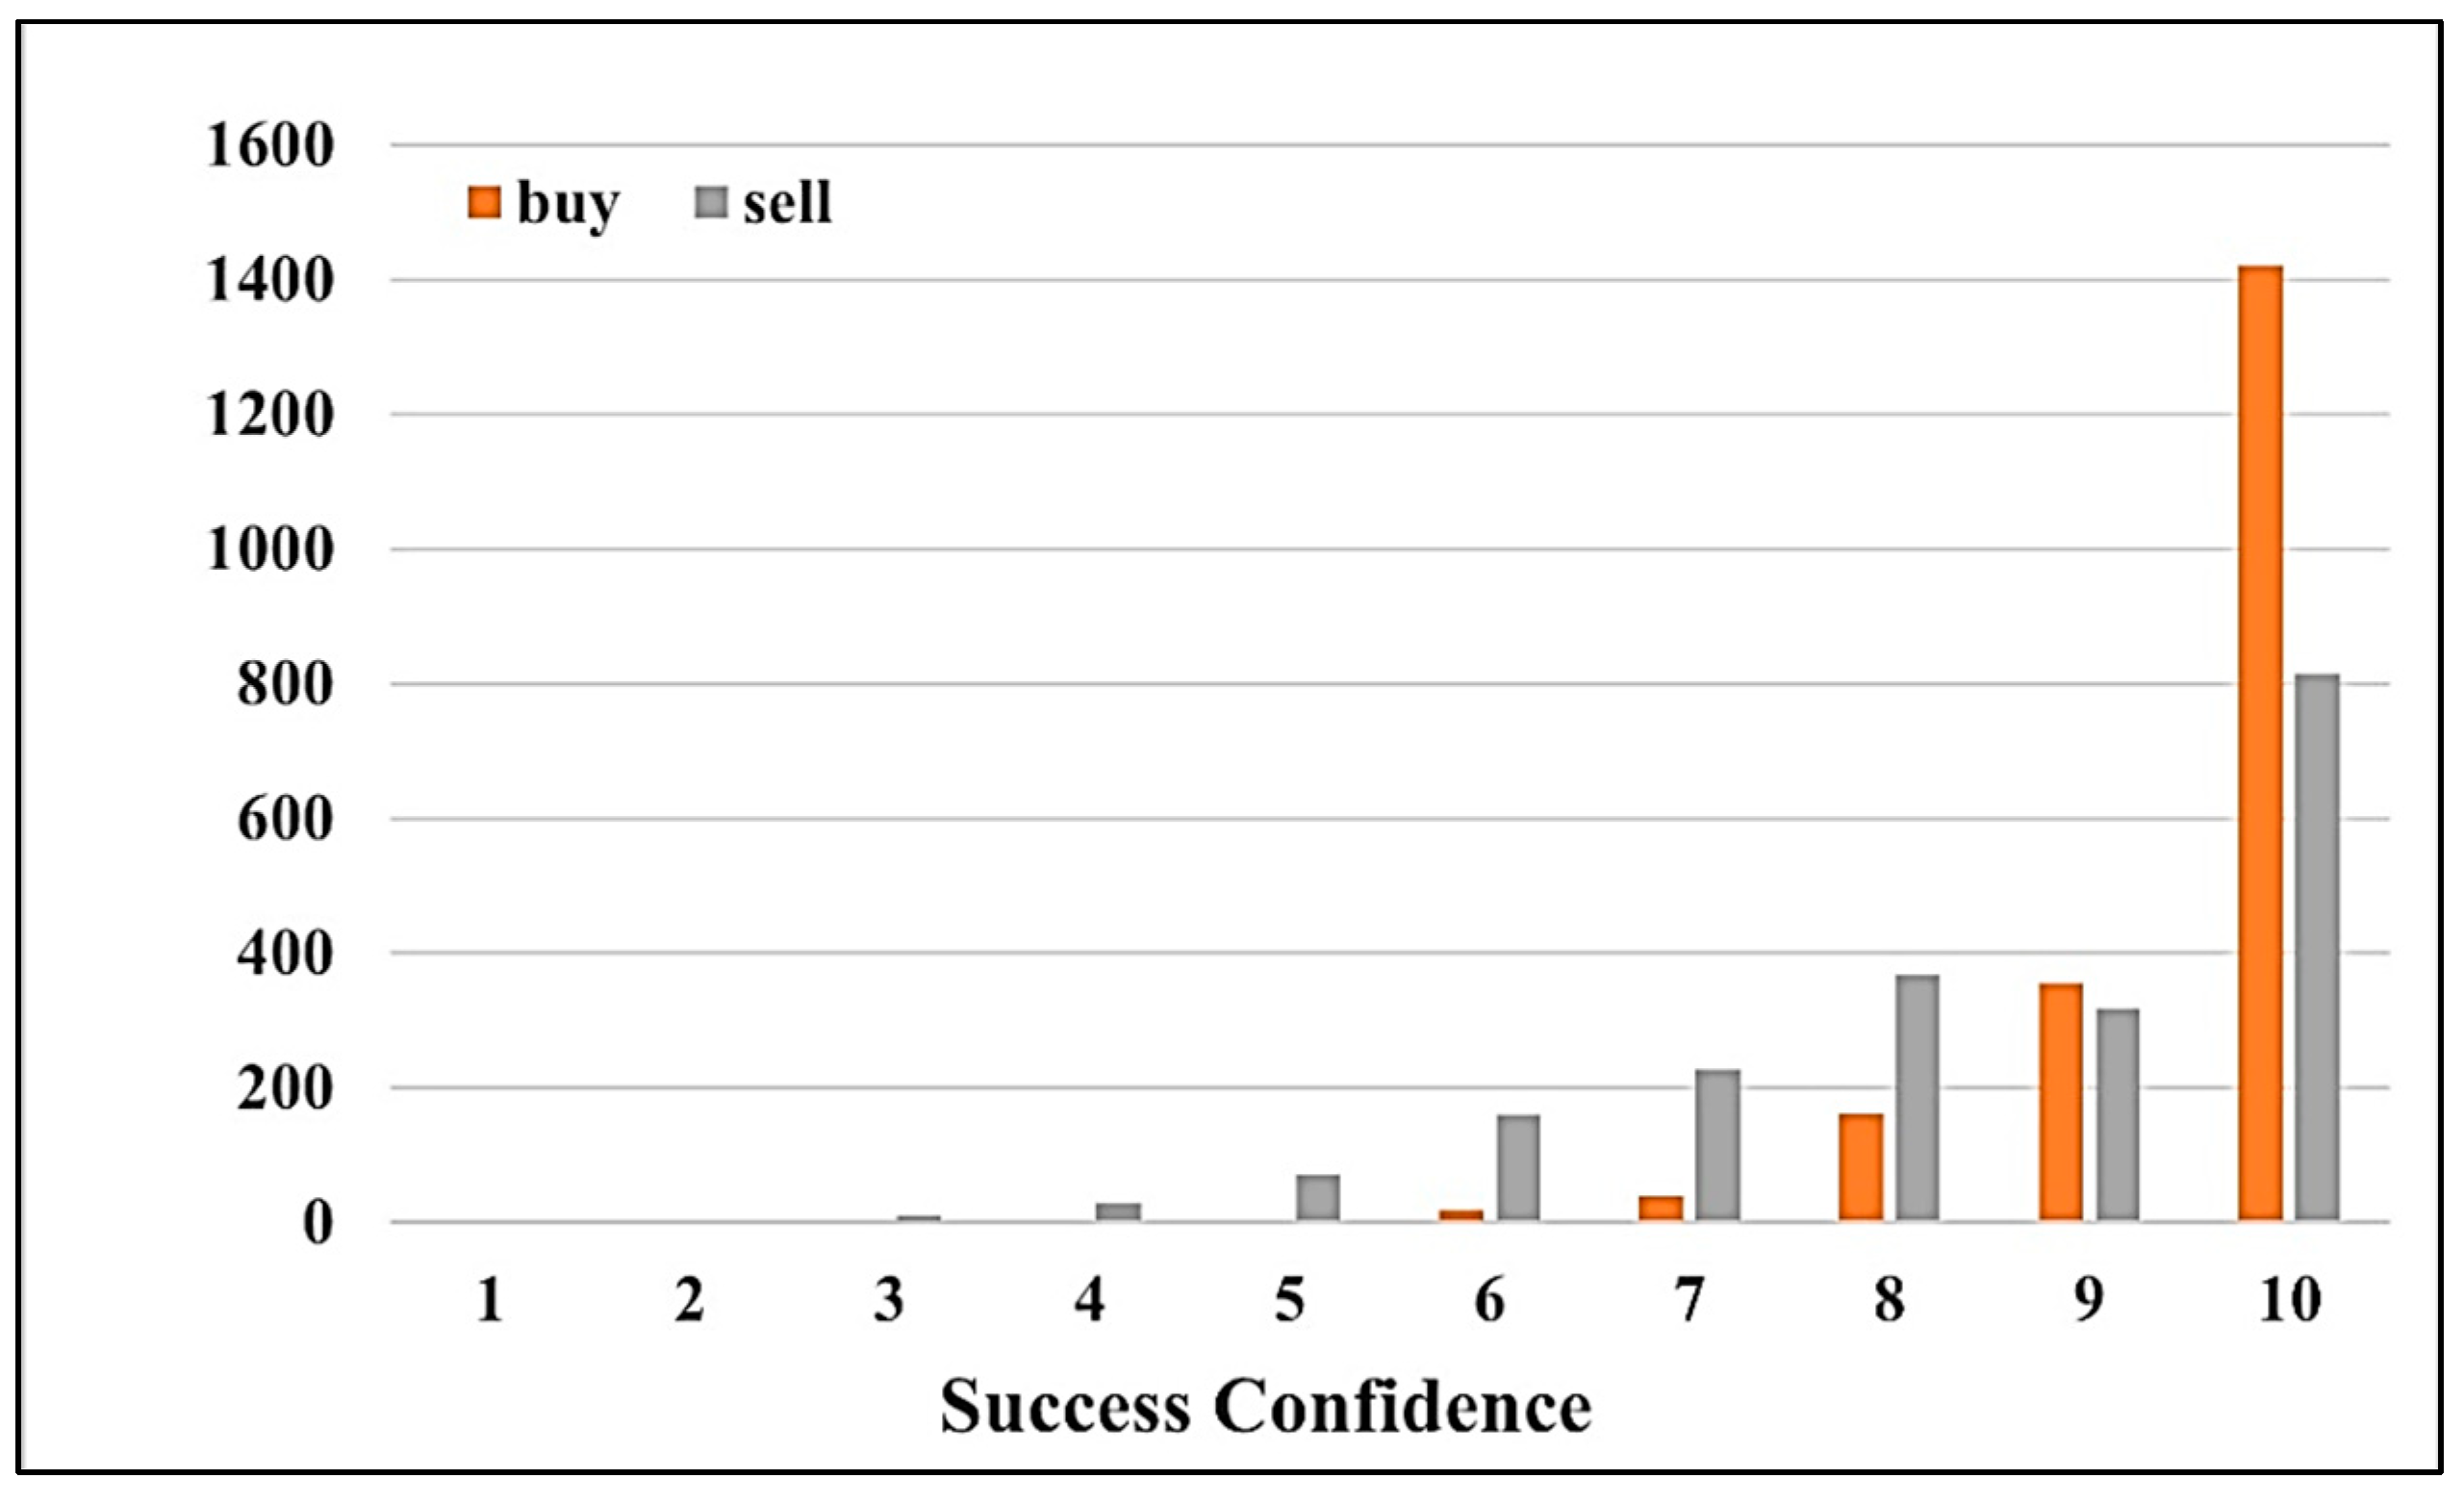
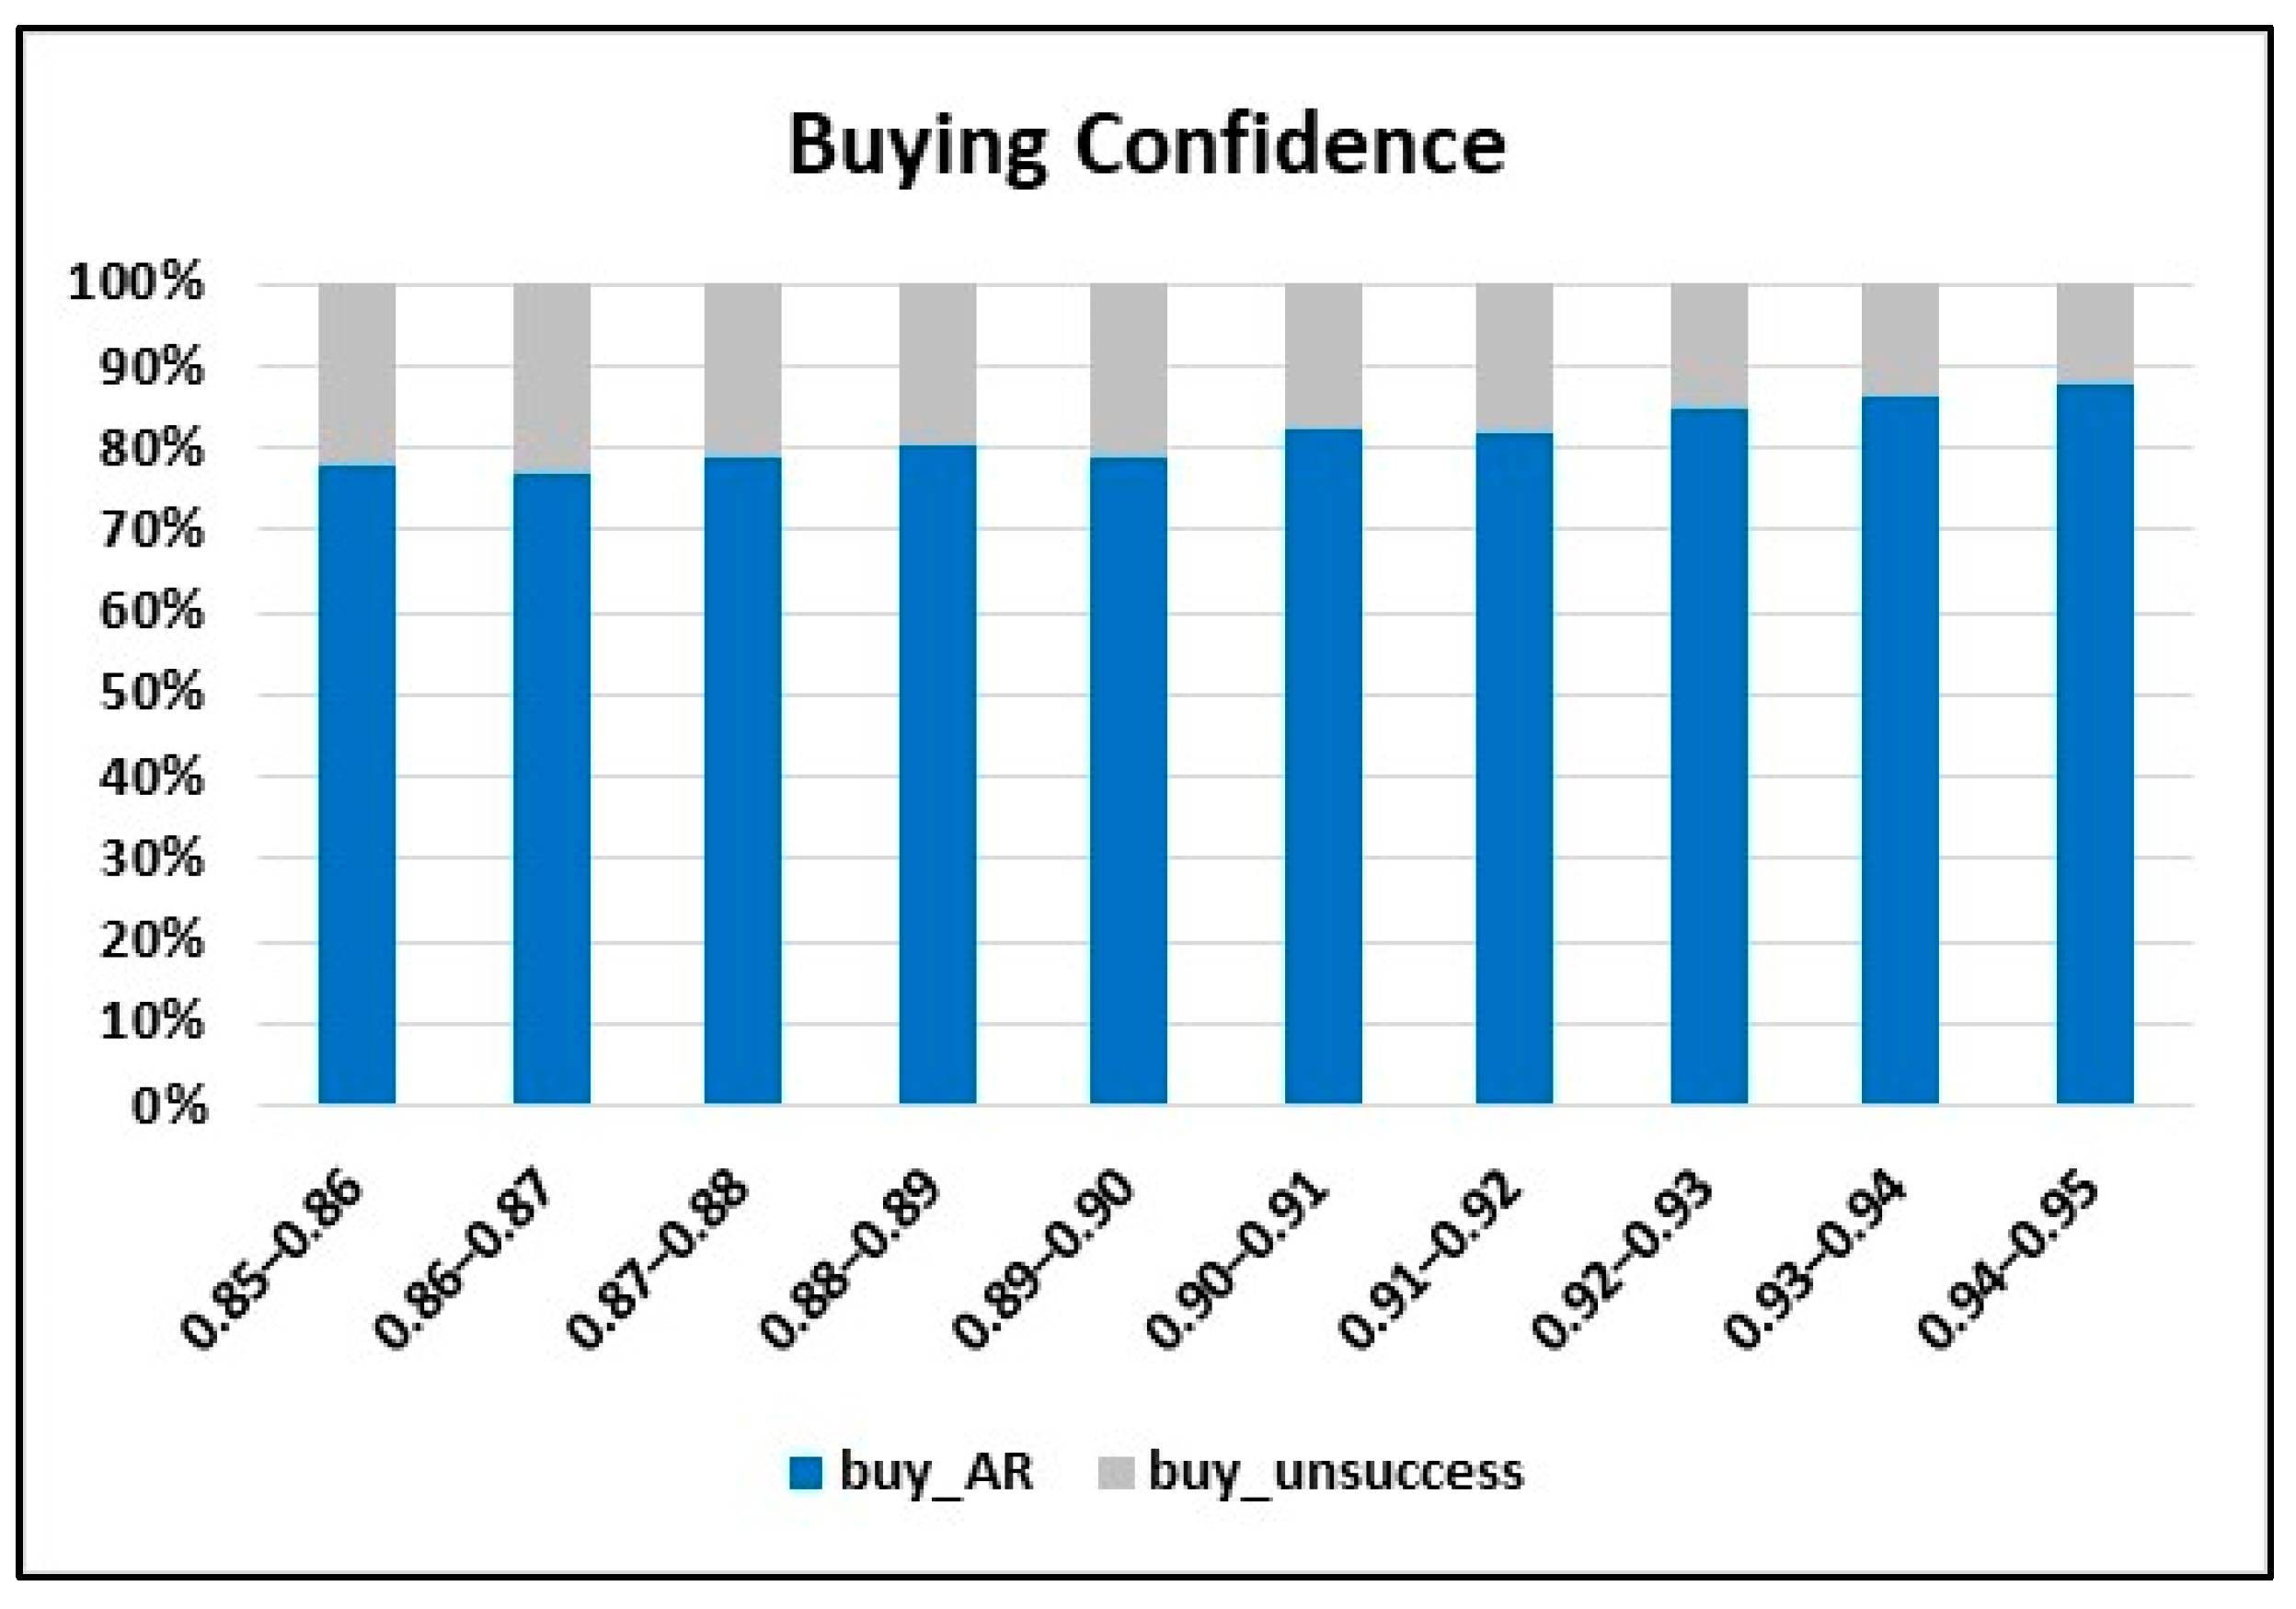
4.2.1. Relationship between Buying Success Confidence and Bid Price

When the data on the purchasing sentiment and the success in winning bids were broken down, the confidence data between 0.86 and 0.95 led to a 78.51–88.35 percent accuracy. This shows the consistency in the purchase confidence. There is an obvious correlation with the number of the winning bids, as shown in Table 8, which can be seen more clearly in the chart in Figure 9.

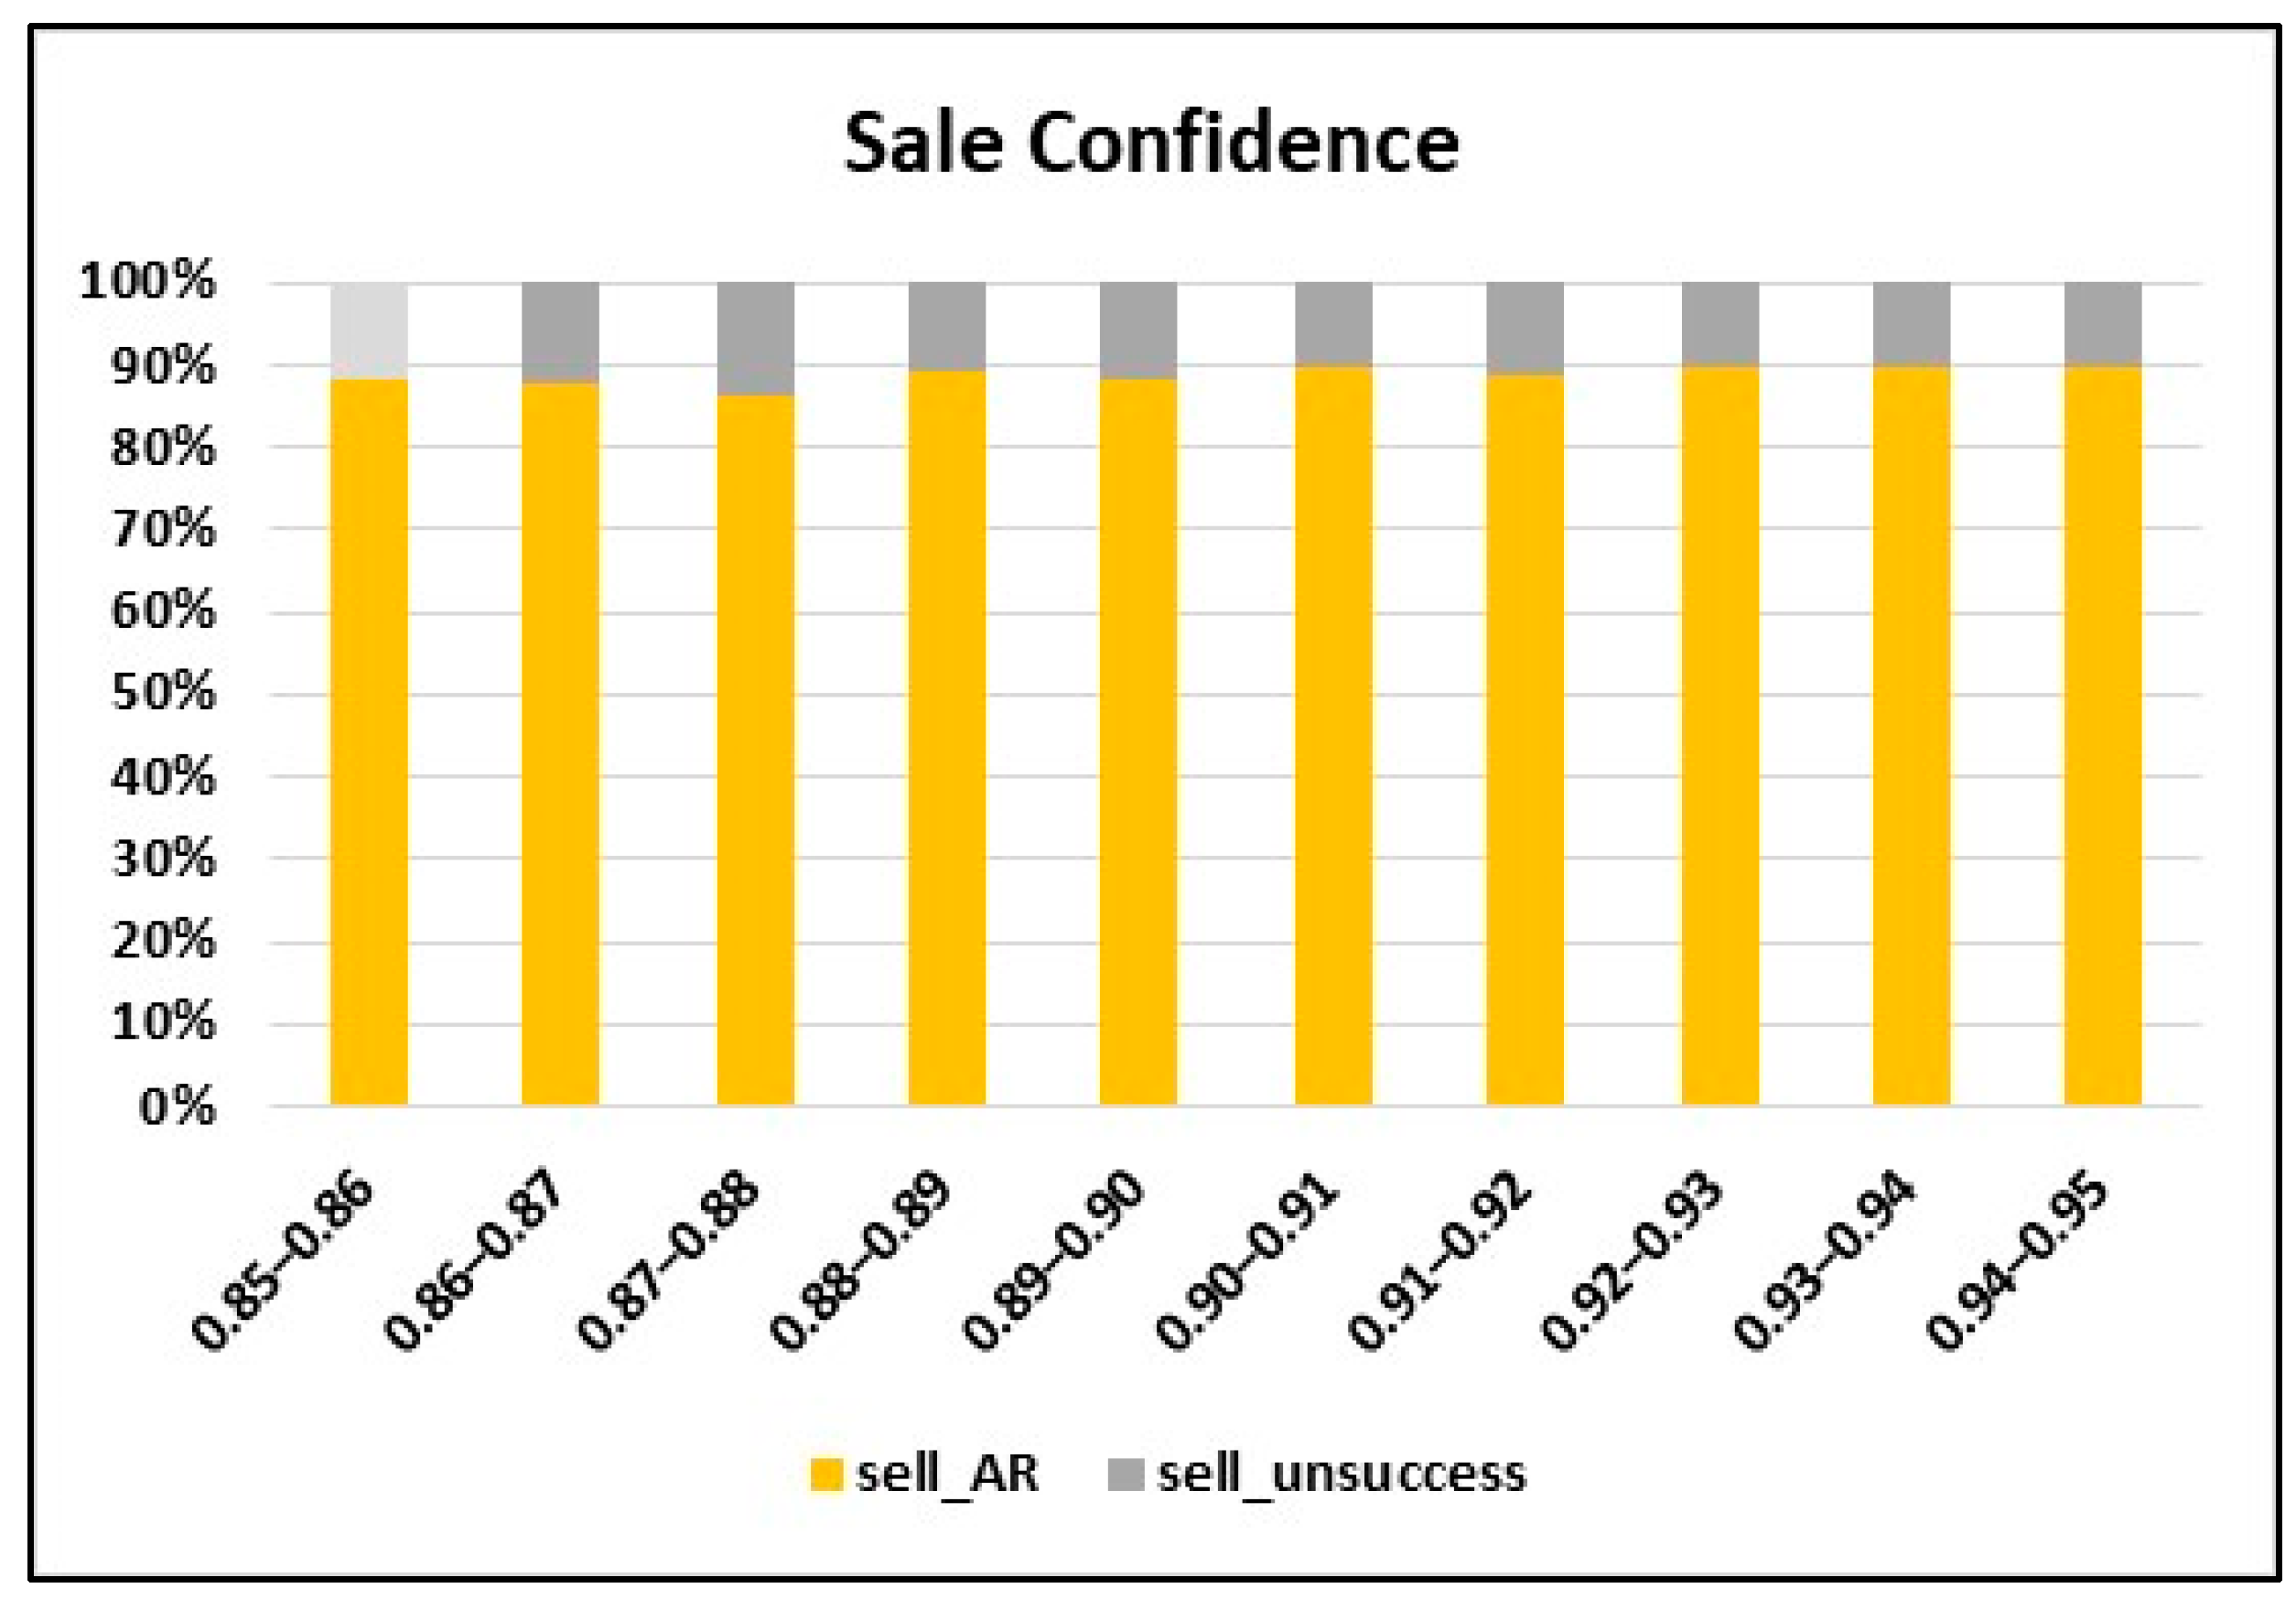
4.2.2. Relationship between Sales Success Confidence and the Offer Price

When the data on the selling sentiment and the success in winning bids were broken down, the confidence data between 0.86 and 0.95 led to 87.11–90.00 percent accuracy. This shows the consistency in the sales confidence. There is an obvious correlation with the number of the winning bids, as shown in Table 9, which can be seen more clearly in the chart in Figure 10.

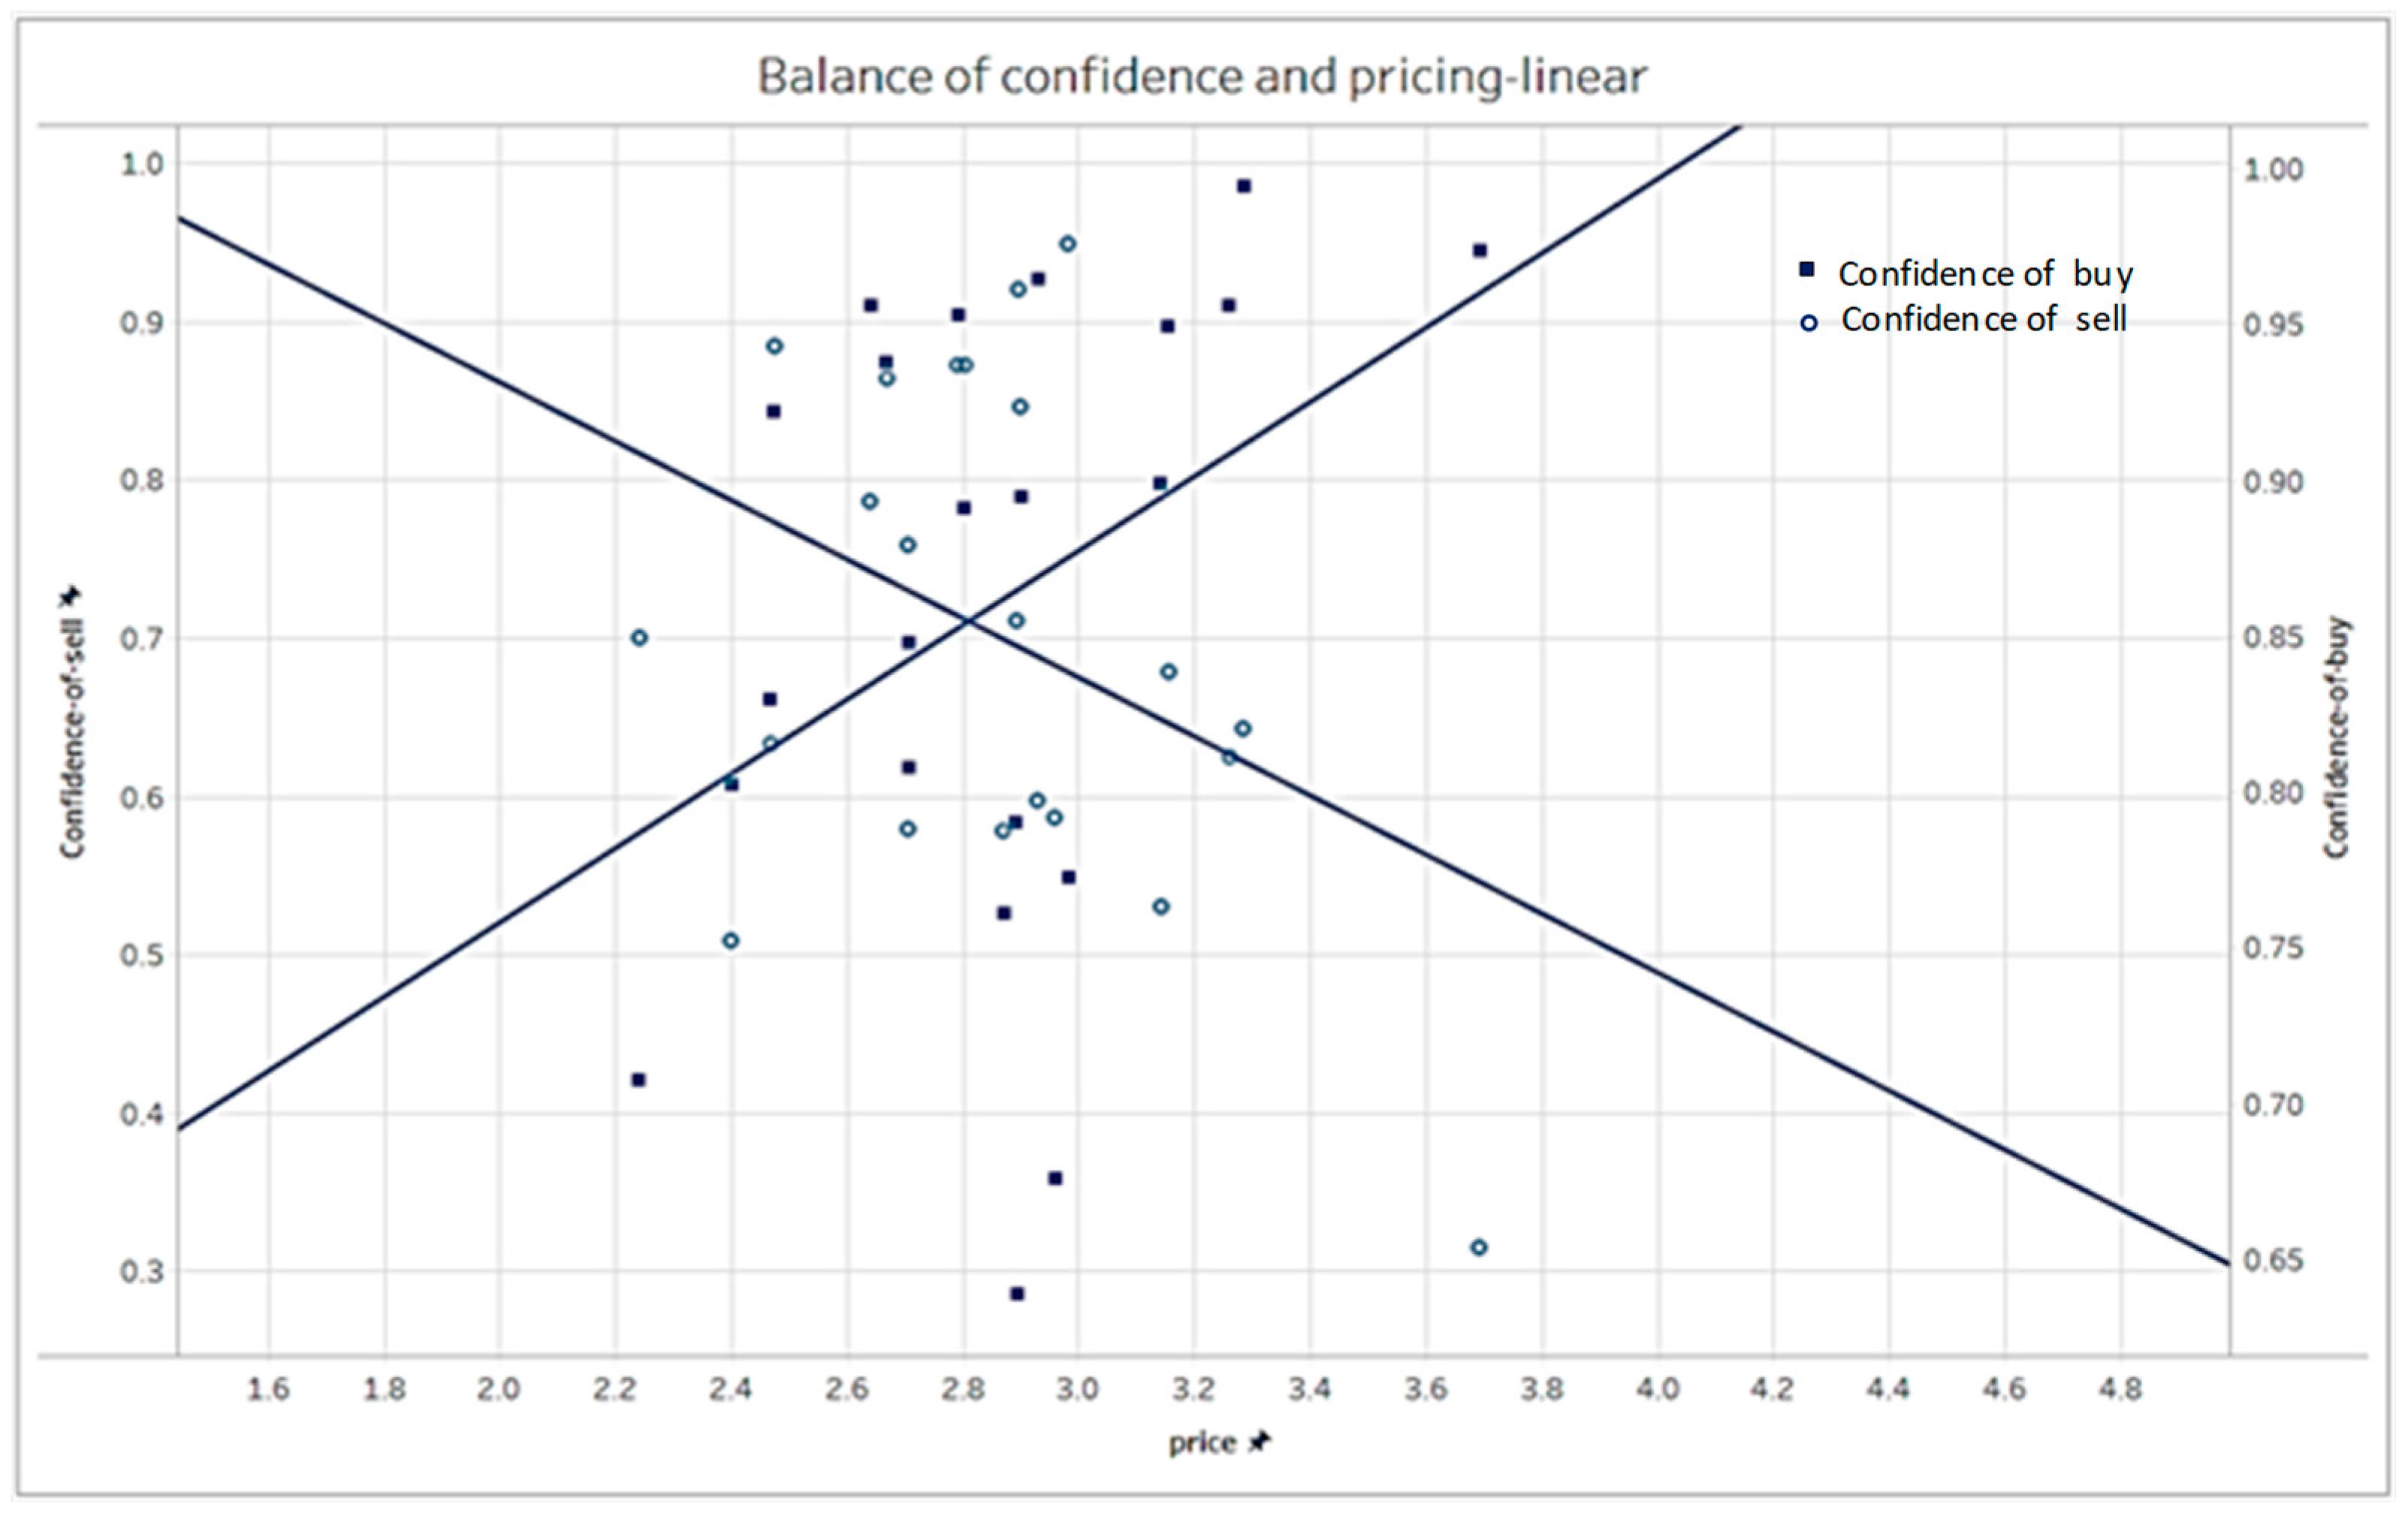
4.2.3. The Trend of the Relationship between Price and Sentiment for N Houses

The scatter plots in Figure 11 display the selling and the buying prices on the horizontal axis with their confidence on the vertical axis. According to the trendlines, from the buyer’s view, when the buyers offer low prices, they have low buying confidence. But if they pay more attention to buying at higher prices, their buying confidence will increase. On the other hand, from the seller’s view, when the sellers offer low prices, their sales confidence is high. When the sellers want to sell at higher prices, their sales confidence will decrease. It is evidently seen that the intersection point of both trendlines, which represents the equilibrium price at the equilibrium state, is approximately THB 2.8 per unit.
The P2P free-trade model for N houses tested by the bipartite graph method revealed the buyer relationship and buying behavior, which helps to identify how successful each buyer is. The statistical purchase success rates are between 0.86% and 0.95% with an accuracy between 77.62% and 88.35%. Similarly, the model can also give insights into seller relationships and selling behavior, which can be used to predict sales opportunities from past sales behavior. The successful sales statistic values are between 0.86% and 0.95% with an accuracy between 87.84% and 90.00%. Moreover, the equilibrium price, which was derived by using the demand and supply law and the bipartite graph method, was THB 2.78 per kWh.

5. Discussion

According to the four-house and the N-house double-auction data simulations, the results of the tested P2P pricing model agreed with each other and their trendlines went in the same direction. Those models were also verified by the proven results from demand and supply theory and bipartite graph theory. This can be expressed as: more goods on the supply side leads to the lower price of those goods on the market. In other words, the lack of products results in their higher price. Moreover, the buying confidence will rise with higher prices, and if the purchasing price is high, the buying confidence is also increased. In addition, when the demand for a product is high, the price of the product will rise, and the price of the product will decrease if there is less demand for it. In terms of sales confidence, the chances of sales success will vary inversely with the offered prices. If the offered price for sale is high, the chances of winning the auction or confidence in the sale will decrease, while if the bidding price is low, the sales confidence will increase.
Both models have consistency in terms of price trends, but they still cannot point out the right price. Indeed, the bipartite graph method is the backbone for the buyer and the seller’s estimated prices to be used in the competition. With the bipartite graph principle, P2P trading gives confidence in the trading, increasing the chances of winning bids and the chances of winning auction sales. The result showed that the equilibrium price was 2.78 THB/kWh. Given that the regulated price that suppliers can sell their electrical energy produced from solar energy is 2.20 THB/kWh (as shown in Table 1) and consumers must pay about 3.27 to 4.51 THB/kWh for their used energy (as shown in Table 2), the suppliers can increase their income by 0.58 THB/kWh, while the consumers can decrease their energy expense by about 0.49 to 1.73 THB/kWh. Therefore, it can be concluded that both suppliers and consumers will obtain more advantages from participating in this P2P model such as increasing incomes and decreasing expenses, respectively. In addition, this will help both buyers and sellers offer the right price due to the mechanism of a truly free market, which will cause true fairness in the sustainable electricity supply chain industry in Thailand. The findings of this study are consistent with those of the previous reports [2].
Once the regulated price is cheaper than the price determined in P2P transactions, consumers will have no willingness to participate in the transaction. However, according to the demand and supply law, consumers normally still want to pay less than that regulated price, while the suppliers, who want to sell their goods, will also cut their margins off, which leads to the lower selling price. Therefore, the equilibrium price in P2P transactions will change to another lower price, which is lower than the regulated price again. Then, both suppliers and consumers still obtain advantages such as gaining profits and saving expenses, respectively.
In addition, the P2P trading platform will not have any participants in the transactions if the Thai government announces a policy that will promote the very high regulated buying price and subsidize the regulated selling price in the electricity market. That means the suppliers will be willing to sell their produced electricity to EGAT to gain very high profits, while the consumers will prefer to buy electricity directly from the grid instead of the suppliers. This phenomenon will not sustain the social, environmental, or economic aspects. Finally, when the government does not have the money to finance the policy, the regulated prices will return to the real regulated prices, and then P2P transactions will be active again.

6. Beneficially Practical Implications of Economic Pricing in P2P Electrical Trading for a Sustainable Electricity Supply Chain Industry (SESCI) in Thailand: Social, Environment, and Economic Aspects

Nowadays, the electrical energy industry in Thailand is necessary for the country’s developments in many areas such as trade, industry, communication, and housing, which are related to the direction of growth and the country’s economy. The planning to determine the direction of development at the country’s policy level in electric power is very important for long-term sustainable developments in the future, especially in the three cores of sustainability, i.e., society, environment, and economics [46,47]. The important issues are used in the planning to determine the policy direction, i.e., the consideration of controlling the amount of demand and supply sides of energy use and production together. This method can be used to study and analyze the elements from the electricity supply chain from upstream, including the procurement of electrical energy, to midstream, including producers, and all the way to downstream, including consumers [2]. It consists of five main processes in the electrical industry, i.e., (1) fuel procurement, (2) electricity production, (3) the electrical transmission system, (4) electricity transportation in the distribution system, and (5) electrical retail. The benefits of the studied P2P electrical trading platform on those five processes in the field of social, environmental, and economic areas are shown in Table 10.

7. Conclusions, Limitations, and Future Work

The peer-to-peer trading systems that exist today continue to focus on creating trading platforms. Some of them focus on managing electrical power in the system to be worthwhile and sufficient for all users in the system, while there are few works that explain the upcoming price mechanism. The results of this study revealed two key findings as discussed below.

7.1. Explaining the Price Mechanism

When there is completely competitive buying and selling, it was discovered that it actually followed the law of supply and demand. But that method could not determine if it would win or lose in the race. Therefore, the bipartite graph theory calculation was applied as a tool to determine the chances and the probability of buying success and the probability of a successful sale and to find out the right price to win the auction.

7.2. The Appropriate Price at the Equilibrium Point

Whether the models were proved by the demand and supply theory or the bipartite graph method, the prices at the equilibrium point were approximately the same, in this case, it was about THB 2.78 per unit. This kind of price mechanism is useful for biding a satisfactory price and offering a reasonable price in term of buyers and sellers, respectively. Compared with the current single-buyer monopoly market, the results of this study showed that the price of electrical energy per unit was much cheaper. We believe that if the studied system is adapted, it will be fair for all stakeholders in electrical energy trading.
However, there are some limitations in this research. The model testing is predicated on the idea that the total amount of power in the system needs to have sufficient volume. But if the supply is not enough, the behaviors of the buyers and the sellers in the auction system will change. Nevertheless, the market will reach equilibrium anyway. In addition, it is important to investigate the potential increase in the distribution network costs in the event that renewable energy prices become more competitive and peer-to-peer electricity trading becomes more active in the future, as well as the service charge of the brokers and the stakeholders. Moreover, in order to attain the desired benefits, P2P electricity trading techniques, which are varied, probably need to be tailored in accordance with the target distribution systems, such as on islands, villages, or distant places. Therefore, while it is worthwhile to conduct additional research into the P2P electricity trading mechanisms of future distribution systems, it is also necessary to develop designed guidelines, platforms, government policies, and regulations for these mechanisms.

Author Contributions

Conceptualization, A.L. and Y.S.; methodology, A.L., T.W. and Y.S.; software, A.L., T.W. and Y.S.; validation, A.L. and Y.S.; formal analysis, A.L., T.W. and Y.S.; investigation, A.L. and Y.S.; resources, T.W.; data curation, T.W.; writing—original draft preparation, A.L., T.W. and Y.S.; writing—review and editing, A.L. and Y.S.; visualization, A.L., T.W. and Y.S.; supervision, A.L. and Y.S.; project administration, A.L. and Y.S. All authors have read and agreed to the published version of the manuscript.

Funding

This research received no external funding, and the APC was funded by Mahidol University.

Data Availability Statement

The double-auction bidding random data, the success confidence in buying and selling data, and figures and tables, as well as the simulation input files, are available upon request.

Conflicts of Interest

The authors declare that this research was conducted in the absence of any commercial or financial relationships that could be construed as a potential conflict of interest.

References

  1. ERC. Establishment of the Energy Regulatory Commission. Available online: https://www.erc.or.th/en/history-page (accessed on 15 July 2023).
  2. Leelasantitham, A. A Business Model Guideline of Electricity Utility Systems Based on Blockchain Technology in Thailand: A Case Study of Consumers, Prosumers and SMEs. Wirel. Pers. Commun. 2020, 115, 3123–3136. [Google Scholar] [CrossRef]
  3. ERC. Establishment of the Energy Regulatory Commission. Available online: https://www.erc.or.th/en/power-purchasing3/2697 (accessed on 30 September 2022).
  4. MEA. Type 1 Residential Service. Available online: https://www.mea.or.th/en/our-services/tariff-calculation/other/-yosbxMGAjzp0 (accessed on 2 August 2023).
  5. Wongsamerchue, T.; Leelasantitham, A. An Electronic Double Auction Prepaid Electricity Trading Using Blockchain Technology. J. Mob. Multimed. 2022, 18, 1829–1850. [Google Scholar] [CrossRef]
  6. Baig, M.J.A.; Iqbal, M.T.; Jamil, M.; Khan, J. Design and implementation of an open-Source IoT and blockchain-based peer-to-peer energy trading platform using ESP32-S2, Node-Red and, MQTT protocol. Energy Rep. 2021, 7, 5733–5746. [Google Scholar] [CrossRef]
  7. Bandara, K.Y.; Thakur, S.; Breslin, J. Flocking-based decentralised double auction for P2P energy trading within neighbourhoods. Int. J. Electr. Power Energy Syst. 2021, 129, 106766. [Google Scholar] [CrossRef]
  8. Khorasany, M.; Dorri, A.; Razzaghi, R.; Jurdak, R. Lightweight blockchain framework for location-aware peer-to-peer energy trading. Int. J. Electr. Power Energy Syst. 2021, 127, 106610. [Google Scholar] [CrossRef]
  9. Park, B.R.; Chung, M.H.; Moon, J.W. Becoming a building suitable for participation in peer-to-peer energy trading. Sustain. Cities Soc. 2022, 76, 103436. [Google Scholar] [CrossRef]
  10. Huang, T.; Sun, Y.; Jiao, M.; Liu, Z.; Hao, J. Bilateral energy-trading model with hierarchical personalized pricing in a prosumer community. Int. J. Electr. Power Energy Syst. 2022, 141, 108179. [Google Scholar] [CrossRef]
  11. Wongthongtham, P.; Marrable, D.; Abu-Salih, B. Blockchain-enabled Peer-to-Peer energy trading. Comput. Electr. Eng. 2021, 94, 107299. [Google Scholar] [CrossRef]
  12. Dorahaki, S.; Rashidienjad, M.; Ardestani, S.F.F.; Abdollahi, A.; Salehizadeh, M.R. A Peer-to-Peer energy trading market model based on time-driven prospect theory in a smart and sustainable energy community. Sustain. Energy Grids Netw. 2021, 28, 100542. [Google Scholar] [CrossRef]
  13. Hu, Q.; Zhu, Z.; Bu, S.; Li, F. A multi-market nanogrid P2P energy and ancillary service trading paradigm: Mechanisms and implementations. Appl. Energy 2021, 293, 116938. [Google Scholar] [CrossRef]
  14. Leong, C.H.; Gu, C.; Li, F. Auction Mechanism for P2P Local Energy Trading considering Physical Constraints. Energy Procedia 2019, 158, 6613–6618. [Google Scholar] [CrossRef]
  15. Esmat, A.; de Vos, M.; Ghiassi-Farrokhfal, Y.; Palensky, P.; Epema, D. A novel decentralized platform for peer-to-peer energy trading market with blockchain technology. Appl. Energy 2021, 282, 116123. [Google Scholar] [CrossRef]
  16. Mengelkamp, E.; Garttner, J.; Rock, K.; Kessler, S.; Orsini, L. Designing microgrid energy markets: A case study: The Brooklyn Microgrid. Appl. Energy 2018, 210, 870–880. [Google Scholar] [CrossRef]
  17. Umar, A.; Kumar, D.; Ghose, T. Blockchain-based decentralized energy intra-trading with battery storage flexibility in a community microgrid system. Appl. Energy 2022, 322, 119544. [Google Scholar] [CrossRef]
  18. Zeng, X.; Liu, L.; Leung, S.; Du, J.; Wang, X.; Li, T. A decision support model for investment on P2P lending platform. PLoS ONE 2017, 12, e0184242. [Google Scholar] [CrossRef] [PubMed]
  19. Khorasany, M.; Gazafroudi, A.S.; Razzaghi, R.; Morstyn, T.; Shafie-khah, M. A framework for participation of prosumers in peer-to-peer energy trading and flexibility markets. Appl. Energy 2022, 314, 118907. [Google Scholar] [CrossRef]
  20. Azim, M.I.; Tushar, W.; Saha, T.K. Cooperative negawatt P2P energy trading for low-voltage distribution networks. Appl. Energy 2021, 299, 117300. [Google Scholar] [CrossRef]
  21. PankiRaj, J.S.; Yassine, A.; Choudhury, S. An Auction Mechanism for Profit Maximization of Peer-to-Peer Energy Trading in Smart Grids. Procedia Comput. Sci. 2019, 151, 361–368. [Google Scholar] [CrossRef]
  22. López-García, D.A.; Torreglosa, J.P.; Vera, D. A decentralized P2P control scheme for trading accurate energy fragments in the power grid. Int. J. Electr. Power Energy Syst. 2019, 110, 271–282. [Google Scholar] [CrossRef]
  23. Han, D.; Zhang, C.; Ping, J.; Yen, Z. Smart contract architecture for decentralized energy trading and management based on blockchains. Energy 2020, 199, 117417. [Google Scholar] [CrossRef]
  24. Görgülü, H.; Topcuogla, Y.; Yaldiz, A.; Gökcek, T.; Erding, O. Peer-to-peer energy trading among smart homes considering responsive demand and interactive visual interface for monitoring. Sustain. Energy Grids Netw. 2022, 29, 100584. [Google Scholar] [CrossRef]
  25. Liu, Y.; Ma, H.; Jiang, Y.; Li, Z. Learning to recommend via random walk with profile of loan and lender in P2P lending. Expert Syst. Appl. 2021, 174, 114763. [Google Scholar] [CrossRef]
  26. Taleizadeh, A.A.; Safaei, A.Z.; Bhattacharya, A.; Amjadian, A. Online peer-to-peer lending platform and supply chain finance decisions and strategies. Ann. Oper. Res. 2022, 315, 397–427. [Google Scholar] [CrossRef]
  27. Zhou, Y.; Wu, J.; Song, G.; Long, C. Framework design and optimal bidding strategy for ancillary service provision from a peer-to-peer energy trading community. Appl. Energy 2020, 278, 115671. [Google Scholar] [CrossRef]
  28. Kong, K.G.H.; Lim, J.Y.; Leong, W.D.; Ng, W.P.Q.; Teng, S.Y.; Sunarso, J.; How, B.S. Fuzzy optimization for peer-to-peer (P2P) multi-period renewable energy trading planning. J. Clean. Prod. 2022, 368, 133122. [Google Scholar] [CrossRef]
  29. Zhou, W.; Wang, Y.; Peng, F.; Liu, Y.; Sun, H. Distribution network congestion management considering time sequence of peer-to-peer energy trading. Int. J. Electr. Power Energy Syst. 2022, 136, 107646. [Google Scholar] [CrossRef]
  30. Chen, Y.; Lei, X.; Yang, J.; Zhong, H.; Huang, T. Decentralized P2P power trading mechanism for dynamic multi-energy microgrid groups based on priority matching. Energy Rep. 2022, 8, 388–397. [Google Scholar] [CrossRef]
  31. Kanakadhurga, D.; Prabaharan, N. Demand response-based peer-to-peer energy trading among the prosumers and consumers. Energy Rep. 2021, 7, 7825–7834. [Google Scholar] [CrossRef]
  32. Suryono, R.R.; Purwandari, B.; Budi, I. Peer to Peer (P2P) Lending Problems and Potential Solutions: A Systematic Literature Review. Procedia Comput. Sci. 2019, 161, 204–214. [Google Scholar] [CrossRef]
  33. Xu, S.; Zhao, Y.; Li, Y.; Zhou, Y. An iterative uniform-price auction mechanism for peer-to-peer energy trading in a community microgrid. Appl. Energy 2021, 298, 117088. [Google Scholar] [CrossRef]
  34. Lin, J.; Pipattanasomporn, M.; Rahman, S. Comparative analysis of auction mechanisms and bidding strategies for P2P solar transactive energy markets. Appl. Energy 2019, 255, 113687. [Google Scholar] [CrossRef]
  35. Zheng, B.; Wie, W.; Chen, Y.; Wu, Q.; Mei, S. A peer-to-peer energy trading market embedded with residential shared energy storage units. Appl. Energy 2022, 308, 118400. [Google Scholar] [CrossRef]
  36. Yahaya, A.S.; Javaid, N.; Alzahrani, F.A.; Rehman, A.; Ullah, I.; Shahid, A.; Shafiq, M. Blockchain Based Sustainable Local Energy Trading Considering Home Energy Management and Demurrage Mechanism. Sustainability 2020, 12, 3385. [Google Scholar] [CrossRef]
  37. Lohachab, A.; Garg, S.; Kang, B.H.; Amin, M.B. Performance evaluation of Hyperledger Fabric-enabled framework for pervasive peer-to-peer energy trading in smart Cyber–Physical Systems. Future Gener. Comput. Syst. 2021, 118, 392–416. [Google Scholar] [CrossRef]
  38. An, J.; Hong, T.; Lee, M. Development of the business feasibility evaluation model for a profitable P2P electricity trading by estimating the optimal trading price. J. Clean. Prod. 2021, 295, 126–138. [Google Scholar] [CrossRef]
  39. Wu, Y.; Cimen, H.; Vasquez, J.C.; Guerrero, J.M. P2P energy trading: Blockchain-enabled P2P energy society with multi-scale flexibility services. Energy Rep. 2022, 8, 3614–3628. [Google Scholar] [CrossRef]
  40. Zhang, M.; Eliassen, F.; Taherkordi, A. Demand–Response Games for Peer-to-Peer Energy Trading With the Hyperledger Blockchain. IEEE Trans. Syst. Man Cybern. Syst. 2021, 52, 19–31. [Google Scholar] [CrossRef]
  41. Zhang, C.; Yang, T.; Wang, Y. Peer-to-Peer energy trading in a microgrid based on iterative double auction and blockchain. Sustain. Energy Grids Netw. 2021, 27, 100524. [Google Scholar] [CrossRef]
  42. Zhang, H.; Zhao, H.; Liu, Q.; Chen, E.; Huang, X. Finding potential lenders in P2P lending: A Hybrid Random Walk Approach. Inf. Sci. 2018, 432, 376–391. [Google Scholar] [CrossRef]
  43. Suryono, R.R.; Budi, I.; Purwandari, B. Detection of fintech P2P lending issues in Indonesia. Heliyon 2021, 7, e06782. [Google Scholar] [CrossRef] [PubMed]
  44. W3Schools. Python Random Module. Available online: https://www.w3schools.com/python/module_random.asp (accessed on 15 March 2022).
  45. Sukma, N.; Leelasantitham, A. A community sustainability ecosystem modeling for water supply business in Thailand. Front. Environ. Sci. 2022, 10, 940955. [Google Scholar] [CrossRef]
  46. Sukma, N.; Leelasantitham, A. From conceptual model to conceptual framework: A sustainable business framework for community water supply businesses. Front. Environ. Sci. 2022, 10, 1013153. [Google Scholar] [CrossRef]
  47. Wu, Z.; Wang, J.; Zhong, H.; Gao, F.; Pu, T.; Tan, C.; Chen, X.; Li, G.; Zhou, M.; Xia, Q. Sharing Economy in Local Energy Markets. J. Mod. Power Syst. Clean Energy 2023, 11, 714–726. [Google Scholar] [CrossRef]
Figure 1. The current structure of the Thai electricity industry.
Energies 17 01220 g001
Figure 2. Decentralized trading structure model [2].
Energies 17 01220 g002
Figure 3. The 4-house P2P electrical energy trading model [5].
Energies 17 01220 g003
Figure 4. Bipartite relationship in selling. The letters S, B, and t stand for selling, buying, and transaction, respectively, while the numbers 1, 2, 3, and 4 represent the house number. The blue, orange, and green colors represent the matched transactions from the seller numbers 1, 2, and 3, respectively.
Energies 17 01220 g004
Figure 5. Bipartite relationship in buying. The letters S, B, and t stand for selling, buying, and transaction, respectively, while the numbers 1, 2, 3, and 4 represent the house number. The blue, orange, and green colors represent the matched transactions from the buyer numbers 1, 2, and 3, respectively.
Energies 17 01220 g005
Figure 6. Example data obtained by uniform random sampling in an auction. The red color represents the offer prices and the amount of energy for selling, while the black color represents the bidding prices for buying.
Energies 17 01220 g006
Figure 7. Relationship between price and quantity when n = 4.
Energies 17 01220 g007
Figure 8. Success frequencies in buying and selling.
Energies 17 01220 g008
Figure 9. Buying confidence chart.
Energies 17 01220 g009
Figure 10. Sales confidence chart.
Energies 17 01220 g010
Figure 11. Buying–selling confidence equilibrium point.
Energies 17 01220 g011
Table 1. EGAT’s electrical energy purchasing price.
Energy SourceUnit Price (Baht/kWh)
Solar Energy
          Rooftop2.20
          On ground2.16
Wind Energy3.10
Waste
          VSPP5.08
          SPP3.66
Biomass2.79
Biogas3.57
Table 2. PEA and MEA electrical energy selling price (ladder method).
Consumer TypeNo.Unit RangeUnit Price (THB/kWh)Monthly Fee (THB)Average Unit Price with Monthly Fee (THB)
Group 1
<150 kWh/Month
1.11–152.34888.192.5417
1.216–252.98828.193.3689
1.326–353.24058.193.6464
1.436–1003.62378.193.6813
1.5101–1503.71718.193.7947
1.6151–4004.22188.194.2388
1.7More than 4004.42178.194.4661
Group 2
>150 kWh/Month
2.11–1503.248438.223.2717
2.2151–4004.221838.224.2392
2.3More than 4004.421738.224.5172
Table 3. Related research works on energy trading platforms.
ResearchersHighlightsMethodsResultsLimitations
Wongsamerchue et al. [5]Double auction prepaid-tradingDouble auctionCase studyFour-peer case study
Baig et al. [6]Microgrid energy marketsImplementationTrading platformRemote area; no pricing optimization
Bandara et al. [7]Neighborhood energy tradingDouble auctionTrading algorithmNo pricing optimization
Khorasany et al. [8]Participation of prosumersProof of locationCost reduction by 17.09%Needs smart meter and pricing model
Park et al. [9]Building suitabilityBuilding capabilityguidelinesEnergy management
Huang et al. [10]Energy trading modelADMMDecrease 5.11%No pricing optimization o confidential trade
Wongthongtham et al. [11]Increasing scalabilityScalabilityScalabilityNo technical details Implementation and pricing mechanism
Dorahaki et al. [12]Energy trading modelDiscount impactSatisfaction of userOnly win–win situation
Hu et al. [13]High level of efficiencyMaximize profitsPower sharingPricing optimization
Leong et al. [14]Considering physical constraintsGame theoryBidding strategyNot Include Economic Pricing
Esmat et al. [15]Ant colony optimizationAnt colonyEfficient market solutionUncertain prosumer commitment
Mengelkamp et al. [16]Balancing supply and demandFrameworkCase studyNo pricing optimizatoin or confidential trade
Umar et al. [17]Energy trading with battery storageFrameworkSelf-sustainabilityHourly based trading; no auction mechanism
Zeng et al. [18]Model for investmentLogistic classificationHigher efficiencyNo auction or pricing optimization
Khorasany et al. [19]Anonymous proof of locationDistribution systemLightweight FWNo pricing mechanism
Azim et al. [20]Voltage regulationCoalition gameFeasibilitySmall-sized prosume; no pricing optimizatoin
Table 4. Related research works on pricing optimization.
ResearchersHighlightsMethodsResultsLimitations
PankiRaj et al. [21]Profit maximizationSealed bid auctionHigh profit returnSingle side auction with no confidential condition
López-García et al. [22]Power balance in gridSplitting the energyScalabilityAccuracy and efficiency of devices
Han et al. [23]Energy trading and managementBalancing profitsEfficiencyNeed to develop platform
Görgülü et al. [24]Energy management systemPriority matchingDomestic modelsOnly smart home applied
Liu et al. [25]Profile of loan and lenderP2P lendingEffectivenessNo upper and lower limit price
Taleizadeh et al. [26]Finance decisions and strategiesP2P lendingOptimal strategiesDeterministic demand and financial SC
Zhou et al. [27]Optimal bidding strategyResidual balancingCritically reviewedNo auctionor confidential mechanism
Kong et al. [28]Fuzzy optimizationFuzzy setsCarbon emission reducion of 61%Single-step trading mechanism
Zhou et al. [29]Congestion managementCost allocationProfit increaseNo auction or confidential mechanism
Chen et al. [30]Mechanism for dynamic multi-energyIMMGSEffectivenessNo auction and confidential mechanism
Kanakadhurga et al. [31]Demand response-based P2PParticle swarmCost reductionConfidential trading needed
Suryono et al. [32]P2P lending issues in IndonesiaNoneSolutionsLiterature review
Xu et al. [33]Auction mechanismAMSASaving costsUniform clearing price
Table 6. Comparison of the results from other research studies and this work.
ResearchP2PEnergyTrading PlatformAuction MethodPricing OptimizationDemand and Supply Economic LawConfidential TradingBenefits and Contribution to SESCI
[6,8,12,13,17,18,19,20]-----
[5,7,9,10,11,14,16,27]----
[25,26,28,29,30]---
[22,23,24,31]----
[33,34,38,41]---
[37,44]----
This work
Table 7. Buying and selling prices with the amount of demand and supply in the system.
DemandSupply
THB/kWhHouse AHouse BTotalHouse CHouse DTotal
5.001.500.503.008.5014.0020.00
4.003.003.007.006.5011.0015.00
3.004.507.5011.005.007.5010.00
2.007.009.0015.004.503.005.00
1.0010.0010.0019.002.000.500.00
Table 8. Distribution of buying sentiment and the number of winning bids.
Buying confidence0.860.870.880.890.900.910.920.930.940.95
Buying success322326390325432497671568699910
All bidding4104204904005306108006708101030
Unsuccessful21.4622.3820.4118.7518.4918.5216.1315.2213.7011.65
AR78.5477.6279.5981.2581.5181.4883.8884.7886.3088.35
Table 9. Distribution of selling sentiment and the number of winning bids.
Sales confidence0.860.870.880.890.900.910.920.930.940.95
Sales success325392354388259160251278224162
All bidding370450400440280180280310250180
Unsuccessful12.1612.8911.5011.8210.7111.1110.3610.3210.4010.00
AR87.8487.1188.5088.1889.2988.8989.6489.6889.6090.00
Table 10. Benefits of the P2P platform on the electricity supply chain in social, environmental, and economic areas.
Existing Processes of the Electrical Supply ChainBeneficially Practical Implications of Economic Pricing in P2P Electrical Trading for Sustainable Electricity Supply Chain Industry in Thailand
SocialEnvironmentEconomics
(1) Fuel procurementParticipation in regulating electrical energy prices.Lowering fuel transportation or restricting gas pipeline installations helps diminish the overall environmental impact on the surrounding areas.Reducing expenses on importing fuel and natural gas.
(2) Electricity productionThe electrical power generation from PV system is simple and user-friendly, empowering communities to self-educate and install it themselves.Using clean energy for power generation decreases pollutant emissions.Possible to develop a business that supplies equipment for PV system installations at the community level.
(3) Electrical transmission systemFlexibility in the installation and utilization of local microgrids helps diminish reliance on centralized electricity transmission.Implementing community microgrid systems diminishes the demand for nationwide transmission system installations, leading to less intrusion into forested areas and mitigated environmental impacts.Microgrids improve the electrical system’s stability and dependability, resulting in less compensations due to power outages and blackouts in the local area.
(4) Electricity transportation in the distribution systemThere is adaptability in handling energy management at the community level, contributing to a decrease in reliance on central energy management.Clean energy-produced electricity, devoid of pollutants, contributes to establishing a Green Community identity.By deploying microgrids, electricity losses in the transmission system are reduced, allowing for the highest possible revenue from electricity sales.
(5) Electrical retailUtilizing peer-to-peer (P2P) platforms can enhance the reputation and support the sustainability of community-based electricity sales business.It involves creating a sustainable awareness that encourages community members to understand the importance of environmental conservation, pollution reduction, and mitigating the impact of the greenhouse effec on both the local populace and the entire nation.Establishing electricity prices that are fair and appropriate for stakeholder based on the supply and demand economic law. Income from selling electricity will be directed back into the community to enhance local economic growth.
Disclaimer/Publisher’s Note: The statements, opinions and data contained in all publications are solely those of the individual author(s) and contributor(s) and not of MDPI and/or the editor(s). MDPI and/or the editor(s) disclaim responsibility for any injury to people or property resulting from any ideas, methods, instructions or products referred to in the content.

