Article

Air Equalizing Mechanism in Cooling Performance Improvement of Vertical Delta-Type Radiators

1
CHN Energy Pingluo Power Co., Ltd., Shizuishan 753000, China
2
School of Energy and Power Engineering, Shandong University, Jing-Shi Road 17932#, Jinan 250061, China
*
Authors to whom correspondence should be addressed.
Energies 2024, 17(5), 1111; https://doi.org/10.3390/en17051111
Submission received: 11 January 2024 / Revised: 16 February 2024 / Accepted: 21 February 2024 / Published: 26 February 2024
(This article belongs to the Section J1: Heat and Mass Transfer)

Abstract

:
Based on the design and measured data of one actual tower, a three-dimensional numerical model for a natural draft dry cooling tower (NDDCT) was created and validated under constant heat load. This enabled the performance improvement mechanism of air equalizing on vertical delta-type radiators (VDRs) to be clarified by detailed analysis of key parameters, such as the exit water temperature, heat transfer coefficient, and mass airflow. Under the impact of typical ambient crosswind, all VDRs were retrofitted with air-side-equalizing devices. It was found that the exit water temperatures of the whole NDDCT decreased by 0.865 °C, 0.593 °C and 0.186 °C under the studied ambient crosswind speeds of 2.5 m/s, 4 m/s and 12 m/s, respectively. The performance improvement mechanism of air-side equalizing was investigated for three VDRs, which were located on the upwind, tower lateral, and downwind sides under crosswind impacts. Besides the studied VDRs, the performance of the neighboring VDRs behind them was also improved by the optimized aerodynamic field and the reduced hot wind recirculation around them. In addition, the average heat transfer coefficients of the VDRs were enhanced, which could lay the foundation for improving the cooling performance of thermodynamic devices with VDRs.

1. Introduction

A natural draft dry cooling tower (NDDCT) has reduced capacity if its flow field is distorted by the ambient crosswind. Many scholars have studied the influence of crosswind on NDDCTs. Zhao et al. [1] compared the ambient crosswind, atmosphere temperature, and other factors, and found that the cooling capacity of a NDDCT rapidly deteriorated with increasing wind speed. Wei et al. [2] indicated that the pressure difference of an NDDCT decreased, the hot plume was disrupted, and backflow occurred at the leading edge of the tower outlet. Ma et al. [3] revealed that crosswind caused secondary flow at the bottom of the tower and played the role of a wind-cover, which reduced the cooling capacity of the tower rapidly. Wang et al. [4] found that the separation area of the rear flow and swirling intensities of the mainstream vortices were critical factors. Wang et al. [5,6] proved through experiments and numerical simulations that crosswind had an influence on the air-flow field near the lateral and leeward sides of the tower and that only the windward sector worked normally under high wind speed.
Therefore, many scholars have put forward suggestions concerning the uneven flow field inside and outside the tower to reduce the impact of wind. One approach is to improve the distribution of the internal aerodynamic field by installing windbreak walls at the bottom of the NDDCT. The common types are three-leaf and cross-windbreak walls [7], and their mechanism is to eliminate the vortex in the tower generated by the crosswind [8]. And this effect is more obvious as the wind velocity increases. It has been found that the orientation between the windbreak walls and the crosswind also has an influence [9,10]. In addition, the optimization of the windbreak wall structure is also the focus of research. Discontinuous walls and some new types of windbreak walls have been shown to be beneficial to the cooling capacity of the tower [11,12,13].
Another method is to adjust the external aerodynamic field of the NDDCT by arranging air deflectors around the radiators. The air deflectors enhance the heat transfer on the lateral and leeward sides of the tower while expanding the favorable influence on the windward side [14,15]. Moreover, the change of crosswind direction only had a 10% effect on the NDDCT with air deflectors under high wind velocities [16]. Many scholars found that air deflectors not only affected the flow field outside the NDDCT, but also changed the airflow distribution in the deltas. Zhao et al. [17] pointed out that the cooling deltas’ air-inlet direction angle was reduced by installing air deflectors. And the cooling deltas severely affected by the crosswind had a 7% improvement in heat transfer performance under the effect of air deflectors [18]. Other scholars have studied the integrated application of windbreak walls and air deflectors, as well as new types of deflectors [19,20,21,22,23,24]. There are also some studies targeting aerodynamic field regulation by redesigning the tower shape [25,26]. The above research shows the importance of improving the aerodynamic field of the whole tower.
However, as a critical heat transfer element, the heat transfer characteristics and aerodynamic fields of cooling deltas are also a research focus. Kong et al. [27] investigated the detailed airflow and heat rejection of individual cooling deltas. Yang et al. [28] researched the aerodynamic field and temperature field of cooling deltas and found that the side deltas performed the worst under the influence of crosswinds. Ma et al. [29] found that a delta’s air-inlet deflection angle caused a difference in the performance of two columns in a delta. Li et al. [30] quantified the difference in terms of non-equilibrium temperature differences and indicated that the worsening of a leeward columns’ capacity led to an increase in the non-equilibrium temperature difference, which degraded NDDCT’s performance. Zhang et al. [31] analyzed the role of non-uniform flow on the cooling capacity and defined three partitions according to the degree of influence of the non-uniform flow on cooling capacity. Sharifullin et al. [32] studied four factors which may affect the cooling performance of cooling towers and pointed out that the non-uniform distribution of water and airflow is one reason for the reduction in cooling capacity.
To achieve a uniform cooling delta aerodynamic field, apart from the above-mentioned solution of adding air deflectors [16,17,18,21], air-side-equalizing devices can also be installed on the symmetry plane of cooling deltas. Most studies on crosswind ranges have mainly focused on wind velocities above 4 m/s [1,2,3,8,17,20,22,28,29,33,34,35]. And 12 m/s is the critical value for cooling tower performance deterioration [36]. According to a large number of studies, the deterioration degree is 32.5% when the wind velocity grows from 0 to 4 m/s, and 67.5% when it increases from 4 to 12 m/s [1,4,6,37,38,39,40]. Therefore, it is important to enhance the cooling capacity of NDDCTs at low wind speeds. In addition, the non-equilibrium temperature difference between the two cooling columns of each delta with the effect of crosswind is a key factor that degrades the cooling capacity of an NDDCT. Therefore, to enhance the cooling capacity of an NDDCT, it is efficient to install air-side-equalizing devices to even aerodynamic fields of cooling deltas.
This paper proposes an optimization method for installing air-side-equalizing devices in the symmetry plane of cooling deltas according to a patent [41]. Most previous studies have focused on the aerodynamic fluid control of the internal and external environment of the tower and lack analysis of the airflow near the key heat transfer elements. This paper aims to fill the above research gap by exploring the aerodynamic field methods of VDRs. In addition, this paper supplements the water temperature change of the scale of the sub-cooling column before and after air-side-equalizing and analyzes the influence of air-side-equalizing on a VDR’s aerodynamic field, ventilation and heat transfer coefficient. The improvements resulting from installing air-side-equalizing devices to the whole tower are studied at the annual average wind velocity and high wind velocity. The heat transfer enhancement mechanism was clarified by adding air-side-equalizing devices to representative cooling deltas on the upwind, lateral, and downwind sides of the cooling tower. This study may help to improve the optimal design of NDDCTs in practical engineering.

2. Methods

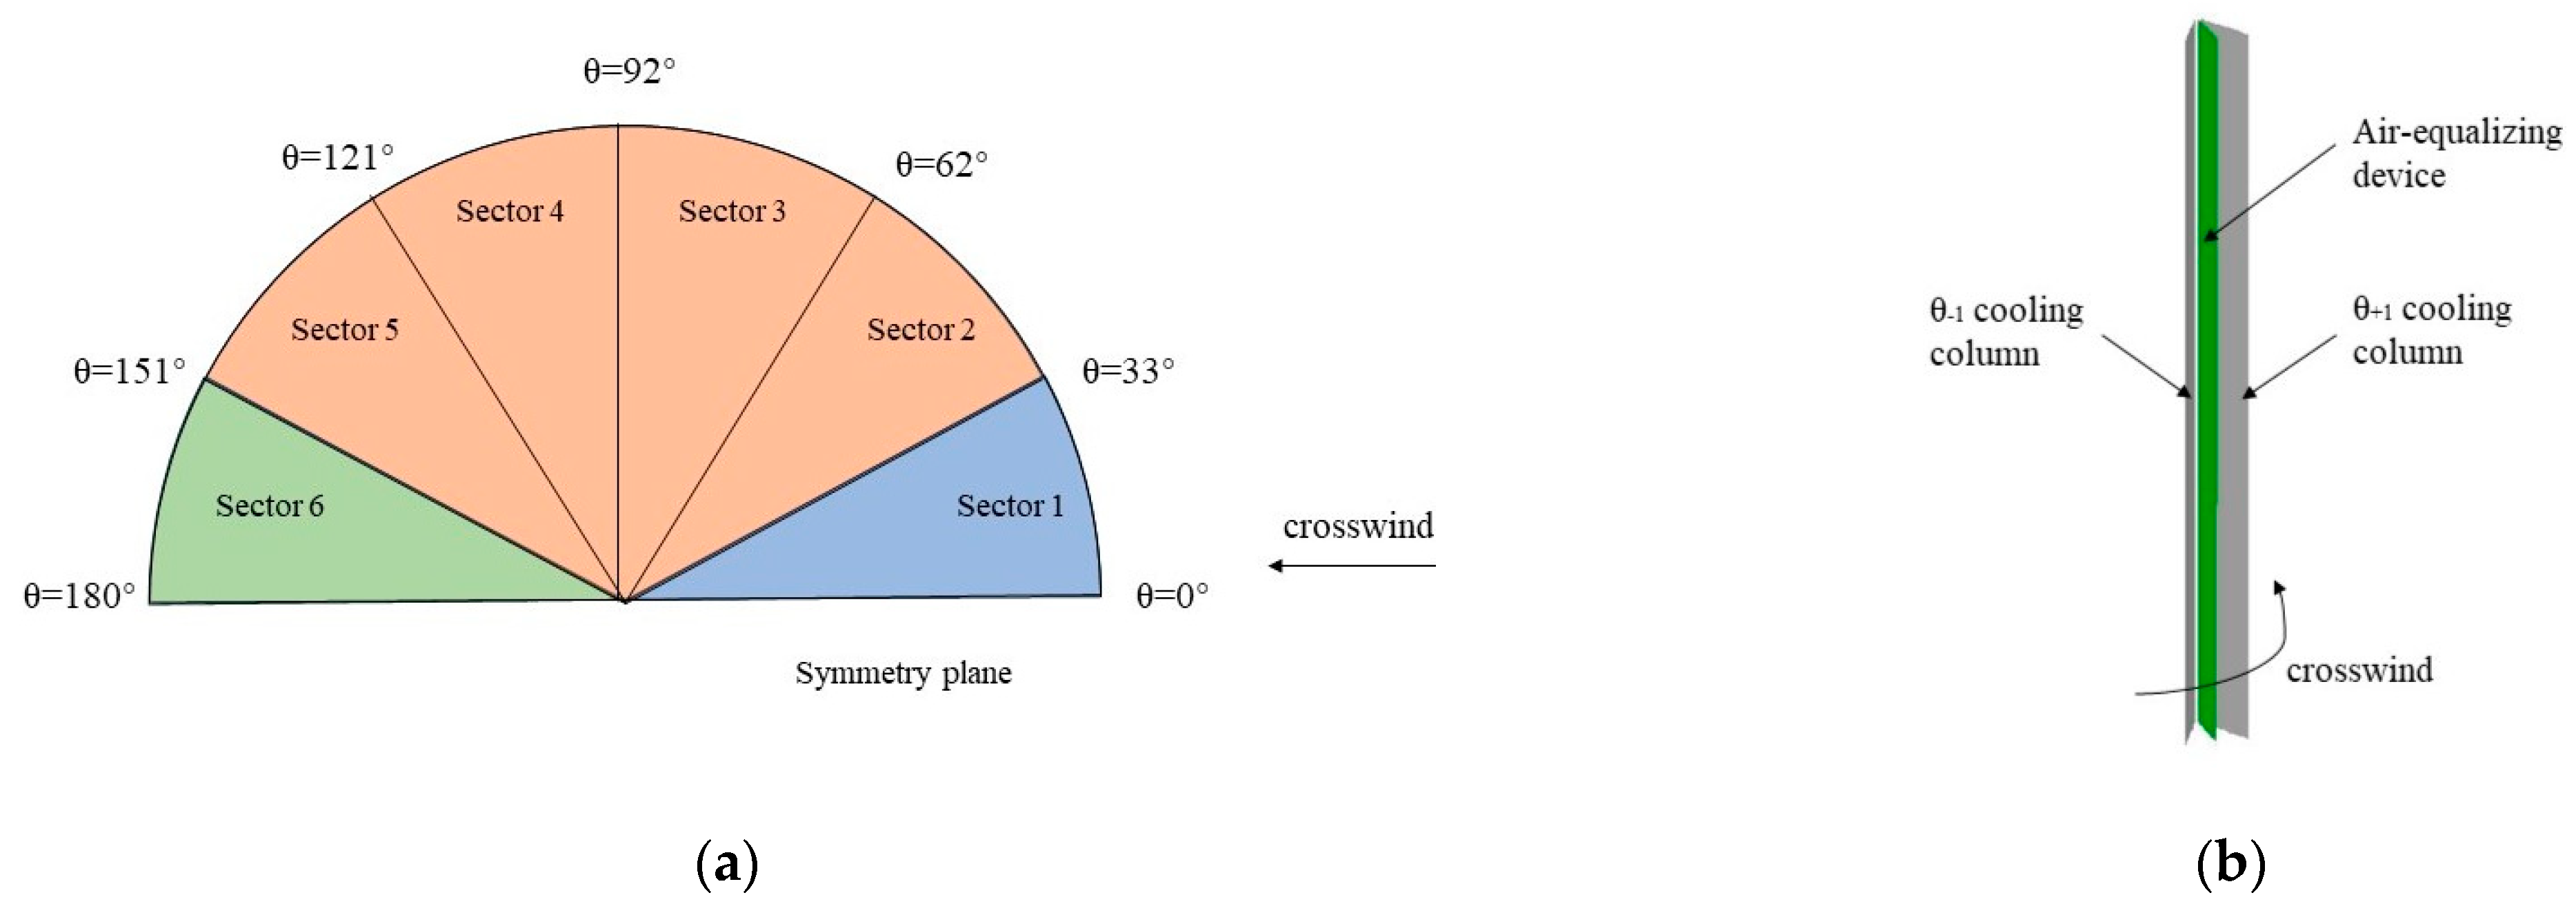
2.1. Geometric Model

The studied power plant has two 1000 MW generation units, each of which has one NDDCT installed. The parameters of the tower are shown in Figure 1. In total, 196 VDRs are arranged vertically around the bottom of the tower. Each delta is 28 m in height, 2.72 m in breadth, and 46° in apex angle. Under normal running conditions, the circulation water flow rate is 105,643 m3/h and is equally distributed in each delta. Because the real-life industrial cooling tower operates under steady-state conditions, the temperature of the whole tower hardly changes, always staying at 9.9 °C. The outlet water temperature of the tower changes with the variation in the inlet water temperature. Therefore, this research assumes a constant heat load to simulate the real-life operating process and to gain more accurate results.
Because an aerodynamic field distribution is symmetrical with a crosswind or without, this paper uses a half-tower model to investigate the working mechanism of air-side-equalizing devices. All VDRs are divided into six sectors along the wind direction, as shown in Figure 2a. The upwind sector in blue is Sector 1, the downwind sector in green is Sector 6, and the lateral sectors in orange are the other sectors. The circulating water flows into deltas along the outside bundles and flows out along the inside bundles. The delta’s structure and the position of the air-side-equalizing device is shown in detail in Figure 2b. The windward and leeward cooling columns are named θ + 1 and θ 1 columns, respectively, along the wind direction. The air-side-equalizing devices are set between the two columns and are 28 m in height, extending from the apex to the shutter. In the numerical simulation, the air-side-equalizing devices are considered a non-ventilated board with 0 m thickness.

2.2. Mathematical Equations

In the actual operation process, the NDDCT is affected by thermal resistance, environment changes and buildings. In order to reflect the real-life operation of the NDDCT and reduce the calculation difficulty, this article makes the following assumptions: (1) The cooling water has the same flow rate in each heat exchanger of the NDDCT, which means the cooling water is evenly distributed. (2) The opening degree of louvres is 100% in this study. Therefore, we ignore the influence of louvres on the aerodynamic field. (3) The thermal resistance in the convective heat transfer process does not exist, and the temperature of the heat exchanger wall is equal to that of the cooling water. (4) Based on Ref. [42], this article uses the water temperature drop to replace the constant heat load of the cooling system in the study power plant.
Utilizing computational fluid dynamics (CFD), numerical calculations were carried out. The variables of circulating water and the density of air are steady during the simulation. Therefore, this paper uses a time-averaged steady-state process to solve the problems. Atmospheric turbulence is simulated by the standard k ε model according to Ref. [43].
According to Ref. [33], the momentum, energy, continuity, etc., governing equations are as follows:
( ρ u j ) x j = 0 ,
( ρ u j u i ) x j = p x i + τ i j x i ρ β ( T a T r ) g i + R i ,
( u j T ) x j = x j [ ( δ + δ t ) T a x j ] + q h ,
( ρ u j k ) x j = x j [ ( v + v t σ k ) k x j ] + P + G ε ,
( ρ u j ε ) x j = x j [ ( v + v t σ ε ) ε x j ] + C 1 ε ε k ( P + G ) C 2 ε ε 2 k ,
In which, τ i j = ( μ + μ t ) S i j , P = v t S i j S j i , G = g β v t σ t T a z , ν t = C μ k 2 ε , S i j = ( u i x j + u j x i ) . In the above equations, x i is the Cartesian direction, and u i are velocity components along this direction. ρ , β , and T a represent the density, compressibility factor, and temperature of the atmosphere, respectively. g i is the gravity acceleration. S i j is the strain rate tensor. v , δ and μ are the molecular kinematic viscosity, molecular thermal diffusivity, and molecular dynamic viscosity of the air, respectively. R i and q h denote a source term in energy equation and momentum equation, respectively, in the z-axis direction. ε and k represent the turbulent dissipation and the turbulent kinetic energy, respectively. And C μ = 0.09 , C 1 ε = 1.44 , C 2 ε = 1.92 , σ k = 1.0 , σ ε = 1.3 , and σ t = 1.0 are constants of the standard k ε model.
We ignore the heat transfer thermal resistance in the realistic working process; that is, the heat dissipation of the water is equal to the heat absorption of air, and the water and wall temperature are the same. Therefore, the local heat transfer coefficient on the air side is used. The pressure drop and the heat transfer coefficient of the radiator were determined according to Ref. [44]:
Δ p = 14.37204 v n 1.64609 ,
h = 36.20587 v n 0.45583 ,
Since the parameters of the circulating water remain unchanged, it can be considered that circulating water flows in a steady state in the bundles. The heat dissipation rate of the micro-element control volume is expressed by Equation (8):
d Q = h ( T w T a ) A V d V ,

2.3. The CFD and Validation

2.3.1. Solution Method

The incompressible air in the model is solved using the Segregated method. The Reynolds time-averaged equation and energy equation are solved in second-order upwind differential format. For the diffusion term, the central difference method is still utilized. The pressure and velocity are coupled using the SIMPLE algorithm. Convergence is considered to occur when the residuals of each item are less than the convergence criteria, the continuous iteration is more than 200 steps, and the temperature change is less than 0.01 °C in the outlet water.

2.3.2. Boundary Conditions

In this study, a semi-cylindrical model including the tower and environment are established at a realistic scale. The model is 1000 m in height and 700 m in semi-diameter. The structure is shown in Figure 3a,b, which shows the boundary conditions settings of the model top and side with a crosswind or without. The symmetry plane is set as Symmetry. The ground, tower shell and delta wall are set as Wall.
Since the turbulence near the NDDCT is mainly due to the ambient crosswind bypass debris, assuming the Backflow Turbulent Intensity and the Backflow Turbulent Viscosity Ratio as 0.1% is more realistic, according to Ref. [45]. The Velocity Inlet boundary condition specifies the velocity distribution as a function of height by the following equation.
v y = v c ( z z c ) α ,
where v c is the reference speed; z c = 10 m, which is the reference height; and α = 0.2, which is the wind velocity profile index.
The air-side-equalizing devices are set as a Wall with a no-slip boundary condition. It is considered that this device only affects the aerodynamic field and does not participate in the heat transfer process.

2.3.3. Computing Mesh and Grid Study

Figure 4 shows the meshing of the model near the radiators in longitudinal sections. The model densifies the grid near the VDRs, and the grid size grows outward in a certain proportion. This paper uses grid systems with the following numbers of cells: 3,253,938, 3,755,643, and 4,910,584. According to Ref. [17], the relative error is the difference between the calculated and design exit water temperature divided by the design temperature difference of the circulating water. Under the same simulation conditions, the calculated value, temperature difference and relative error of the three grid systems are listed in Table 1. In the design condition, the exit water temperature is 28.5 °C. Although the grid system with 4,910,584 cells has the most accurate value compared with the design value, the grid system with 3,755,643 cells has both the fastest calculation speed and accurate result. Consequently, the grid system with 3,755,643 mesh cells is selected for calculation.

2.3.4. Model Validation

Some measured data are compared with the simulation results to ensure model validity. Table 2 lists the parameters specified in the real-time data. The listed parameters of C1 and C2 are from the real-time measurement data.
Under the C1 and C2 conditions, the power generation unit ran constantly and normally in the survey period, and the shutter opening was 100%. Because the scale of tower is too large, this research obtained the final measurements by averaging multiple measuring points. The data for the C1 and C2 conditions were measured on 9 April 2023 and 30 June 2019, respectively. The numerical results calculated by the model used in this paper are 35.32 °C and 45.03 °C, and the real measured values are 45.11 °C and 35.68 °C, respectively. The differences between the simulated and measured data are only 0.36 and 0.08 °C under these two measured conditions.
During operation, the thermal resistance would increase due to ageing and increased fouling of the equipment. Therefore, the above analyses prove that the results calculated by the model can reach the accuracy requirements, and the model and its simulation results are credible.
In addition, the data from the published references [17,28,46] were compared with the calculated data to further validate the numerical model, which has been clarified thoroughly by Zhao et al. [47].
During the process of calculation, the surface monitors observe the average water temperature of the outlet water surface. The computational iterations are converged when they satisfy the following convergence criteria: The outlet water temperature changes by less than 0.01 °C within 100 steps. All of the residuals are less than 10−4, and the residual of the energy equation is less than 10−6. The studied cases in this paper steadily converged after iterating 2100 steps from a reasonable initial solution. The results of this numerical model are reliable with good stability and convergence.

3. Results and Discussion

In this section, the effect of the air-side-equalizing device on NDDCT and VDRs and the heat transfer enhancement mechanism are analyzed under five sets of operating conditions at three typical wind velocities.

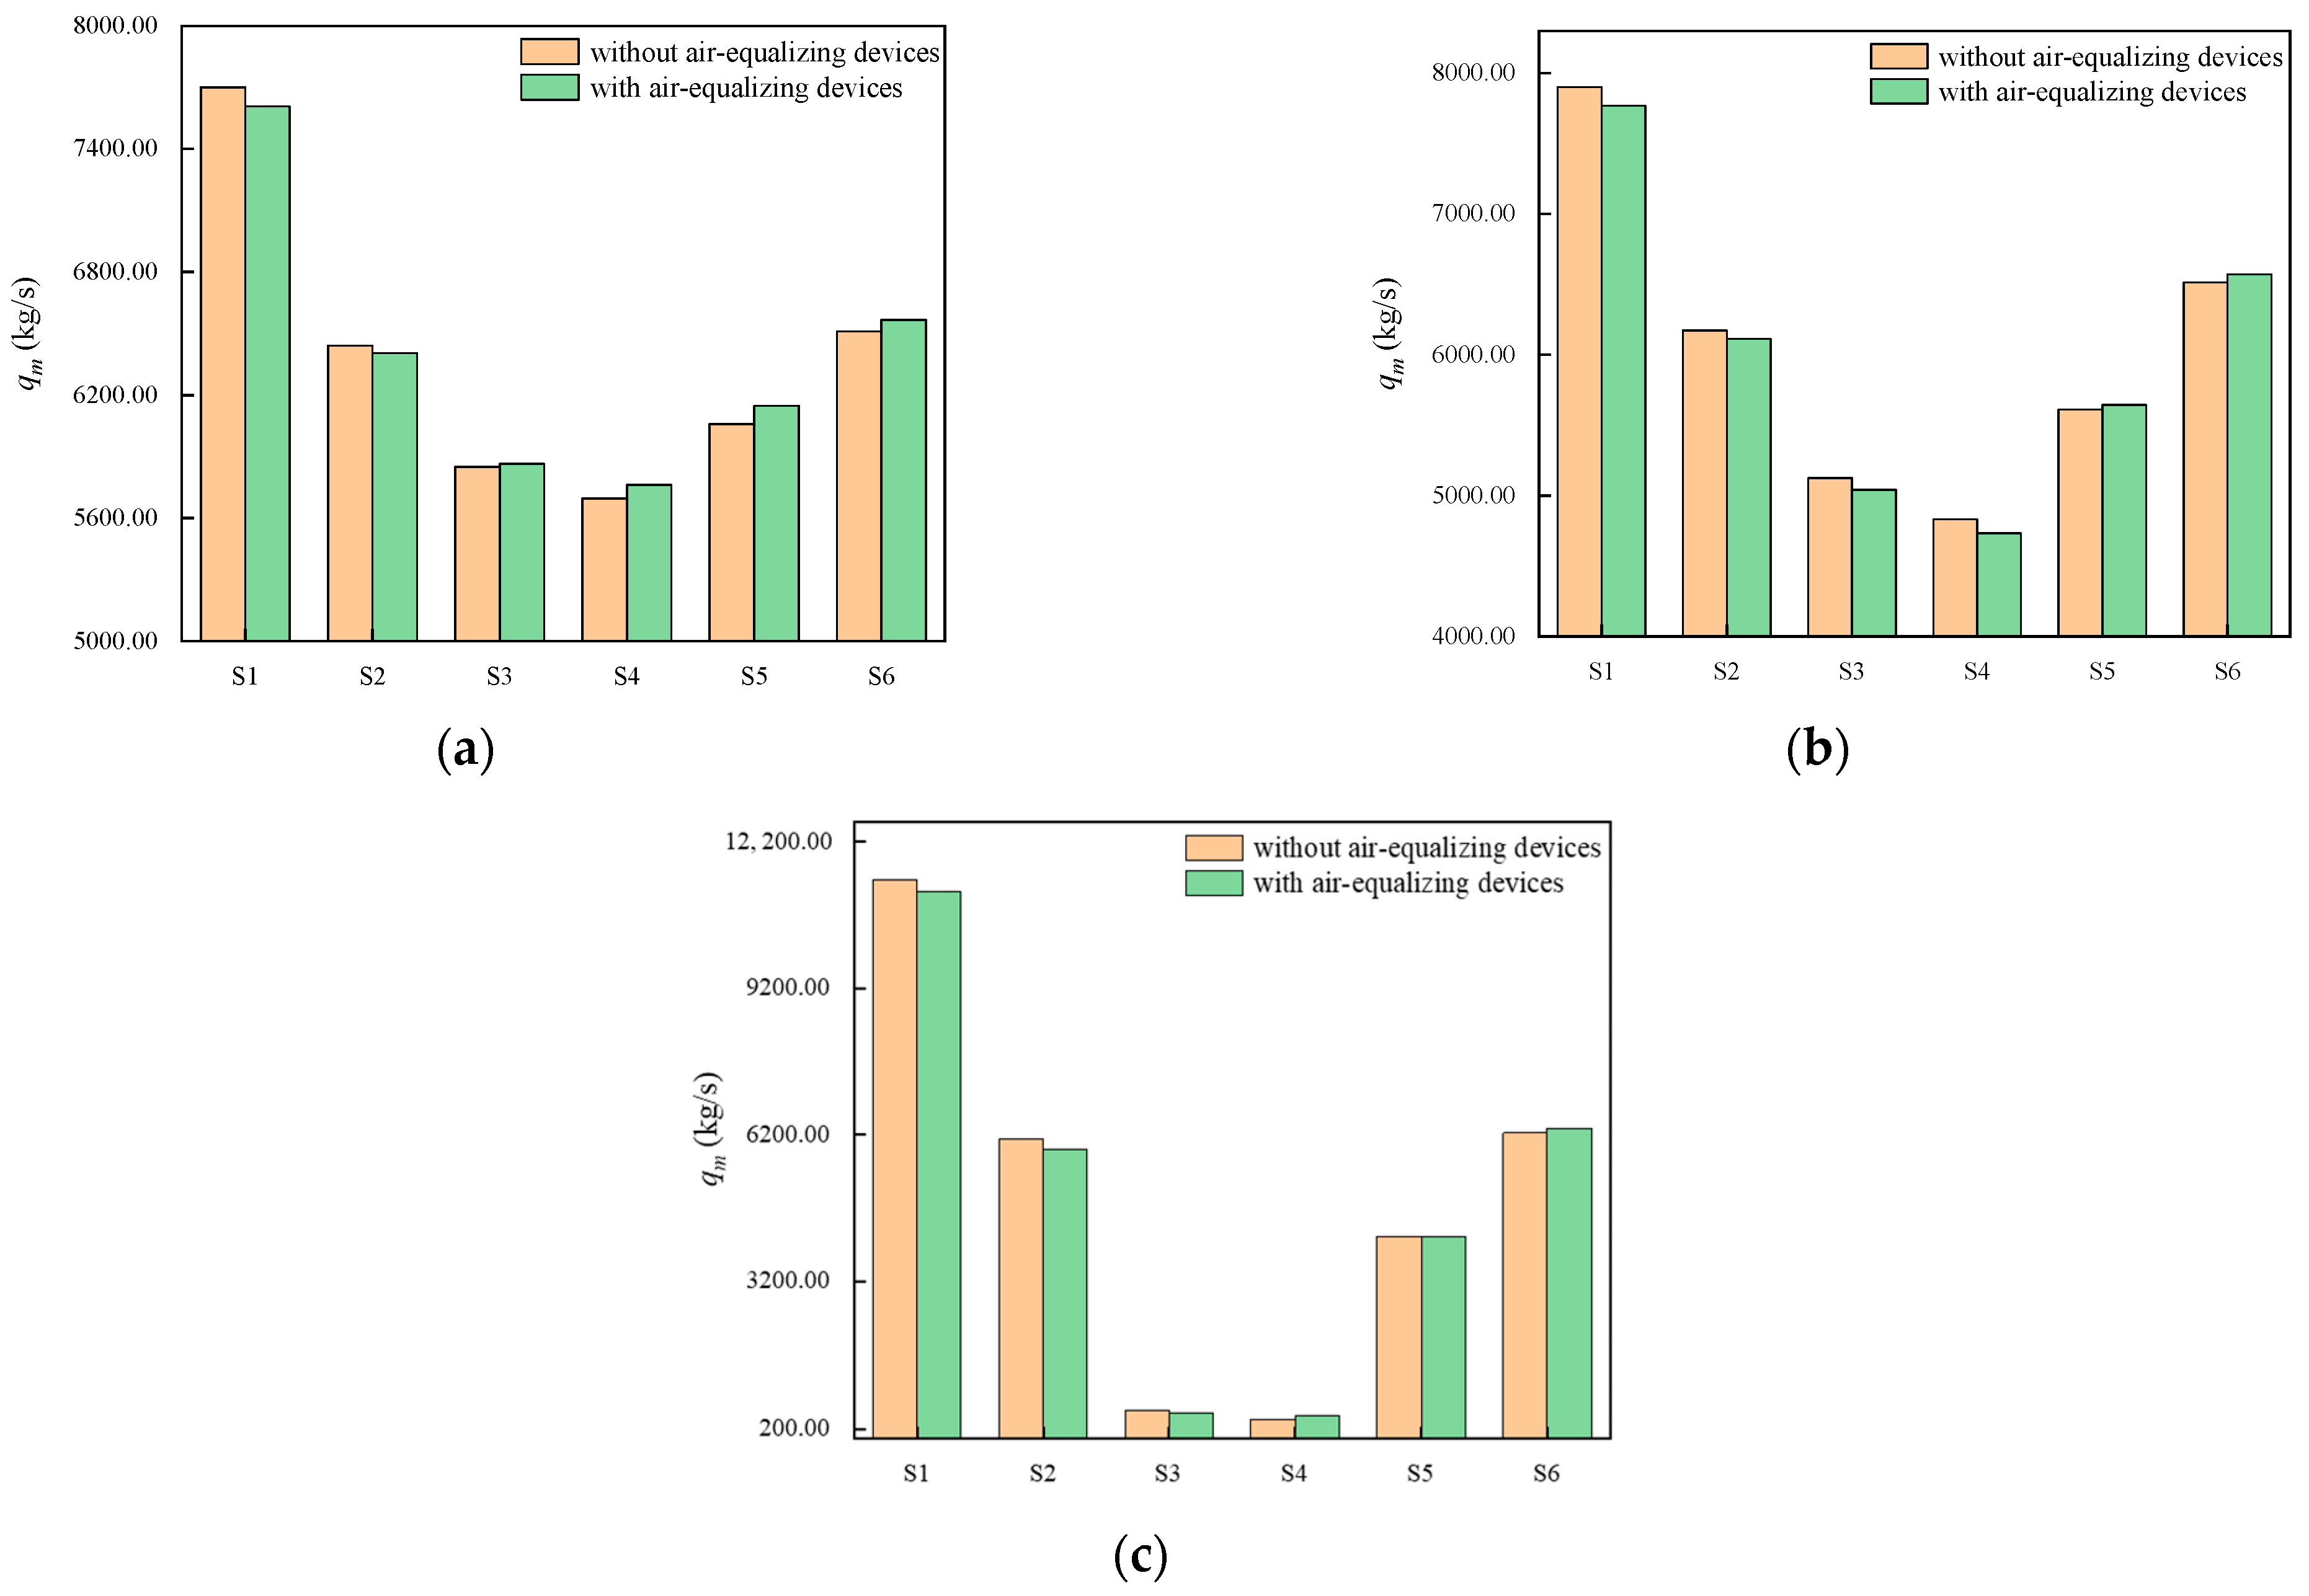
3.1. Impact on the NDDCT

The NDDCT’s capacity is affected by the cooling deltas, which are the critical heat transfer elements. The air-inlet flow of VDRs, especially the side deltas, is deflected under the influence of the ambient wind. This causes the difference between the two sides of the columns and deteriorates the deltas’ performance. Adding air-side-equalizing devices improves the distribution of the cooling deltas’ aerodynamic field, thus improving the cooling deltas’ performance.
The constructures of the velocity fields are similar at 2.5 m/s and 4 m/s wind velocities. At 2.5 m/s and 4 m/s wind velocities, the air-inlet velocity of the deltas increases as the crosswind velocity increases, as shown in Figure 5a,c. But the air-inlet deviation angles simultaneously become larger. T a near the θ 1 columns is higher than at 2.5 m/s wind velocity, and the range becomes larger as the wind velocity increases to 4 m/s. According to Equation (7), this has a negative influence, decreasing the heat exchange rate.
In Figure 5b,d, it is observed that after installing the air-side-equalizing devices, the aerodynamic field is divided into two parts, which flow into the θ + 1 and θ 1 cooling columns, respectively. In one cooling delta, part of the air inlet is blocked and then flows into the θ 1 cooling column, increasing its mass airflow. Moreover, the range and value of T a near the θ 1 columns have a significant reduction, and the velocity distribution becomes uniform. However, the wind velocity distribution and T a around the θ + 1 cooling columns changes less than in the θ 1 columns before and after the addition of the air-side-equalizing devices. At the same time, as the airflow enters the cooling deltas along the air-side-equalizing device, the air-inlet deflection angle decreases, and the reflux area behind the apex of the deltas is reduced.
When v = 12 m/s, the crosswind no longer flows into the side deltas, but the hot air flows outward, as shown in Figure 5e,f, which heavily influences the deltas’ performance. Air velocity through the cooling deltas does not change significantly after adding air-side-equalizing devices, but T a outside the θ 1 columns still slightly decreases. The air flows out of deltas in a radial direction under the effect of the air-side-equalizing devices.
The mass airflow of sectors at different wind velocities is measured and is shown in Figure 6. With the crosswind, the mass airflow of the upwind sector is the largest, and that of the side sectors is the least. However, the air-side-equalizing can adjust this situation. As illustrated in Figure 6a, the air-side-equalizing devices increase the mass airflow q m S 3 and q m S 4 when v = 2.5 m/s. This indicates that the air-side-equalizing devices not only create a uniform air-inlet distribution in the side cooling deltas but also increase the mass airflow here. When the crosswind velocity reaches 4 m/s, the air-side-equalizing devices still can still create a uniform aerodynamic field.
However, the blocking effect of the air-side equalizing becomes more apparent as the air-inlet deviation angle rises, which results in a decrease in the mass airflow of the tower lateral, as shown in Figure 6b. When v = 12 m/s, the main airflow starts to gradually leave the tower after 90°, and the air deflection angle starts to decrease relative to the position before 90°. The mass airflow q m S 3 decreases, and that of q m S 4 increases slightly, as shown in Figure 6c. It is evident that the equalizing of flow fields on the air side increases the air-inlet capacity of sectors with a small air deflection angle.
Since the NDDCT operates at a constant heat load, the outlet water temperature is used as the measure of its cooling performance variation. The water temperature t w 2 of cooling deltas with air-side-equalizing devices decreases at 2.5 m/s wind speed, especially in the tower lateral, which decreases by up to 1.096 °C, as illustrated in Figure 7a. The outlet water temperature of the NDDCT decreases by up to 0.954 °C when v = 4 m/s. But the decrease becomes smaller at 4 m/s wind velocity, as shown in Figure 7b. This indicates that the improvement effect of equalizing on the air side of the deltas’ flow fields decreases as the crosswind velocity increases from 2.5 m/s to 4 m/s.
As shown in Figure 7c, the air-side equalizing even deteriorates in some deltas as the air-inlet deviation angle continues to increase at 12 m/s. The t w 2 of cooling deltas near the 62° circumferential angle increase by 0.528 °C on average. However, the performance of other deltas improves, and the t w 2 of the whole tower decreases by up to 1.060 °C. At 2.5 m/s, 4 m/s, and 12 m/s wind velocities, the water temperature of the NDDCT decreases by 0.865 °C, 0.593 °C, and 0.186 °C, respectively. Therefore, the uniform aerodynamic field of cooling deltas is an effective optimization measure. How the air-side equalizing enhances the heat transfer capacity is explored in depth in the following sections.

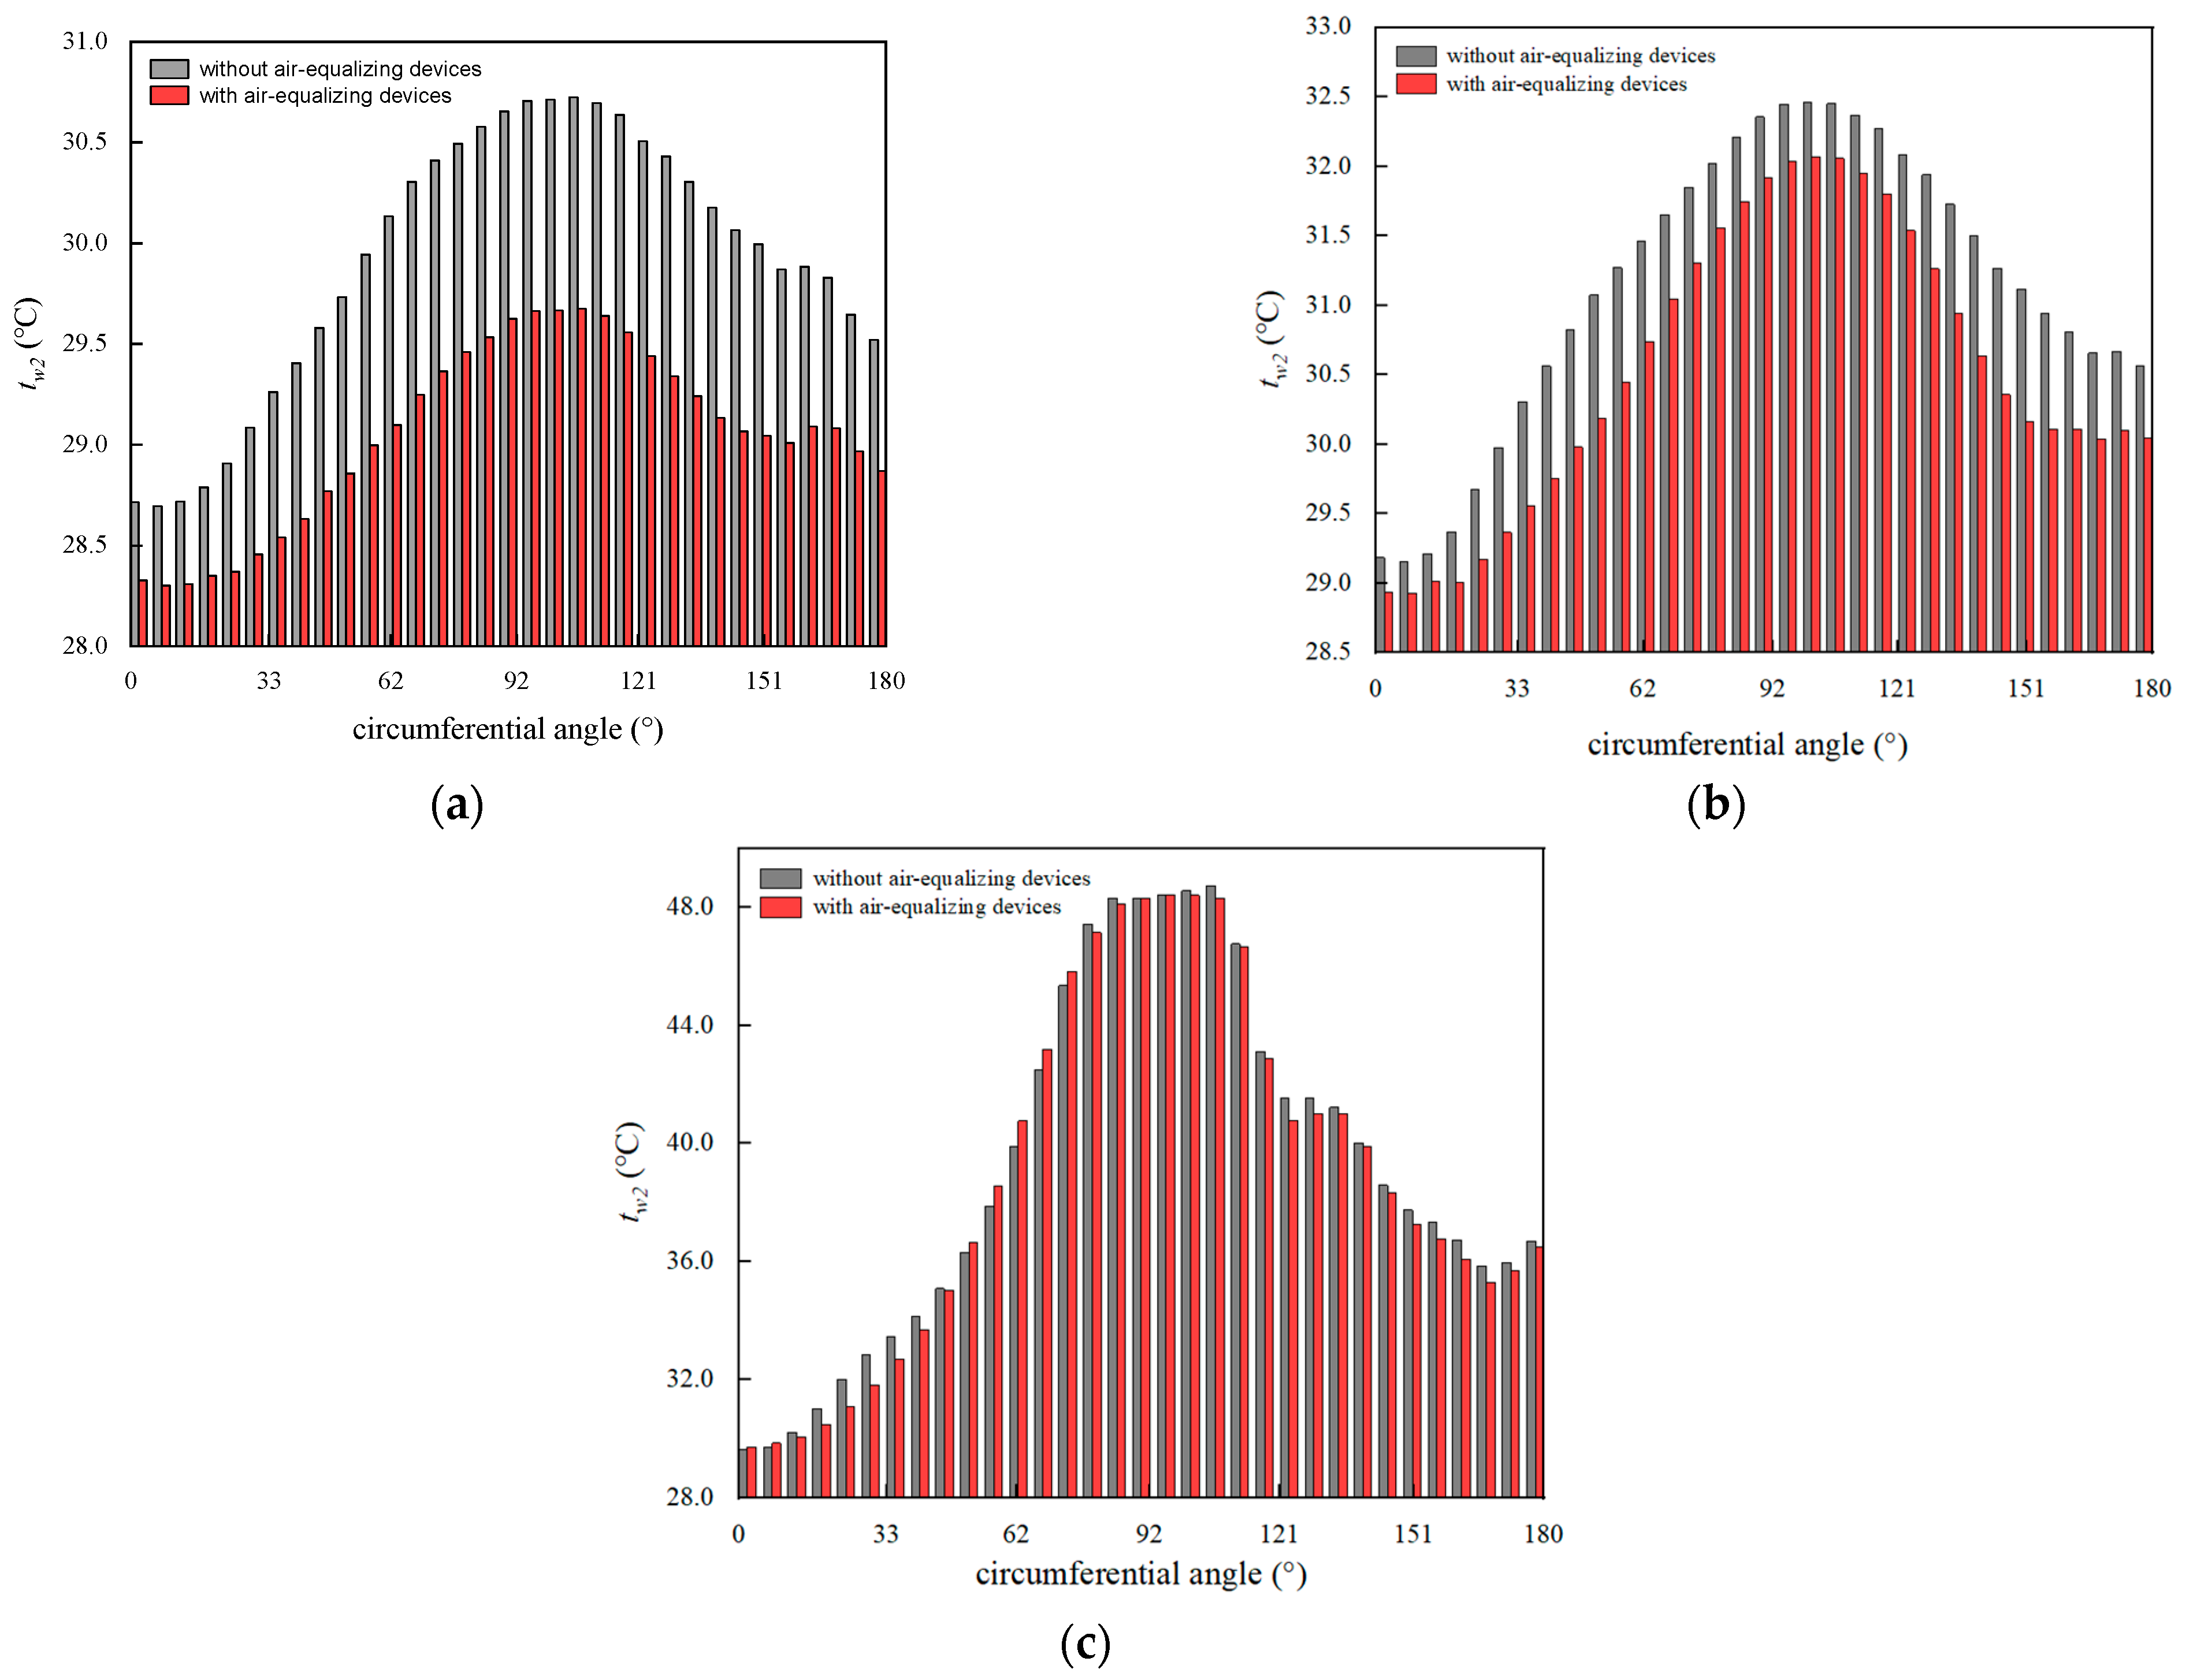
3.2. Impact on the Cooling Deltas at 2.5 m/s Wind Velocity

The studies at the average annual crosswind speed of 2.5 m/s are more practical than those at the design crosswind speed of 4 m/s in the engineering application. Thus, the studies in this subsection are all conducted at 2.5 m/s wind velocity. The studied delta is specified as M cooling delta, along the crosswind direction, and the cooling deltas on its left and right are L and R cooling deltas, respectively. Since this study uses a half-tower model, when studying the effect of air-side equalizing on many upwind and downwind cooling deltas, the deltas taken are representative cooling deltas in the center of sectors 1 and 6.
It can be seen in Figure 8a that the air velocity near the θ 1 column of M delta decreases. The impact of air-side equalizing is not apparent because the air-inlet of the upwind deltas is hardly deflected. However, a slight decrease is still shown in the water temperature near the M cooling delta’s vertex in Figure 8b. For the leeward side shown in Figure 8e, the airflow field variation is more obvious compared with the windward side deltas. The airflow is separated into two streams with a lower velocity. Similarly, the water temperature near the M cooling delta’s vertex drops, as shown in Figure 8f. The above phenomenon indicates that the air-side equalizing favours the local cooling unit.
For the M cooling delta in Figure 8c, the air-side-equalizing device redivides the aerodynamic field into two parts and the air-inlet direction tends to be radial. In other words, the flow field distribution near the θ + 1 and θ 1 cooling columns tends to be the same due to air-side equalizing. Meanwhile, the vortex near the θ 1 cooling columns and below the apex of the cooling delta decreases due to the changed air-inlet direction. For the R cooling delta, although no air-side-equalizing device is added, the air-inlet velocity of its θ 1 cooling column increases and is more evenly distributed. In Figure 8d, the water temperature on the inner side of the θ + 1 columns of both the M and R cooling deltas increases, especially for the M cooling delta. When compared with the θ 1 column of the L cooling delta, the θ 1 column of the M cooling delta has a significant drop in the outlet water temperature.
In Figure 9a–c, the air-side-equalizing device not only balances the discrepancy between the mass airflow q m θ + 1 and q m θ 1 of M deltas, but also increases q m θ 1 of R1 deltas at all locations. And the effect of air-side equalizing is more obvious on the tower lateral. The discrepancy in mass airflow of two columns of the M delta reduces from 97.093 kg/s to 28.442 kg/s, and that of the θ 1 cooling column of the R1 cooling delta decreases by 20.100 kg/s.
Figure 10a–c show the heat transfer coefficients of the M cooling deltas and nearby cooling deltas. Upwind, on the side and downwind of the NDDCT, there is a significant increase in the heat transfer coefficient h M θ + 1 . According to Equation (9), the heat transfer coefficient is proportional to the air inlet velocity. The air-side-equalizing device blocks part of the air flowing into the θ + 1 cooling columns so that air inlet velocities of the θ + 1 cooling columns increase along the air-side-equalizing device’s outer edge.
The heat transfer coefficient h M θ 1 increases as shown in Figure 10a. On the windward side of the NDDCT, where the hot wind recirculation is minimal, air-side equalizing increases the air inlet velocity of both columns simultaneously, thereby improving the heat transfer coefficient on both sides. In Figure 10b,c, air-side equalizing creates a uniform aerodynamic field near the θ 1 columns of the M and R1 cooling deltas, but the main effect is to reduce the hot wind recirculation in their vicinity. Although the mass airflow q m θ 1 of the lateral and downwind R1 deltas increases, the air-inlet velocity does not change significantly, so the heat transfer coefficient is almost unchanged.
Based on the above phenomenon, it can be concluded that the air-side equalizing redistributes the inlet airflow to the cooling columns on both sides of the M cooling deltas at low wind velocity, which increases the inlet airflow velocity of θ + 1 cooling columns while weakening hot wind recirculation near the θ 1 cooling columns of the M and R1 deltas. The air-side equalizing affects the θ + 1 and θ 1 cooling columns to different degrees at different locations of the NDDCT, as described in Figure 11a–c. The improvement effect of weakening the hot wind recirculation of the R cooling deltas is more obvious at the upwind and lateral locations of the NDDCT, as shown in Figure 11a,b. Compared with weakening the hot wind recirculation, the deltas’ more uniform aerodynamic field plays a greater role in the downwind cooling deltas, according to Figure 11c.

3.3. Impact on the Cooling Deltas at 12 m/s Wind Velocity

The inlet airflow deflection angle of the upwind and downwind cooling deltas is small under high wind velocity conditions, and the airflow is uniformly distributed with small non-equilibrium temperature differences, as described in Figure 12a,e. Therefore, the influence of air-side equalizing on the aerodynamic field is not obvious. There is only a slight temperature change near the apex of the deltas in Figure 12b,f. As described in Figure 12c, the air-side-equalizing device blocks the air outflow the θ + 1 column of the M cooling delta. As a result, the water temperature of the R delta and the θ 1 column of the M cooling delta decreases, while that of the θ + 1 column of the M delta increases, as shown in Figure 12d. The non-equilibrium temperature difference of the M and R deltas reduces.
As illustrated in Figure 13a–c, the mass airflow of the two columns of M deltas on the three positions of the NDDCT vary in a similar pattern: the air-side equalizing reduces the difference between q m θ + 1 and q m θ 1 . This indicates that the airflow field distribution around the two sides of the columns is more uniform. In addition, the mass airflow q m θ 1 of the upwind R1 delta and q m θ + 1 of the side R1 delta increase. This reduces the difference in R1 cooling deltas, which improves the overall balance of the R1 delta on the upwind and side tower.
According to Figure 14a,b, the heat transfer coefficient of the upwind and lateral M deltas change law is similar to that of the 2.5 m/s wind velocity condition. However, there is no significant increase in the h M θ 1 of the windward tower. Under conditions of high wind speed, air mostly enters the θ 1 columns along the surface of the air-side-equalizing devices. Therefore, the air-side equalizing has little effect on regulating the average inlet airflow velocity. In addition, the increase in the heat transfer coefficients h M θ + 1 and h R 1 θ 1 of the tower lateral indicates that the air-inlet velocity rises with the mass airflow without the hot wind recirculation. Since the airflow field of the leeward M delta is uniformly distributed, the air-side equalizing has less effect on its air-inlet velocity, so its heat transfer coefficient changes less.
The t w 2 M of the upwind and downwind tower decreases, while the t w 2 M of the tower lateral increases, as shown in Figure 15a–c. This indicates that the more uniform aerodynamic field is an important reason for improving the performance of windward and leeward M cooling deltas. However, in the side M cooling delta, due to the large air-inlet deflection angle and the air recirculation, the air-side-equalizing devices instead reduce the cooling performance of the M delta. For the R1 deltas, the t w 2 R 1 decreases at the upwind and side positions, and t w 2 R 1 remains approximately the same at the downwind position. The mechanisms that can improve the cooling performance of the upwind and side R1 cooling deltas are reducing the hot wind recirculation and increasing the heat transfer coefficient h R 1 θ 1 , respectively.

4. Conclusions

Through modeling and numerical simulation of the cooling tower, the principles of the effects of air-side equalizing on the cooling capacity of an NDDCT and deltas was explored, and the following conclusions are obtained.
(1) A uniform aerodynamic field can effectively reduce the negative effects of crosswinds on the NDDCT. This effect decreases as the wind speed increases. The exit water temperature of the NDDCT decreases by 0.865 °C, 0.593 °C, and 0.186 °C at 2.5 m/s, 4 m/s, and 12 m/s, respectively.
(2) For M cooling deltas at most locations, the uniform aerodynamic field reduces the cooling performance deviation of the two sides of the cooling columns under crosswind conditions, which manifests as a decrease in the non-equilibrium temperature difference.
(3) For the R cooling delta adjacent to the M delta, the air-side-equalizing device improves its cooling performance by reducing the hot wind recirculation. On the upwind and downwind sides, at low wind velocities, the reduction of hot wind recirculation has a greater positive effect compared with a uniform aerodynamic field.
(4) At high wind speed, the air-side equalizing has the opposite function on the M and R side cooling deltas. The airflow in the M cooling deltas at the tower lateral positions is blocked by the air-side-equalizing device. As a result, this portion of the air is redirected to the R cooling deltas, increasing its inlet air velocity and heat transfer coefficient, thereby improving the cooling capacity of the whole delta.
The air-side-equalizing device blocks the airflow inside the M cooling deltas to the radiators. The blocked portion of the air flows into the R deltas, increasing their air-inlet velocity and heat transfer coefficient and improving its cooling effect.
(5) Under crosswind conditions, heat transfer in deltas is enhanced by the combination of weakened hot wind recirculation and a homogeneous flow field. This exploratory study aims to draw attention to optimizing the airflow field at the micro heat transfer unit and accelerate the process of designing and operating radiators for the development of efficient dry cooling technology.

Author Contributions

Conceptualization, T.C. and Q.Z.; Data curation, L.Q.; Formal analysis, T.C.; Funding acquisition, Y.Z. (Yuanbin Zhao); Investigation, T.C., Y.Z. (Yaoming Zhang) and C.W.; Methodology, Y.Z. (Yaoming Zhang) and C.W.; Project administration, K.L., S.L. and Y.Z. (Yuanbin Zhao); Resources, Y.Z. (Yaoming Zhang), C.W., K.L., S.L. and L.Q.; Software, K.L., S.L. and L.Q.; Supervision, Y.Z. (Yuanbin Zhao); Validation, Q.Z. and Y.Z. (Yaoming Zhang) and C.W.; Writing—original draft, T.C. and Q.Z.; Writing—review and editing, Q.Z. All authors have read and agreed to the published version of the manuscript.

Funding

This research was funded by both the Science and Technology Innovation Capability Improvement Project of Medium-sized Enterprises in Shandong Province (Grant No. 2022TSGC1026) and the Sci-Tech Innovation Project of CHN Energy Ningxia Power Electric Co., Ltd., China (Grant No. NXDL-2022-33).

Data Availability Statement

All data are reported in the article.

Conflicts of Interest

Authors Tiefeng Chen, Yaoming Zhang, Chengjun Wang, Kaiming Li, Shixing Li, Longtao Quan were employed by the company CHN Energy Pingluo Power Co., Ltd. The remaining authors declare that the research was conducted in the absence of any commercial or financial relationships that could be construed as a potential conflict of interest.

References

  1. Zhao, Y.B.; Long, G.Q.; Sun, F.Z.; Li, Y.; Zhang, C.J. Numerical study on the cooling performance of dry cooling tower with vertical two-pass column radiators under crosswind. Appl. Therm. Eng. 2015, 75, 1106–1117. [Google Scholar] [CrossRef]
  2. Wei, Q.D.; Zhang, B.Y.; Liu, K.Q.; Du, X.D.; Meng, X.Z. A study of the unfavorable effects of wind on the cooling efficiency of dry cooling towers. J. Wind Eng. Ind. Aerodyn. 1995, 54, 633–643. [Google Scholar] [CrossRef]
  3. Ma, H.; Si, F.Q.; Li, L.; Yan, W.S.; Zhu, K.P. Effects of ambient temperature and crosswind on thermo-flow performance of the tower under energy balance of the indirect dry cooling system. Appl. Therm. Eng. 2015, 78, 90–100. [Google Scholar] [CrossRef]
  4. Wang, W.L.; Lv, J.F.; Zhang, H.; Liu, Q.; Yue, G.X.; Ni, W.D. A quantitative approach identifies the critical flow characteristics in a natural draft dry cooling tower. Appl. Therm. Eng. 2018, 131, 522–530. [Google Scholar] [CrossRef]
  5. Wang, W.L.; Wang, Y.Z.; Zhang, H.; Lin, G.M.; Lu, J.F.; Yue, G.X.; Ni, W.D. Fresh breeze cuts down one-third ventilation rate of a natural draft dry cooling tower: A hot state modelling. Appl. Therm. Eng. 2018, 131, 1–7. [Google Scholar] [CrossRef]
  6. Wang, W.L.; Zhang, H.; Liu, P.; Li, Z.; Lv, J.F.; Ni, W.D. The cooling performance of a natural draft dry cooling tower under crosswind and an enclosure approach to cooling efficiency enhancement. Appl. Energy 2017, 186, 336–346. [Google Scholar] [CrossRef]
  7. Lu, Y.; Guan, Z.; Gurgenci, H.; Zou, Z. Windbreak walls reverse the negative effect of crosswind in short natural draft dry cooling towers into a performance enhancement. Int. J. Heat Mass Transf. 2013, 63, 162–170. [Google Scholar] [CrossRef]
  8. Ghasemi Zavaragh, H.; Ceviz, M.A.; Shervani Tabar, M.T. Analysis of windbreaker combinations on steam power plant natural draft dry cooling towers. Appl. Therm. Eng. 2016, 99, 550–559. [Google Scholar] [CrossRef]
  9. Gu, H.F.; Wang, H.J.; Gu, Y.Q.; Yao, J.N. A numerical study on the mechanism and optimization of wind-break structures for indirect air-cooling towers. Energy Convers. Manag. 2016, 108, 43–49. [Google Scholar] [CrossRef]
  10. Lu, Y.S.; Gurgenci, H.; Guan, Z.Q.; He, S.Y. The influence of windbreak wall orientation on the cooling performance of small natural draft dry cooling towers. Int. J. Heat Mass Transf. 2014, 79, 1059–1069. [Google Scholar] [CrossRef]
  11. Al-Waked, R.; Behnia, M. The effect of windbreak walls on the thermal performance of natural draft dry cooling towers. Heat Transf. Eng. 2005, 26, 50–62. [Google Scholar] [CrossRef]
  12. Chen, L.; Yang, L.J.; Du, X.Z.; Yang, Y.P. Performance improvement of natural draft dry cooling system by interior and exterior windbreaker configurations. Int. J. Heat Mass Transf. 2016, 96, 42–63. [Google Scholar] [CrossRef]
  13. Shirazi, M.; Jahangiri, A. 3D numerical study using three novel windbreak walls in natural draft dry cooling towers for performance enhancement under various crosswind conditions. Therm. Sci. Eng. Prog. 2021, 25, 100971. [Google Scholar] [CrossRef]
  14. Seifi, A.R.; Akbari, O.A.; Alrashed, A.A.A.A.; Afshary, F.; Shabani, G.A.S.; Seifi, R.; Goodarzi, M.; Pourfattah, F. Effects of external wind breakers of Heller dry cooling system in power plants. Appl. Therm. Eng. 2018, 129, 1124–1134. [Google Scholar] [CrossRef]
  15. Wu, T.; Ge, Z.H.; Yang, L.J.; Du, X.Z. Flow deflectors to release the negative defect of natural wind on large scale dry cooling tower. Int. J. Heat Mass Transf. 2019, 128, 248–269. [Google Scholar] [CrossRef]
  16. Gao, X.F.; Zhang, C.W.; Wei, J.J.; Yu, B. Performance prediction of an improved air-cooled steam condenser with deflector under strong wind. Appl. Therm. Eng. 2010, 30, 2663–2669. [Google Scholar] [CrossRef]
  17. Zhao, Y.B.; Long, G.Q.; Sun, F.Z.; Li, Y.; Zhang, C.J.; Liu, J.B. Effect mechanism of air deflectors on the cooling performance of dry cooling tower with vertical delta radiators under crosswind. Energy Convers. Manag. 2015, 93, 321–331. [Google Scholar] [CrossRef]
  18. Ardekani, M.A.; Ranjbar, M.A.; Farhani, F. Use of guide vanes for improvement of flow pattern and enhancement of thermal performance of dry cooling towers. Mech. Ind. 2016, 18, 111. [Google Scholar] [CrossRef]
  19. Du, X.P.; Han, D.T.; Zhu, Q.M. Heat Transfer Enhancement of the Air-Cooling Tower with Rotating Wind Deflectors under Crosswind Conditions. Appl. Sci. 2018, 8, 544. [Google Scholar] [CrossRef]
  20. Goodarzi, M.; Keimanesh, R. Heat rejection enhancement in natural draft cooling tower using radiator-type windbreakers. Energy Convers. Manag. 2013, 71, 120–125. [Google Scholar] [CrossRef]
  21. Ma, H.; Cai, L.; Si, F.Q.; Wang, J.S. Exploratory research on annular-arranged moist media to improve cooling capacity of natural draft dry cooling tower and thermo-flow characteristics of its radiators. Int. J. Heat Mass Transf. 2021, 172, 121123. [Google Scholar] [CrossRef]
  22. Ma, H.; Si, F.Q.; Zhu, K.P.; Wang, J.S. The adoption of windbreak wall partially rotating to improve thermo-flow performance of natural draft dry cooling tower under crosswind. Int. J. Therm. Sci. 2018, 134, 66–88. [Google Scholar] [CrossRef]
  23. Abbasi, M.; Alighanbari, F.; Sarvestani, A.B.; Golneshan, A.A. The effect of crosswind and installation of wind-break deflector on the performance of natural draft dry cooling tower (NDDCT). J. Wind Eng. Ind. Aerodyn. 2022, 229, 105146. [Google Scholar] [CrossRef]
  24. Goodarzi, M.; Keimanesh, R. Numerical analysis on overall performance of Savonius turbines adjacent to a natural draft cooling tower. Energy Convers. Manag. 2015, 99, 41–49. [Google Scholar] [CrossRef]
  25. Goodarzi, M. A proposed stack configuration for dry cooling tower to improve cooling efficiency under crosswind. J. Wind Eng. Ind. Aerodyn. 2010, 98, 858–863. [Google Scholar] [CrossRef]
  26. Alizadeh Kheneslu, R.; Jahangiri, A.; Ameri, M. Interaction effects of natural draft dry cooling tower (NDDCT) performance and 4E (energy, exergy, economic and environmental) analysis of steam power plant under different climatic conditions. Sustain. Energy Technol. Assess. 2020, 37, 100599. [Google Scholar] [CrossRef]
  27. Kong, Y.Q.; Wang, W.J.; Zuo, Z.T.; Yang, L.J.; Du, X.Z.; Xu, C.; Yang, Y.P. Influencing mechanisms of a crosswind on the thermo-hydraulic characteristics of a large-scale air-cooled heat exchanger. Energies 2019, 12, 1128. [Google Scholar] [CrossRef]
  28. Yang, L.J.; Wu, X.P.; Du, X.Z.; Yang, Y.P. Dimensional characteristics of wind effects on the performance of indirect dry cooling system with vertically arranged heat exchanger bundles. Int. J. Heat Mass Transf. 2013, 67, 853–866. [Google Scholar] [CrossRef]
  29. Ma, H.; Si, F.Q.; Kong, Y.; Zhu, K.P.; Yan, W.S. Wind-break walls with optimized setting angles for natural draft dry cooling tower with vertical radiators. Appl. Therm. Eng. 2017, 112, 326–339. [Google Scholar] [CrossRef]
  30. Li, W.D.; Wang, H.T.; Wang, J.; Duan, C.P.; Zhao, Y.B. Effect mechanism of exit-water temperature distribution characteristics on the anti-freezing of natural draft dry cooling tower. Appl. Therm. Eng. 2019, 161, 114078. [Google Scholar] [CrossRef]
  31. Zhang, K.; Li, M.J.; Liu, H.; Xiong, J.G.; He, Y.L. A general and rapid method to evaluate the effect of flow maldistribution on the performance of heat exchangers. Int. J. Therm. Sci. 2021, 170, 107152. [Google Scholar] [CrossRef]
  32. Sharifullin, V.N.; Badriev, A.I. Aerodynamic Characteristics of the Cooling Tower under the Nonuniform Distribution of the Water and Air Flows. Therm. Eng. 2019, 66, 569–574. [Google Scholar] [CrossRef]
  33. Goodarzi, M.; Moradi Maryamnegari, S. A new natural draft dry cooling tower with improved thermal performance during windy condition. Appl. Therm. Eng. 2018, 139, 341–351. [Google Scholar] [CrossRef]
  34. Ma, H.; Si, F.Q.; Wang, J.S. Study on the effects of apex angle of the delta-type radiator on thermo-flow performance of natural draft dry cooling tower. Int. J. Heat Mass Transf. 2020, 148, 119002. [Google Scholar] [CrossRef]
  35. Chen, L.; Yang, L.; Du, X.; Yang, Y. Flue gas diffusion for integrated dry-cooling tower and stack system in power plants. Int. J. Therm. Sci. 2017, 114, 257–270. [Google Scholar] [CrossRef]
  36. Li, X.X.; Gurgenci, H.; Guan, Z.Q.; Wang, X.R.; Xia, L. A review of the crosswind effect on the natural draft cooling towers. Appl. Therm. Eng. 2019, 150, 250–270. [Google Scholar] [CrossRef]
  37. Liao, H.T.; Yang, L.J.; Du, X.Z.; Yang, Y.P. Triangularly arranged heat exchanger bundles to restrain wind effects on natural draft dry cooling system. Appl. Therm. Eng. 2016, 99, 313–324. [Google Scholar] [CrossRef]
  38. Wang, W.L.; Zhang, H.; Li, Z.; Lv, J.F.; Ni, W.D.; Li, Y.S. Adoption of enclosure and windbreaks to prevent the degradation of the cooling performance for a natural draft dry cooling tower under crosswind conditions. Energy 2016, 116, 1360–1369. [Google Scholar] [CrossRef]
  39. Wu, T.; Ge, Z.; Yang, L.; Du, X. Modeling the performance of the indirect dry cooling system in a thermal power generating unit under variable ambient conditions. Energy 2019, 169, 625–636. [Google Scholar] [CrossRef]
  40. Yang, L.J.; Chen, L.; Du, X.Z.; Yang, Y.P. Effects of ambient winds on the thermo-flow performances of indirect dry cooling system in a power plant. Int. J. Therm. Sci. 2013, 64, 178–187. [Google Scholar] [CrossRef]
  41. Zhao, Y.B.; Sun, F.Z.; Yang, Y.; Li, Y. Air-Side Flow Equalization Device for Cooling Delta of Natural Draft Dry Cooling Tower. CN104596346B, 11 May 2016. [Google Scholar]
  42. Al-Waked, R.; Behnia, M. The performance of natural draft dry cooling towers under crosswind: CFD study. Int. J. Energy Res. 2004, 28, 147–161. [Google Scholar] [CrossRef]
  43. Launder, B.E.; Spalding, D.B. The numerical computation of turbulent flow. Comput. Methods Appl. Mech. ANR Eng. 1974, 3, 269. [Google Scholar] [CrossRef]
  44. Yang, L.J.; Jia, S.N.; Bu, Y.D.; Du, X.Z.; Yang, Y.P. Numerical study on flow and heat transfer characteristics of finned tube bundles for air-cooled heat exchangers of indirect dry cooling systems in power plants. Proc. CESS 2012, 32, 50–57. [Google Scholar]
  45. Li, X.G.; Guo, T.; Huang, W.; Wang, L.B.; Zhao, Y.B. Improvement mechanism of wedged column on the cooling performance of vertical delta radiator. Int. J. Heat Mass Transf. 2022, 188, 122619. [Google Scholar] [CrossRef]
  46. Su, M.D.; Tang, G.F.; Fu, S. Numerical simulation of fluid flow and thermal performance of a dry-cooling tower under cross wind condition. J. Wind Eng. Ind. Aerodyn. 1999, 79, 289–306. [Google Scholar] [CrossRef]
  47. Zhao, Y.B.; Zhao, Q.; Li, F.; Liang, Q.H.; Li, X.; Chen, Y.S. Effect mechanism of cooling delta aerodynamic field equalizing on the cooling characteristics of dry cooling tower. Int. Commun. Heat Mass Transf. 2023, 148, 107070. [Google Scholar] [CrossRef]
Figure 1. Diagram of a natural draft cooling tower.
Energies 17 01111 g001
Figure 2. The distribution and local structure of the NDDCT. (a) The distribution of sectors; and (b) the structure of one cooling delta.
Energies 17 01111 g002
Figure 3. The computational domain and boundary conditions of the half NDDCT model. (a) The boundary conditions without a crosswind; and (b) boundary conditions with a crosswind.
Energies 17 01111 g003
Figure 4. Local mesh around a cooling delta.
Energies 17 01111 g004
Figure 5. Comparison of the velocity (the arrow represents velocity vector) and temperature field on the tower lateral before and after installing the air-side-equalizing devices at different wind velocities: (a,b) under 2.5 m/s; (c,d) under 4 m/s; and (e,f) under 12 m/s.
Energies 17 01111 g005aEnergies 17 01111 g005b
Figure 6. The mass airflow q m of sectors before and after installing air-side-equalizing devices at different wind velocities: (a) v = 2.5 m/s; (b) v = 4 m/s; (c) v = 12 m/s.
Energies 17 01111 g006
Figure 7. The t w 2 of cooling deltas in NDDCT before and after installing air-side-equalizing devices at 2.5 m/s, 4 m/s, and 12 m/s wind velocities: (a) v = 2.5 m/s; (b) v = 4 m/s; and (c) v = 12 m/s.
Energies 17 01111 g007
Figure 8. The impact on the aerodynamic field and exit water temperature distribution of M, L, and R side deltas when v = 2.5 m/s: (a,b) windward side; (c,d) tower lateral; and (e,f) leeward side.
Energies 17 01111 g008aEnergies 17 01111 g008b
Figure 9. The q m of the M and surrounding cooling delta at different locations of the NDDCT at 2.5 m/s wind velocity: (a) windward side; (b) tower lateral; and (c) leeward side.
Energies 17 01111 g009
Figure 10. The heat transfer coefficient for the M and surrounding cooling deltas at different locations of the NDDCT under 2.5 m/s wind velocity: (a) windward side; (b) tower lateral; and (c) leeward side.
Energies 17 01111 g010
Figure 11. Water temperature of the M and surrounding cooling deltas at different locations of the NDDCT at 2.5 m/s wind velocity: (a) windward side; (b) tower lateral; and (c) leeward side.
Energies 17 01111 g011
Figure 12. The impact on the aerodynamic field (the arrow represent the velocity vector) and outlet water temperature distribution of the M, L, and R side deltas when v = 12 m/s: (a,b) windward side; (c,d) tower lateral; and (e,f) leeward side.
Energies 17 01111 g012
Figure 13. The q m of the M and surrounding cooling deltas at different locations of the NDDCT at 12 m/s wind velocity: (a) windward side; (b) tower lateral; and (c) leeward side.
Energies 17 01111 g013
Figure 14. The heat transfer coefficient of M and its surrounding cooling deltas at different locations of the NDDCT under 12 m/s crosswind: (a) windward side; (b) tower lateral; and (c) leeward side.
Energies 17 01111 g014
Figure 15. The t w 2 for the M and surrounding cooling deltas at different locations of the NDDCT at 12 m/s wind velocity: (a) windward side; (b) tower lateral; and (c) leeward side.
Energies 17 01111 g015
Table 1. The exit water temperature and relative error at each grid for three quantities of mesh cells.
Grid Number3,253,9383,755,6434,910,584
t w 2 /°C28.77028.54328.498
Temperature difference/°C0.2700.043−0.002
Relative error (%)1.9850.3160.015
Table 2. Validation based on design and test conditions.
Design/Test Work ConditionsSymbolC1C2
Atmospheric pressure (kPa) P 85.1384.35
Atmospheric dry-bulb temperature (°C) T a 19.0727.39
Atmospheric relative humidity (%) R H 5762
Ambient crosswind velocity (m/s) v 5.001.49
Circulating water volume flow rate (m3/h) m w 94,000117,217.72
Inlet circulating water temperature (°C) t w 1 45.8952.98
Design/Test outlet water temperature (°C) t w 2 d 35.6845.11
3D numerical outlet water temperature (°C) t w 2 35.3245.03
Disclaimer/Publisher’s Note: The statements, opinions and data contained in all publications are solely those of the individual author(s) and contributor(s) and not of MDPI and/or the editor(s). MDPI and/or the editor(s) disclaim responsibility for any injury to people or property resulting from any ideas, methods, instructions or products referred to in the content.

